the Creative Commons Attribution 4.0 License.
the Creative Commons Attribution 4.0 License.
 | 26 Jul 2024
Evolution of river regimes in the Mekong River basin over 8 decades and the role of dams in recent hydrological extremes
Flow regimes in major global river systems are undergoing rapid alterations due to unprecedented stress from climate change and human activities. The Mekong River basin (MRB) was, until recently, among the last major global rivers relatively unaltered by humans, but this has been changing alarmingly in the last decade due to booming dam construction. Numerous studies have examined the MRB's flood pulse and its alterations in recent years. However, a mechanistic quantification at the basin scale attributing these changes to either climatic or human drivers is lacking. Here, we present the first results of the basin-wide changes in natural hydrological regimes in the MRB over the past 8 decades and the impacts of dams in recent decades by examining 83 years (1940–2022) of river regime characteristics simulated by a river–floodplain hydrodynamic model that includes 126 major dams in the MRB. Results indicate that, while the Mekong River's flow has shown substantial decadal trends and variabilities, the operation of dams in recent years has been causing a fundamental shift in the seasonal volume and timing of river flow and extreme hydrological conditions. Even though the dam-induced impacts have been small so far and most pronounced in areas directly downstream of major dams, dams are intensifying the natural variations in the Mekong's mainstream wet-season flow. Further, the additional 65 dams commissioned since 2010 have exacerbated drought conditions by substantially delaying the MRB's wet-season onset, especially in recent years (e.g., 2019 and 2020), when the natural wet-season durations are already shorter than in normal years. Further, dams have shifted by up to 20 % of the mainstream annual volume between the dry and wet seasons in recent years. While this has a minimal impact on the MRB's annual flow volume, the flood occurrence in many major areas of Tonlé Sap and the Mekong Delta has been largely altered. This study provides critical insights into the long-term hydrological variabilities and impacts of dams on the Mekong River's flow regimes, which can help improve water resource management in light of intensifying hydrological extremes.
- Article
(7025 KB) - Full-text XML
-
Supplement
(3693 KB) - BibTeX
- EndNote


A consistent pattern of river regimes is crucial in sustaining healthy hydrological and ecological systems in river basins (Botter et al., 2013; Bunn and Arthington, 2002; Poff et al., 2015). However, climatic and human drivers have been dramatically altering flow regimes in many global regions (Gudmundsson et al., 2021; Haddeland et al., 2014). For example, hydrological extremes such as severe floods and droughts, which are being intensified by climate change (Calvin et al., 2023; Hirabayashi et al., 2010; Oki and Kanae, 2006; Pokhrel et al., 2021), are profoundly altering the hydrological and hydrodynamic rhythms globally (Best, 2018; Grill et al., 2019; Nilsson et al., 2005). Such intensified climate extremes are causing more catastrophic floods and droughts, especially in densely populated regions with high flood–drought risk such as Southeast Asia (Lauri et al., 2012; Smajgl et al., 2015; Try et al., 2020; Västilä et al., 2010; S. Wang et al., 2021). Humans have been using water infrastructures (e.g., dams) to reduce risks from such hydrological extremes and better manage water resources. The construction of tens of thousands of dams globally (Lehner et al., 2011; Mulligan et al., 2020; Zhang and Gu, 2023) has greatly benefited our societies in reducing flood risk (Boulange et al., 2021); however, dams have been highly controversial (Flaminio et al., 2021; Graf, 1999) because large dams and their reservoirs fundamentally alter natural river regimes by redistributing water seasonally, causing detrimental ecological impacts (Best, 2018; Dethier et al., 2022; Ziv et al., 2012). However, despite a slowdown in dam construction or even removal of existing dams in regions such as North America (Bednarek, 2001; Bellmore et al., 2017), dam building is booming in other regions, e.g., the Mekong River, Amazon River, and Congo River basins (Winemiller et al., 2016; Zarfl et al., 2014).
In the Mekong River basin (MRB), the alteration of river regimes has been small historically, at least in terms of mainstream Mekong flow (Adamson and Bird, 2010; Adamson et al., 2009; Grumbine and Xu, 2011). However, the acceleration in dam construction in the recent past and the associated management of land and water systems (Cho and Qi, 2021, 2023) have led to a rapid increase in the alteration of river flow and flood dynamics (Arias et al., 2014a; Chua et al., 2021; Dang et al., 2022, 2016). Being driven primarily by the Asian monsoon, the MRB's hydrological rhythm is characterized by high, and rather unpredictable, seasonal variability (Adamson et al., 2009; Delgado et al., 2010; Wang et al., 2022). However, the pattern of the MRB's river flow seasonal cycle is remarkably consistent, with a single, concentrated annual wet season which, on average, features throughout its 795 000 km2 basin between approximately late June and early November (Adamson et al., 2009; Kummu and Sarkkula, 2008; Chua et al., 2021; Västilä et al., 2010). This leads to a prolonged flooding period in many parts of the lower MRB, which is also known as the “flood pulse” (Pokhrel and Tiwari, 2022). During the remainder of the year, river flow gradually reduces to less than 10 % (sometimes 5 %) of its flood peak (Adamson et al., 2009). Additionally, the MRB has a distinct flow-reversal mechanism in the Tonlé Sap River (TSR), whereby water flows into Tonlé Sap Lake (TSL) in Cambodia from the Mekong mainstream during the wet season, dramatically increasing the lake's size (by ∼ 80 %) (Dang et al., 2022; Kummu et al., 2013; Teh et al., 2019). The lake drains in the dry season, leading to a reversed flow in the TSR and supplying water to the Mekong Delta (MD). Through this mechanism, the lake acts as a natural detention reservoir, creating a unique flood characteristic where areas between TSL and the MD are partially inundated for many months each year.
Owing to the unique and cyclic rhythm of the Mekong flood pulse, the river–floodplain ecosystems and local communities of the lower MRB have been in harmony with the annual timing of this flood pulse. This flow rhythm supports fish migration and breeding, including in the seasonally flooded areas of TSL (Arias et al., 2013; Baran and Myschowoda, 2009; Orr et al., 2012; Yoshida et al., 2020; Ziv et al., 2012). Simultaneously, the flood pulse also brings rich nutrients each year in the form of sediment and a large volume of water to the floodplains in the areas between TSL and the MD, which is critical to rice production. As a result, Cambodia has been ranked among the top countries for inland fishery production (Chea et al., 2023), while Vietnam is among the top rice exporters globally (Yuan et al., 2022). Additionally, the enormous water volume in combination with the mountainous topography in upstream areas is highly favorable for hydropower production, leading to the planning and construction of hundreds of dams in China, Laos, and Vietnam, especially in recent years (Dang et al., 2022; Shin et al., 2020). While an increased number of dams could be beneficial for flood control, the majority of the Mekong's large dams are intended for hydropower production, which prioritizes power generation over downstream flood mitigation. Furthermore, these dams are physical barriers that directly hinder local fish migration and production annually (Chowdhury et al., 2024). As such, changes in the Mekong's river regime – especially the flood pulse – caused by intensified climate extremes and accelerating human activities could lead to potentially catastrophic impacts on the region's water, food, and energy systems and its critical ecosystems.
With the critical role of the Mekong, the study of its hydrological attributes has been the focal point of both regional and global research for decades. Many studies have focused on the overall long-term trends of river flow (Delgado et al., 2010; Li et al., 2017) and the patterns of the Mekong flood pulse, especially its timing and water budget (Adamson et al., 2009). Others have assessed the ecological impacts of changes in this flood pulse (Arias et al., 2014b). Furthermore, intensified extreme floods and droughts (Keovilignavong et al., 2021) and the role of rapid hydropower development across the MRB in recent years (Gao et al., 2021; Ngor et al., 2018; Pokhrel and Tiwari, 2022) have captured the attention of many investigators, leading to an increase in studies on the impact of these events. Overall, the changes in the Mekong flood characteristics have been the subject of numerous studies (Västilä et al., 2010; J. Wang et al., 2021), especially on the impact of dams on river flow and inundation patterns (Dang et al., 2022; Pokhrel et al., 2018a; Shin et al., 2020; Wang et al., 2017) as well as other human activities (Arias et al., 2012; Kummu and Sarkkula, 2008; NG and Park, 2021).
While past studies have provided important insights into the MRB's hydrological regime, there are notable limitations and major scientific gaps. First, many previous studies have relied on observed hydrological data, which are limited to only a handful of stations in the Mekong mainstream (Adamson and Bird, 2010; Adamson et al., 2009; Delgado et al., 2010), with considerable temporal gaps. Remote-sensing-based datasets have helped overcome this issue to a certain extent, providing enhanced spatial coverage; however, they are available only for recent decades, often at a monthly scale, and remote-sensing products generally suffer from uncertainties from various sources, including cloud contamination (Bryant et al., 2021; Lakshmi et al., 2023; Vu et al., 2022). As a result, there is a lack of analyses of the long-term trend of river flow across the entire MRB by using a spatially complete and temporally continuous dataset. Second, it is not possible to separate the impacts of dams from natural trends and variabilities in hydrological extremes or the flood pulse by using only observed data for recent periods because there were some large dams constructed in the MRB before the 1990s (Dang et al., 2022; Shin et al., 2020). Hydrological modeling can address this limitation; however, no studies to date have presented a full picture of the long-term hydrological changes in the Mekong River over the past century. Third, most studies on droughts in the MRB have focused primarily on the general drought indices and frequency (Li et al., 2021; Lu and Chua, 2021; Tuong et al., 2021), while flood-related studies are more focused on changes in the annual maximum flow only (Chua et al., 2021; Delgado et al., 2010; Västilä et al., 2010), leaving critical research gaps regarding other aspects of these extreme events under the influence of both natural climate variability and dam operation.
In this study, we address the aforementioned gaps by applying a hydrodynamic model to simulate the hydrological attributes of the MRB over an 83-year period (1940–2022) and over the entire basin. We specifically address the following research questions. (1) How did the MRB's flow regime and flood pulse evolve over decadal timescales before and after the construction of major dams? (2) What are the relative impacts of dams compared to natural variabilities in the MRB's seasonal flows, hydrological extremes, and inundation patterns in recent years? We address these questions by (a) examining the regional trend in river flow (i.e., annual total, maximum, and minimum) per decade across the MRB and (b) attributing the observed trends and variabilities to natural variation and dam operation by comparing seasonal timings, flow volume, and extreme conditions between simulations with and without dams. The remainder of the paper is organized as follows. Section 2 describes the data and methods, while the results are presented in Sect. 3, accompanied by discussions in Sect. 3.5. Finally, Sect. 4 provides concluding remarks.
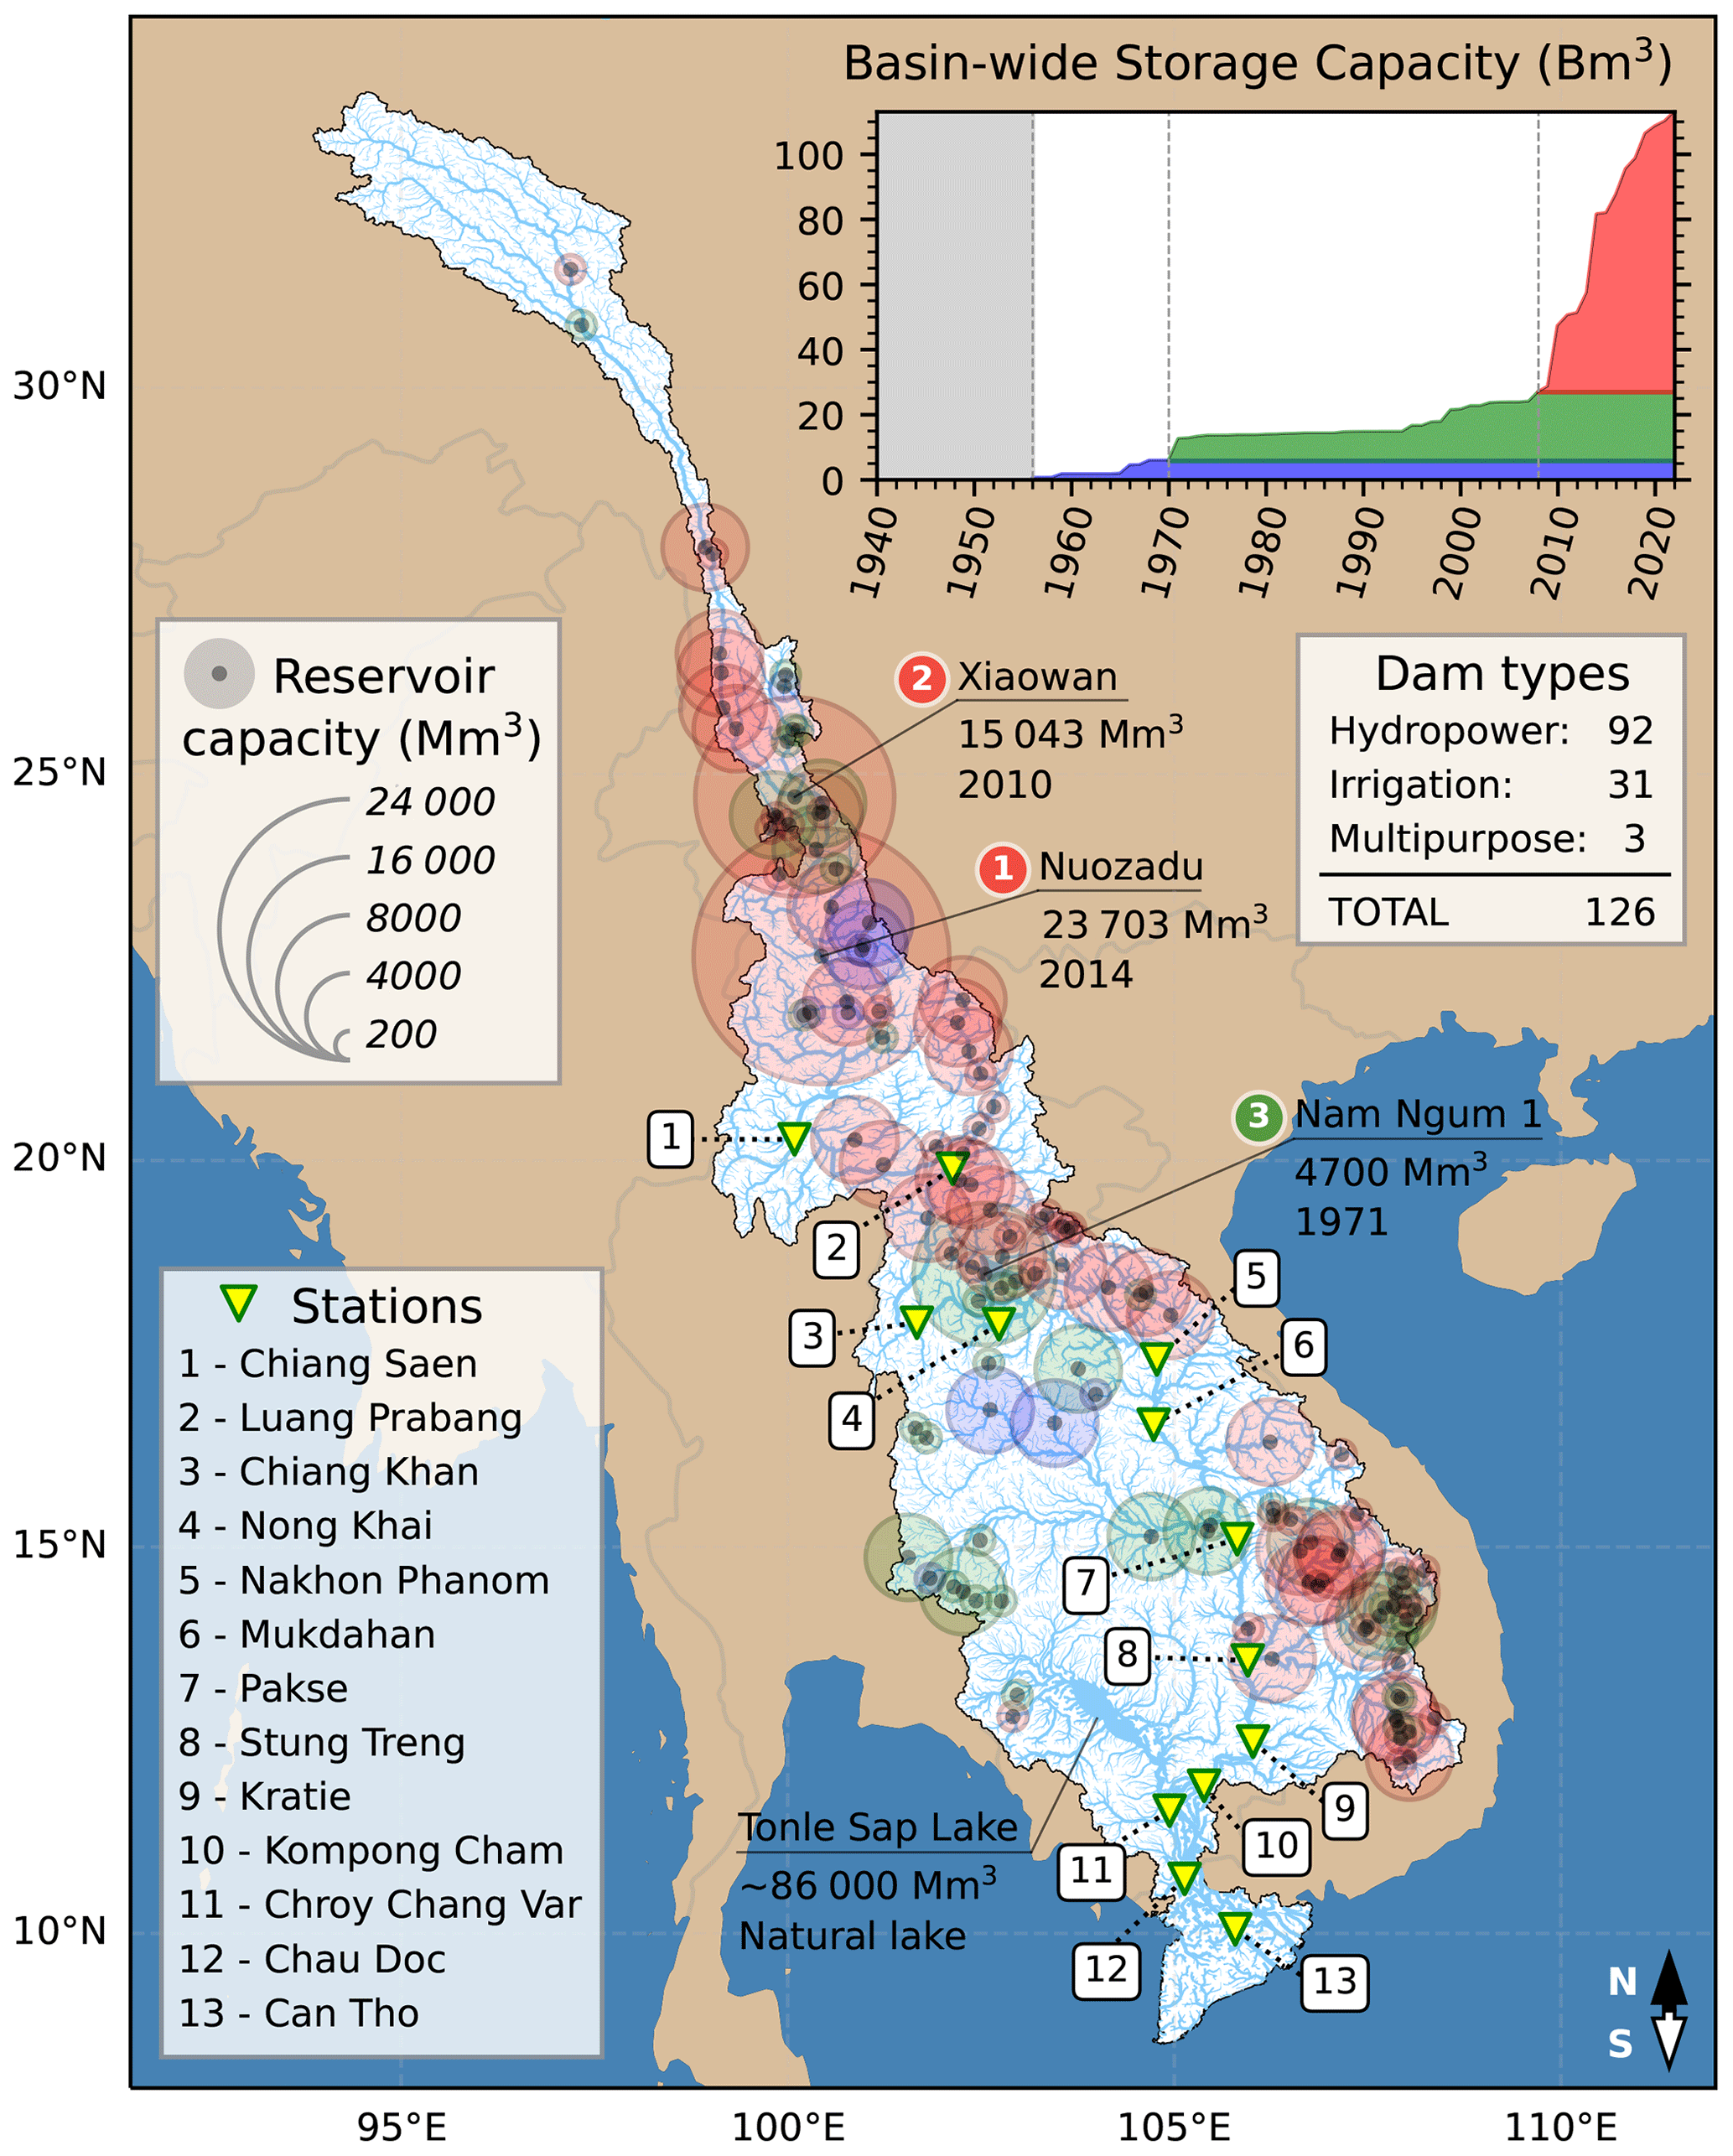
Figure 1Spatial map of the MRB showing the locations of the gauging stations (yellow triangles) used for the validation and the major dams (black dots) that are included in the simulation. The stations are numbered, and their names are listed in the bottom-left corner. Color coding and the sizes of the outer circles for each dam indicate the period of the dam's commission and the reservoir's maximum storage capacity, respectively. The three largest reservoirs are numbered (color-coded circles) and named, along with their storage capacity and commissioned year. Note that the color coding of the numbering for the dams also indicates the period in which the dam was commissioned. Tonlé Sap is also indicated. The background shows the river network (blue lines) with thicknesses based on simulated long-term mean river flow from 1940 to 2022 at the 3 arcmin (∼ 5 km) spatial resolution. The basin-wide total reservoir storage capacity (billion cubic meters) for each year, color-coded following the dam's outer circles, is shown in the upper-right inset, with black dotted lines indicating the years that separate the periods.
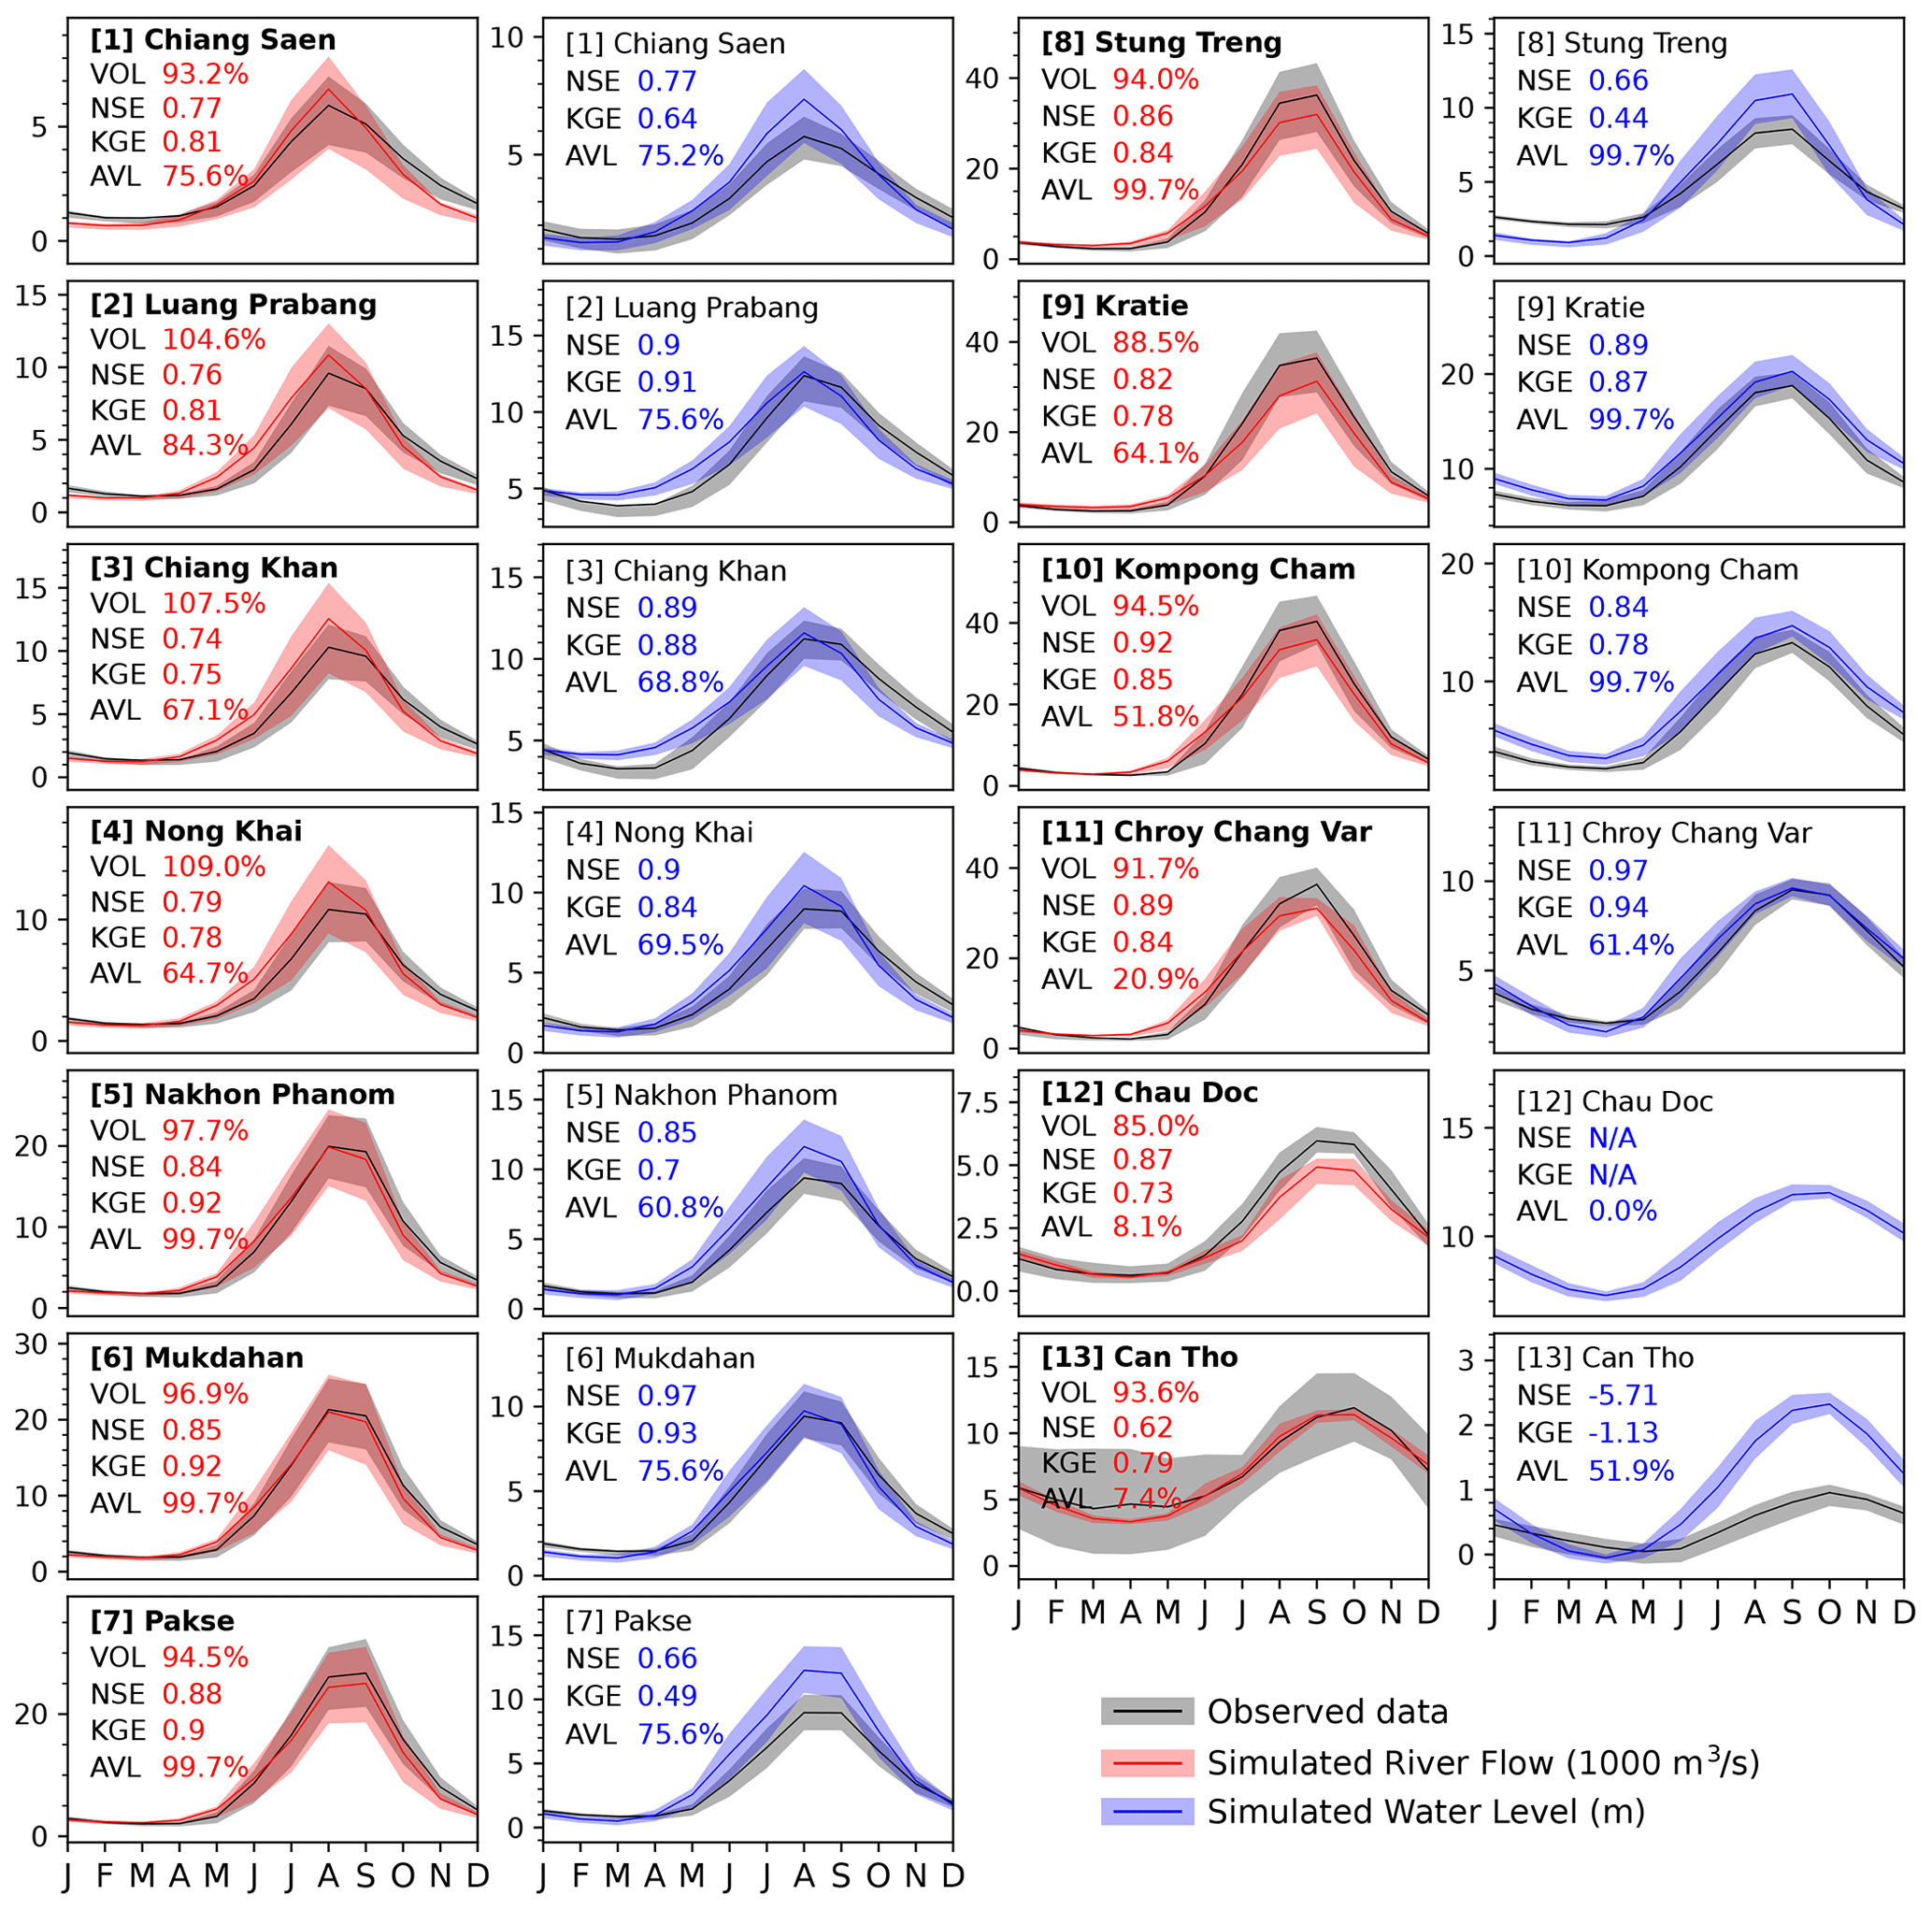
Figure 2Comparison of the seasonal cycle of simulated river flow (red lines) and water level (blue lines) with observations (black lines) from the MRC at the stations marked in Fig. 1. Shadings of similar color coding indicate interannual variability presented as the upper and lower first quantiles for each month. Volume in percentage is indicated in panels with river flow validation, while the Nash–Sutcliffe efficiency (NSE), Kling–Gupta efficiency (KGE), and availability of observed data (AVL) in percentage are indicated in all the panels.
2.1 Data
Observed river flow and water level data used for model validation (see Sect. 3.1) at 13 gauging stations on the Mekong mainstream (Fig. 1) are obtained from the Mekong River Commission (MRC). These stations are selected considering (i) a broad spatial coverage across the MRB and (ii) the availability of at least 5 years of continuous observational data for both river flow and water level. Considering that there are temporal gaps in the observed dataset, model performance metrics were only calculated for periods for which observations are available for each station (Fig. 2). Additional information on the stations is provided in Table S1 in the Supplement.
Dam and reservoir specifications, including coordinates, status (e.g., operational, planned, or cancelled), year of commission, purpose (e.g., hydropower, multipurpose, irrigation, or water supply), heights, storage capacity, or installed capacity, were obtained from two primary sources: the Research Program on Water, Land, and Ecosystem (WLE; https://www.cgiar.org/research/program-platform/water-land-ecosystems/, last access: 14 April 2020), which includes 445 dams, and the Stimson Center (https://www.stimson.org/2020/mekong-infrastructure-tracker-tool/, last access: 19 June 2023) with 777 dams in the MRB region. A comparison of the two datasets revealed that there is considerable inconsistency between them, including different dam specification values or duplicated dams under different versions of their names. Additionally, a substantial number of dam specifications that are critical in simulation setups, e.g., commission year, dam height, and reservoir storage, were missing. Such inaccurate dam specification or the lack of a certain number of dams can yield inaccurate simulation results. Thus, we have synthesized the information on dam attributes for the entire MRB by building on the dam database prepared by Shin et al. (2020) and by combining additional information from WLE and the Stimson Center. Specifically, we have filled in any missing values and corrected erroneous records in the merged dam database using publicly available information collected from various resources, including published reports from local governments or the MRC, documents from design and construction companies, other peer-reviewed literature, as well as news articles. This has resulted in a database of 693 dams in the Mekong region. Of these, 126 dams (compared to 86 in Shin et al., 2020, and Dang et al., 2022) commissioned by 2022 are selected based on criteria similar to our previous studies (Dang et al., 2022; Shin et al., 2020): (1) dam height is at least 15 m (≥ 15 m), (2) storage capacity is over 1 (Mm3 (million cubic meters), and (3) energy generation capacity is over 100 MW (megawatt). The locations of these dams are shown in Fig. 1, and more information on the dam specifications can be found in Table S2 in the Supplement.
2.2 Model and simulation settings
We use CaMa-Flood-Dam (CMFD), a river–floodplain hydrodynamic model that includes an optimized reservoir operation scheme (Dang et al., 2022; Shin et al., 2020). This is an enhanced version of the Catchment-based Macro-scale Flood-plain model, CaMa-Flood (Yamazaki et al., 2011), version 4.0. The model discretizes the study domain into unit catchments, in which each unit is assigned a set of river–floodplain topography parameters obtained from the MERIT Hydro dataset (Yamazaki et al., 2019) to present subgrid-scale hydrodynamic processes at ∼ 5 km (3 arcmin or 0.05°) resolution. Based on the unit's parameters and water storage, the model simulates river flow, water level, and inundated area following the local inertial and mass conservation equations (Yamazaki et al., 2013). At unit catchments where reservoir outlets (or dams) are located, the natural outflow was recalculated based on the reservoir's designed purpose as follows: (1) for irrigation or water supply dams, dam release is simulated to meet downstream irrigation demand, and (2) for hydropower, the release amount is set to optimize the power generation. Due to the lack of operating priorities for multipurpose dams in this region, these dams are represented in the model in a way similar to hydropower dams. More detailed information on the implementation of the reservoir scheme can be found in our previous studies (Dang et al., 2022; Shin et al., 2020). Additionally, while water demand information is required for irrigation dam release calculation, there are no publicly available datasets for the MRB over the entire study period. Thus, we have applied the long-term seasonal average of the simulated irrigation demand from the Human Intervention and Ground Water coupled MATSIRO (HiGW-MAT) model (Pokhrel et al., 2015), following our previous studies (Dang et al., 2022; Shin et al., 2020), as input in CMFD simulations.
CMFD simulations are driven by runoff data taken from the ECMWF Reanalysis version 5 (ERA5) global climate and weather dataset (Hersbach et al., 2020). We have selected the ERA5 dataset due to its (i) temporal completeness for our simulation period (i.e., 1940–2022) and (ii) higher spatial resolution (i.e., 0.25°) compared to other global forcing datasets used in our previous studies over the Mekong (e.g., Dang et al., 2022; Pokhrel et al., 2018b; Shin et al., 2020). This approach of using global runoff datasets for CaMa-Flood simulations has been proven to yield good model performance in major global river basins (Chaudhari and Pokhrel, 2022; Shin et al., 2021; Tanoue et al., 2016; Yamazaki et al., 2012), especially the Mekong (Dang et al., 2022; Shin et al., 2020). However, initial results from ERA5 forcing indicated considerable overestimation of river flow at all stations upstream of Kompong Cham (Figs. S3–4). Thus, we applied bias correction to the ERA5 runoff dataset at the basin scale, as discussed in Sect. 2.3.
To quantify the effects of natural climate variation and reservoir operation on the MRB's hydrodynamics over the past decades, we conducted the following two simulations: (1) natural simulation without considering dams (NAT) and (2) regulated simulation by initiating dam operation from the start of their commissioned years (DAM). This results in 83 years of daily simulated river flow, water level, and flood depth for the entire MRB at a spatial resolution of ∼ 5 km (3 arcmin or 0.05°).
2.3 Data-processing techniques and statistical measures
In climate impact studies, systematic deviations between simulated historical data and observations (precipitation, temperature, etc.) are commonly resolved using statistical and dynamical bias correction methods. However, to the authors' knowledge, studies with bias correction on runoff are scarce and uncommon because it is relatively difficult to collect runoff observations over large domains. Here, given the substantial bias found in the simulated discharge when CMFD is forced with the ERA5 runoff data, we use runoff from the HiGW-MAT model – proven to yield accurate simulation results with CMFD for the MRB (Dang et al., 2022; Pokhrel et al., 2018b; Shin et al., 2020) – as a reference to bias-correct the ERA5 runoff. We note that observed runoff data are not available for such bias correction at the basin scale and that HiGW-MAT runoff could not be used because of its limited temporal coverage (1979–2016), especially for the purpose of examining extreme events in recent years. To preserve the general trend, variabilities, and extremes while correcting the mean, standard deviation, quantiles, and frequencies of the ERA5 dataset, the empirical quantile mapping (EQM) method (Mendez et al., 2020; Themeßl et al., 2012) was applied. First, the daily HiGW-MAT data were linearly interpolated from 0.5 to 0.25° to match the ERA5 resolution. Second, complete time series at each grid cell of HiGW-MAT data in the baseline period (1979–2016) were extracted to obtain the cumulative distribution function (CDF). Similarly, two CDFs were obtained from ERA5 in each period (the baseline period and the remaining years). Third, values in ERA5 data during the baseline period were replaced with values with the same percentile in HiGW-MAT data. Fourth, we find the differences between HiGW-MAT and ERA5 values at each percentile in the baseline period. Then we applied these differences to the corresponding value in the ERA5 data based on their percentile from the CDF of the remaining years. The bias correction addresses the large overestimation found in the original ERA5-based results (Figs. S2–S6 in the Supplement), yielding notable improvements in the simulated river flow and water level across the MRB for periods both within (1979–2016; Figs. S3 and S5) and outside (1940–1978; Figs. S4 and S6) the HiGW-MAT data availability. Additionally, the results in Fig. S2 suggest that the combination of bias-corrected ERA5 runoff and our dam scheme greatly improves the model's performance, even at the daily scale. Thus, we use the results based on bias-corrected ERA5 runoff for our analyses.
At each grid cell, the time series of the simulated river flow is analyzed to evaluate the model performance, overall regional trends, and annual flood pulse characteristics. We first extract time series data consisting of daily river flow and water level as well as the total volume and maximum and minimum flows per calendar year. Daily and monthly simulated data are compared with observations using statistical measures such as volume changes (VOL), Nash–Sutcliffe efficiency (NSE), and Kling–Gupta efficiency (KGE). Then, the trend in the flow at each cell is estimated using the Theil–Sen slope estimator (Gilbert, 1987), along with its statistical significance derived by applying the Mann–Kendall test (Mann, 1945). Additionally, various flood pulse characteristics, including the timing and magnitude of wet- and dry-season flows as well as annual extreme flows (maximum and minimum) using daily time series, were calculated. To detect the start and end of the wet seasons, the long-term average river flow in the NAT simulation was applied as the season threshold following Adamson and Bird (2010) and Chua et al. (2021). Furthermore, we applied a 7 d moving average filter to the daily river flow in the seasonal timing analysis to avoid false detection of season onset due to early minor high-flow events (Fig. S1 in the Supplement).
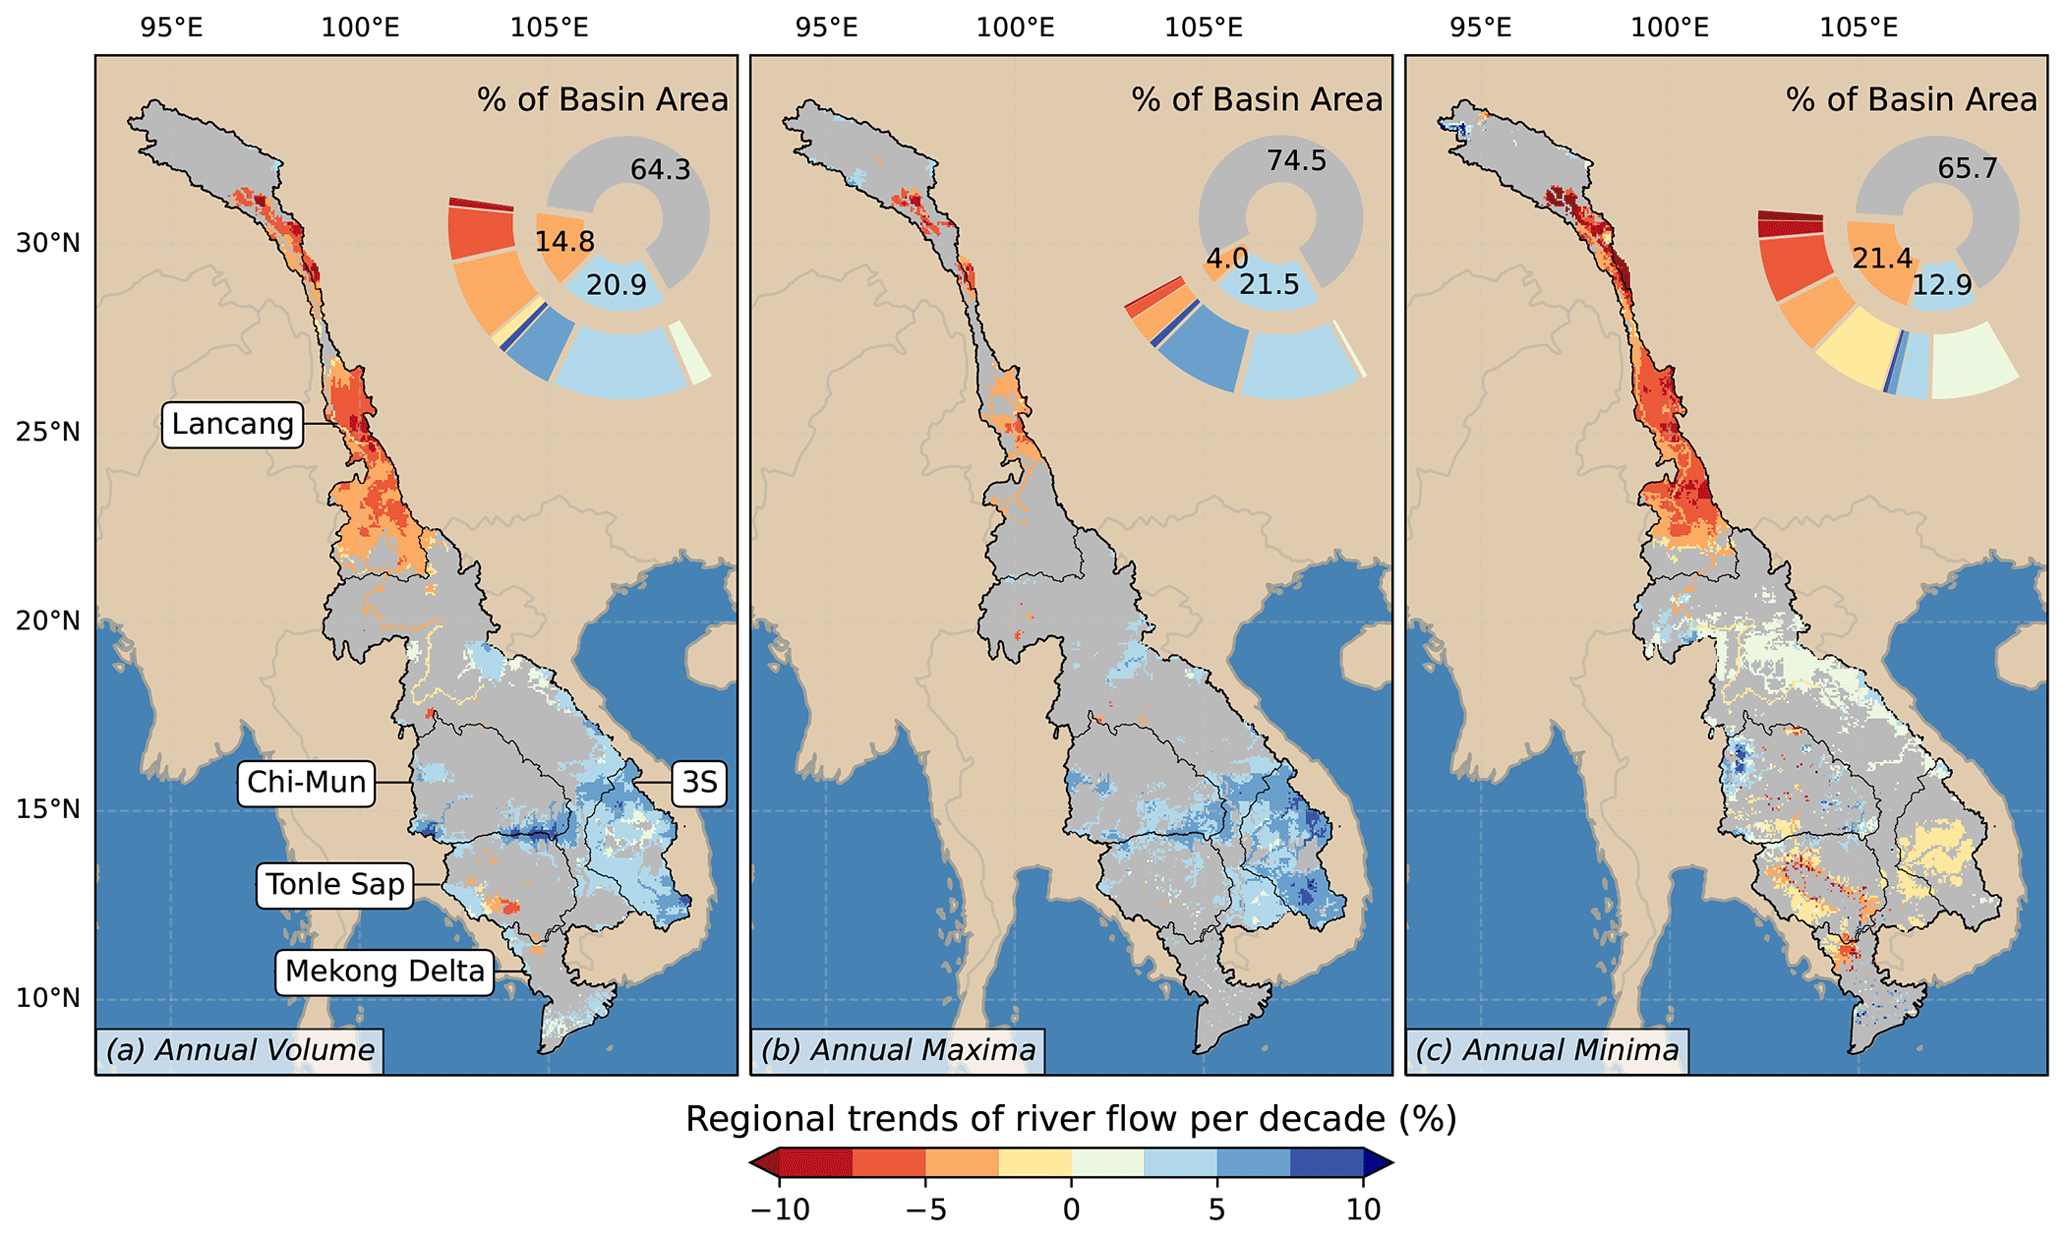
Figure 3Decadal trends in simulated river flow (1940–2022) that are significant (p value ≤ 0.05), shown for (a) annual volume, (b) annual maxima (high flow), and (c) annual minima (low flow). Blue indicates increasing river flow, orange denotes decreasing river flow (in percent change of the long-term average values), and grey indicates areas with no significant trend. Similar color coding is applied to the inner pie chart in the top-right corner, which indicates the percentage of basin areas which have respective trends. The outer semi-pie chart indicates a more detailed separation of areas with a significant trend following the color coding of the bottom color bar. Five major subbasins of the MRB, including Lancang, Chi-Mun, 3S (Sesan, Srepok, and Sekong), Tonlé Sap, and the Mekong mega-delta, are named, while their boundaries are indicated as thin black lines.
3.1 Model performance
The results presented in Fig. 2 – which also include statistical indicators – suggest that the model accurately reproduces the seasonal variations in river flow and water levels for most stations across the MRB. For river flow, the simulated results at all the stations agree remarkably well with observations, especially given the size of the MRB and its hydrological and topographic complexities, which are challenging to represent in basin-scale models. While there are small discrepancies between the simulated and observed river flows, the simulated annual VOL ranges from ∼ 85 % to 110 % of the observed values, indicating slight overestimation (< 10 %) in stations upstream of Nakhon Phanom. In stations downstream of Pakse, the underestimations range from ∼ 3 % to 15 %. Additionally, high NSE (0.74–0.92) and KGE (0.75–0.92) values at all stations with a wide range of observed data availability (AVL ranging from 7.4 % to 99.7 %) further confirm the accuracy of the model in capturing the natural variations in river flow. A similar observation can be made for the simulated water level at most stations where NSE and KGE values are relatively high (0.77–0.97 and 0.64–0.94, respectively), except for the Pakse, Stung Treng, and Can Tho stations. The moderate performance at these stations could be attributed to uncertainties in the model's fixed parameters (e.g., channel width and depth) that are not specifically tuned as well as unaccounted-for human activities such as sand mining or other water infrastructures that could alter river morphology over time. The discrepancies in water levels could also be partly due to inconsistencies in the way water levels are modeled and measured. For instance, the observed data are collected close to the riverbanks, which typically have a smaller difference between the water surface and riverbed than the center of the river, affecting water level readings. Considering that the river cross section is parameterized as rectangular (Yamazaki et al., 2011), simulated water level might include more discrepancies than river flow. Additional analysis of the long-term trend of annual average, minimum, and maximum river flows (Figs. S7–S9 in the Supplement) suggests that simulated results agree with observations at most stations, with certain discrepancies especially when the detected trend is not statistically significant (p > 0.05). Since the primary objective of this study is to assess the annual and decadal variations in the hydrological regime, these minor discrepancies are not of particular concern. Overall, good model performance over a considerably long period (i.e., 8 decades) supports model application in examining the long-term evolution of hydrological conditions in the MRB and quantifying dam impacts in recent periods.
3.2 Regional trends in river flow
Our results show a readily discernible regional pattern in river flow trends across the MRB (Fig. 3). The annual volume, maximum flow, and minimum flow show a varied spatial pattern with a general decrease in the Lancang portion and an increase in the lower portion of the MRB. In relation to the mean annual volume, annual maxima, and annual minima of river flow over the 83-year period, regional trends typically vary within ± 10 % per decade (Fig. 3). Generally, the Mekong mainstream river flow is relatively stable, with no distinct trend over the decades. In particular, only half of the total basin area shows a distinctly significant regional trend, mostly in the tributaries or subbasins. Local trends at the grid level range from −15 % to +12 % per decade for each of the flow characteristics. The spatial patterns of trends can be grouped into three main regions: a decreasing trend across all flow characteristics considered in the upper Mekong (Lancang), an increasing but relatively mild trend in river flow in the mountainous areas of the middle Mekong, and a mixed trend in the Sekong, Sesan, and Srepok (3S) region in the lower and eastern parts of the basin.
In terms of annual volume, ∼ 36 % of the MRB area shows a significant trend, of which 21 % shows an increasing trend and 15 % a decreasing trend. Most areas with a decreasing trend are located in the Lancang region upstream, especially its middle portions, where the decreasing trend is more pronounced (2.5 %–10 %). In contrast, an increasing trend in annual volume is mostly seen in the middle and lower MRB, specifically in the 3S subbasin and the surrounding areas, where a 2.5 %–7.5 % increase per decade is prominent. Additionally, the region at the border between the Chi-Mun and TSL regions or southwest of Chi-Mun shows a higher increase, with values that range from 5 % to 10 % at some locations. A mild increase can be seen in the middle of the MRB and some coastal areas of the MD. Additional analyses comparing the decadal difference of our simulated annual volume and the ERA5 snowfall data (Figs. S10 and S11 in the Supplement) suggest that is there is no clear link between a decline in annual volume and the changing snowfall pattern. However, there is a substantial resemblance in the pattern of the decadal difference between ERA5 runoff, total precipitation (Figs. S12 and S13 in the Supplement), and annual volume (Fig. S10), which further confirms that the annual volume in the Lancang area is also largely influenced by rainfall instead of snowfall.
In terms of annual extremes, only one-fourth of the MRB's total area shows a significant spatial trend in annual maxima or flood peaks, while this number in annual minima is approximately one-third. Out of the 25 % area of the Mekong with a significant spatial trend in annual maxima, ∼ 21 % presents an increasing trend, located primarily in the lower Mekong and the 3S subbasin and its surroundings; these trend values range from 2.5 % to 7.5 %, with some areas reaching over 10 %. While there are some signs of a decreased flood peak in the Lancang region, these include small areas in the upper reaches where flooding is not prevalent. In contrast, in the 34 % of the Mekong area with a significant trend in annual minima, there is ∼ 21 % of an area that shows a decreasing pattern. Again, most of this decreasing trend is present in the Lancang region, with a substantial drop from 2.5 to above 10 % per decade. Surprisingly, the 3S region, which shows an increase in annual volume and annual maxima, also presents a minor drop of < 2.5 % per decade. Areas that are partially flooded in the outer areas of TSL also witness a drop in annual minimum flow of between 2.5 % and 5 % per decade. Similar to annual volume, a slight increase in the middle of the Mekong of 0 %–2.5 % in annual minima per decade is also observed.
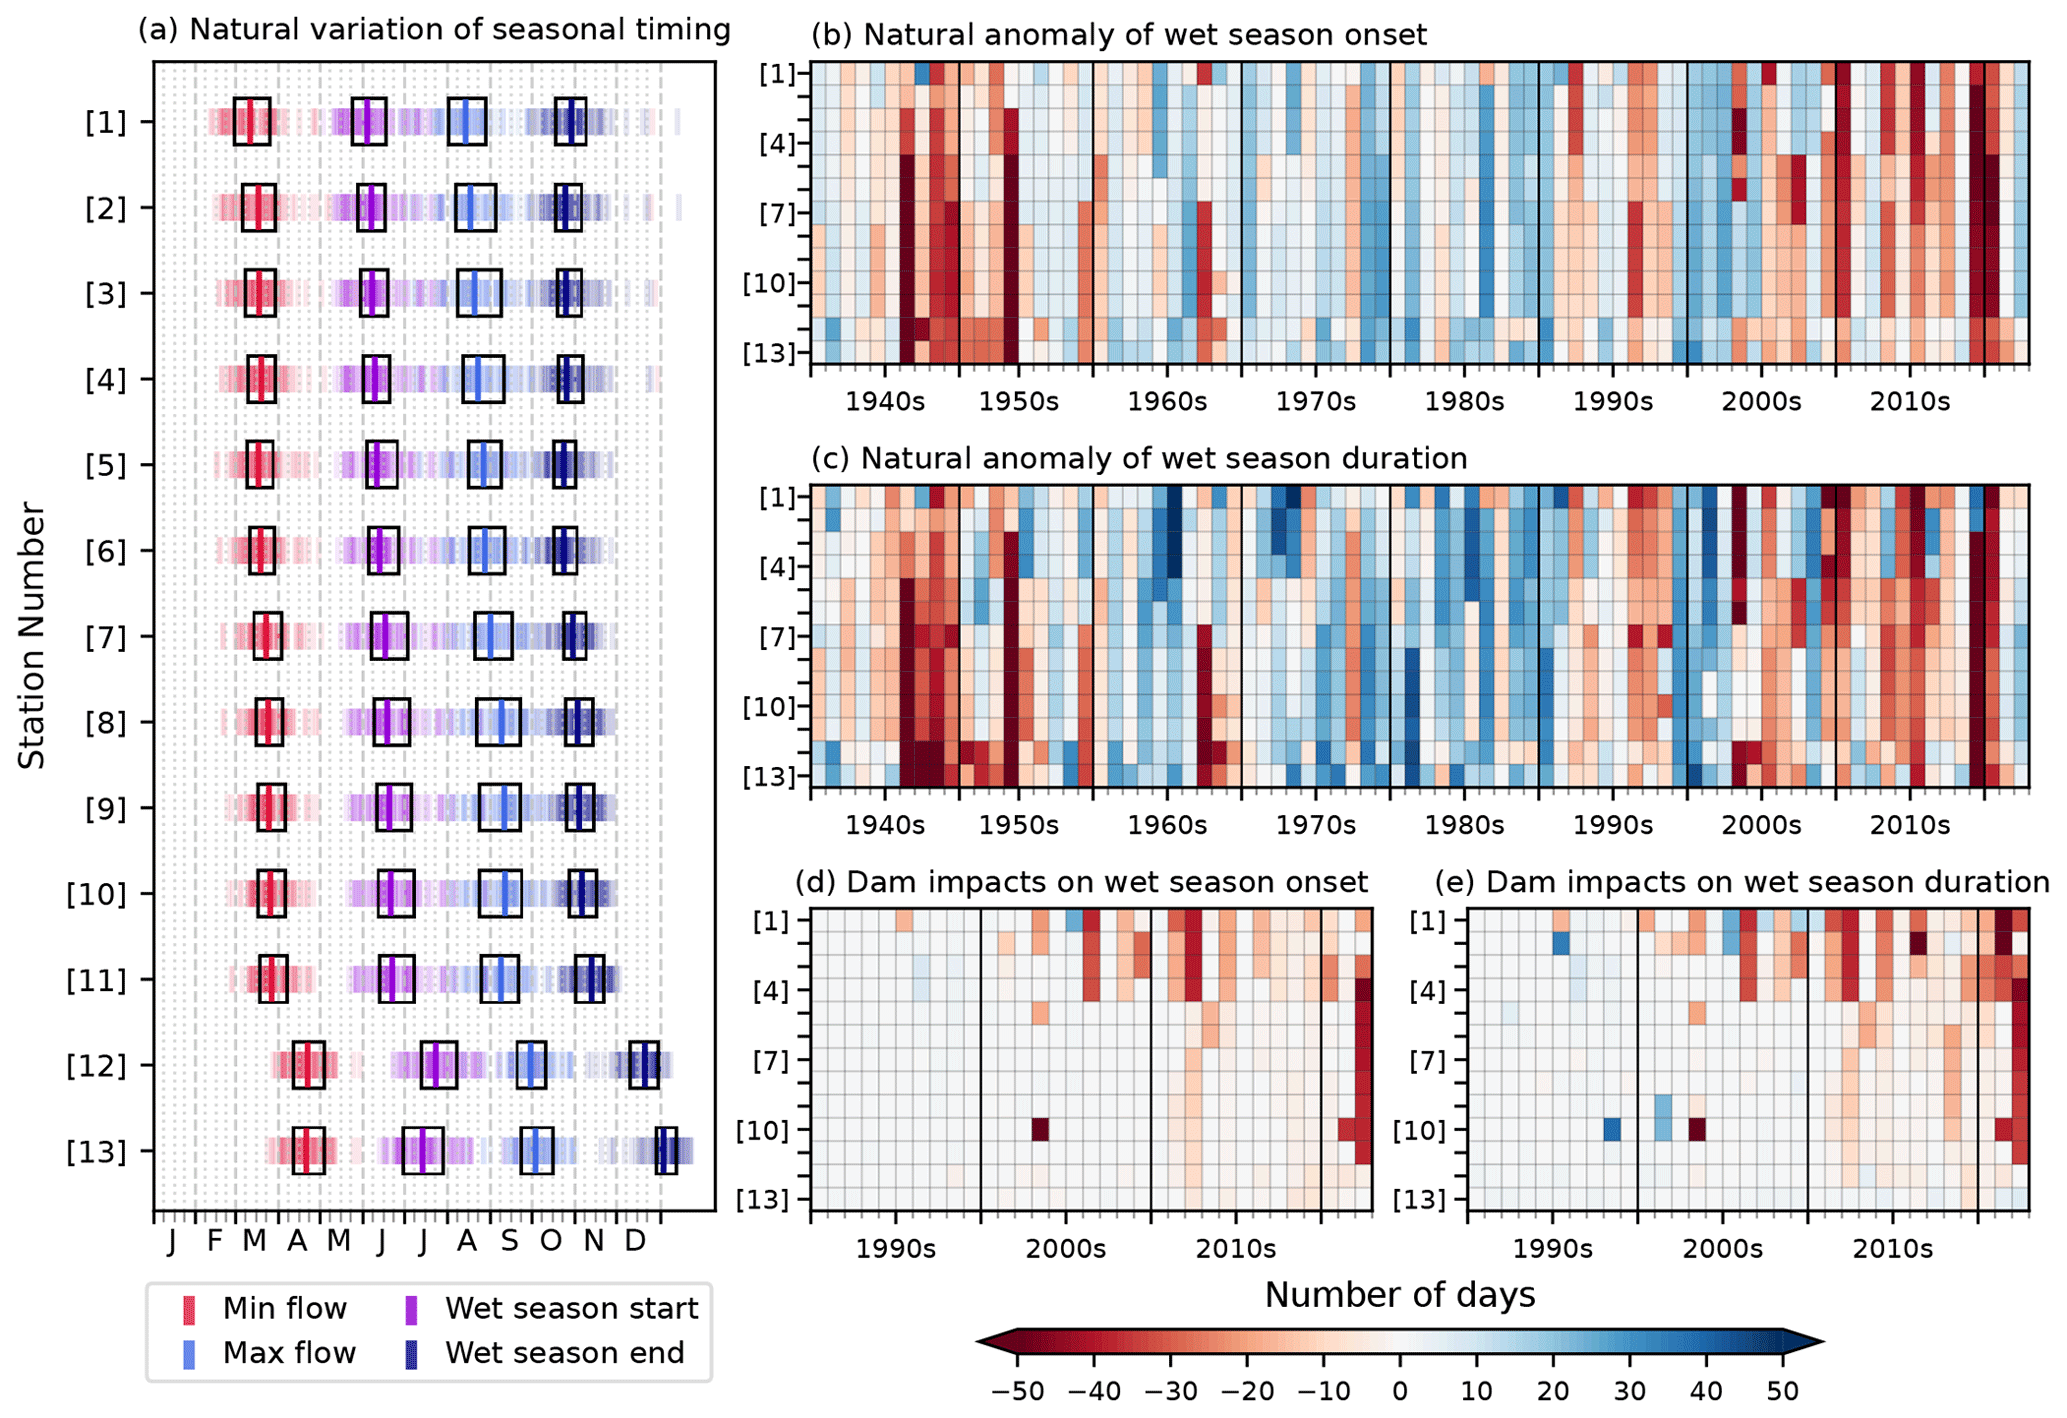
Figure 4Variation in the seasonal timing of the flow regimes (a), anomaly of the onset (b), and duration (c) of the wet season driven by natural variations from 1940 to 2022, as well as the impact of dams on the wet-season onset (d) and duration (e) during 1990–2022. Y axes mark station numbers (as depicted in Fig. 1) for all the panels. In panel (a), the timings of minimum flow, maximum flow, start of the wet season, and end of the wet season are indicated as thin color-coded lines, the black box indicates the 25th and 75th percentiles, and the long-term median is shown as thick lines. Panels (b–e) share the same color bar in the bottom right. Panels (b) and (c) show the difference in natural variation of the wet-season onset and duration, respectively, compared to the long-term average (d). Panels (d) and (e) present the difference between DAM and NAT simulations for wet-season onset and duration in recent years.
3.3 Natural variation and dam impacts on the flood pulse
3.3.1 Seasonal timing
Figure 4 presents a summary of the seasonal timing of various flow regimes (i.e., annual minimum, annual maximum, onset of the wet season, and end of the wet season) per calendar year, along with the variations in these attributes under natural drivers (i.e., climate variability) and dam operation over the past 8 decades at selected stations. Figure 4a provides clear evidence that the overall hydrological timing of the Mekong River is generally consistent across space (i.e., across the stations in Fig. 4a) and time (i.e., the temporal range for each attribute in Fig. 4a). All features of the seasonal timing across the stations from upstream to downstream only vary between 2 weeks and 1 month, which is in line with previous findings (Adamson et al., 2009). Typically, minimum flow occurs in March, while maximum flow occurs in between mid-August and mid-September. The wet season generally starts between mid-May and mid-June and ends in the first half of November. Additionally, there is a discernible delay in the timing of each attribute in the downstream stations, which ranges from a few days to 1 week compared with that for an immediately upstream station. However, the two most downstream stations in the Mekong Delta region (stations 12 and 13) show a distinct timing difference compared to the other stations, where all the attributes are delayed by 2–4 weeks compared to only a few days for the upstream stations.
Comparison of the wet-season onset and duration for each year with the long-term average (Fig. 4b and c) suggests that there is a high correlation between the two attributes. Similar anomalies for the two attributes (negative values indicating late onset or a decrease in duration) suggest that the timing of the wet-season onset can be a reasonable indicator of whether the wet season of that particular year will be reduced or extended compared with the long-term average. Furthermore, this alignment confirms that the end of the wet season at upstream locations is relatively consistent, occurring at the beginning of November, regardless of the wet-season onset being late or early. Additionally, the results further prove that there is a strong propagation effect from the upstream to downstream Mekong River despite the fluctuation in annual local precipitation patterns.
Results also show that the wet-season onset has been significantly delayed, with an alarmingly shorter length than the long-term average (by 20–50 d or higher) in recent years, especially in 2019 and 2020 (Fig. 4b and c). Lastly, close observation of the temporal evolution suggests that there is a notable interdecadal variation in the wet-season timing, with a noticeable period of late–short wet seasons in the 1940s and 1950s, followed by 3 decades of generally early–long wet seasons and then 3 decades of late–short wet seasons. We note that the results presented in Fig. 4b and c do not include any effects of dams, which are known to have been prominent in recent decades (discussed next). Overall, these results from the NAT simulation evidently illustrate that the natural hydrological regime of the MRB had substantial interannual and interdecadal variations in terms of the onset and duration of the wet season, two crucial elements of stable hydrological and ecological systems, especially in the downstream of the basin. The results also imply that there could be potentially enhanced variabilities in the future in the face of climate change and the growing influence of dams.
We find that the construction of dams in recent decades (since the 1990s) has impacted the seasonal timings in a substantial way (Fig. 4d and e). Compared to the effect of natural variation, dams are generally delaying the wet-season onset, with only a few rare instances where the impacts are the opposite at some of the most upstream locations (e.g., 1996 and 2005; Fig. 4d). Similarly, wet-season duration is also being reduced by dams, with only some exceptions at specific stations and years (e.g., 1995, 1998, 2001, and 2005; Fig. 4e). Further, dam impacts are generally localized and more pronounced in the upstream areas (immediately downstream of the dams), with the delay ranging from 10 to 30 d at these locations. Due to the propagation effect of the river's seasonal cycle, upstream dam operation is expected to have a basin-wide impact. However, the delaying effect of upstream dams on downstream seasonal timing is typically contained within a few stations and is detectable on a basin scale only in some years, especially after 2010, a period during which many mega-dams were constructed. With booming dams in recent years, the wet season is being delayed basin-wide, and as a result, the wet-season duration is being reduced. While the impact is only a few days of delay, in critical environmental and agricultural areas such as TSL or the MD, these adverse effects are detected in years that have already seen a substantial delay due to natural variations. In brief, dams are exacerbating the high natural variability in the onset and duration of the wet season, even though the impacts of dams have been smaller so far and constrained within the river reaches with major dams.
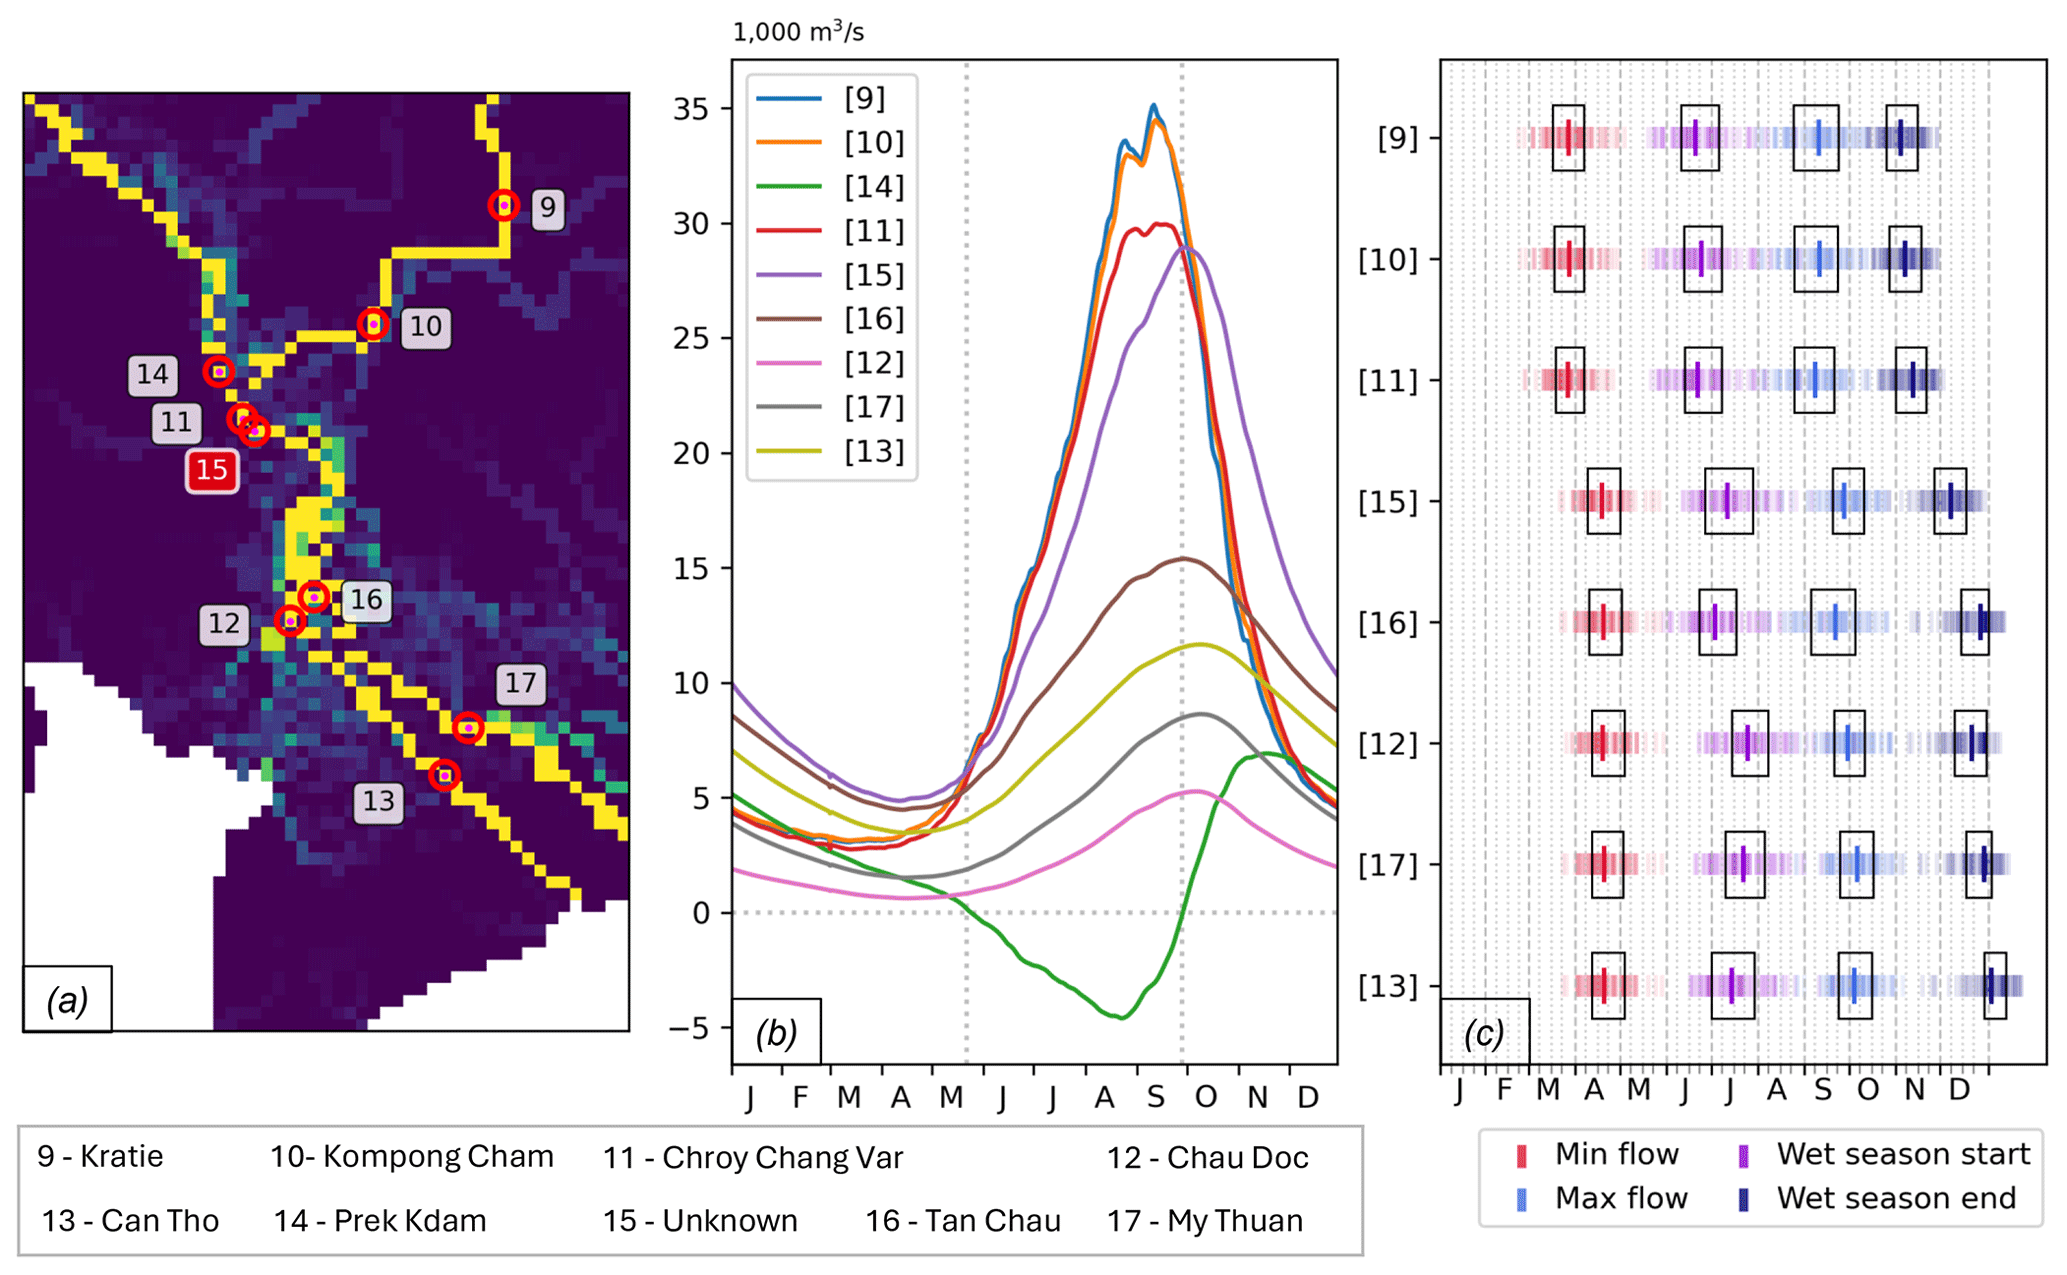
Figure 5Variation in the seasonal timing of the flow regimes at most downstream Mekong mainstream locations driven by natural variations from 1940 to 2022. In panel (a), the locations of the selected stations are indicated as numbered red circles on top of long-term average simulated river flow. Panel (b) shows the color-coded long-term average simulated river flow at each selected location, with vertical dotted lines indicating when the TSR changes its flow direction (outflow from TSL is positive, while inflow to TSL is negative). In panel (c), the variation in the seasonal timing at all the selected locations on the Mekong mainstream and channels (station 14 not included) is shown in a similar color coding and format to Fig. 4.
More detailed analyses of the long-term natural river flow at locations along the Mekong mainstream and the TSR (Fig. 5) suggest that the abrupt shift in seasonal timing at stations 12 and 13 compared to upstream locations is likely due to the natural retention effect of TSL. This shift in seasonal timing is first detected at a location directly downstream of station 11, the confluence of the Mekong mainstream and the TSR, and is carried on to all selected locations further downstream, deep into the MD. Since there are no available gauging stations between stations 11 and 12 (or 16), for further analyses, we have selected one location (marked as 15 – unknown) directly downstream where the Mekong mainstream and the TSR meet. Hydrographs at various locations in Fig. 5b suggest that long-term river flows at stations 9 and 10 are almost identical, while similar flow timing can be observed at station 11, with a visibly lower peak. However, the river flow timing changes immediately downstream of station 11, at location 15. Additionally, the hydrograph indicates that, in the first 5 months, the TSR contributes substantially to downstream river flow, especially in January and February, which is similar to findings in Morovati et al. (2023), where TSR outflow (station 14) is equal to or even higher than flow from the Mekong mainstream (station 10). As a result, while Mekong upstream river flow falls to its minimum in late March, the minimum flow at all locations downstream of station 11 occurs much later, in the middle of April. Similarly, the delayed wet-season end date can also be directly attributed to the influence of TSL, as there is a clear difference in river flow before and after station 11 from late September, when water flows out of the TSR.
Lastly, the wet season of station 13 is further extended by more than 2 weeks into January of the next year compared to that of station 12. Additional analysis at similar locations of stations 12 and 13 in the other main channel of the Mekong in the MD (Fig. 5c) suggests that the end of the wet season gradually shifts to later dates as we move from station 11 into the MD in both Mekong main channels. A direct comparison of the seasonal timing of location 15 with those of stations 12 and 16 suggests that this prolonged effect is likely due to the river being divided into multiple channels instead of direct influence from TSL. When the river diverges into multiple channels, the progression of river flow in each channel becomes relatively stable, with less dramatic rises and drops from the peak flow, as can be seen in the hydrographs, resulting in a longer wet season. This is further confirmed by a clear difference between the seasonal timing within a channel where there are more visible divisions (channel with stations 12 and 13) than the other ones (channel with stations 16 and 17) in the MD, as shown in Fig. 5. Thus, while the abrupt shift in the seasonal timing of the most downstream Mekong areas can be directly attributed to the influence of TSL, the prolonged wet-season effect in the MD can be attributed to the rather flat topography and the extensive irrigation channel network in this area. However, it should be noted that the representation of the river channel network and the other water infrastructures (i.e., dikes) in the current model for this region is partially incomplete due to multiple limitations; thus, we expect the actual wet-season-prolonging effect of the MD channel network to be even more substantial.
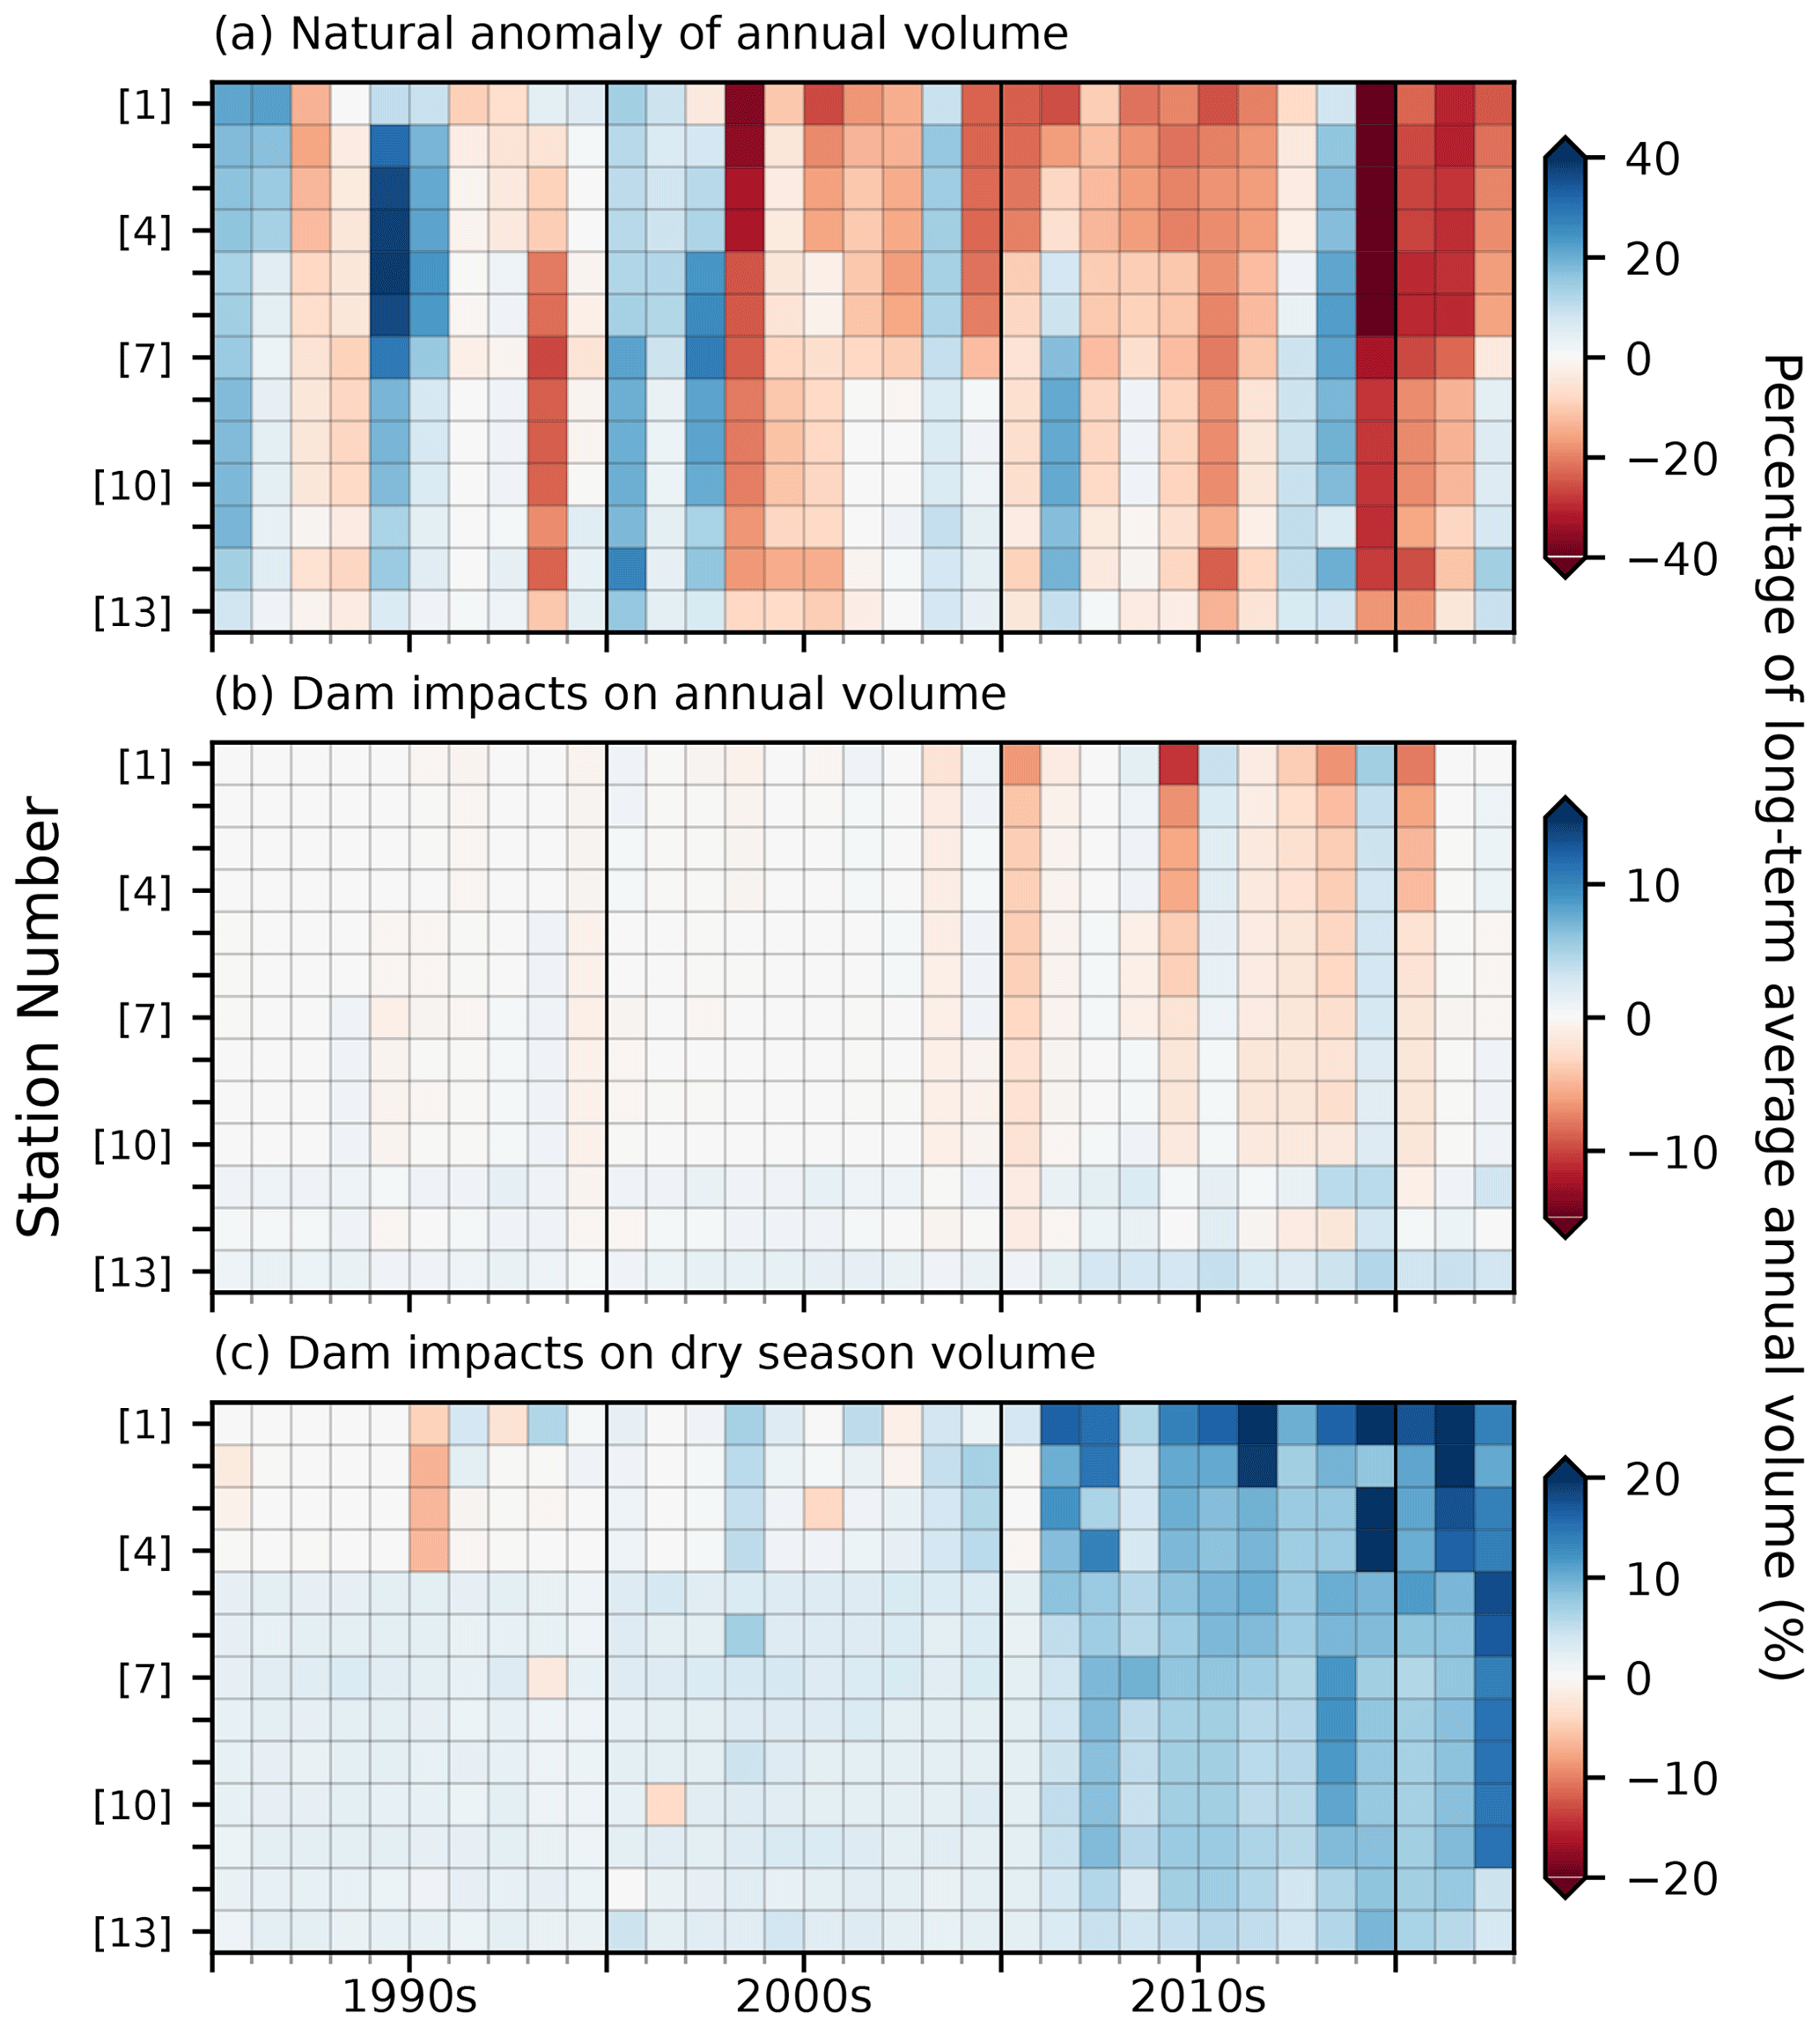
Figure 6Anomaly of natural annual volume compared to the long-term (1940–2022) annual average (a), changes in each year's annual volume due to dam impacts (b), and the change in dry-season volume due to dam operation (c). All the results are normalized by the long-term annual volume at that station and then converted to percentage values. The Y axes mark the station numbers (as depicted in Fig. 1) for all the panels.
3.3.2 Water balance: natural interdecadal variability and dam impacts
To examine the impact of natural climate variability on the water balance at the Mekong mainstream stations, annual flow volumes for the last 3 decades at each station are compared to the long-term average (Fig. 6a). First, the model distinctly captures the anomalously dry (e.g., 1998, 2015, and 2019–2021) and wet (e.g., 2000 and 2011) years discussed in previous studies (Pokhrel et al., 2018b; Shin et al., 2020). Second, while substantial interannual and interdecadal variability can be observed (Fig. 6a), it is clearly discernible that the MRB entered a prolonged water-deficit period starting in the mid-2000s that has intensified greatly in recent years. Since 2004, results have indicated multiple consecutive years with annual volumes well below average (e.g., ∼ 10 %) across the basin. This period reached its peak in 2019 (a major drought), with a ∼ 20 to over 40 % decrease in annual volume at different stations. This is followed by 2 consecutive drought years with more than 20 % lower volume than average across the entire basin; a sign of recovery started showing in 2022, especially in the downstream areas. Overall, these results indicate that there is a generally consistent tendency of decline in annual volume due to climate variation in recent decades compared to the long-term mean, which holds for all the stations examined (Fig. 6a).
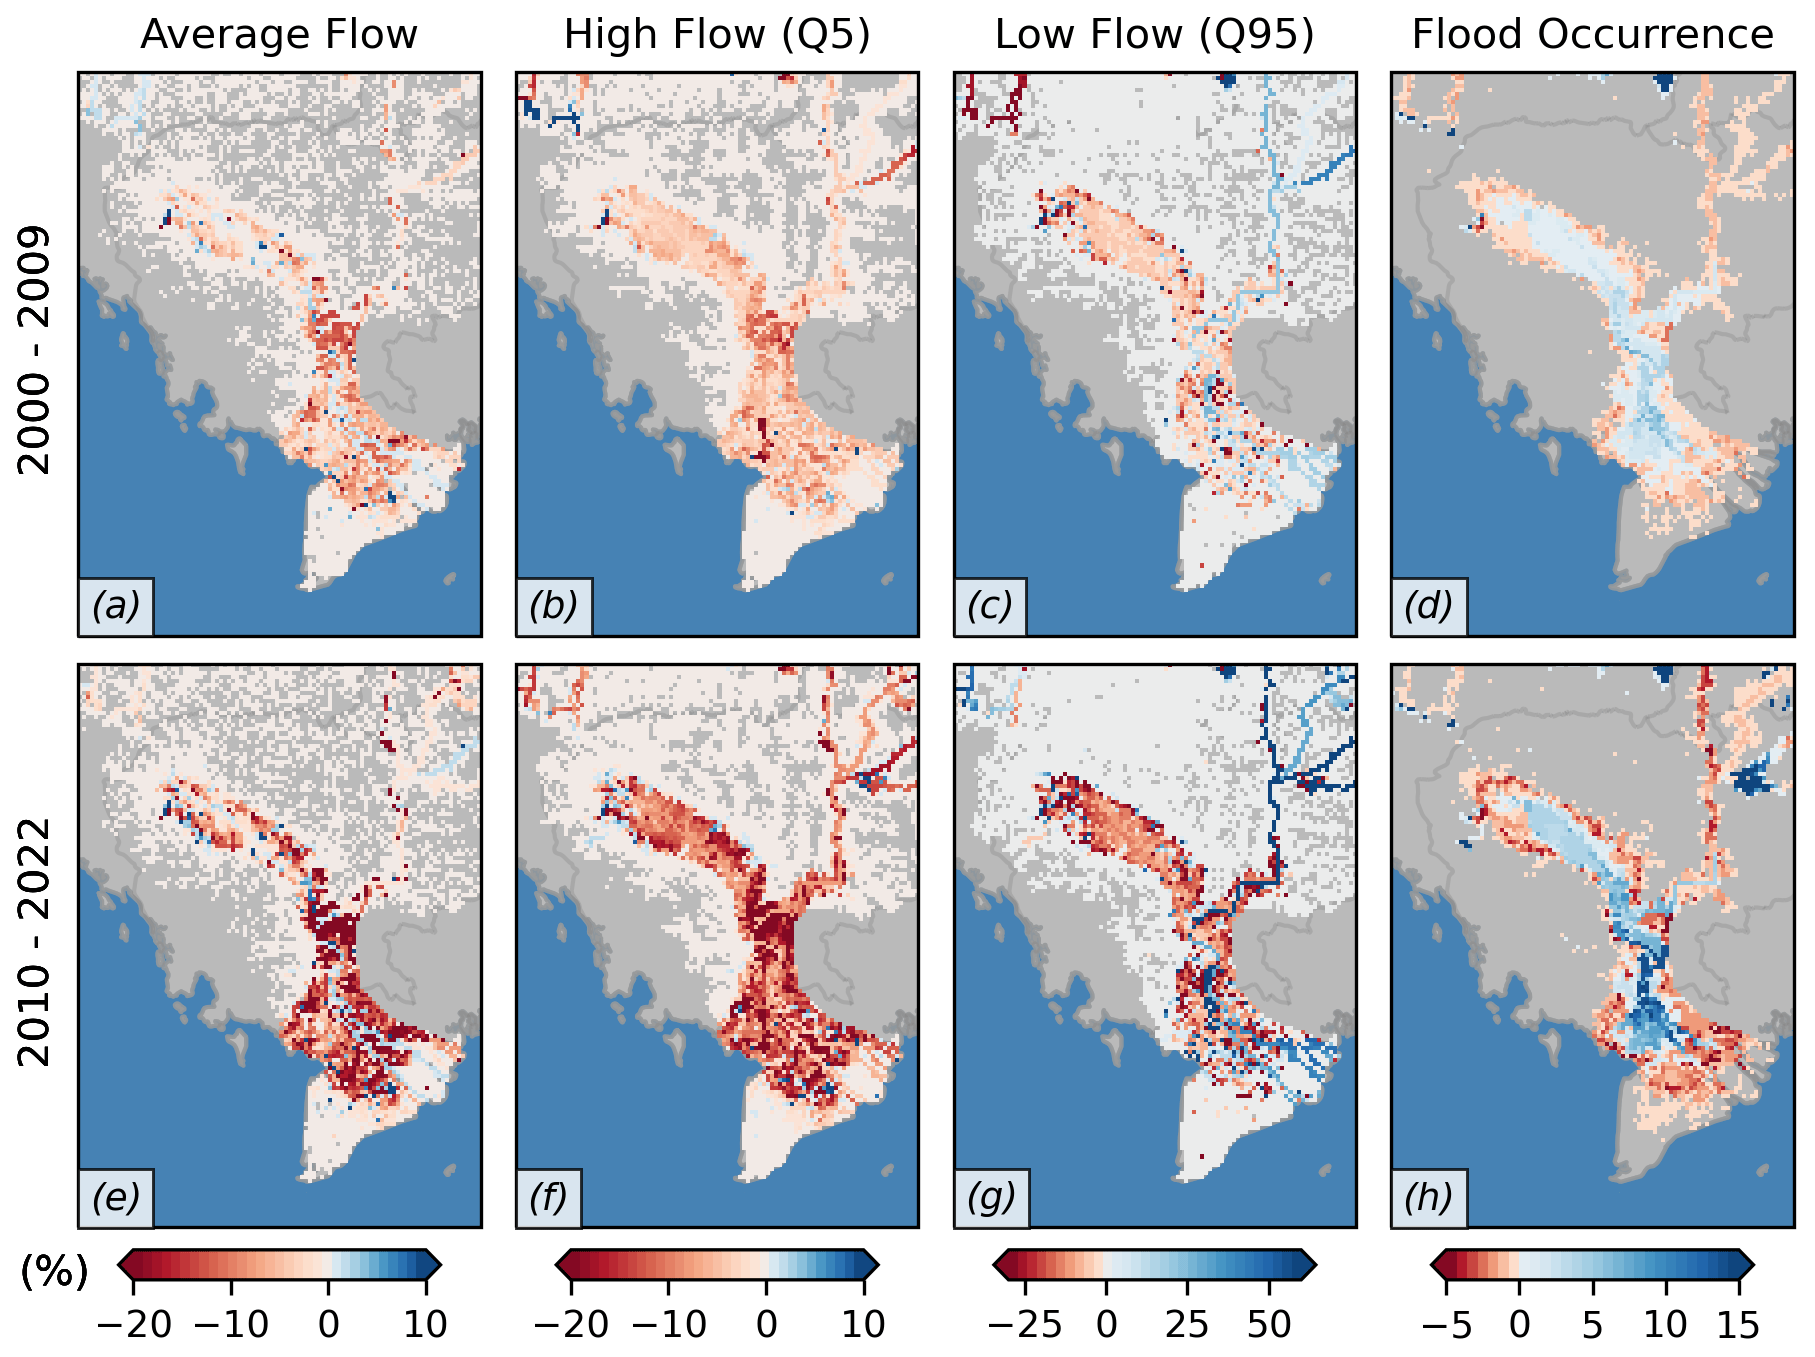
Figure 7Differences in flow regime attributes between the DAM and NAT simulations (period indicated) relative to the long-term (1940–2022) average of the NAT simulation over the Tonlé Sap and Mekong Delta areas, including (a, e) average flow, (b, f) high flow (Q5), and (c, g) low flow (Q95). Panels (d) and (h) show the difference in flood occurrence (percentage change) due to dam operation for the period indicated. Results for two periods are shown: 2000–2009 (a–d) and 2010–2022 (e–h). Areas outside of the MRB or with no changes are indicated in dark grey. Note that the color-bar range is different between the panels.
Figure 6b depicts how dams are affecting the annual volume over time and at different locations along the mainstream, indicating more pronounced impacts since 2010. Evidently, there are signs of dam impacts at an interannual scale, causing a ∼ 5 %–10 % decrease in the long-term average volume from one year to the next, especially in the upstream areas. However, a mild increase of < 5 % can be observed in recent years in the downstream areas (stations 9–13), which is due to dam operation in the lower MRB tributaries (e.g., the 3S region). Evidence from comparing the effects on annual volume between Fig. 6a and b confirms that the magnitudes of dam impacts on annual volume are not substantially higher than the natural variabilities, especially in dry years. In terms of the seasonal volume difference due to dam operation (Fig. 6c), results suggest that there has been a relatively small impact (< 5 %) in previous decades (e.g., the 1990s or the 2000s). However, the shift in the seasonal volume from the wet season to the dry season (i.e., the difference in dry-season volume between DAM and NAT simulations) has increased dramatically from < 5 % to ∼ 10 %–20 % across the Mekong mainstream since 2011, with areas in the upstream witnessing an increase of over 30 % in the long-term average volume. These results illustrate that the impacts of dams have become more prominent in recent years in terms of both annual and dry-season flow volumes, which may have profound implications for downstream hydrological, agricultural, and ecological systems.
3.4 Dam impacts on extreme events and flooding patterns
Figure 7 presents the decadal average of the difference between DAM and NAT simulations for annual average flow, high flow, low flow, and flood occurrence in the TSL and MD areas. Additionally, a map of the mainstream grid cell can be found in Fig. S14 in the Supplement. Results reveal that, even in the 2000s, upstream dam operation had already caused a visible impact on all the flow regime attributes in the most downstream areas of the Mekong. In agreement with Fig. 6b, Fig. 7a suggests that the mainstream average flow in the 2000s was relatively unchanged compared to the long-term average. However, the average flow over floodplain areas in the proximity of the Mekong mainstream and TSL decreased marginally (< 10 %). Similarly, high flow in the mainstream shows a minor decrease (< 2 %), while this decrease is substantially higher in the surrounding floodplains (∼ 5 %–10 %; Fig. 7b). Additionally, further confirming the dam-induced increase in dry-season flow seen in Fig. 6c, Fig. 7c reveals that this effect was moderate in the mainstream during the 2000s. In contrast, low flow in the floodplain decreased similarly to the average and high flows. These results are closely related as flow in the floodplain areas is typically generated during high-flow or flooding events; thus, a decrease in the flood peak due to dam operation directly caused a decrease in river channel overflow, effectively reducing flow in the floodplains and, consequently, flood occurrence in these areas. A previous study (Dang et al., 2022) suggested that upstream dam operation is shrinking TSL by reducing flood occurrence in the lake's outer areas. However, our results in Fig. 7d suggest that this effect is not limited to TSL but propagates further downstream to the MD, where the outer areas of the mainstream also witness a decrease in flood occurrence (< 5 % or ∼ 18 d yr−1). Additionally, due to the increased low flow, flood occurrence in the floodplain areas near the mainstream between TSL and the MD increased (∼ 5 %) during the 2000s (Fig. 7d). In the 2010s, similar dam-induced impacts were observed; however, the magnitude of these effects abruptly increased by 2 times or more. The mainstream's average and high flows remained relatively unchanged, with only a small difference (< 3 %); however, its low flow increased substantially (by ∼ 50 %) compared to the long-term average in some areas, while all flow attributes in the majority of the floodplain decreased substantially (∼ 20 %). The effect of dam operation on the flood occurrence between TSL and the MD also increased as flooding in the inner areas was further prolonged by 10 %–15 % (∼ 36–55 d), while the outer area's flooding was diminished. That is, dam operation has largely altered the seasonality of river regimes in this region and subsequently changed the inundation patterns in the TSL and MD areas. This is concerning for river–floodplain ecosystems and local communities considering that the 2010s were already a historically dry decade for the MRB.
3.5 Discussion
The changing hydrology of the Mekong River basin has been examined by numerous studies using various techniques and datasets; however, an in-depth analysis of the long-term (e.g., decadal and interdecadal) trends in basin-wide river flow regime attributes has never been reported. Furthermore, the impacts of dams on the Mekong flood pulse and extreme events are generally studied separately and only assessed over short time periods. In this study, we used a combination of state-of-the-art modeling approaches and data analysis techniques to mechanistically quantify the changes in various river flow characteristics and flood occurrences and to attribute those to the primary drivers. While natural climate variation remains the key driver of the Mekong's hydrological changes and variabilities over the last 8 decades, the emergence of new dams has caused considerable changes to the river's hydrological regime and flood characteristics in the past decade, which may have potentially profound implications for the ecosystem and livelihood of downstream areas.
Regarding the regional trend under natural climate variation, our results indicate that two main regions in the Mekong have generally changed over the last 8 decades: the Lancang and 3S basins. Overall, the trends suggest a substantial decline in river flow in the Lancang region, with values ranging from ∼ 2.5 % to 10 % per decade, which can be seen in both the annual volume and the flow minima. The detected trend is prevalent in multidecadal historical periods and hence is likely to continue into the future, indicating that we might need to rethink dam operation and water management in this region. For example, the high reduction in annual minima in the Lancang region may lead to more water being held in the Lancang cascade dams, leading to dramatically reduced water levels in the downstream regions, especially during major droughts. Further, sustaining current hydropower production may become challenging in the future. In the 3S region, the tendency of increased (decreased) flow during the wet (dry) season indicates the potential for both increased flood risk and water scarcity. In this regard, existing dams may prove beneficial in mitigating floods and providing additional water in the dry season, if operated considering these changes as suggested in previous studies (Galelli et al., 2022; Pokhrel and Tiwari, 2022). However, such changes in flow patterns will have unintended consequences for downstream ecosystems and livelihoods (Arias et al., 2014; Dang et al., 2022, 2016). Lastly, the decrease in annual minima in TSL's seasonally flooded areas suggests that the lake is becoming more stagnant, potentially contributing to less river flow to the downstream areas than in the past.
In terms of flood pulse, our results agree with previous studies (Adamson et al., 2009; Kummu and Sarkkula, 2008; Västilä et al., 2010) that the average timing of the Mekong River's flow regime has not drastically shifted during the past 8 decades. The wet season typically occurs between June and November, while the minimum and maximum flows occur in March and September, respectively. However, our results further reveal substantial fluctuations in the seasonal timing, sometimes exceeding 50 d per calendar year, and this is heavily dependent on the natural climate variation at each location. The results also show that, while the onset of the wet season varies greatly over time, the end of the wet season has remained relatively stable. This means that the duration of the wet season each year can be predicted by how late the onset of the wet season was. Additionally, our results suggest that there is an abrupt shift in the seasonal timing (∼ 2–4 weeks) that naturally occurs in areas downstream of station 11 compared to the upstream locations, which can be directly attributed to the natural retention effect of TSL. We also find that dam impacts on the seasonal timing of the lower Mekong mainstream, specifically the MD, are relatively small, ranging from 2 to 5 d. However, the effect of accelerated dam operation has considerably delayed the wet-season onset in the upper regions of the Mekong, sometimes by more than 30 d, especially in recent years. This can be particularly damaging to the environment as these impacts have been more pronounced in recent years, when the Mekong was already witnessing a severe drought. This implies that dams are not mitigating extreme drought conditions in terms of seasonal timing but, in fact, are further worsening the delay of the wet season in upstream areas of the MRB.
On a similar note, our results suggest that the effect of mitigating extreme drought conditions through interannual water redistribution is relatively minor. While there are some effects of holding back water in one year and releasing it in another, the difference due to dam operation is found to be only one-fourth of what natural climate variation can cause. However, dams are particularly effective in shifting water seasonally. Results (e.g., Fig. 6) illustrate that, since the 2010s, there has been a consistent shift of 10 %–20 % in the annual volume from the wet season to the dry season. While this impact is still more pronounced upstream, a ∼ 10 % increase in most of the lower mainstream areas during the dry season is prevalent. Overall, this suggests that dams are causing the dry season to be wetter and the wet season to be drier, similar to previous findings (Piman et al., 2016; Räsänen et al., 2012) but less substantial than expected, especially in the lower mainstream areas. While this effect can be positive in terms of agriculture as more water is available and is easily accessible for irrigation, it could cause a significant change and a possibly irreversible adverse impact on the ecosystems. As also noted in previous studies (Arias et al., 2014, 2013), water levels and inundated areas have increased in the dry season, causing many wetland areas to not have the dry period they need, which could eventually destroy these important ecological systems. Our results further confirm that dams are negatively impacting the flow by reducing average flow and high flow in the floodplains of TSL and the MD. Further, due to the decreased high flow during the wet season, flood occurrence will be reduced in many downstream regions, especially the outer areas of the main water bodies, as also discussed in previous studies (Dang et al., 2022; Pokhrel et al., 2018b). However, due to the increase in low flow, flood occurrence in many areas of TSL and the Mekong River near the main water bodies has been prolonged substantially, by 10 %–15 % (∼ 36–54 d yr−1).
This study presented the first long-term (1940–2022) decadal trends and variabilities in river flow regimes over the entire MRB at a spatial resolution of ∼ 5 km. Historical changes in the seasonal timing and volume of the mainstream Mekong flow were examined and attributed to natural climate drivers and dam operation, with an emphasis on the temporal evolution of the Mekong's flood pulse. Then, the dam-induced impacts on the spatial–temporal changes in flow regime attributes of TSL and the MD were investigated by examining the decadal difference between simulations with and without dams for average flow, high flow, low flow, and flood occurrence over the last 2 decades. We draw the following key conclusions. First, natural climate variation caused substantial decadal trends (± 5 %–10 %) in river flow during 1940–2022 in portions of the MRB, especially the Lancang and 3S regions. Second, dams were found to have intensified the high natural variability in the seasonal timing of mainstream Mekong flow, even though dam-induced impacts are still smaller compared to natural climate variation and are typically more pronounced in areas directly downstream of dams. This can be observed in 2019 and 2020, during which dams exacerbated drought conditions by substantially delaying the MRB's wet-season onset. We noted that the wet seasons under natural conditions (simulation without dams) in these years were already alarmingly shorter than in average years (by 20–50 d). Third, upstream dam operation had minimal impact on annual flow but is largely altering the seasonality of the MRB's flow regime attributes and flood dynamics in TSL and the MD by redistributing a substantial flow volume (∼ 10 %–20 % annual volume) from the wet season to the dry season; this was found to be substantial in the Mekong mainstream, especially in recent years. With reduced high flow in the Mekong mainstream, the decreased flood peak directly reduced flood occurrence (by up to 5 % or 18 d yr−1) in the surrounding floodplain areas. However, the increased low flow substantially prolonged the inundation of flooded areas in close proximity to the mainstream by ∼ 36–54 d in some of them. As a result, dams have effectively reduced the typically extensive flooding in TSL and the MD, which could cause unprecedented adverse impacts on the ecological system and local communities. Our results might contain uncertainties caused by the use of a basin-wide model, imperfect model parameterization, uncertainties in collected input data such as dam attributes, and the use of a generic dam operation scheme. These uncertainties could have been further amplified by lacking consideration of other human activities, e.g., changes in land use, sand mining, and water infrastructure development (e.g., dikes), which have been accelerating in recent times. These aspects could be addressed in future studies. Despite these limitations, this study presented the first results of the changes in natural hydrological regimes in the MRB over the past 8 decades, providing key insights into the role of recent increases in dam construction in changing annual or seasonal flow volumes, maximum flows, minimum flows, and flood occurrence in the TSL and MD areas. The findings are expected to be of use for rethinking water resource management, especially in the face of climate change and planning of future dams, and for opening new avenues of research to address emerging dam-related issues in the MRB.
Observed river flow and water level data can be obtained from the Mekong River Commission (2022, http://www.mrcmekong.org/). ERA5 data are open-access and are available from the Copernicus Climate Data Store (CDS; Hersbach et al., 2020; https://doi.org/10.24381/cds.bd0915c6, Hersbach et al., 2023). The Mekong dam list and CMFD code are available upon request. Simulated data used to produce the figures is available from Figshare (https://doi.org/10.6084/m9.figshare.26336977.v1, Pokhrel and Dang, 2024).
The supplement related to this article is available online at: https://doi.org/10.5194/hess-28-3347-2024-supplement.
HD: conceptualization, data curation, methodology, software, formal analysis, validation, visualization, writing – original draft preparation, writing – review and editing. YP: conceptualization, funding acquisition, resources, writing – review and editing.
The contact author has declared that neither of the authors has any competing interests.
Publisher's note: Copernicus Publications remains neutral with regard to jurisdictional claims made in the text, published maps, institutional affiliations, or any other geographical representation in this paper. While Copernicus Publications makes every effort to include appropriate place names, the final responsibility lies with the authors.
This article is part of the special issue “Representation of water infrastructures in large-scale hydrological and Earth system models”. It is not associated with a conference.
Simulations presented in this research were conducted using the High-Performance Computing Cluster (HPCC) provided by the Institute for Cyber-Enabled Research at Michigan State University.
This research was supported by the National Science Foundation (grant nos. 1752729 and 2127643) and the Luce Foundation (LuceSEA – Funded Mekong Culture WELL Project).
This paper was edited by Andrea Castelletti and reviewed by AFM Kamal Chowdhury and one anonymous referee.
Adamson, P. and Bird, J.: The mekong: A drought-prone tropical environment?, Int. J. Water Resour. D., 26, 579–594, https://doi.org/10.1080/07900627.2010.519632, 2010.
Adamson, P. T., Rutherfurd, I. D., Peel, M. C., and Conlan, I. A.: The Hydrology of the Mekong River, in: The Mekong: Biophysical Environment of an International River Basin, edited by: Campbell, I. C., Elsevier, Academic Press, San Diego, 53–76, https://doi.org/10.1016/B978-0-12-374026-7.00004-8, 2009.
Arias, M. E., Cochrane, T. A., Piman, T., Kummu, M., Caruso, B. S., and Killeen, T. J.: Quantifying changes in flooding and habitats in the Tonle Sap Lake (Cambodia) caused by water infrastructure development and climate change in the Mekong Basin, J. Environ. Manage., 112, 53–66, https://doi.org/10.1016/j.jenvman.2012.07.003, 2012.
Arias, M. E., Cochrane, T. A., Norton, D., Killeen, T. J., and Khon, P.: The Flood Pulse as the Underlying Driver of Vegetation in the Largest Wetland and Fishery of the Mekong Basin, AMBIO, 42, 864–876, https://doi.org//10.1007/s13280-013-0424-4, 2013.
Arias, M. E., Piman, T., Lauri, H., Cochrane, T. A., and Kummu, M.: Dams on Mekong tributaries as significant contributors of hydrological alterations to the Tonle Sap Floodplain in Cambodia, Hydrol. Earth Syst. Sci., 18, 5303–5315, https://doi.org/10.5194/hess-18-5303-2014, 2014a.
Arias, M. E., Cochrane, T. A., Kummu, M., Lauri, H., Holtgrieve, G. W., Koponen, J., and Piman, T.: Impacts of hydropower and climate change on drivers of ecological productivity of Southeast Asia's most important wetland, Ecol. Model., 272, 252–263, https://doi.org/10.1016/J.ECOLMODEL.2013.10.015, 2014b.
Arias, M. E., Cochrane, T. A., and Elliott, V.: Modelling future changes of habitat and fauna in the Tonle Sap wetland of the Mekong, Environ. Conserv., 41, 165–175, https://doi.org/10.1017/S0376892913000283, 2014c.
Baran, E. and Myschowoda, C.: Dams and fisheries in the Mekong Basin, Aquat. Ecosyst. Health, 12, 227–234, https://doi.org/10.1080/14634980903149902, 2009.
Bednarek, A. T.: Undamming Rivers: A Review of the Ecological Impacts of Dam Removal, Environ. Manage., 27, 803–814, https://doi.org/10.1007/s002670010189, 2001.
Bellmore, J. R., Duda, J. J., Craig, L. S., Greene, S. L., Torgersen, C. E., Collins, M. J., and Vittum, K.: Status and trends of dam removal research in the United States, WIREs Water, 4, e1164, https://doi.org/10.1002/WAT2.1164, 2017.
Best, J.: Anthropogenic stresses on the world's big rivers, Nat. Geosci., 12, 7–21, https://doi.org/10.1038/s41561-018-0262-x, 2018.
Botter, G., Basso, S., Rodriguez-Iturbe, I., and Rinaldo, A.: Resilience of river flow regimes, P. Natl. Acad. Sci. USA, 110, 12925–12930, https://doi.org/10.1073/pnas.1311920110, 2013.
Boulange, J., Hanasaki, N., Yamazaki, D., and Pokhrel, Y.: Role of dams in reducing global flood exposure under climate change, Nat. Commun., 12, 417, https://doi.org/10.1038/s41467-020-20704-0, 2021.
Bryant, S., McGrath, H., and Boudreault, M.: Gridded flood depth estimates from satellite-derived inundations, Nat. Hazards Earth Syst. Sci., 22, 1437–1450, https://doi.org/10.5194/nhess-22-1437-2022, 2022.
Bunn, S. E. and Arthington, A. H.: Basic principles and ecological consequences of altered flow regimes for aquatic biodiversity, Environ. Manage., 30, 492–507, https://doi.org/10.1007/s00267-002-2737-0, 2002.
Calvin, K., Dasgupta, D., Krinner, G., Mukherji, A., Thorne, P. W., Trisos, C., Romero, J., Aldunce, P., Barrett, K., Blanco, G., Cheung, W. W. L., Connors, S., Denton, F., Diongue-Niang, A., Dodman, D., Garschagen, M., Geden, O., Hayward, B., Jones, C., Jotzo, F., Krug, T., Lasco, R., Lee, Y.-Y., Masson-Delmotte, V., Meinshausen, M., Mintenbeck, K., Mokssit, A., Otto, F. E. L., Pathak, M., Pirani, A., Poloczanska, E., Pörtner, H.-O., Revi, A., Roberts, D. C., Roy, J., Ruane, A. C., Skea, J., Shukla, P. R., Slade, R., Slangen, A., Sokona, Y., Sörensson, A. A., Tignor, M., van Vuuren, D., Wei, Y.-M., Winkler, H., Zhai, P., Zommers, Z., Hourcade, J.-C., Johnson, F. X., Pachauri, S., Simpson, N. P., Singh, C., Thomas, A., Totin, E., Alegría, A., Armour, K., Bednar-Friedl, B., Blok, K., Cissé, G., Dentener, F., Eriksen, S., Fischer, E., Garner, G., Guivarch, C., Haasnoot, M., Hansen, G., Hauser, M., Hawkins, E., Hermans, T., Kopp, R., Leprince-Ringuet, N., Lewis, J., Ley, D., Ludden, C., Niamir, L., Nicholls, Z., Some, S., Szopa, S., Trewin, B., van der Wijst, K.-I., Winter, G., Witting, M., Birt, A., and Ha, M.: IPCC, 2023: Climate Change 2023: Synthesis Report. Contribution of Working Groups I, II and III to the Sixth Assessment Report of the Intergovernmental Panel on Climate Change (Core Writing Team, H. Lee and J. Romero (eds.)), IPCC, Geneva, Switzerland, https://doi.org/10.59327/IPCC/AR6-9789291691647, 2023.
Chaudhari, S. and Pokhrel, Y.: Alteration of River Flow and Flood Dynamics by Existing and Planned Hydropower Dams in the Amazon River Basin, Water Resour. Res., 58, e2021WR030555, https://doi.org/10.1029/2021WR030555, 2022.
Chea, R., Ahsan, D., García-Lorenzo, I., and Teh, L.: Fish consumption patterns and value chain analysis in north-western Cambodia, Fish. Res., 263, 106677, https://doi.org/10.1016/J.FISHRES.2023.106677, 2023.
Cho, M. S. and Qi, J.: Quantifying spatiotemporal impacts of hydro-dams on land use/land cover changes in the Lower Mekong River Basin, Appl. Geogr., 136, 102588, https://doi.org/10.1016/j.apgeog.2021.102588, 2021.
Cho, M. S. and Qi, J.: Characterization of the impacts of hydro-dams on wetland inundations in Southeast Asia, Sci. Total Environ., 864, 160941, https://doi.org/10.1016/J.SCITOTENV.2022.160941, 2023.
Chowdhury, A. F. M. K., Wild, T., Zhang, Y., Binsted, M., Iyer, G., Kim, S. H., and Lamontagne, J.: Hydropower expansion in eco-sensitive river basins under global energy-economic change, Nat. Sustain., 7, 213–222, https://doi.org/10.1038/s41893-023-01260-z, 2024.
Chua, S. D. X., Lu, X. X., Oeurng, C., Sok, T., and Grundy-Warr, C.: Drastic decline of flood pulse in the Cambodian floodplains (Mekong River and Tonle Sap system), Hydrol. Earth Syst. Sci., 26, 609–625, https://doi.org/10.5194/hess-26-609-2022, 2022.
Dang, H., Pokhrel, Y., Shin, S., Stelly, J., Ahlquist, D., and Du, D.: Hydrologic balance and inundation dynamics of Southeast Asia's largest inland lake altered by hydropower dams in the Mekong River basin, Sci. Total Environ., 831, 154833, https://doi.org/10.1016/j.scitotenv.2022.154833, 2022.
Dang, T. D., Cochrane, T. A., Arias, M. E., Van, P. D. T., and de Vries, T. T.: Hydrological alterations from water infrastructure development in the Mekong floodplains, Hydrol. Process., 30, 3824–3838, https://doi.org/10.1002/HYP.10894, 2016.
Delgado, J. M., Apel, H., and Merz, B.: Flood trends and variability in the Mekong river, Hydrol. Earth Syst. Sci., 14, 407–418, https://doi.org/10.5194/hess-14-407-2010, 2010.
Dethier, E. N., Renshaw, C. E., and Magilligan, F. J.: Rapid changes to global river suspended sediment flux by humans, Science, 376, 1447–1452, https://doi.org/10.1126/science.abn7980, 2022.
Flaminio, S., Piégay, H., and Le Lay, Y. F.: To dam or not to dam in an age of anthropocene: Insights from a genealogy of media discourses, Anthropocene, 36, 100312, https://doi.org/10.1016/J.ANCENE.2021.100312, 2021.
Galelli, S., Dang, T. D., Ng, J. Y., Chowdhury, A. F. M. K., and Arias, M. E.: Opportunities to curb hydrological alterations via dam re-operation in the Mekong, Nat. Sustain. 2022 5:12, 5, 1058–1069, https://doi.org/10.1038/s41893-022-00971-z, 2022.
Gao, J., Zhao, J., and Wang, H.: Dam-Impacted Water–Energy–Food Nexus in Lancang-Mekong River Basin, J. Water Res. Plan. Man., 147, 04021010, https://doi.org/10.1061/(asce)wr.1943-5452.0001347, 2021.
Gilbert, R. O.: Statistical methods for environmental pollution monitoring, Wiley, 335 pp., ISBN, 9780471288787, 0471288780, https://www.google.com/books/edition/Statistical_Methods_for_Environmental_Po/lEo1rvDGUEkC?hl=en&gbpv=0, (last access: 20 May 2024), 1987.
Graf, W. L.: Dam nation: A geographic census of American dams and their large-scale hydrologic impacts, Water Resour. Res., 35, 1305–1311, https://doi.org/10.1029/1999WR900016, 1999.
Grill, G., Lehner, B., Thieme, M., Geenen, B., Tickner, D., Antonelli, F., Babu, S., Borrelli, P., Cheng, L., Crochetiere, H., Ehalt Macedo, H., Filgueiras, R., Goichot, M., Higgins, J., Hogan, Z., Lip, B., McClain, M. E., Meng, J., Mulligan, M., Nilsson, C., Olden, J. D., Opperman, J. J., Petry, P., Reidy Liermann, C., Sáenz, L., Salinas-Rodríguez, S., Schelle, P., Schmitt, R. J. P., Snider, J., Tan, F., Tockner, K., Valdujo, P. H., van Soesbergen, A., and Zarfl, C.: Mapping the world's free-flowing rivers, Nature, 569, 215–221, https://doi.org/10.1038/s41586-019-1111-9, 2019.
Grumbine, R. E. and Xu, J.: Mekong hydropower development, Science, 332, 178–179, https://doi.org/10.1126/science.1200990, 2011.
Gudmundsson, L., Boulange, J., Do, H. X., Gosling, S. N., Grillakis, M. G., Koutroulis, A. G., Leonard, M., Liu, J., Schmied, H. M., Papadimitriou, L., Pokhrel, Y., Seneviratne, S. I., Satoh, Y., Thiery, W., Westra, S., Zhang, X., and Zhao, F.: Globally observed trends in mean and extreme river flow attributed to climate change, Science, 371, 1159–1162, https://doi.org/10.1126/science.aba3996, 2021.
Haddeland, I., Heinke, J., Biemans, H., Eisner, S., Flörke, M., Hanasaki, N., Konzmann, M., Ludwig, F., Masaki, Y., Schewe, J., Stacke, T., Tessler, Z. D., Wada, Y., and Wisser, D.: Global water resources affected by human interventions and climate change, P. Natl. Acad. Sci. USA, 111, 3251–3256, https://doi.org/10.1073/pnas.1222475110, 2014.
Hersbach, H., Bell, B., Berrisford, P., Hirahara, S., Horányi, A., Muñoz-Sabater, J., Nicolas, J., Peubey, C., Radu, R., Schepers, D., Simmons, A., Soci, C., Abdalla, S., Abellan, X., Balsamo, G., Bechtold, P., Biavati, G., Bidlot, J., Bonavita, M., De Chiara, G., Dahlgren, P., Dee, D., Diamantakis, M., Dragani, R., Flemming, J., Forbes, R., Fuentes, M., Geer, A., Haimberger, L., Healy, S., Hogan, R. J., Hólm, E., Janisková, M., Keeley, S., Laloyaux, P., Lopez, P., Lupu, C., Radnoti, G., de Rosnay, P., Rozum, I., Vamborg, F., Villaume, S., and Thépaut, J. N.: The ERA5 global reanalysis, Q. J. Roy. Meteor. Soc., 146, 1999–2049, https://doi.org/10.1002/qj.3803, 2020.
Hersbach, H., Bell, B., Berrisford, P., Biavati, G., Horányi, A., Muñoz Sabater, J., Nicolas, J., Peubey, C., Radu, R., Rozum, I., Schepers, D., Simmons, A., Soci, C., Dee, D., and Thépaut, J.-N.: ERA5 hourly data on pressure levels from 1940 to present, Copernicus Climate Change Service (C3S) Climate Data Store (CDS) [data set], https://doi.org/10.24381/cds.bd0915c6, 2023.
Hirabayashi, Y., Kanae, S., Emori, S., Oki, T., and Kimoto, M.: Global projections of changing risks of floods and droughts in a changing climate, Hydrolog. Sci. J., 53, 754–772, https://doi.org/10.1623/HYSJ.53.4.754, 2010.
Keovilignavong, O., Nguyen, T. H., and Hirsch, P.: Reviewing the causes of Mekong drought before and during 2019–20, Int. J. Water Resour. D., 00, 1–21, https://doi.org/10.1080/07900627.2021.1967112, 2021.
Kummu, M. and Sarkkula, J.: Impact of the Mekong River flow alteration on the Tonle Sap flood pulse, Ambio, 37, 185–192, https://doi.org/10.1579/0044-7447(2008)37[185:IOTMRF]2.0.CO;2, 2008.
Kummu, M., Tes, S., Yin, S., Adamson, P., Józsa, J., Koponen, J., Richey, J., and Sarkkula, J.: Water balance analysis for the Tonle Sap Lake-floodplain system, Hydrol. Process., 28, 1722–1733, https://doi.org/10.1002/hyp.9718, 2013.
Lakshmi, V., Le, M.-H., Goffin, B. D., Besnier, J., Pham, H. T., Do, H.-X., Fang, B., Mohammed, I., and Bolten, J. D.: Regional analysis of the 2015–16 Lower Mekong River basin drought using NASA satellite observations, J. Hydrol. Reg. Stud., 46, 101362, https://doi.org/10.1016/j.ejrh.2023.101362, 2023.
Lauri, H., de Moel, H., Ward, P. J., Räsänen, T. A., Keskinen, M., and Kummu, M.: Future changes in Mekong River hydrology: impact of climate change and reservoir operation on discharge, Hydrol. Earth Syst. Sci., 16, 4603–4619, https://doi.org/10.5194/hess-16-4603-2012, 2012.
Lehner, B., Liermann, C. R., Revenga, C., Vörömsmarty, C., Fekete, B., Crouzet, P., Döll, P., Endejan, M., Frenken, K., Magome, J., Nilsson, C., Robertson, J. C., Rödel, R., Sindorf, N., and Wisser, D.: High-resolution mapping of the world's reservoirs and dams for sustainable river-flow management, Front. Ecol. Environ., 9, 494–502, https://doi.org/10.1890/100125, 2011.
Li, D., Long, D., Zhao, J., Lu, H., and Hong, Y.: Observed changes in flow regimes in the Mekong River basin, J. Hydrol. (Amst), 551, 217–232, https://doi.org/10.1016/j.jhydrol.2017.05.061, 2017.
Li, Y., Lu, H., Yang, K., Wang, W., Tang, Q., Khem, S., Yang, F., and Huang, Y.: Meteorological and hydrological droughts in Mekong River Basin and surrounding areas under climate change, J. Hydrol. Reg. Stud., 36, 100873, https://doi.org/10.1016/j.ejrh.2021.100873, 2021.
Lu, X. X. and Chua, S. D. X.: River Discharge and Water Level Changes in the Mekong River: Droughts in an Era of Mega-Dams, Hydrol. Process., 35, 1–9, https://doi.org/10.1002/hyp.14265, 2021.
Mann, H. B.: Nonparametric Tests Against Trend, Econometrica, 13, 245, https://doi.org/10.2307/1907187, 1945.
Mekong River Commission: Mekong River Commission, http://www.mrcmekong.org/, last access: 29 September 2022.
Mendez, M., Maathuis, B., Hein-Griggs, D., and Alvarado-Gamboa, L. F.: Performance Evaluation of Bias Correction Methods for Climate Change Monthly Precipitation Projections over Costa Rica, Water, 12, 482, https://doi.org/10.3390/W12020482, 2020.
Morovati, K., Tian, F., Kummu, M., Shi, L., Tudaji, M., Nakhaei, P., and Alberto Olivares, M.: Contributions from climate variation and human activities to flow regime change of Tonle Sap Lake from 2001 to 2020, J. Hydrol. (Amst), 616, 128800, https://doi.org/10.1016/J.JHYDROL.2022.128800, 2023.
Mulligan, M., van Soesbergen, A., and Sáenz, L.: GOODD, a global dataset of more than 38,000 georeferenced dams, Sci. Data, 7, 1–8, https://doi.org/10.1038/s41597-020-0362-5, 2020.
Ng, W. X. and Park, E.: Shrinking Tonlé Sap and the recent intensification of sand mining in the Cambodian Mekong River, Sci. Total Environ., 777, 146180, https://doi.org/10.1016/j.scitotenv.2021.146180, 2021.
Ngor, P. B., Legendre, P., Oberdorff, T., and Lek, S.: Flow alterations by dams shaped fish assemblage dynamics in the complex Mekong-3S river system, Ecol. Indic., 88, 103–114, https://doi.org/10.1016/j.ecolind.2018.01.023, 2018.
Nilsson, C., Reidy, C. A., Dynesius, M., and Revenga, C.: Fragmentation and flow regulation of the world's large river systems, Science, 308, 405–408, https://doi.org/10.1126/science.1107887, 2005.
Oki, T. and Kanae, S.: Global hydrological cycles and world water resources, Science, 313, 1068–1072, https://doi.org/10.1126/science.1128845, 2006.
Orr, S., Pittock, J., Chapagain, A., and Dumaresq, D.: Dams on the Mekong River: Lost fish protein and the implications for land and water resources, Global Environ. Chang., 22, 925–932, https://doi.org/10.1016/j.gloenvcha.2012.06.002, 2012.
Piman, T., Cochrane, T. A., and Arias, M. E.: Effect of Proposed Large Dams on Water Flows and Hydropower Production in the Sekong, Sesan and Srepok Rivers of the Mekong Basin, River Res. Appl., 32, 2095–2108, https://doi.org/10.1002/RRA.3045, 2016.
Poff, N. L., Brown, C. M., Grantham, T. E., Matthews, J. H., Palmer, M. A., Spence, C. M., Wilby, R. L., Haasnoot, M., Mendoza, G. F., Dominique, K. C., and Baeza, A.: Sustainable water management under future uncertainty with eco-engineering decision scaling, Nat. Clim. Change, 6, 25–34, https://doi.org/10.1038/nclimate2765, 2015.
Pokhrel, Y. and Dang, H.: Evolution of river regimes in the Mekong River basin over 8 decades and the role of dams in recent hydrological extremes, Figshare [data set], https://doi.org/10.6084/m9.figshare.26336977.v1, 2024.
Pokhrel, Y. and Tiwari, A. D.: Re-operating dams in the Mekong, Nat. Sustain., 5, 1005–1006, https://doi.org/10.1038/s41893-022-00998-2, 2022.
Pokhrel, Y., Koirala, S., Yeh, P. J. F., Hanasaki, N., Longuevergne, L., Kanae, S., and Oki, T.: Incorporation of groundwater pumping in a global Land Surface Model with the representation of human impacts, Water Resour. Res., 51, 78–96, https://doi.org/10.1002/2014WR015602, 2015.
Pokhrel, Y., Burbano, M., Roush, J., Kang, H., Sridhar, V., and Hyndman, D. W.: A review of the integrated effects of changing climate, land use, and dams on Mekong river hydrology, Water (Switzerland), 10, 1–25, https://doi.org/10.3390/w10030266, 2018a.
Pokhrel, Y., Shin, S., Lin, Z., Yamazaki, D., and Qi, J.: Potential Disruption of Flood Dynamics in the Lower Mekong River Basin Due to Upstream Flow Regulation, Sci. Rep.-UK, 8, 1–13, https://doi.org/10.1038/s41598-018-35823-4, 2018b.
Pokhrel, Y., Felfelani, F., Satoh, Y., Boulange, J., Burek, P., Gädeke, A., Gerten, D., Gosling, S. N., Grillakis, M., Gudmundsson, L., Hanasaki, N., Kim, H., Koutroulis, A., Liu, J., Papadimitriou, L., Schewe, J., Müller Schmied, H., Stacke, T., Telteu, C. E., Thiery, W., Veldkamp, T., Zhao, F., and Wada, Y.: Global terrestrial water storage and drought severity under climate change, Nat. Clim. Change, 11, 226–233, https://doi.org/10.1038/s41558-020-00972-w, 2021.
Räsänen, T. A., Koponen, J., Lauri, H., and Kummu, M.: Downstream Hydrological Impacts of Hydropower Development in the Upper Mekong Basin, Water Resour. Manag., 26, 3495–3513, https://doi.org/10.1007/S11269-012-0087-0/FIGURES/7, 2012.
Shin, S., Pokhrel, Y., Yamazaki, D., Huang, X., Torbick, N., Qi, J., Pattanakiat, S., Ngo-Duc, T., and Nguyen, T. D.: High Resolution Modeling of River-Floodplain-Reservoir Inundation Dynamics in the Mekong River Basin, Water Resour. Res., 56, 1–23, https://doi.org/10.1029/2019WR026449, 2020.
Shin, S., Pokhrel, Y., Talchabhadel, R., and Panthi, J.: Spatio-temporal dynamics of hydrologic changes in the Himalayan river basins of Nepal using high-resolution hydrological-hydrodynamic modeling, J. Hydrol. (Amst), 598, 126209, https://doi.org/10.1016/j.jhydrol.2021.126209, 2021.
Smajgl, A., Toan, T. Q., Nhan, D. K., Ward, J., Trung, N. H., Tri, L. Q., Tri, V. P. D., and Vu, P. T.: Responding to rising sea levels in the Mekong Delta, Nat. Clim. Change, 5, 167–174, https://doi.org/10.1038/nclimate2469, 2015.
Tanoue, M., Hirabayashi, Y., and Ikeuchi, H.: Global-scale river flood vulnerability in the last 50 years, Sci. Rep.-UK, 6, 1–9, https://doi.org/10.1038/srep36021, 2016.
Teh, L. S. L., Bond, N., KC, K., Fraser, E., Seng, R., and Sumaila, U. R.: The economic impact of global change on fishing and non-fishing households in the Tonle Sap ecosystem, Pursat, Cambodia, Fish. Res., 210, 71–80, https://doi.org/10.1016/j.fishres.2018.10.005, 2019.
Themeßl, M. J., Gobiet, A., and Heinrich, G.: Empirical-statistical downscaling and error correction of regional climate models and its impact on the climate change signal, Climatic Change, 112, 449–468, https://doi.org/10.1007/s10584-011-0224-4, 2012.
Try, S., Tanaka, S., Tanaka, K., Sayama, T., Lee, G., and Oeurng, C.: Assessing the effects of climate change on flood inundation in the lower Mekong Basin using high-resolution AGCM outputs, Prog. Earth Planet. Sci., 7, 34, https://doi.org/10.1186/s40645-020-00353-z, 2020.
Tuong, V., Hoang, T. Van, Chou, T. Y., Fang, Y. M., Wang, C. T., Tran, T. D., and Tran, D. D.: Extreme droughts change in the mekong river basin: A multidisciplinary analysis based on satellite data, Water (Switzerland), 13, 1–19, https://doi.org/10.3390/w13192682, 2021.
Västilä, K., Kummu, M., Sangmanee, C., and Chinvanno, S.: Modelling climate change impacts on the flood pulse in the lower mekong floodplains, J. Water Clim. Change, 1, 67–86, https://doi.org/10.2166/wcc.2010.008, 2010.
Vu, D. T., Dang, T. D., Galelli, S., and Hossain, F.: Satellite observations reveal 13 years of reservoir filling strategies, operating rules, and hydrological alterations in the Upper Mekong River basin, Hydrol. Earth Syst. Sci., 26, 2345–2364, https://doi.org/10.5194/hess-26-2345-2022, 2022.
Wang, J., Yun, X., Pokhrel, Y., Yamazaki, D., Zhao, Q., Chen, A., and Tang, Q.: Modeling Daily Floods in the Lancang-Mekong River Basin Using an Improved Hydrological–Hydrodynamic Model, Water Resour. Res., 57, 1–20, https://doi.org/10.1029/2021WR029734, 2021.
Wang, J., Tang, Q., Yun, X., Chen, A., Sun, S., and Yamazaki, D.: Flood inundation in the Lancang-Mekong River Basin: Assessing the role of summer monsoon, J. Hydrol. (Amst), 612, https://doi.org/10.1016/j.jhydrol.2022.128075, 2022.
Wang, S., Zhang, L., She, D., Wang, G., and Zhang, Q.: Future projections of flooding characteristics in the Lancang-Mekong River Basin under climate change, J. Hydrol. (Amst), 602, 126778, https://doi.org/10.1016/j.jhydrol.2021.126778, 2021.
Wang, W., Lu, H., Ruby Leung, L., Li, H. Y., Zhao, J., Tian, F., Yang, K., and Sothea, K.: Dam Construction in Lancang-Mekong River Basin Could Mitigate Future Flood Risk From Warming-Induced Intensified Rainfall, Geophys. Res. Lett., 44, 10,378-10,386, https://doi.org/10.1002/2017GL075037, 2017.
Winemiller, K. O., McIntyre, P. B., Castello, L., Fluet-Chouinard, E., Giarrizzo, T., Nam, S., Baird, I. G., Darwall, W., Lujan, N. K., Harrison, I., Stiassny, M. L. J., Silvano, R. A. M., Fitzgerald, D. B., Pelicice, F. M., Agostinho, A. A., Gomes, L. C., Albert, J. S., Baran, E., Petrere, M., Zarfl, C., Mulligan, M., Sullivan, J. P., Arantes, C. C., Sousa, L. M., Koning, A. A., Hoeinghaus, D. J., Sabaj, M., Lundberg, J. G., Armbruster, J., Thieme, M. L., Petry, P., Zuanon, J., Torrente Vilara, G., Snoeks, J., Ou, C., Rainboth, W., Pavanelli, C. S., Akama, A., Van Soesbergen, A., and Sáenz, L.: Balancing hydropower and biodiversity in the Amazon, Congo, and Mekong, Science, 351, 128–129, https://doi.org/10.1126/science.aac7082, 2016.
Yamazaki, D., Kanae, S., Kim, H., and Oki, T.: A physically based description of floodplain inundation dynamics in a global river routing model, Water Resour. Res., 47, 1–21, https://doi.org/10.1029/2010WR009726, 2011.
Yamazaki, D., Lee, H., Alsdorf, D. E., Dutra, E., Kim, H., Kanae, S., Oki, T., Yamazaki, C., Lee, H., Alsdorf, D. E., Dutra, E., Kim, H., Kanae, S., and Oki, T.: Analysis of the water level dynamics simulated by a global river model: A case study in the Amazon River, Water Resour. Res., 48, 9508, https://doi.org/10.1029/2012WR011869, 2012.
Yamazaki, D., De Almeida, G. A. M., and Bates, P. D.: Improving computational efficiency in global river models by implementing the local inertial flow equation and a vector-based river network map, Water Resour. Res., 49, 7221–7235, https://doi.org/10.1002/wrcr.20552, 2013.
Yamazaki, D., Ikeshima, D., Sosa, J., Bates, P. D., Allen, G. H., and Pavelsky, T. M.: MERIT Hydro: a high-resolution global hydrography map based on latest topography dataset, Water Resour. Res., 55, 5053–5073, https://doi.org/10.1029/2019WR024873, 2019.
Yoshida, Y., Lee, H. S., Trung, B. H., Tran, H. D., Lall, M. K., Kakar, K., and Xuan, T. D.: Impacts of mainstream hydropower dams on fisheries and agriculture in lower mekong basin, Sustainability (Switzerland), 12, 1–21, https://doi.org/10.3390/su12062408, 2020.
Yuan, S., Stuart, A. M., Laborte, A. G., Rattalino Edreira, J. I., Dobermann, A., Kien, L. V. N., Thúy, L. T., Paothong, K., Traesang, P., Tint, K. M., San, S. S., Villafuerte, M. Q., Quicho, E. D., Pame, A. R. P., Then, R., Flor, R. J., Thon, N., Agus, F., Agustiani, N., Deng, N., Li, T., and Grassini, P.: Southeast Asia must narrow down the yield gap to continue to be a major rice bowl, Nature Food, 3, 217–226, https://doi.org/10.1038/s43016-022-00477-z, 2022.
Zarfl, C., Lumsdon, A. E., Berlekamp, J., Tydecks, L., and Tockner, K.: A global boom in hydropower dam construction, Aquat. Sci., 77, 161–170, https://doi.org/10.1007/s00027-014-0377-0, 2014.
Zhang, A. T. and Gu, V. X.: Global Dam Tracker: A database of more than 35,000 dams with location, catchment, and attribute information, Sci. Data, 10, 1–19, https://doi.org/10.1038/s41597-023-02008-2, 2023.
Ziv, G., Baran, E., Nam, S., Rodríguez-Iturbe, I., and Levin, S. A.: Trading-off fish biodiversity, food security, and hydropower in the Mekong River Basin, P. Natl. Acad. Sci. USA, 109, 5609–5614, https://doi.org/10.1073/pnas.1201423109, 2012.