the Creative Commons Attribution 4.0 License.
the Creative Commons Attribution 4.0 License.
 | 15 Aug 2018
Remote land use impacts on river flows through atmospheric teleconnections
Ingo Fetzer
Patrick W. Keys
Ruud J. van der Ent
Hubert H. G. Savenije
Line J. Gordon
The effects of land-use change on river flows have usually been explained by changes within a river basin. However, land–atmosphere feedback such as moisture recycling can link local land-use change to modifications of remote precipitation, with further knock-on effects on distant river flows. Here, we look at river flow changes caused by both land-use change and water use within the basin, as well as modifications of imported and exported atmospheric moisture. We show that in some of the world’s largest basins, precipitation was influenced more strongly by land-use change occurring outside than inside the basin. Moreover, river flows in several non-transboundary basins were considerably regulated by land-use changes in foreign countries. We conclude that regional patterns of land-use change and moisture recycling are important to consider in explaining runoff change, integrating land and water management, and informing water governance.
Please read the corrigendum first before continuing.
-
Notice on corrigendum
The requested paper has a corresponding corrigendum published. Please read the corrigendum first before downloading the article.
-
Article
(15821 KB)
- Corrigendum
-
Supplement
(3762 KB)
-
The requested paper has a corresponding corrigendum published. Please read the corrigendum first before downloading the article.
- Article
(15821 KB) - Full-text XML
- Corrigendum
-
Supplement
(3762 KB) - BibTeX
- EndNote


River flows (Q) are fundamental for ecosystems, nutrient transport, hydropower, navigation, and human well-being (Oki and Kanae, 2006). Land-use change (LUC) has been suggested to be the most important driver of both past (Piao et al., 2007; Sterling et al., 2012) and future (Betts et al., 2015; Milly et al., 2005) changes in river flows (ΔQ). Central to the analysis of Q is the river basin unit, and estimates of ΔQ from LUC often assume that impacts occur exclusively within a basin (Gerten et al., 2008; Piao et al., 2007; Rost et al., 2008a, b; Sterling et al., 2012). Water governance is strongly focused on frameworks such as the Integrated River Basin Management (IWRM) and largely assumes that there is no land–atmosphere feedback, even in discussions of spatial misfit between institutions and hydrological realities (Giordano et al., 2015; Hoekstra, 2010). In fact, land–atmosphere feedbacks are not incorporated into most recent literature on a wide range of topics of relevance for water management, such as virtual water (Dalin et al., 2017), the freshwater planetary boundary (Rockström et al., 2009; Steffen et al., 2015), water scarcity (Mekonnen and Hoekstra, 2016), the relative role of climate and LUC for water flows (Zheng et al., 2016), and land acquisition impacts on water (Johansson et al., 2016; Rulli et al., 2012).
However, studies on land–atmosphere interactions clearly show that changes in land surface properties can considerably influence precipitation (P) and Q through land–atmosphere feedback, sometimes well beyond the local scale (Avissar and Werth, 2005; Badger and Dirmeyer, 2016; Garcia et al., 2016). For example, general circulation model simulations suggest that complete deforestation of central Africa may decrease February P by 35 % in the Great Lakes region (Avissar and Werth, 2005), and irrigation in India may support up to 40 % of the P in some arid regions in eastern Africa (de Vrese et al., 2016). Under a business-as-usual deforestation scenario, Q in the Xingu River basin in the Amazon was found to increase by 10–12 % without land–atmosphere feedback, and decrease by 30–36 % when such feedback was taken into account (Stickler et al., 2013). Furthermore, statistical analyses of observed data suggest that irrigation in the US High Plains enhances downwind Q (Kustu et al., 2011), and coupled regional climate modelling shows that irrigation in the California Central Valley can be linked to an about 30 % increase in Colorado Q (Lo and Famiglietti, 2013). At the global scale, ΔQ from future climate and LUC scenarios changed from decrease to increase by considering land–atmosphere feedback and by closing the water balance (Betts et al., 2015).
Land–atmosphere interactions can influence Q through thermal layer processes, terrestrial moisture recycling (TMR), and circulation perturbation (Goessling and Reick, 2011). First, thermal layer processes refer to the boundary layer and mesoscale circulation perturbation that may lead to a change in total terrestrial evaporation (E) and can locally lead to both positive and negative P responses (Guillod et al., 2015; Koster et al., 2003; Seneviratne et al., 2010). Local forest clearing has for example been shown to enhance P in downwind areas due to turbulence changes (Khanna et al., 2017; Saad et al., 2010). Second, TMR refers to the process of terrestrial E returning to land as P and is underpinned by the mass conservation of water (Brubaker et al., 1993). TMR is often the dominating land–atmosphere process at the regional to continental scale (D'Almeida et al., 2007; Lawrence and Vandecar, 2014; Spracklen et al., 2012; Tuinenburg, 2013). About 40 % of global terrestrial P (van der Ent et al., 2014) originates from terrestrial E and the average distance travelled in the atmosphere is 500–5000 km (van der Ent and Savenije, 2011) – a distance likely to exceed the size of most river basins. Lastly, large-scale atmospheric circulation perturbation allows extreme LUC (e.g. complete tropical deforestation) to impact P in geographically remote regions and continents in unexpected ways (Avissar and Werth, 2005; Badger and Dirmeyer, 2016; Garcia et al., 2016; Lawrence and Vandecar, 2014). Monsoon regions are particularly sensitive to circulation perturbation, and irrigation may for example reduce P by weakening the monsoon onset (Tuinenburg, 2013).
The previous studies that illustrated the importance of remote LUC for basin P and Q did not examine the effect of taking moisture recycling into account for estimating LUC effects on Q and attributing them to influence from different nations, nor did they analyse the interplay between LUC within and outside the river basin. These effects are, however, important to disentangle since they can have profound water governance implications for, for example, riparian water rights and transboundary river basin treaties (Dirmeyer et al., 2009; Ellison et al., 2017; Keys et al., 2017). Thus, there is a missing interdisciplinary bridge between understanding the role of land–atmosphere feedback over large distances and its importance for water governance at the basin scale.
This study aims to (i) investigate the potential impacts of human LUC on Q worldwide accounting for TMR, (ii) disentangle the relative influence on Q from within- and extra-basin LUC, (iii) attribute potential human LUC impacts on Q to nation states, and (iv) discuss the potential implications for water governance. We focus on the TMR effect because it is transparent, closes the water balance, and explicitly links changes in land and water geographically. Given these advantages, similar TMR approaches have in recent years been used to analyse unexplored relations, e.g. LUC impacts of crop yields (Bagley et al., 2012), self-amplifying forest dieback from TMR changes (Zemp et al., 2017), and vulnerability to LUC-induced reductions in P (Keys et al., 2016; Miralles et al., 2016). For a comparison of different methods for analysing LUC impacts on Q, see Table S1 in the Supplement.
2.1 Modelling
2.1.1 Hydrological modelling
We used the process-based Simple Terrestrial Evaporation to Atmosphere Model (STEAM) hydrological model (Wang-Erlandsson et al., 2014) to simulate water fluxes based on land cover and land use. STEAM partitions evaporation into five fluxes: vegetation interception, floor interception, transpiration, soil moisture evaporation, and open-water evaporation. STEAM uses the Penman–Monteith equation (Monteith, 1965) to estimate potential evaporation, the Jarvis–Stewart equation (Stewart, 1988) to compute stomatal resistance, and Jolly's growing season index (function of minimum temperature, soil moisture content, and daylight) to describe phenology (Jolly et al., 2005). STEAM operates at and a 3 h resolution. Based on the long-term water balance, mean annual river flow (Q) is assumed to approximately equal the difference between mean annual P and E, i.e. . STEAM was validated in previous studies (Wang-Erlandsson et al., 2014, 2016) and compared well with recent observation-based analyses of evaporation partitioning by land-cover type (Wei et al., 2017). Modifications from the original version of STEAM (Wang-Erlandsson et al., 2014, 2016) include (1) update of land-use classification, parameterization, and parameterization approach (Table S2 and Fig. S1 in the Supplement), (2) use of a temperature threshold of 0 ∘C for differentiating snowfall from rainfall, and (3) differences in input data (i.e. root zone storage capacity, land surface map, precipitation data source as described in Data). Evaluation against runoff data is shown in Fig. S2. Simulated land-use change effects on evaporation increase and decrease are compared with literature values in Table S3 and found to be in the conservative range. With the study period being 2000–2013, the years 1995–1999 were used as spin-up for STEAM.
2.1.2 Moisture tracking
Atmospheric moisture is tracked using the Eulerian Water Accounting Model-2 layers (WAM-2layers) moisture tracking scheme (van der Ent, 2014; van der Ent et al., 2014). WAM-2layers tracks atmospheric moisture from zero pressure to surface pressure in two layers. Within the layers, atmosphere is assumed to be well mixed. WAM-2layers tracks vapour flows by applying the water balance. For example, the following equation is used to track where evaporation from a given region falls as precipitation (i.e. forward tracking):
where Stracked is the tracked atmospheric storage in an atmospheric column in one layer, t is time, u and v are wind components in the x zonal and y meridional directions, Etracked is tracked evaporation entering and Ptracked is precipitation exiting an atmospheric column and layer, and Fvertical,tracked is the tracked vertical moisture transport between the two layers. An analogous equation is used for tracking the source of precipitation to a given region (i.e. backward tracking). The spatial resolution of WAM-2layers is 1.5∘ and input data are linearly interpolated to the 15 min time step to maintain numerical stability. WAM-2layers has been employed previously for analysing atmospheric moisture transport over terrestrial areas (Keys et al., 2012, 2016) and validated against other types of moisture tracking algorithms (van der Ent et al., 2013). We used the MATLAB version of WAM-2layers, but a Python version is also openly available on Github (van der Ent, 2016). With the study period being 2000–2013, the year 1999 is used as spin-up in forward tracking in WAM-2layers, and 2014 is used as spin-up for backward tracking in WAM-2layers.
2.1.3 Coupling of the moisture tracking scheme and the hydrological model
Hydrological flows in the current land-use scenarios are simply represented by current data and simulation. To obtain E and P under potential land cover, STEAM is coupled with WAM-2layers by (1) simulating present-day E in STEAM and forward tracking terrestrial E with WAM-2layers, meaning that the Etracked is equal to all evaporation from terrestrial surfaces, i.e. not belonging to the oceans, (2) simulating E in STEAM based on present-day P and potential land cover, and forward tracking the fate of terrestrial E with WAM-2layers, (3) calculating the change in Ptracked, (4) updating the present-day P with the changes in Ptracked, and (5) simulating E in STEAM based on updated P and potential land cover, and forward tracking the fate of terrestrial E with WAM-2layers; see Fig. 1. Steps 3–5 are iterated until the annual P change is below 1 % and the monthly P change is below 5 mm month−1 in every grid cell, which in our case ultimately resulted in four iterations in total. This procedure assumes that land-use induced changes in terrestrial E will result in proportional changes in P with terrestrial origin.

Figure 1Model coupling schematic. Model coupling between STEAM and WAM-2layers based on current land use and potential vegetation scenarios. P stands for current precipitation; E stands for evaporation. Subscript t stands for terrestrial origin, pv denotes simulation with potential vegetation, cur denotes simulation with current land use, and n stands for the number of iterations.
2.2 Data
2.2.1 Land data
Land-use and land-cover data input to STEAM are based on the Ramankutty potential land-cover (Ramankutty and Foley, 1999) and current land-use scenarios (Ramankutty et al., 2008) for consistency. We further added permanent wetlands, permanent snow or ice, and urban or built-up areas from the Land Cover Type Climate Modeling Grid (CMG) MCD12C1 International Geosphere Biosphere Program (IGBP) land classification created from Terra and Aqua Moderate Resolution Imaging Spectroradiometer (MODIS) data (Friedl et al., 2010) for the year 2005. Monthly irrigated rice and irrigation non-rice crops were obtained from the data set of Monthly Irrigated and Rainfed Crop Areas around the year 2000 (MIRCA2000) V1.1 (Portmann et al., 2010). The urban and irrigated areas were only added to the current land-cover map. In this merging procedure, MODIS is allowed to override the Ramankutty data sets, and MIRCA2000 is allowed to override the Ramankutty map as long as it does not extend over the cropland areas. The scenarios used are shown in Fig. S3 and the land-use change is illustrated in Fig. 2.
The root zone storage capacity map is based on a climate-observation-based root zone storage capacity (SR) (Wang-Erlandsson et al., 2016) derived from satellite and energy balance-based evaporation, gauge-based precipitation, and modelled irrigation. The best performing Gumbel normalized root zone storage capacity (SR,CRU-SM,merged) was used. Root zone storage capacity for both current and potential land-cover and land-use scenarios was constructed from the mean of land-cover type and Köppen–Geiger climate class (Kottek et al., 2006). The mean root zone storage capacity of single land-cover types was used only in places where the combination of land-cover type and climate zone that exists in the potential land-cover scenario did not exist in the current land-use map.
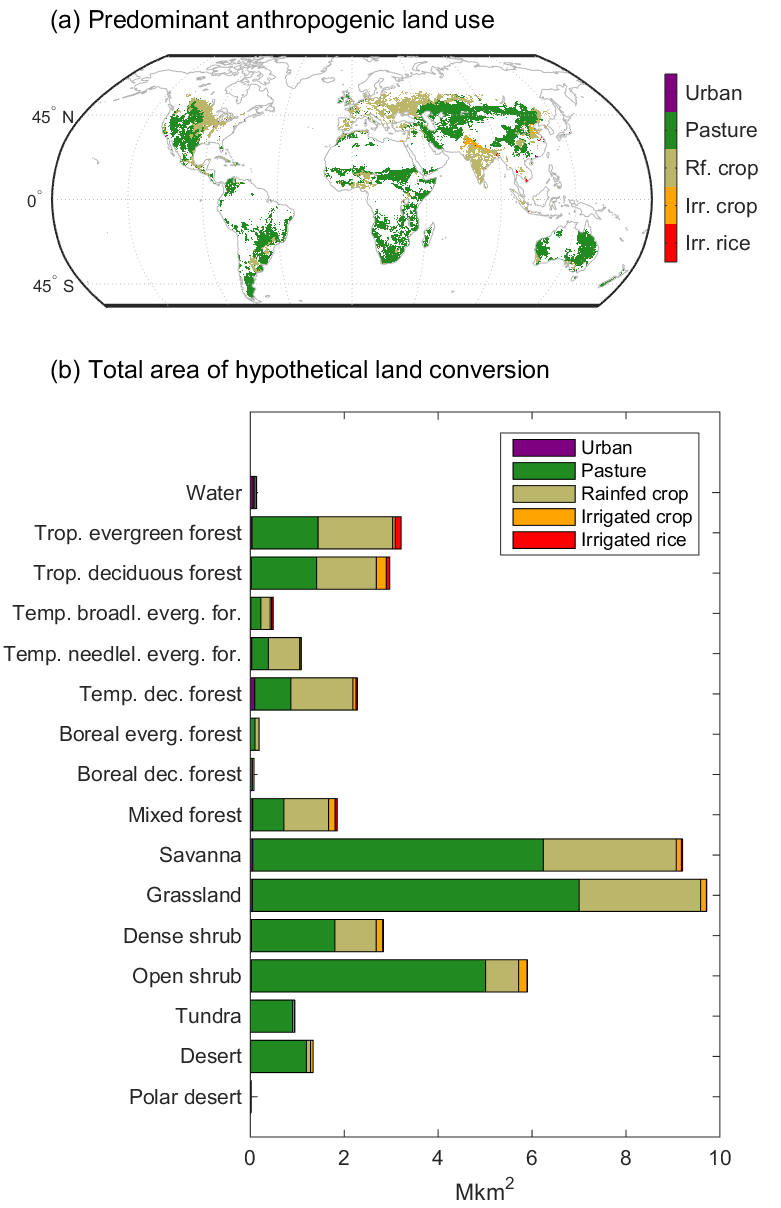
Figure 2Changes in land use resulting from the replacement of the potential vegetation scenario with the current land-use map. Changes in (a) land use (current land use is shown, with grid cells without major land-use change masked out) and (b) total area of difference between potential vegetation (y axis) and the current land-use map (colour legend).
2.2.2 Meteorological forcing and runoff data
Meteorological data used in WAM-2layers and STEAM, except for land precipitation, were taken from the Earth Retrospective Analysis Interim (ERA-I) from the European Centre for Medium-Range Weather Forecasts (ECMWF) (Dee et al., 2011). ERA-I meteorological forcings to STEAM are snowmelt, temperature at 2 m height, dew point temperature at 2 m height, wind speed (meridional and zonal vectors) at 10 m height, incoming shortwave radiation, and net longwave radiation. In addition, ERA-I evaporation data were used to downscale calculated daily potential evaporation in STEAM to the 3 h time step. ERA-I model level forcings used in WAM-2layers are specific humidity and wind speed at 6-hourly resolution, spanning from zero to surface pressure. Moreover, 3-hourly ocean evaporation is taken from ERA-I. The Modern-Era Retrospective analysis for Research and Applications (MERRA) reanalysis has in a previous study been used as input to WAM-2layers for comparison and generated similar persistent moisture recycling patterns, except in South America, where differences arise due to underestimation of precipitation in MERRA (Keys et al., 2014). Precipitation forcing for WAM-2layers and STEAM both come from the state-of-the-art Multi-Source Weighted-Ensemble Precipitation (MSWEP V1) product (Beck et al., 2017) that was specifically created for hydrological modelling. The use of MSWEP as forcing for STEAM resulted in runoff estimates that compare well to observed runoff data (Fig. S2). All meteorological forcing data cover temporally 1995–2014.
Runoff data used for benchmarking were taken from the composite (observed river discharge consistent with the water balance model) from the Global Runoff Data Centre (GRDC) (Fekete et al., 2002). The separate GRDC water balance model runoff fields are included in the comparison for reference (Fig. S2).
The spatial coverage of all data used is 57∘ S–79.5∘ N latitudes at resolution. MSWEP originally at 0.25∘ and GRDC runoff at 0.5∘ were aggregated to 1.5∘ resolution by simple averaging.
2.3 Analyses
2.3.1 Changes in hydrological flows
River flow change without TMR (ΔQnoTMR) is
where Pcur is current-day precipitation data from MSWEP, Ecur is current-day evaporation based on STEAM simulation, and Epv,1 results from STEAM simulation in the potential vegetation scenario and forced with current-day precipitation (Fig. 1). River flow change after accounting for TMR (ΔQ) is
where Ppv,4 is the converged precipitation (i.e. meeting the convergence requirement of mean annual precipitation change <1 % yr−1 and monthly precipitation change < 5 mm month−1 in every grid cell) achieved at the fourth iterative coupling between STEAM and WAM-2layers, and Epv,5 is the evaporation under the potential vegetation scenario simulated in STEAM with precipitation forcing Ppv,4.
Change in tracked basin precipitation (ΔPtracked,basin) occurring outside the river basin boundaries is referred to as ΔPimport, whereas ΔPtracked,basin originating from within the basin boundary is referred to as ΔPbasin-recycling. Internally recycled evaporation (ΔEbasin-recycling) corresponds to ΔPbasin-recycling and all other basin evaporation change is considered exported (ΔEexport).
2.3.2 Country influence on changes in river flows
The influence on river flow change in river basin b from country c without considering TMR () is
where ΔEb,c is evaporation change in the part of river basin b located in country c. The influence on river flow change in basin b from country c with consideration of TMR () is
where is the evaporation change exported from the part of basin b located in country c, and is the precipitation change imported to basin b from country c.
Influences from countries below 5 % of total influences in a specific basin () were lumped into the category “Other”.
3.1 LUC impacts on global water flows
Our results show that human LUC (from potential land cover to current land use) (Fig. 2) has led to reductions in E and P, and to increases in Q, in large parts of the world (Fig. 4b–d). E has decreased primarily in Southwest China, Europe, western Africa, the south of Congo, and south-eastern South America, resulting from substantial pasture and agricultural expansion (Ramankutty et al., 2008). Following prevailing wind directions (Fig. 3c), subsequent P has decreased in all tropical regions, southern central China, the eastern US, and Europe.
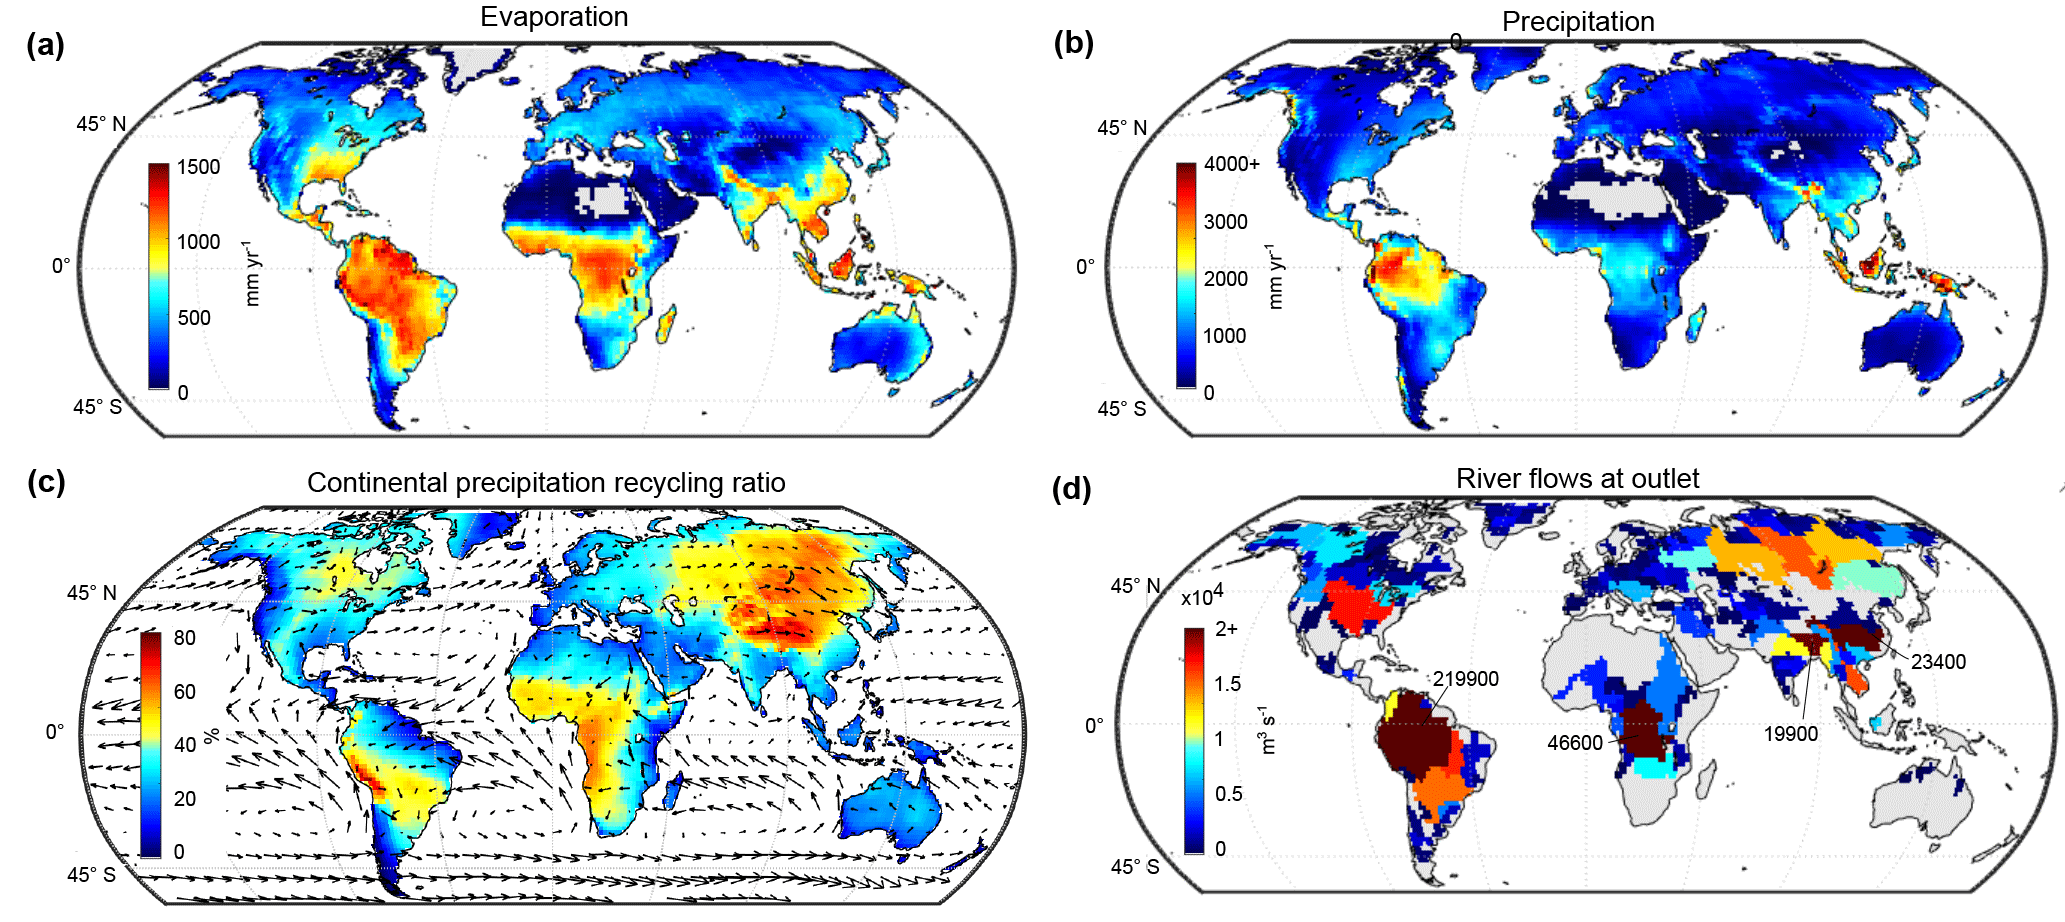
Figure 3Current mean annual hydrological flows 2000–2013. (a) Current evaporation simulated by STEAM, (b) current precipitation (MSWEP data), (c) current continental precipitation recycling ratio (i.e. precipitation with terrestrial origin divided by total precipitation: Ptracked∕P) where arrows show average winds in the lower atmosphere, and (d) current river flow at outlet based on P−E. Values below about 0.5 % of the maximum display value are in grey.
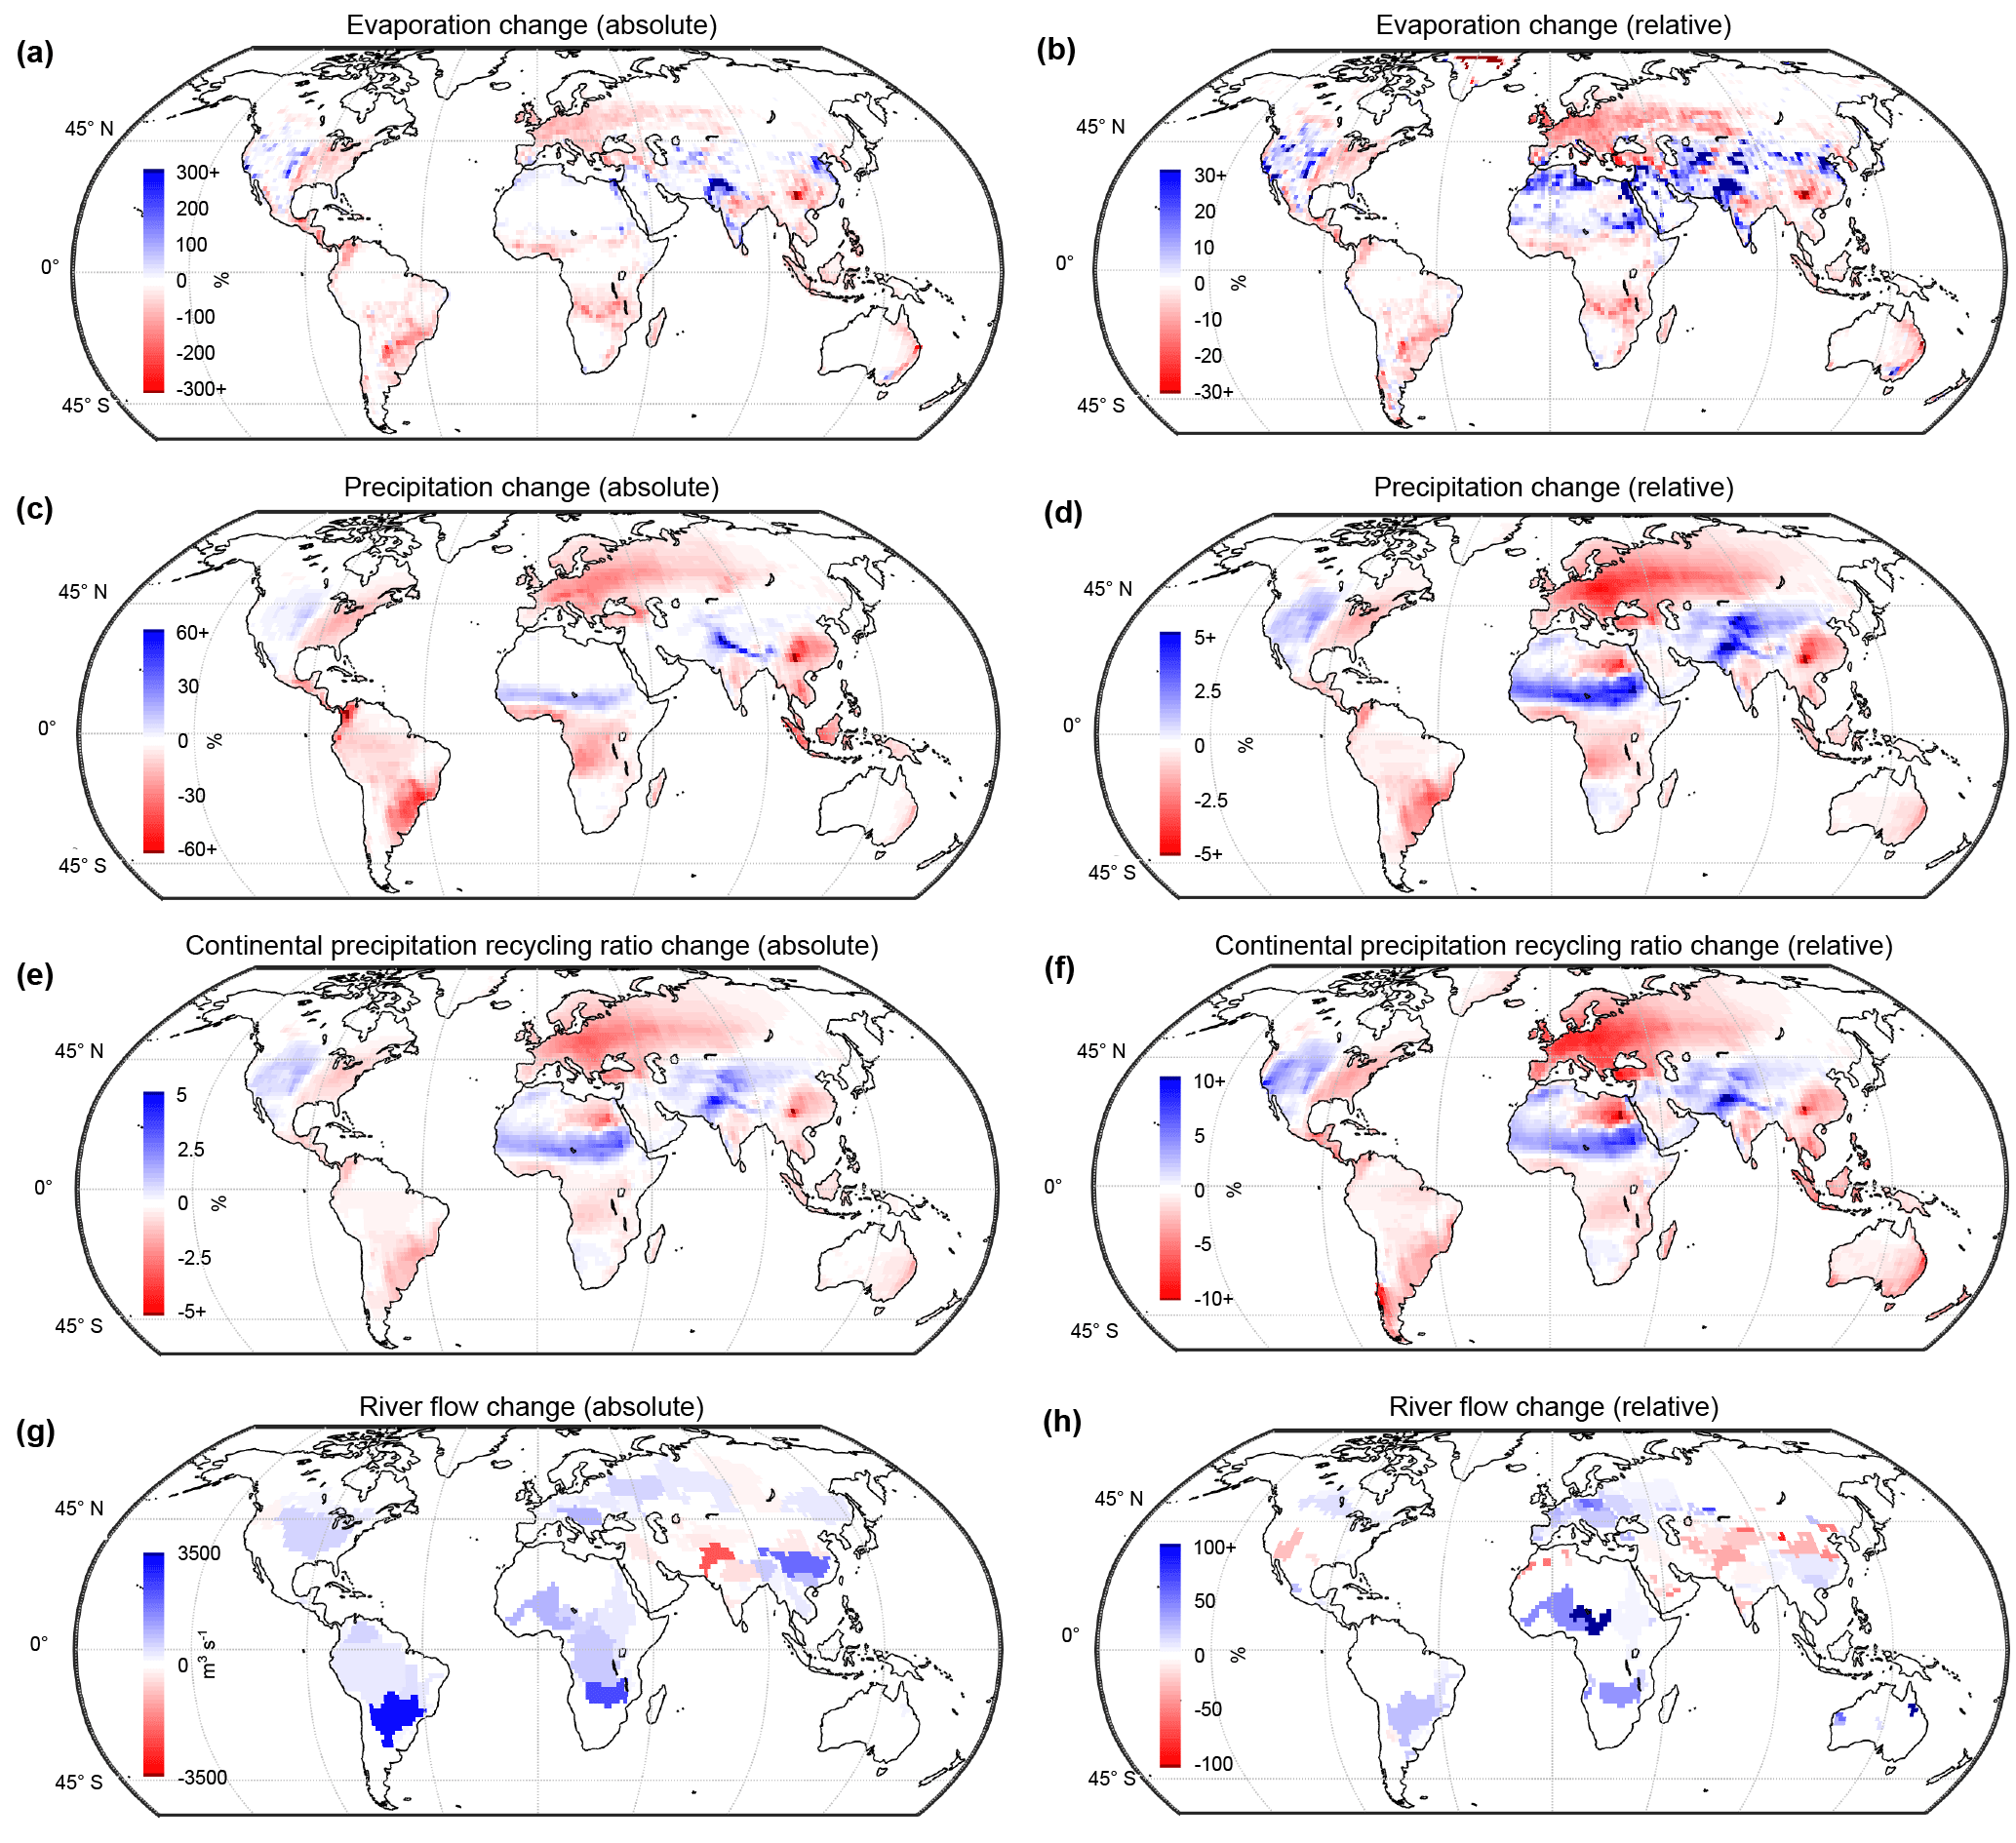
Figure 4Land-use change-induced changes in hydrological flows (current land-use–potential vegetation scenario): (a) absolute change in evaporation, (b) relative change in evaporation, (c) absolute changes in precipitation, (d) relative change in precipitation, (e) absolute change in continental precipitation recycling ratio (i.e. precipitation with terrestrial origin divided by total precipitation Ptracked∕P and converted to the unit of percent), (f) relative change in continental precipitation recycling ratio, (g) absolute change in river flows at outlet, and (h) relative change in river flows at outlet.
Nevertheless, in some areas, E increased due to incremental irrigation – notably in India, the western US, Northeast China, and the Middle East (Fig. 4a, b). Due to the combination of heavy irrigation in India and orography, P has increased substantially along the Himalaya mountain ridge (Fig. 4b, c). Weak increases in P are observed in other downwind regions: the Sahel (i.e. downwind irrigation areas along the Nile) and in the western US. Continental precipitation recycling ratios are modified – with some exceptions – in a similar pattern to P (Fig. 4e, f). Large ΔQ are seen in the La Plata basin in South America, the Zambezi in southern Africa, the Yangtze in China, and the Indus in northern India (Fig. 4g), and relative changes in Q are large in for example the Colorado basin in the US, the Odra basin in eastern Europe, and the Lake Chad river basin in Africa (Fig. 4g).
3.2 The role of TMR for ΔQ
In aggregate (Fig. 5), when accounting for TMR, LUC changed global terrestrial E by −1251 km3 yr−1 (−1.8 % from 69 211 km3 yr−1), P by −586 km3 yr−1 (−0.5 % from 107 800 km3 yr−1), and Q by 664 km3 yr−1 (+1.7 % from 38 589 km3 yr−1). The estimated changes to Q tend to fall in the conservative end of previous estimates (Gerten et al., 2008; Piao et al., 2007; Rost et al., 2008a, b; Sterling et al., 2012) (Fig. 5). However, recent research (Jaramillo and Destouni, 2015) suggests that consumptive water use is severely underestimated in earlier studies (Döll et al., 2009; Sterling et al., 2012). ΔQ with TMR corresponds to the difference between ΔE and ΔP change including TMR (Fig. 5, solid bars), whereas ΔQ without accounting for TMR simply corresponds to ΔE without TMR (Fig. 5, hollow bars).

Figure 5Human impact on global hydrological flows. The solid bars show our estimated net change (terrestrial area 131.7 million km2 and time period 2000–2013) in evaporation, precipitation, and river flows including consideration of TMR. Hollow bars show flow changes without TMR. Circles and stars indicate river flow change estimates from other studies (Table S4), where LUC implicitly accounts for consumptive water use. Note that while consumptive water use alone always reduces river flows, other human impacts have both positive and negative influences that are concealed by the global aggregate.
Including TMR nearly halves the global ΔQ estimate. This is because E returns as P over land and thus compensates for the initial water “loss” from the basin. This suggests that previous studies without TMR (Gerten et al., 2008; Piao et al., 2007; Sterling et al., 2012) may have substantially overestimated the net LUC impacts on Q. Our estimate of LUC impact on Q is slightly larger than some of the estimates of CO2 fertilization (Alkama et al., 2010; Gerten et al., 2008), but substantially smaller than climate change and overall human impact (Alkama et al., 2010; Gerten et al., 2008) (Fig. 5).
Our river basin analysis shows that accounting for TMR considerably alters estimates of ΔQ (Fig. 7a): in the Congo, Volga, and Ob basins, ΔQ are reduced by more than half; in the Amazon, ΔQ drops from 1630 to 270 m3 s−1; and in the Yenisei, the sign of ΔQ is reversed from an increase (150 m3 s−1) to a decrease (−220 m3 s−1).
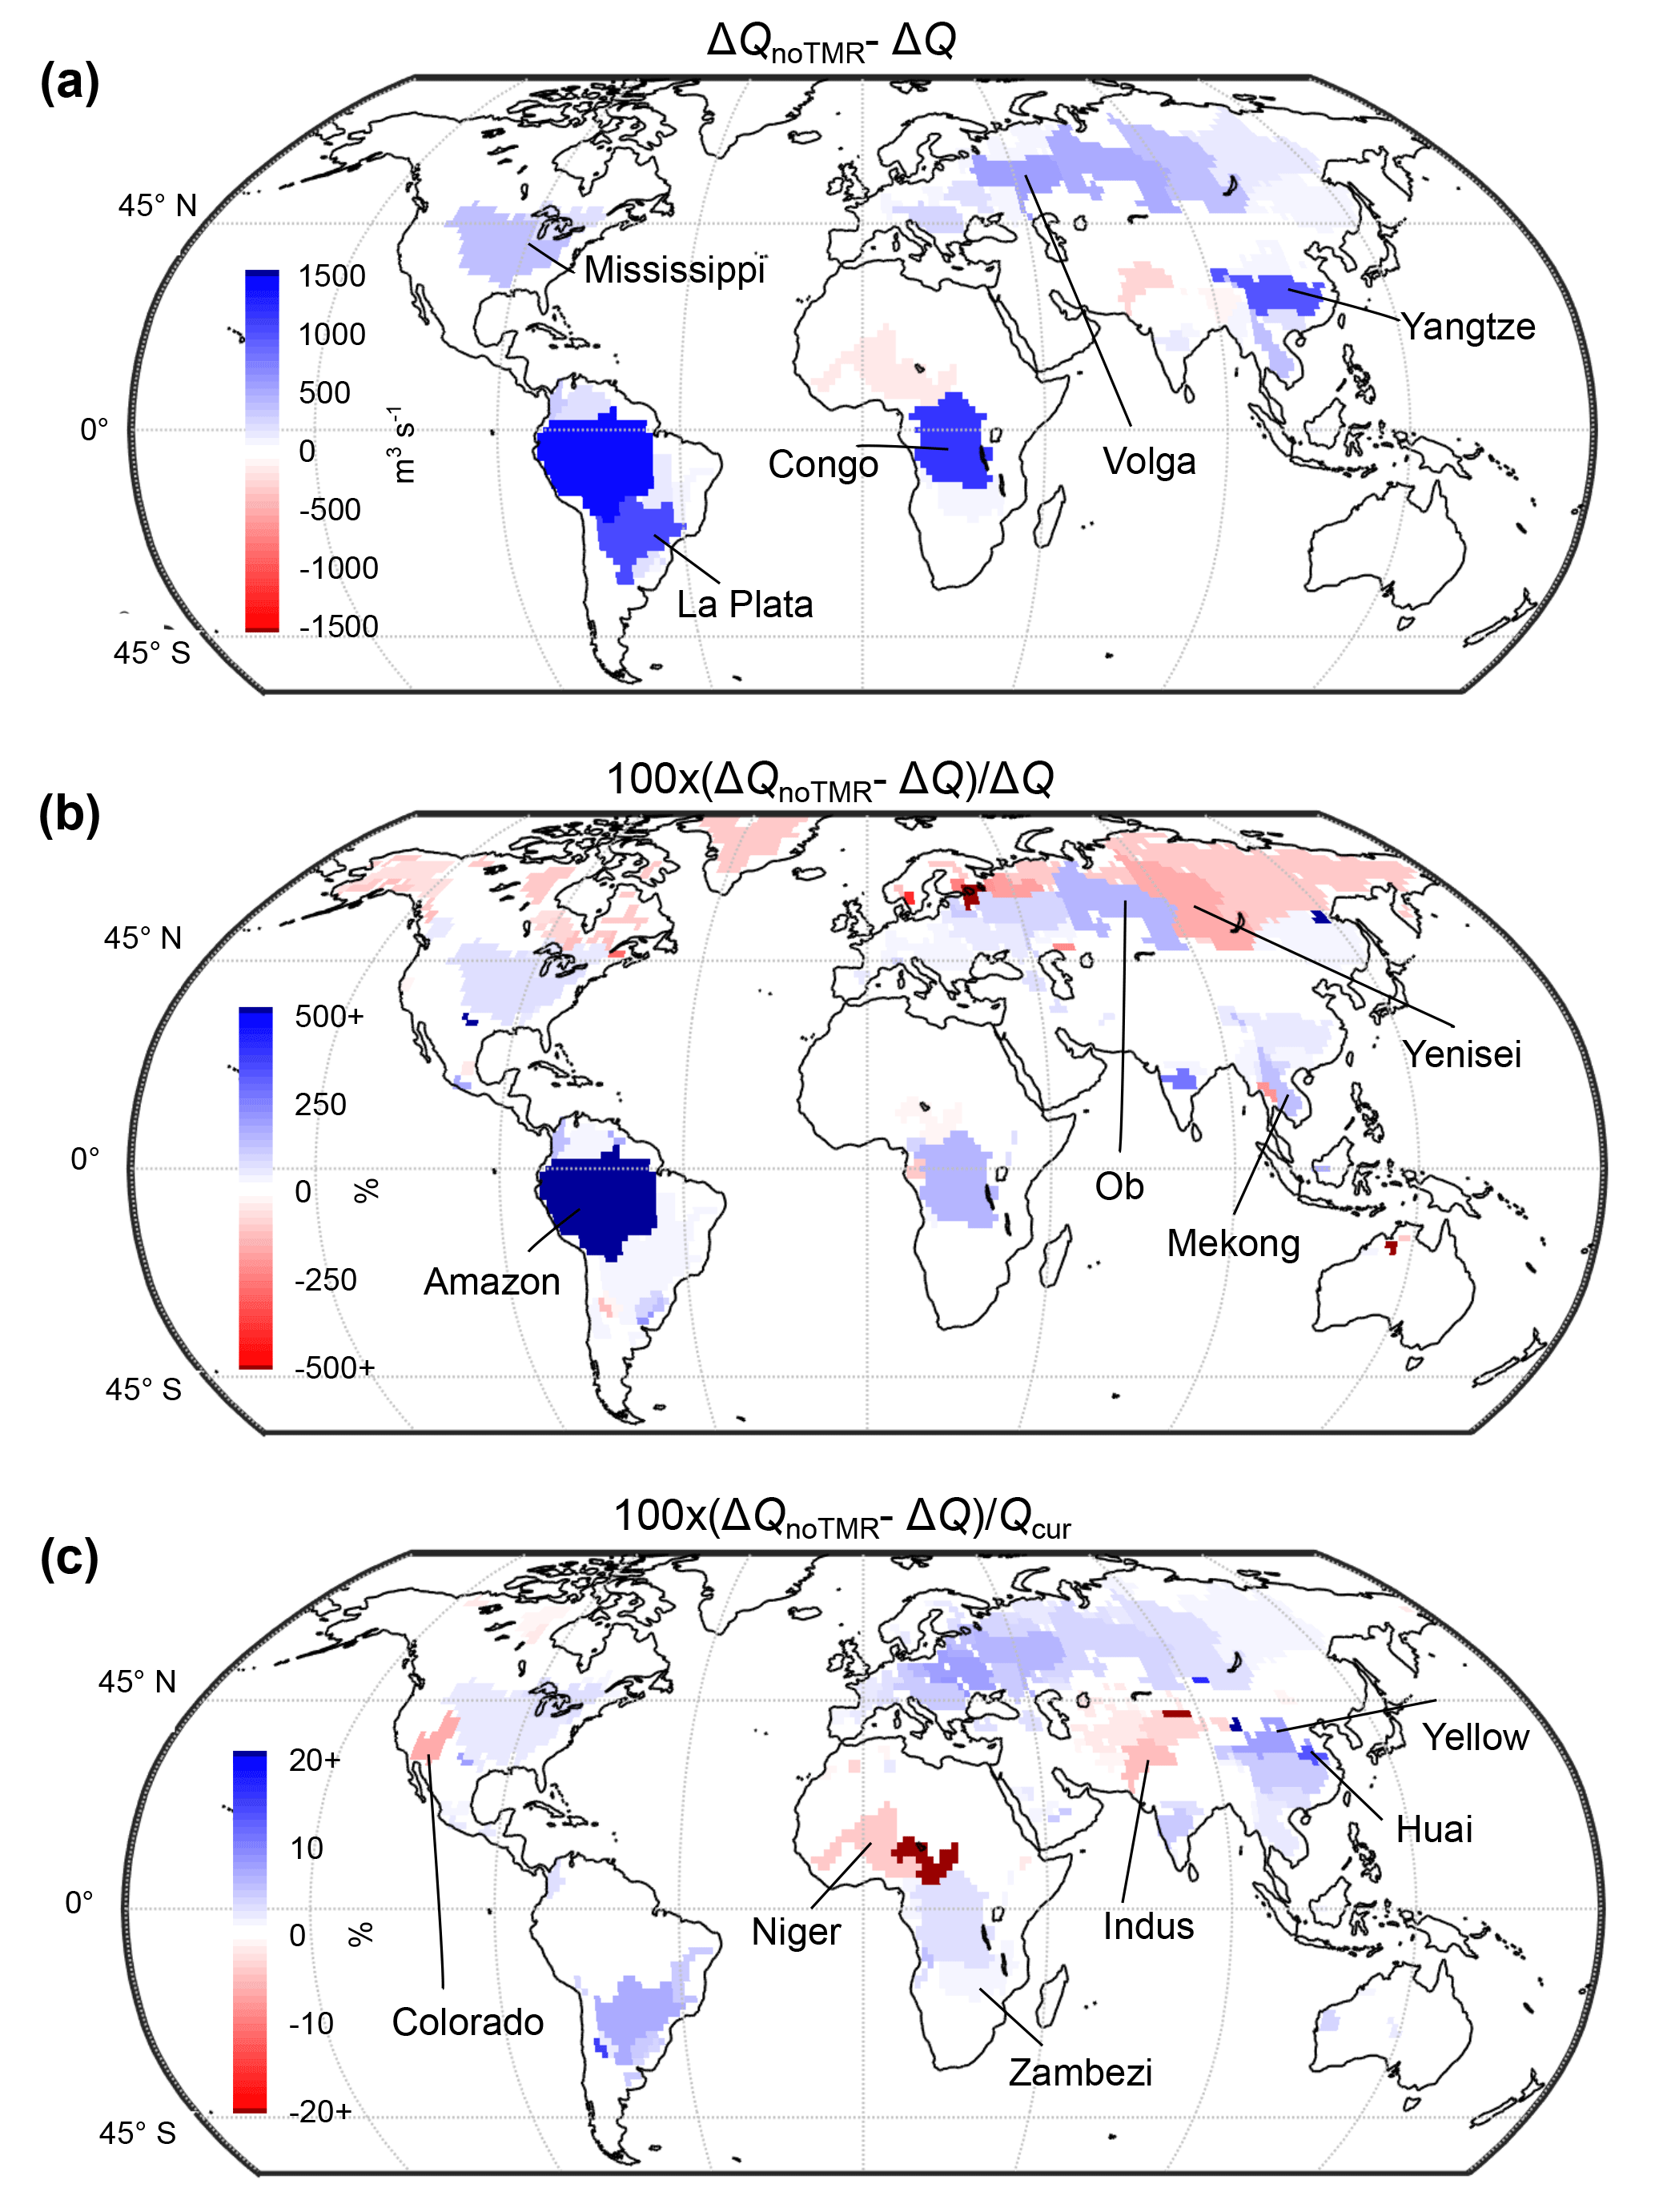
Figure 6The effect of accounting for TMR on river flow change estimates, shown (a) as absolute difference between river flow change without and with TMR effect, i.e. ΔQnoTMR−ΔQ, (b) as this difference relative to river flow change with TMR effect, i.e. (, and (c) as this difference relative to current river flows, i.e. (.
At the basin level, the TMR effect on river flow change is estimated to be the largest in large and relatively wet basins such as the Amazon, Congo, and Yangtze River basins in terms of absolute volumes (Fig. 6a). Not accounting for TMR clearly generates the largest relative deviations in river flow change estimates in the Amazon (i.e. ΔQnoTMR is approximately 5 times larger than ΔQ), and large relative TMR effects are seen in many large basins worldwide, including e.g. the Congo (ΔQnoTMR is 150 % higher than ΔQ), Yenisei (ΔQnoTMR is 165 % lower than ΔQ), and Ob (ΔQnoTMR is 140 % higher than ΔQ) river basins (Fig. 6b). The TMR effect relative Qcur (Fig. 6c) shows that TMR effect can be important also in more arid basins such as the Colorado, Niger, and the Yellow River.
3.3 The interplay between internal and external LUC
Furthermore, atmospheric moisture does not respect river basin boundaries (Fig. 7a, and spatial maps in Figs. 8, 9, S4, S5, S6, and S7). In fact, P over the basins has been modified more significantly by external than by internal LUC (change in imported precipitation ΔPimport> change in internally recycled precipitation ΔPbasin-recycling) in some of the largest basins (Fig. 7a). Likewise, internally recycled evaporation changes (Ebasin-recycling) (Fig. 7b, II) are substantially smaller than ΔE, affecting P elsewhere (ΔEbasin-recycling< change in exported evaporation ΔEexport) for all selected river basins (Fig. 7a).

Figure 7Changes in hydrological flows at river basin scale. (a) Changes in hydrological flows in 10 of the basins with the largest TMR effect on river flows (Q) (8 basins with increased and 2 with decreased Q), and 5 basins with large relative changes in river flows (2 basins with positive ΔQ and 3 with negative ΔQ). (b) Conceptual figure of hydrological flow changes in a basin. The (−) and (+) in (b) may be different for different basins, and the (−) and (+) as displayed here are for example seen in the Amazon, Congo, and Yangtze; see (a). Note also that the figure has two y axes, m3 s−1 to the left and % to the right
Internal moisture recycling (Fig. 7b, II) does not affect ΔQ directly, but only indirectly if ΔPbasin-recycling affects subsequent ΔEexport under transient change (Fig. 7b and Methods). Thus, provided steady state, ΔQ simply corresponds to the difference between ΔEexport and ΔPimport (Fig. 7a). For example, ΔQ in the Amazon is very small because the reduced ΔPimport is almost entirely offset by reduced ΔEexport. In Congo, about half of the within-basin LUC-induced Q increase is counteracted by extra-basin LUC (i.e. ΔPimport≈0.5ΔEexport). The effect of TMR on ΔQ (ΔQnoTMR−ΔQ, where subscript noTMR denotes simulation without TMR) corresponds to total ΔP (i.e. ΔPimport+ΔPbasin-recycling) and any indirect ΔE (i.e. ΔEnoTMR−ΔE, not shown). In the Yangtze, the ΔQ is mitigated mostly by ΔPbasin-recycling. The strong flow reduction in the heavily irrigated Indus, however, is only mildly compensated for by TMR (i.e. ΔPimport≪ΔEexport).
The pattern of overlapping precipitationsheds (i.e. P source regions)and evaporationsheds (i.e. E sink regions) illustrated in Fig. 7b and moderated by wind directions can also be clearly seen in the basin-specific precipitationshed and evaporationshed maps (Fig. 8). In the Amazon (Fig. 8a, b), the moisture arrives from the east, is stopped up by the Andes, and changes direction towards the south-east. The hotspot of precipitation source and sink within the Amazon basin does not overlap, with major moisture providing spots located along the north-eastern border and the major moisture receiving spots located along the Andes in the west. In the Yangtze (Fig. 8c, d), the moisture comes from a large area in the south, and leaves in the direction of Japan in a relatively narrow band. In the Yenisei (Fig. 8e, f), the moisture follows the westerlies, coming in straight from the west, and leaving straight towards the east. In the Niger (Fig. 8g, h), the moisture is mostly supplied from the east from terrestrial areas, and flows towards the west into the Atlantic. For precipitationsheds and evaporationsheds of other basins, see Figs. S4 and S6 respectively.
While changes in precipitationsheds and evaporationsheds are conditioned by the original moisture flows, the resulting pattern ultimately depends on the distribution of LUC-induced hydrological change (compare Figs. 8 and 9). For example, although the Amazon precipitationshed is weak over Africa (Fig. 8a), the precipitationshed change is in fact relatively strong there due to strong LUC-induced hydrological change (Fig. 9a). In other cases, aggregated changes in Fig. 7 hide spatially heterogeneous increases and decreases in moisture flows. For example, agricultural activities and irrigation in India, the Sahel, and regions around the Nile increase moisture supply to the Yangtze, Yensisei, and Niger basins and offset deforestation-induced moisture supply decrease elsewhere (Fig. 9c, e, g). For changes in precipitationsheds and evaporationsheds of other basins, see Figs. S5 and S7 respectively.
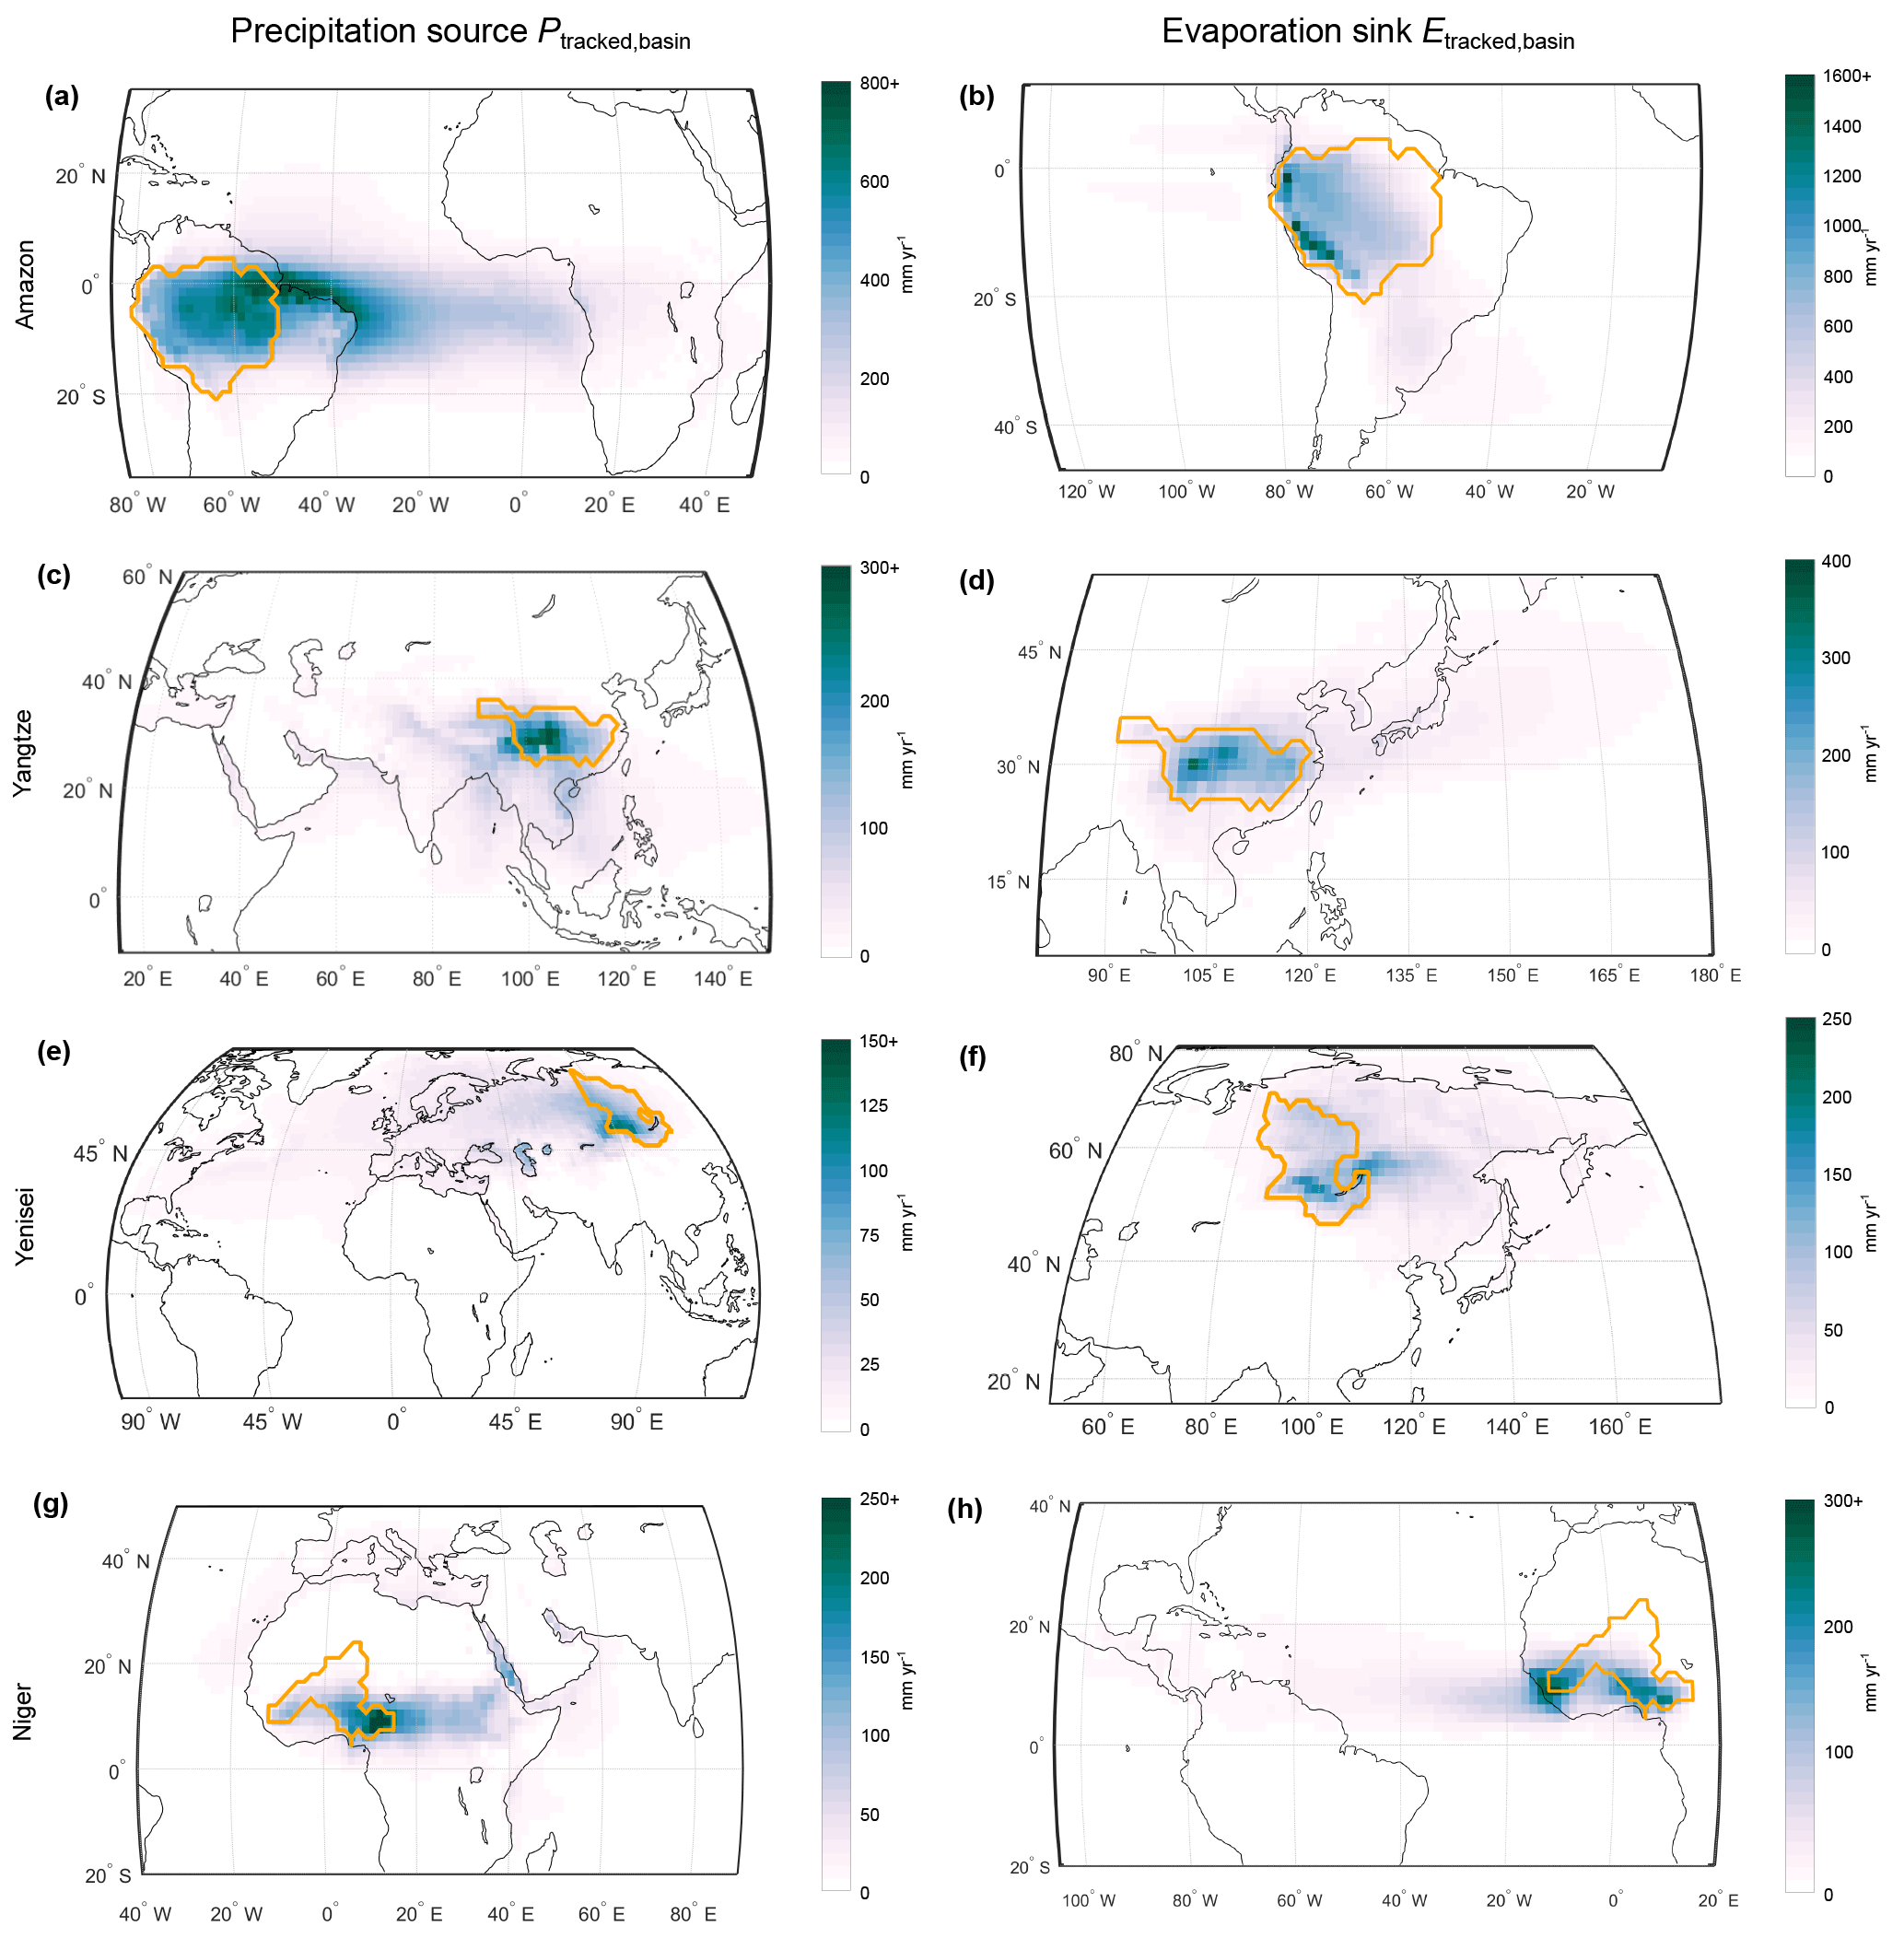
Figure 8Mean annual precipitation sources and evaporation sinks for selected river basins (boundaries in orange).
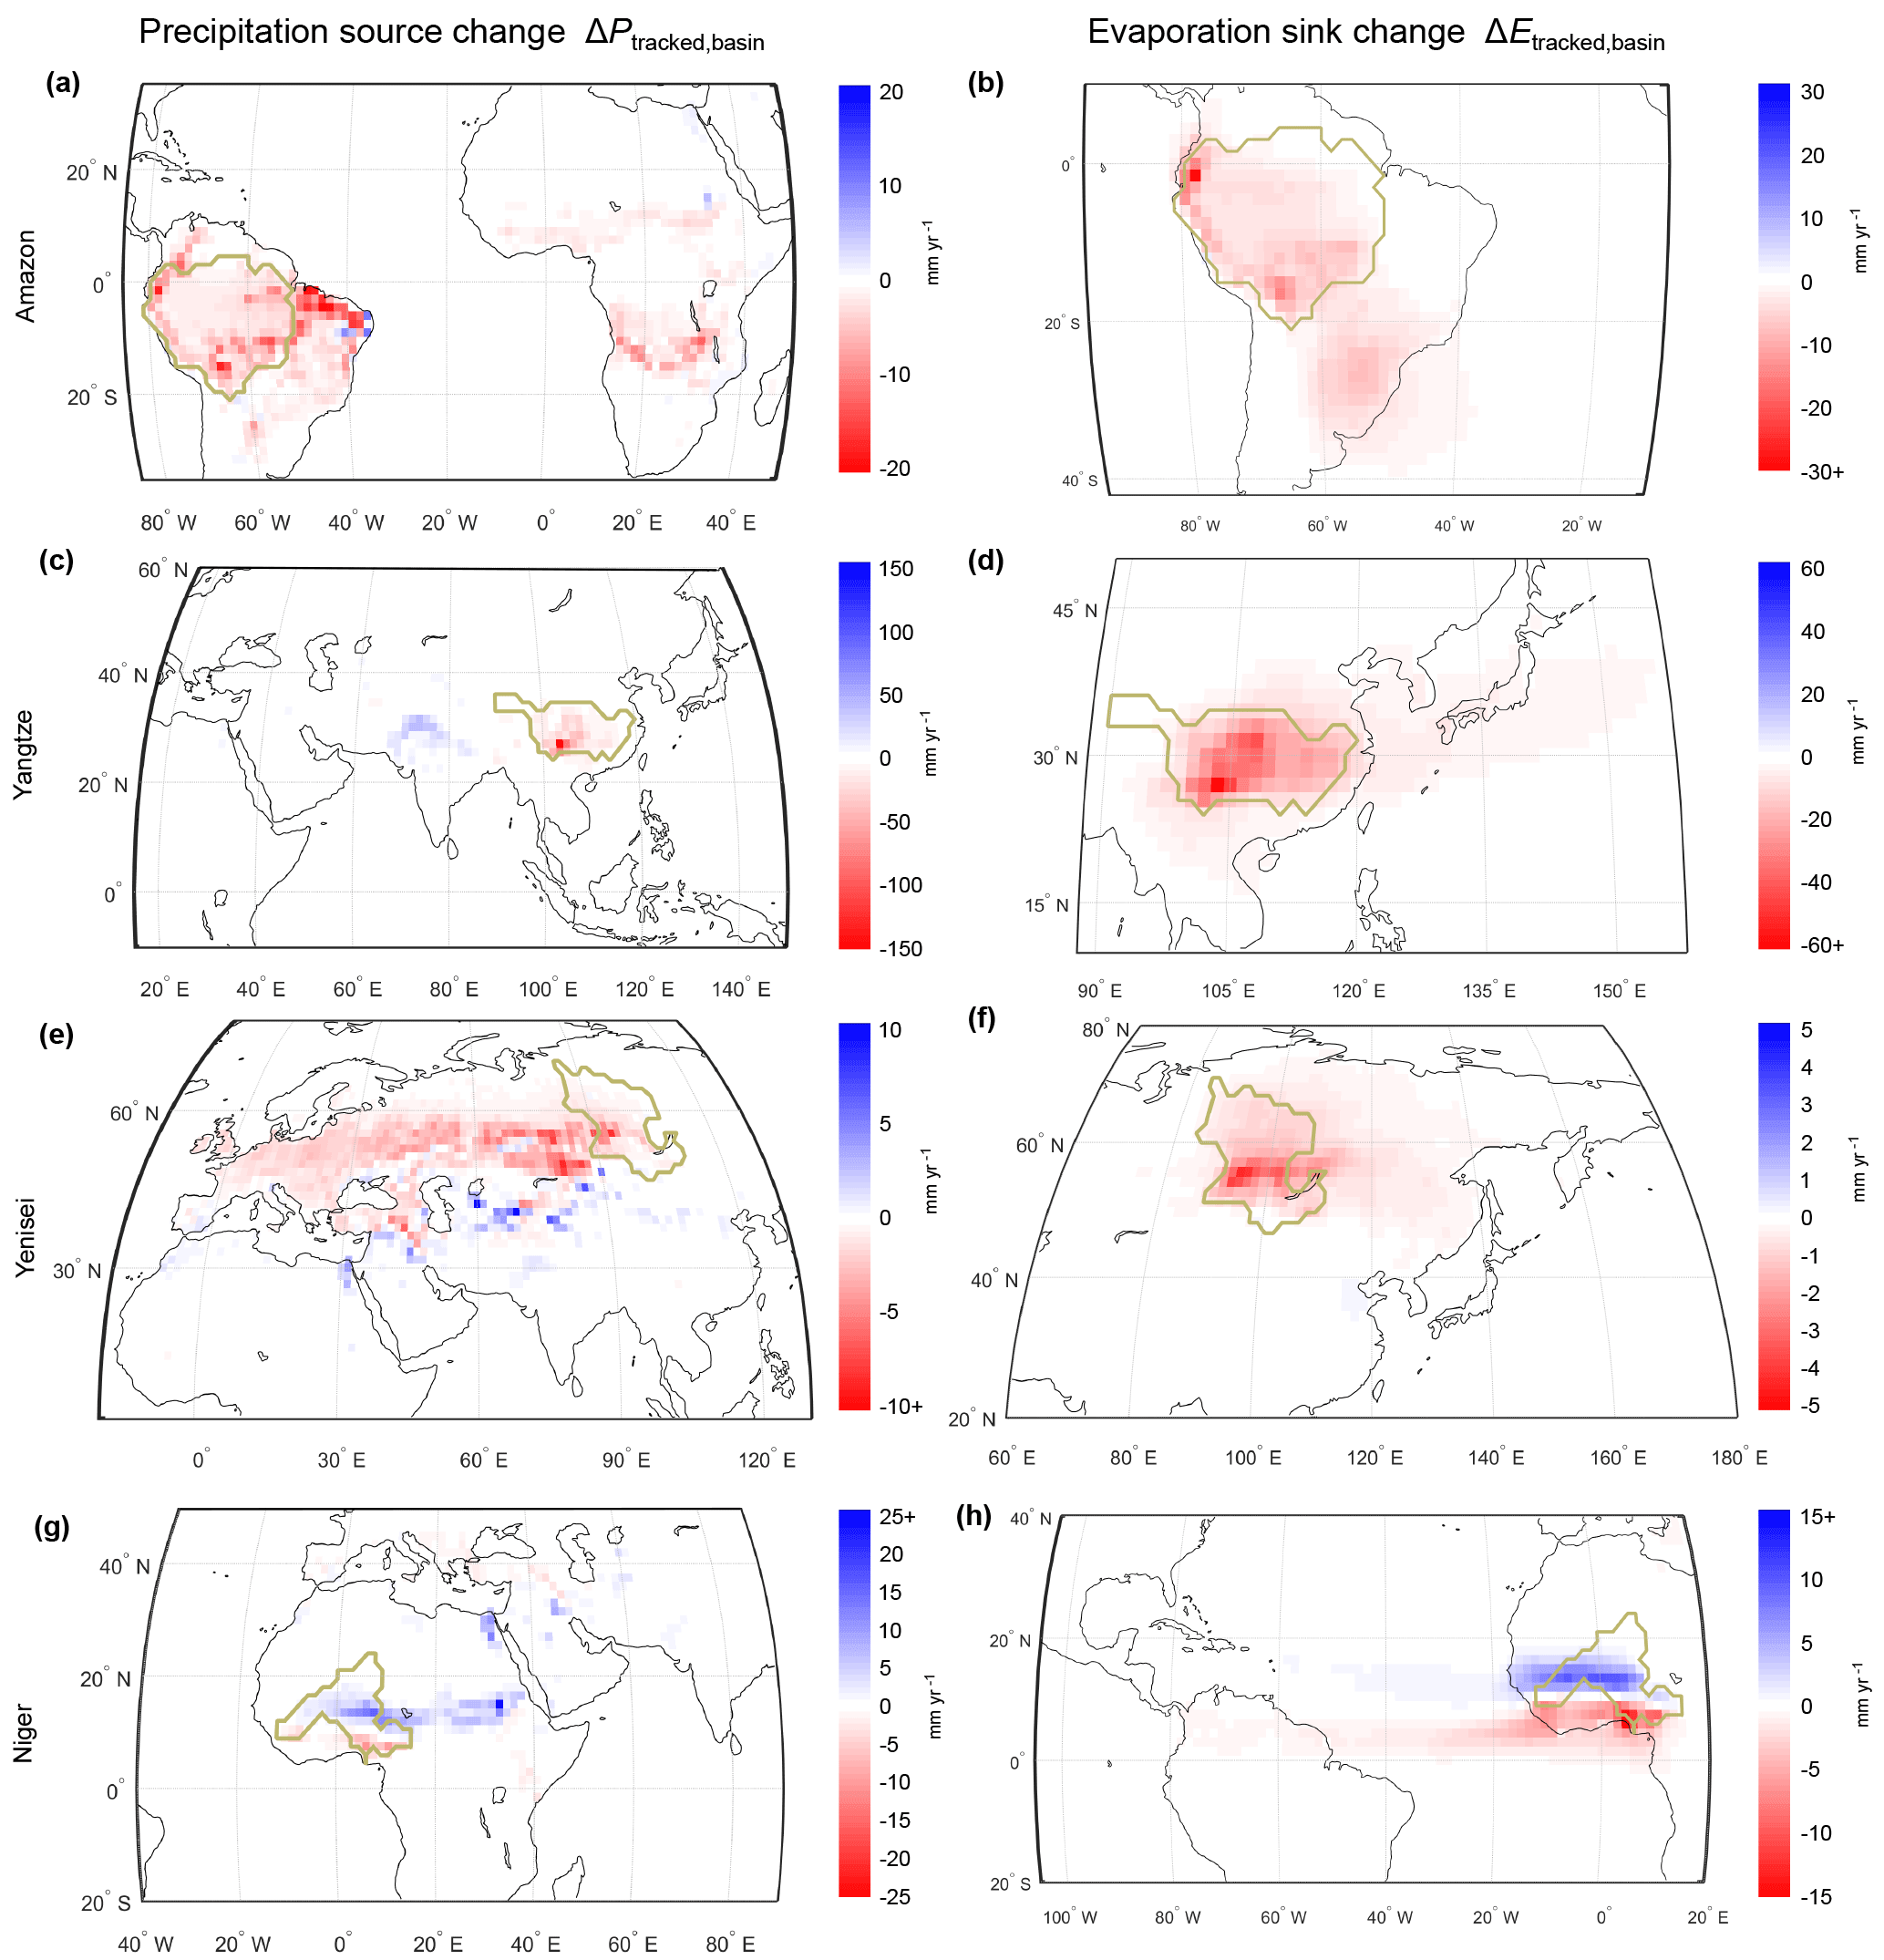
Figure 9Impacts of human land-use change on mean annual precipitation source (i.e. ΔPimport+ΔPbasin-recycling) and evaporation sinks (i.e. ΔEexport+ΔEbasin-recycling) for selected river basins (boundaries in dark yellow).
3.4 Attributing influence on ΔQ to nations
Typically, TMR attributes LUC influence on Q (methods described in Sect. 2.3.2) to a larger number of nations than when only basin boundaries are considered (Fig. 10). In several of the studied basins (such as the Amazon, Congo, Volga, Ob, Yenisei, and Niger basins; see Fig. 10a, b, e, f, i, l), the share of nations contributing less than 5 % to ΔQ grows considerably when TMR is considered. In some cases, nations not considered key influencers of ΔQ in fact influence ΔQ by more than 5 % when TMR is accounted for: in the Mekong, India is only an important influencer (10 % influence) when TMR is considered (Fig. 10g); in the Yenisei, Mongolia falls below 5 % influence, while Kazakhstan (11 %) and China (6 %) climb considerably in influence (Fig. 10i); and in the Niger basin, Sudan/South Sudan (8 %) and Niger (5 %) replace Ivory Coast and Guinea as important influencers (Fig. 10l). Notably, basins geographically confined within one nation can be influenced by LUC taking place in foreign nations. This is for example the case in the Yangtze, Yellow, and Huai, where irrigation in India increases the basins' P (Fig. 10d, m, n). The TMR leads to a limited difference in nation influence only in the North American basins (Fig. 10h, o) and La Plata (Fig. 10c).
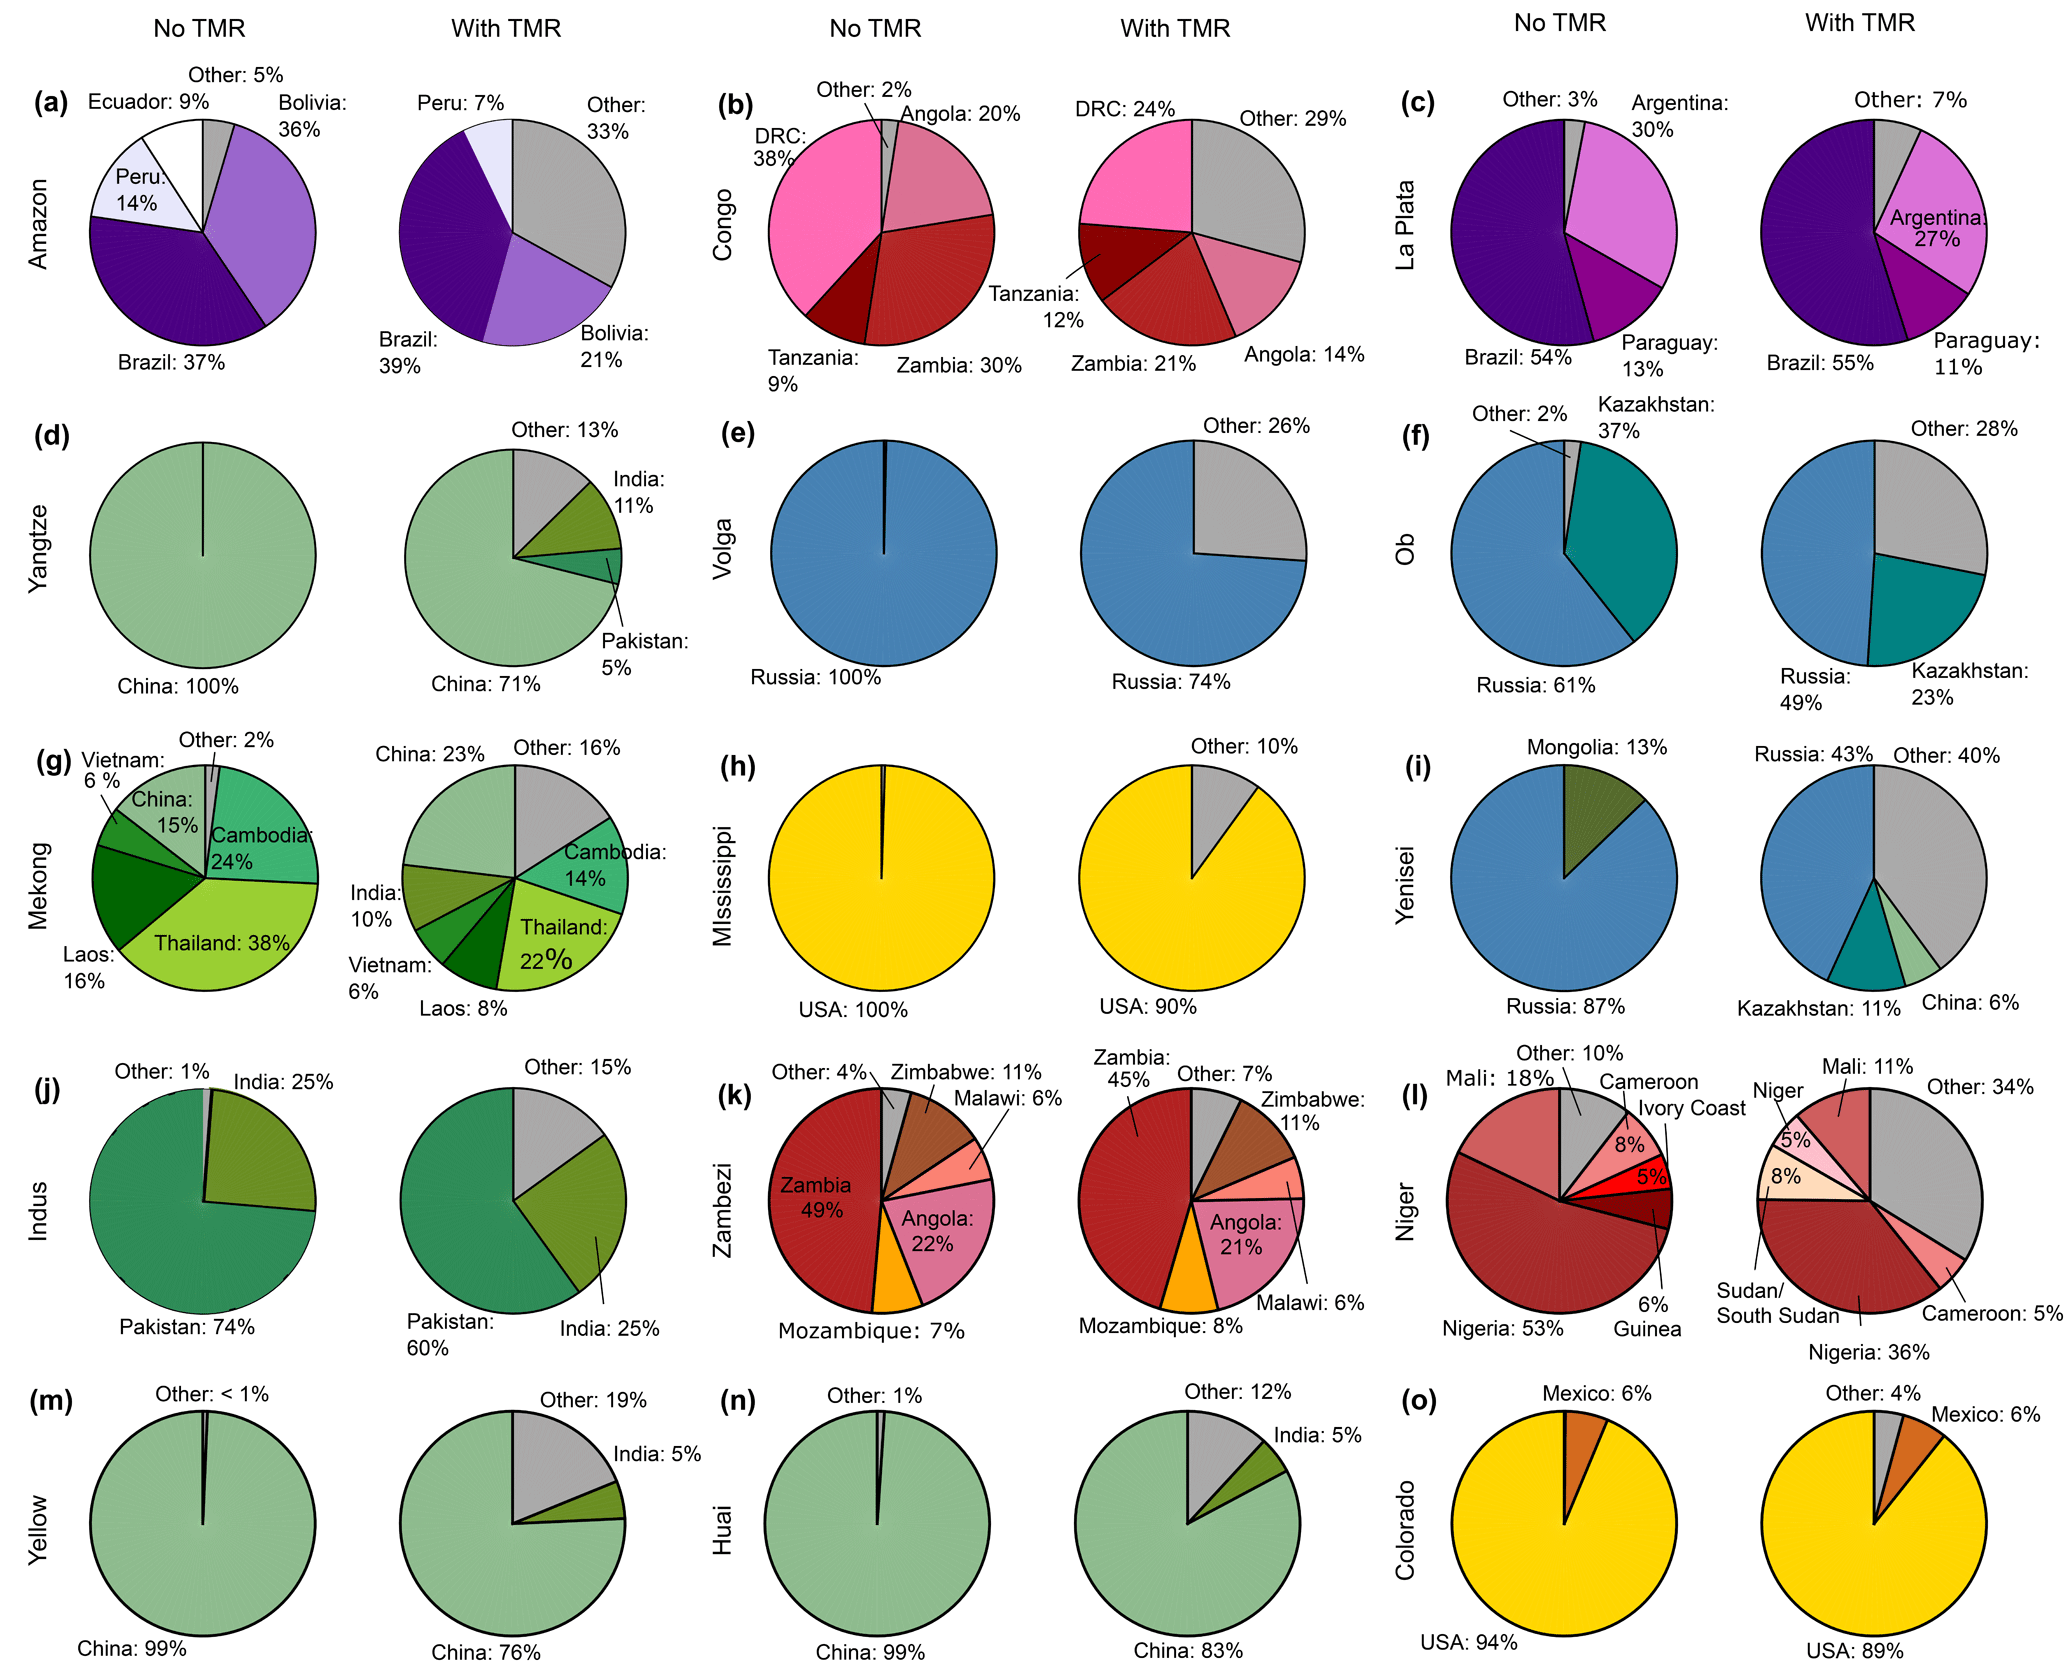
Figure 10Nation influence on river flow change depending on whether TMR is taken into account in the 15 studied basins. Without considering TMR, river flow change influence originates entirely from evaporation change within the basin. With consideration of TMR, nation influence to river flow change is considered as the sum of absolute changes in precipitation import and the sum of absolute changes in evaporation export (Methods). Single country contribution below 5 % is bundled into category “Other”.
4.1 Interplay between TMR and LUC
At the global scale, ΔQ as a response to LUC can be almost halved by taking TMR into account (Fig. 5). However, these effects vary widely by regions. While the TMR effects are negligible in some basins, remote LUC can compensate for the majority of the impact on Q from local LUC in other basins (e.g. Amazon, Fig. 7a) and even propose new transboundary relationships (e.g. Yangtze, Fig. 10d). From a TMR perspective, the impact on Q from within-basin LUC depends on the ΔE exported from the basin as much as the ΔP imported to the basin.
Our analysis shows the importance of considering LUC on par with TMR to identify anthropogenic influence on water resources, beyond analyses of pure moisture exchanges (Dirmeyer et al., 2009; Keys et al., 2017). While Africa does not constitute a major moisture source of Amazonian P (7 % of all Amazon P, 13 % of Amazon P with continental origin; see also Fig. 8a), the spatial extent of ΔE from LUC was sufficient to elevate the relative importance of African LUC for Amazonian ΔQ (28 % of Amazon ΔP; see also Fig. 10a). Similarly, India is not identified as a major moisture source of the Yangtze (see Fig. 8c and Wei et al., 2012), but has about 10 % influence on Yangtze ΔQ (Fig. 10d).
4.2 Potential governance relevance
Our results indicate that both precipitationsheds and evaporationsheds of river basins are relevant governance units. Previous studies of TMR for water management (Berger et al., 2014; Keys et al., 2017) have emphasized the importance of considering the P source region, i.e. the precipitationshed (Keys et al., 2012), which was introduced as a concept analogue to watershed for water resource management. This study finds that the evaporationshed (van der Ent and Savenije, 2013), i.e. the E sink region, is just as important when considering changes to Q.
LUC impacts Q through TMR in different ways depending on how precipitationshed, river basin, and evaporationshed are aligned. For example, where an evaporationshed has a limited overlap with river basin boundaries, reforesting a river basin may lead to unexpectedly large reductions in Q, if considerable deforestation simultaneously occurs in the precipitationshed outside the river basin.
The magnitude of TMR effects from remote LUC on Q can be comparable to managed water flows. For example, the Yangtze River provides 36 % of the country's surface water resources, and is subject to two of the world's most ambitious water engineering projects: the Three Gorges Dam and the South-to-North Water Diversion (CWRC, 2017). The overall TMR effect on mean annual LUC-induced ΔQ is here estimated at 980 m3 s−1 in the Yangtze basin, and the mean annual moisture change imported to the basin from foreign countries is estimated at 1110 m3 s−1 (Fig. 9c). As a comparison, the Q difference between a normal year and a dry year is about 300 m3 s−1 and the total amount of water to be transferred from the Yangtze through the South-to-North Water Diversion is aimed to be 1420 m3 s−1 (NSBD, 2011). Seasonal and interannual flow variability is a major challenge facing the Yangtze, and future research in the seasonal LUC influence and interaction with the monsoon system is needed. Note, however, that our estimates are associated with parameter sensitivity (see Fig. S9) and large uncertainties as discussed in the Limitations.
We note that the relevance of considering TMR governance depends on future LUC. The simulated ΔQ in this paper follows from a rather extreme LUC scenario (from potential to current land use). The current LUC in this study is 15 million km2 cropland and 28 million km2 pasture conversion (Ramankutty et al., 2008). As a comparison, models used in the Intergovernmental Panel on Climate Change (IPCC) Fourth Assessment Report (AR4) estimated cropland changes from −1.2 to +12 million km2 between 2000 and 2050 (IPCC, 2007). A more recent multi-model comparison ranged cropland conversion until 2050 from −1 to +8.5 million km2 across different scenarios (Schmitz et al., 2014). In total, the potential land for agricultural conversion has been estimated at 17 million km2 (Schmitz et al., 2014). Thus, future LUC can be considerable, and potential TMR impacts on Q will be dependent on the type and geographical distribution of LUC, as well as dependent on prevailing winds, hydroclimate, and orography.
4.3 Limitations
In interpreting our results, it should be noted that our approach only accounts for the TMR effects. The frequency or intensity of P is assumed to remain unaffected by thermal layer processes or circulation perturbation, which may introduce a bias into the quantitative estimates of hydrological flows under water-limited conditions (i.e. semi-arid regions and temperate regions during summertime) (Medvigy et al., 2011). Furthermore, vegetation response to ΔP is not simulated, such as forest dieback from increased fire risk under drying conditions. Human modification of Q through dams and climate change (Haddeland et al., 2014) are also not considered in this study. In addition, the land-use change over land may affect the above ocean processes mainly through modification of the energy balance and circulation in monsoon regions, which we do not account for. Changes in freshwater discharge to the oceans might have implications for ocean circulation and climate, as studies of for example river discharge to the Arctic Ocean showed (Peterson, 2002, 2006). However, moisture recycling's buffering effect (which mitigates river flow changes) should have a mitigating effect on the ocean's response to freshwater inflow. Otherwise, precipitation over the ocean can influence ocean salinity (IPCC, 2013) and precipitation patterns over land can be influenced by sea surface temperature (Xie et al., 2010), but we consider this outside the scope of our study and likely to be of minor importance for the research questions that we address. Our TMR analyses should, thus, be seen as an inquiry to better understand the relative importance of local and remote LUC effects on Q from a water balance perspective, rather than an exact prediction. Nevertheless, due to the inevitable recycling of moisture in the global hydrological cycle, uncertainties in the magnitude are unlikely to affect our key conclusions that upwind extra-basin LUC can be essential for Q.
The magnitude of our estimated ΔP (Fig. 5) and ΔQ from LUC is conservative in comparison to the literature (Spracklen and Garcia-Carreras, 2015). For example, a meta-analysis of 96 different general circulation models (GCMs) and regional climate model (RCM) deforestation simulations showed that under 10 % conversion of Amazon forest to pasture or soybean production, the inter-quartile range of rainfall change in the Amazon basin is 0 to −4 % (Spracklen and Garcia-Carreras, 2015). In comparison, the STEAM-WAM2layers approach with change from potential to current land-use change (i.e. 8.8 % deforestation extent in the Amazon) causes a rainfall reduction of 0.4 % in the Amazon and thus falls in the conservative range. In addition, our analyses concern mean annual ΔQ, and can also be considered conservative in the sense that seasonal signals are expected to be much stronger.
The limitations of our methods should also been seen in the light of the strengths and limitations of alternative methods for studying hydrological LUC effects; see Table S1. The most complex and coupled modelling approaches account for the highest number of feedback processes. However, the high degree of freedom in GCMs also contributes to the high sensitivity of precipitation to initial conditions and the low signal-to-noise ratios. For example, a scenario replacing natural with present-day land cover only detected a significant response in less than 5 % of all grid cells in a single model analysis (Findell et al., 2007) and less than 5 % in non-perturbed grid cells across seven different models (Pitman et al., 2009). Regional deforestation scenarios generate higher ratios of significant results near the source of change, albeit noise remains high in distant regions (Werth and Avissar, 2002). The challenges in simulating precipitation due to cloud formation, aerosol representation, and inherent uncertainties in circulation response (Aloysius et al., 2016; Koren et al., 2012; Shepherd, 2014), and non-closure of water balance in semi-coupled modelling approaches (Bring et al., 2015), also contribute to a high model dependence in estimates of river flow change from LUC (Kundzewicz et al., 2007). Thus, the sign, magnitude, and location of impacts vary widely among models (Aloysius et al., 2016; Pitman et al., 2009). Observation-based methods relate presence of vegetation or irrigation to precipitation or river flows using statistical methods, often in combination with moisture tracking to determine the geographical origin of rainfall (DeAngelis et al., 2010; Kustu et al., 2010, 2011; Spracklen et al., 2012). Limitations of this type of method include variations in data quality, challenges in isolating effects of land use from climate variability, and difficulties establishing causation from correlation (Matin and Bourque, 2015). Key elements missing in all approaches including our own are socio-economic dynamics and landscape resilience, which are complex issues currently explored in experimental model settings (Nitzbon et al., 2017; Reyer et al., 2015).
4.4 Future research outlook
Research of land-use change dynamics and moisture recycling is becoming increasingly detailed, looking at e.g. the role of transpiration for moisture recycling during dry periods (Staal et al., 2018; Wang-Erlandsson et al., 2014; van der Ent et al., 2014), studying the interplay with groundwater use and recharge (Keune et al., 2018), and identifying influential source areas within a basin (Staal et al., 2018; Weng et al., 2018). Nevertheless, a key challenge for considering TMR effects in water governance is the modelling uncertainties and inherent variabilities associated with land–atmosphere feedback processes. The most complex modelling approaches account for the highest number of feedback processes. However, the sign, magnitude, and location of impacts vary widely even among state-of-the-art climate models (Aloysius et al., 2016; Pitman et al., 2009). Key future improvements in climate models' ability to simulate ΔP from LUC will contribute to the governability of TMR. In-depth examination of differences in model simulation of P (e.g. the ongoing Precipitation Driver Response Model Intercomparison Project Myhre et al., 2017) is one step in this direction. Tracking moisture in coupled climate models could further help identify causes of simulated differences in atmospheric and hydrological outputs. Key elements missing in current research on LUC effects on hydrological flows include socio-economic dynamics and landscape resilience, which are complex issues currently explored in experimental model settings (Nitzbon et al., 2017; Reyer et al., 2015).
In the meantime, “no-regret” policies in river basin management, where TMR objectives align with other aims, can potentially be explored in conjunction with LUC scenarios that include TMR effects.
We analysed the potential impact of human LUC on Q worldwide through TMR, and separately looked at the remote and local LUC effects of relevance to water governance. Despite the river basin being the standard unit in water governance and water resource management, we find that ΔQ are ultimately dependent on the modifications in both incoming P and outflowing E. At the global scale, ΔQ as a response to LUC is almost halved by taking TMR into account. Due to variations in moisture recycling patterns and LUC, the magnitude and spatial sources of the TMR effect on ΔQ vary substantially among individual basins. In some basins, the remote LUC effect on ΔQ exceeded local within-basin effects (e.g. in the Amazon), while in others, TMR introduced considerable foreign nation influence on ΔQ (e.g. in the Yangtze). International governance arrangements of teleconnnected LUC influence could be needed, even for river basins that today are not considered transboundary. We conclude that consideration of TMR is essential for understanding Q modifications and managing water resources in a rapidly changing and tele-coupled world (Liu et al., 2013) facing increasing pressure on both land (Schmitz et al., 2014) and water (Mekonnen and Hoekstra, 2016). Further research in both climate modelling and water governance strategies is needed to internalize land–atmosphere interactions in future water resource considerations.
The Water Accounting Model-2 layers (WAM-2layers) moisture tracking scheme in Python code can be obtained from GitHub (https://github.com/ruudvdent/WAM2layersPython, van der Ent, 2016). Earth Retrospective Analysis Interim (ERA-I) meteorological data can be obtained from the European Centre for Medium-Range Weather Forecasts (ECMWF) (http://apps.ecmwf.int/datasets/data/interim-full-daily/levtype=sfc/, European Centre for Medium-Range Weather Forecasts, 2018). The Multi-Source Weighted-Ensemble Precipitation (MSWEP) data can be downloaded from http://www.gloh2o.org/ (Beck, 2017). The Ramankutty potential land data come from https://nelson.wisc.edu/sage/data-and-models/global-potential-vegetation/index.php (Ramankutty and Foley, 2018). The current cropland and pasture map can be obtained from EarthStat (http://www.earthstat.org/data-download/, Ramankutty et al., 2018). Land Cover Type Climate Modeling Grid (CMG) MCD12C1 International Geosphere Biosphere Program (IGBP) land classification created from Terra and Aqua Moderate Resolution Imaging Spectroradiometer (MODIS) data can be downloaded at https://modis.gsfc.nasa.gov/data/dataprod/mod12.php (Friedl, 2018). Monthly irrigated rice and irrigation non-rice crops were obtained from the data set of Monthly Irrigated and Rainfed Crop Areas around the year 2000 (MIRCA2000) V1.1 and can be downloaded at http://www.uni-frankfurt.de/45218031 (Portmann et al., 2018).
The supplement related to this article is available online at: https://doi.org/10.5194/hess-22-4311-2018-supplement.
The research was conceived by LWE, RJvdE, PWK, HHGS, and LJG. IF contributed ideas for analyses. LWE carried out the model simulations, analysed the data, and wrote the paper with input from all the authors.
The authors declare that they have no conflict of interest.
We thank Victor Galaz, Chandrakant Singh, and two anonymous reviewers for
providing feedback on the manuscript. Lan Wang-Erlandsson, Patrick W. Keys,
and Line J. Gordon, are funded by the Swedish Research Council Formas (grant
no. 1364115). Lan Wang-Erlandsson is also funded by the Japan Society for the
Promotion of Science (JSPS). Ruud J. van der Ent received funding from the
European Union Seventh Framework Programme (FP7/2007-2013, grant agreement
no. 603608). Ingo Fetzer receives financial support from the Stordalen
Foundation. Ingo Fetzer and Line J. Gordon are also supported by the Swedish
foundation for strategic environmental research (MISTRA).
Edited by: Stefan Uhlenbrook
Reviewed by: two
anonymous referees
Alkama, R., Kageyama, M., and Ramstein, G.: Relative contributions of climate change, stomatal closure, and leaf area index changes to 20th and 21st century runoff change: A modelling approach using the Organizing Carbon and Hydrology in Dynamic Ecosystems (ORCHIDEE) land surface model, J. Geophys. Res.-Atmos., 115, D17112, https://doi.org/10.1029/2009JD013408, 2010. a, b
Aloysius, N. R., Sheffield, J., Saiers, J. E., Li, H., and Wood, E. F.: Evaluation of historical and future simulations of precipitation and temperature in central Africa from CMIP5 climate models, J. Geophys. Res.-Atmos., 121, 130–152, https://doi.org/10.1002/2015JD023656, 2016. a, b, c
Avissar, R. and Werth, D.: Global hydroclimatological teleconnections resulting from tropical deforestation, J. Hydrometeorol., 6, 134–145, 2005. a, b, c
Badger, A. M. and Dirmeyer, P. A.: Remote tropical and sub-tropical responses to Amazon deforestation, Clim. Dynam., 46, 3057–3066, https://doi.org/10.1007/s00382-015-2752-5, 2016. a, b
Bagley, J. E., Desai, A. R., Dirmeyer, P. A., and Foley, J. A.: Effects of land cover change on moisture availability and potential crop yield in the world's breadbaskets, Environ. Res. Lett., 7, 014009, https://doi.org/10.1088/1748-9326/7/1/014009, 2012. a
Beck, H.: gloh2o, available at: http://www.gloh2o.org/, last access: 21 July 2017.
Beck, H. E., van Dijk, A. I. J. M., Levizzani, V., Schellekens, J., Miralles, D. G., Martens, B., and de Roo, A.: MSWEP: 3-hourly 0.25∘ global gridded precipitation (1979–2015) by merging gauge, satellite, and reanalysis data, Hydrol. Earth Syst. Sci., 21, 589–615, https://doi.org/10.5194/hess-21-589-2017, 2017. a
Berger, M., van der Ent, R., Eisner, S., Bach, V., and Finkbeiner, M.: Water accounting and vulnerability evaluation (WAVE): considering atmospheric evaporation recycling and the risk of freshwater depletion in water footprinting, Environ. Sci. Technol., 48, 4521–4528, https://doi.org/10.1021/es404994t, 2014. a
Betts, R. A., Golding, N., Gonzalez, P., Gornall, J., Kahana, R., Kay, G., Mitchell, L., and Wiltshire, A.: Climate and land use change impacts on global terrestrial ecosystems and river flows in the HadGEM2-ES Earth system model using the representative concentration pathways, Biogeosciences, 12, 1317–1338, https://doi.org/10.5194/bg-12-1317-2015, 2015. a, b
Bring, A., Asokan, S. M., Jaramillo, F., Jarsjö, J., Levi, L., Pietroń, J., Prieto, C., Rogberg, P., and Destouni, G.: Implications of freshwater flux data from the CMIP5 multimodel output across a set of Northern Hemisphere drainage basins, Earth's Future, 3, 206–217, https://doi.org/10.1002/2014EF000296, 2015. a
Brubaker, K. L., Entekhabi, D., and Eagleson, P. S.: Estimation of continental precipitation recycling, J. Climate, 6, 1077–1089, 1993. a
CWRC: Changjiang Water Resources Commission of the Ministry of Water Resources, available at: http://www.cjw.gov.cn/zjzx/cjyl/ (last access: 13 August 2018), 2017. a
Dalin, C., Wada, Y., Kastner, T., and Puma, M. J.: Groundwater depletion embedded in international food trade, Nature, 543, 700–704, https://doi.org/10.1038/nature21403, 2017. a
D'Almeida, C., Vorosmarty, C. J., Hurtt, G. C., Marengo, J. A., Dingman, S. L., and Keim, B. D.: The effects of deforestation on the hydrological cycle in Amazonia: a review on scale and resolution, Int. J. Climatol., 27, 633–647, 2007. a
de Vrese, P., Hagemann, S., and Claussen, M.: Asian Irrigation, African Rain: Remote Impacts of Irrigation, Geophys. Res. Lett., 43, 3737–3745, https://doi.org/10.1002/2016GL068146, 2016. a
DeAngelis, A., Domínguez, F., Fan, Y., Robock, A., Kustu, M. D., and Robinson, D.: Evidence of enhanced precipitation due to irrigation over the Great Plains of the United States, J. Geophys. Res., 115, D15115, https://doi.org/10.1029/2010JD013892, 2010. a
Dee, D., Uppala, S., Simmons, A. J., Berrisford, P., Poli, P., Kobayashi, S., Andrae, U., Balmaseda, M., Balsamo, G., Bauer, P., Bechtold, P., Beljaars, A. C. M., van de Berg, L., Bidlot, J., Bormann, N., Delsol, C., Dragani, R., Fuentes, M., Geer, A., Haimberger, L., Healy, S., Hersbach, H., Hólm, E., Isaksen, L., Kållberg, P., Köhler, M., Matricardi, M., McNally, A., Monge-Sanz, B., Morcrette, J.-J., Park, B.-K., Peubey, C., de Rosnay, P., Tavolato, C., Thépaut, J.-N., and Vitart, F.: The ERA-Interim reanalysis: configuration and performance of the data assimilation system, Q. J. Roy. Meteor. Soc., 137, 553–597, https://doi.org/10.1002/qj.828, 2011. a
Dirmeyer, P. A., Brubaker, K. L., and DelSole, T.: Import and export of atmospheric water vapor between nations, J. Hydrol., 365, 11–22, https://doi.org/10.1016/j.jhydrol.2008.11.016, 2009. a, b
Döll, P., Fiedler, K., and Zhang, J.: Global-scale analysis of river flow alterations due to water withdrawals and reservoirs, Hydrol. Earth Syst. Sci., 13, 2413–2432, https://doi.org/10.5194/hess-13-2413-2009, 2009. a
Ellison, D., Morris, C. E., Locatelli, B., Sheil, D., Cohen, J., Murdiyarso, D., Gutierrez, V., van Noordwijk, M., Creed, I. F., Pokorny, J., Gaveau, D., Spracklen, D. V., Tobella, A. B., Ilstedt, U., Teuling, A. J., Gebrehiwot, S. G., Sands, D. C., Muys, B., Verbist, B., Springgay, E., Sugandi, Y., and Sullivan, C. A.: Trees, forests and water: Cool insights for a hot world, Global Environ. Chang., 43, 51–61, https://doi.org/10.1016/j.gloenvcha.2017.01.002, 2017. a
European Centre for Medium-Range Weather Forecasts: ERA Interim Daily, available at: http://apps.ecmwf.int/datasets/data/interim-full-daily/levtype=sfc/, last access 13 August 2018.
Fekete, B. M., Vörösmarty, C. J., and Grabs, W.: High-resolution fields of global runoff combining observed river discharge and simulated water balances, Global Biogeochem. Cy., 16, 15-1–15-10, https://doi.org/10.1029/1999GB001254, 2002. a
Findell, K. L., Shevliakova, E., Milly, P. C. D., Stouffer, R. J., Findell, K. L., Shevliakova, E., Milly, P. C. D., and Stouffer, R. J.: Modeled Impact of Anthropogenic Land Cover Change on Climate, J. Climate, 20, 3621–3634, https://doi.org/10.1175/JCLI4185.1, 2007. a
Friedl, M.: Land Cover Types Yearly L3 Global 0.05 Deg CMG, available at: https://modis.gsfc.nasa.gov/data/dataprod/mod12.php, last access: 13 August 2018.
Friedl, M. A., Sulla-Menashe, D., Tan, B., Schneider, A., Ramankutty, N., Sibley, A., and Huang, X.: MODIS Collection 5 global land cover: Algorithm refinements and characterization of new datasets, Remote Sens. Environ., 114, 168–182, https://doi.org/10.1016/j.rse.2009.08.016, 2010. a
Garcia, E. S., Swann, A. L. S., Villegas, J. C., Breshears, D. D., Law, D. J., Saleska, S. R., and Stark, S. C.: Synergistic ecoclimate teleconnections from forest loss in different regions structure global ecological responses, PLoS ONE, 11, e0165042, https://doi.org/10.1371/journal.pone.0165042, 2016. a, b
Gerten, D., Rost, S., von Bloh, W., and Lucht, W.: Causes of change in 20th century global river discharge, Geophys. Res. Lett., 35, L20405, https://doi.org/10.1029/2008GL035258, 2008. a, b, c, d, e
Giordano, M., Suhardiman, D., and Peterson-Perlman, J.: Do hydrologic rigor and technological advance tell us more or less about transboundary water management?, Int. Environ. Agreem.-P., 16, 815–831, https://doi.org/10.1007/s10784-015-9297-2, 2015. a
Goessling, H. F. and Reick, C. H.: What do moisture recycling estimates tell us? Exploring the extreme case of non-evaporating continents, Hydrol. Earth Syst. Sci., 15, 3217–3235, https://doi.org/10.5194/hess-15-3217-2011, 2011. a
Guillod, B. P., Orlowsky, B., Miralles, D. G., Teuling, A. J., and Seneviratne, S. I.: Reconciling spatial and temporal soil moisture effects on afternoon rainfall, Nat. Commun., 6, 6443, https://doi.org/10.1038/ncomms7443, 2015. a
Haddeland, I., Heinke, J., Biemans, H., Eisner, S., Flörke, M., Hanasaki, N., Konzmann, M., Ludwig, F., Masaki, Y., Schewe, J., Stacke, T., Tessler, Z. D., Wada, Y., and Wisser, D.: Global water resources affected by human interventions and climate change, P. Natl. Acad. Sci. USA, 111, 3251–3256, https://doi.org/10.1073/pnas.1222475110, 2014. a
Hoekstra, A. Y.: The Global Dimension of Water Governance: Why the River Basin Approach Is No Longer Sufficient and Why Cooperative Action at Global Level Is Needed, Water, 3, 21–46, https://doi.org/10.3390/w3010021, 2010. a
IPCC: Mitigation of Climate Change, Contribution of Working Group III to the Fourth Assessment Report of the Intergovernmental Panel on Climate Change, in: Climate Change 2007, edited by: Metz, B., Davidson, O., Bosch, P., Dave, R., and Meyer, L., Cambridge University Press, Cambridge, UK, 2007. a
IPCC: The Physical Science Basis. Contribution of Working Group I to the Fifth Assessment Report of the Intergovernmental Panel on Climate Change, in: Climate Change 2013, edited by: Stocker, T., Qin, D., Plattner, G.-K., Tignor, M., Allen, S., Boschung, J., Nauels, A., Y. Xia, V. B., and Midgley, P., September 2013, Cambridge University Press, Cambridge, United Kingdom and New York, NY, USA, p. 1535, https://doi.org/10.1017/CBO9781107415324, 2013. a
Jaramillo, F. and Destouni, G.: Local flow regulation and irrigation raise global human water consumption and footprint, Science, 350, 1248–1251, https://doi.org/10.1126/science.aad1010, 2015. a
Johansson, E. L., Fader, M., Seaquist, J. W., and Nicholas, K. A.: Green and blue water demand from large-scale land acquisitions in Africa, P. Natl. Acad. Sci. USA, 113, 11471–11476, https://doi.org/10.1073/pnas.1524741113, 2016. a
Jolly, W. M., Nemani, R., and Running, S. W.: A generalized, bioclimatic index to predict foliar phenology in response to climate, Glob. Change Biol., 11, 619–632, https://doi.org/10.1111/j.1365-2486.2005.00930.x, 2005. a
Keune, J., Sulis, M., Kollet, S., Siebert, S., and Wada, Y.: Human Water Use Impacts on the Strength of the Continental Sink for Atmospheric Water, Geophys. Res. Lett., 45, 4068–4076, https://doi.org/10.1029/2018GL077621, 2018. a
Keys, P. W., van der Ent, R. J., Gordon, L. J., Hoff, H., Nikoli, R., and Savenije, H. H. G.: Analyzing precipitationsheds to understand the vulnerability of rainfall dependent regions, Biogeosciences, 9, 733–746, https://doi.org/10.5194/bg-9-733-2012, 2012. a, b
Keys, P. W., Wang-Erlandsson, L., and Gordon, L. J.: Revealing Invisible Water: Moisture Recycling as an Ecosystem Service, PloS one, 11, e0151993, https://doi.org/10.1371/journal.pone.0151993, 2016. a, b
Keys, P. W., Wang-Erlandsson, L., Gordon, L. J., Galaz, V., and Ebbesson, J.: Approaching moisture recycling governance, Global Environ. Chang., 45, 15–23, https://doi.org/10.1016/j.gloenvcha.2017.04.007, 2017. a, b, c
Khanna, J., Medvigy, D., Fueglistaler, S., and Walko, R.: Regional dry-season climate changes due to three decades of Amazonian deforestation, Nat. Clim. Change, 7, 200–204, https://doi.org/10.1038/nclimate3226, 2017. a
Koren, I., Altaratz, O., Remer, L. A., Feingold, G., Martins, J. V., and Heiblum, R. H.: Aerosol-induced intensification of rain from the tropics to the mid-latitudes, Nat. Geosci., 5, 118–122, https://doi.org/10.1038/ngeo1364, 2012. a
Koster, R. D., Suarez, M. J., Higgins, R. W., and Van den Dool, H. M.: Observational evidence that soil moisture variations affect precipitation, Geophys. Res. Lett., 30, 1–4, https://doi.org/10.1029/2002GL016571, 2003. a
Kottek, M., Grieser, J., Beck, C., Rudolf, B., and Rubel, F.: World Map of the Köppen-Geiger climate classification updated, Meteorol. Z., 15, 259–263, https://doi.org/10.1127/0941-2948/2006/0130, 2006. a
Kundzewicz, Z. W., Mata, L. J., Arnell, N. W., Doll, P., Kabat, P., Jimenez, B., Miller, K. A., Oki, T., Scen, Z., and Shiklomanov, I. A.: Freshwater resources and their management, in: Climate Change 2007: Impacts, Adaptations, and Vulnerability, Contribution of Working Group II to the Fourth Assessment Report of the Intergovernmental Panel on Climate Change, edited by: Parry, M., Canziani, O., Palutikof, J., van der Linden, P., and Hansen, C., Cambridge University Press, Cambridge, UK, 173–210, 2007. a
Kustu, M. D., Fan, Y., and Robock, A.: Large-scale water cycle perturbation due to irrigation pumping in the US High Plains: A synthesis of observed streamflow changes, J. Hydrol., 390, 222–244, https://doi.org/10.1016/j.jhydrol.2010.06.045, 2010. a
Kustu, M. D., Fan, Y., and Rodell, M.: Possible link between irrigation in the U.S. High Plains and increased summer streamflow in the Midwest, Water Resour. Res., 47, W03522, https://doi.org/10.1029/2010WR010046, 2011. a, b
Lawrence, D. and Vandecar, K.: Effects of tropical deforestation on climate and agriculture, Nat. Clim. Change, 5, 27–36, https://doi.org/10.1038/nclimate2430, 2014. a, b
Liu, J., Hull, V., Batistella, M., DeFries, R., Dietz, T., Fu, F., Hertel, T. W., Izaurralde, R. C., Lambin, E. F., Li, S., Martinelli, L. A., McConnell, W. J., Moran, E. F., Naylor, R., Ouyang, Z., Polenske, K. R., Reenberg, A., de Miranda Rocha, G., Simmons, C. S., Verburg, P. H., Vitousek, P. M., Zhang, F., and Zhu, C.: Framing Sustainability in a Telecoupled World, Ecol. Soc., 18, 26, https://doi.org/10.5751/ES-05873-180226, 2013. a
Lo, M.-H. and Famiglietti, J. S.: Irrigation in California ' s Central Valley strengthens the southwestern U. S. water cycle, Geophys. Res. Lett., 40, 301–306, https://doi.org/10.1002/GRL.50108, 2013. a
Matin, M. A. and Bourque, C. P.-A.: Relating seasonal dynamics of enhanced vegetation index to the recycling of water in two endorheic river basins in north-west China, Hydrol. Earth Syst. Sci., 19, 3387–3403, https://doi.org/10.5194/hess-19-3387-2015, 2015. a
Medvigy, D., Walko, R. L., and Avissar, R.: Effects of deforestation on spatiotemporal distributions of precipitation in South America, J. Climate, 24, 2147–2163, https://doi.org/10.1175/2010JCLI3882.1, 2011. a
Mekonnen, M. M. and Hoekstra, A. Y.: Four billion people facing severe water scarcity, Sci. Adv., 2, e1500323, https://doi.org/10.1126/sciadv.1500323, 2016. a, b
Milly, P. C. D., Dunne, K. A., and Vecchia, A. V.: Global pattern of trends in streamflow and water availability in a changing climate, Nature, 438, 347–350, https://doi.org/10.1038/nature04312, 2005. a
Miralles, D. G., Nieto, R., McDowell, N. G., Dorigo, W. A., Verhoest, N. E., Liu, Y. Y., Teuling, A. J., Dolman, A. J., Good, S. P., and Gimeno, L.: Contribution of water-limited ecoregions to their own supply of rainfall, Environ. Res. Lett., 11, 124007, https://doi.org/10.1088/1748-9326/11/12/124007, 2016. a
Monteith, J. L.: Evaporation and environment, in: Symp Soc Exp Biol, vol. 19, chap. The State, Cambridge University Press, Swansea, 205–234, 1965. a
Myhre, G., Forster, P. M., Samsmset, B. H., Hogdnebrog, Ø., Sillmann, J., Aalbergsjø, S. G., Andrews, T., Boucher, O., Faluvegi, G., Fläschner, D., Iversen, T., Kasoar, M., Kharin, V., Kirkevag, A., Lamarque, J. F., Olivié, D., Richardson, T. B., Shindell, D., Shine, K. P., Stjern, C. W., Takemura, T., Voulgarakis, A., and Zwiers, F.: PDRMIP: A precipitation driver and response model intercomparison project-protocol and preliminary results, B. Am. Meteor. Soc., 98, 1185–1198, https://doi.org/10.1175/BAMS-D-16-0019.1, 2017. a
Nitzbon, J., Heitzig, J., and Parlitz, U.: Sustainability, collapse and oscillations of global climate, population and economy in a simple World-Earth model, Environ. Res. Lett., 12, 074020, https://doi.org/10.1088/1748-9326/AA7581, 2017. a, b
NSBD: South-to-North Water Diversion, available at: http://www.nsbd.gov.cn/zx/english/ (last access: 13 August 2018), 2011. a
Oki, T. and Kanae, S.: Global hydrological cycles and world water resources, Science, 313, 1068–1072, https://doi.org/10.1126/science.1128845, 2006. a
Peterson, B. J.: Increasing River Discharge to the Arctic Ocean, Science, 298, 2171–2173, https://doi.org/10.1126/science.1077445, 2002. a
Peterson, B. J.: Trajectory Shifts in the Arctic and Subarctic Freshwater Cycle, Science, 313, 1061–1066, https://doi.org/10.1126/science.1122593, 2006. a
Piao, S., Friedlingstein, P., Ciais, P., de Noblet-Ducoudré, N., Labat, D., and Zaehle, S.: Changes in climate and land use have a larger direct impact than rising CO2 on global river runoff trends, P. Natl. Acad. Sci. USA, 104, 15242–15247, https://doi.org/10.1073/pnas.0707213104, 2007. a, b, c, d
Pitman, A. J., de Noblet-Ducoudré, N., Cruz, F. T., Davin, E. L., Bonan, G. B., Brovkin, V., Claussen, M., Delire, C., Ganzeveld, L., Gayler, V., van den Hurk, B. J. J. M., Lawrence, P. J., van der Molen, M. K., Müller, C., Reick, C. H., Seneviratne, S. I., Strengers, B. J., and Voldoire, A.: Uncertainties in climate responses to past land cover change: First results from the LUCID intercomparison study, Geophys. Res. Lett., 36, 1–6, https://doi.org/10.1029/2009GL039076, 2009. a, b, c
Portmann, F. T., Siebert, S., and Döll, P.: MIRCA2000-Global monthly irrigated and rainfed crop areas around the year 2000: A new high-resolution data set for agricultural and hydrological modeling, Global Biogeochem. Cy., 24, 1–24, https://doi.org/10.1029/2008GB003435, 2010. a
Portmann, F. T., Siebert, S., and Döll, P.: MIRCA2000 data download, available at: http://www.uni-frankfurt.de/45218031, last access: 13 August 2018.
Ramankutty, N. and Foley, J. A.: Estimating historical changes in global land cover: Croplands historical have converted areas, Global Biogeochem. Cy., 13, 997–1027, 1999. a
Ramankutty, N. and Foley, J. A.: Global Potential Vegetation Dataset, available at: https://nelson.wisc.edu/sage/data-and-models/global-potential-vegetation/index.php, last access: 13 August 2018.
Ramankutty, N., Evan, A. T., Monfreda, C., and Foley, J. A.: Farming the planet: 1. Geographic distribution of global agricultural lands in the year 2000, Global Biogeochem. Cy., 22, 1–19, https://doi.org/10.1029/2007GB002952, 2008. a, b, c
Reyer, C. P. O., Brouwers, N., Rammig, A., Brook, B. W., Epila, J., Grant, R. F., Holmgren, M., Langerwisch, F., Leuzinger, S., Lucht, W., Medlyn, B., Pfeifer, M., Steinkamp, J., Vanderwel, M. C., Verbeeck, H., and Villela, D. M.: Forest resilience and tipping points at different spatio-temporal scales: Approaches and challenges, J. Ecol., 103, 5–15, https://doi.org/10.1111/1365-2745.12337, 2015. a, b
Ramankutty, N., Evan, A. T., Monfreda, C., and Foley, J. A.: Cropland and Pasture Area 2000, available at: http://www.earthstat.org/data-download/, last access: 13 August 2018.
Rockström, J., Steffen, W., Noone, K., Persson, A., Chapin III, F. S., Lambin, E. F., Lenton, T. M., Scheffer, M., Folke, C., Schellnhuber, H. J., Nykvist, B., de Wit, C. A., Hughes, T., van der Leeuw, S., Rodhe, H., Sörlin, S., Snyder, P. K., Costanza, R., Svedin, U., Falkenmark, M., Karlberg, L., Corell, R. W., Fabry, V. J., Hansen, J., Walker, B., Liverman, D., Richardson, K., Crutzen, P., and Foley, J. A.: Planetary boundaries: Exploring the safe operating space for humanity, Ecol. Soc., 14, 32, 2009. a
Rost, S., Gerten, D., Bondeau, A., Lucht, W., Rohwer, J., and Schaphoff, S.: Agricultural green and blue water consumption and its influence on the global water system, Water Resour. Res., 44, W09405, https://doi.org/10.1029/2007WR006331, 2008a. a, b
Rost, S., Gerten, D., and Heyder, U.: Human alterations of the terrestrial water cycle through land management, Adv. Geosci., 18, 43–50, https://doi.org/10.5194/adgeo-18-43-2008, 2008b. a, b
Rulli, C. M., Saviori, A., and Odorico, P. D.: Global land and water grabbing, P. Natl. Acad. Sci. USA, 110, 892–897, https://doi.org/10.1073/pnas.1213163110, 2012. a
Saad, S. I., Da Rocha, H. R., Silva Dias, M. A. F., and Rosolem, R.: Can the deforestation breeze change the rainfall in Amazonia? A case study for the BR-163 highway region, Earth Interact., 14, 1–25, https://doi.org/10.1175/2010EI351.1, 2010. a
Schmitz, C., van Meijl, H., Kyle, P., Nelson, G. C., Fujimori, S., Gurgel, A., Havlik, P., Heyhoe, E., D'Croz, D. M., Popp, A., Sands, R., Tabeau, A., van der Mensbrugghe, D., von Lampe, M., Wise, M., Blanc, E., Hasegawa, T., Kavallari, A., and Valin, H.: Land-use change trajectories up to 2050: Insights from a global agro-economic model comparison, Agr. Econ., 45, 69–84, https://doi.org/10.1111/agec.12090, 2014. a, b, c
Seneviratne, S. I., Corti, T., Davin, E. L., Hirschi, M., Jaeger, E. B., Lehner, I., Orlowsky, B., and Teuling, A. J.: Investigating soil moisture-climate interactions in a changing climate: A review, Earth-Sci. Rev., 99, 125–161, https://doi.org/10.1016/j.earscirev.2010.02.004, 2010. a
Shepherd, T. G.: Atmospheric circulation as a source of uncertainty in climate change projections, Nat. Geosci., 7, 703–708, https://doi.org/10.1038/ngeo2253, 2014. a
Spracklen, D., Arnold, S. R., and Taylor, C. M.: Observations of increased tropical rainfall preceded by air passage over forests, Nature, 489, 282–285, https://doi.org/10.1038/nature11390, 2012. a, b
Spracklen, D. V. and Garcia-Carreras, L.: The impact of Amazonian deforestation on Amazon basin rainfall, Geophys. Res. Lett., 42, 9546–9552, https://doi.org/10.1002/2015GL066063, 2015. a, b
Staal, A., Tuinenburg, O. A., Bosmans, J. H., Holmgren, M., Van Nes, E. H., Scheffer, M., Zemp, D. C., and Dekker, S. C.: Forest-rainfall cascades buffer against drought across the Amazon, Nat. Clim. Change, 8, 539–543, https://doi.org/10.1038/s41558-018-0177-y, 2018. a, b
Steffen, W., Richardson, K., Rockstrom, J., Cornell, S. E., Fetzer, I., Bennett, E. M., Biggs, R., Carpenter, S. R., de Vries, W., de Wit, C. A., Folke, C., Gerten, D., Heinke, J., Mace, G. M., Persson, L. M., Ramanathan, V., Reyers, B., and Sorlin, S.: Planetary boundaries: Guiding human development on a changing planet, Science, 347, 1259855, https://doi.org/10.1126/science.1259855, 2015. a
Sterling, S. M., Ducharne, A., and Polcher, J.: The impact of global land-cover change on the terrestrial water cycle, Nat. Clim. Change, 3, 385–390, https://doi.org/10.1038/nclimate1690, 2012. a, b, c, d, e
Stewart, J.: Modelling surface conductance of pine forest, Agr. Forest Meteorol., 43, 19–35, https://doi.org/10.1016/0168-1923(88)90003-2, 1988. a
Stickler, C. M., Coe, M. T., Costa, M. H., Nepstad, D. C., McGrath, D. G., Dias, L. C. P., Rodrigues, H. O., and Soares-Filho, B. S.: Dependence of hydropower energy generation on forests in the Amazon Basin at local and regional scales, P. Natl. Acad. Sci. USA, 110, 9601–9606, https://doi.org/10.1073/pnas.1215331110, 2013. a
Tuinenburg, O. A.: Atmospheric Effects of Irrigation in Moonsoon Climate: The Indian Subcontinent, PhD thesis, Wageningen University, 2013. a, b
van der Ent, R. J.: A new view on the hydrological cycle over continents, PhD thesis, Delft University of Technology, 2014. a
van der Ent, R. J.: WAM2layersPython, available at: https://github.com/ruudvdent/WAM2layersPython (last access: 13 August 2018), 2016. a, b
van der Ent, R. J. and Savenije, H. H. G.: Length and time scales of atmospheric moisture recycling, Atmos. Chem. Phys., 11, 1853–1863, https://doi.org/10.5194/acp-11-1853-2011, 2011. a
van der Ent, R. J. and Savenije, H. H. G.: Oceanic sources of continental precipitation and the correlation with sea surface temperature, Water Resour. Res., 49, 3993–4004, https://doi.org/10.1002/wrcr.20296, 2013. a
van der Ent, R. J., Tuinenburg, O. A., Knoche, H.-R., Kunstmann, H., and Savenije, H. H. G.: Should we use a simple or complex model for moisture recycling and atmospheric moisture tracking?, Hydrol. Earth Syst. Sci., 17, 4869–4884, https://doi.org/10.5194/hess-17-4869-2013, 2013. a
van der Ent, R. J., Wang-Erlandsson, L., Keys, P. W., and Savenije, H. H. G.: Contrasting roles of interception and transpiration in the hydrological cycle – Part 2: Moisture recycling, Earth Syst. Dynam., 5, 471–489, https://doi.org/10.5194/esd-5-471-2014, 2014. a, b, c
Wang-Erlandsson, L., van der Ent, R. J., Gordon, L. J., and Savenije, H. H. G.: Contrasting roles of interception and transpiration in the hydrological cycle – Part 1: Temporal characteristics over land, Earth Syst. Dynam., 5, 441–469, https://doi.org/10.5194/esd-5-441-2014, 2014. a, b, c, d
Wang-Erlandsson, L., Bastiaanssen, W. G. M., Gao, H., Jägermeyr, J., Senay, G. B., van Dijk, A. I. J. M., Guerschman, J. P., Keys, P. W., Gordon, L. J., and Savenije, H. H. G.: Global root zone storage capacity from satellite-based evaporation, Hydrol. Earth Syst. Sci., 20, 1459–1481, https://doi.org/10.5194/hess-20-1459-2016, 2016. a, b, c
Wei, J., Dirmeyer, P. A., Bosilovich, M. G., and Wu, R.: Water vapor sources for Yangtze River Valley rainfall: Climatology, variability, and implications for rainfall forecasting, J. Geophys. Res., 117, D05126, https://doi.org/10.1029/2011JD016902, 2012. a
Wei, Z., Yoshimura, K., Wang, L., Miralles, D. G., Jasechko, S., and Lee, X.: Revisiting the contribution of transpiration to global terrestrial evapotranspiration, Geophys. Res. Lett., 44, 2792–2801, https://doi.org/10.1002/2016GL072235, 2017. a
Weng, W., Luedeke, M. K. B., Zemp, D. C., Lakes, T., and Kropp, J. P.: Aerial and surface rivers: downwind impacts on water availability from land use changes in Amazonia, Hydrol. Earth Syst. Sci., 22, 911–927, https://doi.org/10.5194/hess-22-911-2018, 2018. a
Werth, D. and Avissar, R.: The local and global effects of Amazon deforestation, J. Geophys. Res., 107, 8087, https://doi.org/10.1029/2001JD000717, 2002. a
Xie, S. P., Deser, C., Vecchi, G. A., Ma, J., Teng, H. Y., and Wittenberg, A. T.: Global Warming Pattern Formation: Sea Surface Temperature and Rainfall, J. Climate, 23, 966–986, https://doi.org/10.1175/2009jcli3329.1, 2010. a
Zemp, D. C., Schleussner, C.-F., Barbosa, H. M. J., Hirota, M., Montade, V., Sampaio, G., Staal, A., Wang-Erlandsson, L., and Rammig, A.: Self-amplified Amazon forest loss due to vegetation-atmosphere feedbacks, Nat. Commun., 8, 14681, https://doi.org/10.1038/ncomms14681, 2017. a
Zheng, J., Sun, G., Li, W., Yu, X., Zhang, C., Gong, Y., and Tu, L.: Impacts of land use change and climate variations on annual inflow into the Miyun Reservoir, Beijing, China, Hydrol. Earth Syst. Sci., 20, 1561–1572, https://doi.org/10.5194/hess-20-1561-2016, 2016. a
The requested paper has a corresponding corrigendum published. Please read the corrigendum first before downloading the article.
- Article
(15821 KB) - Full-text XML
- Corrigendum
-
Supplement
(3762 KB) - BibTeX
- EndNote