the Creative Commons Attribution 4.0 License.
the Creative Commons Attribution 4.0 License.
 | 24 Nov 2025
Robust adaptive pathways for long-term flood control in delta cities: addressing pluvial flood risks under future deep uncertainty
Hengzhi Hu
Qian Ke
Wei Wu
Min Zhang
Yanjuan Wu
Chengming Jin
Jiahong Wen
Delta cities are increasingly vulnerable to flood risks due to the uncertainties surrounding climate change and socioeconomic development. Decision-makers face significant challenges in determining whether and how to invest in flood defense. Adaptation solutions should consider not only robustness but also adaptiveness in case the future unfolds other than as expected. To support decision-making and meet long-term multi-objective targets, we propose a synthesized framework that integrates robustness analysis, adaptiveness analysis, and pathway generation. This framework was applied to evaluate alternative solutions for managing pluvial flood risk in central Shanghai. The results demonstrate that relying on a single-objective decision-making approach (focused only on robustness) can lead to biased outcomes. By examining the effectiveness period and flexibility of candidate solutions, we assessed their potential to meet long-term flood control targets. The analysis reveals that a combined option – incorporating increased green areas, an improved drainage system, and a deep tunnel with a 30 % runoff absorption capacity (D + G + Tun30) – emerged as one of the most robust and adaptive pathways, based on multi-objective trade-off analysis. This study highlights the importance of considering effectiveness period within predefined control targets and retaining flexibility to avoid path-dependency and minimize long-term regrets. The proposed framework is broadly applicable and can guide adaptive responses to future flood risks in other delta cities.
- Article
(5627 KB) - Full-text XML
-
Supplement
(1042 KB) - BibTeX
- EndNote


Flood risk is increasing in low-lying delta cities due to rapid urbanization and climate change (Yang et al., 2023), hindering the capacity of urban development. Delta cities such as Shanghai (Yin et al., 2020), Ho Chi Minh City (Scussolini et al., 2017), and London (Dottori et al., 2023) are facing the combined challenges from extreme rainstorms, sea level rise and urbanization-induced land subsidence with regard to flooding risk reduction (Ward et al., 2017). It is anticipated that as a result of changing climate patterns, the frequency and severity of extreme flood events will increase in urban areas, thereby increasing the flood risk, particularly in rapidly developing delta cities (Sun et al., 2021).
Delta cities are urged to examine potential climate adaptation options (Han and Mozumder, 2021) and test their cost-effectiveness in designed socio-economic and climate scenarios to address rising flood risks (Lin et al., 2020). Dottori et al. (2023) proposed strategies for European cities to deal with increasing river flood risk. However, these strategies or options will remain effective within a fixed timeframe under the uncertainties of climate change, land use change or political change is questionable; in addition, how these strategies can be up-scaled to meet the future needs is rarely discussed. This is a pressing concern for decision makers in long-term planning. In the field of decision making under deep uncertainty (DMDU), various approaches have emerged. Robust Decision Making (RDM) is effective at identifying course of actions that perform well across a wide range of future scenarios through stress-testing, but it lacks explicit guidance on how to sequence actions over time (Lempert et al., 2013; Workman et al., 2021). Dynamic Adaptive Policy Pathway (DAPP) by contrast, excels at planning flexible adaptation pathways to avoid lock-in, but is relatively weaker in quantitatively evaluating robustness across uncertainties (Haasnoot et al., 2013; Dias et al., 2020).
These DMDU approaches have been continuously improved and optimized, the boundaries between methods have become increasingly blurred, and fusion thinking is progressively adopted (Haasnoot et al., 2020). As pointed out by Lempert et al. (2003), RDM provides systematic procedures that emphasize the iterative analysis process of scenario exploration, which can help decision-makers discover situations where options may fail, and understand the trade-off among all the adaptation options (Lempert et al., 2013). Kasprzyk et al. (2013) proposed the Multi-Objective Robust Decision Making (MORDM) approach by the combination concept of both multi-objective evolutionary optimizations and RDM (Bartholomew and Kwakkel, 2020; Yang et al., 2021). Marchau et al. (2019) pointed out that the RDM approach usually pays less attention to the dynamic planning of pathways on long-term scales of climate change. On the other hand, DAPP, which consist of the strengths of both Adaptive Policymaking (Walker et al., 2001) and Adaptation pathway (Haasnoot et al., 2013; Ranger et al., 2010), focuses on generating alternative dynamic pathway to achieve flexibility and avoid lock-in effects while it lacks quantitative robustness evaluation metrics (e.g., regret-based criteria or satisficing thresholds) as well as a thorough vulnerability analysis to quantify potential failures (Haasnoot et al., 2013).
Both the RDM and DAPP approaches are arguably most widely applied, and the concept of integrating two approaches has been proposed (Kwakkel et al., 2016) and practiced in cases (Tariq et al., 2017). However, as Ramm et al. (2018a) illustrated, integration of RDM and DAPP has not been thoroughly implemented. Future opportunities for a combined RDM–DAPP approach include engaging stakeholders to define clear adaptation objectives, establish suitable metrics, and determine risk tolerance as these factors significantly influence the outcomes of alternative pathways (Ramm et al., 2018b). Robustness emphasizes the ability of a strategy to perform in an effective way in many plausible futures. How to define robustness and assess whether options are insensitive to deep uncertainty to ensure certain performance across multiple plausible futures have sparked extensive discussions, especially when meeting multi-objective targets (Herman et al., 2015; McPhail et al., 2018).
The selection of indicators for robustness depends on the priorities and preferences by policymakers and it will substantially affect the outcomes of decisions (Giuliani and Castelletti, 2016). For example, the decision-makers who endorse risk aversion may under-estimate adaptation options' performance. To overcome the single objective problem framing, Quinn et al. (2017) optimized operations of the four largest reservoirs under several different multi-objective problem framings in Hanoi city (Vietnam), and highlighted the importance of formulating and evaluating alternative stakeholder objectives.
However, an open question remains: to what extent can a traditional robustness evaluation (especially under risk-averse assumptions) suffice for rational decision-making, versus using a multi-objective trade-off analysis to gain a more comprehensive view? For example, while one might assume the cost of a climate adaptation option is normally proportional to its benefit (risk reduction), in practice, options with high performance often entail higher costs and potentially longer construction periods (Dottori et al., 2023). Focusing on a single-objective (whether maximizing risk reduction or benefit-cost efficiency alone) provided limited information for long-term planning, and can lead to lock-in or path dependency issues due to overinvestment or maladaptation over time.
Adaptiveness refers to the ability of a strategy to adjust to changing conditions (Haasnoot et al., 2013; Malekpour and Newig, 2020). Rather than being in opposition, adaptiveness and robustness are complementary: incorporating flexibility can meeting long-term sufficiency criteria by avoiding overinvestment and lock-in. For example, committing immediately to an extremely high-level (and high-cost) flood defense could lead to path-dependency if future conditions turn out less severe than expected, whereas a strategy that can be incrementally upgraded retains both flexibility and robust performance over time. Despite its importance, the quantification of “adaptiveness” (e.g., in terms of flexibility) remains challenging (Kind et al., 2018). Adaptation tipping point analysis provided insight into when options will no longer meet a specified performance target (Haasnoot et al., 2013), and Patient Rule Induction Method (PRIM) offers a quantitative way to identify these tipping points (Ramm et al., 2018a, b). Kirshen et al. (2015) noted that the preferred urban flood control strategy may change once additional criteria like no-regret and flexibility are considered at critical thresholds. Rather than choosing an “optimal” here-and-now solution that could become suboptimal later, a “wait-and-see” approach (delaying or staging investments) can preserve flexibility. In the ROA paradigm, flexibility is explicitly valued since it allows decision-makers to defer committing to large, costly, and irreversible measures while implementing smaller steps until more information is available (Erfani et al., 2018). In this paper, we define “robustness” as the ability of course of action to maintain acceptable performance across a wide range of plausible futures, and “adaptiveness” as the ability to adjust or augment the strategy over time in response to how the future unfolds. Therefore, in our framework we incorporate both the timing of adaptations (the tipping point, termed the “effectiveness period” in this paper) and the flexibility to adjust, as key characteristics of adaptiveness that support better long-term planning.
In this study, we aim to propose a decision-making synthesized framework that integrates both robustness and adaptiveness to formulate a robust adaptive pathway for long-term climate adaptation planning under deep uncertainties. This framework is intended to guide decision-makers in prioritizing and sequencing adaptation options – a pressing challenge in urban climate action planning. We demonstrate the framework by applying it to a delta city (Shanghai) to evaluate a range of flood adaptation alternatives under plausible mid-21st-century scenarios (combining extreme rainfall and deteriorating drainage capacity by the 2070s).
The remainder of this article is organized as follows: Sect. 2 presents the proposed comprehensive framework and methodology. Section 3 introduces the background of the case study area and the preprocessing procedures. Section 4 presents the results, where a multi-objective trade-off is applied to evaluate the potential pathways for generating a robust adaptive pathway. This analysis combines metrics such as the average risk reduction rate (ARRR), benefit-cost ratio (BCR), effectiveness period, and flexibility of all options. Section 5 discusses the key findings related to pluvial flood risk management in coastal cities, the implications of multi-objective trade-off considering both robustness and adaptiveness, how the synthesized framework can inform long-term adaptive policy formulation, and provides recommendations for future work. Finally, Sect. 6 concludes with a summary.
2.1 Framework development
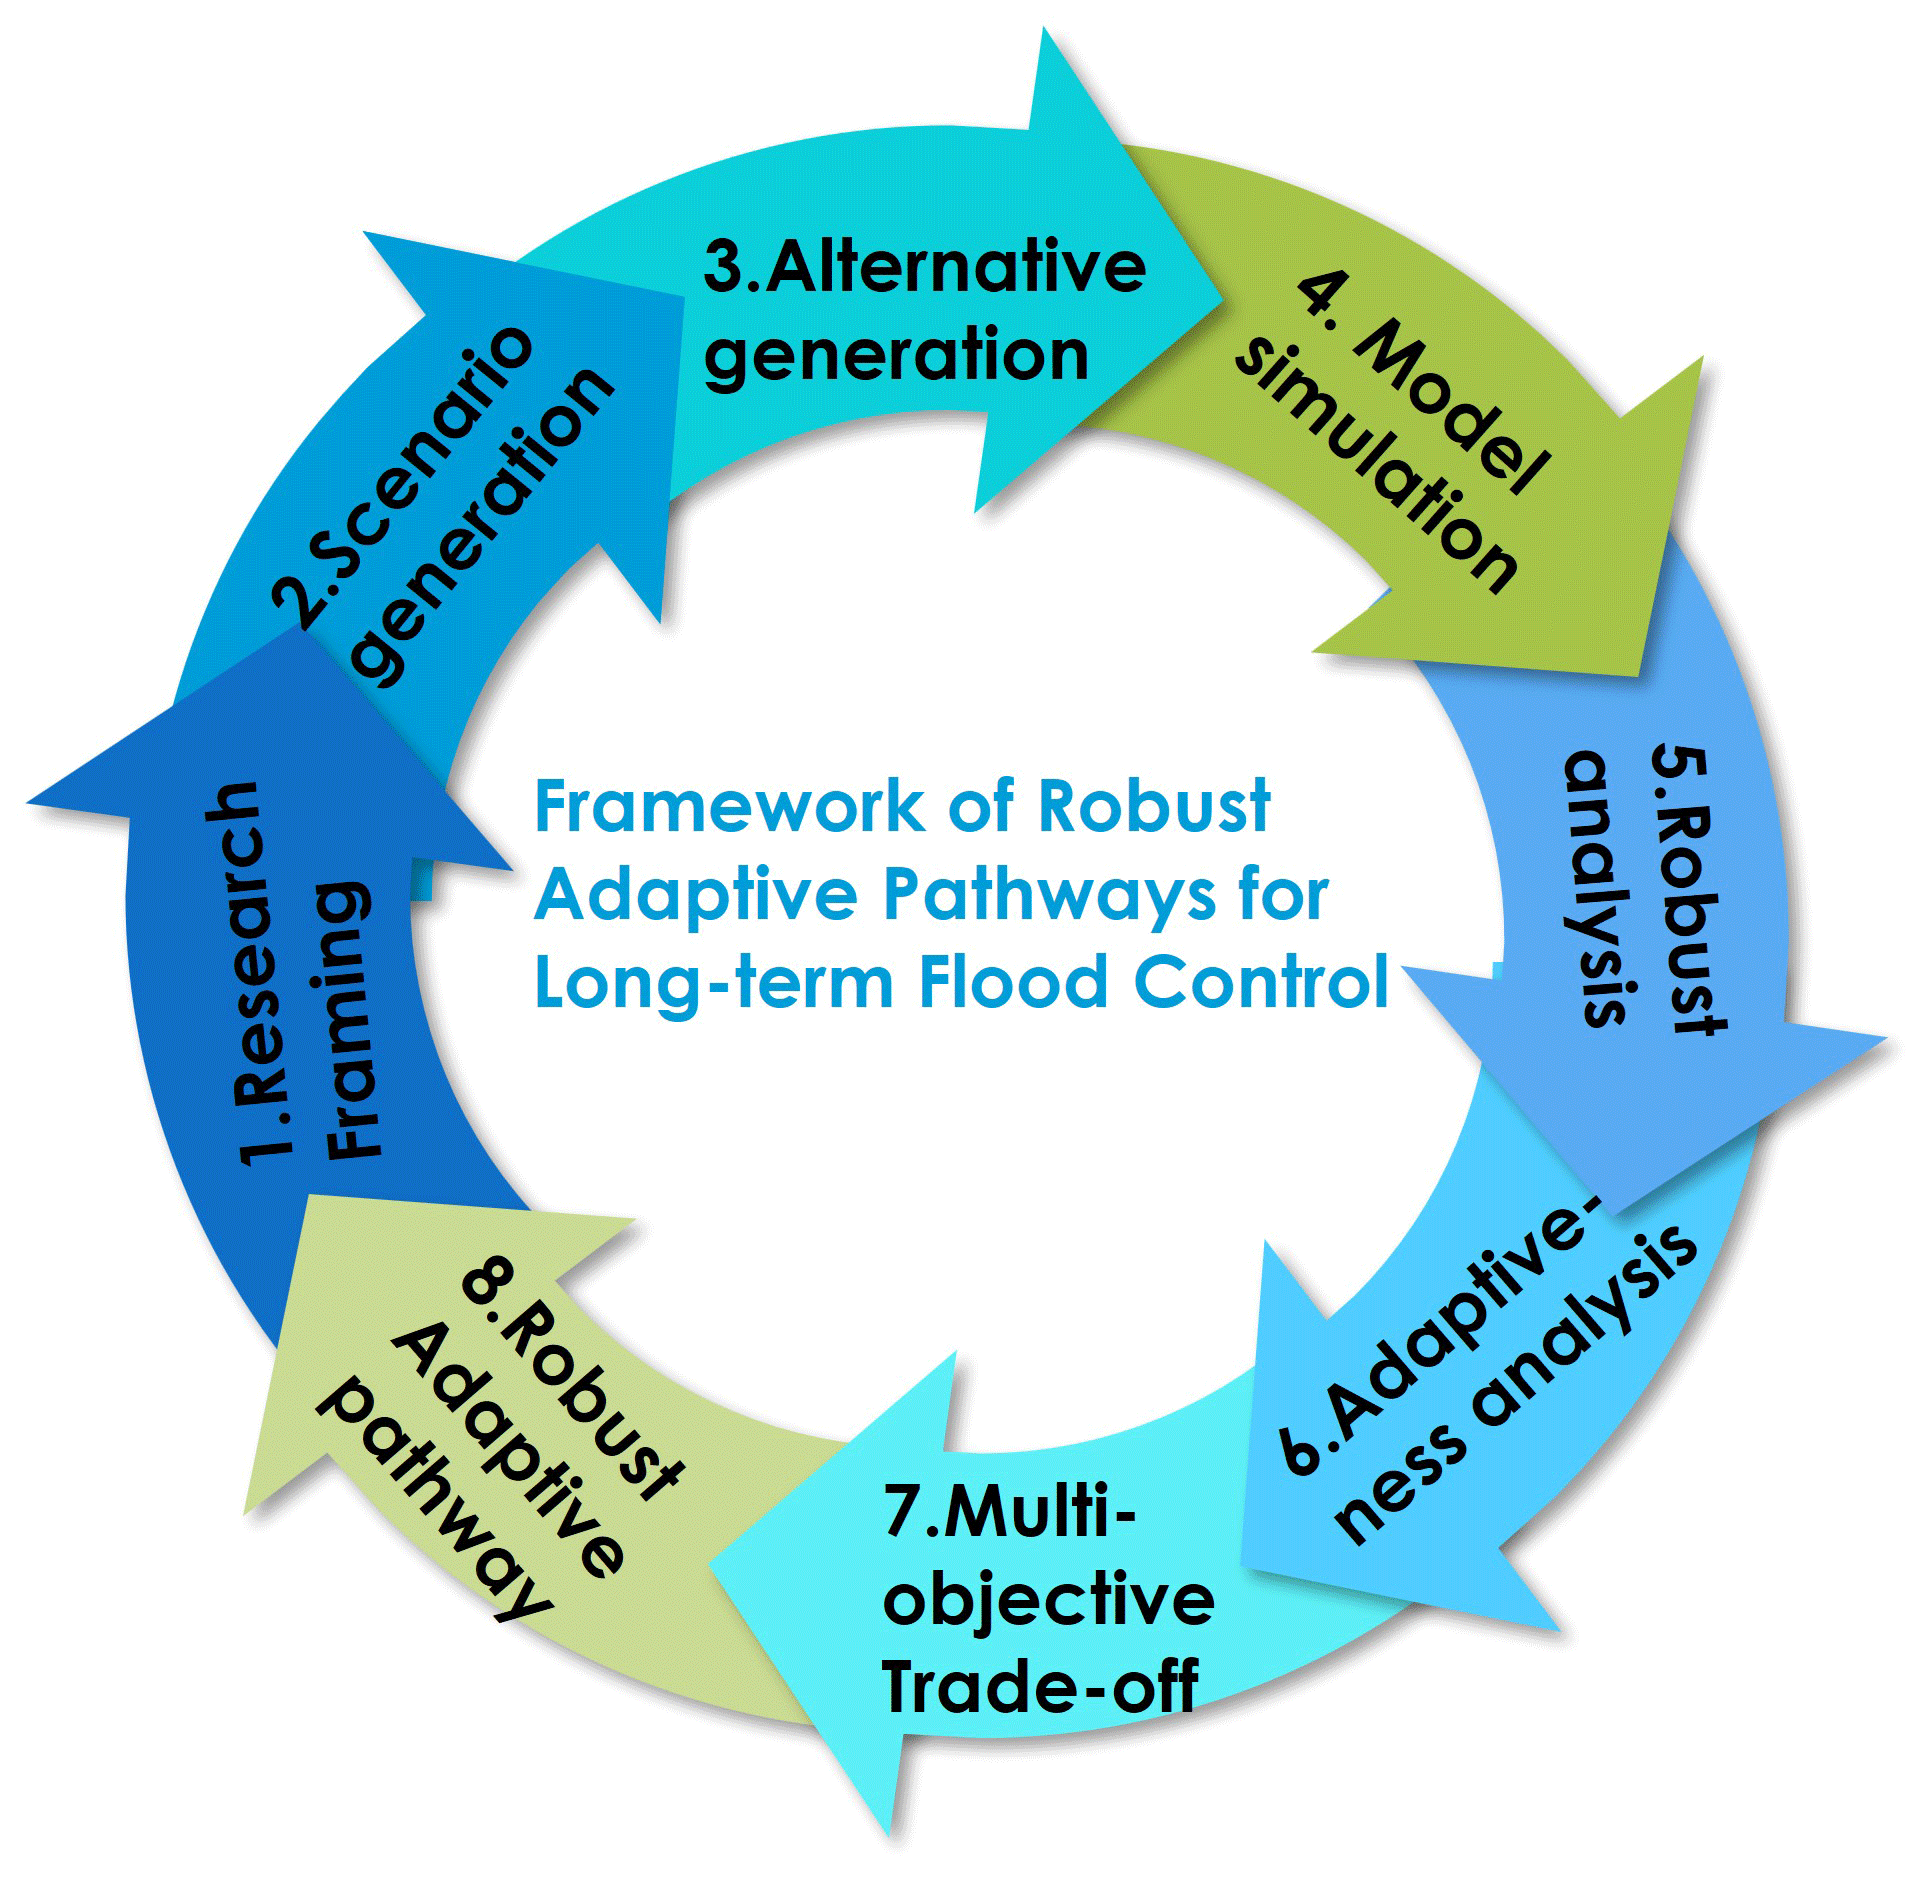
Having outlined the challenges of pluvial flood risks under deep uncertainties, we now present a robust adaptive pathway framework for long-term planning. We built this framework by extending the taxonomy of DMDU approaches proposed by Kwakkel and Haasnoot (2019), which categorizes five dimensions of decision frameworks, and incorporating recent advancements in robustness and adaptation methods. Figure 1 provides an overview of our framework's eight sequential steps. We summarize these steps below, then detail each component of the methodology:
-
Research framing. Define the long-term flood management objectives and a dynamic policy structure. Unlike a static, short-term plan, the proposed policy structure is dynamic and adaptive, providing a continuous pathway toward achieving long-term flood control goals while retaining flexibility to adjust as future conditions evolve. In our framework, introducing “adaptive” measures alongside traditional approaches enhances overall robustness by reducing the risk of over-investment or lock-in.
-
Scenario generation. Develop a set of plausible future scenarios capturing key uncertainties (meteorological, hydrological, socio-economic, etc.). The ranges for uncertain factors can be derived from expert judgments, policy targets, or climate projections (Lempert et al., 2013). We employed a Latin Hypercube Sampling approach (Workman et al., 2021) to efficiently generate diverse futures. In our case study, for instance, futures were defined by varying extreme rainfall intensities and drainage capacity degradation by 2050, based on climate model outputs and local planning assumptions.
-
Alternative generation. Identify and develop a portfolio of adaptation options. In our study, we used stakeholder workshops and policy document analysis to formulate viable flood control measures (both structural and non-structural). The current flood management strategy (status quo) serves as a baseline option, and a range of new adaptation alternatives (e.g., green infrastructure, drainage upgrades, tunnels, and their combinations) were assembled for evaluation.
-
Model simulation. Evaluate each option (and combinations of options) under all futures using an appropriate flood simulation model. The framework can accommodate models of varying complexity: for instance, high-fidelity 1D/2D hydrodynamic models (e.g., SOBEK, MIKE 1D2D; Wang et al., 2018) could be used for detailed analysis at the cost of more computation, whereas simpler conceptual models allow faster simulation of many scenarios. In our case study, we employed a simplified hydrological model based on the SCS-CN method to simulate runoff and flooding, which kept computational demands manageable given the thousands of plausible futures simulations, although the framework could integrate more complex models if needed.
-
Robustness analysis. Assess each option's performance across all futures using robustness metrics, which used to be depicted as f(a,wj) meaning the performance of option a under scenario wj. In this study, we assume all scenarios are equally likely (an application of Laplace's principle of insufficient reason) and compute performance indicators for each option under each scenario. Key indicators include the average risk reduction rate (ARRR), percentage reduction in expected damages compared to baseline, averaged over scenarios, and the benefit cost ratio (BCR), ratio of total avoided damage to total cost. Using these, we evaluate how “robust” each option is, for instance, how well it performs on average and whether it consistently meets acceptable thresholds across scenarios.
-
Adaptiveness analysis. Determine how long each option remains effective and how easily it can be adjusted. For each single or combined alternatives, we identify its effectiveness period – the duration or range of conditions over which it meets the flood risk target – by finding the point at which its performance falls below the acceptable threshold. We use the PRIM algorithm to analyze scenario results and pinpoint these tipping points; in doing so, we optimize PRIM's coverage (the proportion of scenarios captured by a tipping point condition) and density (the success rate within those scenarios) to balance generality and precision to balance generality and precision. We refer to the conditions triggering failure as signposts, which are observable indicators that an adaptation or policy change will soon be needed. Furthermore, we quantify each option's and combination's flexibility in our framework by the number of measures it contains. In other words, a multi-component strategy planned with, say, three measures have a higher planned flexibility score than a single-measure strategy, since it inherently includes more future actions. This flexibility metric reflects only the strategy's planned adaptability, not an absolute limit, even a one-measure strategy could be expanded later.
-
Multi-objective trade-off. Evaluate each alternative across multiple metrics to understand trade-offs. We consider both robustness metrics (e.g., risk reduction, benefit cost ratio, regret-based measures) and adaptiveness metrics (effectiveness period and flexibility) for every strategy. For comparison, all metric values are normalized and, in our analysis, treated with equal importance. This allows us to compute an overall performance score for each alternative. Options that achieve a good balance across all criteria are deemed the most promising candidates for robust and adaptive planning. We did not run a computational multi-objective optimizer which would be typical if there were hundreds of options. Instead, we effectively enumerated and evaluated a small set of candidate solutions manually or with simple search, given the case study's scope.
-
Robust adaptive pathway. Formulate and select robust adaptive pathways. Using the information on each option's effectiveness period and flexibility, we identify sequences of actions that extend flood protection over time. We generate an adaptation roadmap by considering how the system could transition under transient scenarios. From the set of possible pathways, we then select a robust adaptive pathway that best satisfies the flood control objectives in the long term based on the multi-objective analysis from step 7. Along this pathway, we define key signposts – measurable indicators (e.g., a threshold of rainfall intensity or drainage failure rate) that signal when it's time to shift to the next course of action. Monitoring these signposts will support future decision-making and adjustments to the plan.
2.2 Methods of robust adaptive pathway procedures
2.2.1 Robustness analysis
Deciding on a robustness criterion is essentially a meta-decision problem (Herman et al., 2015). In our context, robustness of a strategy refers to its satisfactory performance across a range of uncertain future states. Various metrics can be used to evaluate course of actions' performance under uncertainty and identify those that are sufficient against a given criterion including Maximax, Maximin, Mean-variance, Starr's domain criterion, Laplace's principle of insufficient reason, etc. (Molina-Perez et al., 2019). Each metric embodies a different risk preference, so the choice of metric can influence which option appears most favorable (Giuliani and Castelletti, 2016). In this study, we adopted neutral risk aversion of Laplace's principle of insufficient reason as one robustness measure: in the absence of known scenario probabilities, we assign equal weight to all scenarios and identify solutions that perform best on average. It is important to note that while metrics like Laplace's principle provide a useful initial screening for sufficient strategies, they can be prone to corner solutions and may not fully capture multi-attribute challenges under deep uncertainty. The subsequent adaptive pathways analysis (DAPP) is therefore essential to complement this initial screening and build a resilient long-term strategy. The performance of option or combination a is depicted as Eq. (1).
where a∗ denotes the optimal option or combination, A is the set of all options or combinations (listed in Table 2), N is the total number of futures. Andf(a,wj) is the performance of option or combination a under future wj, which represents the expected flood risk associated with adaptation option or combination a under future wj, as generated from the flood-damage simulation model. This risk value forms the basis for evaluating robustness through indicators such as the ARRR.
In many robust decision-making frameworks, criteria related to satisficing and regret are used as performance measures (Herman et al., 2015). Regret is broadly the opportunity loss incurred by not choosing the optimal action in a given scenario – essentially, how much worse a strategy performs compared to the best possible outcome in that scenario. Satisfaction can be viewed as a measure of how well a strategy meets a predefined target (combining effectiveness and efficiency). In our evaluation, we compute these metrics relative to a baseline scenario or option. Equation (2) illustrates how we calculate regret-based performance for the alternatives.
where Pi is the performance value of average risk reduction rate (ARRR) of alternative options or combinations in all plausible futures N, f(a,wj) represents the performance value of pluvial flood risk of option a in future wj, and f(a0,wj) is the performance value of pluvial flood risk of the baseline option a0 in future wj.
Decision-makers also examine whether any given strategy has stressful scenarios – situations in which it fails to meet minimum acceptable performance. A threshold can be set to define what constitutes intolerable performance. Metrics like the domain criterion quantify the fraction of the uncertainty space (subsets of all futures) in which a solution meets all performance requirements. Such considerations align with policy risk indicators often used in practice (e.g., minimum safety standards or environmental protection criteria) to ensure options avoid unacceptable outcomes. Based on the elicitation of local requirements, we define the as the performance of average risk reduction rate (ARRR) which satisfies the minimum threshold of the given flood control target (F0, F0=0.7 in this case), as depicted in Eq. (3).
where represents the performance value of ARRR of the option or combination a in subsets s of all plausible futures N that meets the given flood control target F0. PRIM is applied to identify clusters of successful cases by searching across the full set of futures N for each option or combination. Specifically, for each option or combination a, we select the subset of future S that leads to the most successful outcome by balancing coverage and density with given flood control target F0.
Internationally, the net present value of benefits (PVB) and the net present value of costs (PVC) are commonly used to represent benefits and costs, respectively (Xie et al., 2017). In this study, PVB is selected as the pluvial flood risk reduction rate (RRR) before and after the implementation of the options, rather than as the pluvial flood risk reduction value. It is important to note that the goal of this study is not to calculate the direct risk of extreme pluvial flooding in the future, as the absolute value of the risk would be too large for meaningful comparison. Therefore, the benefit-cost ratio (BCR) is presented simply as the ratio of PVB to PVC.
2.2.2 Adaptiveness analysis
PRIM is an interactive statistical clustering algorithm that generates a series of subspaces by peeling away layers of the uncertainty space, where the coverage and density of points of interest in each box are greater than in the surrounding space (Matrosov et al., 2013). As a visualized tool for exploratory analysis, PRIM is widely used in many works to investigate either key factors causing system failure or stressful scenarios that might cause alternative options' failure. Parameters of coverage, density, and interpretability characterize the subspaces. These three metrics are usually correlated, with increasing density resulting in decreasing coverage and interpretability. It turns out that an analyst needs to trade-off in selecting the potential coverage, density, and interpretability to achieve the best combination. The subspaces describe the conditions beyond which coastal inundation impacts are unacceptable signifying adaptation tipping points are reached (Ramm et al., 2018a). Key factors along with the tipping point of options are evaluated in associated timeframes which need not be exact. Identifying an indicative period at which conditions describing adaptation tipping points indicate an effectiveness period (or use-by year) (Haasnoot et al., 2013). The results of PRIM can assist decision-makers in identifying sensitive ranges of uncertain factors or combinations, and factors with little influence can be safely disregarded.
Following a decision initially, flexibility in decision theory is related to the remaining choices available in the following period. The larger this set, the more flexibility the decision maker retains. This idea can be generalized to staged choices over multiple periods. For example, Erfani et al. (2018) proved that flexibility is valuable in providing decision nodes in multistage scenarios (planning periods in every 5 years) for least-cost water supply intervention scheduling. One way of assessing the value of flexibility is thus by comparing a flexible investment strategy against a strategy that scores highly on a static sufficiency metric but offers fewer future options (Kind et al., 2018). However, flexibility is not treated as delayed option value as other ROA work calculated, instead, we consider the convertibility of options that is still in line with the idea of wait-and-see yet is more straight-forward. It is important to note that a strategy initially implemented as a single measure does not preclude future augmentation if conditions worsen. In our framework, however, such augmentations were not pre-planned in single-measure scenarios. Therefore, our “flexibility” metric should be interpreted as the degree of planned adaptability, rather than an absolute limit on a strategy's potential to adapt.
2.2.3 Multi-objective trade-off
The cost and benefit of investment in adaption options may lead to a static decision-making perspective. Therefore, an important question was raised for robust decision-making of how to avoid failure scenarios regarding factors including risk reduction rates over time, cost of option, and economic benefit ratio. On this basis, making robust decisions needs to include other factors beyond cost and benefit, such as effectiveness period and flexibility, for a comprehensive evaluation in the long-term (Erfani et al. 2018)
The optimization of options' combinations can be identified via the trade-off process by Eq. (4).
where l∈L is a candidate adaptation pathway from the set of feasible pathways L; y1(l): Flexibility – number of successful alternatives reachable from pathway l; y2(l): Effectiveness period – duration before performance drops below threshold; y3(l): Benefit-Cost Ratio (BCR) – economic efficiency of pathway l; y4(l): Average Risk Reduction Rate (ARRR) – robustness of flood risk performance.
2.2.4 Robust adaptive pathway
Adaption tipping points (effectiveness periods) are central to adaptation pathways, the conditions under which an action no longer meets the specified objectives. The timing of the adaptation points for a given action, its effectiveness period, is scenario dependent. The DAPP, manually drawn based on model results or expert judgment, presents an overview of relevant pathways (Haasnoot et al., 2020). In this study, we first examined the effectiveness period of alternative options by PRIM analysis to identify acceptably robust adaptation pathway for future flood control. We then identified the combination of candidate pathways in consideration of both effectiveness period and flexibility, ensuring the adaptive solutions in incremental stages allow for maintaining flood control levels before committing to larger schemes. Roadmap of candidate's pathways are generated during this procedure. Lastly, the preferred robust pathway is determined by a trade-off analysis of all the criteria.
3.1 Background
Shanghai, with a domain of 6340 km2, provides residences to 24.9 million population with a built-up area of 1237.9 km2 in 2021. Shanghai has been perhaps the most important economic and financial center in China, and it now aspires to be one of the world's most important economic, financial, shipping, and trade centers (Shanghai Statistical Bureau, 2021). Shanghai is surrounded by water on three sides: the East China Sea to the east, the Yangtze River Estuary to the north, and Hangzhou Bay to the south. In addition, the Huangpu River, a Yangtze River tributary, flows through the heart of Shanghai. The average yearly precipitation is approximately 1400 mm in recent 10 years, with 63 % concentrated during the flooding season from May to September. As a result, the most catastrophic hazard in Shanghai has been floods produced by torrential rainfall, which annually disrupts transportation and other social activities, causes substantial economic losses, and threatens urban safety.
Shanghai has the lowest elevation (with averagely 4 m a.m.s.l.) and large numbers of old-lane residential buildings in central city, which have fewer floors compared to other districts that is vulnerable to the extreme pluvial flood events see Fig. 2). The spatial distribution of rainfall will continue to concentrate in urban areas, and the increasing likelihood of extreme precipitation (Liang and Ding, 2017), combined with the trends of relative sea-level, will cause stakeholders, includes residents, policymakers, and scientists etc., to be concerned about the rising flooding risk in delta cities of Shanghai (Du et al., 2020).
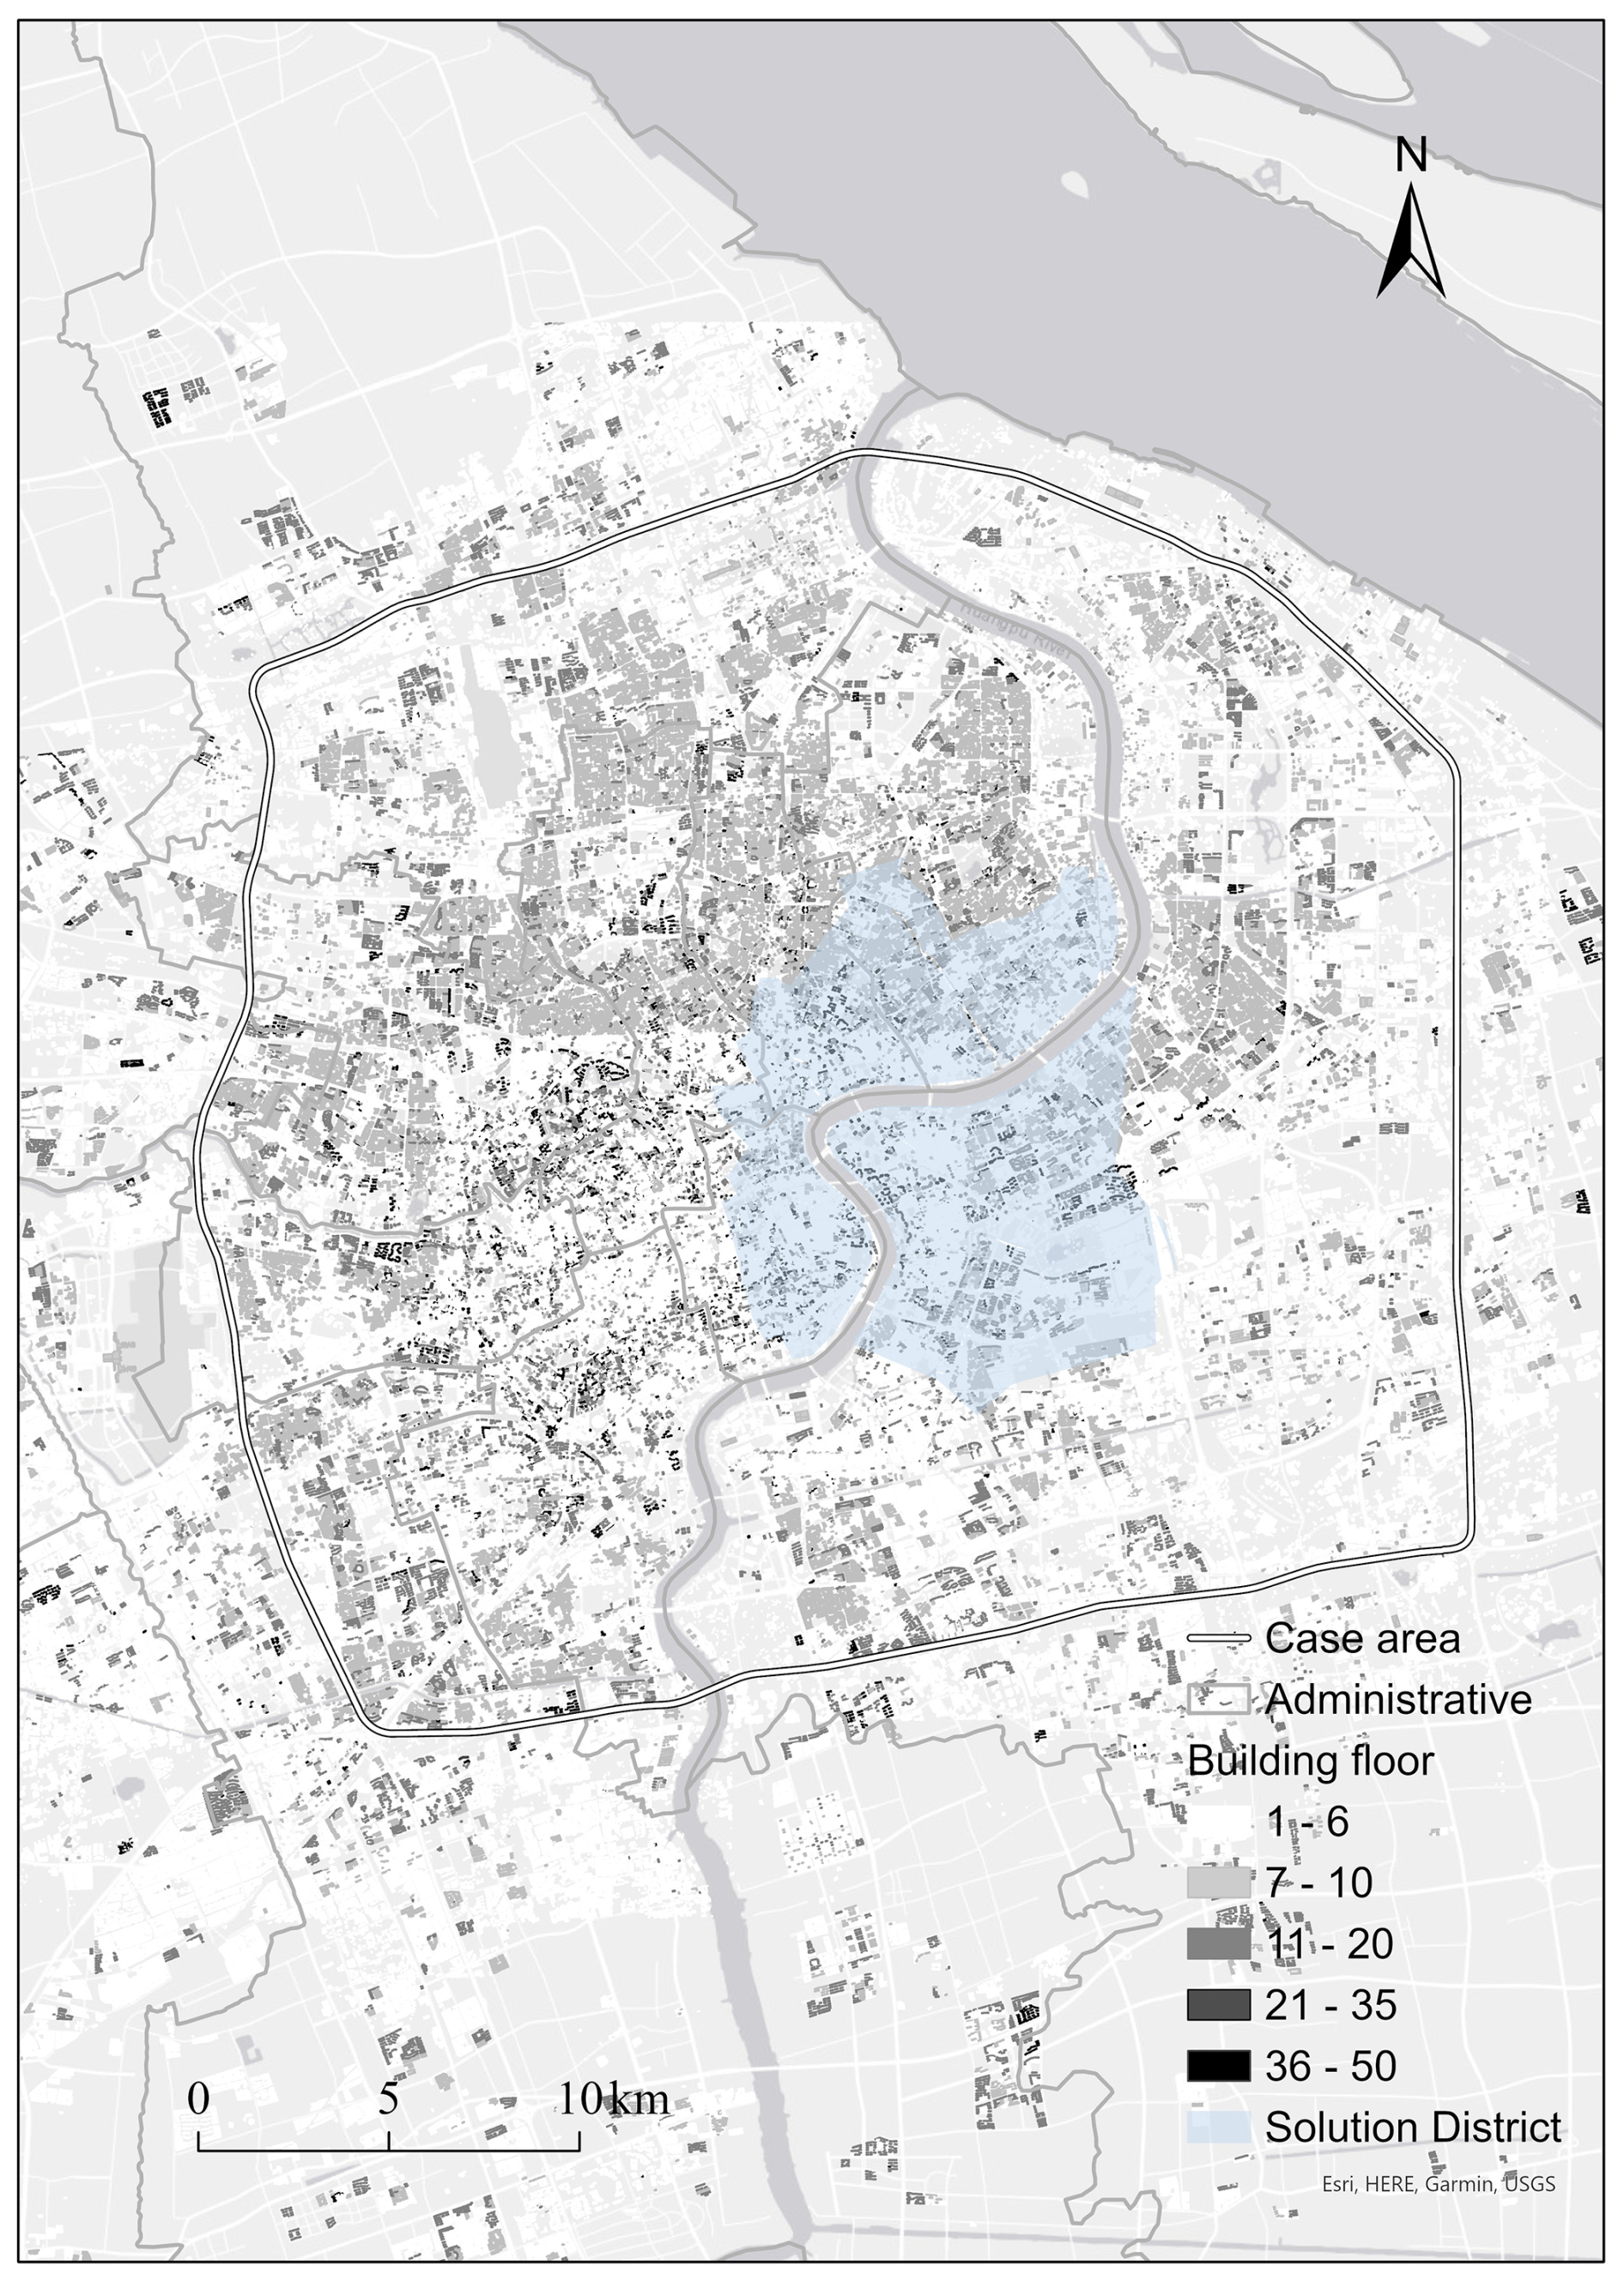
Figure 2Case area, administrative, and solution district (blue shade) in center Shanghai, including spatial distribution of building footprints indicating the number of stories (gray shades), the base map was provided by Esri, using ArcGIS Online Services.
3.2 Research Framing
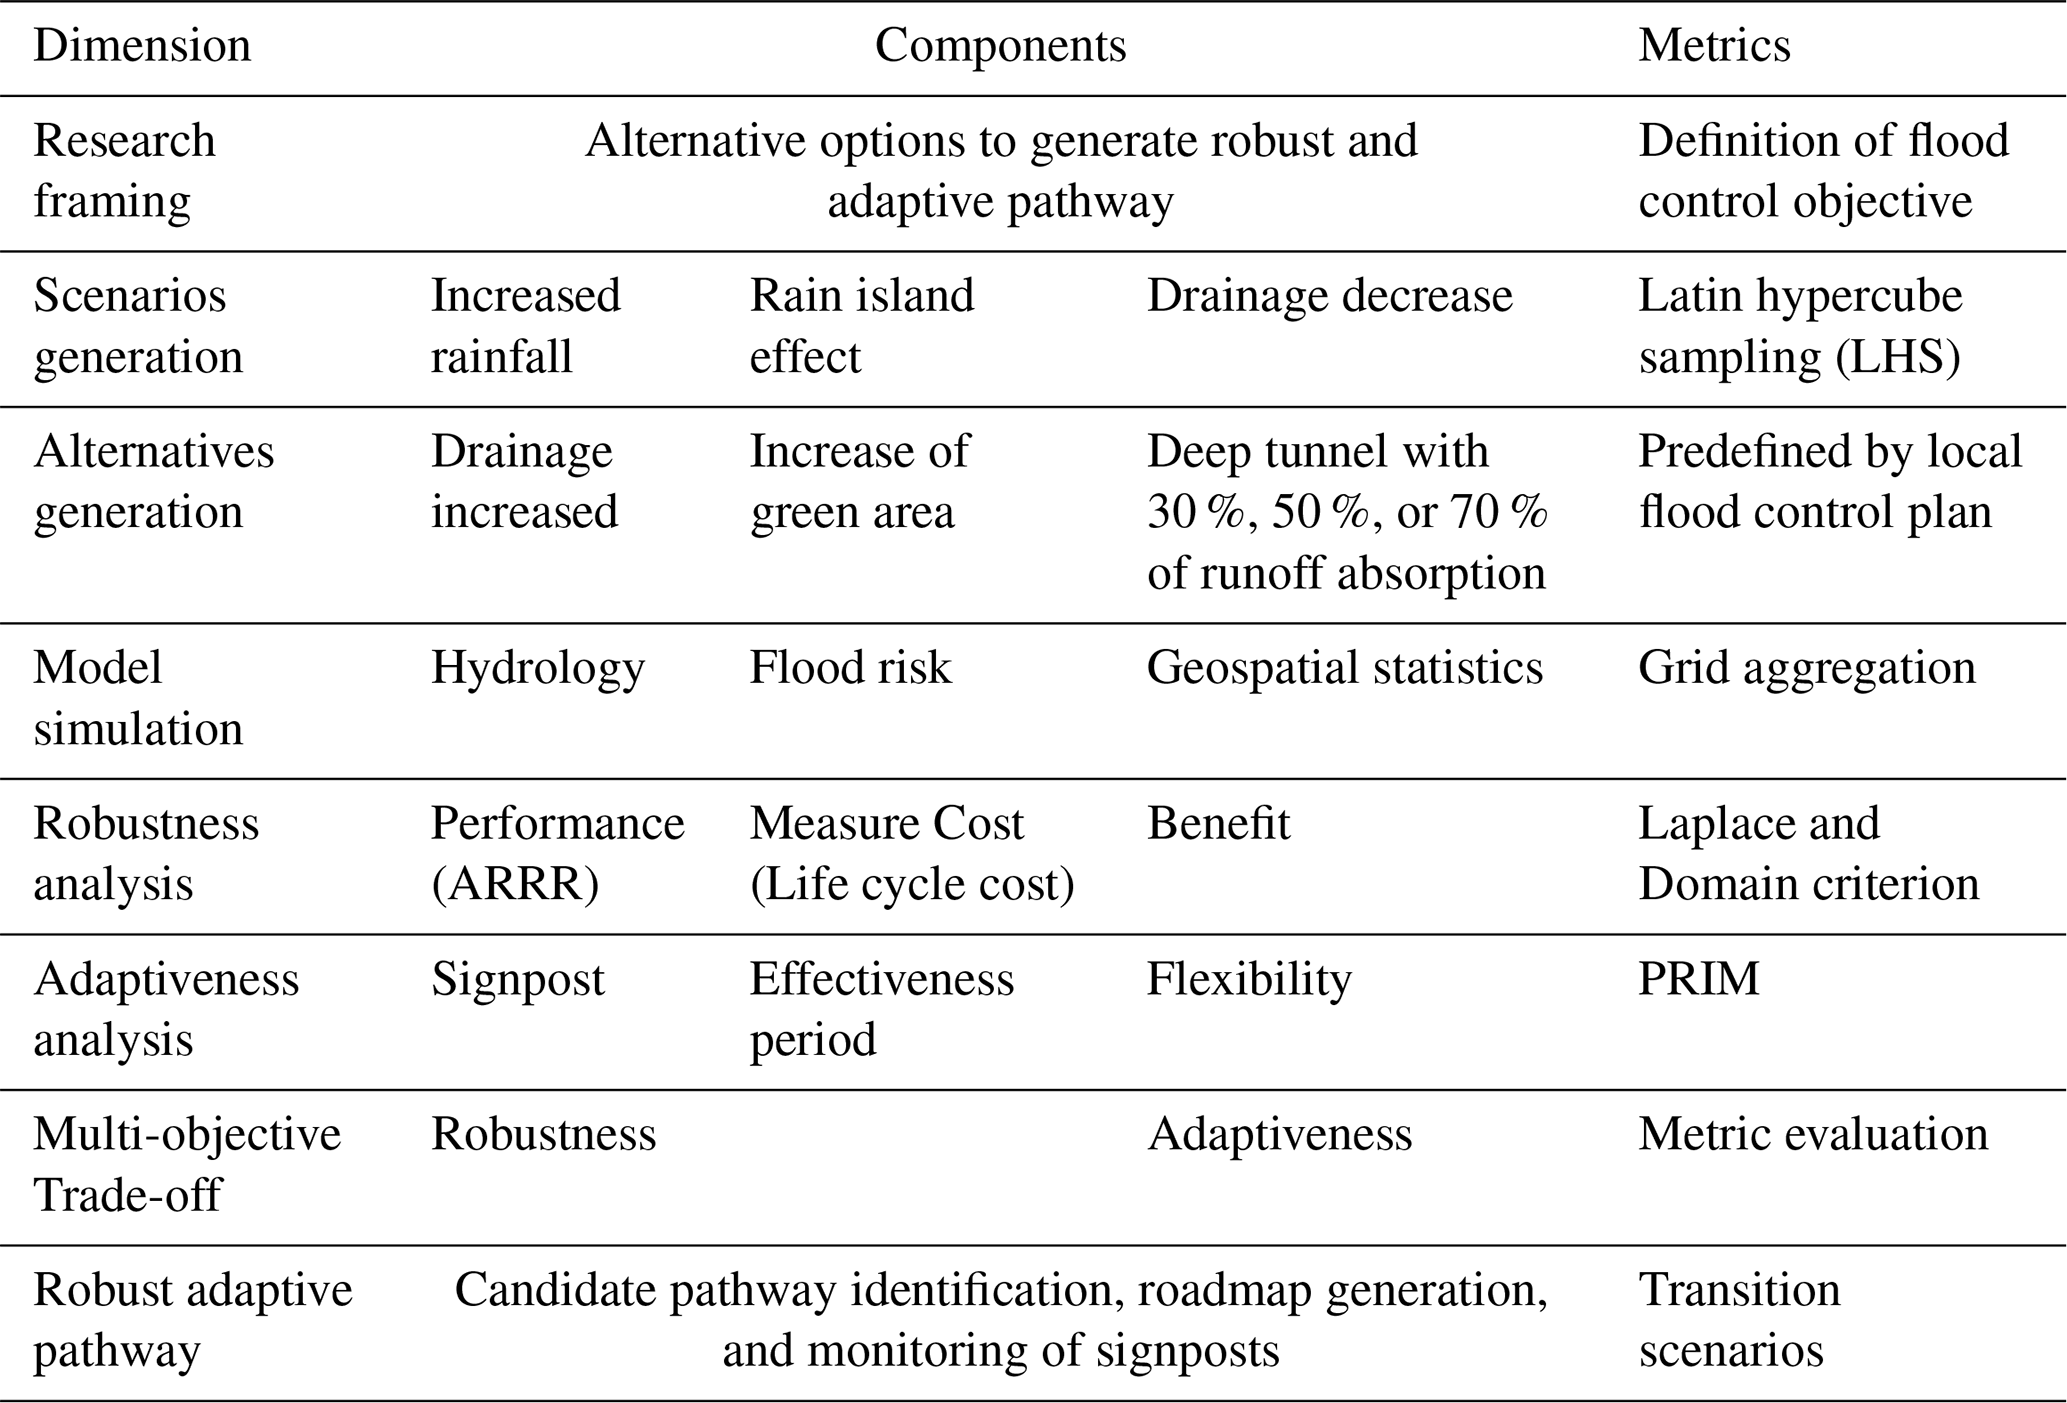
Based on the proposed framework, the dimensions, components, and metrics of this study are organized as shown in Table 1. To ensure urban safety, this study defines an explicit flood control objective of achieving a 70 % average risk reduction rate, in alignment with the Shanghai Flood Control and Drainage Plan (2020–2035) (Shanghai Municipal Water Authority, 2020).
The robustness analysis serves as the foundation of our methodology, ensuring that the proposed options can meet the sufficiency criteria under future uncertainties. Once robustness is assessed, we proceed to the adaptiveness analysis, which allows us to account for flexibility in response to unforeseen challenges. We conduct a trade-off analysis in terms of robustness and adaptiveness was of particular significance to providing iterative stress tests over many plausible scenarios using robustness metrics and identifying effectiveness periods and flexibility to generate alternative pathways. Following the structure of robust decision-making pathway framework, Fig. 3 illustrates the entire procedures for long-term flood control planning in the Shanghai case study.
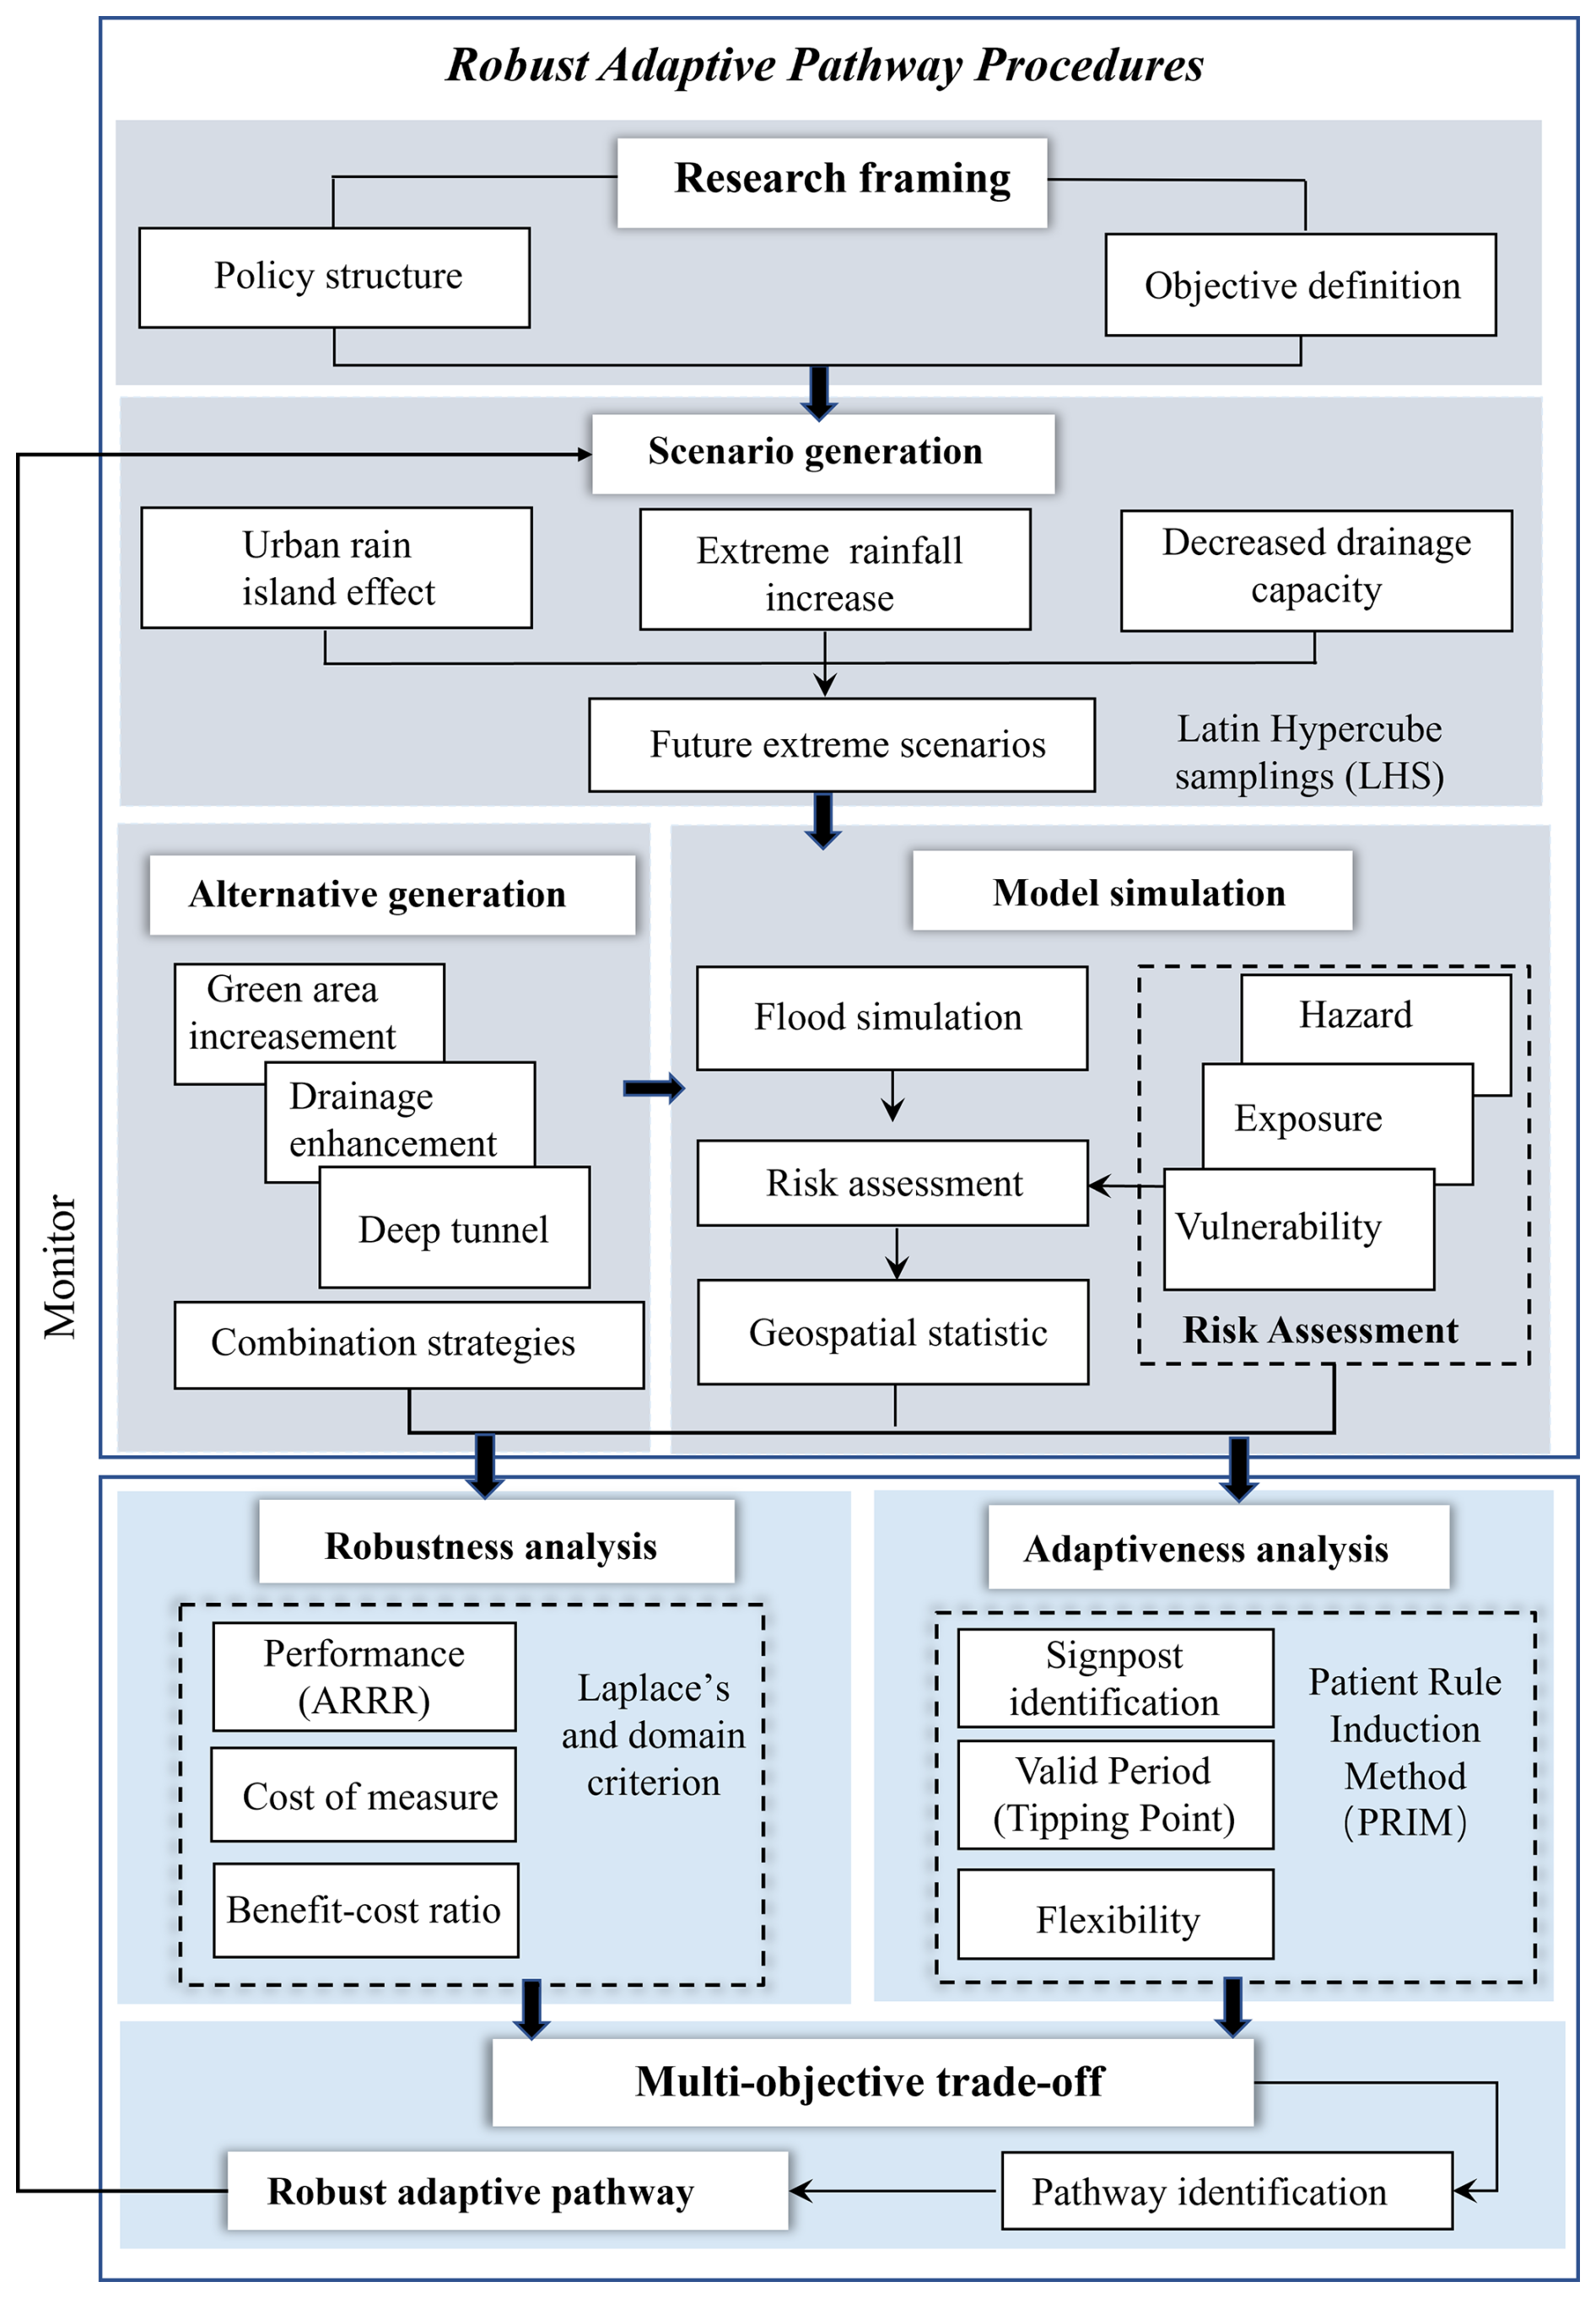
Figure 3Framework of robust adaptive decision-making pathway, which incorporates the robustness, adaptiveness, multi-objective trade-off, and pathway generation (blue boxes).
3.3 Scenario generation
Precipitation is predicted very likely to increase in the Yangtze River Basin in the 21st century (Hui et al., 2018), and the frequency and intensity of extreme rainstorm events may continue to increase (uncertain factor of the α, future rainfall assumed to increase from 7 % to 18 %). Shanghai's spatial rainfall patterns reveal a significant “rain island effect” between urban centers and suburbs (Liang and Ding, 2017) (uncertain factor of the β, assumed to increase from 10 % to 20 % in central region (Xujiahui and Pudong rain gauges), decrease from −0.076 % to −0.038 % (other 9 rain gauges in Shanghai)). In addition, land subsidence has been a persistent issue due to the groundwater exploitation and construction of high-rise buildings (Yang et al., 2020). By 2050, it is projected that the current river embankment and drainage systems in Shanghai will experience a 20 %–30 % reduction in capacity due to a likely relative rise in sea level of 50 cm (compared to the year of 2010), caused by both sea level rise and land subsidence (Wang et al., 2018). The uncertain factor of the decrease of drainage capacity (γ, assumed to decrease from 0 % to 50 % due to the anthropogenic land subsidence and sea level rise) is designed to be the degradation effect of restraining the water from the urban drainage system flowing to the river system due to the high river water level caused by the continually rising sea level, land subsidence, and other degradation factors.
This study focused on a record-breaking convective rainfall that occurred on 13 September 2013 and had an intensity record of 140.7 mm within 3 h (at 17:00–19:00 Beijing time). The variation interval of each uncertainty factors was clarified, and Latin Hyper Cube Sampling (LHS) was used to construct 100 plausible futures based on the historic “913” extreme rainfall event in 2013 (Sect. S1 in the Supplement).
3.4 Alternative generation
It is acknowledged that the current Shanghai flood control infrastructure is insufficient to protect the city from long-term inundation risk (Shanghai Municipal Water Authority, 2020). Three options, drainage improvement, increase of green area, and construction of deep tunnel, are pre-defined with stakeholders of experts and decision-makers following the Shanghai Flood Control and Drainage Plan (2020–2035). The solution district locates in the core business district (CBD) of Shanghai and is highlighted in Fig. 2. We defined the existing structure of flood control measures as the baseline and evaluated alternative measures' performance verse the baseline control level in the flood simulation model (Table S4).
3.5 Model simulation
Simulations of extreme pluvial flood inundation under climate change scenarios are carried out using the Shanghai Urban Inundation Model (SUIM) (Sect. S2 in the Supplement). It was created to couple multiple simulation processes, which consists of the SCS-CN hydrological model, statistical analysis of flooding results, risk assessment, and assessment of adaptation measures. Appropriate socioeconomic indicators were selected to characterize the exposure of the elements at risk and the vulnerability curve to evaluate the flood risk in all plausible scenarios (Sect. S3 in the Supplement). We then coupled the hydrological module and risk assessment module to assess the future risk (Sect. S3 in the Supplement). Three climate adaptation options are quantitatively characterized in the risk assessment system. The benefit-cost ratio (BCR) of all options is calculated according to the performances of the risk reduction rate over the life cycle cost (Sect. S4 in the Supplement).
4.1 Robustness analysis
This section presents the performance evaluation results, including average risk reduction rate (ARRR) and Benefit-cost ratio (BCR), to reflect the robustness of potential climate adaptation options (Sect. S4 in the Supplement). BCR was defined as the average risk reduction rate (ARRR) per unit cost (Sect. S4 in the Supplement) based on the robustness metrics of Laplace's Principal of Insufficient Reason. Specifically, the benefit is the reduction in expected flood losses compared to the no-action scenario (Eq. 3), while the cost refers to the total implementation cost of each adaptation option (Sect. S4 in the Supplement). Given that drainage capacity reduction (γ) is the main factor affecting the solutions' performance, thus the study selects γ as the only explanatory indicator to explore the failure scenario of options based on the PRIM method.
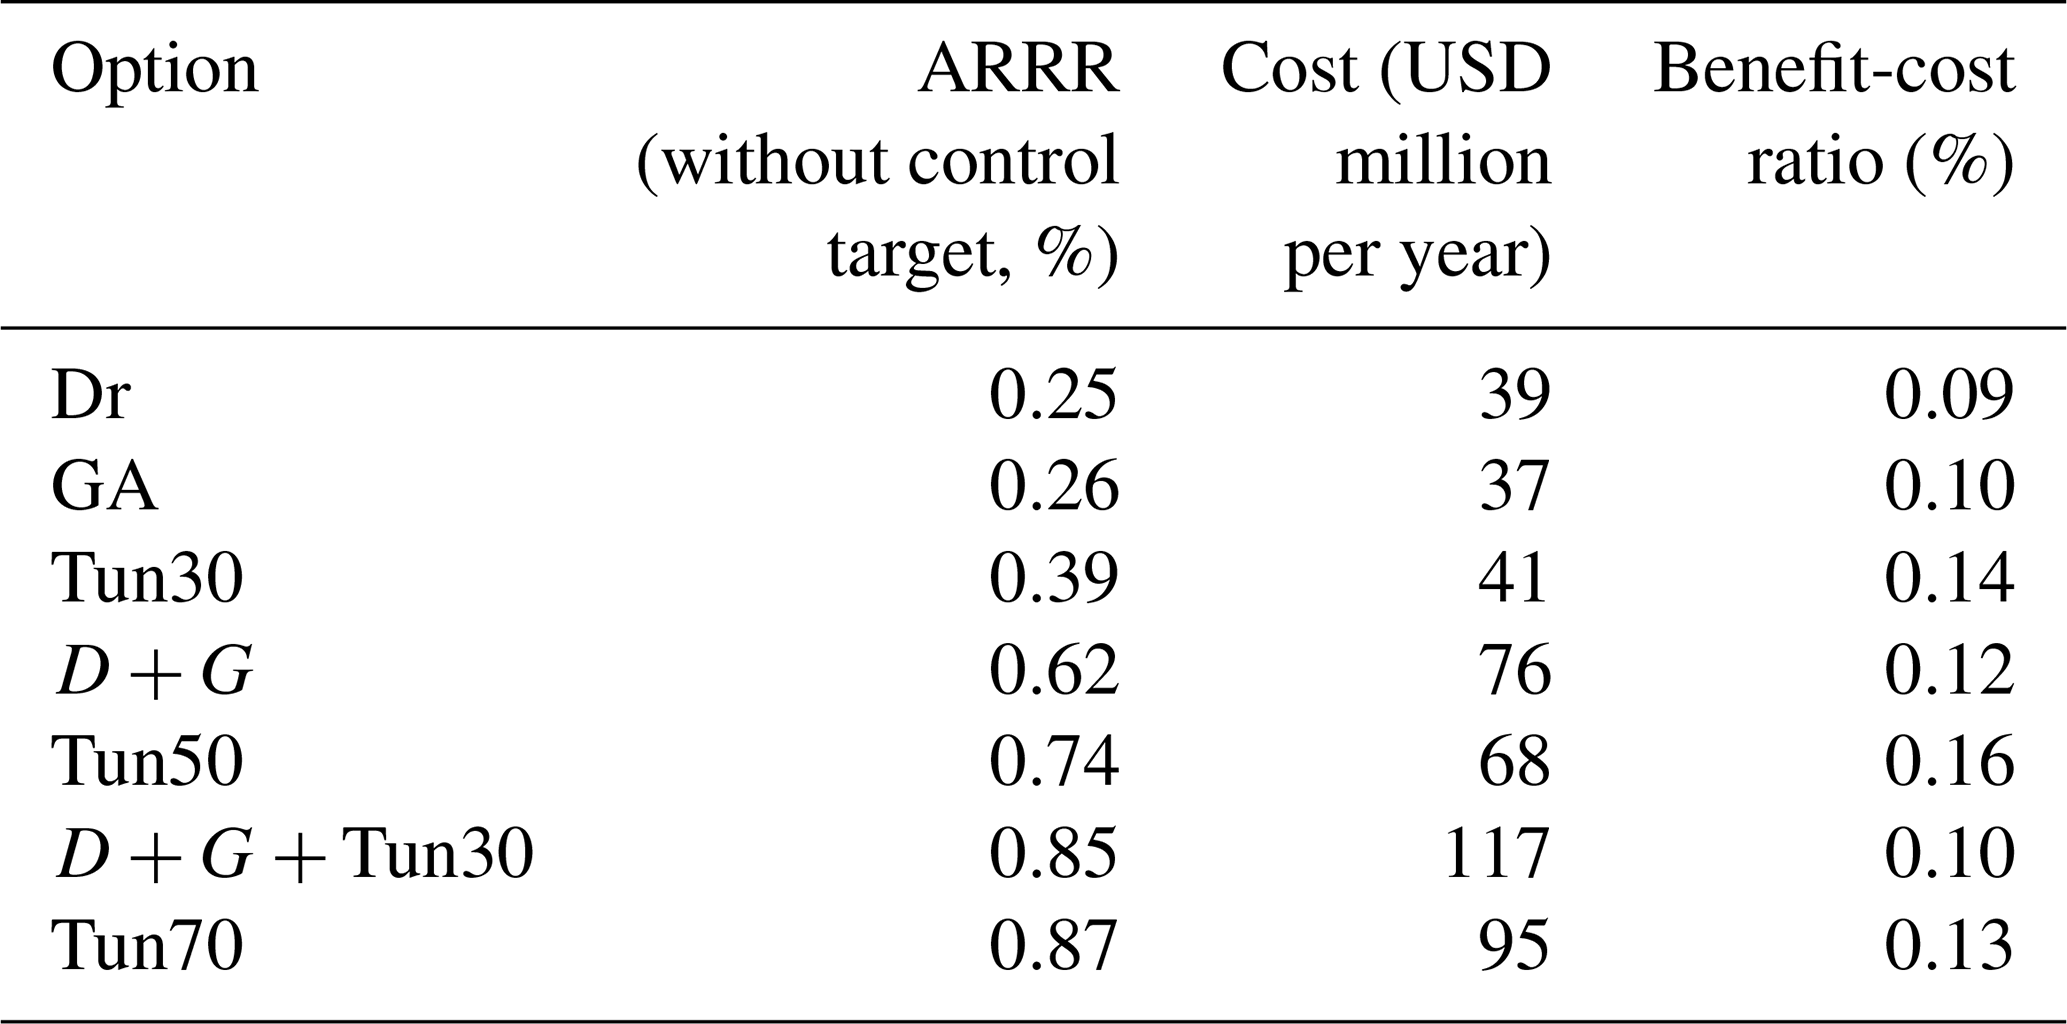
As depicted in Table 2, the ARRR is calculated (Eq. 2) to analyze the effectiveness of (the combination of) options. The average yearly cost of single options, which includes increasing drainage capacity (Dr), expanding green areas (GA), and constructing a deep tunnel with 30 % runoff absorption (Tun30), is at a comparative level, ranging from USD 39 million to 41 million per year. Their performance is relatively unsatisfactory (the ARRR is less than 0.39.) However, the ARRR for the combined option (D + G), drainage improvement and public green area, is higher (0.62) than the sum of two single options (0.51), indicating that the composite option will be more effective of reducing flood risk. Furthermore, it demonstrates that the combined options (i.e., D + G and D + G + T30) are satisfactory in terms of ARRR performance but not economically attractive due to their relatively higher costs. While two single-option involving deep tunnel (namely Tun50, Tun70) seem very attractive in terms of both ARRR and BCR. It is noted that if an option defers a major investment (like the Tun30) to later years, in reality its present value cost would be lower with discounting, potentially making the strategy more economically attractive than our simple BCR suggests.
Table 2The ratio of the benefit-cost of each adaptation options.
4.2 Adaptiveness analysis
Scenario discovery validates the decrease of drainage capacity is the most critical uncertainty in defining the risk reduction rate of performance objective. The failure scenarios are identified when the flood control target F0 = 0.7 is not met. We further interpret failure scenarios by selecting subspace of each alternative options under flood control target using PRIM algorithm to optimize the combined value of coverage and density. Table 3 summarizes these metrics, where coverage and density are derived from PRIM-identified failure boxes, and ARRR is calculated as the average performance within those clusters. The valid period is defined by the point (characterized by γ) when a single option or combination no longer meets the performance target.
Table 3ARRR and coverage and density of success scenarios in each option combinations under 70 % risk reduction control standard.
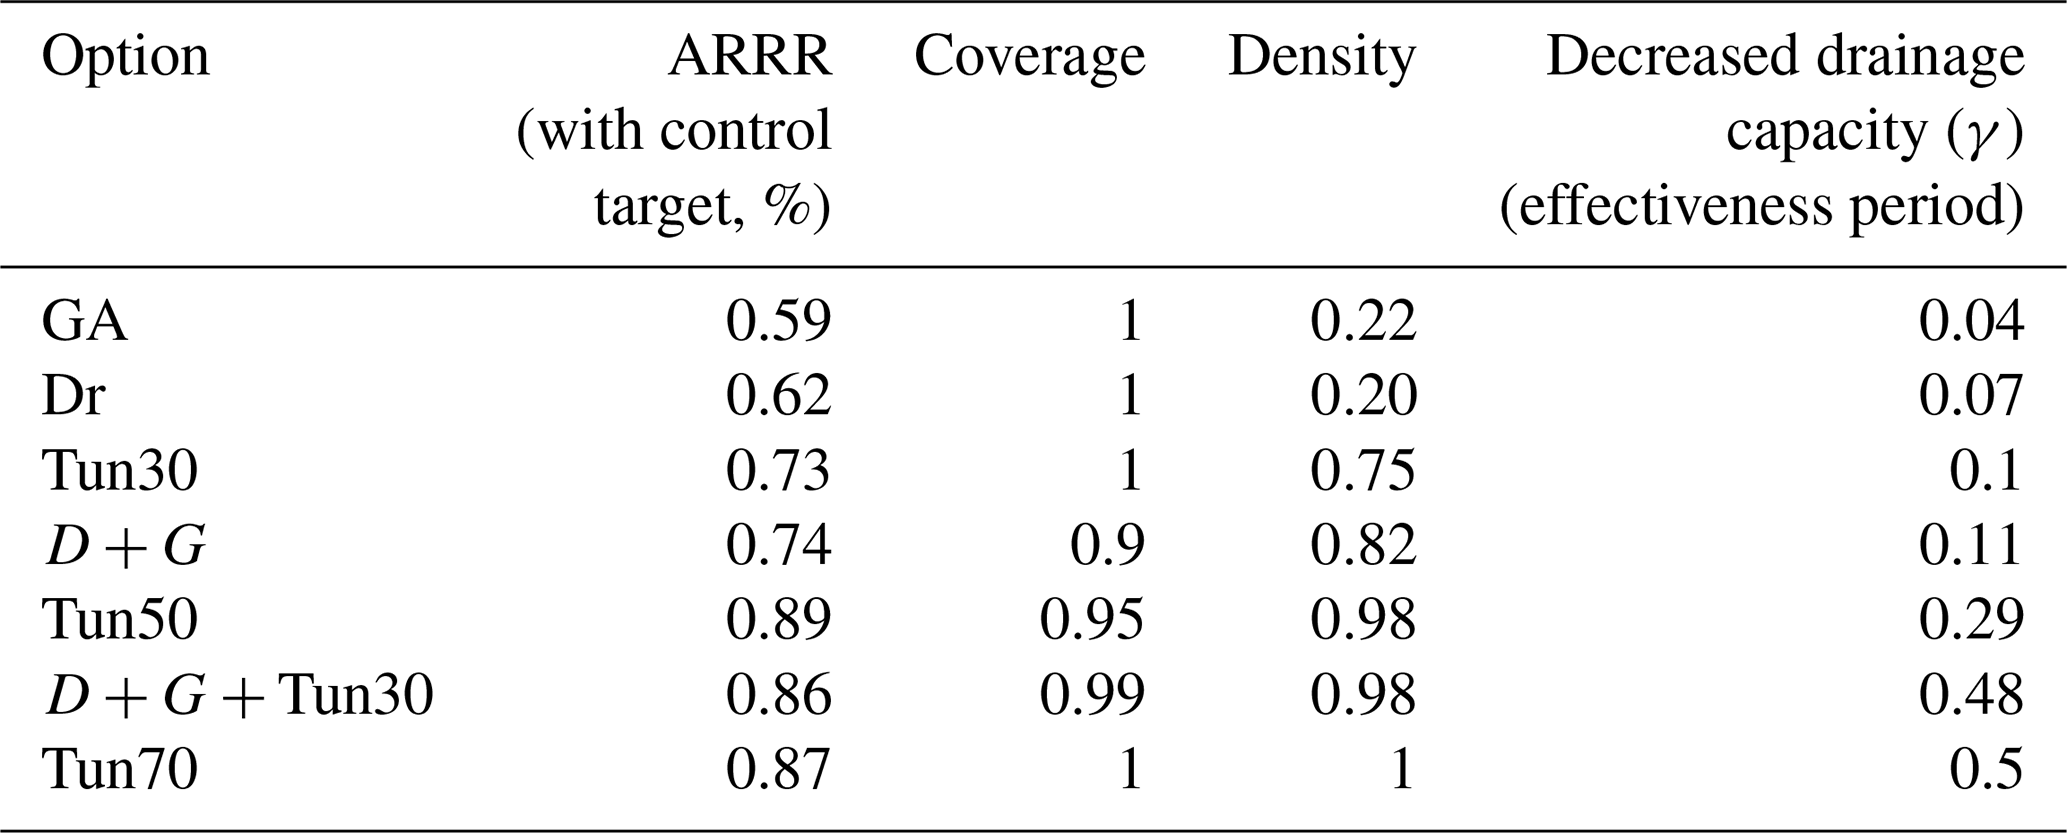
According to the results in Table 3, it was found that within the 70 % risk reduction control target (Eq. 3), the single options of Dr and GA performed less favorably (relatively smaller ARRR) and can quickly fail to meet the risk reduction target (with no larger than 0.1 of γ). Tun30 and D + R are very comparative since they preform very closely (similar results on ARRR and γ) but still not attractive. While Tun50 seems very attractive in terms of ARRR (0.89), however, it does not possess higher effectiveness period (γ) than both D + G + Tun30 and Tun70. Surprisingly, both D + G + Tun30 and Tun70 can function well in an effective way for a longer time. So far, D + G + Tun30 and Tun70 have proven to be highly competitive in terms of cost-effectiveness and effectiveness period over time.
We define flexibility as the number of transitions by enumerating overall option combinations regarding adaptive transferable pathways from the original option (current flood control infrastructure) to the destination options (e.g., D + G + Tun30 and Tun70, Fig. 6). For example, the D + G + Tun30 comprises three single options, allowing it to begin with any of the three and delay further action until a tipping point approaches, giving it a convertibility score of three (Table S6). Therefore, each single option has a value of one for convertibility.
4.3 Multi-objective trade-off
An analysis focused solely on static performance metrics (e.g., ARRR and BCR) would rank options like Tun50 and Tun70 as the top performers. In contrast, an analysis that also incorporates adaptive characteristics (effectiveness period and flexibility) reveals the advantages of a pathway like D + G + Tun30. These differing outcomes demonstrate why moving beyond a single-metric assessment to a multi-criteria evaluation is crucial for identifying course of actions that are sufficient over the long term. Only by considering all metrics simultaneously can we identify strategies that strike an appropriate balance for long-term flood management. Multi-objectives of (the combination of) options consider all four metrics, including BCR, and performance of the risk reduction control criteria (ARRR > 70 %), effectiveness period (γ), and the flexibility. We solve the multi-objective problem using normalized and equally weighted metrics (Eq. 4). Figure 5 depicts the results of BCR, ARRR in control criteria, effectiveness period, and flexibility of each option's combination. The higher the normalized rating, the greater the payoff. The outcome demonstrates that both GA and Dr perform poorly, whereas Tun30 and D + G are not robust enough compared to Tun50, D + G + Tun30, and Tun70. It needs to be highlighted that Tun50, D + G + Tun30, and Tun70 possess high priority. We found that the D + G + Tun30 pathway achieved a well-balanced performance across risk reduction, cost-effectiveness, and our flexibility metric (Table S7). In our initial analysis, this made D + G + Tun30 appear as the most promising option overall. However, as discussed, this planned flexibility advantage does not necessarily mean a single-component strategy cannot be adapted later. It is important to note that this conclusion is contingent on including the flexibility metric. If flexibility were defined differently or given less weight, another option – for example, the single large tunnel Tun70 – could emerge as preferable for long-term risk control.
4.4 Robust adaptive pathway
4.4.1 Pathway identification
The candidate pathway was identified by enumerating the possible combinations of options. In this study, we found two potential pathways including from Tun30 to Tun70, and from Dr or GA to D + G + Tun30. It can be observed from Fig. 6 that when γ increases, the performance of options of Dr (or GA, vice versa) steadily diminishes until the risk control target are not satisfied.
The drainage capacity, affected by the compound event of land subsidence, sea level rise, and storm surge, is deemed to be undermined (which is reflected by drainage capacity reduction rate γ) over time. Figure 6 illustrates the concept of an option combination's effectiveness period using Dr + GA + Tun30 as an example. ARRR to begin with Dr is 0.62, with an increase in γ, Dr fails (γ = 0.07), and ARRR will decrease further if no additional options are taken. The addition of GA can increase the ARRR to 0.74 before Dr and D + G fail (γ = 0.11). The ARRR will continue to decrease if options are not strengthened. Before D + G completely fails, incorporating Tun30 can increase the ARRR to 0.86; as γ increases, D + G + Tun30 fails at γ = 0.48. To ensure the adaptive robustness of the combination of options, decision-makers can increase the service coverage area and rainwater absorption capacity of the deep tunnel project in the core area prior to the total failure of D + G + Tun30. In other words, the transition from Tun30 to Tun50 and even Tun70, along with the combination of options, will be stable over the long-term time horizon. It is noted that the slight rise in performance after GA and Tun30 installation reflects a short ramp-up period in our model, during which newly implemented measures gradually reach full effectiveness, then performance begins to decline as expected under continued climate-induced stressors.
The differing curvature of the performance decline is due to the interaction of measures. For the Dr-only strategy, once implemented, its risk reduction gradually diminishes at an accelerating rate as climate stressors intensify – producing a concave-down curve (initially gentle slope, steepening later). In contrast, the strategies with multiple measures (D + G and D + G + Tun30) show a more linear decline. This is because when drainage alone begins to lose effectiveness, the next measure (GA, and later Tun30) either has just been implemented or is concurrently mitigating risk, effectively offsetting some of the non-linear drop. The combined result is a more steady (approximately linear) decrease in performance over time, as the measures' effects complement each other. We normalized time as γ = (with T = 50 years, the simulation period), so γ corresponds to the year 2070.
4.4.2 Pathway generation
We comprehensively evaluated the candidate pathways by considering performances, BCR, effectiveness period, and flexibility. The time frame lacks an absolute time reference but still offers a relative tracking of the rate at which relative sea levels are rising.
Figure 7 depicts two robust transition pathways: D + G to D + G + Tun30 and Tun30 to either Tun50 or Tun70. The two pathways D + G + Tun30 and Tun30 to Tun70, provide adaptive short and long-term pathway schemes from a flexibility standpoint. The short-term options are used as transitional schemes, and new options can be added before their failure, i.e., pathway transition, to maintain the risk control objectives. In addition, the two schemes can complement each other and incorporate new options before the system's long-term robustness is compromised. Additionally, D + G + Tun30 and Tun70 leave room for upgrading to the costlier and more durable D + G + Tun70 in the long run when γ exceeds 0.5 (e.g., sea level or land subsidence exceeds observing increase speed).
We observed that Tun70 offered the highest robustness in terms of ARRR and the longest effectiveness period among all single options. However, its lack of initial flexibility – requiring a large up-front investment in gray infrastructure – could lead to path dependency if future conditions turn out to be mild. In contrast, strategies that start with smaller measures (like Dr or GA) and can add on bigger projects later avoid that risk of over-commitment. This underscores the classic tension in planning: a strategy like Tun70 is robust but inflexible, whereas a phased approach is flexible but may initially be less robust. Our framework attempts to balance these aspects by evaluating both. In conclusion, A promising robust adaptive pathway should initially begin with GA and Dr, followed by a combination of D + G. Ultimately as time goes by with gradually undermined drainage capacity, it should incorporate Tun30 with the flexibility to expand to Tun70.
5.1 Key findings
Applying this framework to the case of the reoccurrence in the 2050s (of the extreme rainfall events on 13 September 2013) in Shanghai reveals informative findings to urban planners and other stakeholders. First, the performance of climate adaptation options (for addressing pluvial flood risk) decreases as the drainage capacity reduction rate (γ) increases (Table 3). This result is indirectly supported by events in June 2015 and July 2021, which caused severe inundation in central Shanghai for days because the high water levels of rivers in the region prevented rainwater from being pumped or drained from the drainage system into the river network. This finding also suggests that drainage capacity is a key determining factor for the performance of options in other delta cities which may rely on discharge to the rivers (e.g., Guangzhou, Ho Chi Minh City, London, etc.) (Hu et al., 2019). Urban planners in those cities need to consider scenarios of high-water levels in the river with a joint of extreme storm surge under typhoon takes place in a high astronomical tide period at estuary. Such an event would significantly undermine the drainage capacity thus leading to severe flooding inside the city and bringing potential disastrous impacts (e.g. Zhou et al., 2019).
Second, as the drainage capacity decreases (γ), effectiveness periods of different option combinations varied significantly, showing a discrete distribution, which ranged from 0.04 to 0.5 with a corresponding ARRR ranging from 0.59 to 0.89 (Table 3). Moreover, the most cost-effective solution may not always offer the longest effectiveness period within an explicit flood control target (e.g. 70 % risk reduction as a target in our case study), and therefore cannot be considered satisfactory (Fig. 5). The findings highlight the importance of the discussion regarding the long-term robustness of solutions which has been overseen in many flood- risk control works in delta megacities. It is also further implying that if there is no consideration of the flood risk reduction target, discussions about a robust decision plan with stakeholders is meaningless. This urges to pay great attention to be proactive by strengthening the dynamic pathway and closely monitoring the decrease of the drainage capacity ahead of the pace of relative sea level rising (Fig. 6).
5.2 Robustness and adaptiveness trade-off
The comparison in Sect. 5.1 brings up a vital decision-making issue on the trade-offs between the benefit and cost of alternative options. In general, options with better performance required higher costs, which was also proved in any distinctive option in Tables 2 and S6. It is also demonstrated that the combination of alternative options such as D + G showed a better performance than the single option of Dr and GA at the same cost. However, the cost of an option is not strictly proportional to its benefit (risk reduction rate) (Fig. 4). For instance, Tun50 possesses better performance in reducing inundation risks associated with the relatively low yearly economic cost compared to D + G. Because it is difficult to measure the pros and cons of the costly solution to maintain a higher protection standard and economical solution to possess an acceptable performance (cost-effectiveness), planners typically underestimate both influences by a large margin.
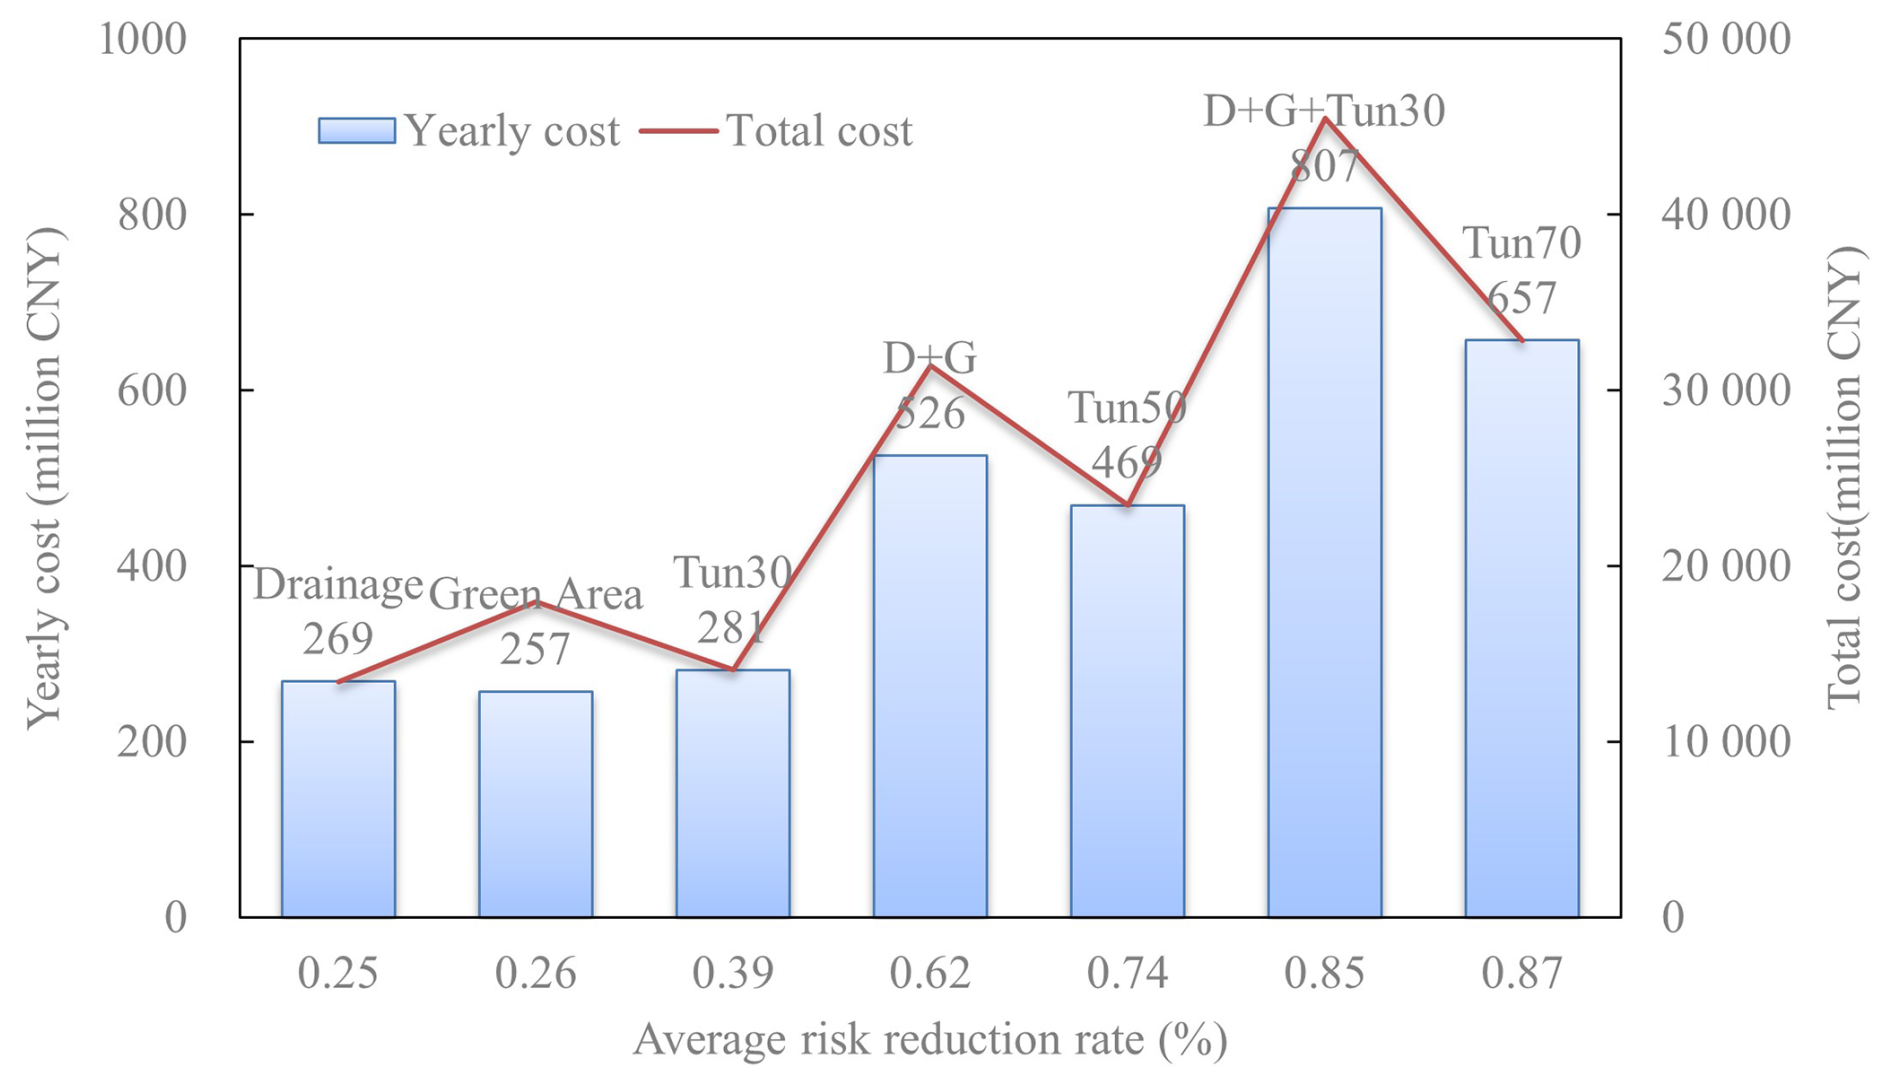
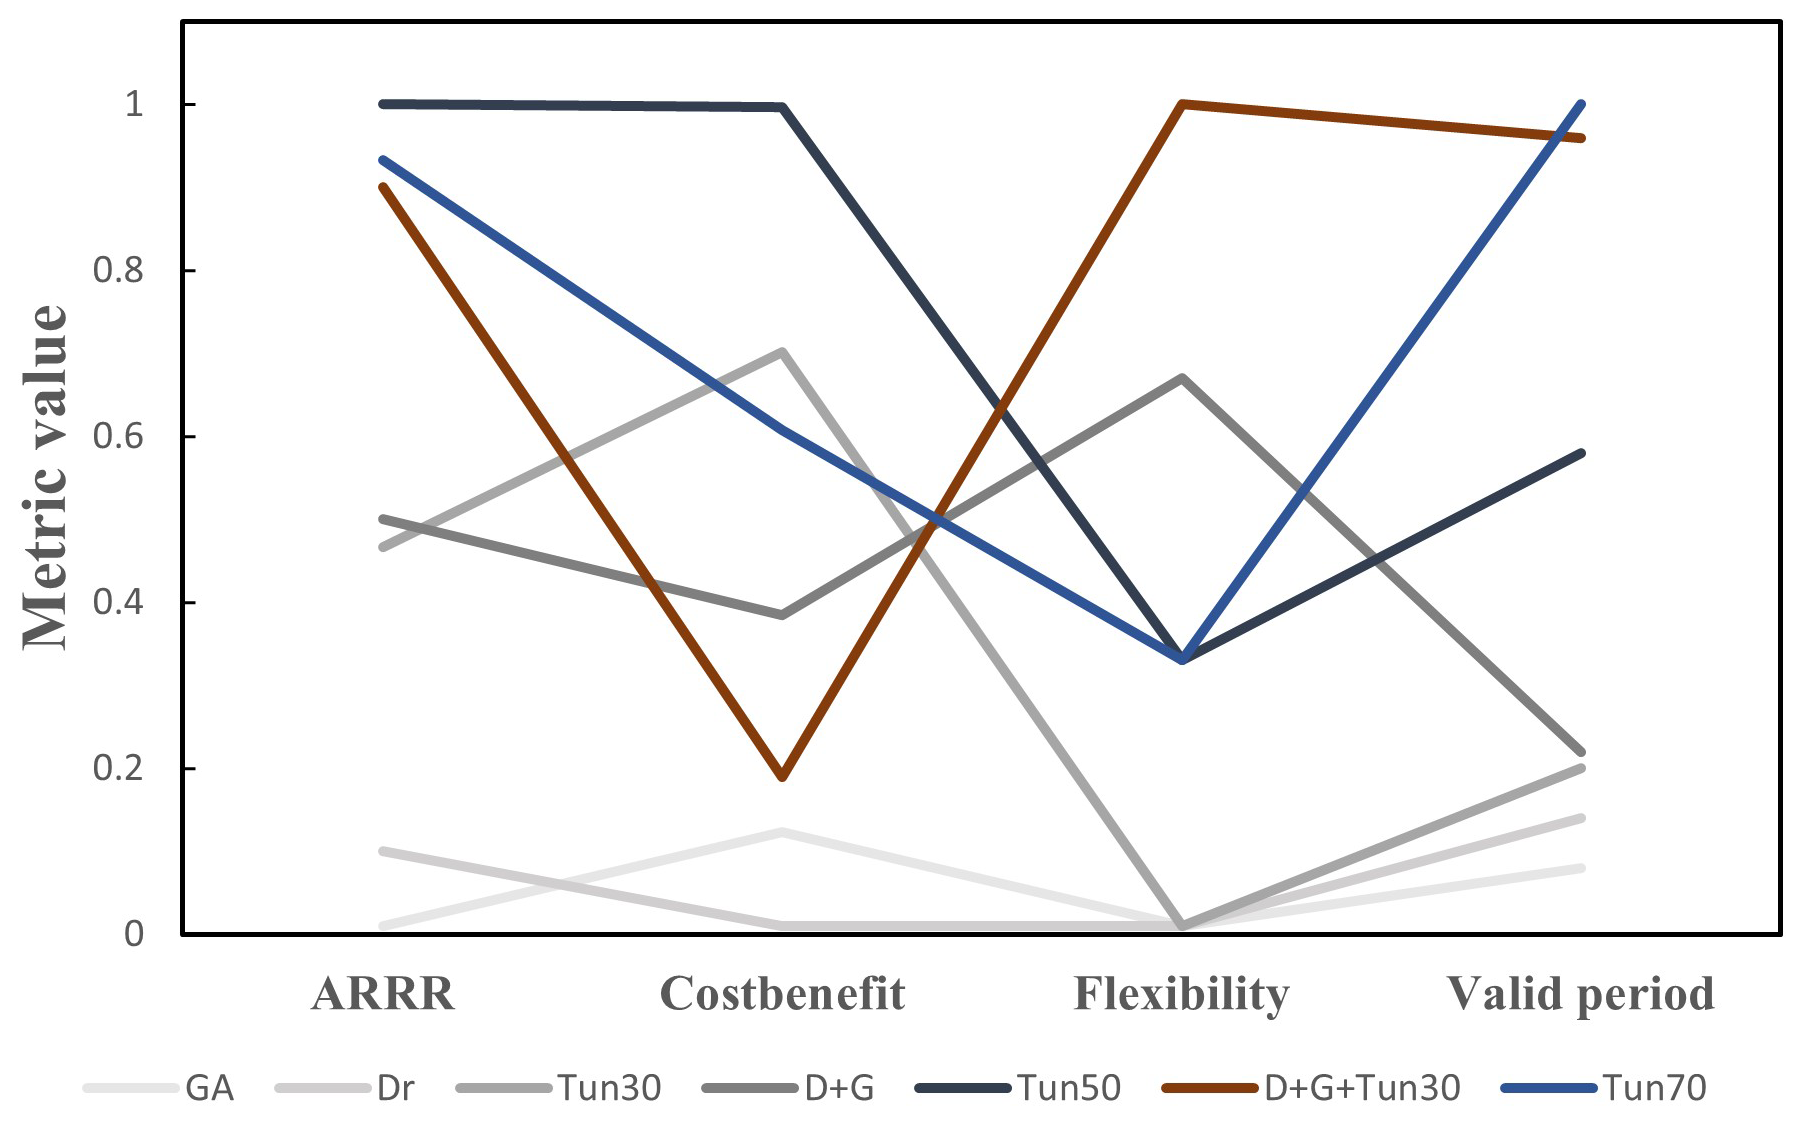
Figure 5Multi-objective trade-off of alternative options with normalized value of robustness and adaptiveness metrics (the preference of priority is accepted from low (bottom) to high (top)).
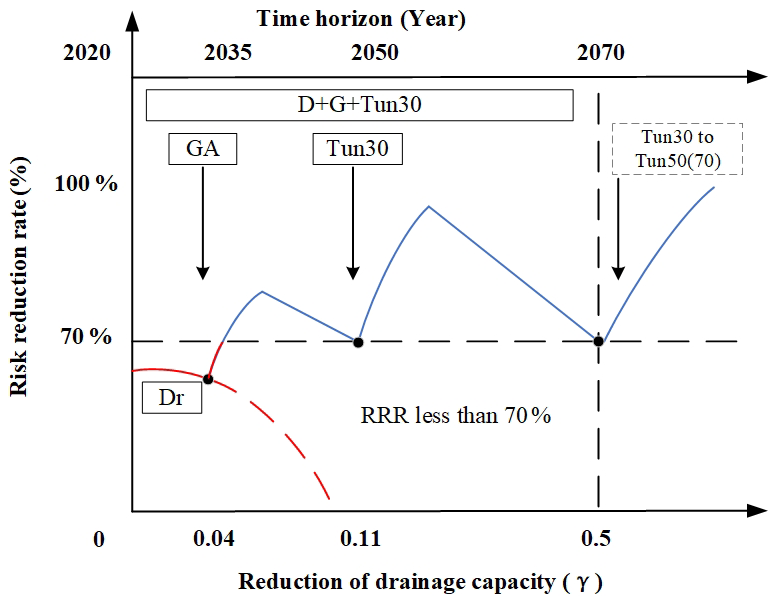
Figure 6Flexible pathway of combination options of drainage improvement (Dr), green area increment (GA), and deep tunnel with 30 % absorption (Tun30), representing the risk reduction rate undermines with the reduction of drainage capacity. An example of Dr + GA + Tun30. γ is a dimensionless time, where γ = 1 corresponds to Year 2070, the end of our planning horizon.
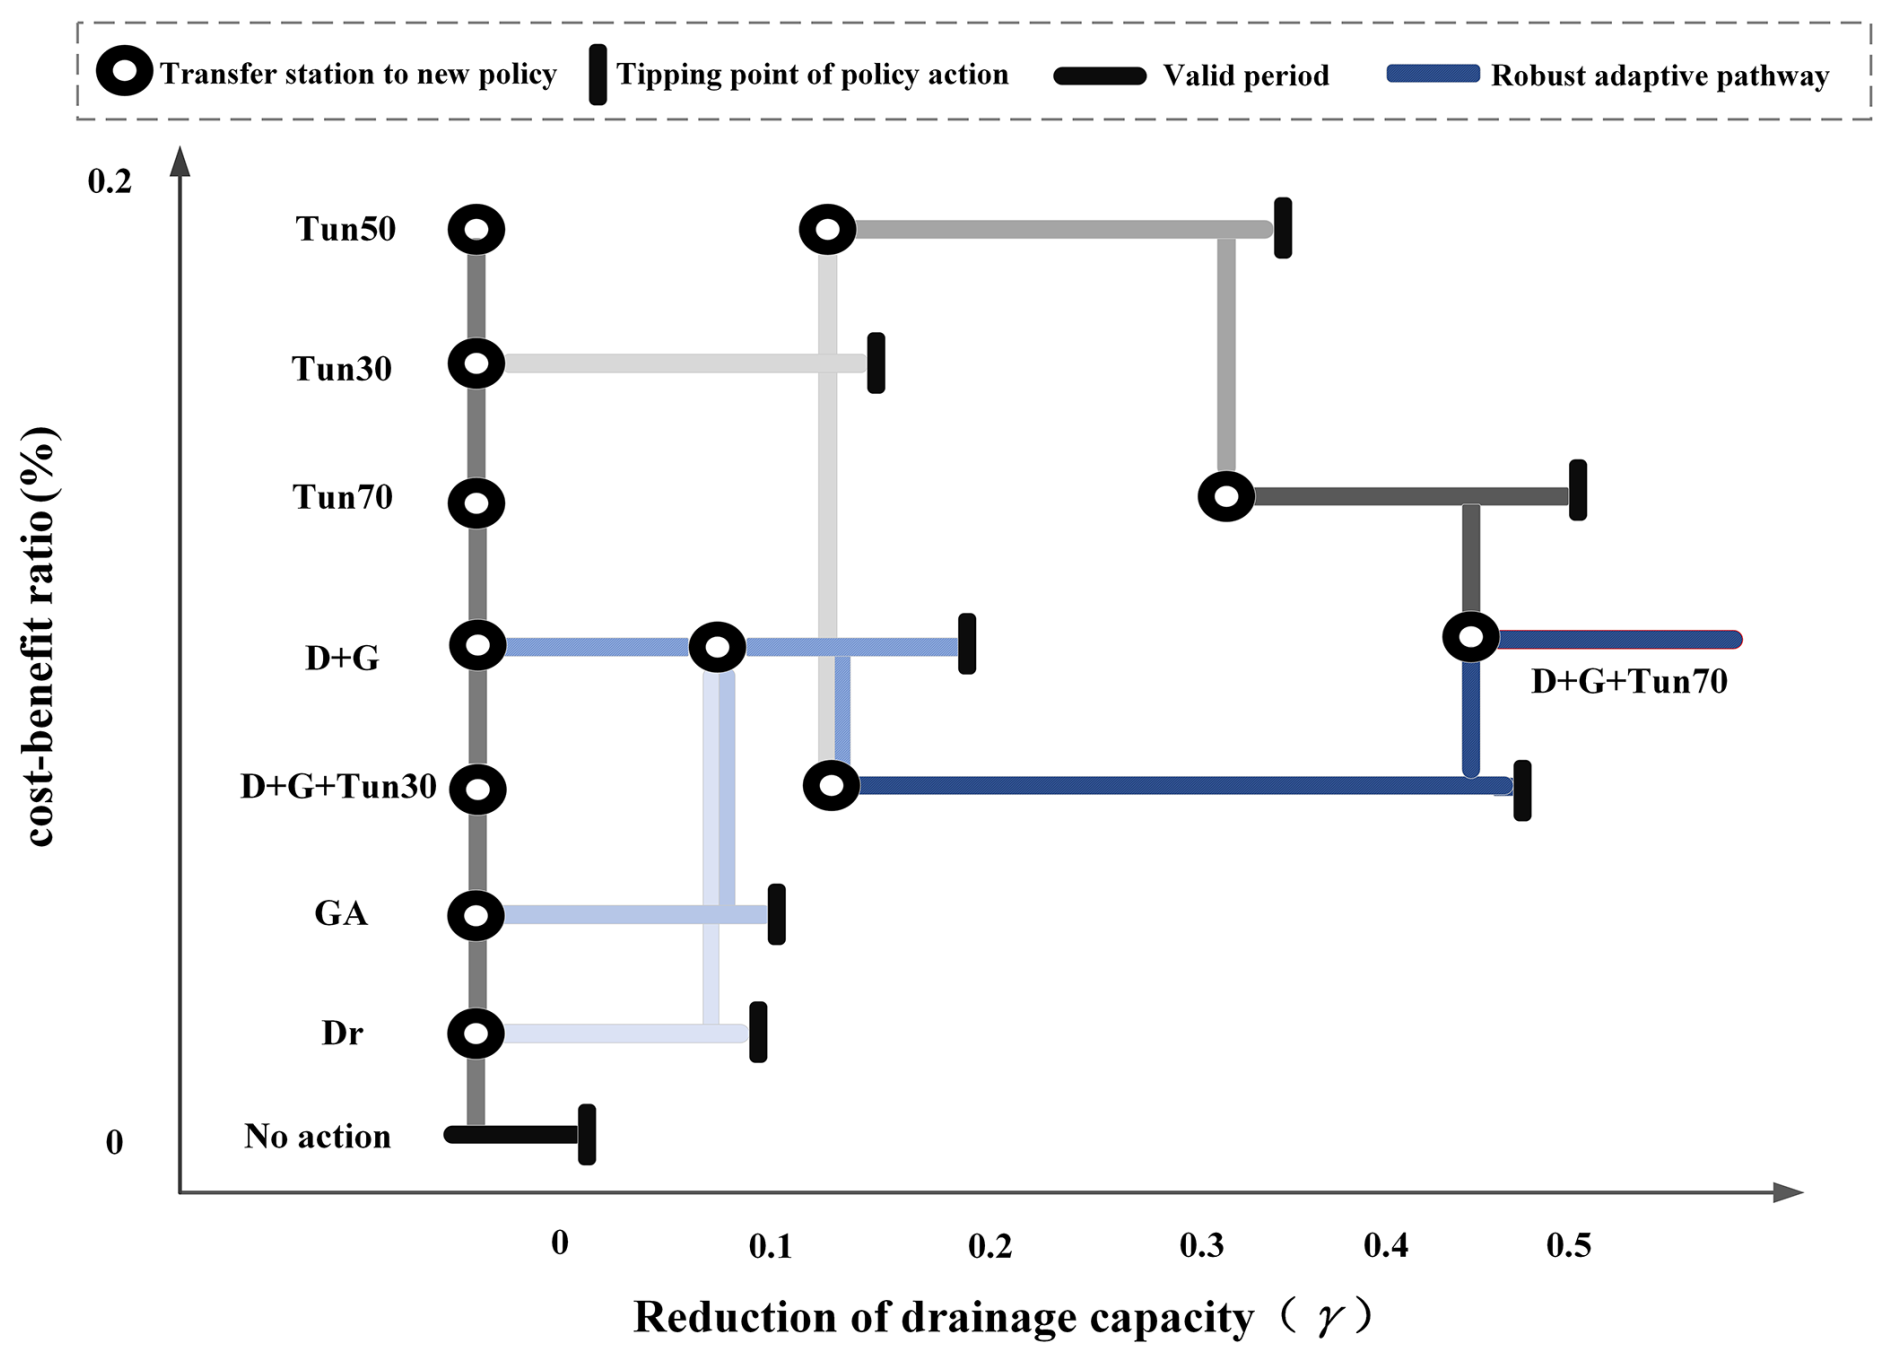
Figure 7Generation of robust adaptive pathways with two potential pathways from either Dr or GA to D + G + Tun30, and from Tun30 to Tun70 as the reduction of drainage capacity over time (x-axis). The options are sequenced in an upward relative higher BCR (y-axis, also see in Table 2).
In recognition of this limitation, it can be realized that single-objective targets e.g., flood control performance (ARRR), or financial control (BCR) may lead to biased decisions or maladaptation for the long-term horizon. For example, Table 2 shows that Tun50 has the highest cost-effectiveness (0.16), while the D + G + Tun30 is positioned at an average level, both of which performed well in reducing flood risk. In sharp contrast, the adaptiveness analysis shows that the D + G + Tun30 behaved significantly better during a reasonable period than Tun50, which is a more flexible and adaptive option for long-term planning (Fig. 7). Therefore, it tends to a biased decision if the decision maker only focus on economic return (BCR). Besides, it illuminates the decision maker that priorities on grey infrastructure (e.g., Tun50) at the starting point yields good performance (74 % of ARRR) but may lead to over-investment and path dependency. Moreover, there is concern that the effectiveness period could be shortened if decision-makers opt for the most cost-effective solution (Tun50) instead of choosing a more expensive but very effective combination (D + G + Tun30). This example enriches the literature on “planning under deep uncertainty”, which should be robust, adaptive, and financially efficient at the starting point for decision-makers, keep options open (flexible), and avoid lock-ins. To minimize regret in the near to long future, the adaptation solutions should pay great attention to both robustness and adaptiveness, which also illuminates the importance of multi-objective trade-off as mentioned in previous work (Kirshen et al., 2015; Ramm et al., 2018a).
Furthermore, we directly compare the top contenders Tun70 and D + G + Tun30. Notably, Tun70 actually achieved higher values than D + G + Tun30 on several individual metrics – it provided the greatest average risk reduction and a superior benefit-cost ratio, and it had the longest effectiveness period among single strategies. The multi-component D + G + Tun30 pathway, on the other hand, had a moderate benefit-cost ratio and slightly lower risk reduction, but scored much higher on planned flexibility. This illustrates a trade-off that if one prioritizes near-term performance and economic efficiency, Tun70 is very attractive; if one prioritizes incorporating flexibility to adapt over time, D + G + Tun30 gains the edge. Our framework's value lies in revealing this trade-off clearly.
5.3 Optimization of the synthesis framework
Although there is a myriad of research running flood risk simulations and assessing the BCR of solutions in Shanghai and other megacities in the coastal areas, seldom of which considers the entire process in making the applicable decision (Du et al., 2020; Sun et al., 2021; Ward et al., 2017). In filling up this niche, this study has proposed a synthesized planning-supporting framework that is capable of considering the entire cascade of procedures from the uncertainties of future urban rainfall pattern, to the sampling of future scenarios, to the hydrological modeling, and to flood risk assessment for the robustness and adaptiveness of alternative options, allowing for making robust and adaptive pathways (Fig. 1).
Compared to other DMDU theories, the synthesized framework asks for finding proxies for solutions' performances in reducing risk, decision-making in terms of cost and benefit, and identifying priorities and adaptive pathways from option combinations in the multi-objective fusion process. The conversations established a fast modeling-interpreting-remodeling feedback mechanism between the analyst and decision maker, which helps reduce the complexities and uncertainties encountered in ROA or other related work (e.g. Kind et al., 2018), and defining explicit objective (Raso et al., 2019). Upon that, incorporating the multi-dimensions of constraints allows for rapidly minimizing disruption factors, balancing alternative solutions' interpretability, coverage, and density, and visualizing the applicable pathway.
One advantage of our decision-support tool is that it can run comprehensive evaluations for thousands of future–option combinations within a few days, using only moderate amounts of input data. This computational efficiency is largely due to our use of a simplified model (SCS-CN) and a relatively small case-study area. However, this highlights a trade-off: using a more detailed 1D–2D model or expanding to a larger region would substantially increase computational time and data requirements. In other words, the “moderate” resource demand we experienced may not hold in cases that require high-resolution modeling. This limitation suggests that careful model selection (or the use of techniques like emulators and parallel computing) is important when applying the framework to bigger or more complex systems.
Another limitation is our risk assessment scope: we considered direct flood losses (inundation damage) but did not model disruptions to transportation or other urban functions, nor wider cascading effects across sectors. Similarly, our BCR focused mainly on direct financial costs, indeed we did not fully quantify co-benefits like ecosystem services or social benefits of adaptation options, which means our economic evaluation was somewhat narrow. Additionally, our cost estimates did not account for certain practical factors such as human resource efforts (e.g., time and coordination required for implementation) or land availability constraints (for instance, the feasibility of allocating sufficient space for new green infrastructure in Shanghai). These simplifications should be kept in mind when interpreting the results. Future work could explore dynamic adaptation difference of “on-the-fly” upgrades versus planned pathways to provide a more direct assessment of flexibility in the real-world sense.
In addition, further work needs to discuss the determination the weights of multi-objectives when conducting trade-off analysis. The balance between robustness and adaptiveness may vary depending on whether the priority is for immediate, high-impact actions or long-term sustainability. The weight assigned to each factor should reflect the specific goals. Besides, scenario discovery was implemented to find the combination option rather than an optimization algorithm to search for the best optimal combinations in many alternative options. We demonstrated a case study with a manageable set of options so that solving the optimization problem was outside the scope. Future work may apply evolutionary optimization algorithms to solve complex problems of multi-objective targets if there were hundreds of possible interventions or sequences.
This work provides a novel decision-making framework for flood mitigation in coastal megacities by synthesizing and building upon established DMDU methods. Rather than introducing a new theory, our contribution lies in the innovative combination and application of these methods to address the joint challenges of robustness and adaptiveness in flood risk management. We demonstrated this framework in a case study, evaluating flood management strategies across multiple criteria – including performance, cost-effectiveness, effectiveness period, and flexibility – under many plausible futures. The results showed that traditional evaluation using only short-term effectiveness or cost-efficiency can be insufficient for long-term planning. Integrating the additional metrics of effectiveness period and flexibility provides more nuanced insights, helping to develop adaptive pathways that remain effective as conditions change. Our case study also illustrated the trade-offs between robustness and adaptiveness. For instance, a high-robustness single option (Tun70) performed very well in meeting flood control targets and had a strong BCR, but it lacked flexibility to adjust if future conditions turned out less severe than anticipated. On the other hand, a multi-component strategy (D + G + Tun30) achieved a high overall score when both robustness and adaptiveness were considered, due to its balance of risk reduction and planned flexibility. This comparison highlights that the “optimal” option can change depending on which criteria decision-makers prioritize. In practice, our robust adaptive pathways approach allows stakeholders to see how emphasizing or de-emphasizing flexibility (or other metrics) would lead to different preferred strategies, thus supporting more informed decision-making.
Overall, this work provides a novel framework to inform Shanghai's long-term flood adaptation planning under climate change. Beyond this case, the approach contributes a theoretical foundation and practical insights for other coastal megacities facing similar challenges, helping decision-makers integrate robustness and adaptiveness into their climate adaptation strategies to better cope with deep uncertainty in extreme flood risks.
Case study region data in Shanghai can be found via Shanghai Statistic Yearbook, Shanghai Flood Control and Drainage Plan (2020–2035; Shanghai Municipal Water Authority, 2020). Figures are made in ArcGIS Pro 3.3 and Microsoft Excel. SCS-CN Models in this paper are mainly coding in Fortran environment (https://doi.org/10.6084/m9.figshare.24899340.v2, Hu, 2023). Data sample can be found via https://doi.org/10.6084/m9.figshare.30570743.v1 (Hu, 2025).
The supplement related to this article is available online at https://doi.org/10.5194/hess-29-6647-2025-supplement.
H.H conceived the study, designed the framework, collected the data and led the analysis of the result and responsible for writing the manuscript and ensuring its intellectual content. Q.K. contributed to the design and implementation of the decision-making framework, and conduct the manuscript writing and revising. W.W. supported the climate projection of the case study area of Shanghai and identified the scenario uncertainties. M.Z. validated the simulation result of pluvial flood and funding support. Y.W. assessed the pluvial flood risk in plausible futures. C.J. manipulated the boundary condition data of flood simulation in study region. J.W. supervised the project and provided expertise in flood risk management, and assisted in finalizing the manuscript.
The contact author has declared that none of the authors has any competing interests.
Publisher's note: Copernicus Publications remains neutral with regard to jurisdictional claims made in the text, published maps, institutional affiliations, or any other geographical representation in this paper. While Copernicus Publications makes every effort to include appropriate place names, the final responsibility lies with the authors. Views expressed in the text are those of the authors and do not necessarily reflect the views of the publisher.
This research was funded by the Shanghai Philosophy Social Science Planning General Project (grant no. 2024BJC014), and National Natural Science Foundation of China (grant nos. 42171080 and 42171282).
This paper was edited by Giuliano Di Baldassarre and reviewed by two anonymous referees.
Bartholomew, E. and Kwakkel, J. H.: On considering robustness in the search phase of robust decision making: a comparison of many-objective robust decision making, multi-scenario many-objective robust decision making, and many objective robust optimization, Environmental Modelling & Software, 127, 104699, https://doi.org/10.1016/j.envsoft.2020.104699, 2020.
Dias, L. F., Aparício, B. A., Nunes, J. P., Morais, I., Fonseca, A. L., Pastor, A. V., and Santos, F. D.: Integrating a hydrological model into regional water policies: Co-creation of climate change dynamic adaptive policy pathways for water resources in southern Portugal, Environmental Science & Policy, 114, 519–532, https://doi.org/10.1016/j.envsci.2020.09.020, 2020.
Dottori, F., Mentaschi, L., Bianchi, A., Alfieri, L., and Feyen, L.: Cost-effective adaptation strategies to rising river flood risk in Europe, Nature Climate Change, 13, 196–202, https://doi.org/10.1038/s41558-022-01540-0, 2023.
Du, S., Scussolini, P., Ward, P. J., Zhang, M., Wen, J., Wang, L., Koks, E., Diaz-Loaiza, A., Gao, J., Ke, Q., and Aerts, J. C. J. H.: Hard or soft flood adaptation? Advantages of a hybrid strategy for Shanghai, Global Environmental Change, 61, 102037, https://doi.org/10.1016/j.gloenvcha.2020.102037, 2020.
Erfani, T., Pachos, K., and Harou, J. J.: Real-Options Water Supply Planning: Multistage Scenario Trees for Adaptive and Flexible Capacity Expansion Under Probabilistic Climate Change Uncertainty, Water Resources Research, 54, 5069–5087, https://doi.org/10.1029/2017WR021803, 2018.
Giuliani, M. and Castelletti, A.: Is robustness really robust? How different definitions of robustness impact decision-making under climate change, Climatic Change, 135, 409–424, https://doi.org/10.1007/s10584-015-1586-9, 2016.
Haasnoot, M., Kwakkel, J. H., Walker, W. E., and ter Maat, J.: Dynamic adaptive policy pathways: A method for crafting robust decisions for a deeply uncertain world, Global Environmental Change, 23, 485–498, https://doi.org/10.1016/j.gloenvcha.2012.12.006, 2013.
Haasnoot, M., van Aalst, M., Rozenberg, J., Dominique, K., Matthews, J., Bouwer, L. M., Kind, J., and Poff, N. L.: Investments under non-stationarity: economic evaluation of adaptation pathways, Climatic Change, 161, 451–463, https://doi.org/10.1007/s10584-019-02409-6, 2020.
Han, Y. and Mozumder, P.: Building-level adaptation analysis under uncertain sea-level rise, Climate Risk Management, 32, 100305, https://doi.org/10.1016/j.crm.2021.100305, 2021.
Herman, J. D., Reed, P. M., Zeff, H. B., and Characklis, G. W.: How should robustness be defined for water systems planning under change, Journal of Water Resources Planning and Management, 141, 04015012, https://doi.org/10.1061/(ASCE)WR.1943-5452.0000509, 2015.
Hu, H.: SCS model, PRIM, and Multi-criteria trade-off, figshare [code], https://doi.org/10.6084/m9.figshare.24899340.v2, 2023.
Hu, H.: Extreme rain scenario and future uncertainties, figshare [data set], https://doi.org/10.6084/m9.figshare.30570743.v1, 2025.
Hu, H. Z., Tian, Z., Sun, L. X., Wen, J., Liang, Z., Dong, G., and Liu, J.: Synthesized trade-off analysis of flood control solutions under future deep uncertainty: An application to the central business district of Shanghai, Water Research, 166, 115067, https://doi.org/10.1016/j.watres.2019.115067, 2019.
Hui, P., Tang, J., Wang, S., Niu, X., Zong, P., and Dong, X.: Climate change projections over China using regional climate models forced by two CMIP5 global models. Part II: projections of future climate, International Journal of Climatology, 38, e78–e94, https://doi.org/10.1002/joc.5409, 2018.
Kasprzyk, J. R., Nataraj, S., Reed, P. M., and Lempert, R. J.: Many objective robust decision making for complex environmental systems undergoing change, Environmental Modelling & Software, 42, 55–71, https://doi.org/10.1016/j.envsoft.2012.12.007, 2013.
Kind, J. M., Baayen, J. H., and Botzen, W. J. W.: Benefits and Limitations of Real Options Analysis for the Practice of River Flood Risk Management, Water Resources Research, 54, 3018–3036, https://doi.org/10.1002/2017WR022402, 2018.
Kirshen, P., Caputo, L., Vogel, R. M., Mathisen, P., Rosner, A., and Renaud, T.: Adapting Urban Infrastructure to Climate Change: A Drainage Case Study, Journal of Water Resources Planning and Management, 141, 04014064, https://doi.org/10.1061/(ASCE)WR.1943-5452.0000443, 2015.
Kwakkel, J. H. and Haasnoot, M.: Supporting DMDU: A Taxonomy of Approaches and Tools, in: Decision making under deep uncertainty: from theory to practice, edited by: Marchau, V. A. W. J., Walker, W. E., Bloemen, P. J. T. M., and Popper, S. W., Springer Nature Switzerland AG, Cham, 355–374, https://doi.org/10.1007/978-3-030-05252-2_15, 2019.
Kwakkel, J. H., Haasnoot, M., and Walker, W. E.: Comparing robust decision-making and dynamic adaptive policy pathways for model-based decision support under deep uncertainty, Environmental Modelling & Software, 86, 168–183, https://doi.org/10.1016/j.envsoft.2016.09.017, 2016.
Lempert, R., Kalra, N., Peyraud, S., Mao, Z., and Tan, S. B.: Ensuring robust flood risk management in Ho Chi Minh City, World Bank Policy Research Working Paper, 6465, 2013.
Lempert, R. J., Popper, S. W., and Bankes, S. C.: Shaping the next one hundred years: new methods for quantitative, long-term policy analysis, RAND Corporation, Santa Monica, CA, MR-1626-RPC, https://doi.org/10.7249/MR1626, 2003.
Liang, P. and Ding, Y.: The long-term variation of extreme heavy precipitation and its link to urbanization effects in Shanghai during 1916–2014, Advances in Atmospheric Sciences, 34, 321–334, https://doi.org/10.1007/s00376-016-6120-0, 2017.
Lin, W. B., Sun, Y. M., Nijhuis, S., and Wang, Z.: Scenario-based flood risk assessment for urbanizing deltas using future land-use simulation (FLUS): Guangzhou metropolitan area as a case study, Science of the Total Environment, 739, 139899, https://doi.org/10.1016/j.scitotenv.2020.139899, 2020.
Malekpour, S. and Newig, J.: Putting adaptive planning into practice: A meta-analysis of current applications, Cities, 106, 102866, https://doi.org/10.1016/j.cities.2020.102866, 2020.
Marchau, V. A. W. J., Walker, W. E., Bloemen, P. J. T. M., and Popper, S. W. (Eds.): Decision making under deep uncertainty: from theory to practice, Springer Nature Switzerland AG, Cham, https://doi.org/10.1007/978-3-030-05252-2, 2019.
Matrosov, E. S., Woods, A. M., and Harou, J. J.: Robust decision making and info-gap decision theory for water resource system planning, Journal of Hydrology, 494, 43–58, https://doi.org/10.1016/j.jhydrol.2013.03.006, 2013.
McPhail, C., Maier, H. R., Kwakkel, J. H., Giuliani, M., Castelletti, A., and Westra, S.: Robustness metrics: How are they calculated, when should they be used and why do they give different results?, Earth's Future, 6, 169–191, https://doi.org/10.1002/2017EF000649, 2018.
Molina-Perez, E., Groves, D. G., Popper, S. W., Ramirez, A. I., and Crespo-Elizondo, R.: Developing a robust water strategy for monterrey, Mexico: diversification and adaptation for coping with climate, economic, and technological uncertainties, Rand Corporation, Santa Monica, CA, RR-3017-FAMM, ISBN 978-1-9774-0274-5, https://www.rand.org/content/dam/rand/pubs/research_reports/RR3000/RR3017/RAND_RR3017.pdf (last access: 10 November 2025), 2019.
Quinn, J. D., Reed, P. M., Giuliani, M., and Castelletti, A.: Rival framings: A framework for discovering how problem formulation uncertainties shape risk management trade-offs in water resources systems, Water Resources Research, 53, 7208–7233, https://doi.org/10.1002/2017WR020524, 2017.
Ramm, T. D., Watson, C. S., and White, C. J.: Describing adaptation tipping points in coastal flood risk management, Computers, Environment and Urban Systems, 69, 74–86, https://doi.org/10.1016/j.compenvurbsys.2018.01.002, 2018a.
Ramm, T. D., Watson, C. S., and White, C. J.: Strategic adaptation pathway planning to manage sea-level rise and changing coastal flood risk, Environmental Science & Policy, 87, 92–101, https://doi.org/10.1016/j.envsci.2018.06.001, 2018b.
Ranger, N., Millner, A., Dietz, S., Fankhauser, S., Lopez, A., and Ruta, G.: Adaptation in the UK: a decision-making process, Environment Agency, Bristol, UK, https://www.lse.ac.uk/granthaminstitute/wp-content/uploads/2014/03/PB-Ranger-adaptation-UK.pdf (last access: 10 November 2025), 2010.
Raso, L., Kwakkel, J., Timmermans, J., and Panthou, G.: How to evaluate a monitoring system for adaptive policies: criteria for signposts selection and their model-based evaluation, Climatic Change, 153, 267–283, https://doi.org/10.1007/s10584-018-2355-3, 2019.
Scussolini, P., Tran, T. V. T., Koks, E., Diaz-Loaiza, A., Ho, P. L., and Lasage, R.: Adaptation to sea level rise: a multidisciplinary analysis for Ho Chi Minh city, Vietnam, Water Resources Research, 53, 10841–10857, https://doi.org/10.1002/2017WR021344, 2017.
Shanghai Municipal Water Authority: Shanghai Flood Control and Drainage Plan (2020–2035), Shanghai, https://swj.sh.gov.cn/ghjhua/20211009/ae9ce5cd33384864b345c75a68e655d4.html (last access: 10 November 2025), 2020.
Shanghai Statistical Bureau: Shanghai Statistical Yearbook 2021, China Statistical Press, Beijing, http://tjj.sh.gov.cn/tjnj/tjnj2021e.htm (last access: 10 November 2025), 2021.
Sun, X., Li, R., Shan, X., Xu, H., and Wang, J.: Assessment of climate change impacts and urban flood management schemes in central Shanghai, International Journal of Disaster Risk Reduction, 65, 102563, https://doi.org/10.1016/j.ijdrr.2021.102563, 2021.
Tariq, A. A., Lempert, R. J., Riverson, J., Schwartz, M., and Berg, N.: A climate stress test of Los Angeles' water quality plans, Climatic Change, 144, 625–639, https://doi.org/10.1007/s10584-017-2062-5, 2017.
Walker, W. E., Rahman, S. A., and Cave, J.: Adaptive policies, policy analysis, and policymaking, European Journal of Operational Research, 128, 282–289, https://doi.org/10.1016/S0377-2217(00)00071-0, 2001.
Wang, J., Yi, S., Li, M., Wang, L., and Song, C.: Effects of sea level rise, land subsidence, bathymetric change and typhoon tracks on storm flooding in the coastal areas of Shanghai, Science of the Total Environment, 621, 228–234, https://doi.org/10.1016/j.scitotenv.2017.11.224, 2018.
Ward, P. J., Jongman, B., Aerts, J. C. J. H., Bates, P. D., Botzen, W. J. W., Diaz-Loaiza, A., Hallegatte, S., Kind, J. M., Kwadijk, J., Scussolini, P., and Winsemius, H. C.: A global framework for future costs and benefits of river-flood protection in urban areas, Nature Climate Change, 7, 642–646, https://doi.org/10.1038/NCLIMATE3350, 2017.
Workman, M., Darch, G., Dooley, K., Lomax, G., Maltby, J., and Pollitt, H.: Climate policy decision making in contexts of deep uncertainty-from optimistion to robustness, Environmental Science & Policy, 120, 127–137, https://doi.org/10.1016/j.envsci.2021.03.002, 2021.
Xie, J., Chen, H., Liao, Z., Gu, X., Zhu, D., and Zhang, J.: An integrated assessment of urban flooding mitigation strategies for robust decision making, Environmental Modelling & Software, 95, 143–155, https://doi.org/10.1016/j.envsoft.2017.06.027, 2017.
Yang, T., Yan, X., Huang, X., and Wu, J.: Integrated management of groundwater exploitation and recharge in Shanghai based on land subsidence control, Proc. IAHS, 382, 831–836, https://doi.org/10.5194/piahs-382-831-2020, 2020.
Yang, W., Xu, K., Ma, C., Lian, J., Jiang, X., Zhou, Y., and Bin, L.: A novel multi-objective optimization framework to allocate support funds for flash flood reduction based on multiple vulnerability assessment, Journal of Hydrology, 603, 127144, https://doi.org/10.1016/j.jhydrol.2021.127144, 2021.
Yang, W., Zhang, J., and Krebs, P.: Investigating flood exposure induced socioeconomic risk and mitigation strategy under climate change and urbanization at a city scale, Journal of Cleaner Production, 387, 135929, https://doi.org/10.1016/j.jclepro.2023.135929, 2023.
Yin, J., Jonkman, S., Lin, N., Yu, D., Aerts, J., Wilby, R., Pan, M., Wood, E., Bricker, J., Ke, Q., Zeng, Z., Zhao, Q., Ge, J., and Wang, J.: Flood Risks in Sinking Delta Cities: Time for a Reevaluation?, Earth's Future, 8, e2020EF001614, https://doi.org/10.1029/2020EF001614, 2020.
Zhou, Q., Leng, G., Su, J., and Ren, Y.: Comparison of urbanization and climate change impacts on urban flood volumes: Importance of urban planning and drainage adaptation, Science of the Total Environment, 658, 24–33, https://doi.org/10.1016/j.scitotenv.2018.12.184, 2019.