the Creative Commons Attribution 4.0 License.
the Creative Commons Attribution 4.0 License.
 | 31 Jul 2025
Evapotranspiration stress intensifies with enhanced sensitivity to soil moisture deficits in a rapidly greening China
Yong Wang
Yong Zhao
Shouzhi Chen
Longhao Wang
Wenjing Yang
Xing Li
Xinxi Li
Huimin Lei
Huanyu Chang
Jiaqi Zhai
Yongnan Zhu
Qingming Wang
Ting Ye
Amidst drastic environmental changes, the intricate interplay and feedback mechanisms in the water–vegetation–atmosphere nexus experience alteration. Previous research primarily centres on the responses among variables within this system, with little known about whether and how these responses (sensitivities) change. Here, we employ the Evapotranspiration Stress Index (ESI) to represent the equilibrium of the nexus and develop a memory dynamic linear model based on Bayesian forward filtering. The model takes into account the carry-over effect in the “dry gets drier” self-amplify loop, allowing for a more effective estimation of the ESI time-varying sensitivity to associated influencing factors. Our analysis reveals that from 1950 to 2020, mainland China experienced a notable 4.74 % escalation in evapotranspiration stress. Surface soil moisture serves as a primary driver, whose sensitivity to ESI has surged by 9.49 % in the last decade compared to the early 2000s. Vapour pressure deficit (VPD) and leaf area index (LAI) also exerted a substantial role, with their sensitivities fluctuating approximately 22.91 % and −45.77 %, respectively. Moreover, the greening pace is linked to an increase in soil moisture sensitivity and a decrease in VPD sensitivity, suggesting that rapid greening may alter the ecological resilience against soil deficit and atmospheric drought. In comparison, the widely used moving window multiple linear regression (MLR) significantly overestimates sensitivity fluctuations, necessitating prudent interpretation of numerical estimates in related research findings. Our findings underscore the spatiotemporal variations in sensitivity, enriching the comprehension of ecosystem reactions to external factors, and offer essential insights for advancing greening endeavours.
- Article
(15608 KB) - Full-text XML
-
Supplement
(2960 KB) - BibTeX
- EndNote


Over the last 2 decades, approximately one-third of land globally has experienced vegetation greening (Chen et al., 2019). Concurrently, 53 % to 64 % of these regions have undergone atmospheric desiccation (Yuan et al., 2019). However, research has also revealed a rise in available water resources (precipitation supply minus evapotranspiration loss) in ∼ 45 % proximate and downwind zones (Cui et al., 2022). Contrary to greening, satellite-based studies have indicated a 0.4-fold expansion in regions shifting from greening to browning (De Jong et al., 2013; Liu et al., 2023). Amidst the ongoing debates over greening or browning, and wetting or drying, it is unequivocal that the intricate interactions and feedback mechanisms among water, vegetation, and climate are altered.
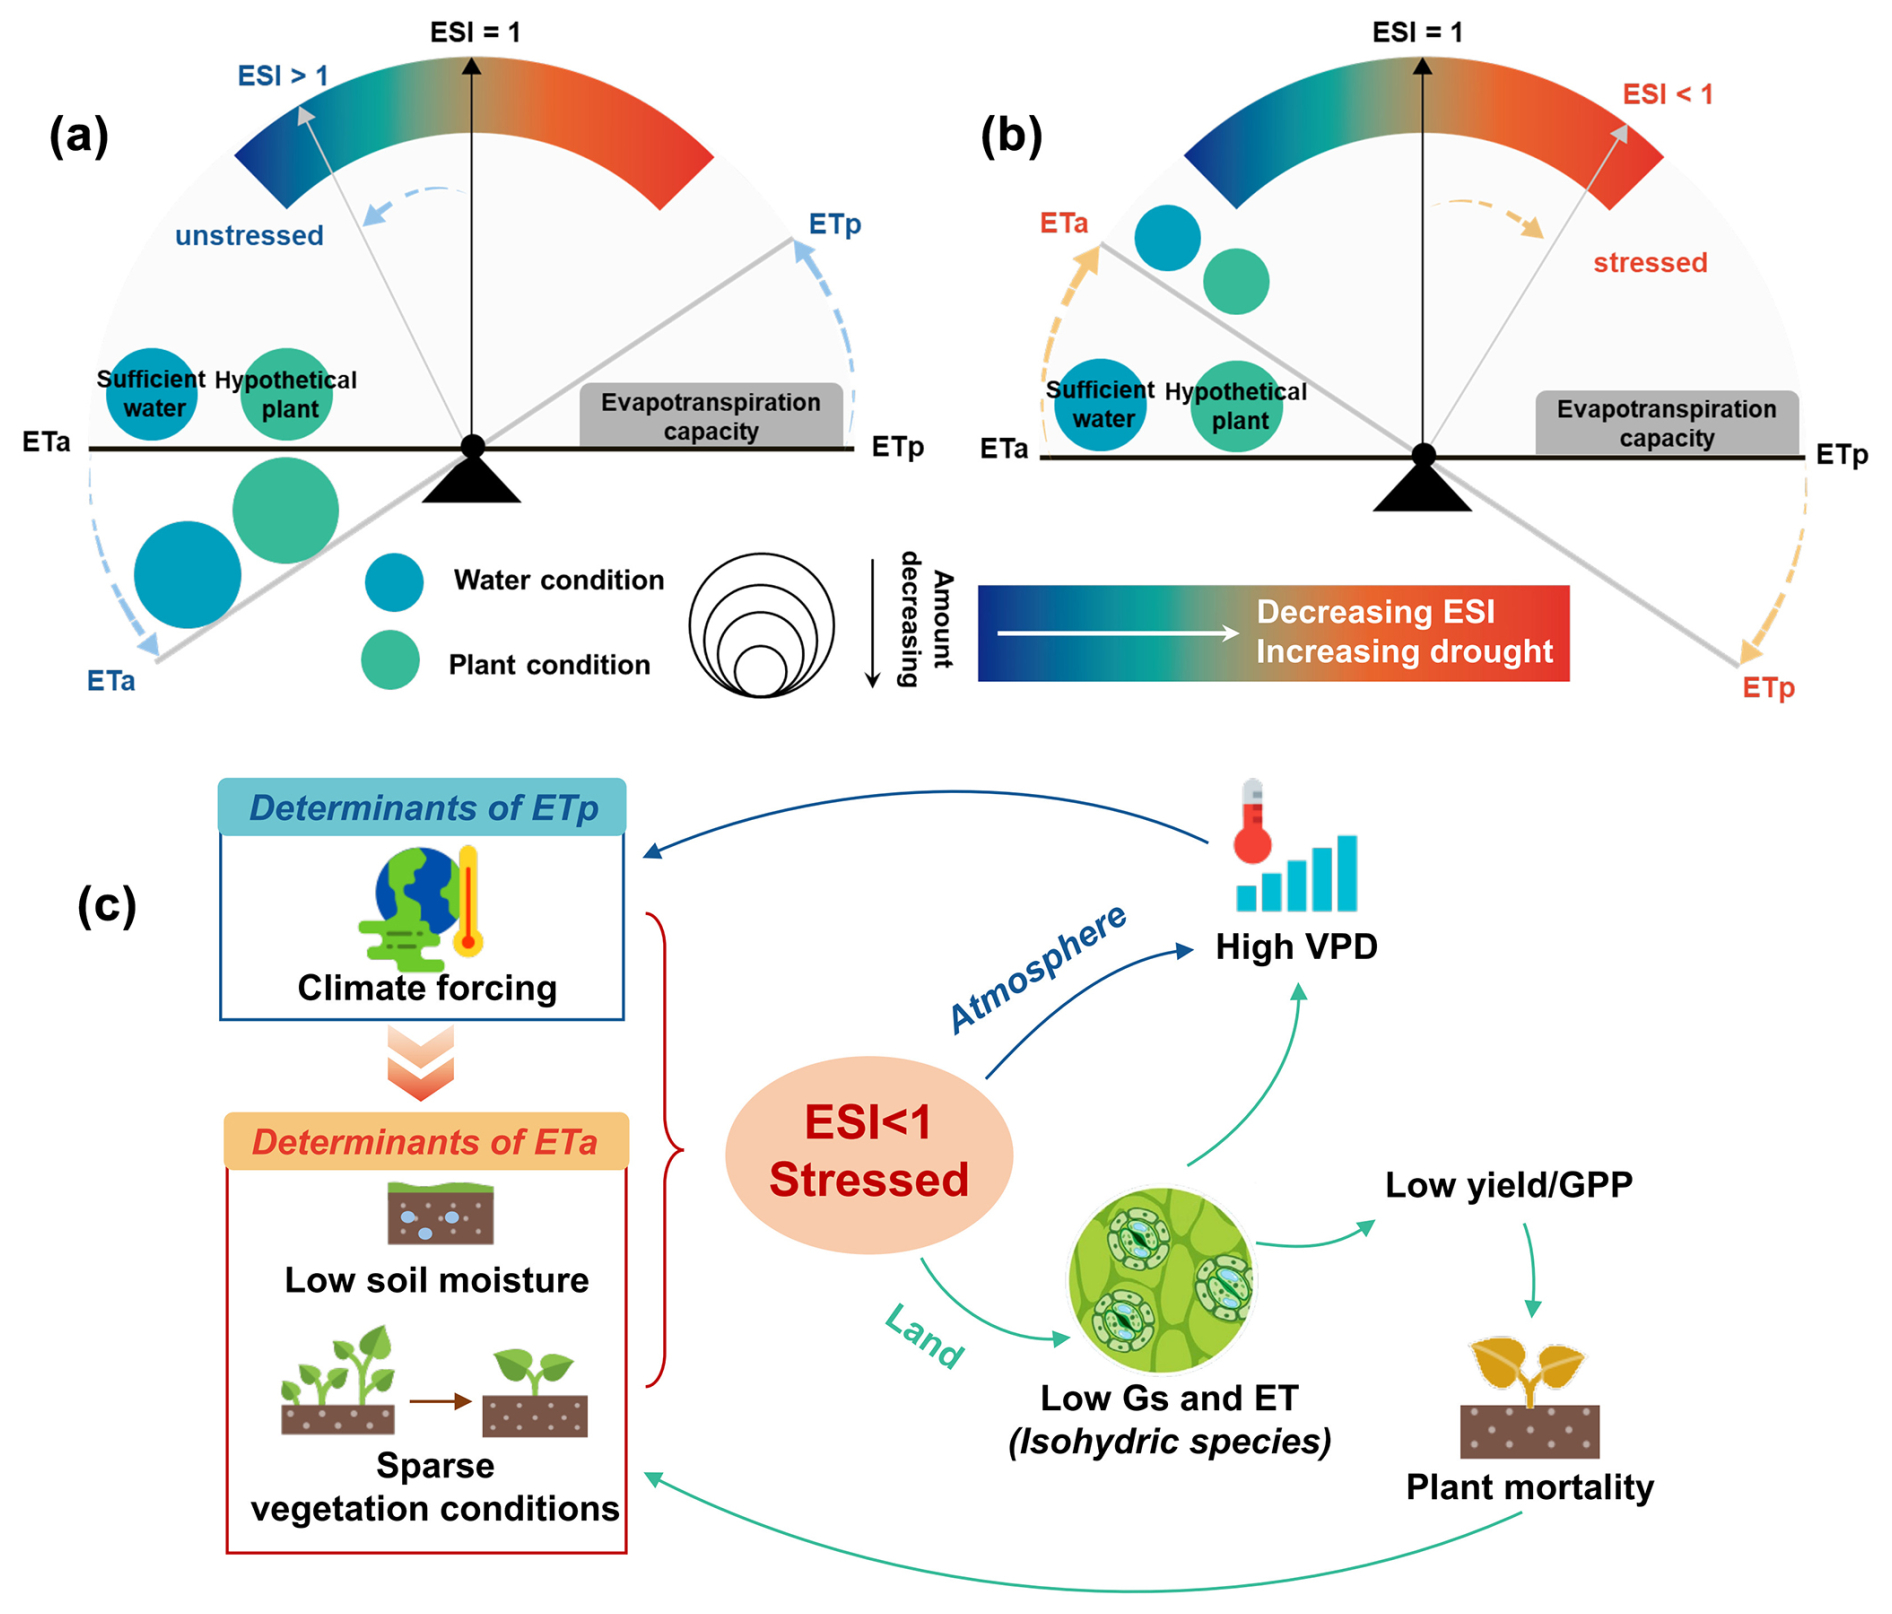
Figure 1Conceptual diagram of evapotranspiration stress and its self-amplify loop. (a) ESI represents the water–vegetation–atmosphere equilibrium, defined as the ratio of actual evapotranspiration (ETa) to potential evapotranspiration (ETp). When using the parameters of crops assumed in the PM equation to calculate ETp (also known as ET0, reference crop evapotranspiration in agriculture), ESI values greater than 1 may occur. (b) As regions experience more severe water deficiency or sparser vegetation cover, the balance tilts further to the right, and the ESI value decreases. A smaller ESI value indicates more severe drought conditions. (c) Schematic of the self-amplify feedback loop, where Gs represents stomatal conductance, GPP stands for gross primary productivity, and VPD denotes vapour pressure deficit. Blue lines depict the atmospheric feedback pathway, while green lines represent the terrestrial surface process pathway.
Defined as the ratio of actual to potential evapotranspiration, the Evapotranspirative Stress Index (ESI) can comprehensively reflect the equilibrium between water supply, vegetation status, and climatic conditions (Anderson et al., 2013, 2016) (Fig. 1a and b). Potential evapotranspiration (ETp, also known as ET0, reference crop evapotranspiration in agriculture) represents the evaporation under ideal circumstances – ample water, uniform vegetation (typically alfalfa) – and is driven solely by climate (Allen et al., 1998; Li et al., 2022b; Thornthwaite, 1948). Regions suffering from water scarcity or sparse vegetation are subject to evapotranspirative stress (Fig. 1b), whereas ample water or vigorous growth may result in actual evapotranspiration surpassing the hypothetical potential (Liu et al., 2022) (Fig. 1a). This occurs because ETp calculations assume fixed canopy and surface properties for a hypothetical crop, whereas real vegetation may outperform these assumptions. Previous research has proven the high sensitivity of ESI to early-stage drought, as plants naturally curtail their water consumption before drought fully manifests (Nguyen et al., 2019; Otkin et al., 2018). Understanding ESI dynamics is thus critical for timely drought response, ecosystem stability, and sustaining crop yields.
The evolution of evapotranspiration (ET) stress includes a positive “dry gets drier” land–atmosphere feedback (Fu et al., 2022; Gentine et al., 2019; Seneviratne et al., 2010) (Fig. 1c). Regions subject to climate-induced ET stress are characterized by low soil moisture and weak vegetation vitality. Isohydric species, in response, close their stomata to conserve water, albeit at the cost of decreased photosynthesis and diminished carbon accumulation (Grossiord et al., 2020; Joshi et al., 2022). On the one side, this reduction in water vapour release into the atmosphere intensifies atmospheric dryness, further reinforcing climate constraints. On the other side, prolonged stress may lead to plant mortality due to hydraulic failure and carbon starvation, further decreasing vegetation cover (Kono et al., 2019; Mantova et al., 2022). Such a self-amplify loop highlights the necessity to consider temporal connections when exploring the ET stress dynamics. Research based on data analysis and field experiments has uncovered that such internal memory effects are particularly pronounced in water-limited areas (Liu et al., 2018; Richard et al., 2008; Xiao et al., 2024a). Statistically, the autocorrelation component can serve as a good representation of internal memory effects (Forzieri et al., 2022; Smith et al., 2022). For example, Kusch et al. (2022) employed a lagged normalized difference vegetation index (NDVI) as a representation of intrinsic-vegetation memory and compared its impact with external meteorological factors. An increasing autocorrelation coefficient signals declining ecosystem resilience or nearing critical thresholds (Liu et al., 2019; Scheffer et al., 2009). Unfortunately, much existing research has focused on external factors, neglecting the role of internal memory in ET stress dynamics (Feng et al., 2020; Fu et al., 2024b; Jung et al., 2010; Liu et al., 2020c; Peng et al., 2019). Therefore, integrating the co-regulation of external forcing factors with internal memory effects is essential for an in-depth investigation into the dynamics of ET stress and ecological responses.
Differences in regional evaporation stress patterns arise from different response to relevant factors. Soil moisture acts as the supply side of evaporation, while vapour pressure deficit (VPD), as the demand side, pulls water from soil pores and plant stomata into the atmosphere (Dong et al., 2020; Liu et al., 2020b). Increased ambient CO2 can mitigate evaporation by enhancing water use efficiency (Li et al., 2023; Liu et al., 2017). Among external drivers, moisture and VPD are found to be particularly sensitive (Liu et al., 2020a; Sulman et al., 2016; Zhang et al., 2021a; Zhong et al., 2023), but vegetation structure, measured by the leaf area index (LAI), also influences evapotranspiration by regulating surface energy and land–atmosphere coupling (Fu et al., 2022). In addition to regional characteristic dependence, the differing sampling time spans are also important contributors to the inconsistent results. In an ever-changing world, the sensitivity of evaporation stress to environmental changes may also evolve (Hsu and Dirmeyer, 2023). However, research on the time-varying sensitivity is still in its infancy. Existing research investigates these temporal changes by segmenting time series, such as Zeng et al. (2022) using a 5-year moving window for NDVI sensitivity to precipitation or Li et al. (2022a) using machine learning to assess LAI sensitivity to soil water over 3-year blocks. However, these approaches only yield an average response for each segment, rather than the true “instantaneous or dynamic” sensitivity. Fortunately, the application of a dynamic linear model based on Bayesian forward filtering, as demonstrated by Zhang et al. (2022) in their recent research of global NDVI sensitivity to precipitation, offers a promising avenue to elucidate this problem.
Over the past 2 decades, China's mean air temperature has increased at a rate of 0.24 °C per decade, exceeding the global average of 0.20 °C per decade. Concurrent with climate warming and large-scale ecological restoration initiatives – including the Three-North Shelter Forest Program, Grain for Green Program, and Plain Greening Project (Fu et al., 2024a) – the regional leaf area index (LAI) has risen by 7.66 % (4.21 % per decade, p < 0.001), the highest rate globally (Chen et al., 2019). However, surface soil moisture has simultaneously declined at 0.08 % per decade, signalling hydrological trade-offs. These rapid environmental transformations, driven by both climate variability and anthropogenic activities, have established China as a critical natural laboratory for studying coupled hydrological–ecological–climatic interactions (Bai et al., 2020; Li et al., 2018; Zheng et al., 2022)
Here, a memory dynamic linear model (MDLM) integrates intrinsic lagged effects and concurrent extrinsic forcing to quantify both the response of the evapotranspiration stress index (ESI) to environmental changes and its temporal variability. Utilizing the MDLM, we calculate the time-varying sensitivity of ESI to key drivers at pixel scale in China over the past 2 decades, with 8 d temporal granularity. The robustness of the results is verified through a moving-window multiple linear regression model. Prior to model implementation, interpretable machine learning algorithms leveraging two classifiers are employed to screen key drivers of ESI across diverse climate–vegetation zones at 8 d, 16 d, and monthly timescales. This study aims to (a) untangle the dynamic trajectory of ET stress, (b) investigate the potential driving mechanisms of ESI, and (c) quantify the time-varying sensitivity of ESI to principal external drivers upon the incorporation of intrinsic memory effects. Our findings are expected to narrow the knowledge gap in temporal variability of evapotranspiration stress response, enhance our comprehension of the complex water–vegetation–climate interactions, and inform potential improvements for Earth system models.
2.1 Datasets
The Evapotranspiration Stress Index (ESI) (Eq. 1) is the ratio of ETa to ETp. Although ETp lacks consensus in definitions and estimation methods, the Penman–Monteith (PM) equation is adopted here due to its consistency with the ESI framework. The ERA5-derived ETp product satisfies this criterion, delivering integrated radiation, surface temperature, and wind speed data required by the PM equation. To avoid potential overestimation of ETp, we implement the Yang et al. (2019)-modified PM formula, which incorporates the CO2 water-saving effect and is widely adopted in evapotranspiration studies (Lian et al., 2021; Zhang et al., 2023). CO2 data were obtained from CarbonTracker (CT2022) for the period 2001–2020 at a 3° × 2° spatial resolution. Appendix A details the calculation procedures of ESI. Additionally, we assess the efficacy of three other mainstream evaporation products in representing ESI spatial patterns across China, benchmarking these against observational data from 26 flux stations.
In addition to the meteorological and CO2 data utilized in ETp calculations (Eq. A4), total precipitation (Prec), atmospheric pressure (P), and soil volumetric water content (svm) across different soil layers from ERA5 are also considered as influencing factors for the ESI. The root zone of vegetation serves as a critical interface for water–plant–atmosphere interactions (Gao et al., 2014, 2024; Wang-Erlandsson et al., 2016). Utilizing root zone depth estimations based on an 80-year drought return period from Stocker et al. (2023), we computed the spatial distribution of root-zone soil moisture (Rsvm) across China through a weighted averaging algorithm, as detailed in Appendix B.
Vegetation factors, key drivers of the Evaporative Stress Index (ESI), were incorporated through the Global Land Surface Satellite (GLASS) datasets, including the Leaf Area Index (LAI; version V60) and Fractional Vegetation Cover (FVC; version V40) (Liang et al., 2013, 2014, 2021). These datasets feature an 8 d temporal resolution and 0.05° spatial resolution spanning 2001–2020. Additionally, Moderate Resolution Imaging Spectroradiometer (MODIS) datasets, including the Normalized Difference Vegetation Index (NDVI) and Enhanced Vegetation Index (EVI) (MOD13C1) with a 16 d temporal resolution, were employed. Besides, to mitigate saturation effects and enhance robustness to noise, kernel density estimation was applied to smooth the NDVI data, creating kernel NDVI (kNDVI) (Camps-Valls et al., 2021) (Eq. 2).
Grids with NDVI values below 0.1 are omitted to eliminate barren, rocky, sandy or snow areas. The Aridity Index (AI) is calculated as a multiyear average (2001–2020) by the ratio of annual Prec to ETp using the ERA5 dataset. Lower AI values indicate drier regions, classifying the study area into sub-humid (0.5 ≤ AI < 0.65), semi-arid (0.2 ≤ AI < 0.5), and arid (0.05 ≤ AI < 0.2), with regions exceeding an AI of 0.65 being categorized as non-dryland areas (Spinoni et al., 2015). To mitigate the effects of land-use change, the annual China Land Cover Dataset (Yang and Huang, 2021), featuring a 30 m grid spacing for the years 2001–2020, is employed. Only grids with consistent land cover types (cropland, forest, or grassland) throughout the study duration were selected for analysis, as depicted in Fig. A1.
The datasets and pre-processing procedures are summarized in Table S1 in the Supplement. All variables were interpolated to a spatial resolution of 0.1° to match the ERA5 dataset and were composited over three distinct temporal scales: 8 d, 16 d, and monthly. The selection of datasets was guided by criteria that included high accuracy, fine spatial resolution, and a broad temporal coverage.
2.2 Identification of the key drivers
Hydrothermal conditions and vegetation variables can each be represented by multiple proxies. For vegetation health, indicators like FVC, LAI, NDVI, and kNDVI are commonly used. In contrast, the energy conditions considered in this study are limited to T and Rn. A disparity in the number of variables may introduce bias, potentially favouring some feature groups over others, which may distort feature importance assessments (Liu et al., 2024). More critically, a high degree of correlation between features – known as multicollinearity – may cause overfitting, where the model becomes excessively tailored to the training data, compromising its ability to generalize.
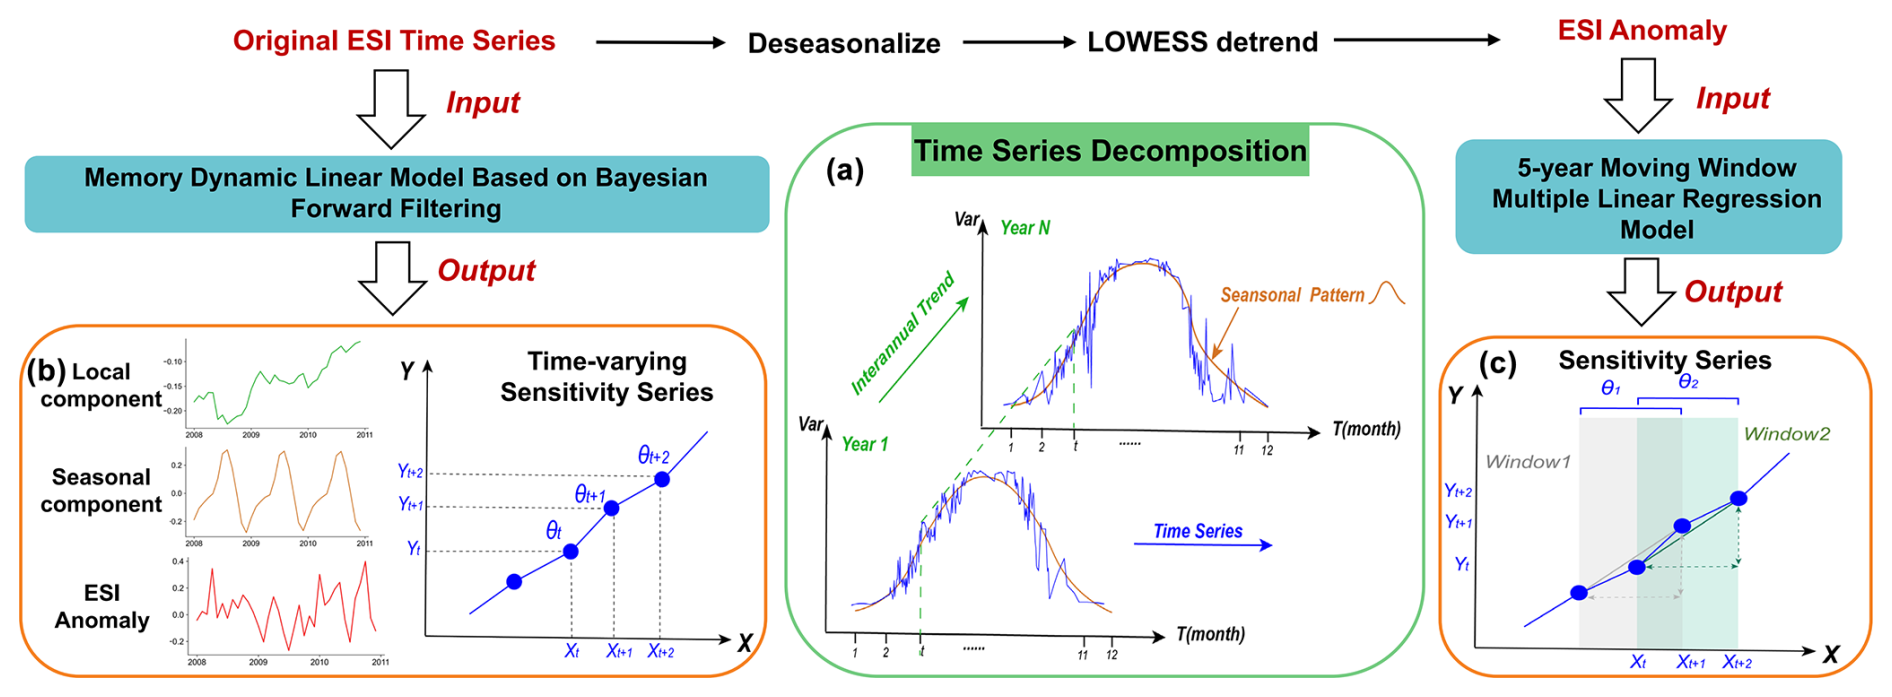
Figure 2Illustration of time-series decomposition and procedures for sensitivity analysis. (a) Conceptual diagram of the time-series structure, where the blue line denotes the intra-annual sequence, the green line signifies the interannual trend, and the brown line illustrates the seasonal cycle pattern. (b) The output of the MDLM. (c) The results from the 5-year moving window multiple linear regression model, in which Y represents the anomaly of ESI, X denotes the driving factors, θ symbolizes the sensitivity of Y to changes in X, and the subscript denotes the specific time point.
To identify the principal factors influencing ET stress, we use Explainable machine learning (SHapley Additive exPlanations), specifically XGBoost and Random Forest (RF) regressors. These models provide a robust approach for feature selection, with SHAP values used to evaluate the importance of each driver, where higher SHAP values indicate greater influence (Lundberg and Lee, 2017). Both XGBoost and RF reduce overfitting risks due to their ensemble nature (Breiman, 2001; Chen and Guestrin, 2016). To optimize the regression model, we use grid search techniques and 5-fold cross-validation for parameter refinement. Furthermore, regularization and the “early stopping” mechanism help manage overfitting and control model complexity. Table S2 in the Supplement presents the performance metrics of two models. Despite the above efforts to prevent overfitting, the relatively low validation accuracy still reveals the SHAP model's susceptibility to misallocating feature importance among highly correlated variables. To address this, we generated multiple training subsets through categorical divisions of temporal scales (8 d, 16 d, monthly) and spatial partitions (drought gradient and land cover types: cropland, forest, grassland). This approach enabled us to obtain diverse importance rankings across China's regions and derive statistically robust importance hierarchies through distribution analysis (Figs. 4 and S3 in the Supplement).
Moreover, we employ partial dependence plots (PDPs) to elucidate the effects of key drivers on the ESI, which show how the model's predictions change in response to variations in individual drivers, while keeping other variables constant (Friedman, 2001; Štrumbelj and Kononenko, 2014). To enhance the robustness, we performed 30 iterations with varying random seeds and averaged the results.
Persistent common trends and analogous seasonal patterns can result in overfitting, thereby concealing the actual causal relationships (Li et al., 2022a) (Fig. 2a). In our SHAP model, we input deseasonalized and detrended anomalies of each variable. Seasonality is mitigated by subtracting the climatological mean, and long-term trends are eliminated through the application of a locally weighted smoothing filter (LOWESS) with a span of 0.3 (Cleveland, 1979).
2.3 Exploration of the time-varying sensitivity
The sensitivity of evaporative stress to key drivers (identified in Sect. 2.2) proxies the ESI's response to driver variations. Given self-amplify mechanisms, the previous state of evaporative stress is modelled by a lag-5 autocorrelation. The mathematical expression for sensitivity is as follows:
where δHydrt, δEnert, δClimt, and δVeget are anomalies in hydrological, energy, climatic, and vegetation conditions, respectively, with subscripts indicating that the anomalies are calculated from the current time (t). The corresponding θ represents the sensitivity of evaporative stress investigated in this study, and ε is the error term. denote the stress states from the previous 1 to 5 stages. Considering the lagging effect, we constructed a memory dynamic linear model based on Bayesian forward filtering (MDLM) to analyse the time-varying sensitivity of ESI. This model draws upon the foundational work of Liu et al. (2019) and Zhang et al. (2021b), which primarily examines the vegetation's response to antecedent growth states and prevailing climatic conditions.
Dynamic linear models serve as a sophisticated statistical methodology for modelling time-series signals by incorporating various contributing factors (Prado et al., 2021). For each pixel, we developed a MLDM that integrates long-term evaporation stress trends, seasonal cycles, the effects of internal memory from the previous five stages, and external drivers. DLM decomposes the ESI series into three components: local mean and trend, seasonal pattern, and regression part. The MDLM, utilizing Bayesian forward filtering, captures the dynamic relationship between ESI's regression components and driving factors at each time step, providing an “instantaneous” response. Additionally, this approach allows sensitivity analysis in both stationary and non-stationary scenarios (Liu et al., 2019; Zhang et al., 2021b), with model precision increasing as the sample size grows. Therefore, we calibrated MLDM using an 8 d resolution, the finest temporal scale available, with data allocation comprising 80 % for training and 20 % for validation. Further details are available in Text S1 in the Supplement.
We also employed multiple linear regression (MLR) with a 5-year moving window to calculate a rough sensitivity sequence for comparison. To remove seasonality and isolate the relationship between ESI anomalies and drivers, we subtracted the long-term average over an 8 d interval and applied the LOWESS method to eliminate local trends. Using Eq. (3), we established a MLR model and analysed the regression coefficients (sensitivity coefficients) for each window. It is crucial to acknowledge that the sensitivity derived from the MLR model represents an average response across a designated window (Fig. 2c), providing only a rough sequence of sensitivity to confirm the overarching trend throughout the study period.
The regression coefficients obtained by the two methods are partial regression coefficients, reflecting the magnitude and direction of the relationship between the variable and the ESI while holding other independent variables constant to remove the obfuscating effects of collinearity (Toyoda, 2024). The precise elucidation of real-world phenomena's intricacies necessitates incorporating a broad spectrum of representative drivers. To prevent overfitting due to multicollinearity, we evaluated the variance inflation factor (VIF) for the independent variables before modelling (Belsley, 1991) (Table S4 in Supplement).
2.4 Other statistical analysis
Besides, we employed Sen's slope estimator (Sen, 1968) to quantify the temporal trend and the Mann–Kendall (MK) test to ascertain the statistical significance (Kendall, 1949; Mann, 1945). The slope > 0 signifies a positive trend, and a slope < 0 denotes a negative trend over time.
This study comprehensively investigates the dynamic trajectory of evaporative stress by comparing the ESI calculated using the conventional PM formula from 1950 to 2020 with the ESI derived from the PM formula incorporating CO2 water-saving effects from 2001 to 2020, enabling a detailed examination of its variation characteristics. Subsequent analyses are conducted using the latter due to limitations in the influencing factors' data series. The SHAP model is applied at 8 d, 16 d, and monthly scales to obtain temporally robust importance rankings. Furthermore, to calculate sensitivity, the MDLM operates at an 8 d temporal resolution, as a larger sample size enhances parameter accuracy. The temporal evolution patterns of sensitivity coefficients are explored at an interannual scale.
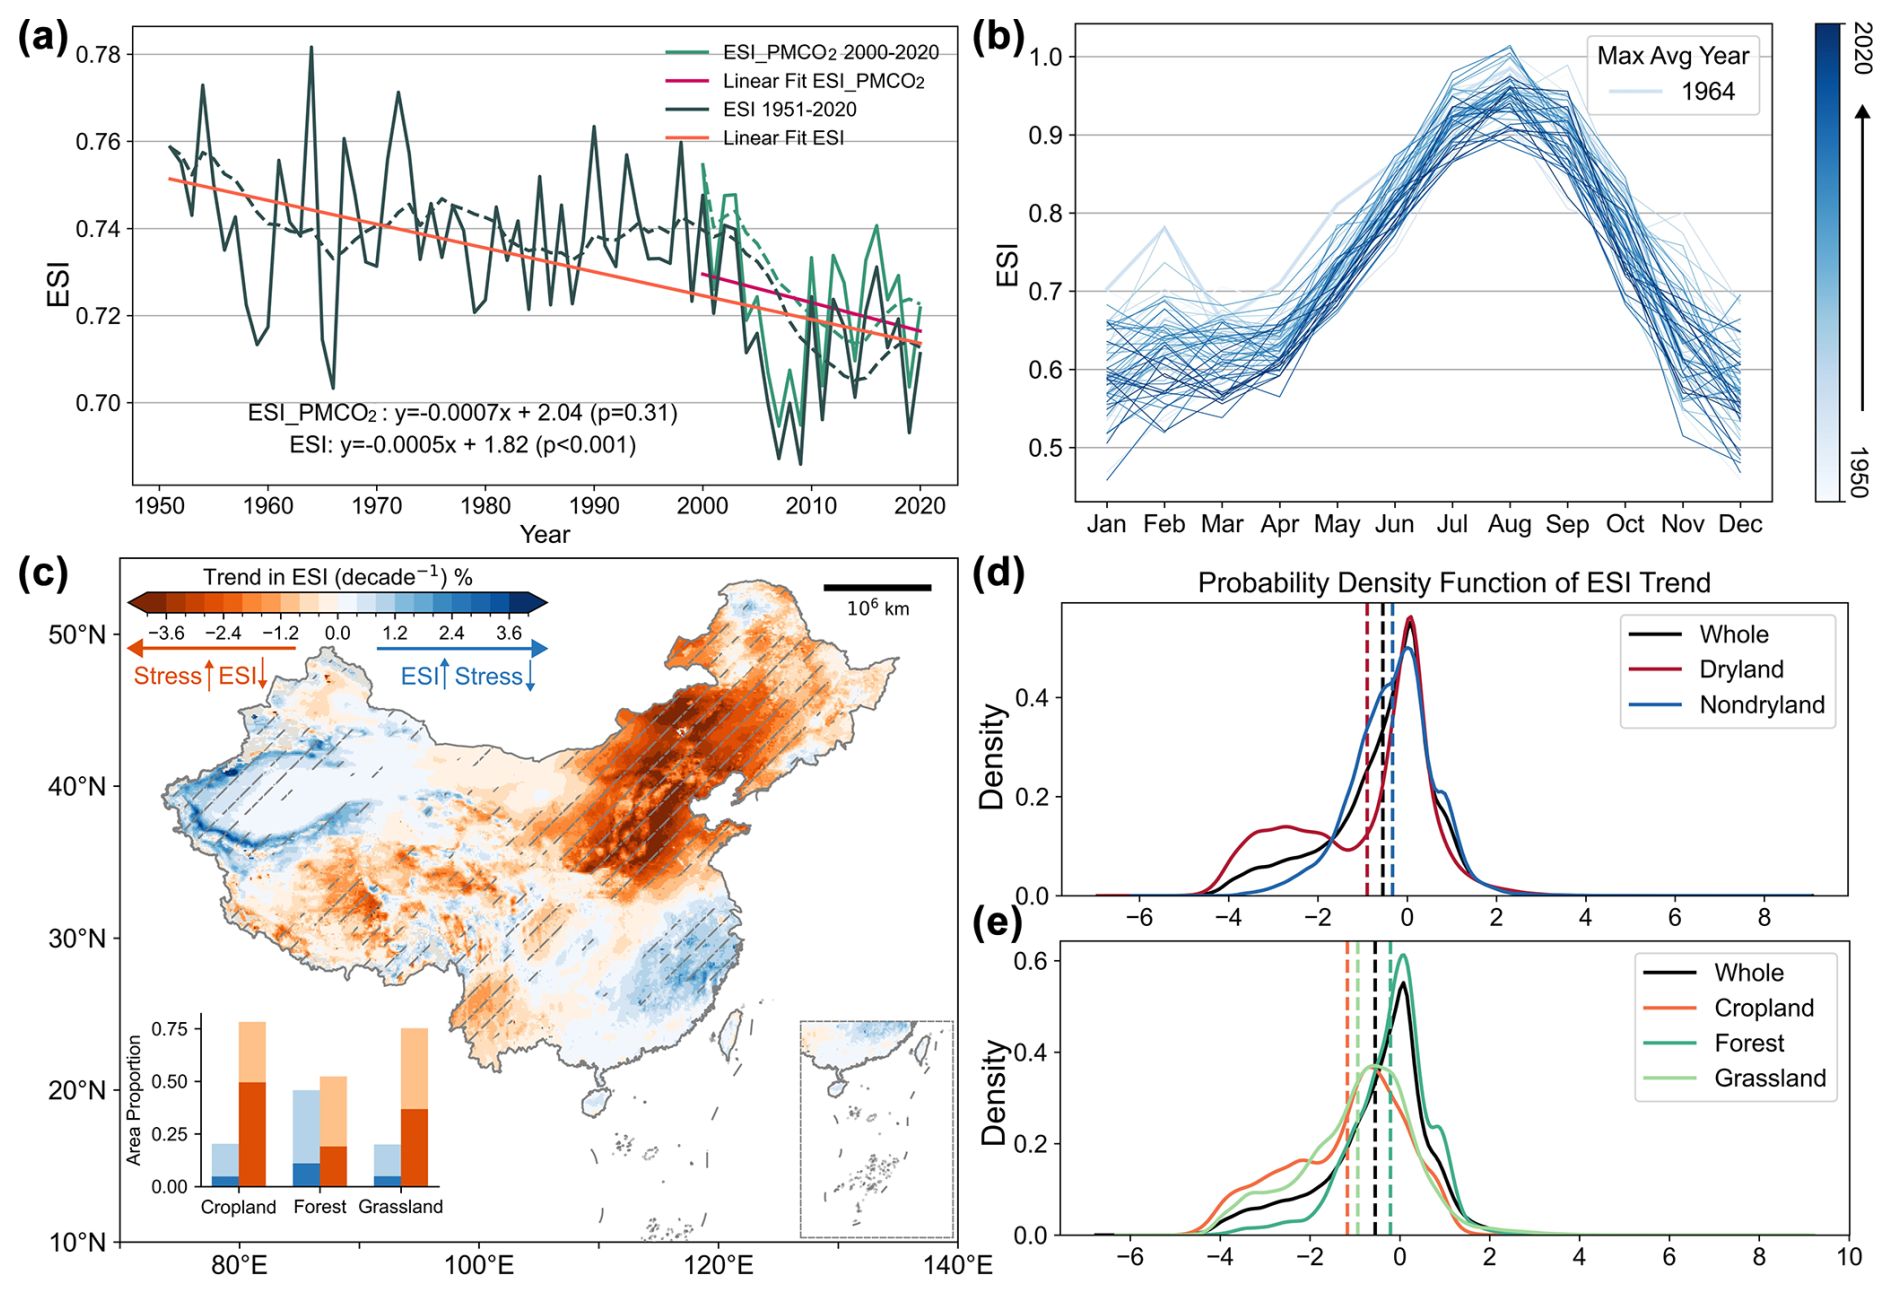
Figure 3Dynamic trajectory of ESI across China from 1950 to 2020. (a) Time series and linear regression of the mean regional ESI, with the traditional PM-equation-derived ESI shown in dark green and the CO2 water-conservation-adjusted ESI in light green. (b) Intra-annual distribution of ESI, with each line corresponding to a different year and darker hues indicating more recent years. (c) ESI trend over the preceding 7 decades, quantified by Sen's slope, where lighter shaded regions denote statistically significant trends at the 0.05 level. The inset graphically summarizes the significant (darker shades) and non-significant (lighter shades) changes of ESI across various vegetation types. Panel (d) and (e) illustrate the distribution of ESI trends in both arid and humid zones, as well as across diverse land-use categories.
3.1 Evapotranspiration stress is intensifying in China
Mainland China demonstrated a pronounced decline in the ESI from 1950 to 2020 (total change of 4.74 %, decreasing by 0.54 % d−1, p < 0.001). While the CO2 water-saving effect partially offset the decline, the downward trend remains largely parallel to the long-term series, indicating a continued exacerbation of evaporative stress (−0.70 % per decade, p = 0.31). Annual tracking over 70 years enhances statistical significance due to the expanded sample size (Fig. 3a). Collectively, the ESI for each month is on a downward trend, with stability in the early growing season (0.58 ± 0.08). Commencing in April, the onset of the growing season prompts a marked increase in ESI and culminates in a peak between 0.9 and 1.0 by August (Fig. 3b).
Spatially, over one-quarter (28.01 %) of the regions nationwide have registered a significant reduction in ESI (p < 0.05), concentrating in the North China Plain and the Northeast, where the rate surpassing 2.40 % per decade. Concurrently, stress in the Northwest and the middle to lower Yangtze River basin is easing (Fig. 3c). ESI declines more sharply in dryland (total change of 7.63 %, decreasing by 0.91 % per decade, p < 0.001) than in non-dryland lands (total change of 2.92 %, decreasing by 0.32 % per decade, p < 0.01) (Figs. 3d and S2 in the Supplement). This decline is observed universally across various land-use categories, with cropland seeing the greatest reduction and the highest percentage of areas (−1.14 % per decade, p < 0.001; 7.59 × 10⁵ km2, 50.24 % of the total cropland area) (Figs. 3c, e, S1, and S2 in the Supplement). Similar dynamics are observed in ESI factoring in the water conservation benefits attributed to CO2. Even so, the decline in ESI for drought-prone and agriculture-intensified regions over the past 2 decades has outpaced that of the preceding 70 years (−1.63 vs −0.91 % per decade in dryland, −1.60 vs −1.14 % per decade in cropland), highlighting the increasing water stress in these areas.
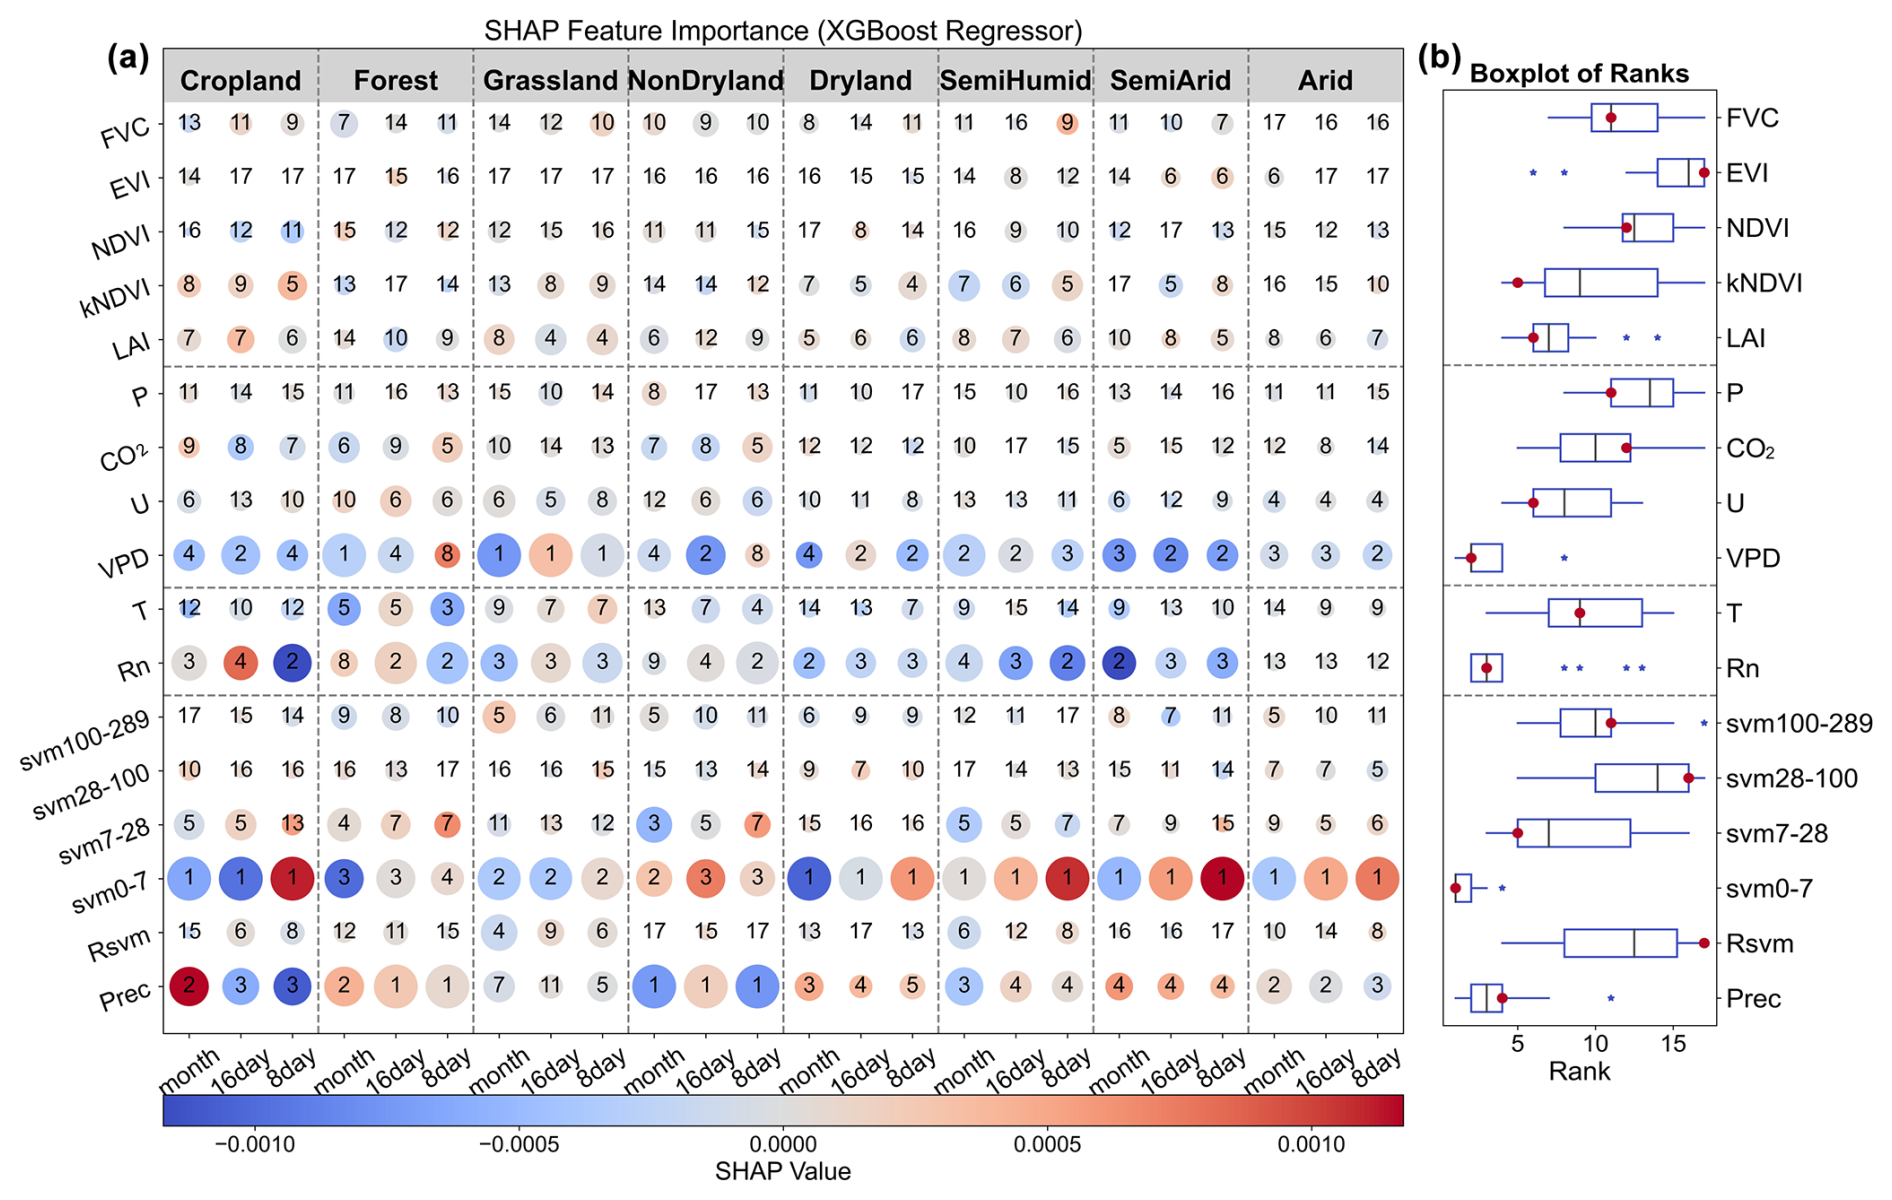
Figure 4Identification of the key external drivers of evapotranspiration stress index (ESI). (a) Matrix plot employs bubble size to represent the absolute values of SHAP, with a colour gradient from blue to red denoting negative and positive effects, respectively. Numerical annotations within each bubble denote the rank of importance for the variables, with higher values signifying greater influence. These ranks are obtained from an explainable machine learning utilizing XGBoost regressors. (b) Box plot provides a statistical representation of the variable rankings across varying underlying surface conditions (corresponding to the row it's in), where the black line denotes the mean ranking and the red dot signifies the median ranking. The analysis incorporates vegetation factors such as FVC, EVI, NDVI, kNDVI, and LAI; meteorological factors including atmospheric pressure (P), carbon dioxide (CO2) concentration, wind speed (U), and VPD; energy factors encompass air temperature (T) and net radiation (Rn); and water supply factors, which account for precipitation (Prec) and the soil volumetric water content (svm) across various soil layer depths, with subscripts specifying the depth range, with 0–7 indicating the soil layer from 0 to 7 cm, and Rsvm representing root-zone soil moisture. Inputs to the model are the anomalies of all aforementioned variables.
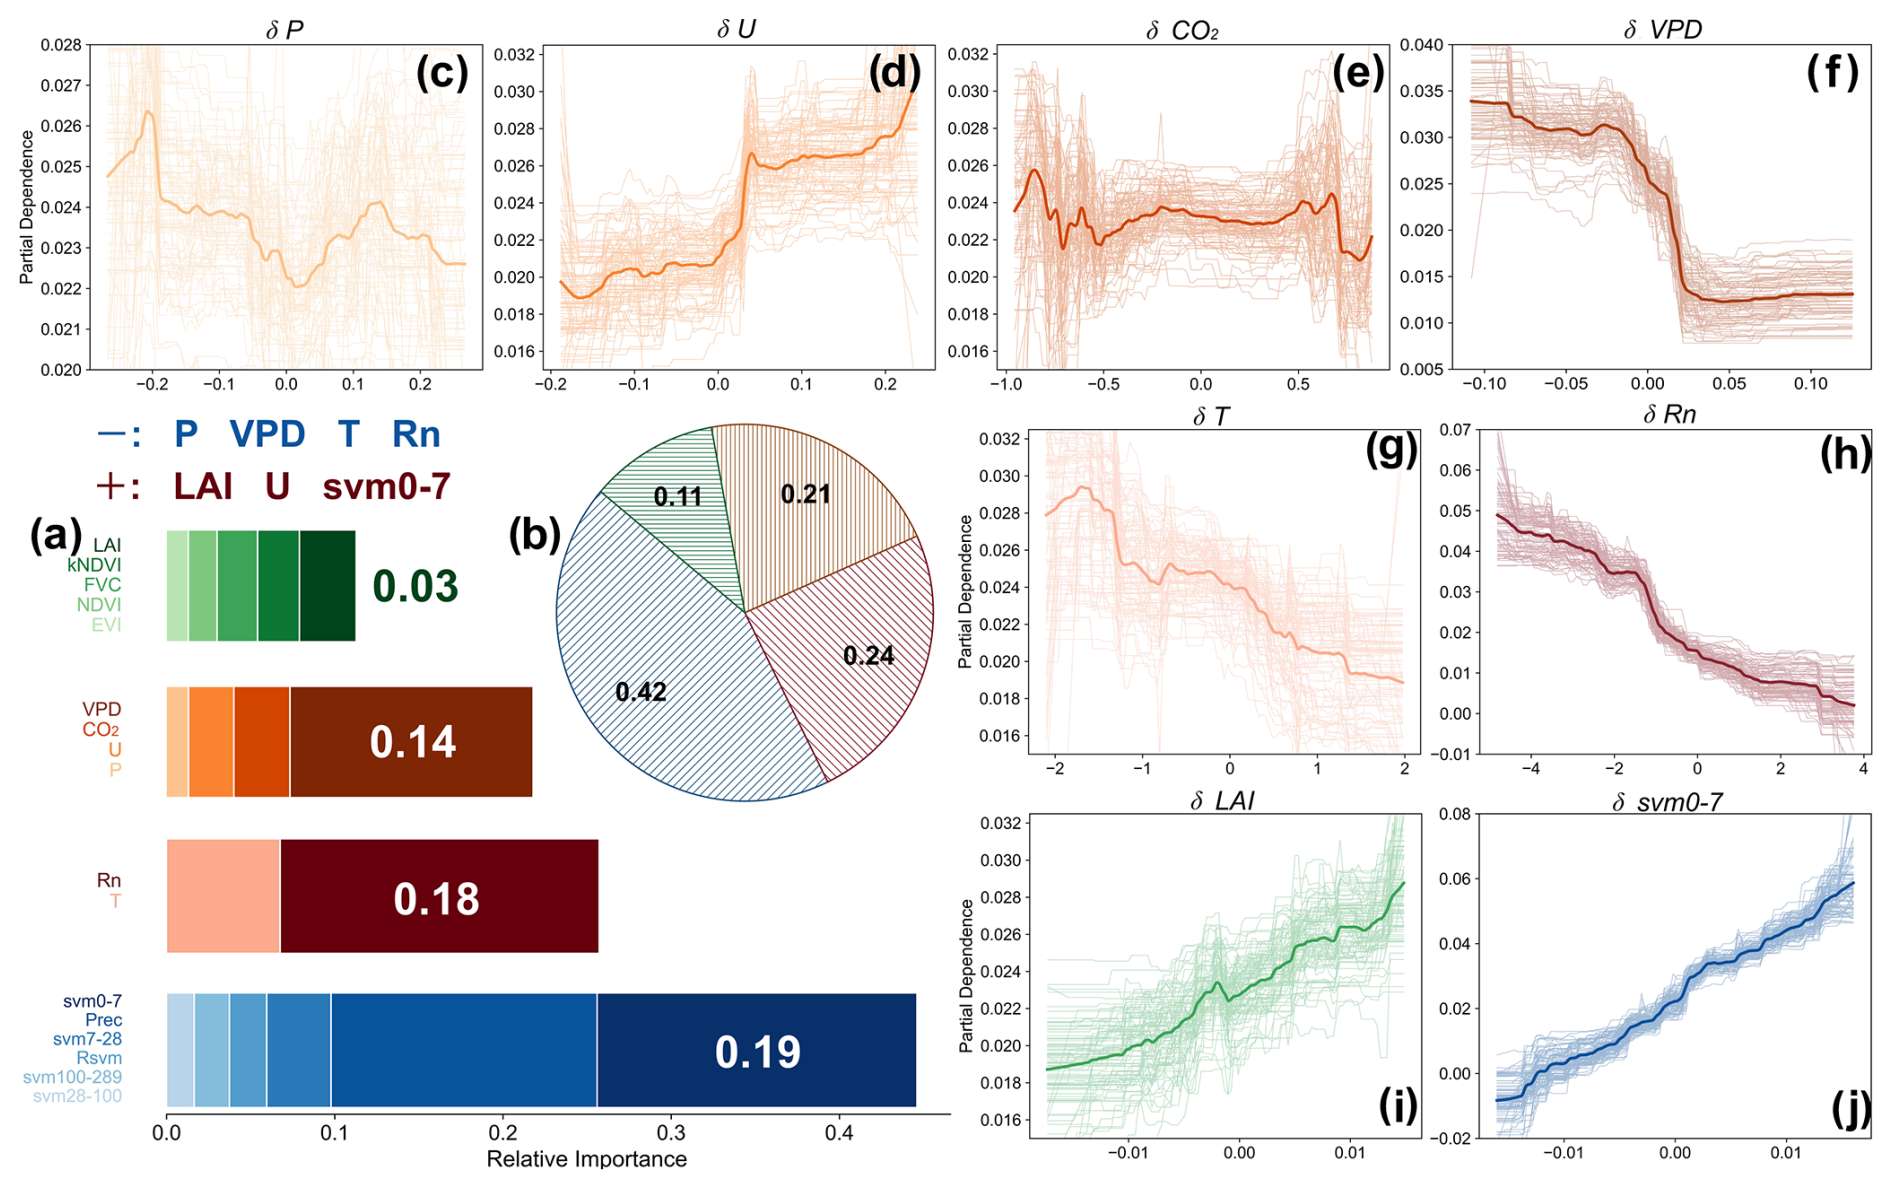
Figure 5Importance and partial dependence of external driving factors influencing ESI. (a) Relative importance of hydrologic, energy, climatic, and vegetation factors in explaining ESI, with each category encompassing multiple indicators. The significance of these indicators is visually encoded by the colour scheme of the bars matching their labels on the left. (b) Pie chart illustrates the proportion of the four categories described in (a). (c–j) Partial dependence graphs correspond to the following variables, in order: P, U, CO2 concentration, VPD, T, Rn, LAI, and soil moisture content for the top 0–7 cm. The thickened lines indicate the average effects, and the light lines around them indicate 30 random incidents from the datasets. This figure is based on an 8 d data series and generated through a SHAP model employing a XGBoost regressor, which processes the anomalies of the variables as inputs.
3.2 Soil moisture as the primary external driver
Both RF and XGBoost models pinpoint shallow soil moisture (0–7 cm) as the paramount driver, indicating that its scarcity is most likely to trigger evaporative stress, especially in water-limited regions, consistent with Liebig's law of the minimum (Danger et al., 2008; Tang and Riley, 2021). Among vegetation proxies, LAI performs the best, likely attributable to its strong correlation with stomatal conductance (Fig. 4b). Similar importance ranking distributions were observed using RF regressor (Fig. S3b). Comparatively, the XGBoost regressor exhibited enhanced stability across multiple subsets, with minimal divergence between training and validation metrics (Table S2), prompting its selection for subsequent importance quantification analysis. Cross-validation reveals that, across an 8 d interval, water, energy, climate, and vegetation factors on ESI variability decline sequentially, contributing 42 %, 24 %, 21 %, and 11 % to ESI, respectively (Fig. 5b). Within each category, the drivers exerting the greatest influence are svm0–7 (0.19), Rn (0.18), VPD (0.14), and LAI (0.03) (Fig. 5a). Monthly-scale analysis reveals amplified hydrological regulation (water contribution = 0.56), with concurrent suppression of vegetation and energy controls (Figs. 5b, S4, and S5 in the Supplement), demonstrating scale-dependent hierarchy in ecosystem stress controls.
Following collinear variable filtering, we identified svm0–7, Rn, T, VPD, U, P, CO2, and LAI as critical external drivers of evaporative stress (parameter set R0). Given precipitation's secondary ranking to svm0–7, we established scenario R1 substituting precipitation to examine hydrological driver divergence (Appendix C). SHAP model calibration across temporal scales revealed ESI response patterns for both variable sets. Reduced multicollinearity enhanced model stability (Table S3 in the Supplement). ESI generally exhibits a nonlinear relationship with several critical factors (Fig. 5c–j), decreasing with a higher VPD, T, and Rn but increasing with U, LAI and svm0–7. Similar patterns are observed across temporal resolutions, reinforcing the robustness of our findings (Figs. S4 and S5). Moreover, the non-monotonic interactions between P and CO2 with ESI highlight the imperative for further investigation into how these factors exacerbate or mitigate evaporative stress across various numerical ranges. However, except for Rn, increasing temporal scale generally decreases the linearity and monotonicity of PDPs (Fig. 5c–j), likely due to data averaging or noise distortion obscuring relationships (Figs. 5, S4, and S5).
3.3 Undergoing dramatic changes in sensitivity of key drivers
To quantify the influence of these variables on the ESI, denoted by sensitivity parameter θ (Table S5 in the Supplement), factorial simulations are conducted using the MDLM and MLR model. The findings demonstrate solid stability and powerful interpretability after successfully passing the multicollinearity test (Table S4).
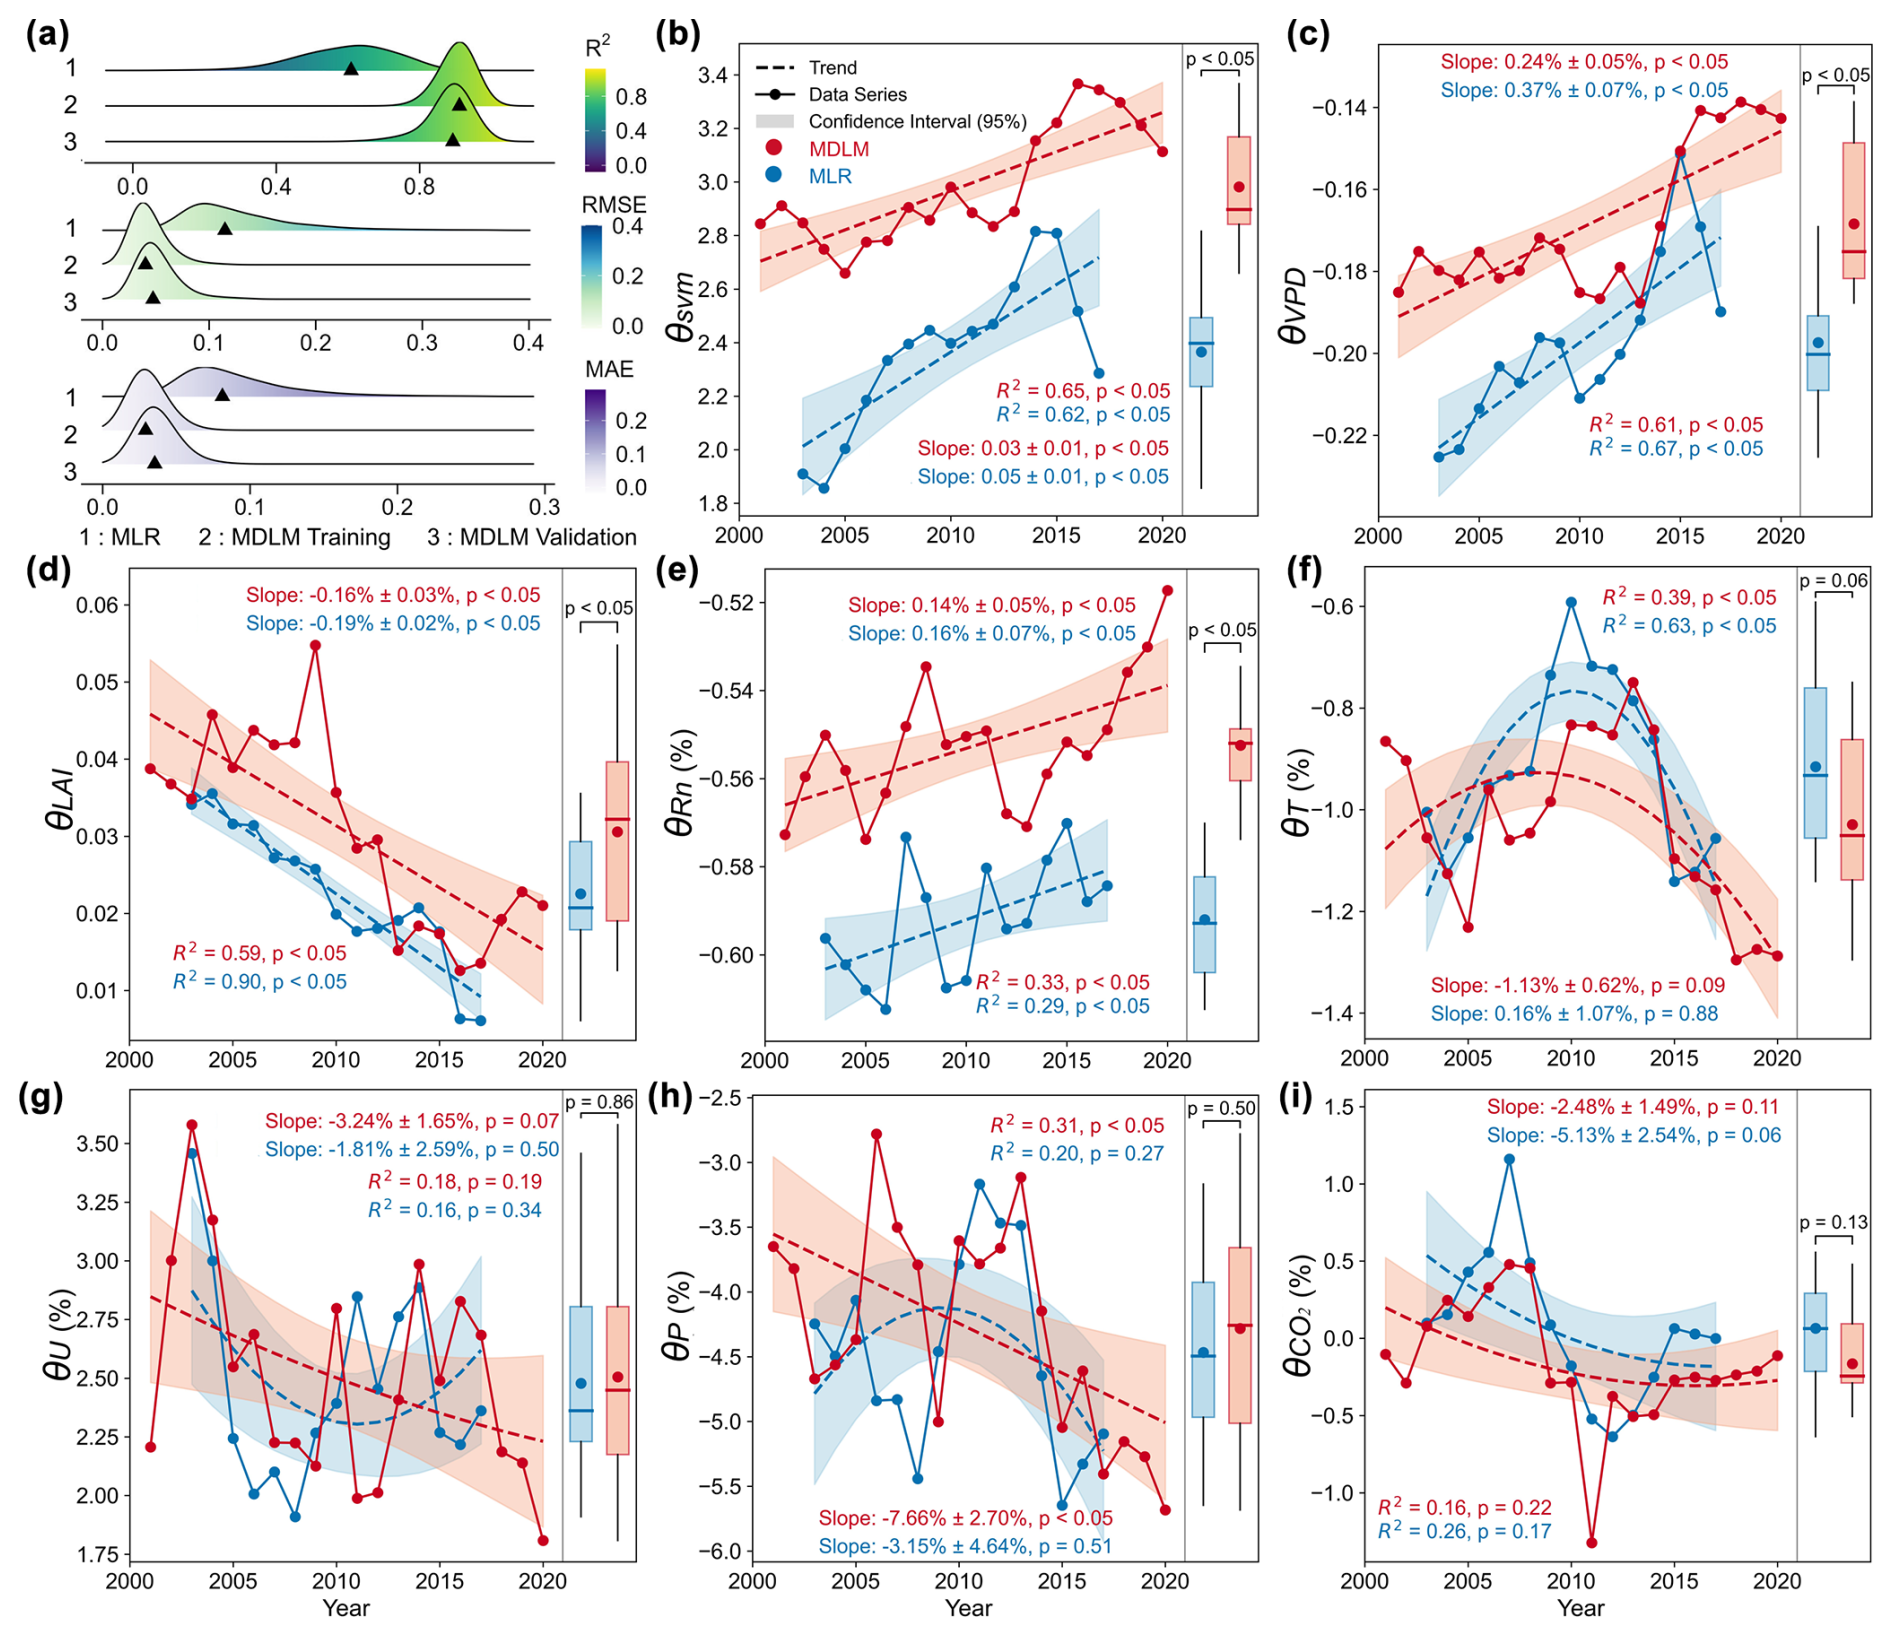
Figure 6Sensitivity of the ESI to external drivers and its dynamic trajectory. (a) Distributions of R2, RMSE, and MAE for MLR and MLDM models across all grid cells in training and validation sets, with triangles marking median positions. (b–i) θ time series derived from MLDM (red) and MLR (blue). Dashed lines indicate linear or quadratic fit trends, with shaded regions representing 95 % confidence intervals of the fits. Text annotations display Sen's slope estimates with statistical significance, along with R2 values and fit significance; quadratic fits were applied when linear trends were insignificant. Box plots illustrate θ distributions: boxes denote interquartile ranges (25th–75th percentiles), horizontal lines represent medians, dots indicate means, whiskers span 5th–95th percentiles, and text annotations specify t test significance of differences between model results.
Soil moisture stands out as the paramount and most sensitive factor, demonstrating a significant upward trend in both models, albeit with quantitative differences (Fig. 6b). MDLM results indicate θsvm increased by 9.49 % over the past 2 decades (0.03 ± 0.01 yr−1, p < 0.001), peaking at a 13 % rise from the previous decade in 2016. In contrast, the MLR model, with a slightly lower mean θsvm (2.36 vs. 2.98), exhibited a stronger growth trend (0.05 ± 0.01 yr−1, p < 0.001), peaking earlier in 2014. This shift in peak timing is an inherent consequence of the moving average process. Similarly, Tang et al. (2025) reported analogous evolutionary patterns and attributed this phenomenon primarily to climatic drivers. Among other pivotal drivers, θVPD and θLAI exhibit considerable numerical values and trends (Figs. 6 and S6 in the Supplement). On average, a 1 kPa rise in VPD correlates with an ∼ 16.84 % rise in evaporative stress according to the MDLM, slightly lower than the 19.74 % increase estimated by the MLR. The MLR also predicts a higher annual growth rate (0.37 ± 0.07 vs 0.24 ± 0.05 % yr−1, p < 0.001) (Fig. 6c). Regarding LAI, the MLR projects a greater decline, with a cumulative reduction of 82.16 % (compared to 45.77 % in the MDLM) and an annual rate of −0.19 ± 0.02 % yr−1 (vs.-0.16 ± 0.03 % yr−1 in the MDLM, p < 0.05) (Fig. 6d). This suggests that the perceived decline in vegetation greening efficacy for drought relief, as assessed by conventional MLR methods, might be overstated. The consensus result from Parameter Set R1 corroborates the robustness of this observation (Fig. S6d).
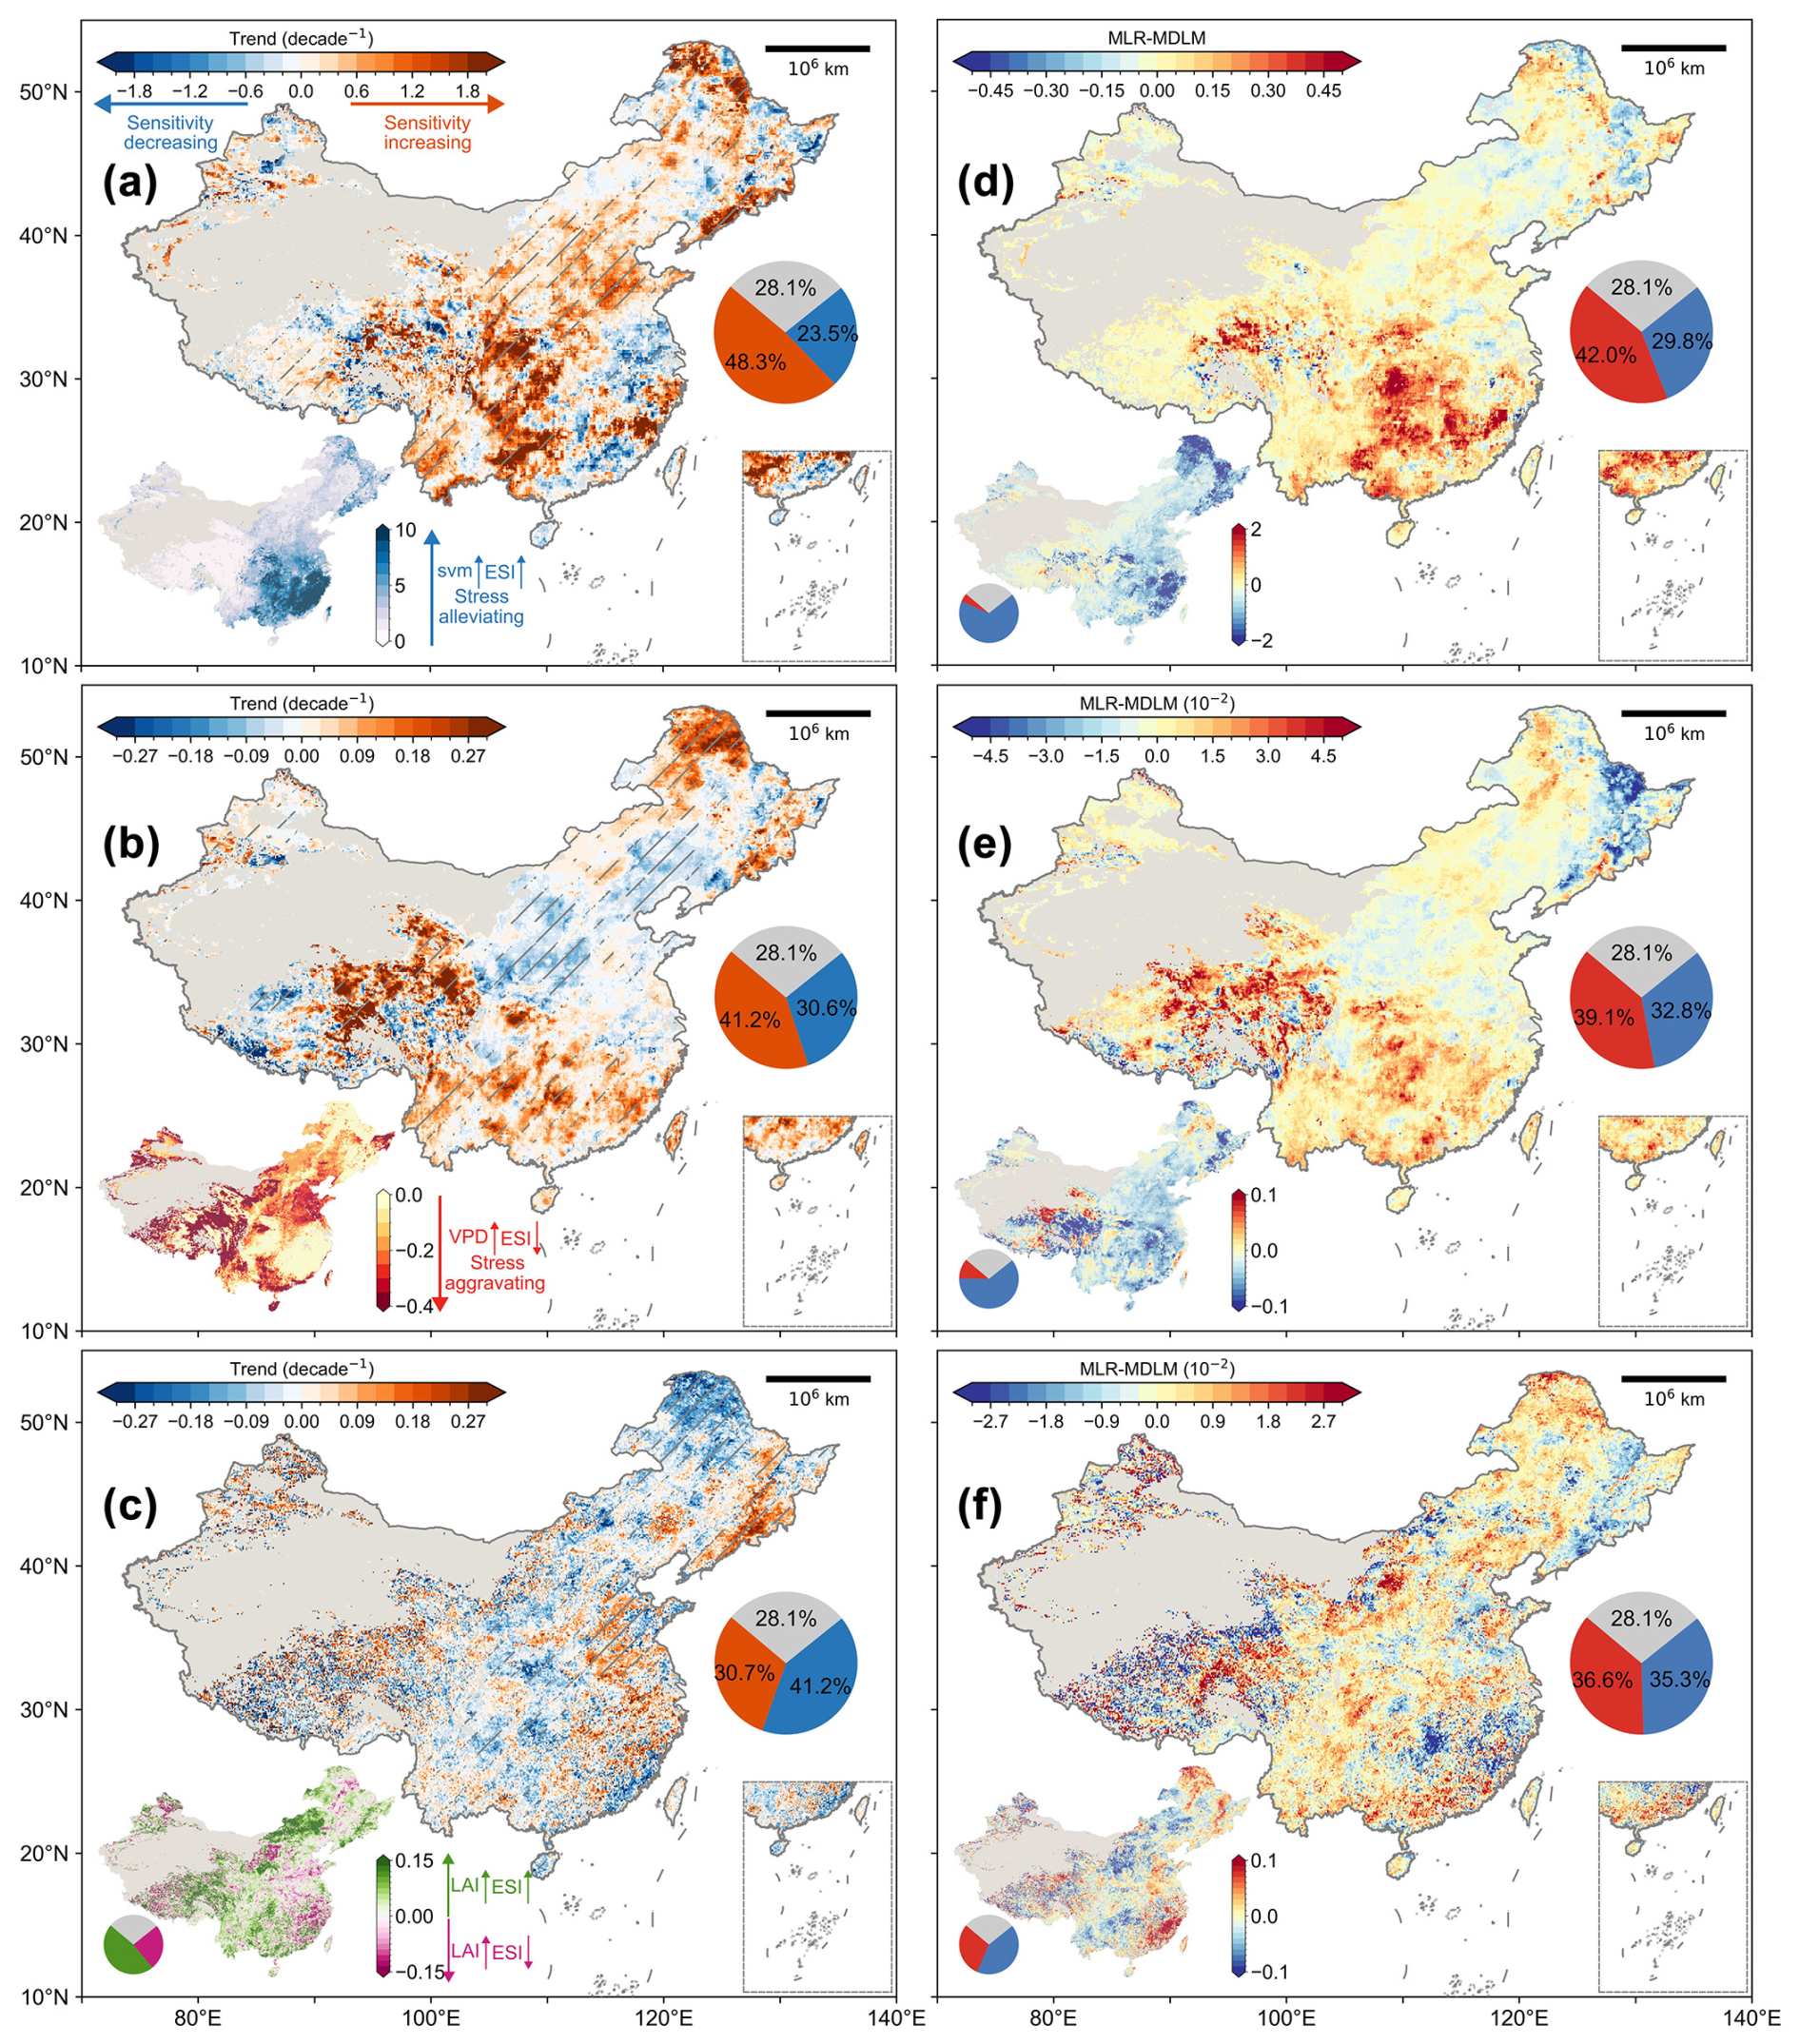
Figure 7Spatiotemporal heterogeneity in sensitivity of ESI to svm0–7, VPD, and LAI. (a–c) Spatial distributions of temporal trends (estimated by Sen's slope) for θsvm (sensitivity of ESI to svm0–7), θVPD, and θLAI, respectively. Orange indicates increasing trends, and blue denotes decreasing trends, with hatched patterns marking significance at p < 0.05 (Mann–Kendall test). Insets display spatial distributions of multi-year mean θ. (d–f) Discrepancies in Sen's slope estimates and multi-year mean values between MLR- and MDLM-derived θ (a–c). Pie charts quantify the proportion of land area exhibiting corresponding trend patterns. Grey indicates non-vegetated areas.
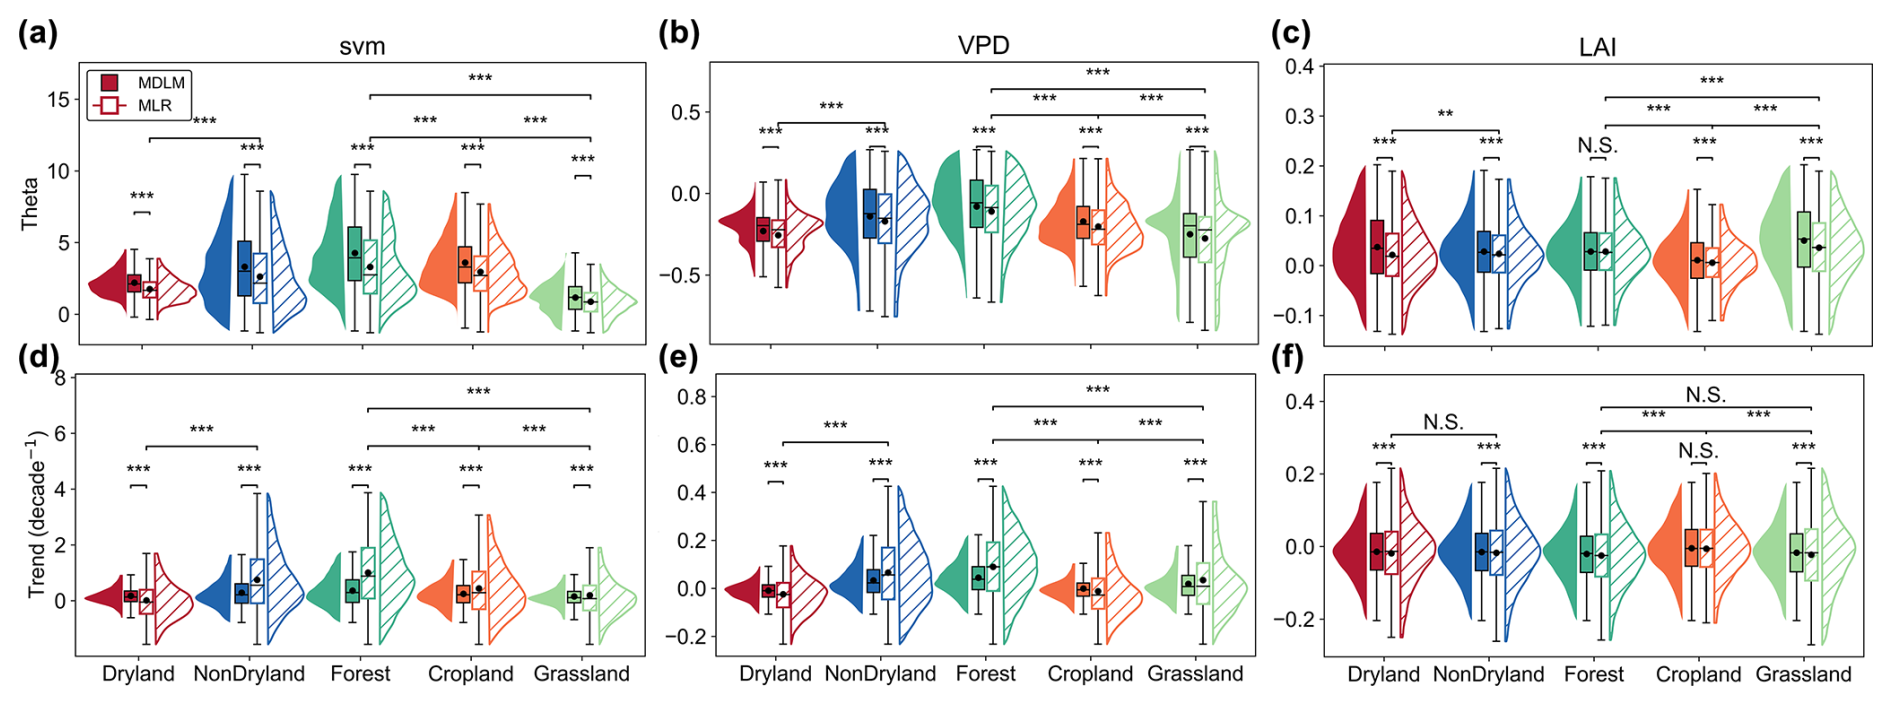
Figure 8Sensitivity comparisons between MDLM and DLM models across regional land types. (a–c) Distributions of sensitivity parameters θ (ESI to svm, VPD, and LAI) in dryland, non-dryland, forest, cropland, and grassland. Box plots show interquartile ranges (25th–75th percentiles, boxes), medians (central lines), means (dots), and data ranges (5th–95th percentiles, whiskers). Corresponding probability density curves are plotted alongside. Top asterisks indicate t test significance between different groups: three asterisks (∗) denote p < 0.001, N.S. = non-significant differences.
Spatially, θsvm is predominantly higher in the southeast and lower in the northwest, while θPrec exhibits a complementary pattern (Figs. 7a and S10a in the Supplement). This indicates that in humid regions, ESI is primarily affected by soil moisture regulation, whereas in arid regions, short-term precipitation can substantially alleviate evaporative stress. The specific mechanisms are discussed in Sect. 4.2. Additionally, θsvm also varies by land-use type, with forest showing the strongest sensitivity and most drastic changes, followed by cropland and grassland (MLDM: 4.27 > 3.60 > 1.17, Fig. 8a and d). A plausible explanation is that regions endowed with optimal water conditions and robust ecological structure exhibit increased sensitivity due to the magnified impacts resulting from the disequilibrium of hydrology, climate, and vegetation (Forzieri et al., 2022). Notably, sensitive hotspots were distributed near the “Hu Line” and in the lower Yangtze River basin (Fig. 7a). Given the recent shifts in forest composition (large-scale planting of single tree species) coupled with the increasing extreme climatic events (Ruan et al., 2022; Yin et al., 2022), these areas warrant special attention. Furthermore, sizeable areas (MDLM: 4.00 × 10⁶ km2, approximately 48.3 % of China mainland) experienced a rise in θsvm (Sen's slope > 0, Fig. 7a), with a similar pattern observed in MLR (Fig. S9a in the Supplement). However, MLR underestimates θsvm in nearly all vegetated areas (∼ 93.6 %), while markedly overestimating its increasing trend in ∼ 58.5 % of these areas, particularly in the south (Figs. 7d and S9a).
Similarly, MLR shows a comparable spatial pattern of underestimation in values and overestimation in trends when estimating θVPD (Figs. 7b, e and S9b). It exhibits notable regional disparities, with dryland encountering a 1.64-fold greater increase in ET stress per unit of VPD compared to wet regions (MDLM: −23.02 % vs −14.07 %). θVPD is decreasing in arid regions (−0.89 % per decade, p < 0.01), in contrast to the increasing trend in humid regions (3.36 % per decade, p < 0.001); therefore the discrepancy between dryland and non-dryland is anticipated to widen (Fig. 8b and e). Notably, MLR indicates an even greater trend divergence between dryland and non-dryland regions (−2.41 % vs. 6.58 % per decade, p < 0.001, Fig. 8e). Interestingly, the response of evaporative stress to LAI (θLAI) exhibits in both positive and negative ways. Approximately 29.6 % (2.81 × 10⁶ km2), counterintuitively, experienced an increase in LAI coupled with intensified ET stress (θLAI < 0), mainly in the Loess Plateau, North China Plain, and lower Yangtze River region (Fig. 7c). In these areas, rapid greening and intensive agricultural expansion are linked to heightened water deficits (Feng et al., 2016; Lu et al., 2018; Wang et al., 2024). In the lower Yangtze River region, increased LAI is associated with reduced evaporation (Zhang et al., 2021c), possibly due to shading effects that lower surface radiation, soil temperature, and soil evaporation (Forzieri et al., 2020). Regions where increased LAI alleviated stress are predominantly near the “Hu Line” (θLAI > 0, 4.01 × 10⁶ km2, ∼ 42.27 %), where sensitivity trends showing a significant decline (Sen's slope < 0, Fig. 7c). This region is a focal point for China's afforestation efforts (Zhan et al., 2023), implying that the benefits of sustained greening in reducing ET stress might be lessening. Additionally, artificial agronomic regulation renders minimal and stable θLAI in cropland (MLDM: θLAI = 1.11 %, Sen's slope = −0.48 % per decade, Fig. 8c and f). Figure 8 further illustrates that the values and trends of θsvm, θVPD, and θLAI, as estimated by MLDM and MLR, display statistically significant differences (p < 0.001) across most climate zones and vegetation types, underscoring substantial methodological discrepancies. Within the same land-use categories, the MLR model consistently demonstrates more dispersed sensitivity trend distributions and higher intra-group variability (Fig. 8).
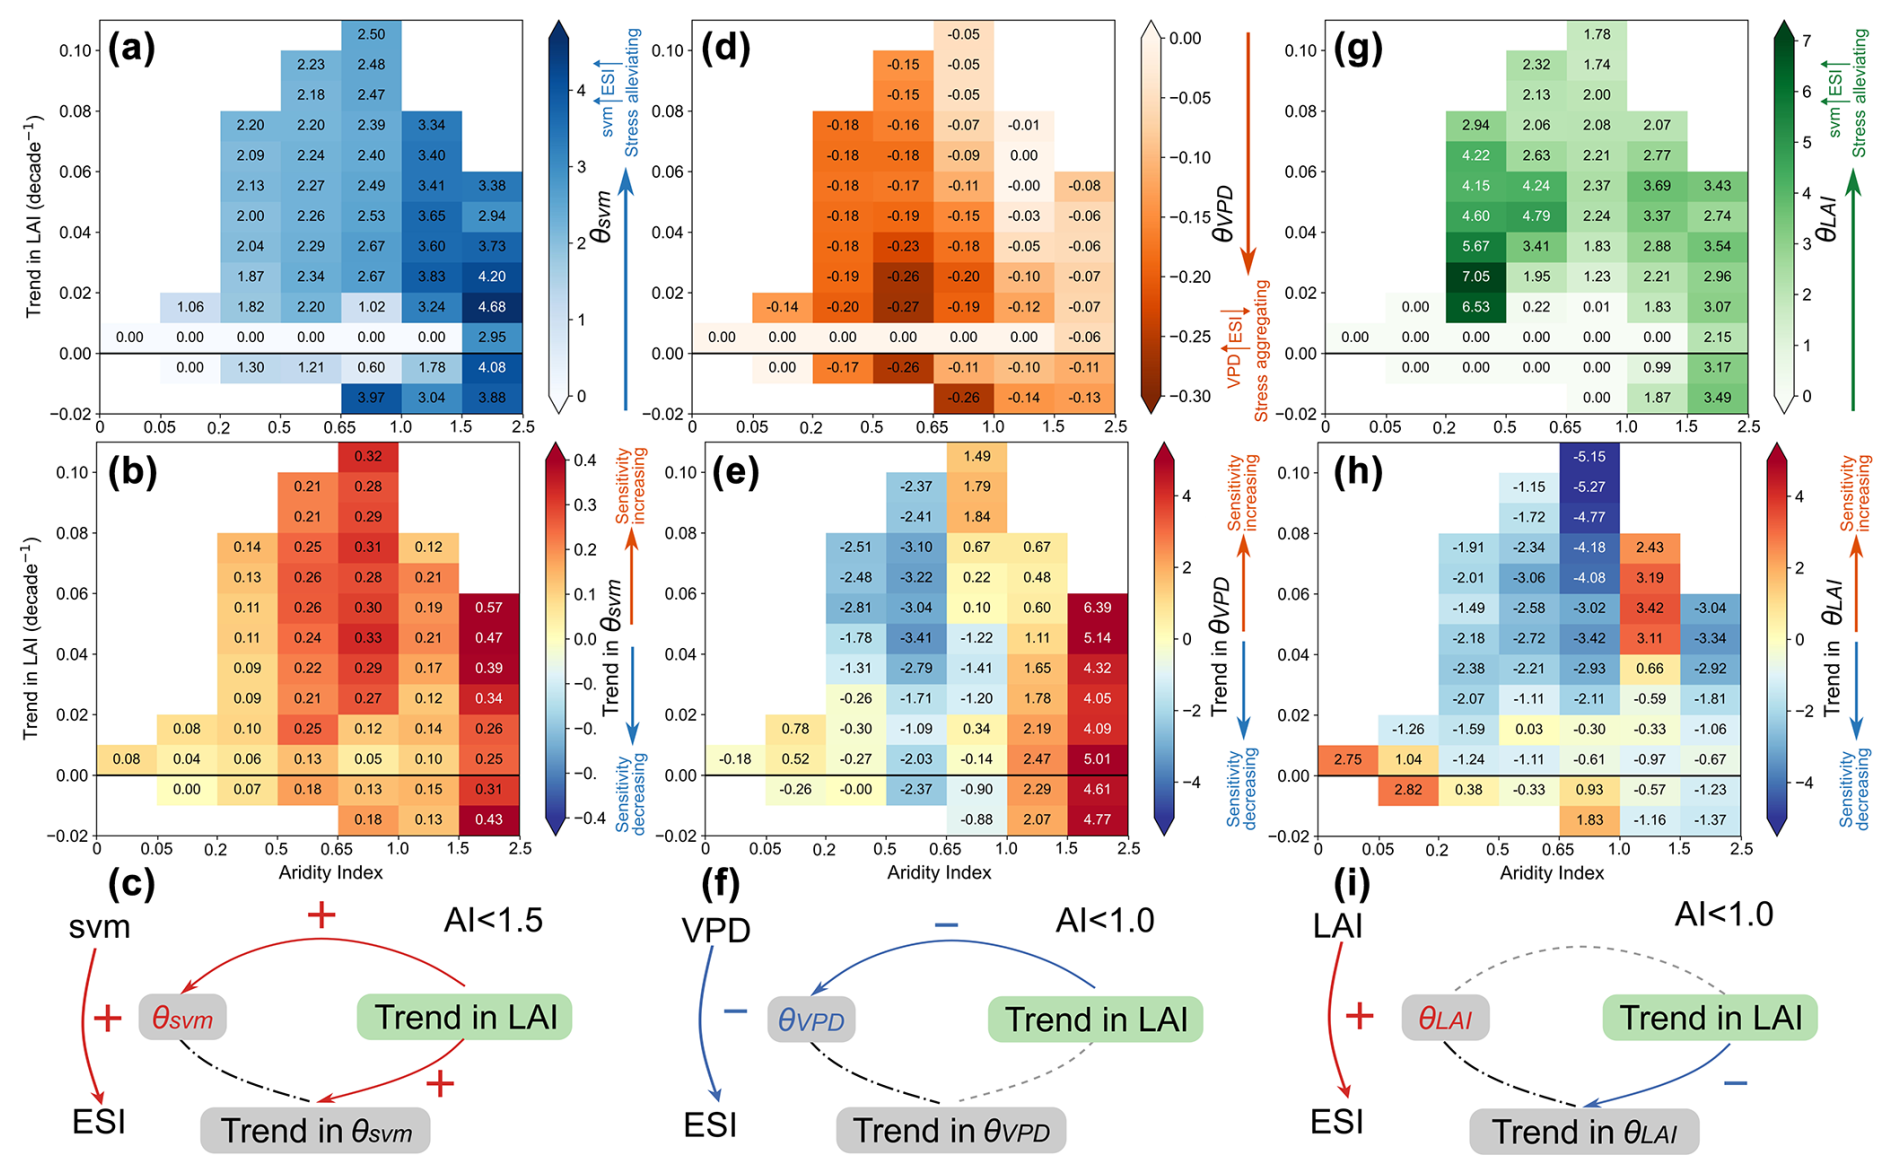
Figure 9Sensitivity and its trend of ESI to svm0–7, VPD, and LAI along greening and aridity gradient. (a) The grouping statistics of θsvm across different bins, categorized by differing degrees of aridity and trends in LAI. Median value is shown for each grid and the number of grid points within each bin is shown in Fig. S12 in the Supplement. Similar to (a), (b) pertains to the grouping statistics of the trends of θsvm. (c) The conceptual diagram delineates the covariation between LAI trends and θsvm, including their respective trends, in regions with an Aridity Index (AI) below 1.5. It offers a conceptual interpretation of the patterns depicted in (a) and (b) for these areas. Note that an increase in ESI indicates a mitigation of evaporative stress. Panels (d–f) and (g–h) are analogous to (a–c); however, their main focus is VPD and LAI, respectively. In panels (c–i), the upper right corner indicates the aridity of regions adhering to the specified pattern. A red line with a “+” sign denotes direct proportionality, whereas a “−” sign accompanied by a blue line indicates inverse proportionality. A grey dashed line represents an ambiguous relationship, and a black dashed line highlights the sensitivity parameter θ and its corresponding trend.
3.4 Sensitivity of soil moisture increases with enhanced greening
Given the prominent greening tendency in China, we further explored the connection between greening and the sensitivity of dramatically changing variables (Fig. 9). In extremely humid regions (AI > 1.5), faster greening trends are associated with lower θsvm values (Fig. 9a). Conversely, in less humid regions (AI < 1.5), particularly in semi-arid and semi-humid zones (0.2 < AI < 0.65), both θsvm and its trend increase alongside the gradient of greening trends, suggesting higher sensitivity and greater acceleration (Fig. 9a and b). Specifically, when 0.2 < AI < 0.5, θsvm rises progressively from 1.30 to 2.20, while the associated trend simultaneously escalates from ∼ 0 to 0.2.
Unlike θsvm, θVPD and θLAI (and their trends) do not exhibit a co-varying gradient pattern along the greening trends (Fig. 9d–i). Remarkably, drier regions with slower pace of greening display greater absolute θVPD values (|θVPD|, Fig. 9d), suggesting that heightened VPD amplifies ET stress per unit increase. However, in rapid greening areas, |θVPD| tends to be diminished (Fig. 9d), likely because denser vegetation enhances transpiration, increasing atmospheric moisture and partially offsetting moisture deficit stress (Fig. 9d and f). These findings imply that vegetation greening may, to some extent, improve the ecosystem's resilience to atmospheric drought. Concerning θLAI, a faster LAI increase corresponds to a steeper decline in θLAI, reducing the efficacy of LAI in mitigating ET pressure (Fig. 9h and i). Consequently, greening-induced water stress mitigation may be less pronounced than anticipated.
4.1 Mechanistic advancements of the MDLM
Previous research has largely focused on the long-term average response of individual variables in the hydrological–climatic–vegetation nexus. Our study employs the ESI as a metric to assess the dynamic equilibrium of the system and introduce the MDLM to capture its time-varying response (Fig. 1). The MDLM, characterized by its mechanism-driven architecture and operational simplicity, can inherently detrend and deseasonalize data, eliminating the need for anomaly pre-processing. It shows a 44.26 % improvement in simulation accuracy over the moving-window MLR (R2 increasing from 0.61 to 0.88, Figs. 6a, and S6–S8), consistent with high fitting accuracies (> 0.90) reported in other studies (Zhang et al., 2021b). This improvement is primarily attributed to Bayesian forward filtering embedded in the MDLM for dynamic parameter estimation and its capability to approximate nonlinear dependencies as quasi-linear relationships at discrete temporal nodes (Fig. 3). Consequently, it provides time-specific analyses, unlike the window-averaged sensitivity produced by MLR (Liu et al., 2019; Zhang et al., 2022). Pixel-scale model comparisons indicate that the MDLM outperforms the MLR across the entire study area (Figs. S7 and S8 in the Supplement), demonstrating its high flexibility and broad applicability to diverse climatic and terrain conditions. More importantly, comparing the θ sequences for key variables (svm, VPD, and LAI) reveals that the MLR significantly overestimates their temporal trends (Figs. 6–8, S6, S9, and S10). These MLR processes – truncating sequence, smoothing, and simplifying nonlinear dynamics – not only lead to signal loss but also cause substantial differences in θ evolution trajectories (Figs. 6g, h and S6g). These findings highlight the need to re-evaluate the suitability of traditional moving average methods for determining inter-variable coupling strength or temporal sensitivity trends.
4.2 Enhanced evapotranspiration stress and its moisture-driven mechanisms
Our findings indicate that despite the water-saving benefits of elevated atmospheric CO2 levels, various regions in China have distinctly experienced increased evaporative stress (Figs. 3a, b and S1). This phenomenon is in concordance with several recent detrimental environmental shifts, including land surface desiccation, rising evaporation demand, and groundwater depletion (Jasechko et al., 2024; Qing et al., 2023; Yuan et al., 2019). The pronounced increase in ET stress in dryland and cropland underscores the vulnerability of these ecosystems (Figs. 3c–e, S1, and S2a, c), primarily attributed to the considerable desiccation of soil moisture (Fig. S11a in the Supplement). Soil moisture, as the exclusive direct water supply source for terrestrial evaporation processes – whether from land surface or plant transpiration – exerts a paramount role (Smith and Boers, 2023; Zhao et al., 2023) (Figs. 4–6 and S3–S6). Over the past 20 years, increased soil water sensitivity and variability has led to greater ET stress intensification (Figs. 6b, 7a, and S11a). Sporadic studies on time-varying sensitivity also reveal that water supply increasingly impacts ecosystems (Hu et al., 2023; Li et al., 2022a; Zeng et al., 2022; Zhang et al., 2022). Our simulations, using precipitation as a water proxy for moisture, also corroborated these findings (Figs. S6b and S10). Hence, addressing the threats posed by soil moisture deficits in arid cropland is crucial for ensuring water and food security.
Intriguingly, our research identifies a complementary spatial pattern between θsvm (southern high–northern low) and θPrec across China (Figs. 7a and S10a). In northern arid/semi-arid regions with low initial soil moisture, precipitation acts as an “instantaneous input” that rapidly replenishes soil moisture and substantially alleviates evaporative stress, exhibiting higher sensitivity. Conversely, in southern humid regions where soils maintain near saturation, surpassing the pre-existing hydro-equilibrium threshold triggers disproportionately severe ecosystem perturbations. Consequently, ESI in these regions demonstrates heightened dependence and sensitivity to soil moisture dynamics. Analogously, despite a relatively moderate increase in forest ET stress (Figs. 3c–e and S2), soil moisture sensitivity emerges both highly pronounced and rapidly enhanced recently (Fig. 8a). In regions with favourable hydrological conditions and stable ecological structures, the collapse of the hydrological–climatic–vegetation system can precipitate profoundly adverse effects (Forzieri et al., 2022). Furthermore, in the face of increasingly intense and severe extreme climatic events, complex ecosystems require closer monitoring to formulate proactive strategies.
4.3 Ecological implications of “greening but drying” feedbacks in a changing climate
Additionally, the pace of greening may influence ecosystems' ability to withstand different types of water stress. On the one hand, in semi-arid and semi-humid regions, the sensitivity of ESI to soil moisture and its variability are proportional to the greening trend (Fig. 9a–c). Therefore, once a soil drought occurs, the adverse impact on ET stress increases, suggesting that overly rapid greening can diminish an ecosystem's resilience to soil drought. Specifically, when afforestation surpasses the carrying capacity dictated by regional hydroclimatic conditions, a slight soil deficit can trigger the self-amplify cycle and result in vegetation degradation and mortality, known as overshoot drought (Zhang et al., 2021b). From a long-term lens, reliance on irrigation during the early stages of artificial vegetation establishment, aimed to ensure plant survival, can hamper the formation of deep root systems (Moreno-Mateos et al., 2020; Xiao et al., 2024b). This practice weakens the plant–groundwater linkage in drylands, subsequently diminishing their resilience (Wang et al., 2023). On the other hand, VPD sensitivity and the greening trend exhibit an inverse gradient (Fig. 9d), particularly in arid lands with high θVPD values Fig. 8b), indicating that greening in drylands has improved the ability to cope with atmospheric drought. Two mechanisms may explain this phenomenon:
-
In certain arid zones, deep-rooted vegetation accesses deep soil moisture during droughts, releasing it into the atmosphere via transpiration, which increases humidity but may also worsen soil aridity (Liang et al., 2024; Sun et al., 2021).
-
Greening reduces surface albedo, limiting surface temperature rise and mitigating atmospheric drought through indirect thermal regulation (Zhang et al., 2024).
Concerning LAI, a faster greening trend correlates with a diminishing contribution of LAI growth in alleviating water stress (Figs. 9d, 8h, and S13h in the Supplement). In certain regions, enhanced LAI may exacerbate water stress (Fig. 7c). Gleason et al. (2017) found that high vegetation density may exacerbate inter-species competition for water, leading to increased water stress for individual plants or specific communities, providing a cogent explanation for our findings. Collectively, although greening has traditionally been considered a positive environmental adjustment, we advocate for a more critical and dialectical understanding. In adherence to sustainable development imperatives, policymakers and decision-makers are tasked with the precise identification of regions amenable to greening initiatives and the establishment of quantifiable benchmarks that will safeguard ecological equilibrium and foster enduring sustainability.
4.4 Research limitations and prospects
Although this study provides valuable insights into the interplay between regional greening and complex ecological couplings in China, it remains subject to certain limitations in methodology and data. First, the observational sample size from flux stations is insufficient, as it has been employed solely for the screening of reanalysis products rather than dynamic factorial simulations. Second, deviations in Parameter Set R0 and R1 indicate that other local factors such as soil texture, vegetation acclimation, plant demographic rates, and vegetation–groundwater dependency may exert considerable influence (Abel et al., 2024; Fu et al., 2024b; Patel et al., 2021). More in-depth studies based on long-term ecophysiological observations and purpose-built field experiments are needed to further unravel the complex mechanisms of VPD, soil moisture, and LAI in land–atmosphere interactions.
Finally, what are the key implications given the glimpse of intensifying evapotranspiration stress coinciding with its increasing sensitivity to soil water deficits in a greening China? Soil water variability would lead to greater changes in the ecosystems undergoing rapid greening. That is, stronger drought effects can be expected when soil water is anomalously low. Concurrently, the increase in LAI may not alleviate evaporative stress as much as expected. Combined with the increasing frequency and severity of extreme climate events, a “greening but drying” trend may thus be more prevalent in the future, potentially raising the risk of ecosystem imbalance.
Our study introduces a memory-driven dynamic linear model (MDLM) that integrates the “dry gets drier” legacy effects to evaluate time-specific sensitivities of evapotranspiration stress drivers in China under rapid vegetation greening. Using the Evapotranspiration Stress Index (ESI) as a proxy for ecosystem water–atmosphere–vegetation equilibrium, we documented a 4.74 % intensification of ET stress across mainland China from 1950 to 2020. Soil moisture sensitivity was the dominant driver, rising by 9.49 % during 2001–2020. Enhanced vegetation greening exhibited stronger coupling with elevated soil moisture sensitivity but reduced VPD sensitivity, reflecting greater susceptibility to soil drought but enhanced resilience to atmospheric aridity. Compared to the conventional moving-window multiple linear regression (MLR) method, the MDLM framework increased the coefficient of determination (R2) by 44.26 %, offering more accurate sensitivity estimates. Methodologically, this work underscores the need to critically re-evaluate trend overestimation inherent in traditional MLR methods. Our findings advance mechanistic understanding of complex regional ecosystem dynamics and offer guidance for steering greening strategies toward a more stable equilibrium among water, atmosphere, and vegetation.
We utilize the ratio of actual evapotranspiration (ETa) to potential evapotranspiration (ETp) to calculate the Evapotranspiration Stress Index (ESI). Before investigating the dynamic changes of ESI, we compared three widely used datasets: the Global Land Evaporation Amsterdam Model v3.7a (daily, 0.25°), the Terra Moderate Resolution Imaging Spectroradiometer (MODIS) MOD16A2GF Version 6.1 (8 d, 500 m), and the European Centre for Medium-Range Weather Forecasts (ECMWF) ERA5-Land (hourly, 0.1°). The results are subsequently validated against observational data from 26 eddy covariance (EC) stations (Fig. A1), sourced from various observation networks (station details in Table S1 in the Supplement). Each site has at least 1 year of continuous observations and energy balance residuals < 35 W m−2 (calculated using Eq. A1). Outliers are removed using a 3-standard-deviation method, and rainy day observations are excluded. Subsequently, data imputation is conducted using the IterativeImputer tool in Python. The latent heat measured at the EC station is converted to ETa (Eq. A2), and ETp is calculated using the traditional Penman–Monteith method (Eq. A3).
where Rn represents net radiation; G denotes soil heat flux, which is zero on a daily scale; LE refers to daily latent heat; and H represents sensible heat flux, with all units expressed in W m−2.
In Eq. (A2), the unit of ETa is mm d−1, with the constant value of λ at 0 °C taken as 28.94.
where the unit of ETp is mm d−1; Δ is the slope of the saturation vapour pressure versus temperature curve (kPa °C−1); γ is the psychrometric constant (kPa °C−1); U is wind speed at 2 m (m s−1); T is surface air temperature (°C); and es and ea are saturated and actual vapour pressure (kPa) and whose difference serves as a crucial indicator of atmospheric moisture deficit, known as vapour pressure deficit (VPD). At the grid scale, all climatic variables used to calculate ETp, including Rn, T, and U, are obtained from the ERA5 dataset. VPD is calculated based on the Clausius–Clapeyron relation using 2 m temperature and dew point temperature (Held and Soden, 2006; Zhong et al., 2023).
To avoid overestimating ETp, we employed the formula developed by Yang et al. (2019) to calculate grid ETp, accounting for the CO2 water-saving effect (Eq. A4). This formula has been widely recognized and applied in recent studies, providing a solid theoretical basis for accurate evapotranspiration estimates (Lian et al., 2021; Zhang et al., 2023). All meteorological data used in the formula came from ERA5, while monthly CO2 data from CarbonTracker (CT2022) covered 2001–2020 at a 3° × 2° resolution. After considering the water-saving effect of CO2, the mean, maximum, and minimum values of ETp in China decreased by 9.48, 30.85, and 19.42 mm, respectively, while the pattern is mirrored (Fig. A2a, b, and d). The conventional ETp calculation method overestimated values across 99.6 % of mainland China, particularly in northern arid regions (Fig. A2c).
where 2.4 × 10 denotes the effect of atmospheric CO2 concentration (ppm) on surface stomatal resistance.
Figure A3 compares the ESI derived from three datasets, revealing substantial discrepancies attributable to methodological differences. For ETp estimation, MODIS and ERA5 apply the PM formula calibrated for idealized vegetation types, consistent with our research hypotheses in Fig. 1. In contrast, GLEAM integrates actual vegetation heterogeneity. The ETa < ETp constraint in MODIS and GLEAM limits their ability to capture water surplus conditions (Fig. A3c and d), whereas ERA5 – free of this restriction – produces ESI spatial patterns aligned with eddy covariance (EC) flux measurements (Fig. A3a and b). Incorporating CO2 water-saving effects into ETp calculations identifies an expansion of non-water-limited regions, enhancing aridity-humidity characterization ontological congruence (Fig. A3a, b, and e). Note that our research is dedicated to analysing the temporal dynamics of the ESI, particularly in relation to the intensification of drought conditions. The conceptual diagram (Fig. 1) demonstrates that lower ESI values signify increasingly severe imbalances and stress levels. The study does not address how often the threshold of 1 is crossed, and it does not explore the physical significance of this threshold.
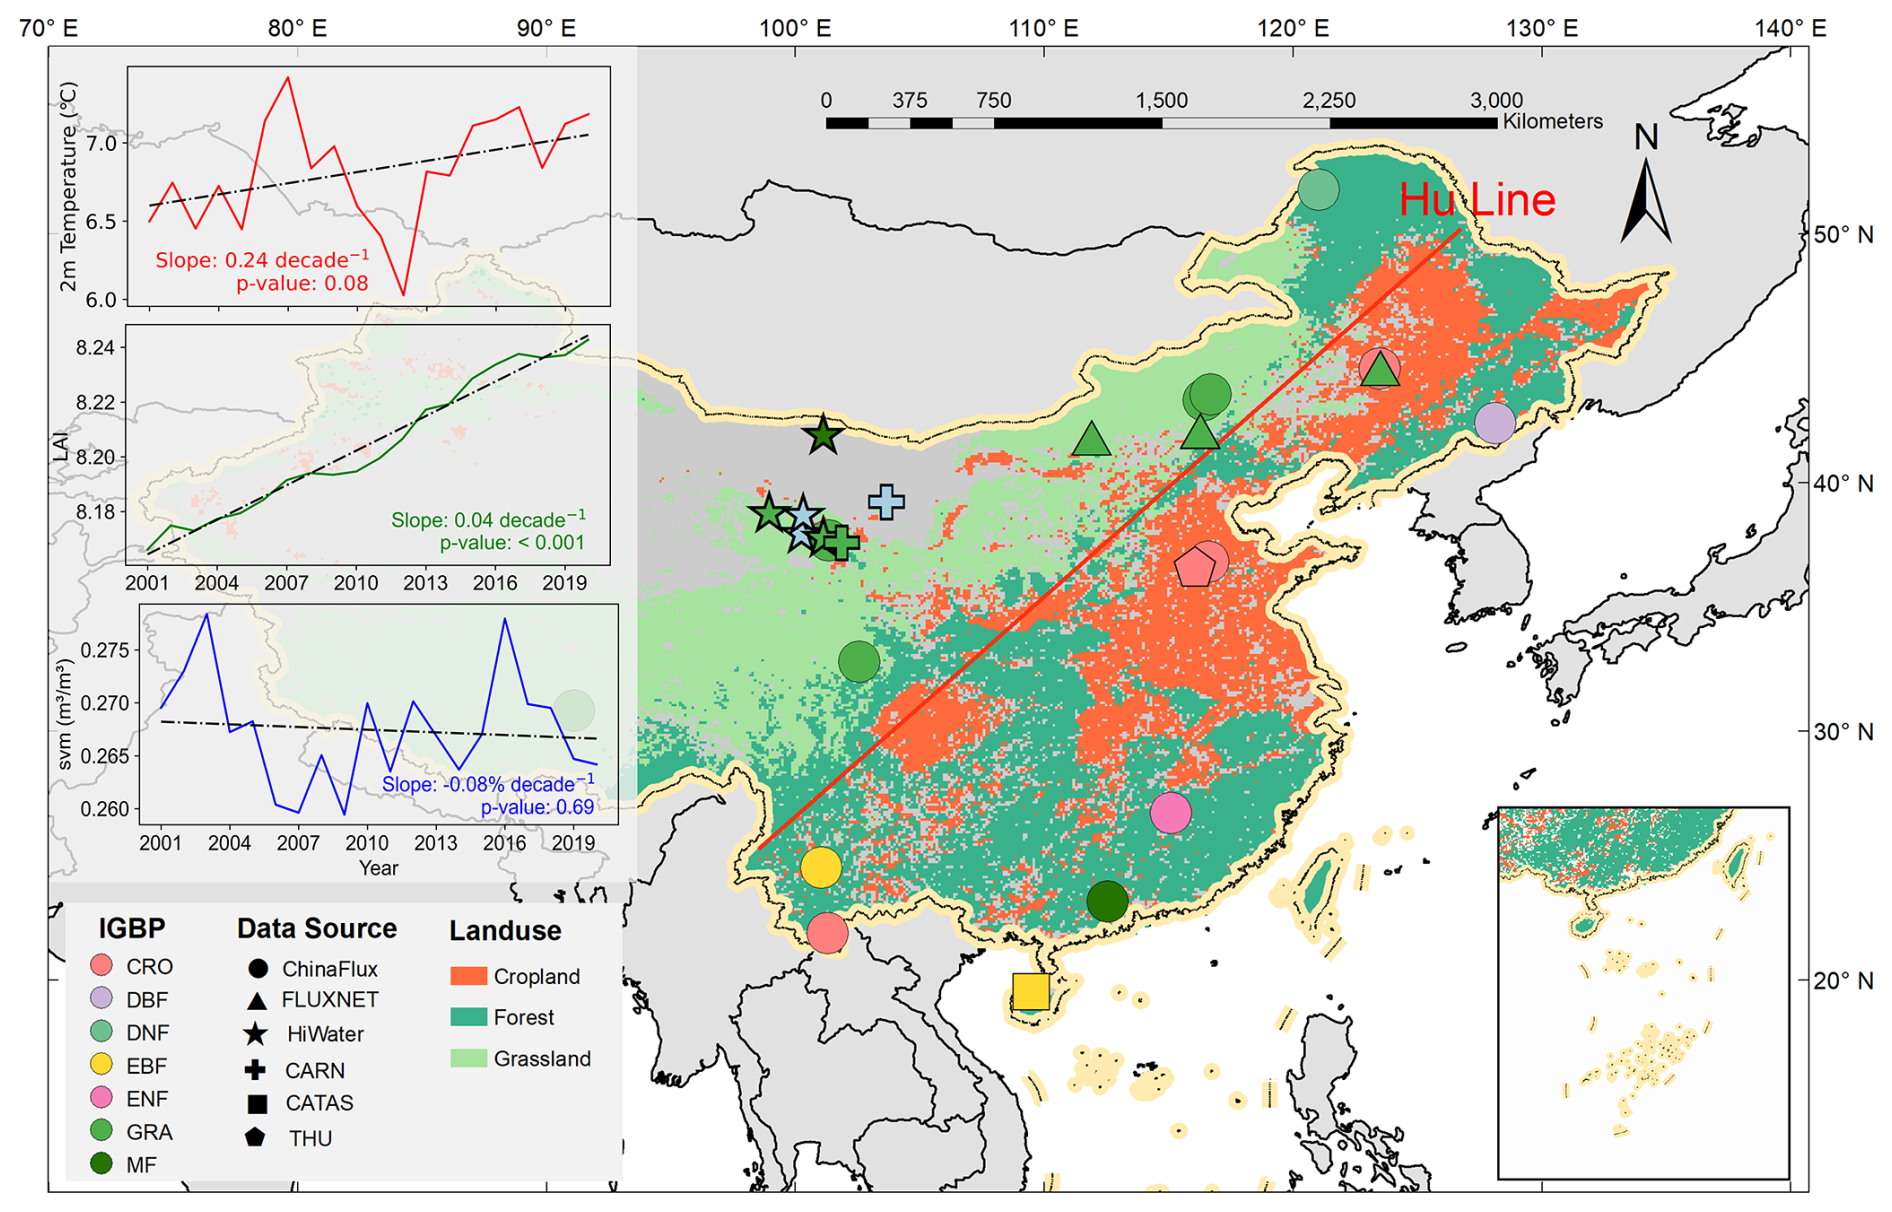
Figure A1Location of the study area and distribution of multi-year average ESI. The extent of the study area, employing a tri-chromatic map to differentiate between cropland, forest, and grassland; dots denote the positions of EC flux stations, with colours representing the International Geosphere-Biosphere Programme (IGBP) classifications and shapes indicating observational sources. The inset displays time-series plots of regional average air temperature (red), surface soil moisture (blue), and LAI (green) over the past 20 years, with a dashed black line denoting the linear trend. The red slanted line denotes the position of the “Hu Line” (also known as the Hu Huanyong Line), with its neighbouring transitional area defined as the “Hu Zone”, fundamental geographical demarcation in China that characteristically differentiates regional hydrological regimes, vegetation coverage gradients, and demographic distribution patterns (Hu, 1935; Li et al., 2024).
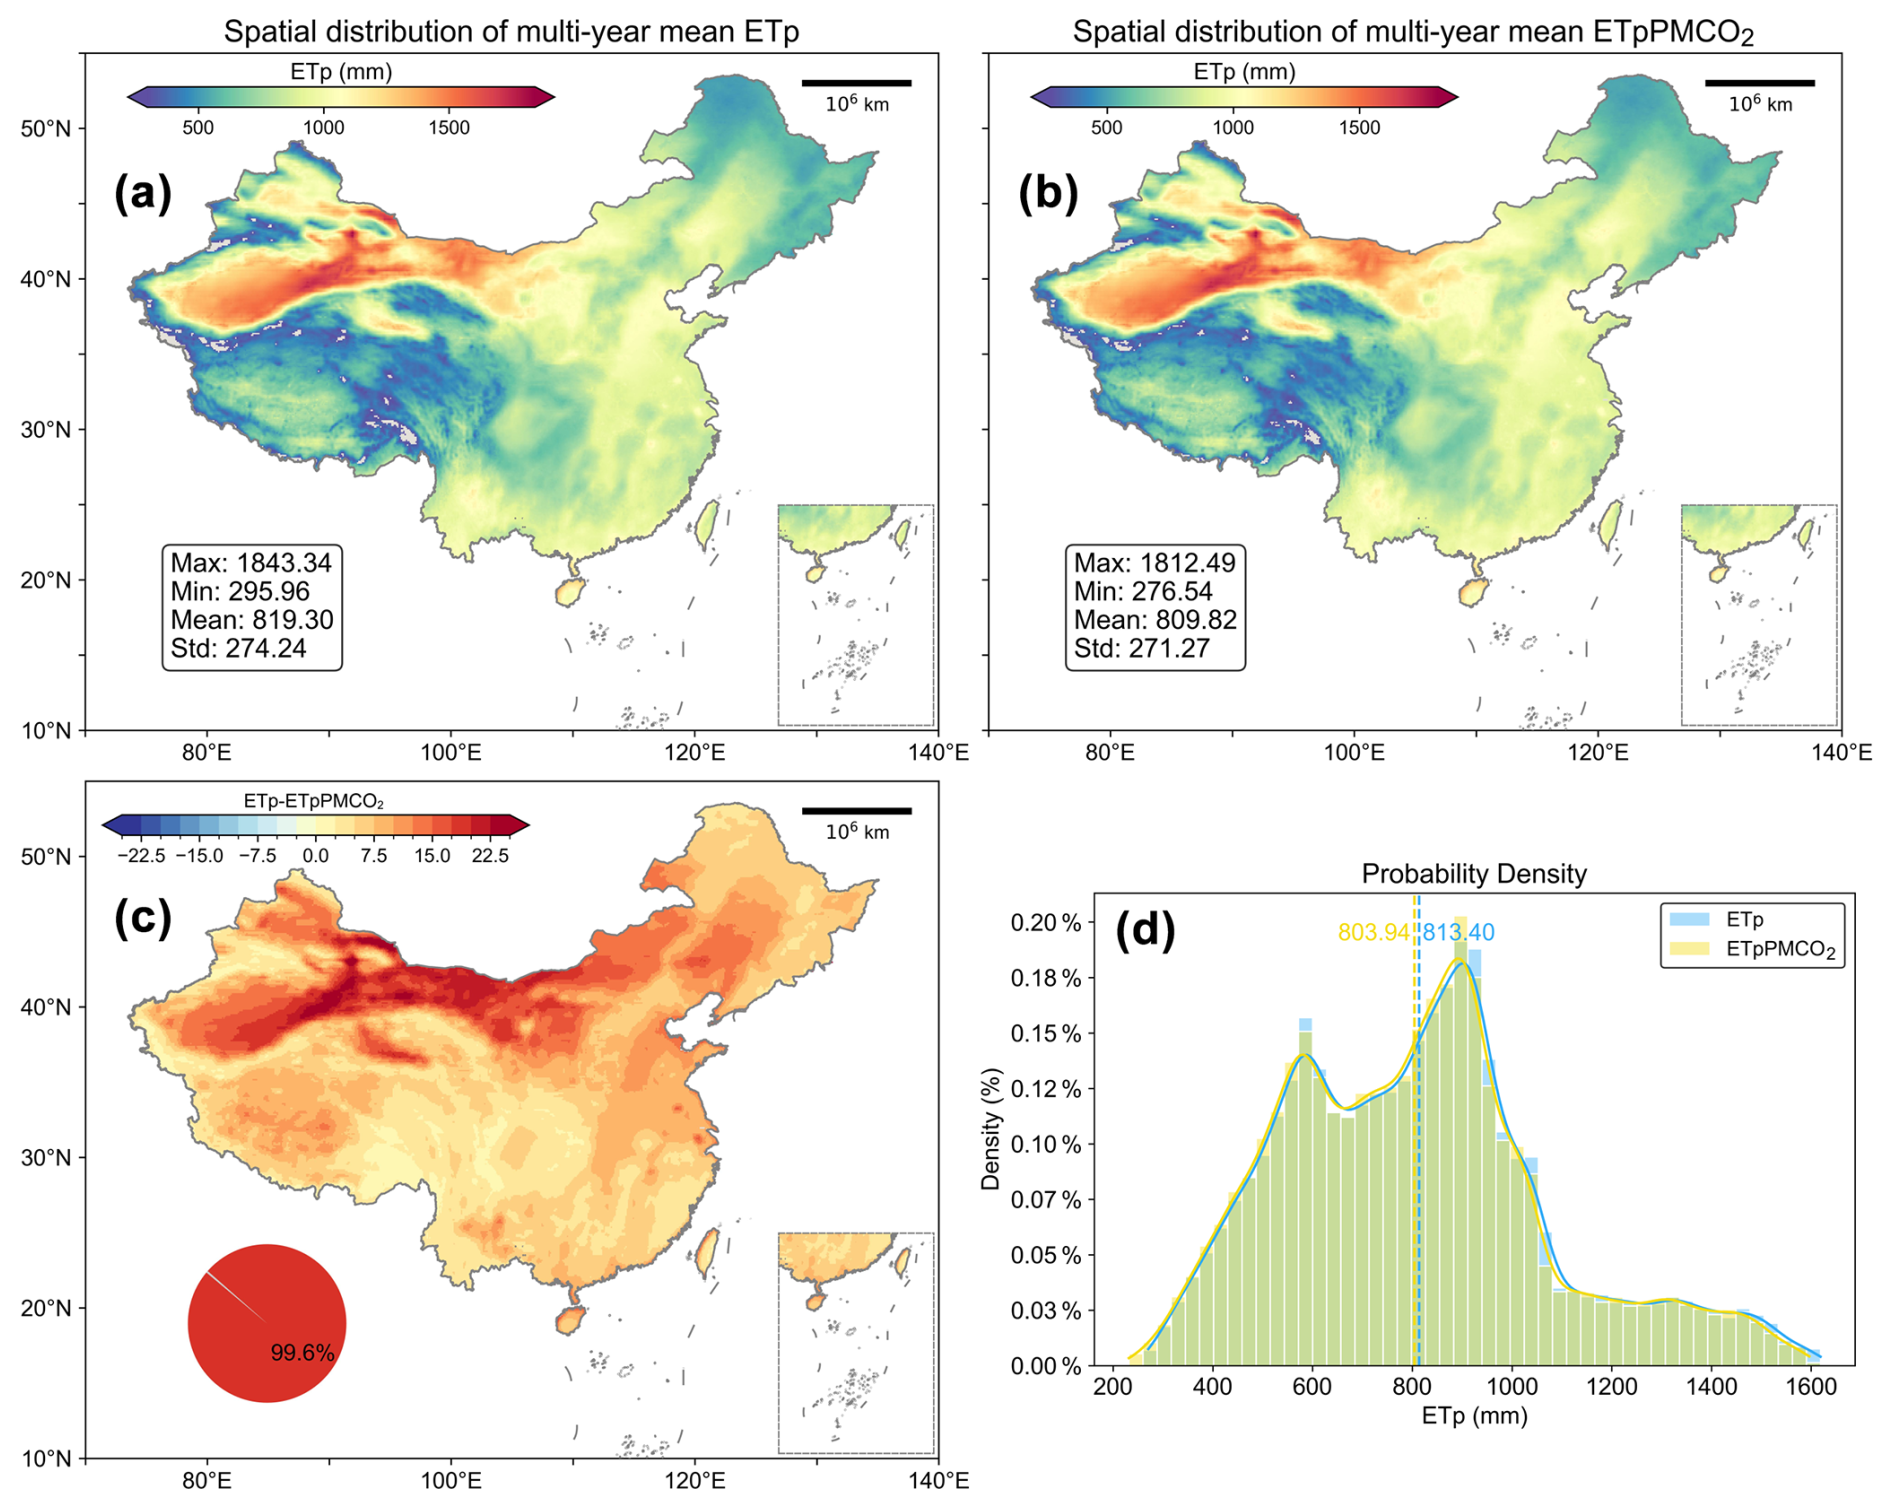
Figure A2Comparison of the spatial distribution of the multi-year average potential evapotranspiration (ETp). (a) Calculated by the traditional PM equation and (b) the modified PM equation that incorporates the CO2 water-saving effect. The maximum value, minimum value, and average value are marked in the lower left corner of the figure. (c) The spatial distribution of the difference between ETp and ETpPMCO2. (d) The probability density curves of the two.
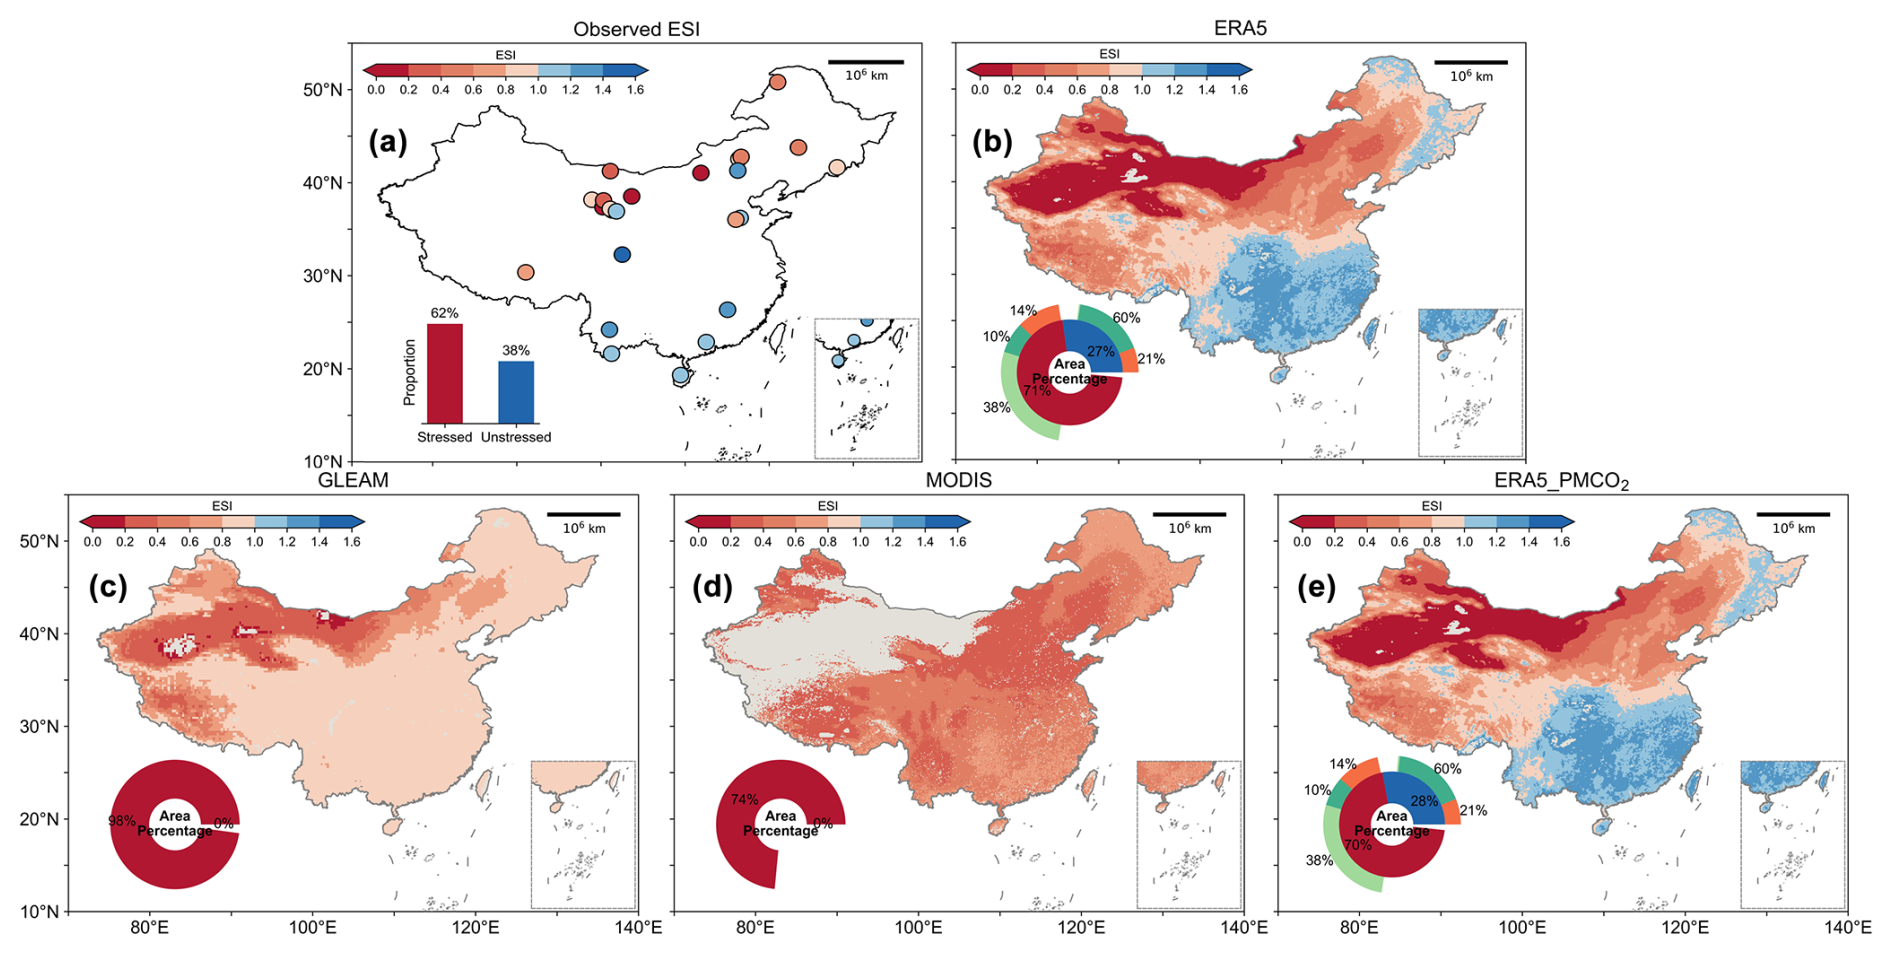
Figure A3Spatial distribution of the multi-year average of ESI calculated from ETa and ETp products from different datasets. (a) was calculated using flux tower observational data, (b) derived from ERA5, (c) originated from GLEAM, (d) obtained from MODIS, and (e) sourced from ERA5 but incorporating the CO2 water-saving effect in ETp calculation.
Previous studies typically generalized the 0–100 cm soil layer as the root zone. However, since the root zone is a highly dynamic interface for water–vegetation–atmosphere interactions, employing more realistic root zone soil moisture data as an indicator for evapotranspiration stress is of critical importance (Gao et al., 2014, 2024; Wang-Erlandsson et al., 2016). This research utilizes root depth data based on an 80-year drought recurrence interval, estimated by Stocker et al. (2023) through the mass accumulation curve methodology. We calculated actual root zone soil moisture (Rsvm) using the weighted averaging method with ERA5 layered soil moisture data (2001–2020). For cases where root depth exceeded 289 cm (the maximum depth covered by ERA5 data), the weighted average soil water content from 0–289 cm was adopted as the Rsvm for this pixel. The computational procedure is outlined below.
The ERA5 soil moisture dataset is stratified into four layers (Layer 1–4), corresponding to soil depths of 0–7, 7–28, 28–100, and 100–289 cm. For each pixel, the contribution of each ERA5 layer to the root zone was calculated based on root depth parameters.
Layer 1 (0–7 cm):
Layer 2 (7–28 cm), activated only when root depth > 7 cm:
Layer 3 (28–100 cm), activated only when root depth > 28 cm:
Layer 4 (100–289 cm), activated only when root depth > 100 cm:
The Rsvm is
where root depth denotes actual root depth (cm), d1–4 represent weighted thicknesses of individual layers (cm), svm1–4 indicates soil moisture values per layer, and Rsvm corresponds to root zone soil moisture (m3 m−3).
Figure B1 investigates the spatiotemporal patterns of root zone soil moisture across China. The regional mean root depth is 2.33 m, with northern arid/semi-arid regions dominated by shallow-rooted vegetation (e.g., grasslands and shrubs) exhibiting lower root zone moisture values (< 0.30 m3 m−3). Deeper root systems (> 15 m) occur in northwestern arid zones and southern karst regions, where vegetation taps into groundwater via deep roots (Fig. B1a). The 20-year mean Rsvm is 0.33 m3 m−3, displaying a clear south-to-north gradient, which corresponds to precipitation patterns (Fig. B1b–d). Notably, over 50 % of vegetated areas exhibit declining Rsvm trends, particularly in northwestern China and the North China Plain, where rates exceed 0.002 (Fig. B1c). These regions have mean annual temperatures of 18–26 °C and annual precipitation below 900 mm (Fig. B1d). These soil-drying trends likely arise from climatic stressors and unsustainable groundwater extraction, calling for urgent policy interventions to protect agricultural productivity and ecosystem stability. Conversely, northeastern and southeastern China demonstrate rising Rsvm trends, where annual precipitation remains abundant. This hydrological shift requires systematic assessment of potential reductions in flood mitigation capacity, underscoring the need for enhanced monitoring protocols in watershed management to address evolving hydrological risks.
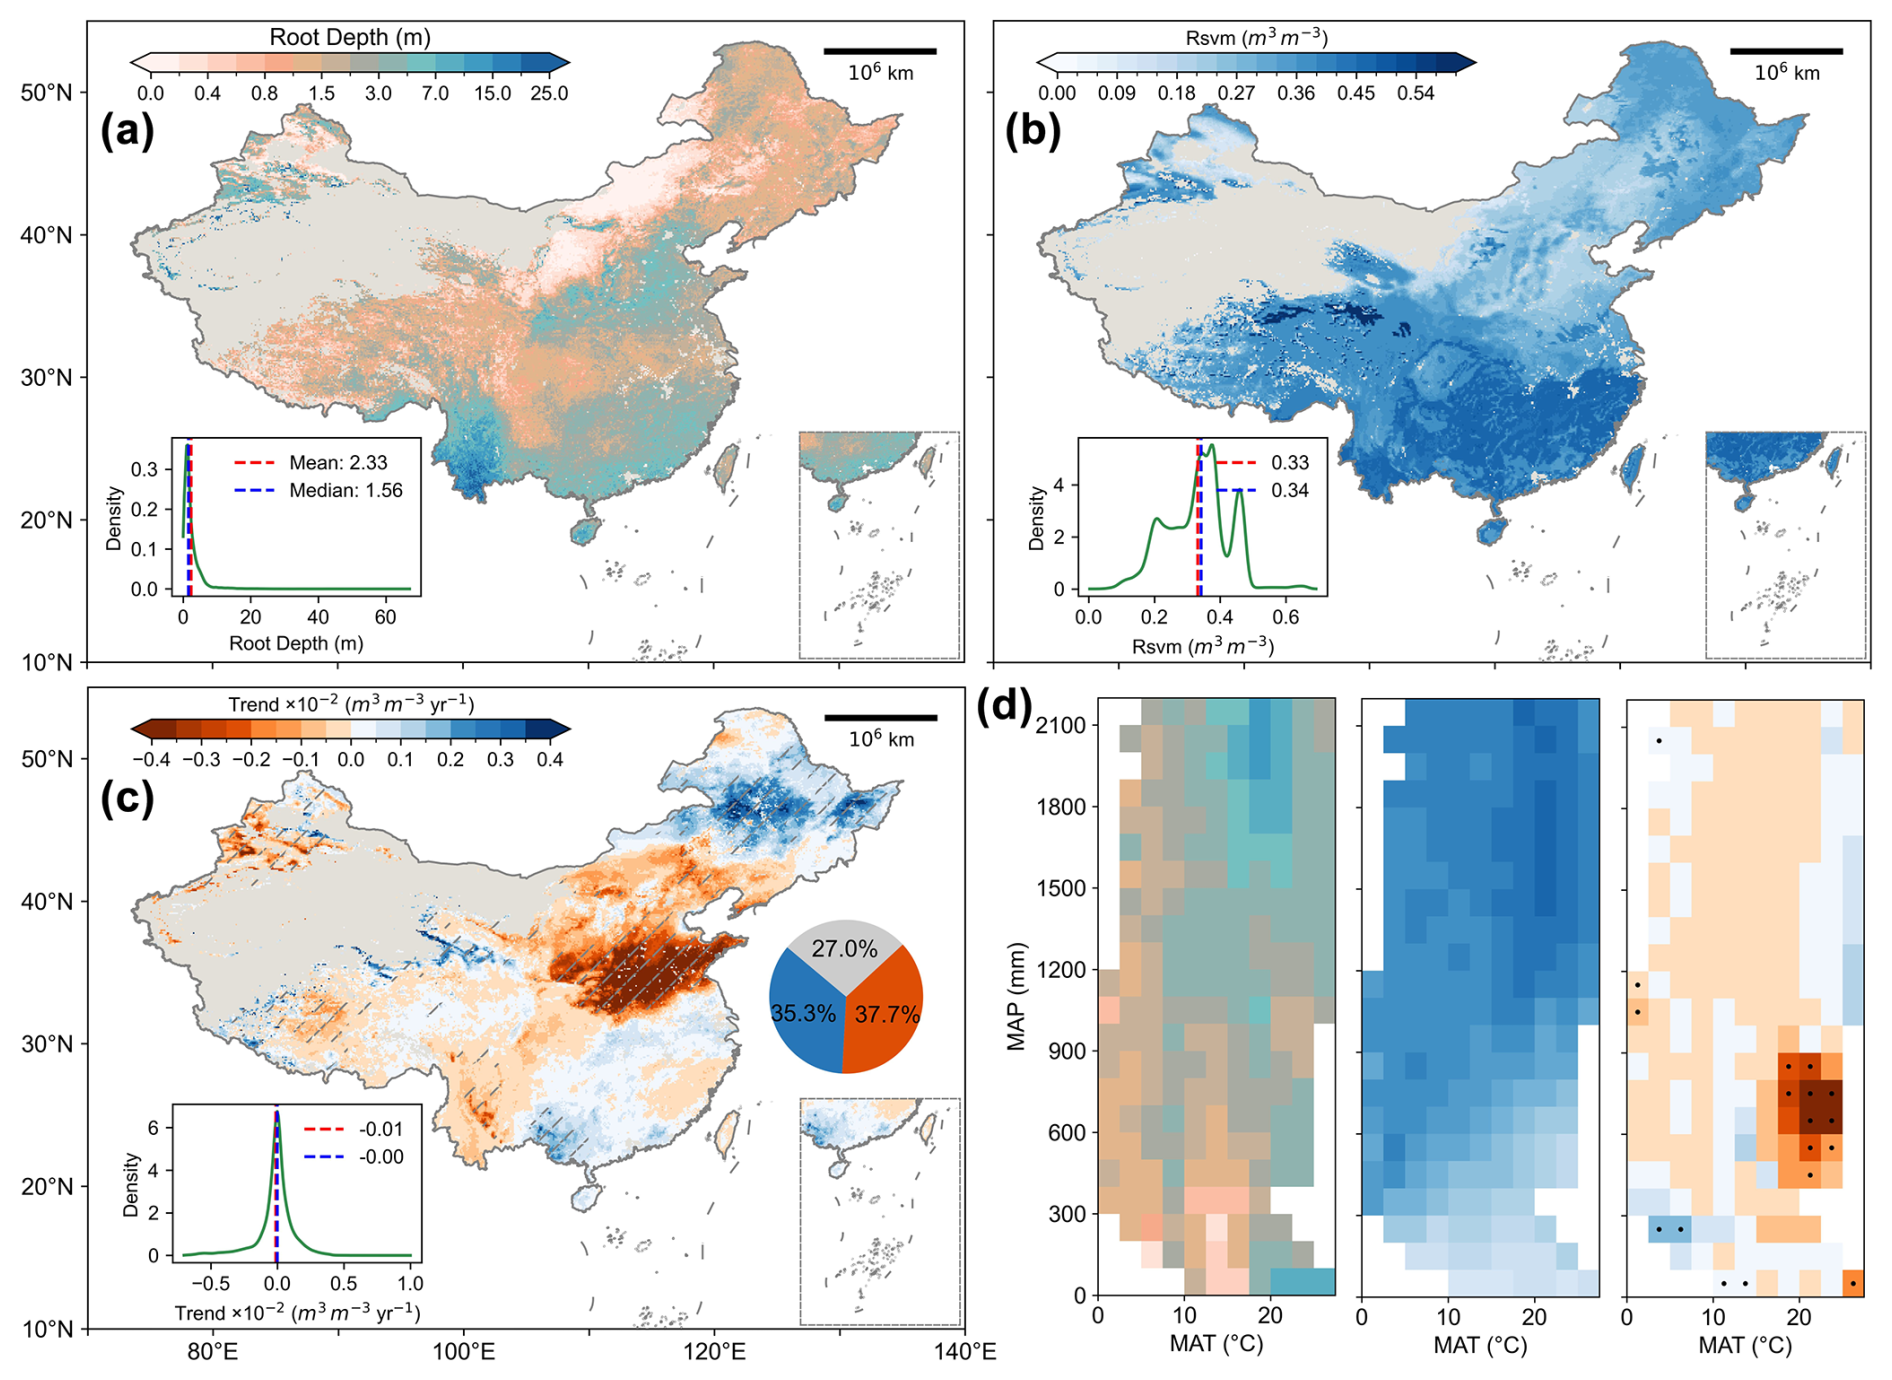
Figure B1Spatiotemporal patterns of root-zone soil moisture (Rsvm) in China. (a) Spatial distribution of root depth. (b) Multi-year mean Rsvm (2001–2020). The inset illustrates the probability density distribution with red and blue markers denoting the mean and median values, respectively. (c) Sen's slope of Rsvm during 2001–2020, where shaded areas indicate regions with statistically significant trends (p < 0.05). The inset displays areal proportions of Rsvm changes: orange represents decreasing trends, blue increasing trends, and grey indicates no-data regions. (d) Climatological phase space diagram corresponding to (a)–(c), with the x axis showing multi-year mean air temperature and the y axis representing precipitation. Colour gradations within bins reflect median values, while dots mark regions exhibiting statistically significant Rsvm trends (p < 0.05).
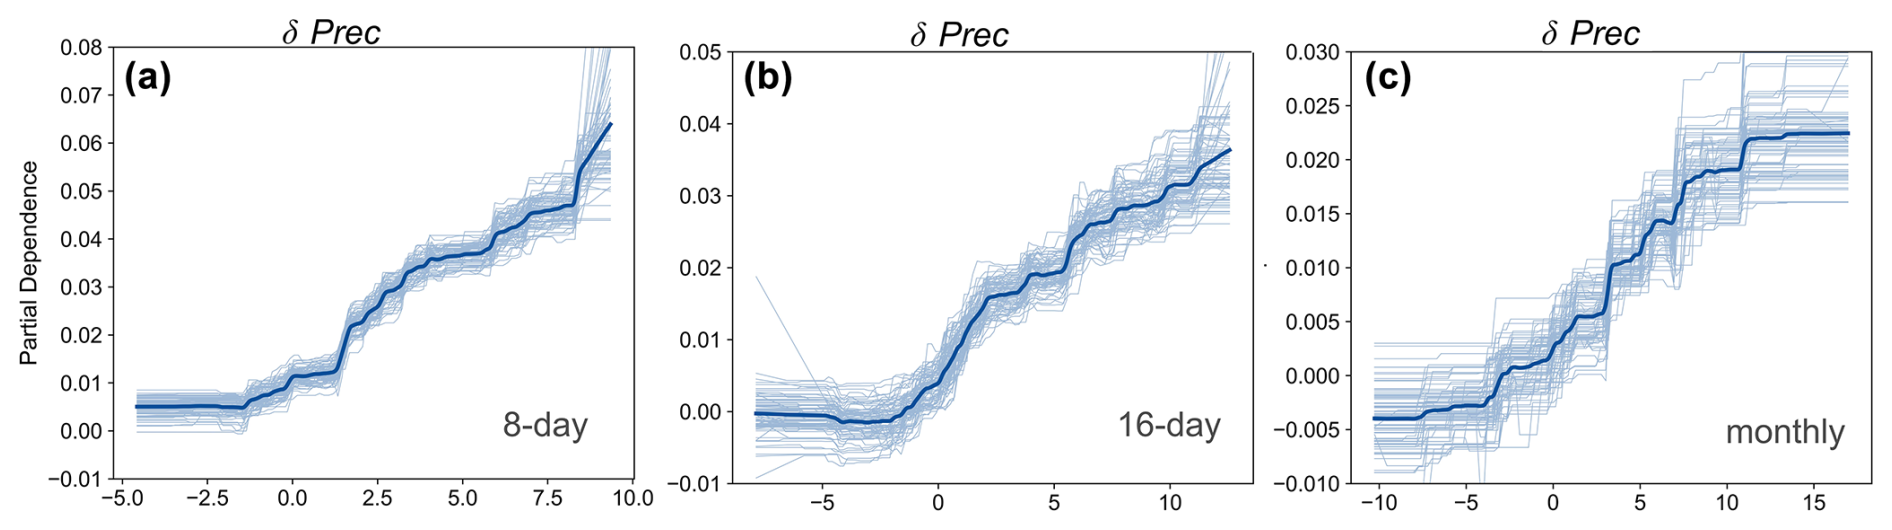
Since precipitation ranked second in importance among parameters (after svm0–7), we developed a comparative Parameter Set R1 using precipitation anomalies to investigate the distinct influences of precipitation and soil moisture on the ESI. SHAP analysis across multiple temporal scales in China revealed contrasting feature importance patterns between parameter sets (see Table S3 for model performance metrics): R1 displayed a broader distributions of contribution indicating more balanced interactions among parameter, while R0 prioritized dominant parameters (svm0–7, Rn). Both configurations consistently showed Rn, VPD, and T negatively regulating ESI, contrasting with positive regulation by LAI and U (Fig. C1). Notably, Prec and svm0–7 synergistically enhanced ESI through moisture supply mechanisms (Figs. C1, C2, 5j, S4j, and S5j), consistently ranking as top predictors. In R1, Prec showed persistent secondary influence to VPD, whereas svm0–7 dominated feature importance at both 16 d and monthly scales (Fig. C1b and c). Unlike the linear relationship of soil moisture, precipitation anomalies induced a biphasic “plateau-ramp” ESI response, requiring anomalies exceeding −5 to 0 mm for stress mitigation. Conversely, svm0–7 exhibited acute sensitivity with near-vertical monthly response gradients (Fig. S5j), indicating immediate drought relief from minimal moisture replenishment (−0.02 to −0.01 m3 m−3) during extreme deficits. Our deseasoned-detrended anomaly analysis inherently accommodates negative values. Subsequent research should prioritize identifying precise response thresholds and turning points.
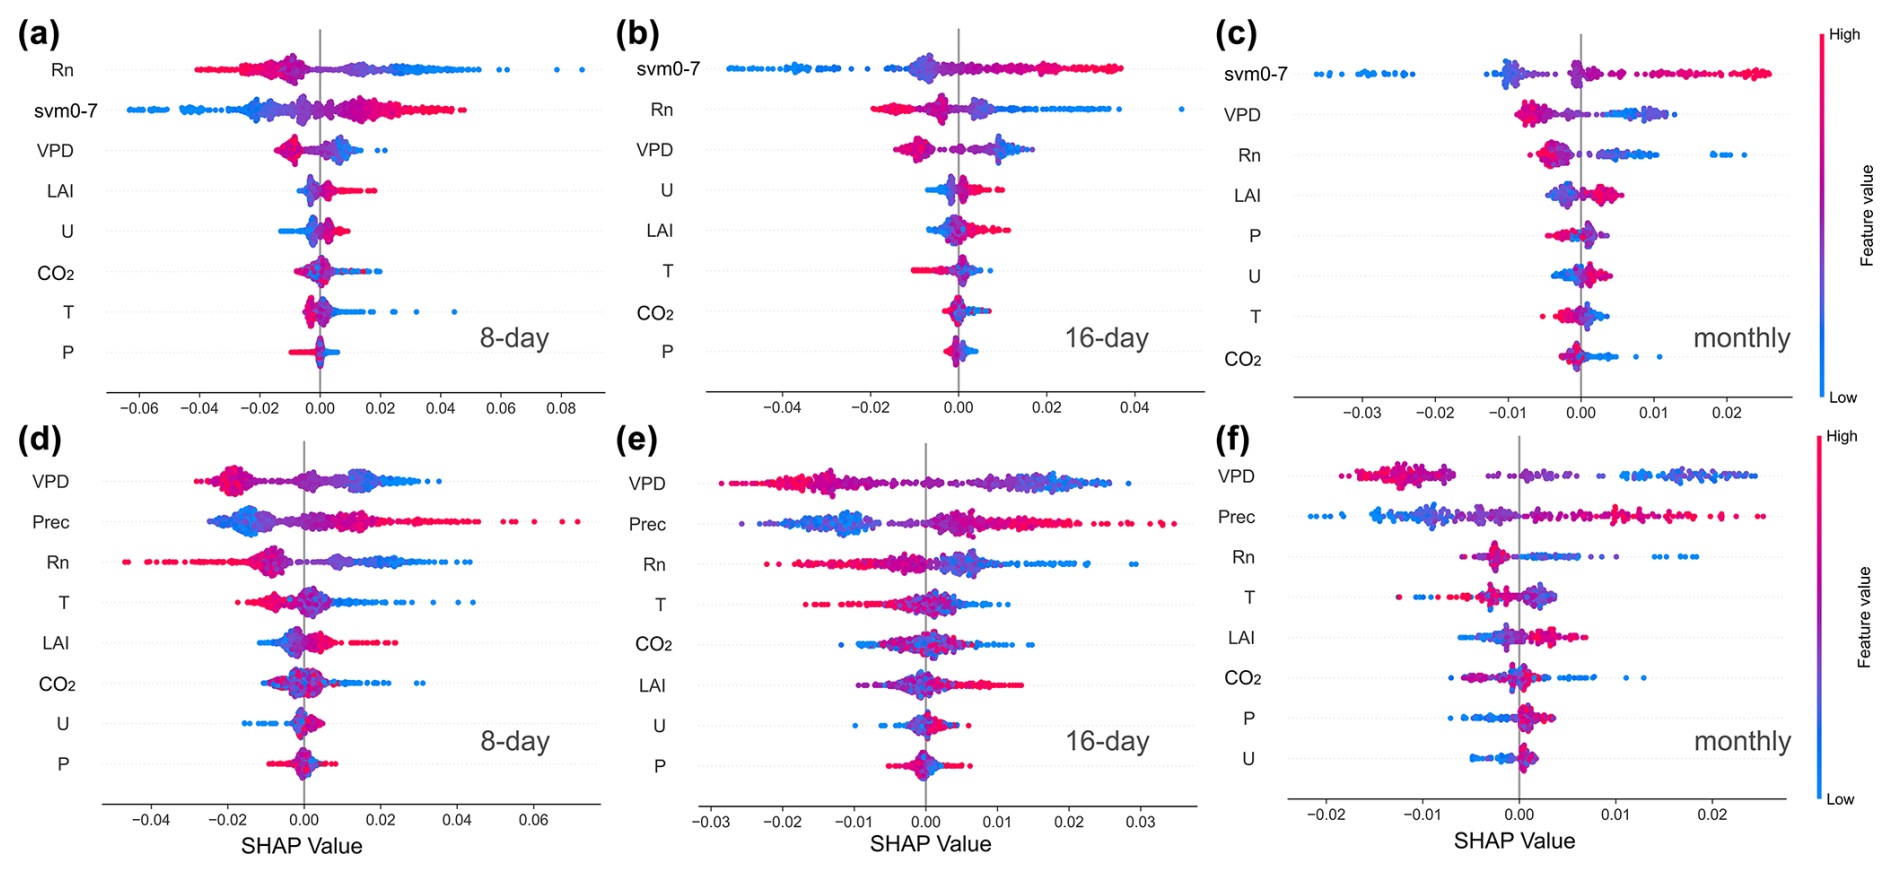
Figure C1Multi-temporal beeswarm plots between Parameter Set R0 (a–c) and R1 (d–f). Parameter set R0 includes svm0–7, Rn, T, VPD, U, P, CO2, LAI, with R1 substituting svm0–7 with Prec. Red denotes high feature values with substantial impacts on ESI. High feature values distributed along the SHAP positive half-axis signify positive contributions to ESI. All features are arranged in descending order of contribution magnitude, where wider x-axis distributions reflect stronger model impacts.
Detailed sources of observations from 26 eddy covariance flux towers are shown in Table S1 in the Supplement. The Global Land Evaporation Amsterdam Model v3.7a can be downloaded from the GLEAM home/landing page (https://www.gleam.eu/, Martens et al., 2011). The Terra Moderate Resolution Imaging Spectroradiometer (MODIS) MOD16A2GF Version 6.1 is accessed from https://doi.org/10.5067/MODIS/MOD16A2GF.061 (Running et al., 2021). Meteorological variables are available from the European Centre for Medium-Range Weather Forecasts (ECMWF) ERA5-Land (https://doi.org/10.24381/cds.e2161bac, Muñoz Sabater, 2019). The monthly CO2 data were obtained from CarbonTracker (CT2022) (https://gml.noaa.gov/ccgg/carbontracker/download.php, Jacobson et al., 2023). LAI (V60) and FVC (V40) from the Global Land Surface Satellite (GLASS) datasets are obtained from http://www.glass.umd.edu/LAI/MODIS/0.1D/ (last access: 15 July 2023) and http://www.glass.umd.edu/FVC/MODIS/500m/ (last access: 15 July 2023). NDVI and EVI in version MOD13C1 are derived from https://doi.org/10.5067/MODIS/MOD13C1.061 (Didan, 2021). The annual China Land Cover Dataset with a resolution of 30 m originates from https://doi.org/10.5281/zenodo.8176941 (Yang and Huang, 2023).
The supplement related to this article is available online at https://doi.org/10.5194/hess-29-3379-2025-supplement.
Conceptualization: YL. Data curation: YW, SC. Formal analysis: YL, LW. Funding acquisition: YZhu, YW. Methodology: YL, WY, XinxL, HL, HC. Software: YL, SC. Supervision: YZhao. Validation: JZ. Visualization: YL, XingL. Writing (original draft): YL. Writing (review and editing): TY, YW, QW, ZW, SC, WL.
The contact author has declared that none of the authors has any competing interests.
Publisher's note: Copernicus Publications remains neutral with regard to jurisdictional claims made in the text, published maps, institutional affiliations, or any other geographical representation in this paper. While Copernicus Publications makes every effort to include appropriate place names, the final responsibility lies with the authors. Regarding the maps used in this paper, please note that Figs. 3, 7, A1–A3, and B1 contain disputed territories.
We appreciate the editor, Hongkai Gao, and two anonymous reviewers for their constructive comments and Ximing Cai (University of Illinois Urbana-Champaign) for insightful discussions and guidance.
This research has been supported by the National Key Research and Development Program of China (grant no. 2021YFC3200200), the National Natural Science Foundation of China (grant nos. 52025093 and 52109044), and the China Institute of Water Resources and Hydropower Research (grant nos. WR0145B032021, WR110146B0042024, WR110145B0072024, and SKL2024YJTS02).
This paper was edited by Hongkai Gao and reviewed by two anonymous referees.
Abel, C., Maestre, F. T., Berdugo, M., Tagesson, T., Abdi, A. M., Horion, S., and Fensholt, R.: Vegetation resistance to increasing aridity when crossing thresholds depends on local environmental conditions in global drylands, Commun. Earth Environ., 5, 379, https://doi.org/10.1038/s43247-024-01546-w, 2024.
Allen, R. G., Pereira, L. S., Raes, D., and Smith, M.: Crop evapotranspiration: guidelines for computing crop water requirements, Crop Evapotranspiration – Guidelines for Computing Crop Water Requirements (FAO Irrigation and Drainage Paper No. 56), Food and Agriculture Organization of the United Nations (FAO), Rome, ISBN: 92-5-104219-5, 1998.
Anderson, M. C., Hain, C., Otkin, J., Zhan, X., Mo, K., Svoboda, M., Wardlow, B., and Pimstein, A.: An Intercomparison of Drought Indicators Based on Thermal Remote Sensing and NLDAS-2 Simulations with U. S. Drought Monitor Classifications, J. Hydrometeorol., 14, 1035–1056, https://doi.org/10.1175/JHM-D-12-0140.1, 2013.
Anderson, M. C., Zolin, C. A., Sentelhas, P. C., Hain, C. R., Semmens, K., Tugrul Yilmaz, M., Gao, F., Otkin, J. A., and Tetrault, R.: The Evaporative Stress Index as an indicator of agricultural drought in Brazil: An assessment based on crop yield impacts, Remote Sens. Environ., 174, 82–99, https://doi.org/10.1016/j.rse.2015.11.034, 2016.
Bai, P., Liu, X., Zhang, Y., and Liu, C.: Assessing the Impacts of Vegetation Greenness Change on Evapotranspiration and Water Yield in China, Water Resour. Res., 56, e2019WR027019, https://doi.org/10.1029/2019WR027019, 2020.
Belsley, D. A.: A Guide to using the collinearity diagnostics, Computer Science in Economics and Management, 4, 33–50, https://doi.org/10.1007/BF00426854, 1991.
Breiman, L.: Random Forests, Mach. Learn., 45, 5–32, https://doi.org/10.1023/A:1010933404324, 2001.
Camps-Valls, G., Campos-Taberner, M., Moreno-Martínez, Á., Walther, S., Duveiller, G., Cescatti, A., Mahecha, M. D., Muñoz-Marí, J., García-Haro, F. J., Guanter, L., Jung, M., Gamon, J. A., Reichstein, M., and Running, S. W.: A unified vegetation index for quantifying the terrestrial biosphere, Sci. Adv., 7, eabc7447, https://doi.org/10.1126/sciadv.abc7447, 2021.
Chen, C., Park, T., Wang, X., Piao, S., Xu, B., Chaturvedi, R. K., Fuchs, R., Brovkin, V., Ciais, P., Fensholt, R., Tømmervik, H., Bala, G., Zhu, Z., Nemani, R. R., and Myneni, R. B.: China and India lead in greening of the world through land-use management, Nat. Sustain., 2, 122–129, https://doi.org/10.1038/s41893-019-0220-7, 2019.
Chen, T. and Guestrin, C.: XGBoost: A Scalable Tree Boosting System. In Proceedings of the 22nd ACM SIGKDD International Conference on Knowledge Discovery and Data Mining (KDD '16), San Francisco, CA, USA, 13–17 August 2016, 785–794 , ACM, https://doi.org/10.1145/2939672.2939785, 2016.
Cleveland, W. S.: Robust Locally Weighted Regression and Smoothing Scatterplots, J. Am. Stat. Assoc., 74, 829–836, https://doi.org/10.1080/01621459.1979.10481038, 1979.
Cui, J., Lian, X., Huntingford, C., Gimeno, L., Wang, T., Ding, J., He, M., Xu, H., Chen, A., Gentine, P., and Piao, S.: Global water availability boosted by vegetation-driven changes in atmospheric moisture transport, Nat. Geosci., 15, 982–988, https://doi.org/10.1038/s41561-022-01061-7, 2022.
Danger, M., Daufresne, T., Lucas, F., Pissard, S., and Lacroix, G.: Does Liebig's law of the minimum scale up from species to communities?, Oikos, 117, 1741–1751, https://doi.org/10.1111/j.1600-0706.2008.16793.x, 2008.
De Jong, R., Verbesselt, J., Zeileis, A., and Schaepman, M.: Shifts in Global Vegetation Activity Trends, Remote Sens.-Basel, 5, 1117–1133, https://doi.org/10.3390/rs5031117, 2013.
Didan, K.: MODIS/Terra Vegetation Indices 16-Day L3 Global 0.05Deg CMG V061, NASA EOSDIS Land Processes Distributed Active Archive Center [data set], https://doi.org/10.5067/MODIS/MOD13C1.061, 2021.
Dong, J., Dirmeyer, P. A., Lei, F., Anderson, M. C., Holmes, T. R. H., Hain, C., and Crow, W. T.: Soil Evaporation Stress Determines Soil Moisture-Evapotranspiration Coupling Strength in Land Surface Modeling, Geophys. Res. Lett., 47, e2020GL090391, https://doi.org/10.1029/2020GL090391, 2020.
Feng, S., Liu, J., Zhang, Q., Zhang, Y., Singh, V. P., Gu, X., and Sun, P.: A global quantitation of factors affecting evapotranspiration variability, J. Hydrol., 584, 124688, https://doi.org/10.1016/j.jhydrol.2020.124688, 2020.
Feng, X., Fu, B., Piao, S., Wang, S., Ciais, P., Zeng, Z., Lü, Y., Zeng, Y., Li, Y., Jiang, X., and Wu, B.: Revegetation in China's Loess Plateau is approaching sustainable water resource limits, Nat. Clim. Change, 6, 1019–1022, https://doi.org/10.1038/nclimate3092, 2016.
Forzieri, G., Miralles, D. G., Ciais, P., Alkama, R., Ryu, Y., Duveiller, G., Zhang, K., Robertson, E., Kautz, M., Martens, B., Jiang, C., Arneth, A., Georgievski, G., Li, W., Ceccherini, G., Anthoni, P., Lawrence, P., Wiltshire, A., Pongratz, J., Piao, S., Sitch, S., Goll, D. S., Arora, V. K., Lienert, S., Lombardozzi, D., Kato, E., Nabel, J. E. M. S., Tian, H., Friedlingstein, P., and Cescatti, A.: Increased control of vegetation on global terrestrial energy fluxes, Nat. Clim. Change, 10, 356–362, https://doi.org/10.1038/s41558-020-0717-0, 2020.
Forzieri, G., Dakos, V., McDowell, N. G., Ramdane, A., and Cescatti, A.: Emerging signals of declining forest resilience under climate change, Nature, 608, 534–539, https://doi.org/10.1038/s41586-022-04959-9, 2022.
Friedman, J. H.: Greedy function approximation: A gradient boosting machine, Ann. Stat., 29, 1189–1232, https://doi.org/10.1214/aos/1013203451, 2001.
Fu, F., Wang, S., Wu, X., Wei, F., Chen, P., and Grünzweig, J. M.: Locating Hydrologically Unsustainable Areas for Supporting Ecological Restoration in China's Drylands, Earths Future, 12, e2023EF004216, https://doi.org/10.1029/2023EF004216, 2024a.
Fu, Z., Ciais, P., Feldman, A. F., Gentine, P., Makowski, D., Prentice, I. C., Stoy, P. C., Bastos, A., and Wigneron, J.-P.: Critical soil moisture thresholds of plant water stress in terrestrial ecosystems, Sci. Adv., 8, eabq7827, https://doi.org/10.1126/sciadv.abq7827, 2022.
Fu, Z., Ciais, P., Wigneron, J.-P., Gentine, P., Feldman, A. F., Makowski, D., Viovy, N., Kemanian, A. R., Goll, D. S., Stoy, P. C., Prentice, I. C., Yakir, D., Liu, L., Ma, H., Li, X., Huang, Y., Yu, K., Zhu, P., Li, X., Zhu, Z., Lian, J., and Smith, W. K.: Global critical soil moisture thresholds of plant water stress, Nat. Commun., 15, 4826, https://doi.org/10.1038/s41467-024-49244-7, 2024b.
Gao, H., Hrachowitz, M., Schymanski, S. J., Fenicia, F., Sriwongsitanon, N., and Savenije, H. H. G.: Climate controls how ecosystems size the root zone storage capacity at catchment scale: Root zone storage capacity in catchments, Geophys. Res. Lett., 41, 7916–7923, https://doi.org/10.1002/2014GL061668, 2014.
Gao, H., Hrachowitz, M., Wang-Erlandsson, L., Fenicia, F., Xi, Q., Xia, J., Shao, W., Sun, G., and Savenije, H. H. G.: Root zone in the Earth system, Hydrol. Earth Syst. Sci., 28, 4477–4499, https://doi.org/10.5194/hess-28-4477-2024, 2024.
Gentine, P., Green, J. K., Guérin, M., Humphrey, V., Seneviratne, S. I., Zhang, Y., and Zhou, S.: Coupling between the terrestrial carbon and water cycles—a review, Environ. Res. Lett., 14, 083003, https://doi.org/10.1088/1748-9326/ab22d6, 2019.
Gleason, K. E., Bradford, J. B., Bottero, A., D'Amato, A. W., Fraver, S., Palik, B. J., Battaglia, M. A., Iverson, L., Kenefic, L., and Kern, C. C.: Competition amplifies drought stress in forests across broad climatic and compositional gradients, Ecosphere, 8, e01849, https://doi.org/10.1002/ecs2.1849, 2017.
Grossiord, C., Buckley, T. N., Cernusak, L. A., Novick, K. A., Poulter, B., Siegwolf, R. T. W., Sperry, J. S., and McDowell, N. G.: Plant responses to rising vapor pressure deficit, New Phytol., 226, 1550–1566, https://doi.org/10.1111/nph.16485, 2020.
Held, I. M. and Soden, B. J.: Robust Responses of the Hydrological Cycle to Global Warming, J. Climate, 19, 5686–5699, https://doi.org/10.1175/JCLI3990.1, 2006.
Hsu, H. and Dirmeyer, P. A.: Soil moisture-evaporation coupling shifts into new gears under increasing CO2, Nat. Commun., 14, 1162, https://doi.org/10.1038/s41467-023-36794-5, 2023.
Hu, H. Y.: Essays on China's population distribution, accompanying with statistics and maps, Acta Geogr. Sin., 2, 22–74, 1935 (in Chinese with English abstract).
Hu, Y., Wei, F., Fu, B., Zhang, W., and Sun, C.: Ecosystems in China have become more sensitive to changes in water demand since 2001, Commun. Earth Environ., 4, 444, https://doi.org/10.1038/s43247-023-01105-9, 2023.
Jacobson, A. R., Schuldt, K. N., Tans, P., Arlyn Andrews, Miller, J. B., Oda, T., Mund, J., Weir, B., Ott, L., Aalto, T., Abshire, J. B., Aikin, K., Aoki, S., Apadula, F., Arnold, S., Baier, B., Bartyzel, J., Beyersdorf, A., Biermann, T., et al.: CarbonTracker CT2022, NOAA Global Monitoring Laboratory [data set], https://doi.org/10.25925/Z1GJ-3254, 2023.
Jasechko, S., Seybold, H., Perrone, D., Fan, Y., Shamsudduha, M., Taylor, R. G., Fallatah, O., and Kirchner, J. W.: Rapid groundwater decline and some cases of recovery in aquifers globally, Nature, 625, 715–721, https://doi.org/10.1038/s41586-023-06879-8, 2024.
Joshi, J., Stocker, B. D., Hofhansl, F., Zhou, S., Dieckmann, U., and Prentice, I. C.: Towards a unified theory of plant photosynthesis and hydraulics, Nat. Plants, 8, 1304–1316, https://doi.org/10.1038/s41477-022-01244-5, 2022.
Jung, M., Reichstein, M., Ciais, P., Seneviratne, S. I., Sheffield, J., Goulden, M. L., Bonan, G., Cescatti, A., Chen, J., De Jeu, R., Dolman, A. J., Eugster, W., Gerten, D., Gianelle, D., Gobron, N., Heinke, J., Kimball, J., Law, B. E., Montagnani, L., Mu, Q., Mueller, B., Oleson, K., Papale, D., Richardson, A. D., Roupsard, O., Running, S., Tomelleri, E., Viovy, N., Weber, U., Williams, C., Wood, E., Zaehle, S., and Zhang, K.: Recent decline in the global land evapotranspiration trend due to limited moisture supply, Nature, 467, 951–954, https://doi.org/10.1038/nature09396, 2010.
Kendall, M. G.: Rank Correlation Methods, London, Charles Griffin & Co. Ltd., ISBN : 0852641990, https://doi.org/10.1017/S0020268100013019, 1948.
Kono, Y., Ishida, A., Saiki, S.-T., Yoshimura, K., Dannoura, M., Yazaki, K., Kimura, F., Yoshimura, J., and Aikawa, S.: Initial hydraulic failure followed by late-stage carbon starvation leads to drought-induced death in the tree Trema orientalis, Commun. Biol., 2, 8, https://doi.org/10.1038/s42003-018-0256-7, 2019.
Kusch, E., Davy, R., and Seddon, A. W. R.: Vegetation-memory effects and their association with vegetation resilience in global drylands, J. Ecol., 110, 1561–1574, https://doi.org/10.1111/1365-2745.13891, 2022.
Li, F., Xiao, J., Chen, J., Ballantyne, A., Jin, K., Li, B., Abraha, M., and John, R.: Global water use efficiency saturation due to increased vapor pressure deficit, Science, 381, 672–677, https://doi.org/10.1126/science.adf5041, 2023.
Li, W., Migliavacca, M., Forkel, M., Denissen, J. M. C., Reichstein, M., Yang, H., Duveiller, G., Weber, U., and Orth, R.: Widespread increasing vegetation sensitivity to soil moisture, Nat. Commun., 13, 3959, https://doi.org/10.1038/s41467-022-31667-9, 2022a.
Li, Y., Piao, S., Li, L. Z. X., Chen, A., Wang, X., Ciais, P., Huang, L., Lian, X., Peng, S., Zeng, Z., Wang, K., and Zhou, L.: Divergent hydrological response to large-scale afforestation and vegetation greening in China, Sci. Adv., 4, eaar4182, https://doi.org/10.1126/sciadv.aar4182, 2018.
Li, W., Migliavacca, M., Forkel, M., Denissen, J. M. C., Reichstein, M., Yang, H., Duveiller, G., Weber, U., and Orth, R.: Widespread increasing vegetation sensitivity to soil moisture, Nat. Commun., 13, 3959, https://doi.org/10.1038/s41467-022-31667-9, 2022a.
Li, Y., Qin, Y., and Rong, P.: Evolution of potential evapotranspiration and its sensitivity to climate change based on the Thornthwaite, Hargreaves, and Penman–Monteith equation in environmental sensitive areas of China, Atmos. Res., 273, 106178, https://doi.org/10.1016/j.atmosres.2022.106178, 2022b.
Li, Z., Yang, Q., Ma, Z., Wu, P., Duan, Y., Li, M., and Zheng, Z.: Aridification and Its Impacts on Terrestrial Hydrology and Ecosystems over a Comprehensive Transition Zone in China, J. Climate, 37, 1651–1666, https://doi.org/10.1175/JCLI-D-23-0203.1, 2024.
Lian, X., Piao, S., Chen, A., Huntingford, C., Fu, B., Li, L. Z. X., Huang, J., Sheffield, J., Berg, A. M., Keenan, T. F., McVicar, T. R., Wada, Y., Wang, X., Wang, T., Yang, Y., and Roderick, M. L.: Multifaceted characteristics of dryland aridity changes in a warming world, Nat. Rev. Earth Environ., 2, 232–250, https://doi.org/10.1038/s43017-021-00144-0, 2021.
Liang, J., Gao, H., Fenicia, F., Xi, Q., Wang, Y., and Savenije, H. H. G.: Widespread increase of root zone storage capacity in the United States, EGUsphere [preprint], https://doi.org/10.5194/egusphere-2024-550, 2024.
Liang, S., Zhao, X., Liu, S., Yuan, W., Cheng, X., Xiao, Z., Zhang, X., Liu, Q., Cheng, J., Tang, H., Qu, Y., Bo, Y., Qu, Y., Ren, H., Yu, K., and Townshend, J.: A long-term Global LAnd Surface Satellite (GLASS) data-set for environmental studies, Int. J. Digit. Earth, 6, 5–33, https://doi.org/10.1080/17538947.2013.805262, 2013.
Liang, S., Zhang, X., Xiao, Z., Cheng, J., Liu, Q., and Zhao, X.: Global LAnd Surface Satellite (GLASS) Products: Algorithms, Validation and Analysis, Heidelberg, Germany, Springer, https://doi.org/10.1007/978-3-319-02588-9, 2014.
Liang, S., Cheng, J., Jia, K., Jiang, B., Liu, Q., Xiao, Z., Yao, Y., Yuan, W., Zhang, X., Zhao, X., and Zhou, J.: The Global Land Surface Satellite (GLASS) Product Suite, B. Am. Meteorol. Soc., 102, E323–E337, https://doi.org/10.1175/BAMS-D-18-0341.1, 2021.
Liu, L., Zhang, Y., Wu, S., Li, S., and Qin, D.: Water memory effects and their impacts on global vegetation productivity and resilience, Sci. Rep.-UK, 8, 2962, https://doi.org/10.1038/s41598-018-21339-4, 2018.
Liu, L., Gudmundsson, L., Hauser, M., Qin, D., Li, S., and Seneviratne, S. I.: Soil moisture dominates dryness stress on ecosystem production globally, Nat. Commun., 11, 4892, https://doi.org/10.1038/s41467-020-18631-1, 2020a.
Liu, Q., Peng, C., Schneider, R., Cyr, D., Liu, Z., Zhou, X., Du, M., Li, P., Jiang, Z., McDowell, N. G., and Kneeshaw, D.: Vegetation browning: global drivers, impacts, and feedbacks, Trends Plant Sci., 28, 1014–1032, https://doi.org/10.1016/j.tplants.2023.03.024, 2023.
Liu, X., Feng, Y., Hu, T., Luo, Y., Zhao, X., Wu, J., Maeda, E. E., Ju, W., Liu, L., Guo, Q., and Su, Y.: Enhancing ecosystem productivity and stability with increasing canopy structural complexity in global forests, Sci. Adv., 10, eadl1947, https://doi.org/10.1126/sciadv.adl1947, 2024.
Liu, Y.: Reduced resilience as an early warning signal of forest mortality, Nat. Clim. Change, 9, 880–885, https://doi.org/10.1038/s41558-019-0583-9, 2019.
Liu, Y., Parolari, A. J., Kumar, M., Huang, C.-W., Katul, G. G., and Porporato, A.: Increasing atmospheric humidity and CO2 concentration alleviate forest mortality risk, P. Natl. Acad. Sci. USA, 114, 9918–9923, https://doi.org/10.1073/pnas.1704811114, 2017.
Liu, Y., Kumar, M., Katul, G. G., Feng, X., and Konings, A. G.: Plant hydraulics accentuates the effect of atmospheric moisture stress on transpiration, Nat. Clim. Change, 10, 691–695, https://doi.org/10.1038/s41558-020-0781-5, 2020b.
Liu, Y., Jiang, Q., Wang, Q., Jin, Y., Yue, Q., Yu, J., Zheng, Y., Jiang, W., and Yao, X.: The divergence between potential and actual evapotranspiration: An insight from climate, water, and vegetation change, Sci. Total Environ., 807, 150648, https://doi.org/10.1016/j.scitotenv.2021.150648, 2022.
Liu, Z., Cheng, L., Zhou, G., Chen, X., Lin, K., Zhang, W., Chen, X., and Zhou, P.: Global Response of Evapotranspiration Ratio to Climate Conditions and Watershed Characteristics in a Changing Environment, J. Geophys. Res.-Atmos., 125, e2020JD032371, https://doi.org/10.1029/2020JD032371, 2020c.
Lu, C., Zhao, T., Shi, X., and Cao, S.: Ecological restoration by afforestation may increase groundwater depth and create potentially large ecological and water opportunity costs in arid and semiarid China, J. Clean. Prod., 176, 1213–1222, https://doi.org/10.1016/j.jclepro.2016.03.046, 2018.
Lundberg, S. M. and Lee, S.-I.: A unified approach to interpreting model predictions, in: Proceedings of the 31st International Conference on Neural Information Processing Systems, 4768–4777, Long Beach, CA, USA, 4–9 December , 2017.
Mann, H. B.: Nonparametric tests against trend, Econometrica, 13, 245–259, https://doi.org/10.2307/1907187, 1945.
Mantova, M., Herbette, S., Cochard, H., and Torres-Ruiz, J. M.: Hydraulic failure and tree mortality: from correlation to causation, Trends Plant Sci., 27, 335–345, https://doi.org/10.1016/j.tplants.2021.10.003, 2022.
Miralles, D. G., Holmes, T. R. H., de Jeu, R. A. M., Gash, J. H., Meesters, A. G. C. A., and Dolman, A. J.: Global land-surface evaporation estimated from satellite-based observations, Hydrol. Earth Syst. Sci., 15, 453–469, https://doi.org/10.5194/hess-15-453-2011, 2011.
Moreno-Mateos, D., Alberdi, A., Morriën, E., Van Der Putten, W. H., Rodríguez-Uña, A., and Montoya, D.: The long-term restoration of ecosystem complexity, Nat. Ecol. Evol., 4, 676–685, https://doi.org/10.1038/s41559-020-1154-1, 2020.
Muñoz Sabater, J.: ERA5-Land hourly data from 1950 to present, Copernicus Climate Change Service (C3S) Climate Data Store (CDS) [data set], https://doi.org/10.24381/cds.e2161bac, 2019.
Nguyen, H., Wheeler, M. C., Otkin, J. A., Cowan, T., Frost, A., and Stone, R.: Using the evaporative stress index to monitor flash drought in Australia, Environ. Res. Lett., 14, 064016, https://doi.org/10.1088/1748-9326/ab2103, 2019.
Otkin, J. A., Zhong, Y., Lorenz, D., Anderson, M. C., and Hain, C.: Exploring seasonal and regional relationships between the Evaporative Stress Index and surface weather and soil moisture anomalies across the United States, Hydrol. Earth Syst. Sci., 22, 5373–5386, https://doi.org/10.5194/hess-22-5373-2018, 2018.
Patel, K. F., Fansler, S. J., Campbell, T. P., Bond-Lamberty, B., Smith, A. P., RoyChowdhury, T., McCue, L. A., Varga, T., and Bailey, V. L.: Soil texture and environmental conditions influence the biogeochemical responses of soils to drought and flooding, Commun. Earth Environ., 2, 127, https://doi.org/10.1038/s43247-021-00198-4, 2021.
Peng, L., Zeng, Z., Wei, Z., Chen, A., Wood, E. F., and Sheffield, J.: Determinants of the ratio of actual to potential evapotranspiration, Glob. Change Biol., 25, 1326–1343, https://doi.org/10.1111/gcb.14577, 2019.
Prado, R., Ferreira, M. A. R., and Lee, S.-I.: Time Series: Modeling, Computation, and Inference, 2nd Edn., Chapman & Hall/CRC, https://doi.org/10.1201/9781351259422, 2021.
Qing, Y., Wang, S., Yang, Z.-L., Gentine, P., Zhang, B., and Alexander, J.: Accelerated soil drying linked to increasing evaporative demand in wet regions, npj Clim. Atmos. Sci., 6, 205, https://doi.org/10.1038/s41612-023-00531-y, 2023.
Richard, Y., Martiny, N., Fauchereau, N., Reason, C., Rouault, M., Vigaud, N., and Tracol, Y.: Interannual memory effects for spring NDVI in semi-arid South Africa, Geophys. Res. Lett., 35, 2008GL034119, https://doi.org/10.1029/2008GL034119, 2008.
Ruan, F., Yang, Y., McVicar, T. R., Guo, H., and Hou, Y.: Historical and future shifts of a sharp zonal aridity gradient: A case study of the Hu Line in China, J. Hydrol., 614, 128590, https://doi.org/10.1016/j.jhydrol.2022.128590, 2022.
Running, S., Mu, Q., Zhao, M., and Moreno, A.: MODIS/Terra Net Evapotranspiration Gap-Filled 8-Day L4 Global 500 m SIN Grid V061, NASA EOSDIS Land Processes Distributed Active Archive Center [data set], https://doi.org/10.5067/MODIS/MOD16A2GF.061, 2021.
Scheffer, M., Bascompte, J., Brock, W. A., Brovkin, V., Carpenter, S. R., Dakos, V., Held, H., Van Nes, E. H., Rietkerk, M., and Sugihara, G.: Early-warning signals for critical transitions, Nature, 461, 53–59, https://doi.org/10.1038/nature08227, 2009.
Sen, P. K.: Estimates of the Regression Coefficient Based on Kendall's Tau, J. Am. Stat. Assoc., 63, 1379–1389, https://doi.org/10.1080/01621459.1968.10480934, 1968.
Seneviratne, S. I., Corti, T., Davin, E. L., Hirschi, M., Jaeger, E. B., Lehner, I., Orlowsky, B., and Teuling, A. J.: Investigating soil moisture–climate interactions in a changing climate: A review, Earth-Sci. Rev., 99, 125–161, https://doi.org/10.1016/j.earscirev.2010.02.004, 2010.
Smith, T. and Boers, N.: Global vegetation resilience linked to water availability and variability, Nat. Commun., 14, 498, https://doi.org/10.1038/s41467-023-36207-7, 2023.
Smith, T., Traxl, D., and Boers, N.: Empirical evidence for recent global shifts in vegetation resilience, Nat. Clim. Change, 12, 477–484, https://doi.org/10.1038/s41558-022-01352-2, 2022.
Spinoni, J., Vogt, J., Naumann, G., Carrao, H., and Barbosa, P.: Towards identifying areas at climatological risk of desertification using the Köppen-Geiger classification and FAO aridity index: TOWARDS IDENTIFYING AREAS AT CLIMATOLOGICAL RISK OF DESERTIFICATION, Int. J. Climatol, 35, 2210–2222, https://doi.org/10.1002/joc.4124, 2015.
Stocker, B. D., Tumber-Dávila, S. J., Konings, A. G., Anderson, M. C., Hain, C., and Jackson, R. B.: Global patterns of water storage in the rooting zones of vegetation, Nat. Geosci., 16, 250–256, https://doi.org/10.1038/s41561-023-01125-2, 2023.
Štrumbelj, E. and Kononenko, I.: Explaining prediction models and individual predictions with feature contributions, Knowl. Inf. Syst., 41, 647–665, https://doi.org/10.1007/s10115-013-0679-x, 2014.
Sulman, B. N., Roman, D. T., Yi, K., Wang, L., Phillips, R. P., and Novick, K. A.: High atmospheric demand for water can limit forest carbon uptake and transpiration as severely as dry soil, Geophys. Res. Lett., 43, 9686–9695, https://doi.org/10.1002/2016GL069416, 2016.
Sun, G., Gao, H., and Hao, L.: Comments on “Large-scale afforestation significantly increases permanent surface water in China's vegetation restoration regions” by Zeng, Y., Yang, X., Fang, N., & Shi, Z. (2020), Agricultural Forest Meteorology, 290, 108001, Agr. Forest Meteorol., 296, 108213, https://doi.org/10.1016/j.agrformet.2020.108213, 2021.
Tang, J. and Riley, W. J.: Finding Liebig's law of the minimum, Ecol. Appl., 31, e02458, https://doi.org/10.1002/eap.2458, 2021.
Tang, J., Niu, B., Fu, G., Peng, J., Hu, Z., and Zhang, X.: Shifted trend in drought sensitivity of vegetation productivity from 1982 to 2020, Agr. Forest Meteorol., 362, 110388, https://doi.org/10.1016/j.agrformet.2025.110388, 2025.
Thornthwaite, C. W.: An Approach toward a Rational Classification of Climate, Geogr. Rev., 38, 55, https://doi.org/10.2307/210739, 1948.
Toyoda, H.: Interpretation of Partial Regression Coefficients, in: Statistics with Posterior Probability and a PHC Curve, Springer Nature Singapore, Singapore, https://doi.org/10.1007/978-981-97-3094-0_16, 261–279, 2024.
Wang, Q., Liu, H., Liang, B., Shi, L., Wu, L., and Cao, J.: Will large-scale forestation lead to a soil water deficit crisis in China's drylands?, Sci. Bull., 69, 1506–1514, https://doi.org/10.1016/j.scib.2024.03.005, 2024.
Wang, T., Wu, Z., Wang, P., Wu, T., Zhang, Y., Yin, J., Yu, J., Wang, H., Guan, X., Xu, H., Yan, D., and Yan, D.: Plant-groundwater interactions in drylands: A review of current research and future perspectives, Agr. Forest Meteorol., 341, 109636, https://doi.org/10.1016/j.agrformet.2023.109636, 2023.
Wang-Erlandsson, L., Bastiaanssen, W. G. M., Gao, H., Jägermeyr, J., Senay, G. B., van Dijk, A. I. J. M., Guerschman, J. P., Keys, P. W., Gordon, L. J., and Savenije, H. H. G.: Global root zone storage capacity from satellite-based evaporation, Hydrol. Earth Syst. Sci., 20, 1459–1481, https://doi.org/10.5194/hess-20-1459-2016, 2016.
Xiao, L., Wu, X., Zhao, S., and Zhou, J.: Memory effects of vegetation after extreme weather events under various geological conditions in a typical karst watershed in southwestern China, Agr. Forest Meteorol., 345, 109840, https://doi.org/10.1016/j.agrformet.2023.109840, 2024a.
Xiao, T., Li, P., Fei, W., and Wang, J.: Effects of vegetation roots on the structure and hydraulic properties of soils: A perspective review, Sci. Total Environ., 906, 167524, https://doi.org/10.1016/j.scitotenv.2023.167524, 2024b.
Yang, J. and Huang, X.: The 30 m annual land cover dataset and its dynamics in China from 1990 to 2019, Earth Syst. Sci. Data, 13, 3907–3925, https://doi.org/10.5194/essd-13-3907-2021, 2021.
Yang, J. and Huang, X.: The 30 m annual land cover datasets and its dynamics in China from 1985 to 2022, Zenodo [data set], https://doi.org/10.5281/zenodo.8176941, 2023.
Yang, Y., Roderick, M. L., Zhang, S., McVicar, T. R., and Donohue, R. J.: Hydrologic implications of vegetation response to elevated CO2 in climate projections, Nat. Clim. Change, 9, 44–48, https://doi.org/10.1038/s41558-018-0361-0, 2019.
Yin, X., Zhou, L.-T., Liu, K., Han, Y., and Du, Z.: Record-breaking flood over the Yangtze River in early summer 2020: role of the north Indian Ocean and north tropical Atlantic SST, Theor. Appl. Climatol., 150, 1173–1186, https://doi.org/10.1007/s00704-022-04217-y, 2022.
Yuan, W., Zheng, Y., Piao, S., Ciais, P., Lombardozzi, D., Wang, Y., Ryu, Y., Chen, G., Dong, W., Hu, Z., Jain, A. K., Jiang, C., Kato, E., Li, S., Lienert, S., Liu, S., Nabel, J. E. M. S., Qin, Z., Quine, T., Sitch, S., Smith, W. K., Wang, F., Wu, C., Xiao, Z., and Yang, S.: Increased atmospheric vapor pressure deficit reduces global vegetation growth, Sci. Adv., 5, eaax1396, https://doi.org/10.1126/sciadv.aax1396, 2019.
Zeng, X., Hu, Z., Chen, A., Yuan, W., Hou, G., Han, D., Liang, M., Di, K., Cao, R., and Luo, D.: The global decline in the sensitivity of vegetation productivity to precipitation from 2001 to 2018, Glob. Change Biol., 28, 6823–6833, https://doi.org/10.1111/gcb.16403, 2022.
Zhan, Y., Ma, C., Yan, Y., Zhu, J., Ji, Y., Ma, C., and Luo, Y.: Spatial differentiation characteristics of vegetation greening rates and climate attribution in China's arid and semi-arid regions, Global Ecology and Conservation, 46, e02563, https://doi.org/10.1016/j.gecco.2023.e02563, 2023.
Zhang, J., Guan, K., Peng, B., Pan, M., Zhou, W., Jiang, C., Kimm, H., Franz, T. E., Grant, R. F., Yang, Y., Rudnick, D. R., Heeren, D. M., Suyker, A. E., Bauerle, W. L., and Miner, G. L.: Sustainable irrigation based on co-regulation of soil water supply and atmospheric evaporative demand, Nat. Commun., 12, 5549, https://doi.org/10.1038/s41467-021-25254-7, 2021a.
Zhang, Y., Keenan, T. F., and Zhou, S.: Exacerbated drought impacts on global ecosystems due to structural overshoot, Nat. Ecol. Evol., 5, 1490–1498, https://doi.org/10.1038/s41559-021-01551-8, 2021b.
Zhang, Y., Kong, D., Zhang, X., Tian, J., and Li, C.: Impacts of vegetation changes on global evapotranspiration in the period 2003–2017, Acta Geogr. Sin., 76, 584–594, https://doi.org/10.11821/dlxb202103007, 2021c.
Zhang, Y., Gentine, P., Luo, X., Lian, X., Liu, Y., Zhou, S., Michalak, A. M., Sun, W., Fisher, J. B., Piao, S., and Keenan, T. F.: Increasing sensitivity of dryland vegetation greenness to precipitation due to rising atmospheric CO2, Nat. Commun., 13, 4875, https://doi.org/10.1038/s41467-022-32631-3, 2022.
Zhang, Y., Zheng, H., Zhang, X., Leung, L. R., Liu, C., Zheng, C., Guo, Y., Chiew, F. H. S., Post, D., Kong, D., Beck, H. E., Li, C., and Blöschl, G.: Future global streamflow declines are probably more severe than previously estimated, Nat. Water, https://doi.org/10.1038/s44221-023-00030-7, 2023.
Zhang, Y., Feng, X., Zhou, C., Sun, C., Leng, X., and Fu, B.: Aridity threshold of ecological restoration mitigated atmospheric drought via land-atmosphere coupling in drylands, Commun. Earth Environ., 5, 381, https://doi.org/10.1038/s43247-024-01555-9, 2024.
Zhao, D., Zhang, Z., and Zhang, Y.: Soil Moisture Dominates the Forest Productivity Decline During the 2022 China Compound Drought-Heatwave Event, Geophys. Res. Lett., 50, e2023GL104539, https://doi.org/10.1029/2023GL104539, 2023.
Zheng, H., Miao, C., Li, X., Kong, D., Gou, J., Wu, J., and Zhang, S.: Effects of Vegetation Changes and Multiple Environmental Factors on Evapotranspiration Across China Over the Past 34 Years, Earths Future, 10, e2021EF002564, https://doi.org/10.1029/2021EF002564, 2022.
Zhong, Z., He, B., Wang, Y.-P., Chen, H. W., Chen, D., Fu, Y. H., Chen, Y., Guo, L., Deng, Y., Huang, L., Yuan, W., Hao, X., Tang, R., Liu, H., Sun, L., Xie, X., and Zhang, Y.: Disentangling the effects of vapor pressure deficit on northern terrestrial vegetation productivity, Sci. Adv., 9, eADF3166, https://doi.org/10.1126/sciadv.adf3166, 2023.
- Abstract
- Introduction
- Materials and methods
- Results
- Discussion
- Conclusions
- Appendix A: Calculation and validation of the ESI
- Appendix B: Spatiotemporal patterns of Rsvm in China
- Appendix C: Comparative impacts of precipitation and surface soil moisture on ESI
- Data availability
- Author contributions
- Competing interests
- Disclaimer
- Acknowledgements
- Financial support
- Review statement
- References
- Supplement