the Creative Commons Attribution 4.0 License.
the Creative Commons Attribution 4.0 License.
 | 05 Feb 2024
Divergent future drought projections in UK river flows and groundwater levels
Simon Parry
Jonathan D. Mackay
Thomas Chitson
Eugene Magee
Maliko Tanguy
Victoria A. Bell
Katie Facer-Childs
Alison Kay
Rosanna Lane
Robert J. Moore
Stephen Turner
John Wallbank
Hydrological drought is a serious issue globally, which is likely to be amplified by 21st century climate change. In the UK, the impacts of changes in river flow and groundwater drought severity in a future of climate change and higher water demand are potentially severe. Recent publication of a new nationally consistent set of river flow and groundwater level projections (the eFLaG dataset), based on state-of-the-art UKCP18 climate projections, offers a unique opportunity to quantitatively assess future UK hydrological drought susceptibility. The dataset includes a transient, multi-model ensemble of hydrological projections driven by a single regional climate model (RCM), with a 12-member perturbed-parameter ensemble, for 200 catchments and 54 boreholes spanning a period from 1961 to 2080. Assessment of a baseline period (1989–2018) shows that the RCM-driven projections adequately reproduce observed river flow and groundwater level regimes, improving our confidence in using these models for assessment of future drought. Across all hydrological models and most catchments, future low river flows are projected to decline consistently out to 2080. Drought durations, intensities and severities are all projected to increase in most (over 90 %, pooling across different drought characteristics) UK catchments. However, the trajectory of low groundwater levels and groundwater drought characteristics diverges from that of river flows. Whilst groundwater levels at most (> 85 %) boreholes are projected to decline (consistent with river flows), these declines are relatively modest (< 10 % reduction) in transient low groundwater levels by 2080, and, in fact, six show moderate increases. Groundwater drought characteristics in the far future (2050–2079) are often similar to those of the baseline (1989–2018), with only 33 % of boreholes showing an increase (towards worsening drought) of more than 10 % for drought severity (48 % of boreholes for drought intensity). Interestingly, for some boreholes, droughts are projected to be more prolonged and severe in the near future (2020–2049) before returning to shorter durations and lower severity in the far future. A number of explanatory factors for this divergence between river flow and groundwater are discussed. The sensitivity to seasonal changes in precipitation and potential evapotranspiration is proposed as a principal driver of divergence because low river flows are more influenced by shorter-term rainfall deficits in the summer half-year, whilst groundwater drought appears to be offset somewhat by the wetter winter signal in the RCM projections. Our results have important implications for water management, demonstrating a widespread increase in river flow drought severity and diminishing low flows that could have profound societal and environmental impacts unless mitigated. Furthermore, the divergence in projections of drought in river flows and groundwater levels brings into question the balance between surface and subsurface water resources. The projected contrast in fortunes of surface and subsurface water resources identified for the UK may be replicated in other parts of the world where climate projections suggest a shift towards drier summers and wetter winters.
- Article
(9826 KB) - Full-text XML
-
Supplement
(11530 KB) - BibTeX
- EndNote


River flow and groundwater drought (hereafter referred to jointly as hydrological drought) are natural phenomena which have been observed throughout the historical record in many parts of the world (Tallaksen and Van Lanen, 2004). The development of hydrological drought is complex, driven in part by the atmosphere (meteorological drought) and by hydrological processes which control the propagation of drought through space and time (Van Loon, 2015). Consequently, the translation of a meteorological drought to river flow and groundwater level deficits manifests differently, but both have important environmental and socio-economic consequences.
Hydrological drought impacts are generally less severe in countries with temperate climates such as the United Kingdom (UK), but they are not immune to costly consequences, particularly where water resources are managed under assumptions of plentiful precipitation. A principal challenge for UK water resources is the geographical distribution of average annual rainfall which is inversely related to patterns of population density. Folland et al. (2015) describe how the drier “English Lowlands” in the south and east are densely populated, with some of the greatest water demands for public water supply, commerce and agriculture – with many catchments in this area already considered water-stressed. Hence, in this region especially, reconciling potential futures of reduced water supply under climate change and increased water demands is already being discussed (the “jaws of death”; Bevan, 2022). Of key importance for water resource managers is understanding how climate change will affect both surface water and groundwater drought. Robust, nationally consistent assessments of future drought incorporating state-of-the-art climate projections have never been more crucial.
In the UK, regional water supply is made up of a mixture of groundwater and surface water; in England, groundwater comprises around a third of water supplies (and more than three-quarters in the south-east, mainly from the Chalk), whereas in Scotland and Wales, groundwater contributes only around 5 % to total water supply (BGS, 2023). Drought is a regular feature of UK hydroclimatology (Bloomfield and Marchant, 2013; Rudd et al., 2017; Barker et al., 2019). The 1975–1976 drought remains the benchmark drought in observed records in the UK (Rodda and Marsh, 2011), although rapid growth of the gauging station network did not commence until the 1960s. Long reconstructed river flow records provide the most comprehensive record of historical droughts; the analysis of these datasets has yielded new insights into severe droughts in the 1890s, 1900s, 1920s and 1930s which rivalled or surpassed the 1976 drought in their duration and severity (Rudd et al., 2017; Barker et al., 2019). These studies and others found that each drought episode tends to have a distinct spatial footprint and temporal evolution, and they are sufficiently large-scale to prompt assessment of their complex spatio-temporal characteristics. Historical chronologies of drought and its recovery have also identified spatial coherence in response (e.g. Parry et al., 2012; Tanguy et al., 2023), although the rate at which droughts terminate has been demonstrated to vary considerably (Parry et al., 2016). Analysis of records of groundwater level measurements that are not significantly impacted by abstraction using standardised metrics of groundwater drought (Bloomfield and Marchant, 2013) has already provided an insight into the spatio-temporal evolution of groundwater drought in the UK. Bloomfield et al. (2015) analysed 74 groundwater level time series from Lincolnshire and identified six broad clusters of groundwater drought behaviour with homogeneous driving meteorology but contrasting hydrogeological properties. They inferred the unsaturated zone thickness as an important control on drought duration, magnitude and intensity. More recently, Bloomfield et al. (2019) analysed long-term changes in groundwater drought occurrence in the Chalk aquifer of the UK using two groundwater level records that extend back to 1891. They showed that while precipitation deficits are the driver of groundwater drought formation and propagation, long-term increases in the frequency and intensity of groundwater drought are associated with climate warming. These results indicate that, even without future changes in precipitation deficits, anthropogenic warming could also serve to increase drought severity.
Our understanding of future changes in hydrological drought remains limited, some of which is based on hydrological projections underpinned by the older UKCP09 climate projections (e.g. Borgeomo et al., 2015; Huskova et al., 2016; Collet et al., 2018; Visser-Quinn et al., 2019). When climate projections from the “weather@home” initiative were used to drive hydrological models, surface water droughts were found to increase in severity across Great Britain (Rudd et al., 2019), with extreme droughts most notably impacted (Dobson et al., 2020). Studies that have assessed the future of the drier part of the hydrological regime driven by newer UKCP18 climate projections (e.g. Kay et al., 2021b; Lane and Kay, 2021) have focused on low flows rather than drought characteristics. However, these studies only considered a single hydrological model. For groundwater level, the study of Jackson et al. (2015) is the only national assessment of changes in UK groundwater levels under climate change currently available. Their analysis is based on the Future Flows and Groundwater Levels dataset (FFGWL; Prudhomme et al., 2013), which includes projections of groundwater levels at 24 boreholes in the UK's principal aquifers. They found that, at most of the boreholes, average summer levels are projected to fall, and average winter levels are projected to increase by the 2050s under the UKCP09 high-greenhouse-gas-emissions scenario. However, they also noted that local hydrogeological conditions appear to control the future response to climate, and their analysis did not assess drought characteristics specifically.
A number of limitations remain in our understanding of future drought severity in the UK. Firstly, none of the existing studies have attempted to integrate analysis of river flow and groundwater level data using consistent driving data and analysis techniques. For groundwater, no analysis of national-scale groundwater drought susceptibility under climate change has been undertaken. Secondly, most studies (and all multi-model analyses) are based on the UKCP09 climate projections, which no longer represent the state of the art for UK climate change science. Finally, none of the assessments to date have examined the significance of hydrological model uncertainty in assessment of hydrological drought under climate change. This is despite the fact that hydrological modelling uncertainties are important and often comparable to climate model uncertainties for low flows (Prudhomme et al., 2011; Engin et al., 2017; Meresa and Romanowicz, 2017; Chegwidden et al., 2019; Lane et al., 2022).
The objective of this study is to use a nationally consistent set of river flow and groundwater level projections available from the eFLaG dataset (Hannaford et al., 2022), which are based on state-of-the-art UKCP18 regional climate model (RCM) projections (Lowe et al., 2018), to quantitatively assess future UK hydrological drought susceptibility. Section 2 gives an overview of the eFLaG river flow and groundwater level dataset and provides details of the indicators used to evaluate changes in drought susceptibility in the future. Section 3 presents the results of this study. This comprises an initial evaluation of RCM-driven river flow and groundwater level projections against observed historical drought, followed by the future projections of river flow and groundwater level drought. Section 4 discusses the results before Sect. 5 concludes the study.
2.1 eFLaG dataset
The eFLaG dataset as well as the climate data and models that underpin it has been comprehensively described in Hannaford et al. (2023). Only a brief overview of the dataset with details relevant for the drought analysis conducted in this study is summarised below. The dataset includes simulated river flow and groundwater level time series for 200 river flow catchments and 54 groundwater level boreholes across the UK. These were generated using a combination of hydrological and groundwater models, all of which were driven by daily time series of available precipitation and potential evapotranspiration (PET). These data are grouped into “simobs” and “simrcm” model outputs.
2.1.1 Simobs model outputs
The simobs outputs are observation-driven simulations, i.e. model simulations driven with observational datasets of precipitation, temperature and PET which comprise the HadUK-Grid 1 km gridded rainfall and air temperature data (Hollis et al., 2019) recommended by UKCP18 and the MORECS PET dataset (Hough and Jones, 1997). The simobs outputs for January 1989 to December 2018 were used herein to represent a 30-year “baseline” period of the past.
2.1.2 Simrcm model outputs
The simrcm outputs were derived by driving the hydrological and groundwater models with 12 km UKCP18 RCM projections (Murphy et al., 2018). These projections consist of a 12-member ensemble, created using perturbed-parameter runs of the Hadley Centre climate model and RCMs. While this ensemble provides some indication of future climate uncertainty, it is important to note that all 12 ensemble members are derived from the same model structure and based on the same high emissions scenario (RCP8.5). This is a necessary constraint of the eFLaG dataset, and the reasons for this and its significance are discussed by Hannaford et al. (2023). In brief, the 12 km “regional” projections of UKCP18 were chosen as these are the only transient, spatially coherent projections in the UKCP18 portfolio, and these were important criteria for eFLaG. Of course, this means that only one socioeconomic scenario is featured, and, as noted by Hannaford et al. (2023), it is regarded as a somewhat pessimistic one and ideally should be contextualised with other scenarios – we return to this limitation in the discussion.
Daily precipitation data were bias-corrected against the simobs climate data using monthly change factors. The simrcm data for 1983 to 2079 were used to provide continuous projections of river flows and groundwater levels. Projections were also assessed on a 30-year time slice basis using the “baseline” (1989–2018), “near future” (2020–2049) and “far future” (2050–2079) to look at relative changes in river flow and groundwater drought characteristics.
2.1.3 Hydrological and groundwater models
An ensemble of four hydrological models was used for the river flow simulations to provide insight into the sensitivity of future projections to hydrological model, an aspect of uncertainty that has been ascertained to be at least as important as climate model uncertainty for low flows in previous studies (Chegwidden et al., 2019; Velazquez et al., 2013). These models are as follows:
-
GR4J and GR6J are lumped catchment rainfall-runoff models (Perrin et al., 2003; Pushpalatha et al., 2011) from the same “airGR” family (Coron et al., 2021) with four and six parameters, respectively. They are relatively simple models with a computationally efficient automatic calibration function, making them suitable for a range of applications. They have been applied successfully in the UK on a number of occasions (e.g. Harrigan et al., 2018; Smith et al., 2019; Anglian Water Drought Plan, 2021).
-
The Probability Distributed Model (hereafter “PDM”; Moore, 2007; UKCEH, 2022a) is a configurable lumped catchment rainfall-runoff model supporting a large choice of potential configurations, several of which were trialled during model setup using an automated procedure across the set of catchments (Fig. S2 of Hannaford et al., 2023).
-
Grid-to-Grid (hereafter “G2G”; Bell et al., 2009) is a distributed hydrological model which simulates natural river flows on a 1 km resolution grid across Great Britain (Moore et al., 2006; Cole and Moore, 2009; Bell et al., 2012). G2G has been applied previously for low-flow and drought studies (e.g. Kay et al., 2018; Rudd et al., 2019; Lane and Kay, 2021) and can be used with abstraction and discharge data to simulate observed river flows (Rameshwaran et al., 2022), though this has not been implemented for this application. G2G is set up using national gridded datasets and is parameterised accordingly, precluding the need for calibrating to observed river flows for individual catchments. Although a key strength of G2G is its ability to provide consistent, national-scale flow estimates, only G2G-simulated flows at gauging station locations are used herein.
Groundwater level time series at boreholes were simulated using the lumped conceptual AquiMod (Mackay et al., 2014) groundwater model. The model has a flexible structural representation of vertical heterogeneity of the subsurface to represent site-specific hydrological and hydrogeological properties of the groundwater catchment surrounding each borehole. AquiMod has been used in the past to assess climate change impacts on groundwater levels (Jackson et al., 2015; Ascott et al., 2021) and also underpins operational drought forecasting delivered by the BGS as part of the UK Hydrological Outlook (Mackay et al., 2015; Prudhomme et al., 2017). It must be noted that only one groundwater level model is available within eFLaG, simply given the nature of that dataset, compared with the multiple river flow models. This is important to bear in mind when interpreting the results of this study: some indication of hydrological model uncertainty can be presented for river flows but not for groundwater.
2.2 River flow catchments and groundwater level boreholes
The full dataset of river flow and groundwater level projections (Hannaford et al., 2022) comprises data for 200 river flow catchments and 54 groundwater level boreholes across the UK. Study locations were selected by considering the needs of the research community and the water industry, as well as including many of the same sites for which projections were available in the FFGWL dataset (Prudhomme et al., 2013). A range of additional factors were considered when determining the catchment and borehole lists: inclusion in key strategic national hydrometric networks; geographical coverage; representativeness of catchment characteristics; overall data quality, record length and completeness; and the absence of artificial influences of an extent that confounds modelling efforts.
Results derived from the river flow projections are provided for the full dataset of 200 catchments (in the case of national-scale mapping of future changes) or for a subset of 32 case study catchments (illustrated in Fig. 1) highlighted to allow us to look at projected catchment-scale drought/low-flow changes in detail. These 32 catchments were selected to ensure a reasonable geographical spread around the UK whilst also reflecting the range of hydroclimatic and hydrogeological properties. An interactive portal (UKCEH, 2022b; https://eip.ceh.ac.uk/hydrology/eflag, last access: 4 January 2024) allows the reader to reproduce much of the analysis presented here, including producing similar catchment-scale analysis but for the wider set of 200 eFLaG catchments.
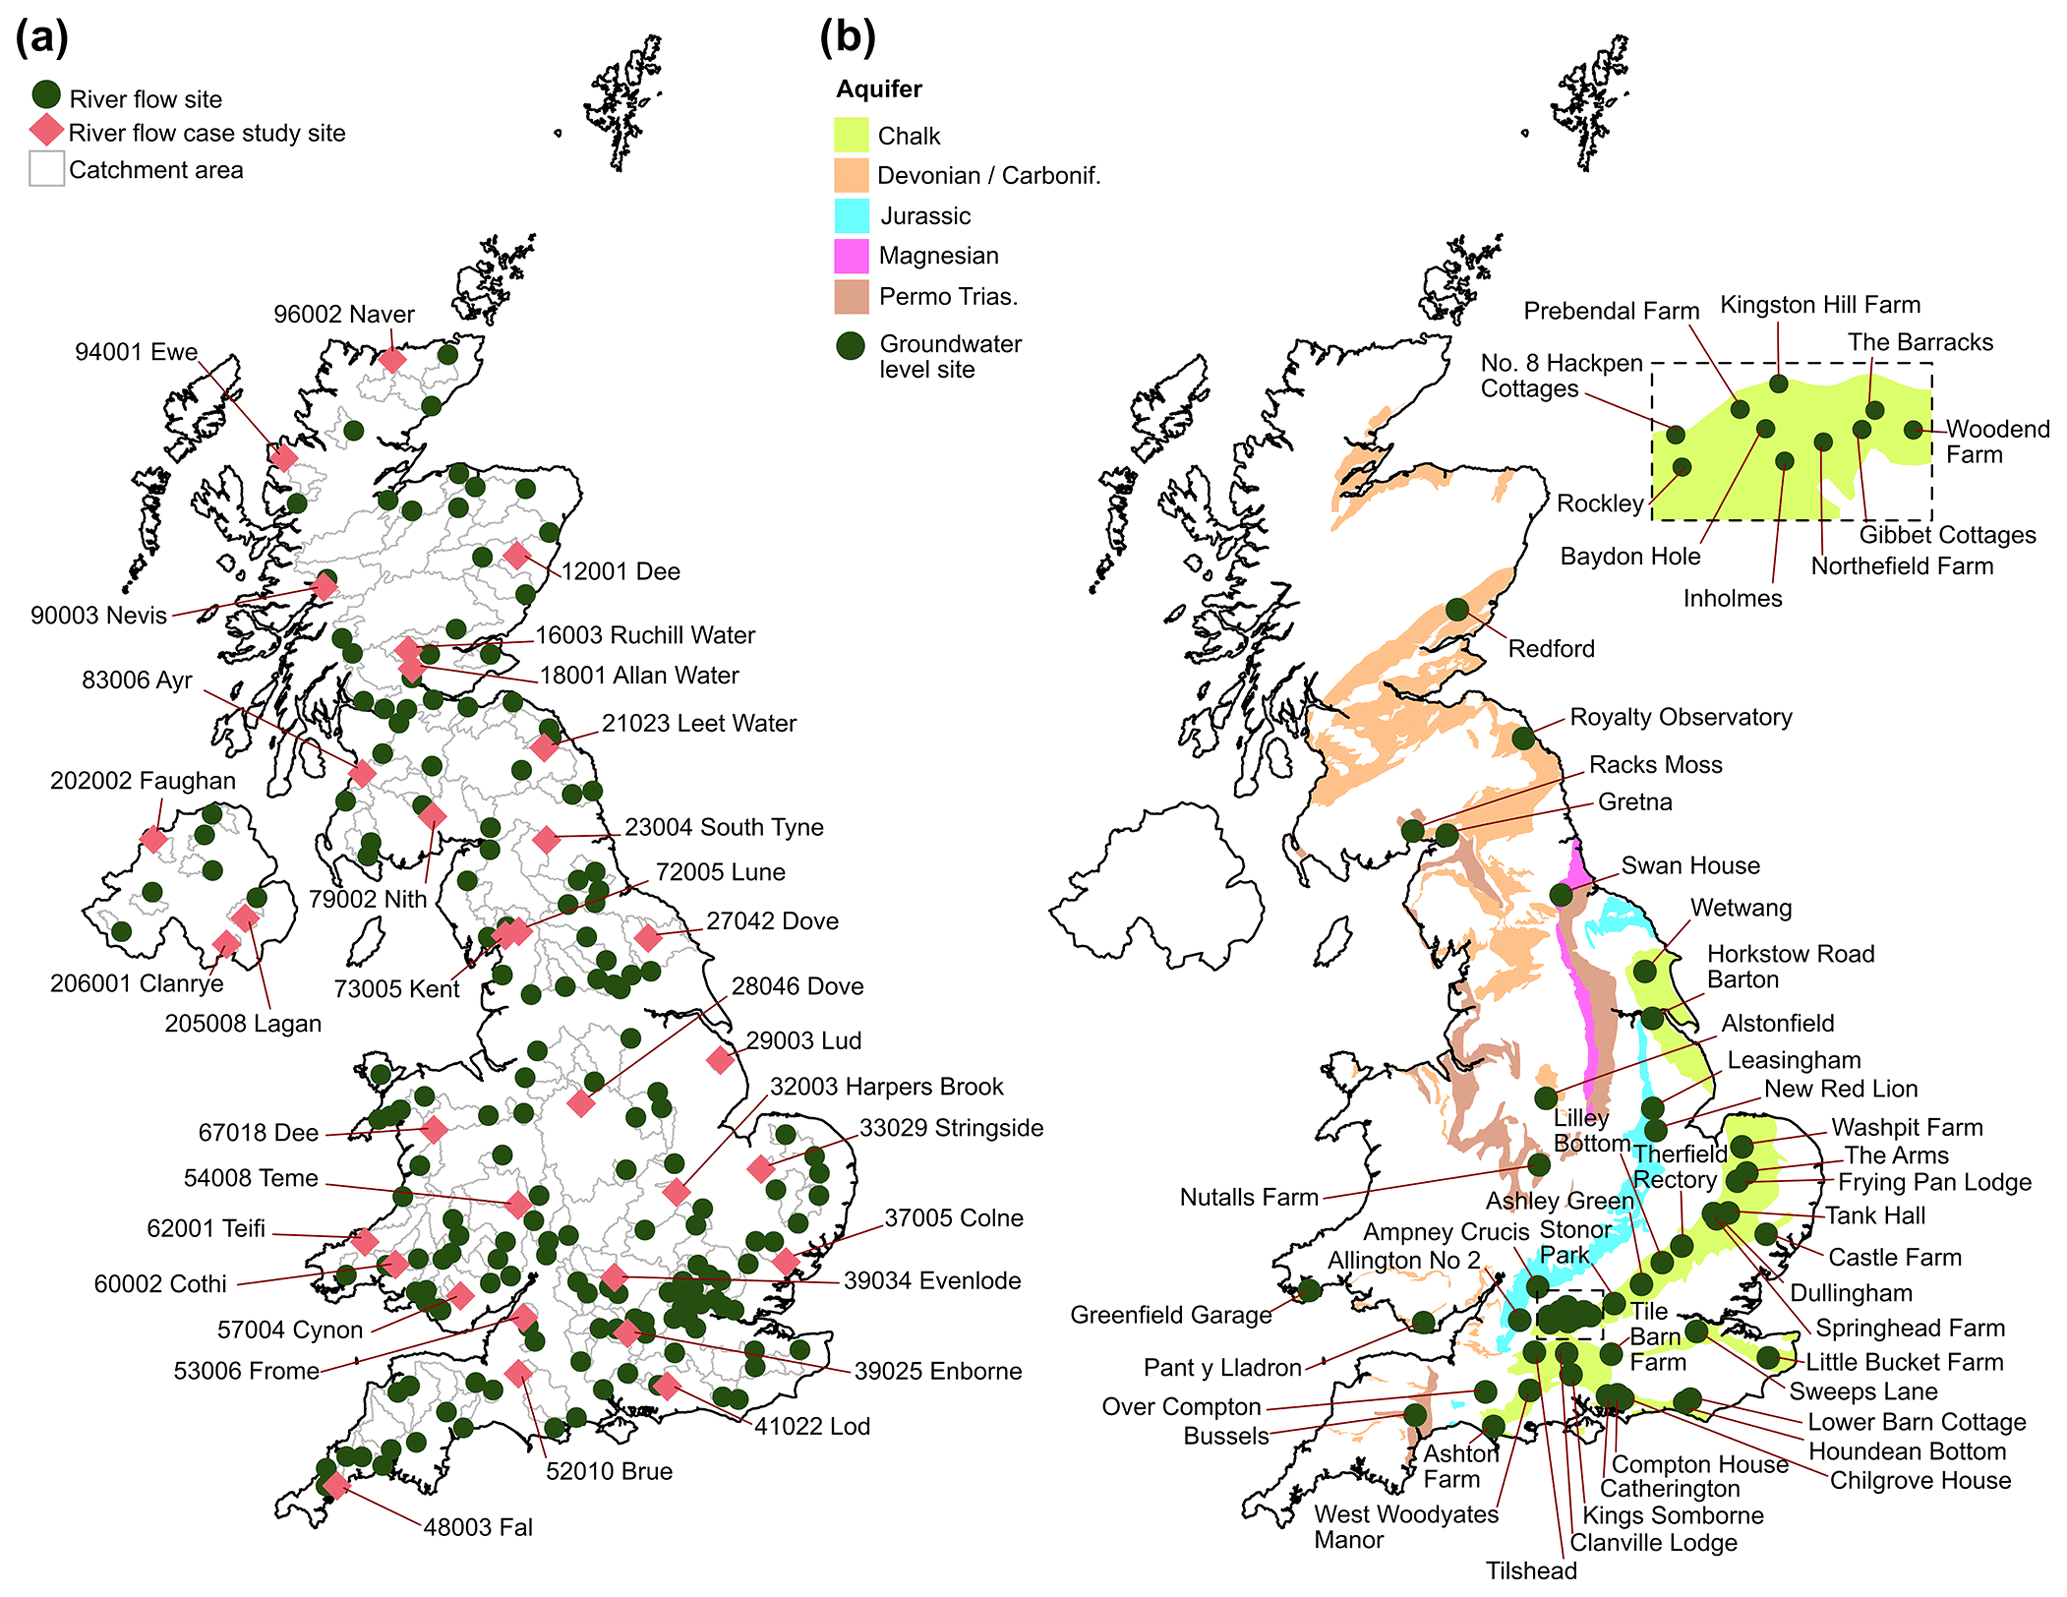
Figure 1Study catchments and boreholes: (a) 200 river flow catchments (numbers represent NRFA station numbers) and (b) 51 groundwater level boreholes. A subset of 32 catchments included in some analyses is indicated by pink diamonds.
Results derived from the groundwater level projections are provided for all but 3 of the 54 boreholes: Skirwith, Llanfair and Heathlanes, which are situated in the Permo-Triassic sandstones. These were excluded because their hydrographs exhibit very long (multi-year) trends that make it difficult to calculate robust metrics of groundwater drought over the selected 30-year time slices.
2.3 Low-flow and level metrics
The 90 % exceedance river flows and groundwater levels (Q90 and L90, respectively) were calculated from the simrcm data to provide a first-order analysis of how hydrological deficits are likely to change in future relative to the recent past. The 70th, 50th and 30th percentile exceedance flows and levels were also analysed to provide a broader context for future hydrological change. Percentage changes in flow and level quantiles were calculated for the near-future and far-future time slices relative to the baseline period. Note that for groundwater these percentage changes are expressed relative to the historical range of groundwater levels in the simrcm baseline period. Transient flow and level quantiles were also calculated using a 30-year moving-average filter to remove the effects of internal variability.
2.4 Drought identification and characterisation
To identify river flow and groundwater droughts from the eFLaG simrcm data, a threshold-based approach was used, which has been widely applied for drought identification (e.g. Parry et al., 2016; Rudd et al., 2017). For a given river flow or groundwater level time series, the data were first aggregated into monthly means. Twelve thresholds (one for each month of the year, which accounts for seasonality) were then derived using a specified flow or level quantile calculated from the simrcm baseline period. The catchment is in drought for a particular month when the flow or level is below the threshold for that month. A pooling procedure is applied which considers two separate events separated by a single month above the threshold to be joined together into a single drought event (provided the magnitude above the threshold does not exceed the accumulated deficit prior to this single month). A drought, as defined in this study, therefore represents a time when the river flow or groundwater level is relatively low with respect to historic norms for that time of year. Having identified individual drought events, three characteristics were assessed for each: (i) duration – the number of months over which a drought occurs, (ii) intensity – the largest flow or level deficit relative to the drought threshold in any month of a drought, and (iii) severity – the accumulated flow or level deficit across all months of a drought.
For river flows the monthly 70 % exceedance flow was used to define the drought thresholds for each catchment. This may be regarded as a relatively “high” threshold for drought, as these flows occur by definition 30 % of the time, which would not be considered extreme. This threshold was chosen based on expert judgement and experimentation, to ensure multi-year droughts pool together rather than being “split” by intermittent higher flows, as occurs with lower thresholds like Q90. This is important given the importance in the UK of multi-year droughts, driven by winter deficiencies, as noted in the Introduction. The threshold balances yielding a sufficient number of droughts while still being “impactful” in highlighting major droughts episodes: it is lower than in some other UK drought studies (e.g. Rudd et al., 2017, 2019), which have shown good representation of known major historical droughts.
For groundwater, it is difficult to compare groundwater drought characteristics across different boreholes when using groundwater level deficits directly. This is because the contrasting hydraulic properties give rise to highly site-specific relationships between level deficit and water availability. Accordingly, a non-parametric normal score transformation of groundwater level data to standardise groundwater level time series into a standardised groundwater index (SGI; Bloomfield and Marchant, 2013) was used before conducting the drought analysis. Following Bloomfield et al. (2019), a SGI of −1 was used as the drought threshold, which corresponds to the 84th percentile exceedance level.
Bloomfield et al. (2015) showed that regional variations in the duration, intensity and severity of groundwater drought in the UK are controlled, in part, by hydrogeological catchment characteristics, which influence the responsiveness of local water table variations to driving climate. For boreholes with high autocorrelation in the SGI series (slowly responding), drought durations and magnitudes are likely to be larger. A convenient way to quantify groundwater responsiveness to climate is to compare the SGI time series with an equivalent standardised precipitation index (SPI). The SPI accumulation period which leads to the strongest correlation between SGI and SPI, qmax, is positively correlated with SGI autocorrelation and can reach as high as 28 months in high-storage, low-diffusivity aquifers such as the Permo-Triassic sandstones (Bloomfield and Marchant, 2013). We calculated qmax for each borehole by comparing the SGI derived from the simobs groundwater level simulations to a standardised recharge index (SRI) derived from the equivalent soil drainage simulations from AquiMod. Figure S1 shows that qmax varies between 1 and 16 months across the boreholes. All four boreholes situated in the Carboniferous limestone are representative of rapidly responding aquifers with qmax < = 2 months. For the Jurassic limestones, Chalk and Permo-Triassic sandstones, the qmax range is 2–6, 3–13 and 7–17 months, respectively.
3.1 Evaluation of simrcm runs over baseline period
The ability of the simrcm runs to represent observed river flow and groundwater drought events is assessed by comparing the characteristics of droughts extracted from the simrcm and simobs simulations over the 30-year baseline time slice (1989–2018). It should be noted that there are 12 times more data in the simrcm ensemble because for each catchment or borehole there is only one simobs time series, whereas there are 12 RCM time series within the simrcm ensemble.
3.1.1 River flows
For river flows within the subset of 32 catchments, the simrcm dataset reasonably approximates to the simobs drought characteristics (Fig. 2). Comparing pairs of box plots corresponding to simobs and simrcm baseline for each of the hydrological models, the 25th, 50th and 75th percentiles of drought duration are in good agreement (particularly in catchments across the north and west of the UK), with absolute differences rarely exceeding 1 month (Fig. 2a). Intensities in simobs are reasonably approximated by the simrcm data for most catchments, particularly with respect to the 25th, 50th and 75th percentiles (notwithstanding slight differences naturally resulting from a continuous variable like intensity compared to a discrete variable like duration). For severity (Fig. 2c), there is generally good agreement between the simrcm and simobs, although differences in 25th, 50th and 75th percentile values are greater for severities than either duration or intensity. There are some larger differences between simobs and simrcm baseline in the tails of the distributions for all metrics in some catchments. For duration, this is particularly so for catchments in southern England (e.g. catchments 29 003 to 52 010 in Fig. 2a), and across north-eastern Britain, high-intensity values are overestimated whilst low intensity values are underestimated (Fig. 2b). However, differences for these extreme events are likely to be influenced by the larger sample size of droughts in the simrcm data due to there being 12 RCM time series. For pairs of box plots across all hydrological models and catchments, where there are differences, the simrcm baseline is more likely to underestimate the drought characteristics.
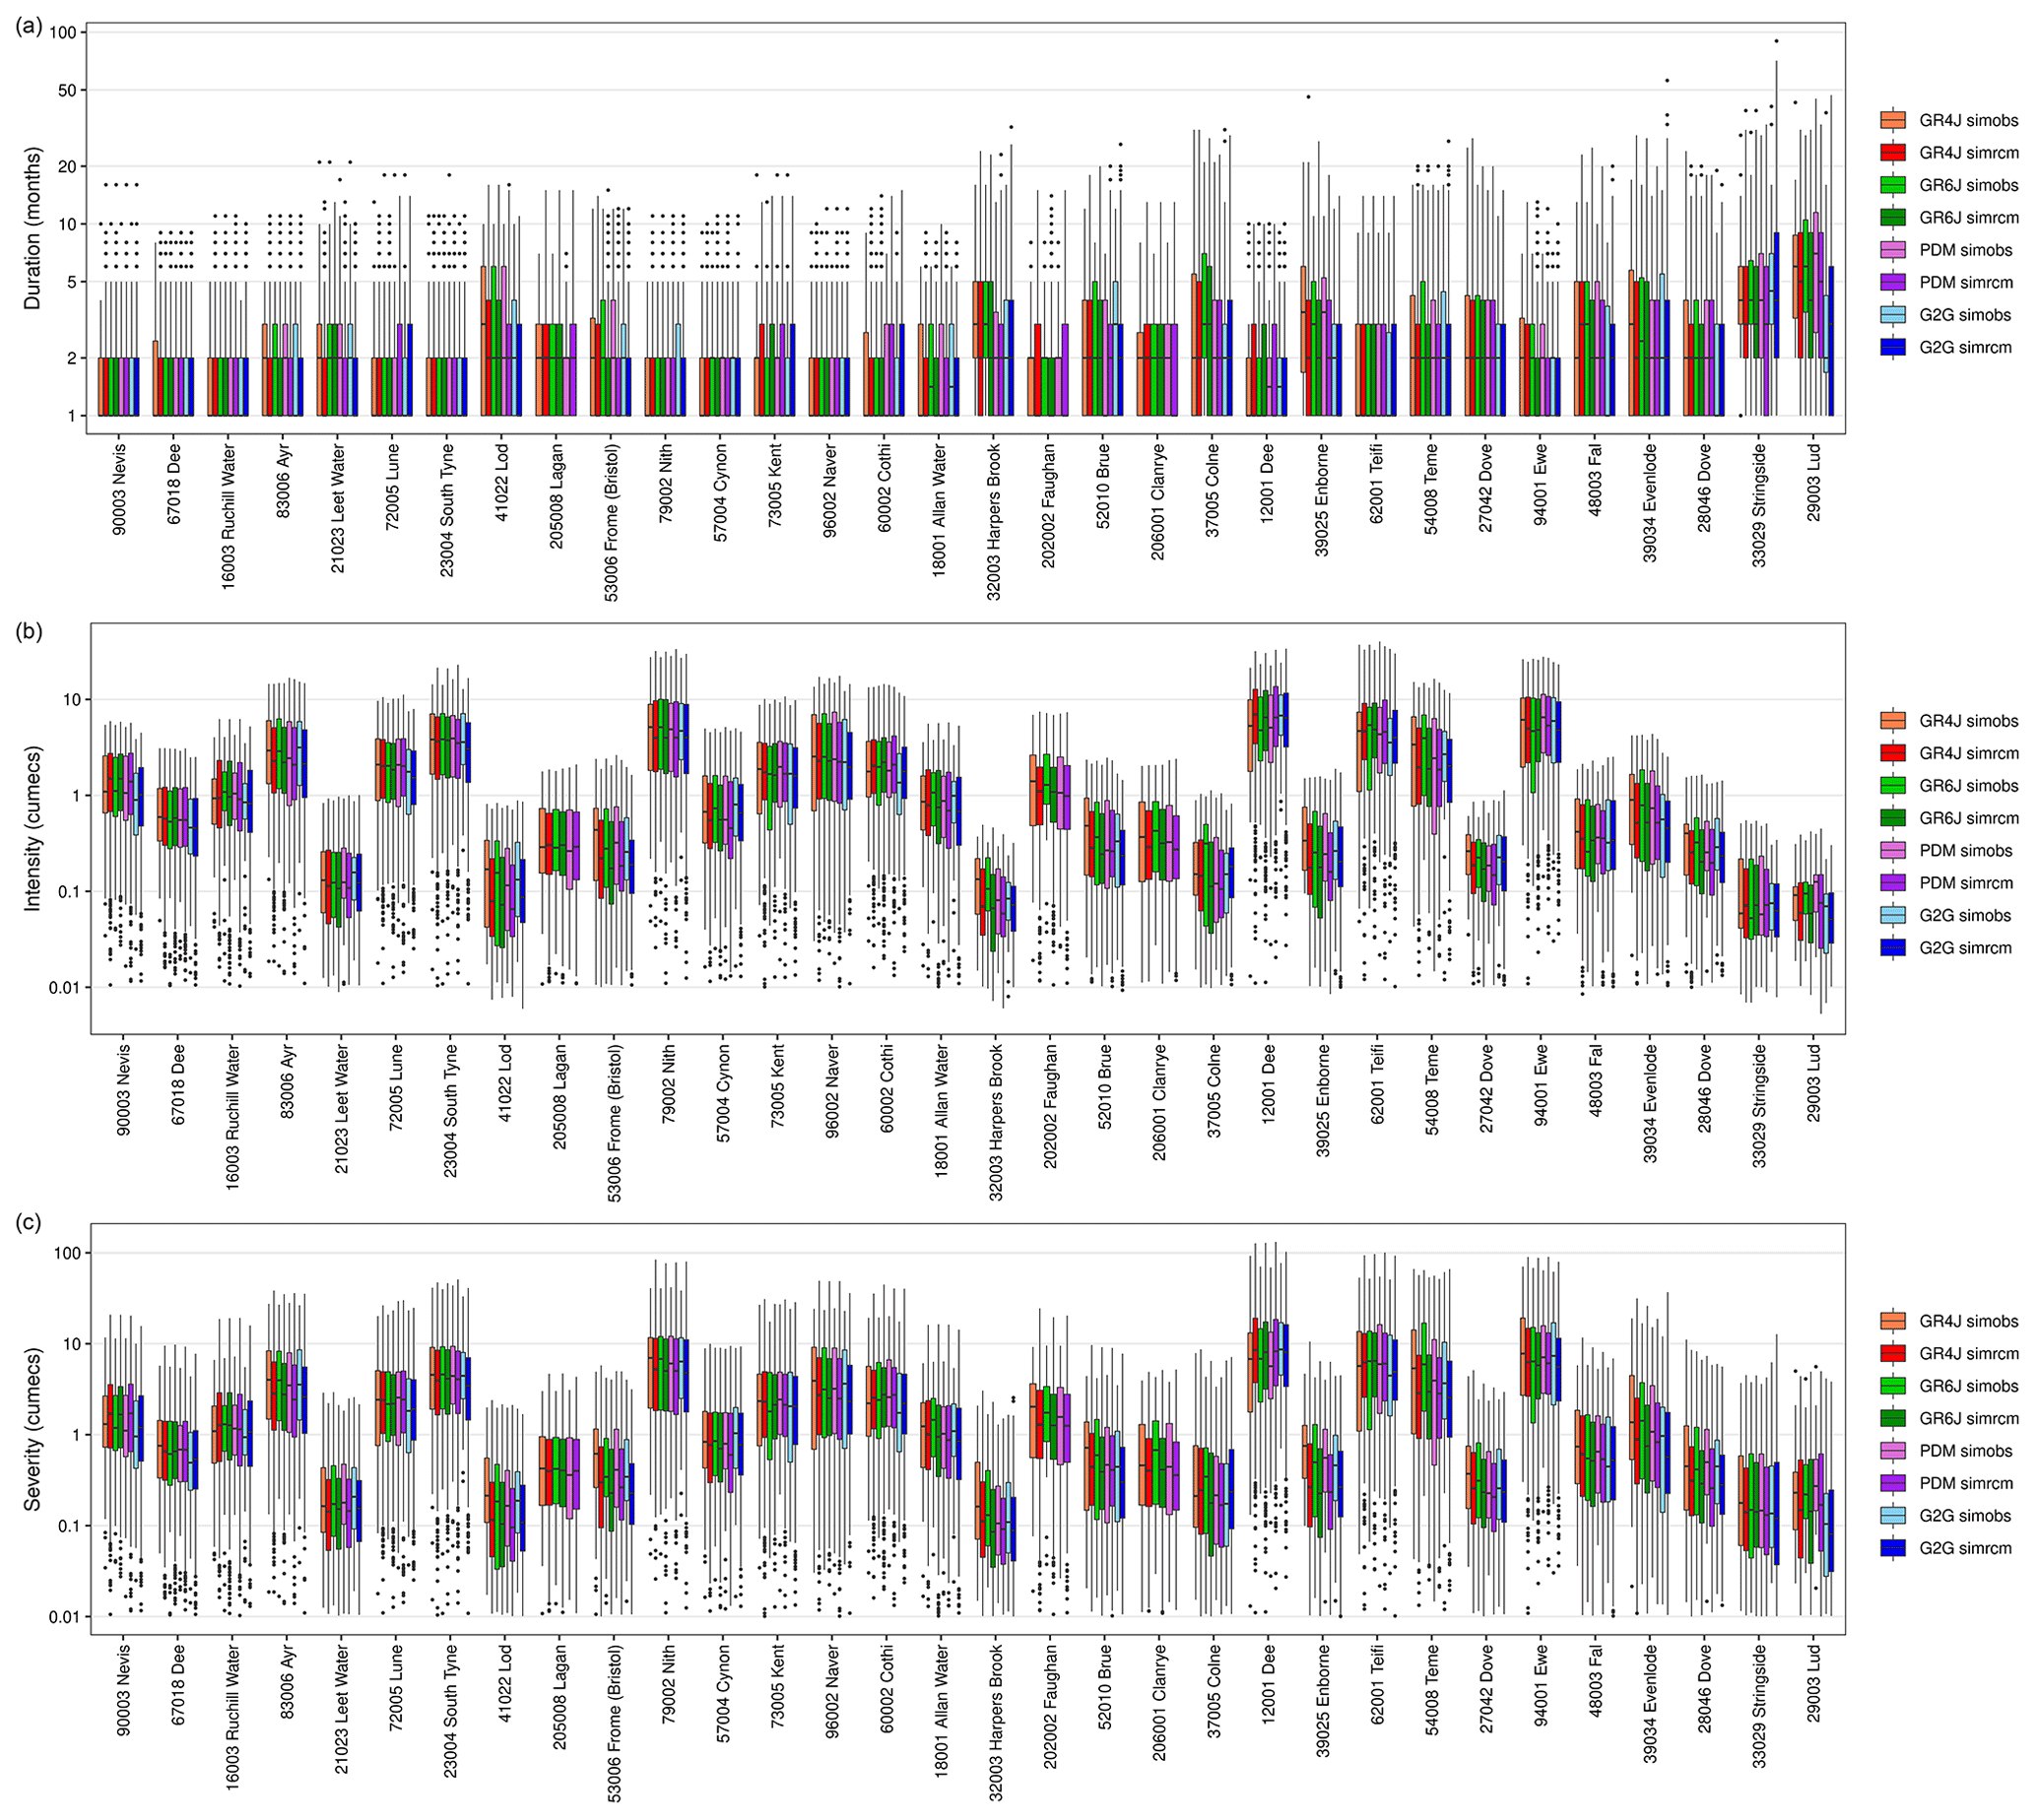
Figure 2Comparison of drought characteristics for 32 catchments in simobs and simrcm for the baseline period (1989–2018). Catchments on the x axis are ordered by increasing Baseflow Index, and the y axes are logarithmic. For each catchment, there are four pairs of box plots, one for each hydrological model, with pairs illustrating comparison between drought characteristics in simobs and simrcm. Note that the baseline box plots contain characteristics for all events identified across all 12 simrcm runs, whereas simobs runs only contain events from a single 30-year time slice. Drought characteristics presented are (a) duration, (b) intensity and (c) severity.
3.1.2 Groundwater levels
A comparison of the simobs and simrcm groundwater drought characteristics is given in Fig. 3. In this plot, the boreholes have been ordered from left to right in order of their responsiveness (qmax). The simobs runs show a trend of longer duration and higher severity as qmax increases. The median duration of drought events ranges from 4 months (Pant Y Lladron, qmax= 1) up to 37 months (Nuttalls Farm, qmax= 17), while the median severity ranges by almost an order of magnitude between 3.6 (Pant Y Lladron) and 30.6 (Nuttalls Farm). The simrcm runs show a similar pattern of increasing duration and severity with qmax and with similar ranges across the different boreholes. However, for some boreholes, there are large discrepancies between the simobs and simrcm quantiles. There does not appear to be any regional spatial control on the magnitude of these discrepancies that could be related to the driving climatic patterns. The largest discrepancies include boreholes from the south-east of England (e.g. Dullingham) up to southern Scotland (Royalty Observatory). Instead, the largest deviations between the simobs and simrcm runs are typically associated with boreholes situated in more slowly responding groundwater systems. There is also a systematic negative bias in the simrcm drought characteristics, whereby 44 of the boreholes show smaller median drought duration in the simrcm runs, and 43 show smaller median severity. There are similar biases in 25th and 75th percentiles. For some boreholes (e.g. Chilgrove House, Royalty Observatory and Therfield Rectory) there is considerably more spread in the simrcm runs than the simobs runs.
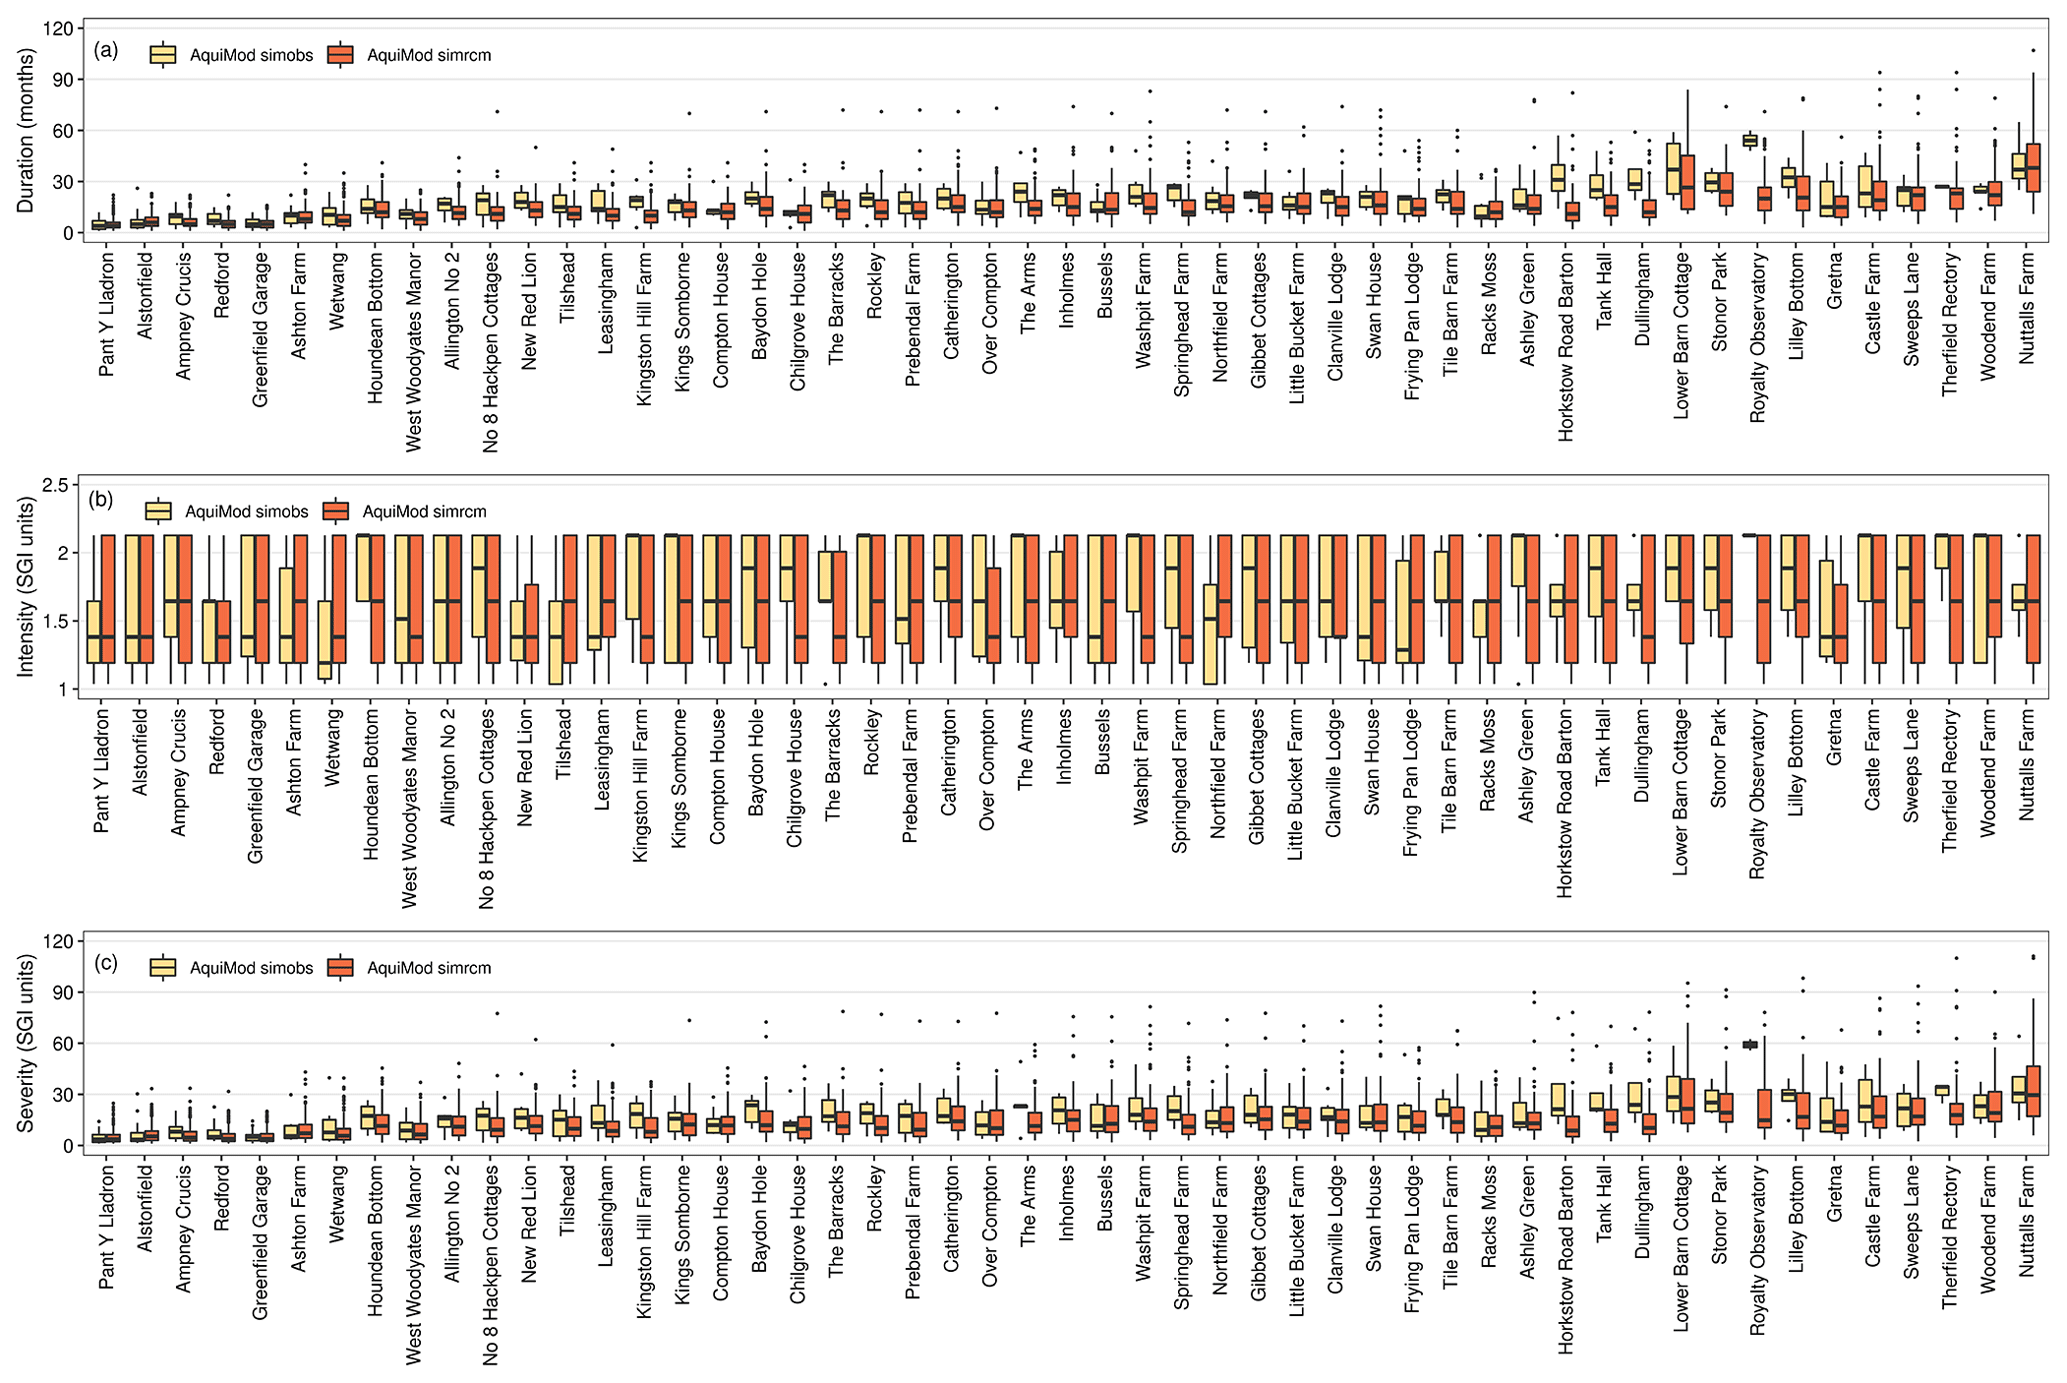
Figure 3Comparison of drought characteristics for 51 boreholes in simobs and simrcm for the baseline period (1989–2018). Pairs of box plots illustrate comparison between drought characteristics in simobs and simrcm. Note that the baseline box plots contain characteristics for all events identified across all 12 simrcm runs, whereas the simobs only contain events from a single 30-year time slice. Drought characteristics presented are (a) duration, (b) intensity and (c) severity. The 51 boreholes along the x axis are ordered from most responsive (left) to least responsive (right).
Differences between the intensity calculated from the simobs and simrcm runs are generally small, with 37 of the 51 boreholes showing differences of less than 0.4 SGI units. However, there are more significant differences for specific boreholes including Kingston Hill Farm and Washpit Farm, which show the largest difference of 0.7 SGI units. Unlike the duration and severity, there does not appear to be any systematic bias in the simrcm simulations of intensity, with both under- and overestimations shown across the boreholes.
3.2 Future projections of river flow and groundwater drought
Projections of future drought from the simrcm runs are presented through comparisons of characteristics of drought events extracted from the baseline (1989–2018), near-future (2020–2049) and far-future (2050–2079) time slices. Within the box plots of Figs. 4 and 5, characteristics of extracted drought events from all 12 RCM ensemble runs are included to provide an appreciation of the range of possible events.
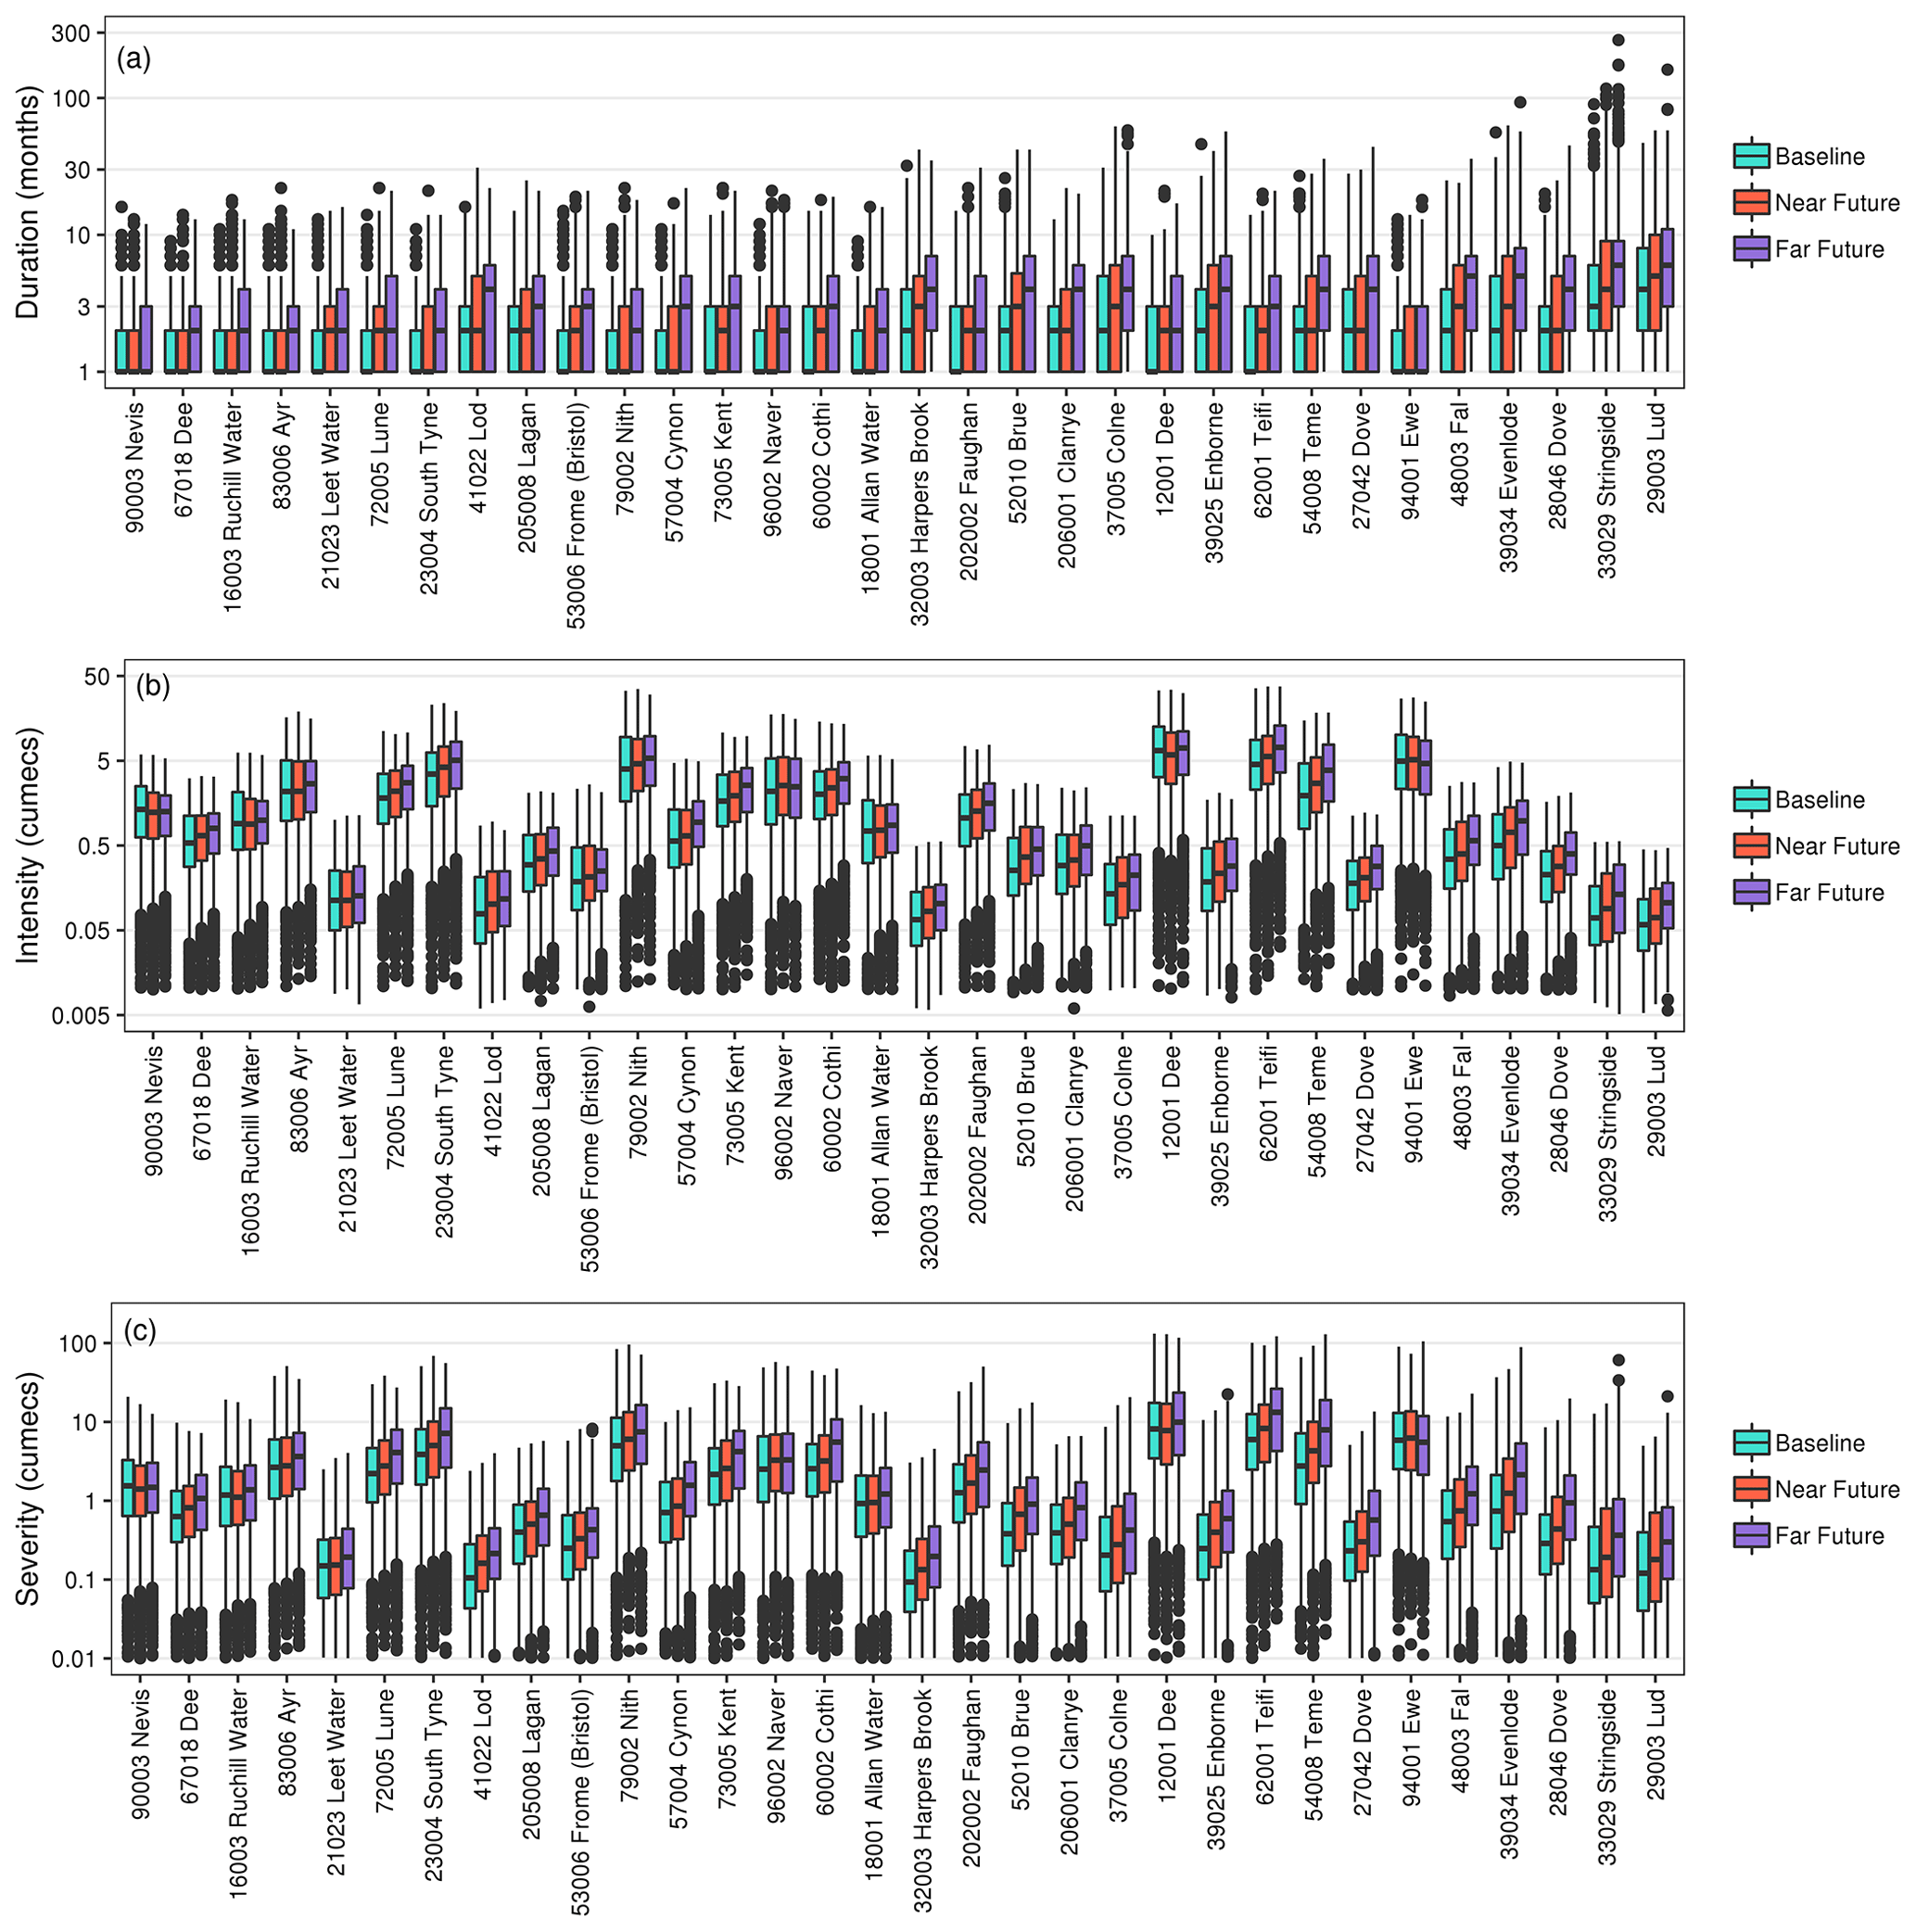
Figure 4Drought event characteristics in simrcm for 32 catchments. Box plots contain all drought events in the baseline (1989–2018), near-future (2020–2049) and far-future (2050–2079) time slices across all 12 simrcm runs for all four hydrological models (GR4J, GR6J, PDM, G2G). Results for three drought characteristics are presented: (a) duration, (b) intensity and (c) severity. The catchments along the x axis are ordered from lowest (left) to highest (right) Baseflow Index. Note that the scales of the y axes are logarithmic.
3.2.1 River flows
For all hydrological models and across the 32 catchments, drought durations are projected to increase in future (Fig. 4a). Increases in durations are most pronounced (increases of up to 6 months) for catchments in the south-east of the UK (e.g. 33 029, 39 034, 39 025, 37 005) and those with the highest Baseflow Index (BFI) values (further to the right of Fig. 4a) which already have the most protracted durations in the baseline period (noting the logarithmic y axis in Figs. 4a and S2). Increases are most notable in some catchments in the south-east for G2G (Fig. S2, e.g. 29 003, 39 034, 33 029), which can be an outlier owing to its simulation of natural flows rather than calibration to gauged flows. Smaller increases of 1–2 months are also apparent in northern and western areas, which tend to have relatively short droughts, though median durations only tend to increase to 2–4 months even in the far future. Whilst in many catchments, the 25th, 50th and 75th percentile durations are projected to increase into the future, projections of the most protracted drought events are less consistent between catchments. Across all hydrological models, whilst the longest droughts are predominantly also projected to increase in duration from the baseline to near future to far future, there are some instances of the longest drought durations peaking in the near future before decreasing in the far future.
Intensities of droughts are projected to increase into the future, across most (92 %–98 % depending on model) catchments and as simulated by the range of hydrological models (Figs. 4b and S3), with over half increasing by more than 50 %. Increases in intensities of droughts in individual catchments are most apparent in the 25th, 50th and 75th percentiles. Relative to baseline intensities, some of the largest increases occur in catchments in southern and eastern England (e.g. 29 003, 33 029, 39 034), with catchments further north more likely to exhibit no change in median intensity (e.g. 16 003, 21 023, 90 003, 94 001). Even accounting for the logarithmic y axis in Figs. 4b and S3, for most combinations of catchment and hydrological model, there is no appreciable change in the highest intensities. Whilst these results are generally consistent across the four hydrological models, increases in median intensity are largest in G2G (Fig. S3d).
Severity of drought is projected to increase in future in nearly all catchments (> 98 %) and across all four hydrological models (Figs. 4c and S4). This is a function of increases in both duration and intensity, with more months of increasingly low flows below the drought threshold. Catchments further south and/or east (e.g. 28 046, 29 003, 33 029) once again exhibit the largest changes (relative to the baseline), with increases both in median and 75th percentile severity. In catchments further north (e.g. 16 003, 83 006, 90 003), future increases in severity are more modest, with median severities exhibiting minimal increase or negligible change. Away from the south-east, there are a number of catchments in which the largest severities either peak in the near future and decline thereafter (e.g. 23 004, 79 002, 83 006) or even decline consistently from the baseline to near future to far future (e.g. 16 003, 67 018, 90 003). Amongst the hydrological models, increases in severity are once again most apparent in G2G, particularly for the highest BFI (least responsive) catchments (e.g. 28 046, 29 003, 33 029).
The above analysis and Fig. 4 provide a comprehensive summary of future drought changes, integrating across the full range of RCM–hydrological model combinations and for all drought characteristics, across the two future time slices. To provide a more focused look at future drought changes, it is beneficial to narrow down the analysis to individual RCM–model combinations, accepting that this limits a consideration of model uncertainty. To that end, to provide an easily interpretable visualisation of transient future changes in drought, Figs. 5 and 6 shows the extracted droughts for one hydrological model (PDM) and 2 of the 12 RCMs (RCM7 and RCM13). These plots show the clear progression towards increasing drought duration, particularly for RCM13, although this is more pronounced for high-storage catchments in south-east England. The intensity and severity of droughts also increase overall, but these plots show the benefit of looking at transient projections given that these changes are non-linear, with interannual and interdecadal variability exerting a strong effect.
These plots (Figs. 5 and 6) also show that drought frequency (in terms of the number of events) decreases in future in many catchments, which may seem counterintuitive given the general trends towards worsening droughts. This is a response to drought duration increasing: hence, droughts are generally less frequent but longer – so the overall proportion of time under drought increases, even if the number of events decreases. A detailed consideration of changes in drought frequency (and its interaction with other drought properties) is beyond the scope for this study but is an important topic for future research.
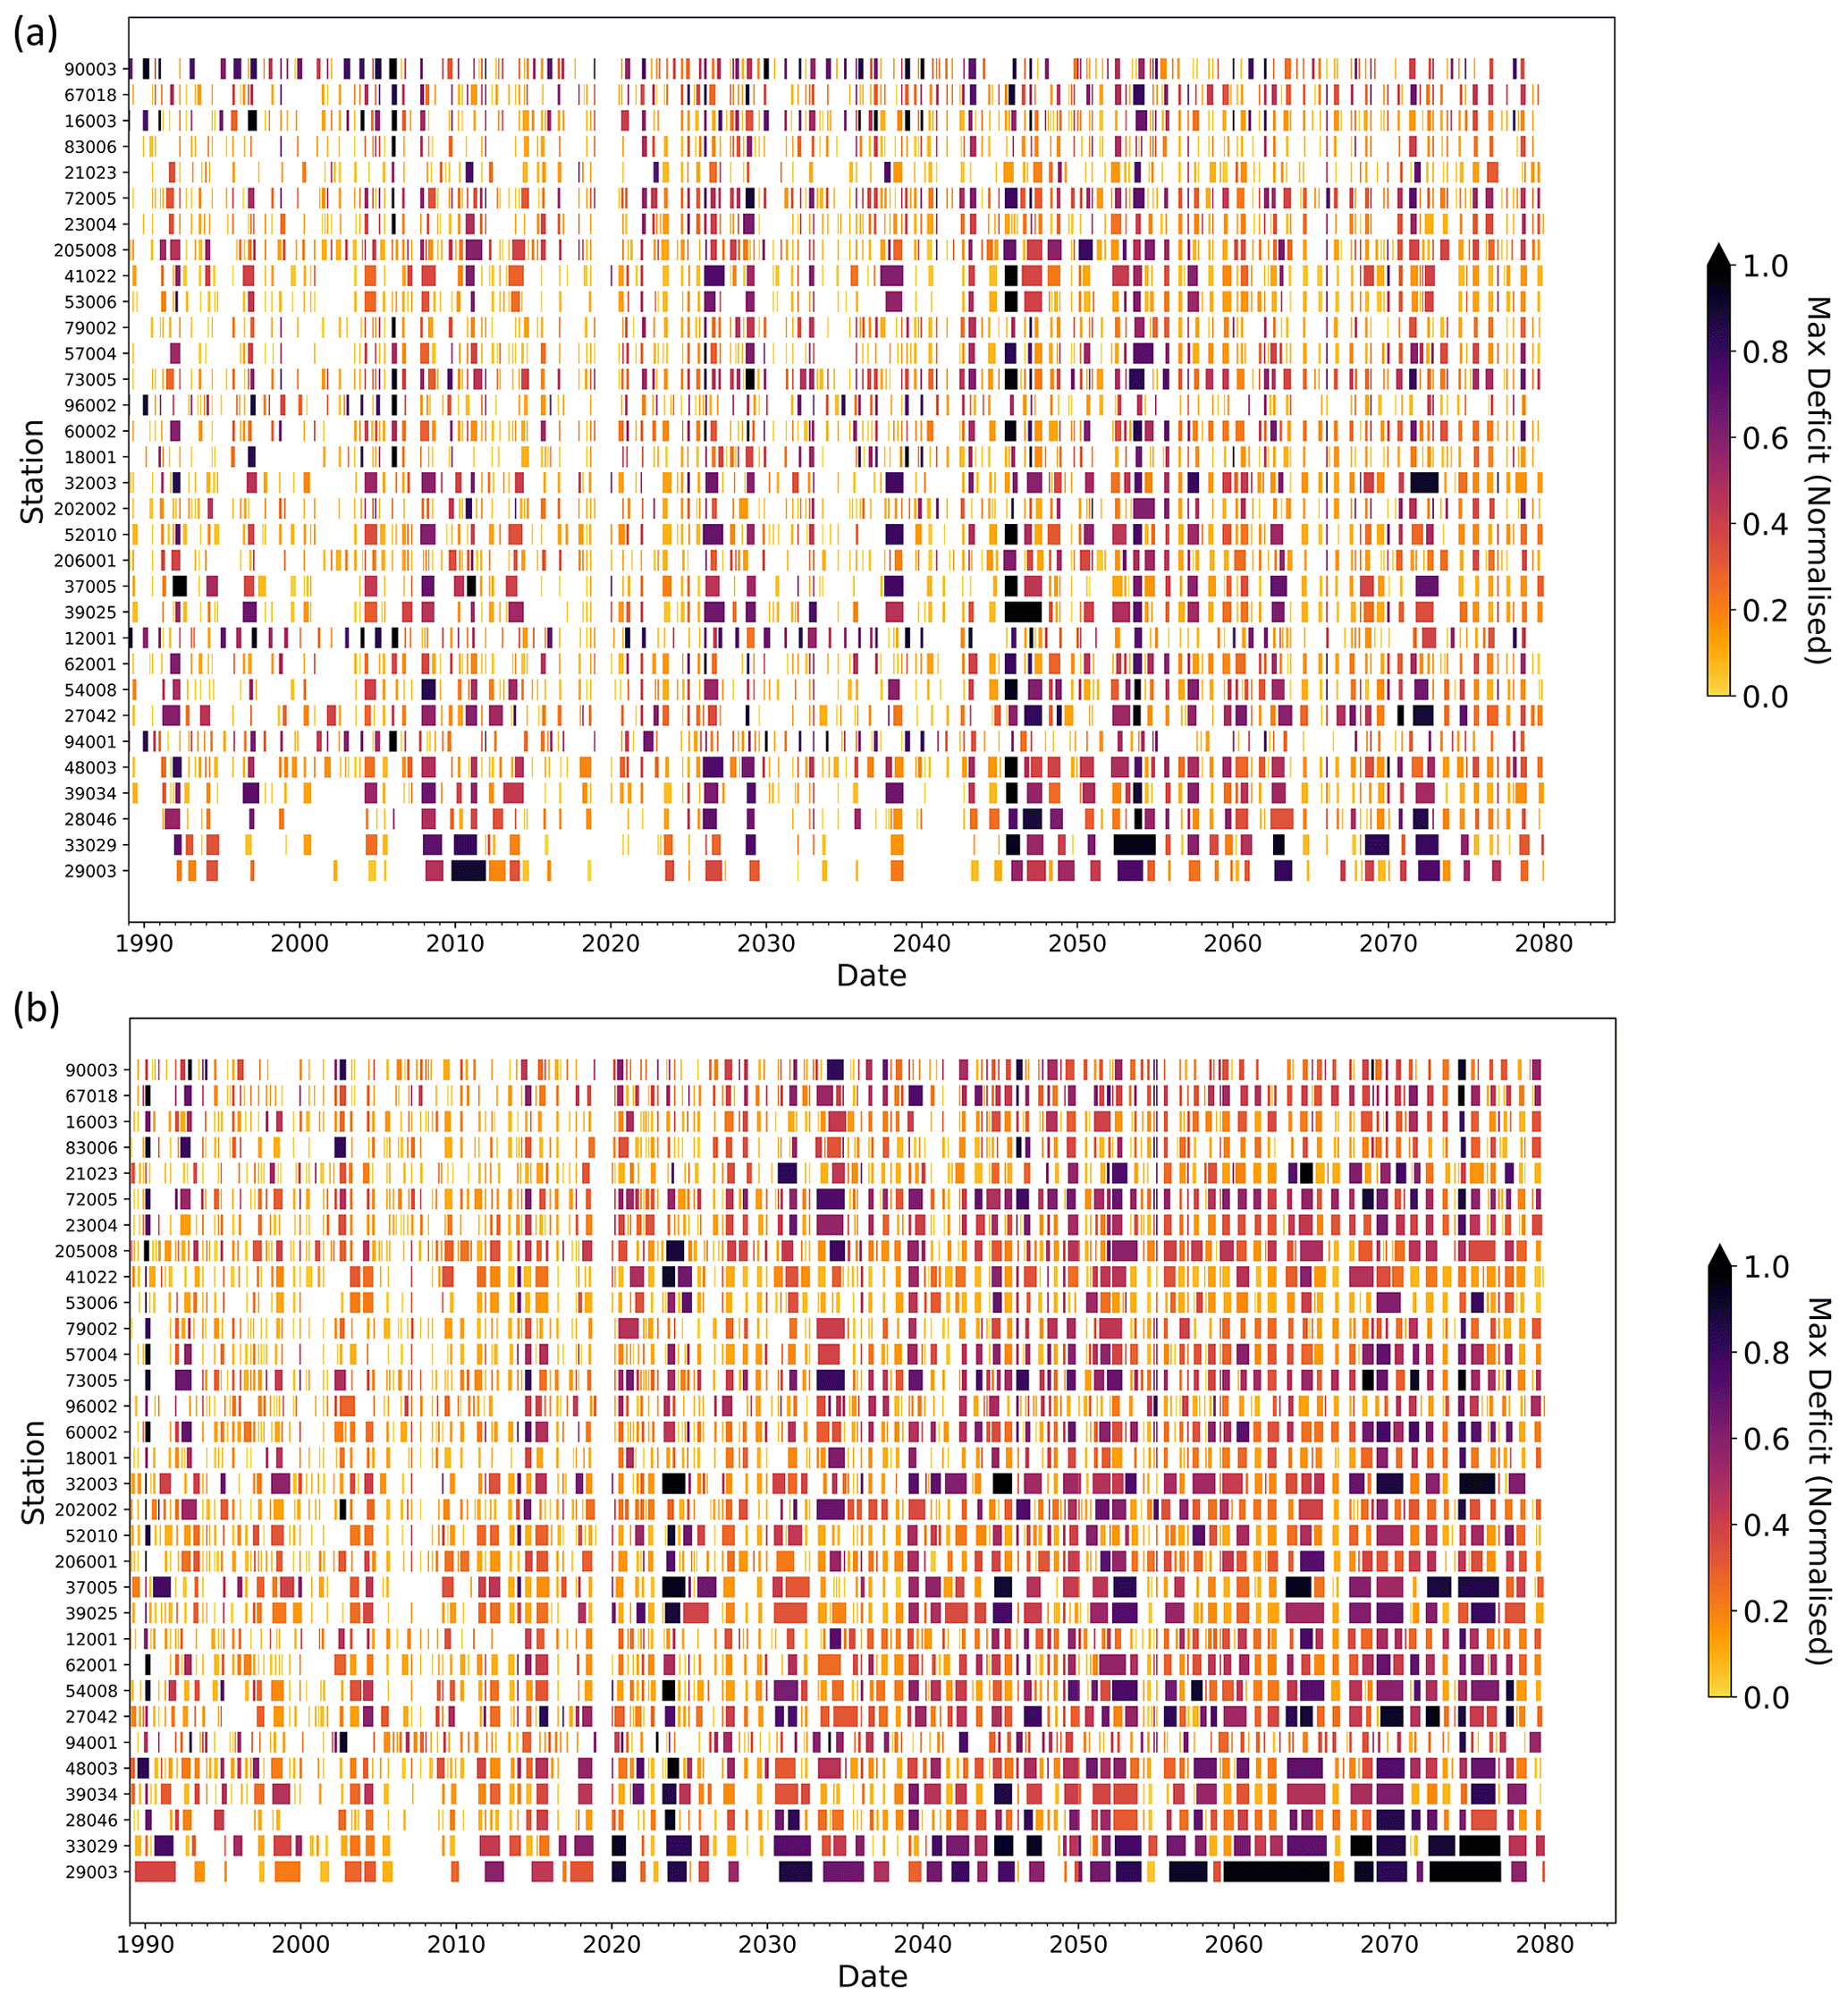
Figure 5Plots showing drought occurrence in the eFLaG projections for one hydrological model (PDM) and two RCMs: RCM7 (a) and RCM13 (b). The rows correspond to individual stations (numbers according to Fig. 1), arranged from low BFI to high BFI, as comparable with Fig. 4. Each drought is shown as a shaded bar, so drought duration is shown by the length of each bar, and the colour corresponds to the intensity (maximum deficit) according to the legend. Normalisation for maximum deficit was carried out to yield values for each catchment between 0 and 1 (min–max scaling) to help show where the deficit is greatest for each catchment.
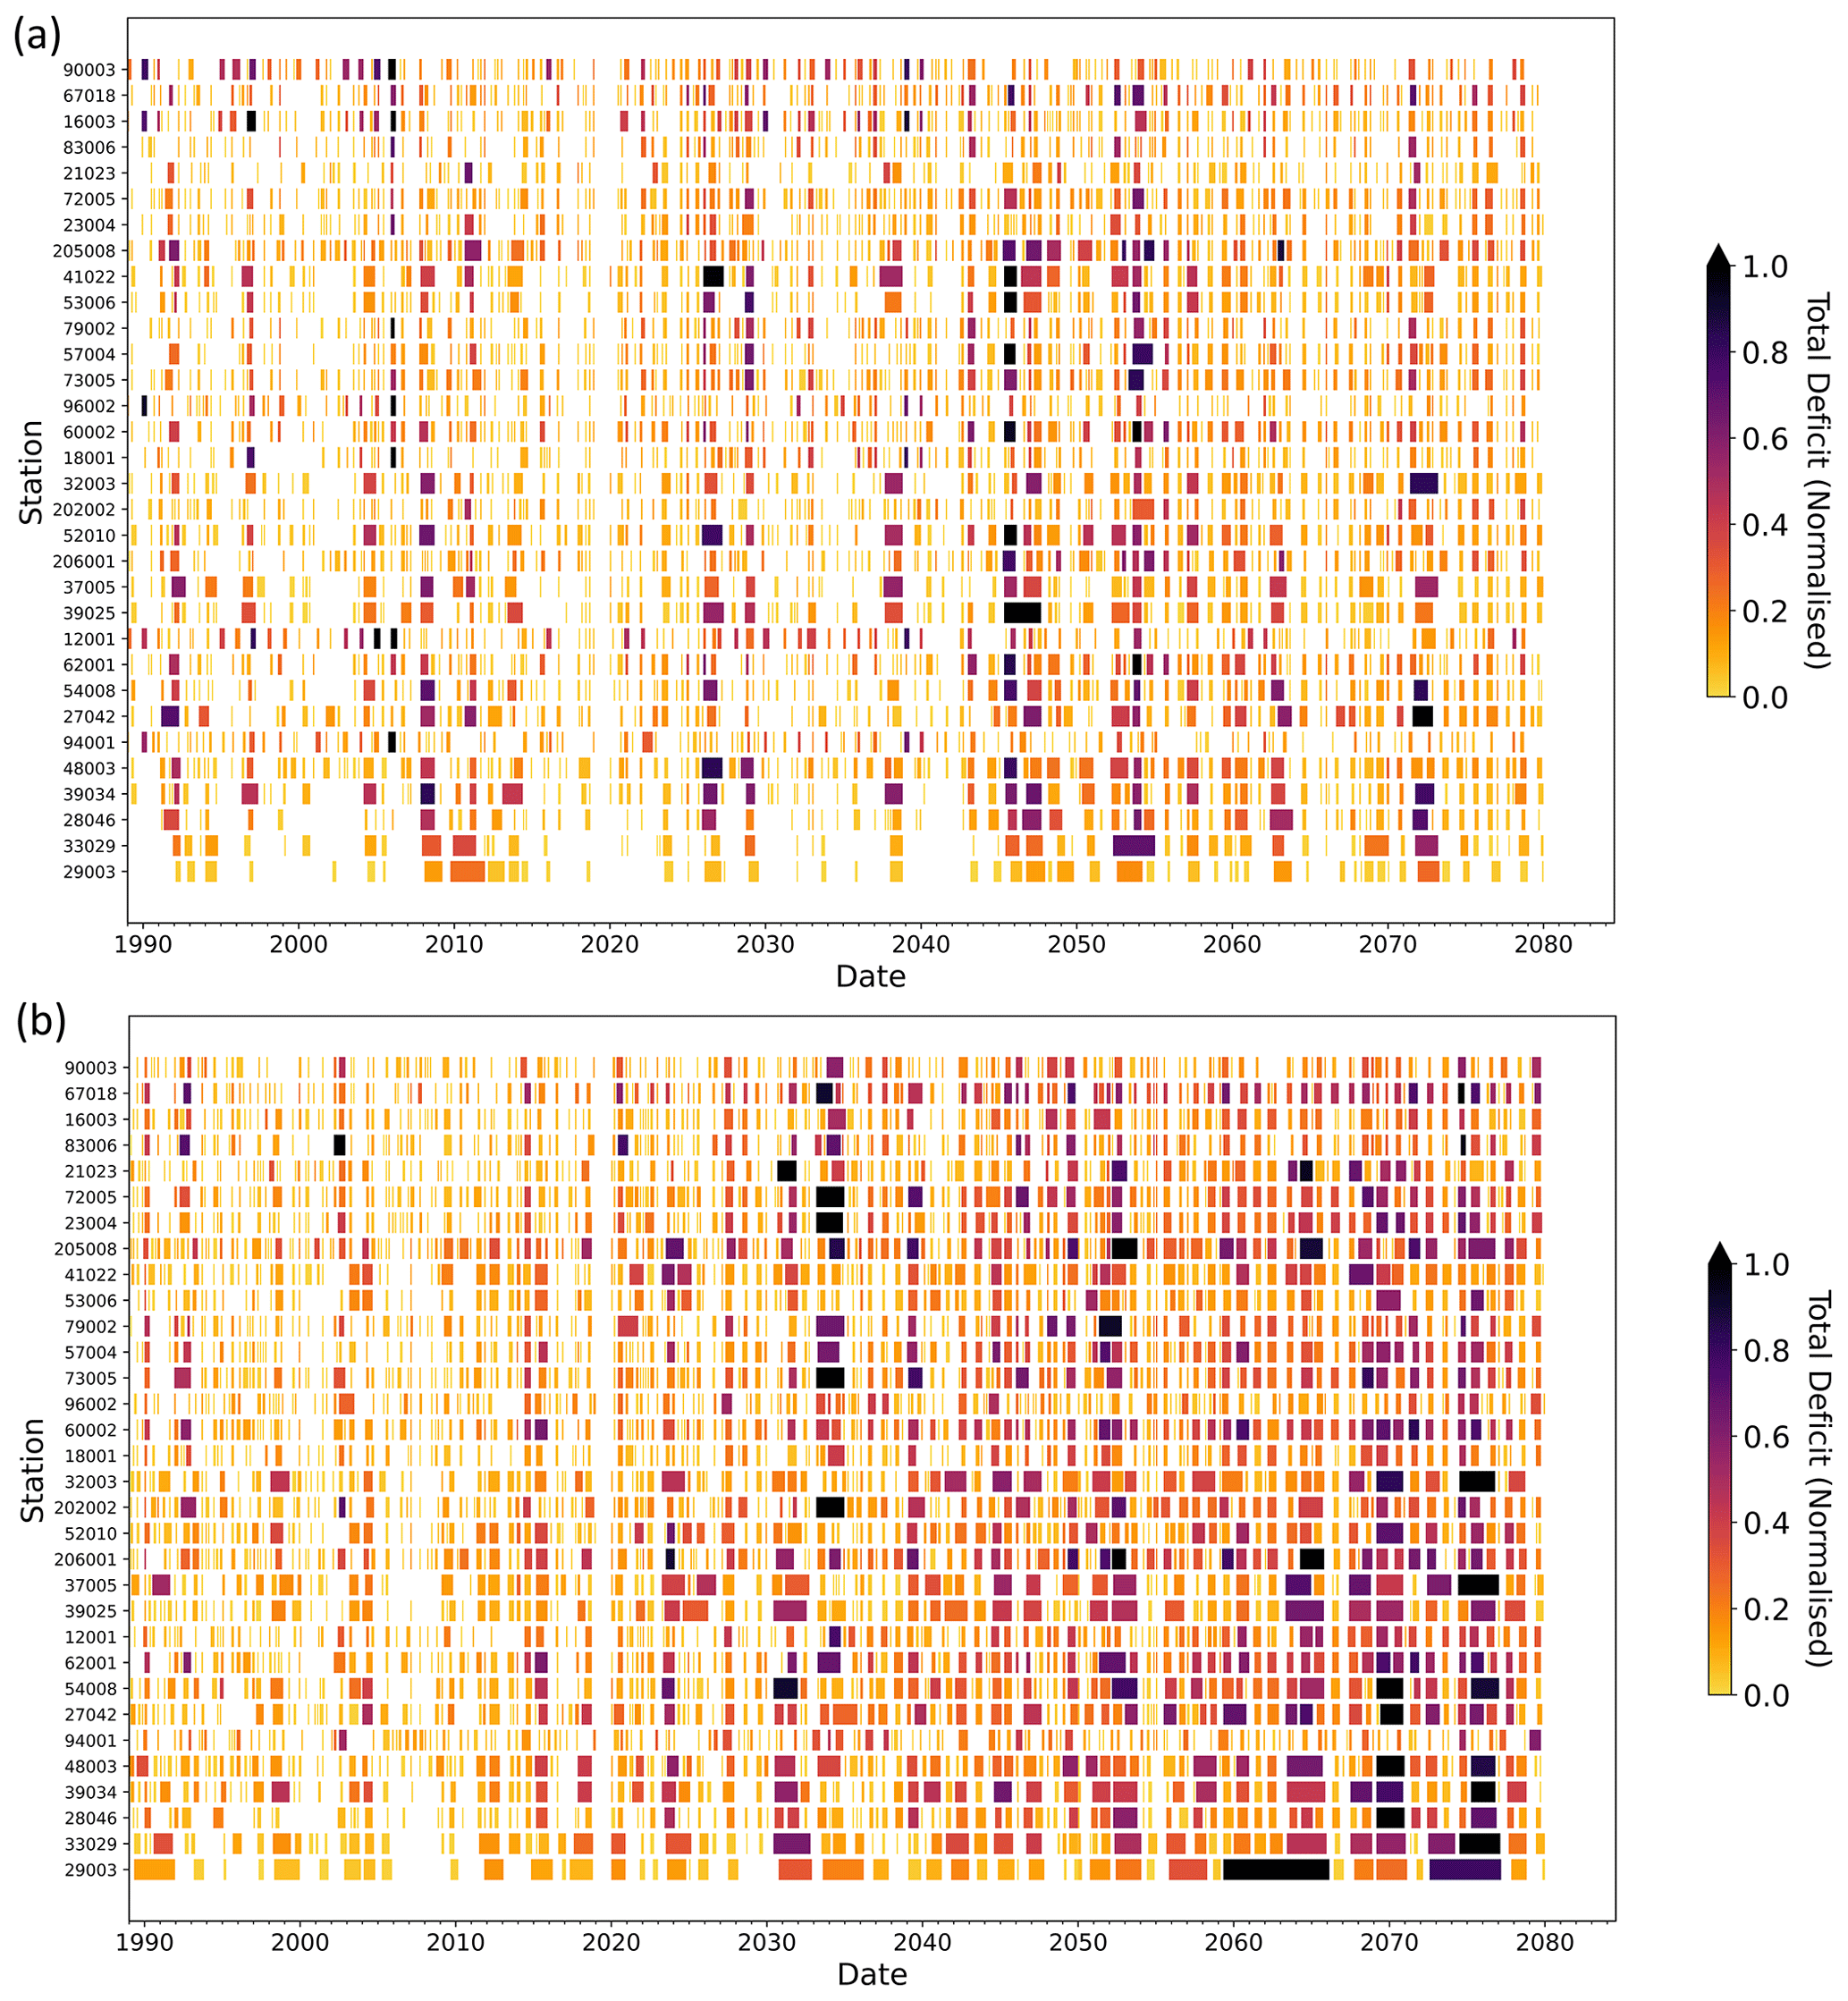
Figure 6Plots showing drought occurrence in the eFLaG projections for one hydrological model (PDM) and two RCMs: RCM7 (a) and RCM13 (b). The rows correspond to individual stations (numbers according to Fig. 1), arranged from low BFI to high BFI, as comparable with Fig. 4. Each drought is shown as a shaded bar, so drought duration is shown by the length of each bar, and the colour corresponds to the severity (total deficit) according to the legend. Normalisation for maximum deficit was carried out to yield values for each catchment between 0 and 1 (min–max scaling) to help show where the deficit is greatest for each catchment.
3.2.2 Groundwater levels
For groundwater levels, there is a range of drought trajectories across the boreholes and different drought metrics (Fig. 7). For the six most responsive boreholes (qmax between 1–3 months, far left of Fig. 7), the duration, intensity and severity all show increases in the near and far future relative to the baseline period. However, for some of the other boreholes the direction of change is more non-linear. The median drought duration increases for 30 of the 51 boreholes in the near future relative to the baseline period but for only 16 boreholes in the far future. Similarly, 39 of the boreholes show increases in severity in the near future relative to the baseline period, but only 24 show increases in the far future. For the intensity, approximately 85 % of the boreholes show increases for the near future and the same proportion (although not necessarily the same boreholes) for the far future.
There seems to be some relation between the changes in the drought duration and severity over time, both in terms of the magnitude and the direction of change. The largest changes are typically associated with the less responsive (high qmax) boreholes. For example, the five most responsive catchments (qmax= 1–2) show changes in near-future duration of between 0–2 months and near-future severity of between 0.6–2.3, relative to the baseline period. For the five least responsive catchments (qmax= 11–17), the change in near-future durations ranges between 1–5 months, and the change in near-future severity ranges between 1.9–8.8, relative to the baseline period. This relationship does not appear to hold for the intensity.
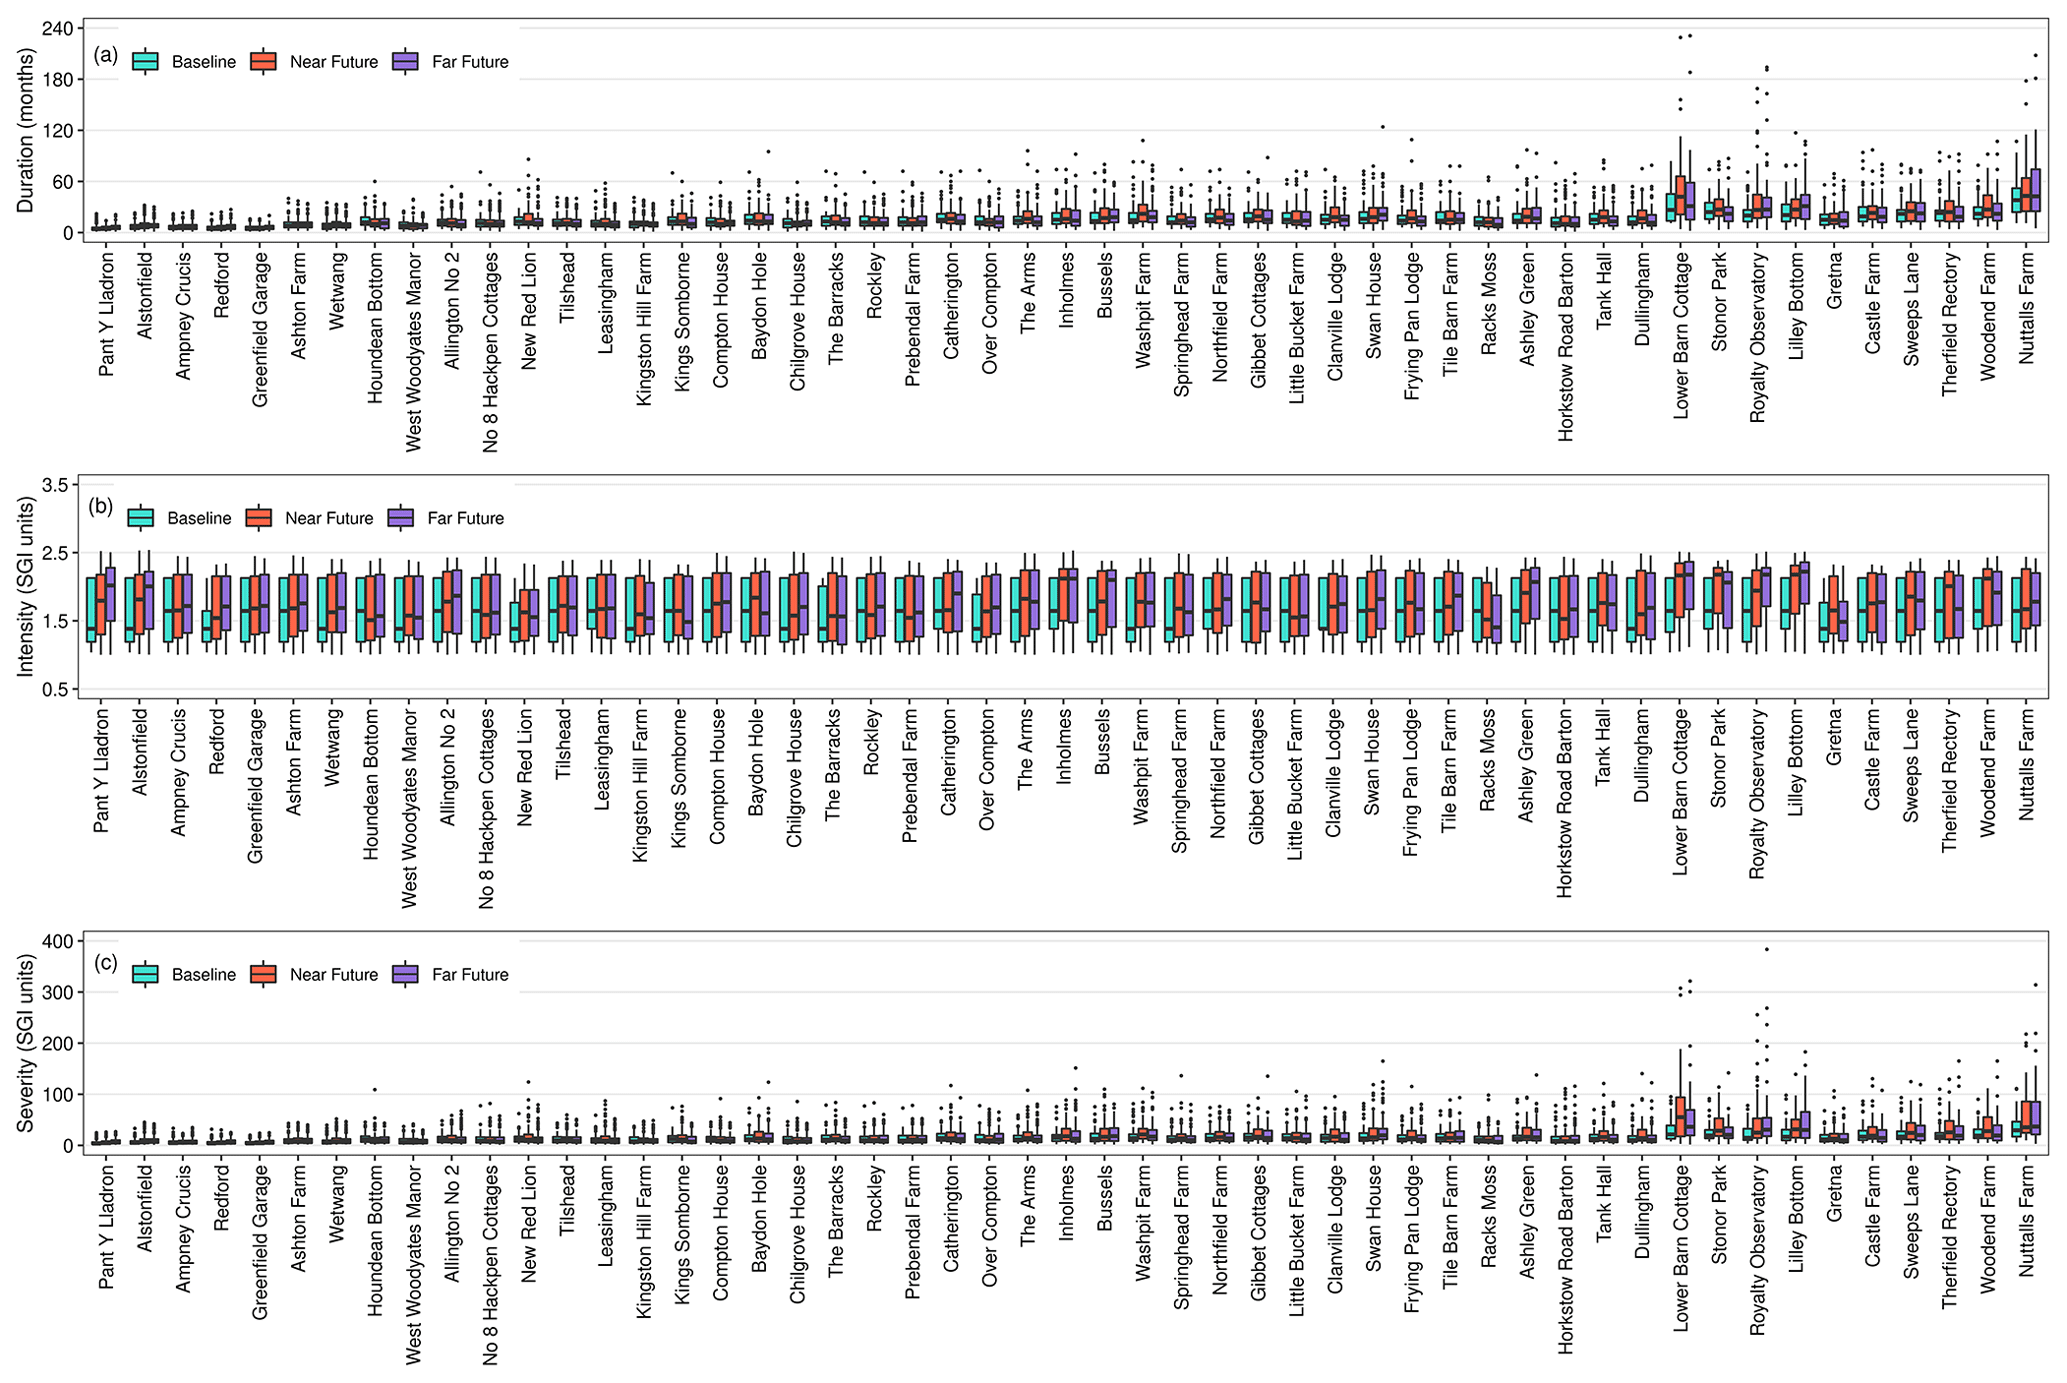
Figure 7Drought event characteristics in simrcm for 51 boreholes. Box plots contain all drought events in the baseline (1989–2018), near-future (2020–2049) and far-future (2050–2079) time slices across all 12 simrcm runs. Results for three drought characteristics are presented: (a) duration, (b) intensity and (c) severity. The 51 boreholes along the x axis are ordered from most responsive (left) to least responsive (right). Note that the scales of the y axes of (a) and (c) are logarithmic.
3.3 Future projections of low river flows and groundwater levels
3.3.1 River flows
Low river flows (as represented by the Q90 metric) are projected to decrease in future in almost all UK catchments (Fig. 8). Percentage change in Q90 allows intercomparison of catchments across hydroclimatic and hydrogeological gradients. Over the near-future time frame (2020–2049), low river flows in catchments across the vast majority of the UK (84 %–98 % of catchments, depending on model) are projected to decrease by at least 10 % from the baseline Q90 (1989–2018; Fig. 8a, c, e, g, i). For this near-future time frame, there is a particularly strong signal for decreases in Q90 across England and Wales, with catchments in the south-east exhibiting the most substantial changes. Numerous (26) catchments in central, southern and eastern England modelled by GR4J exhibit decreases of 40 %–60 %, a magnitude of decrease which is consistent across all models for a cluster of catchments north of London. Of the four hydrological models, projected decreases are larger for GR4J and G2G (typically > 20 %) than for GR6J and PDM (typically > 10 %). Near-future flow decreases of < 10 % are generally confined to catchments in Scotland across all models, with some localised examples elsewhere for GR6J and PDM. Only one catchment in north-west Scotland is projected to experience increased Q90 in the near future and even then only simulated by two of the four models.
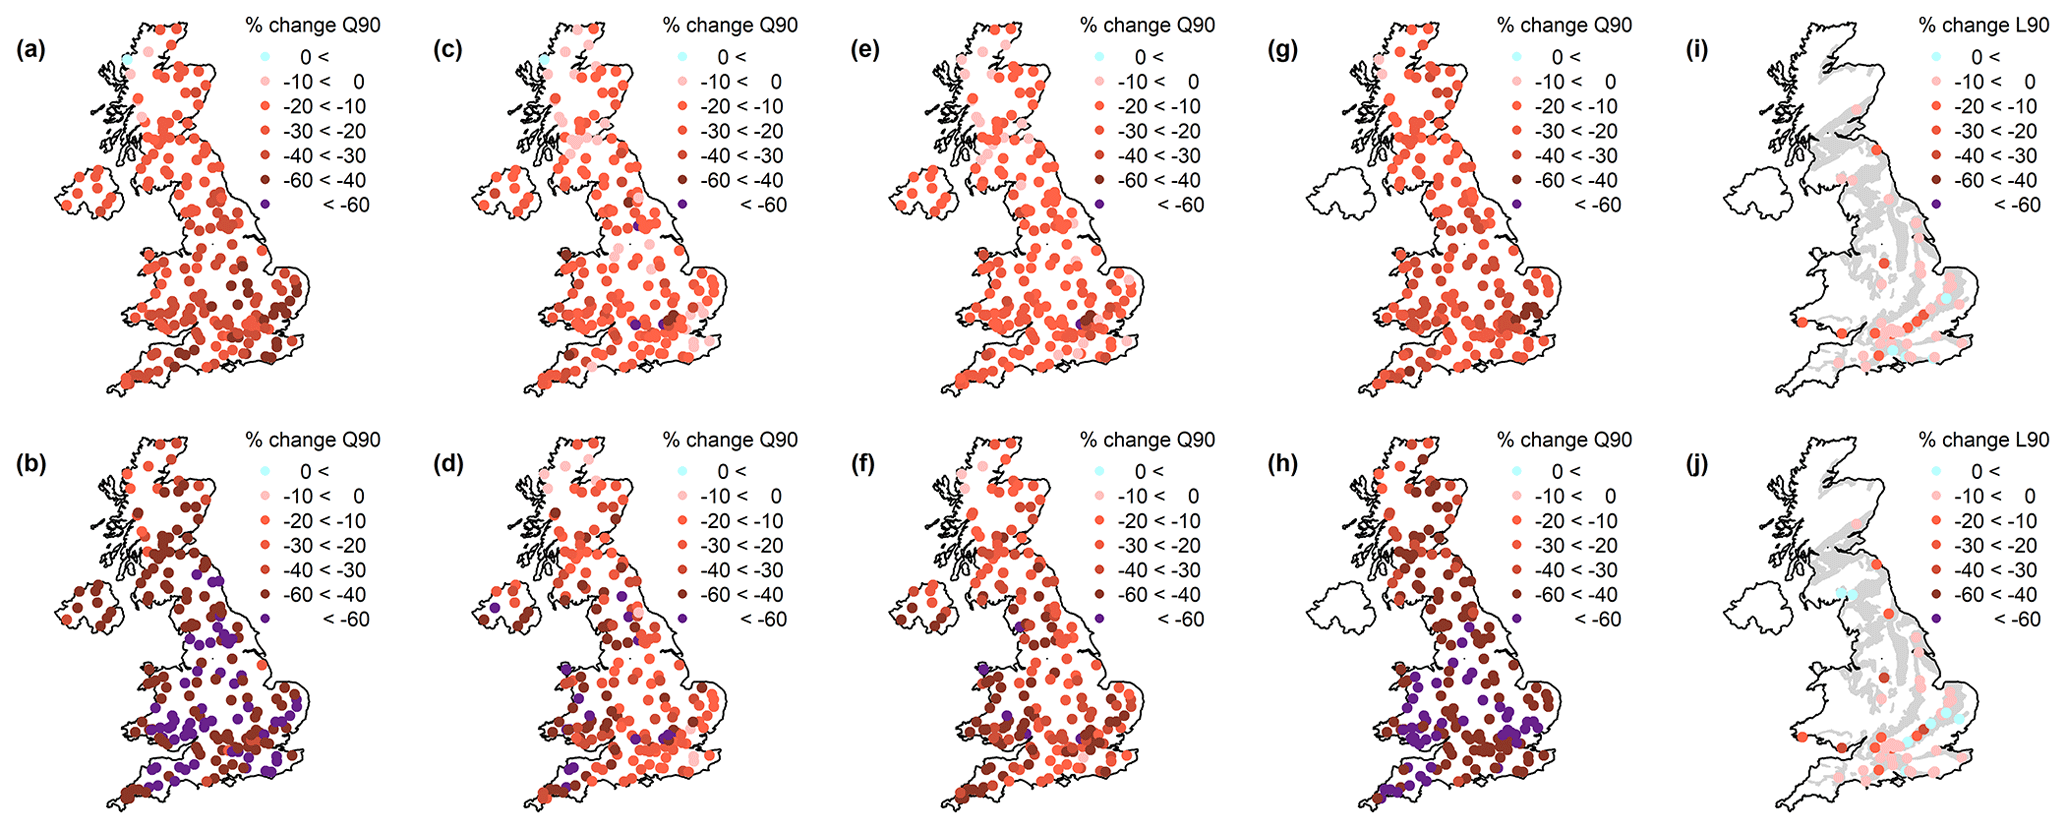
Figure 8Percent change in simrcm median Q90 river flows and L90 groundwater levels in the near future (2020–2049; a, c, e, g, i) and far future (2050–2079; b, d, f, h, j), expressed relative to the baseline (1989–2018) Q90 or L90, for each of the hydrological and hydrogeological models: (a–b) GR4J, (c–d) GR6J, (e–f) PDM, (g–h) G2G and (i–j) AquiMod.
In the far future (2050–2079), low river flows are projected to decline by even more extreme magnitudes (Fig. 8b, d, f, h, j). For GR6J and PDM, it is suggested that low flows will decrease by at least 30 % in most catchments of the UK (away from north-west Scotland), and catchments across Wales and parts of Northern Ireland, northern England and southern England are projected to decrease by at least 40 % from the baseline Q90. For GR4J and G2G, the prospects for far future Q90 are even more noteworthy: decreases are projected to exceed 40 % in the vast majority of UK catchments, with many catchments (58 for GR4J, 30 %; 46 for G2G, 23 %) in England and Wales exhibiting decreases of at least 60 %.
The time slice projections described above provide a snapshot of future low river flows that are consistently in decline throughout the 21st century, illustrated by transient low flows for a subset of catchments (Fig. 9). Whilst the magnitude of change is different between catchments and between hydrological models within catchments, the direction of change is unequivocal. Broadly linear decreases in low flows are projected by all hydrological models in all catchments, with no suggestion that interdecadal variability will influence these patterns. This pattern is also consistent across the climate model ensemble median, maximum and minimum scenarios, suggesting a robustness of declining low flows to uncertainty in the climate model. Gradients of transient low-flow declines tend to be flattest for catchments in north-west Scotland (e.g. 90 003, 94 001, 96 002). Declines in transient low flows are often steepest for G2G than the other three hydrological models, and this difference is most apparent in some more artificially influenced catchments in southern and eastern England (e.g. 33 029, 37 005, 39 034). Conversely, there is strong consistency between the four hydrological models in some more natural catchments of northern and western Britain (e.g. 16 003, 60 002, 79 002).
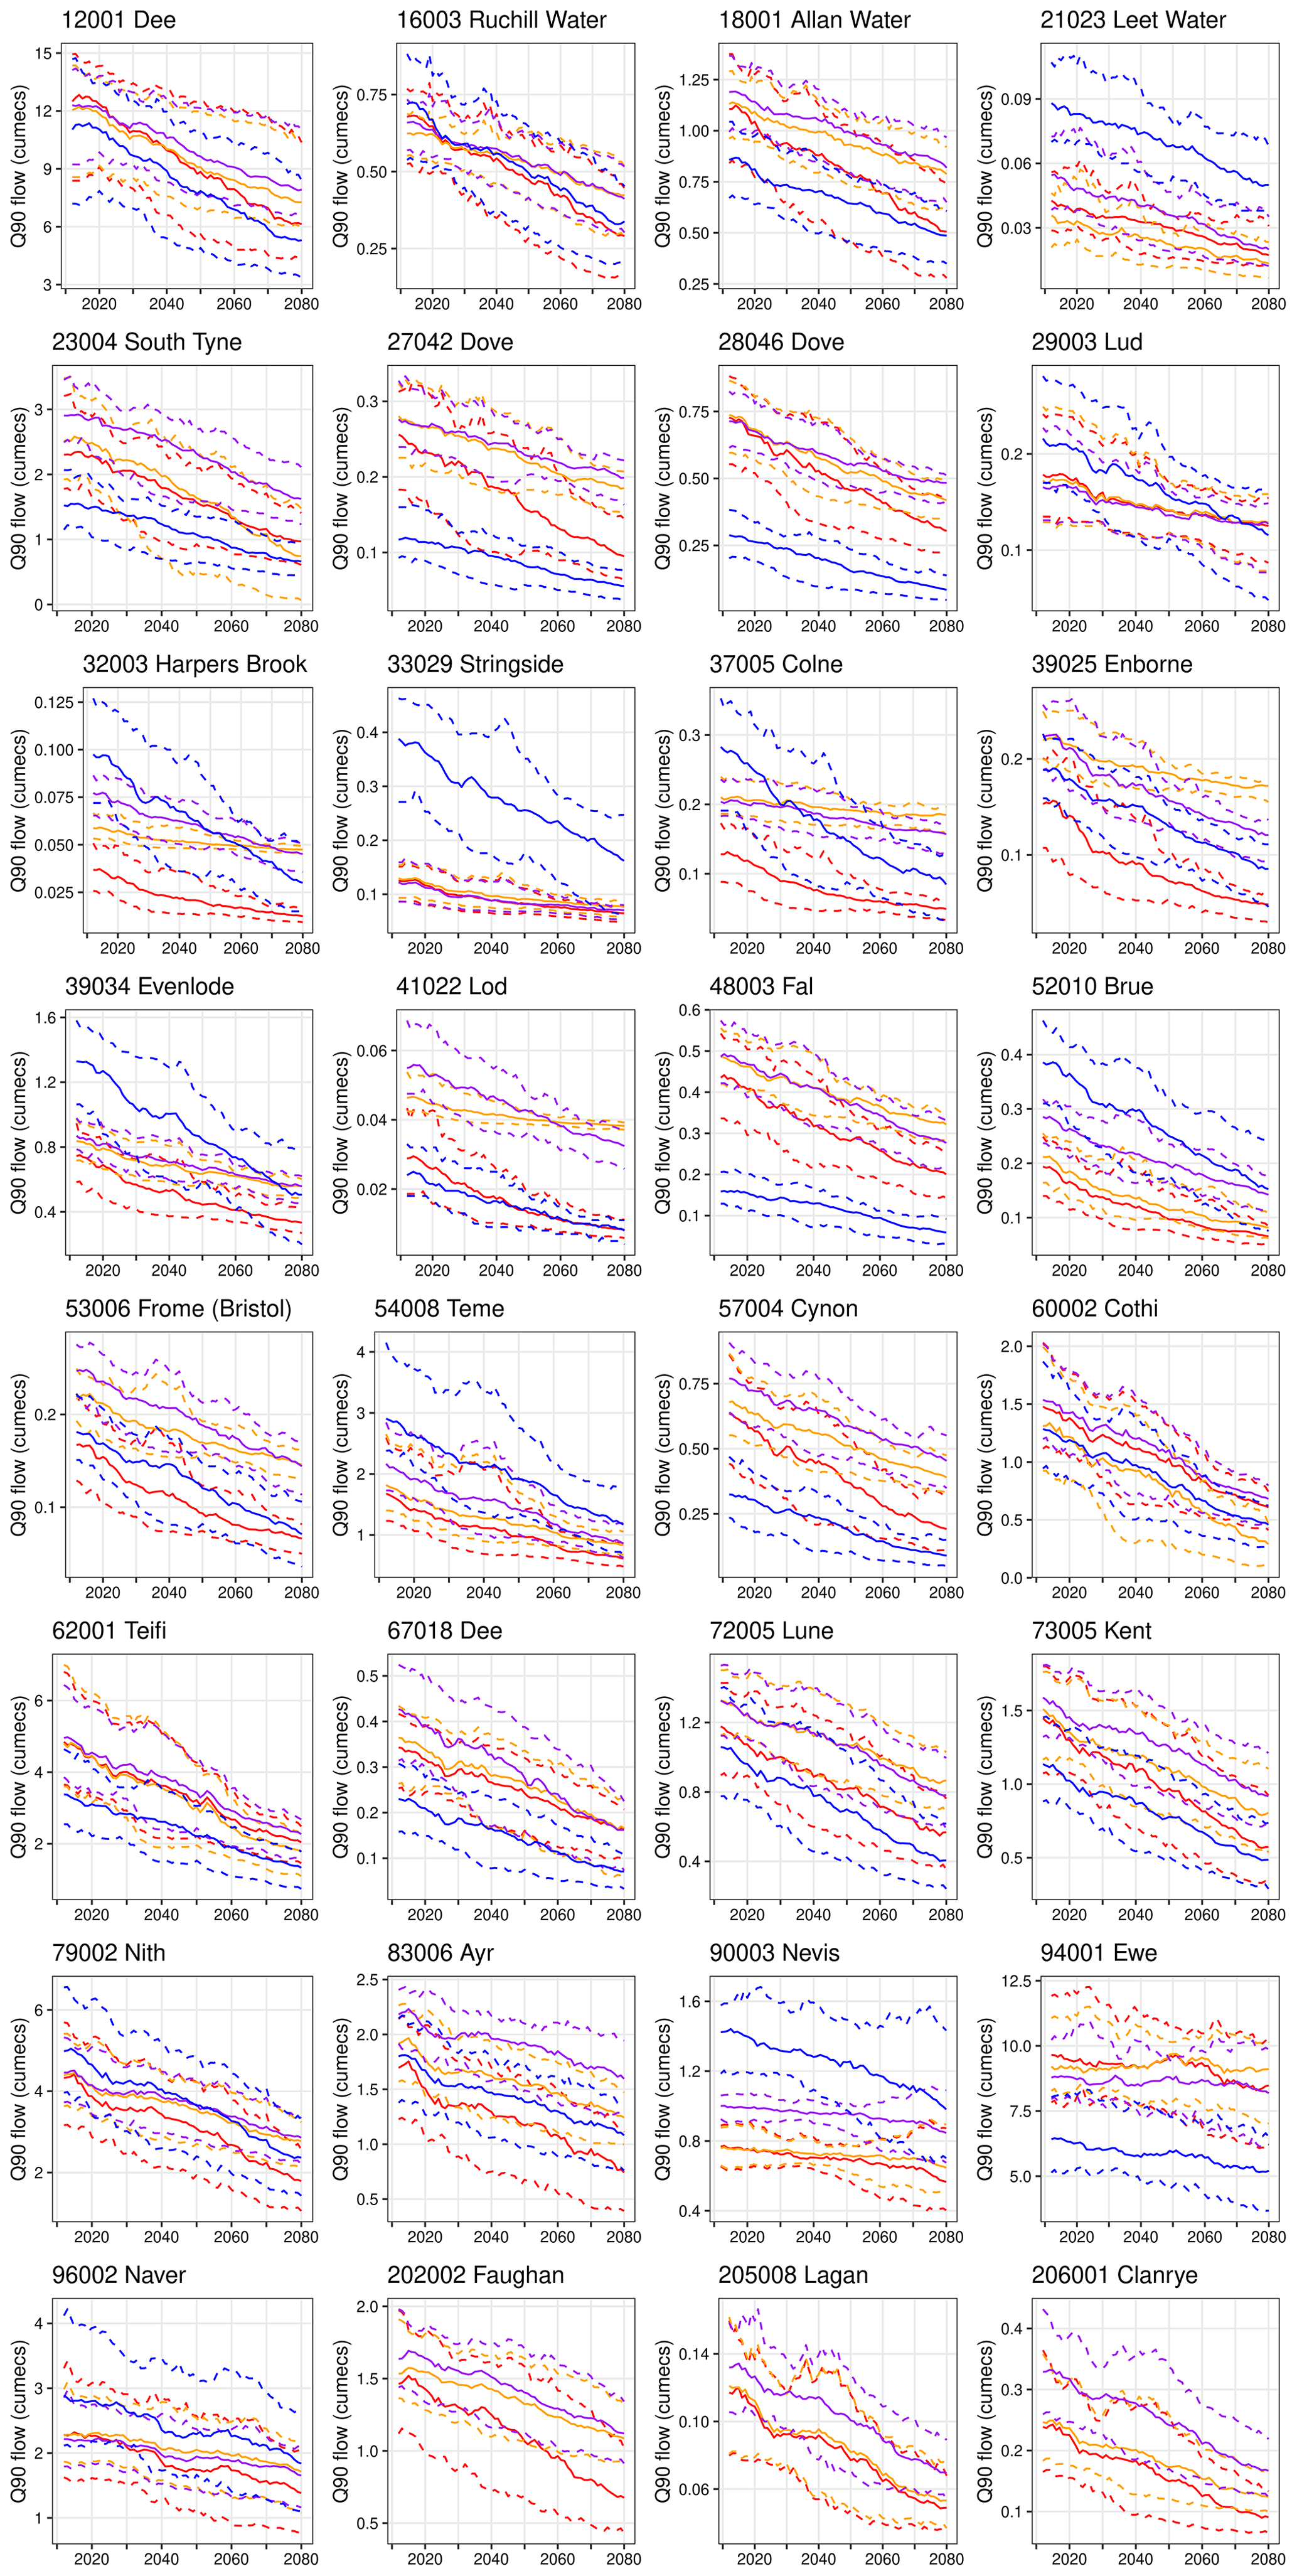
Figure 9The 90 % exceedance flow (Q90; cumecs) over transient 30-year time slices in simrcm data, 1983–2080. Q90 calculated over 1983–2012 is plotted in 2012, over 1984–2013 in 2013, and so on. Ensemble median and maxima or minima calculated over the simrcm ensemble are indicated by solid and dashed lines, respectively. Results for the four different hydrological models are indicated by colour-coding (GR4J in red; GR6J in orange; PDM in purple; G2G in blue) and are presented for 32 catchments. Note that G2G is not plotted for the three catchments in Northern Ireland (202 002, 205 008, 206 001) because Northern Ireland is not modelled by G2G.
Although varying in magnitude of change, future projections of Q90 are consistent nationally in terms of direction of change (i.e. decreasing into the future). For higher flow percentiles, distinct geographical patterns emerge. Future changes in Q70 in the near future and far future are comparable to those for Q90 (particularly across England and Wales; Fig. S5), although the majority of western Scotland is projected to exhibit negligible change (less than ±10 %). This pattern of negligible change across an increasingly large swathe of the north-west continues at Q50 (Fig. S6) and Q30 (Fig. S7); at Q30, most catchments exhibit negligible change in the near future, and in the far future all catchments in the north-west are characterised by increases. This contrasts markedly with catchments in the south-east which are projected to experience decreases in flows at all quantiles, though typical percentage changes in the far future reduce in magnitude from less than −40 % (Q70; Fig. S5) to less than −20 % (Q50; Fig. S6) to less than −10 % (Q30; Fig. S7).
Transient Q70 river flows (Fig. S8) resemble those of Q90 (Fig. 9), with linear decreases throughout the 21st century for all catchments (away from western Scotland, e.g. 90 003, 94 001, 96 002). However, transient flows for Q50 (Fig. S9) and especially Q30 (Fig. S10) highlight the same contrast in future projections highlighted above. Negligible change characterises an increasing number of catchments around the UK from Q70 to Q50 to Q30, and changes are increasingly less linear towards higher flows, with step changes and interdecadal variability apparent (e.g. 18 001, 72 005 in Fig. S10). At Q30, many (47 %–64 % depending on model) catchments exhibit negligible change (< 10 %) over the 2012–2080 time frame overall (Fig. S10), though this masks considerable temporal variability. Rather than simple linear changes, a number of catchments (27 %–30 % depending on model) in northern and western areas are characterised by decreasing Q30 values until the 2050s before increasing Q30 values thereafter (e.g. 16 003, 18 001, 67 018, 72 005, 73 005, 79 002 in Fig. S10). In contrast, linear decreases in Q30 are projected in many (52 %–65 %) catchments, predominantly in the south and east (e.g. 27 042, 29 003, 32 003, 33 029, 37 005, 39 025, 39 034, 52 010 in Fig. S10), a consistent pattern exhibited across all flow quantiles. Regardless of geographic location, whilst RCM ensemble median lines for the four hydrological models generally maintain a similar range, RCM ensemble maxima and minima are increasingly divergent towards 2080, particularly in catchments in the north and west (e.g. 67 018, 72 005, 94 001, 96 002 in Fig. S9; 48 003, 57 004, 72 005, 73 005, 96 002, 202 002 in Fig. S10).
3.3.2 Groundwater levels
Low groundwater levels (as represented by the L90 metric) are projected to decrease in future in 47 of the 51 boreholes in the near future and 43 boreholes in the far future (Fig. 8i). The near-future L90 is projected to decrease by more than 10 % for 11 of the boreholes relative to the baseline period. These include boreholes in the Devonian and Carboniferous limestones and Permo-Triassic sandstones in Scotland as well as a large number of boreholes in the Jurassic limestones and Chalk of north-east and southern England. Two of the boreholes show percentage changes of more than 20 %. The four boreholes that show increases in L90 in the near future are all situated in the Chalk in the south of England.
The far-future L90 is projected to decrease by more than 10 % for 11 of the boreholes relative to the baseline period (Fig. 8j). These include one borehole in the Devonian and Carboniferous limestones in Scotland as well as a large number of boreholes in the Jurassic limestones and Chalk of north-east and southern England, respectively. Four of the boreholes show percentage changes of more than 20 %, whilst three boreholes show changes of more than 30 %. The eight boreholes that show increases in L90 in the far future are situated in the Chalk in the south of England and in the Permo-Triassic sandstones of southern Scotland.
The transient low groundwater level projections (Fig. 10) show a range of behaviours across the boreholes (see Figs. S11–14 for all transient plots). The median projections across the majority of boreholes, including at Alstonfield and Baydon Hole (Fig. 8), show a decrease in L90 over time. Some boreholes exhibit a relatively stationary trajectory of L90 over time such as at Racks Moss and Gibbet Cottages (Fig. 10). Others, such as Houndean Bottom and Tank Hall (Fig. 10), show pronounced increases in L90 during the early to mid 21st century, which then subside thereafter. A number of boreholes show a distinct flattening or inflection of the decreasing L90 over time by the end of the 21st century including at Therfield Rectory and Racks Moss (Fig. 10). For all boreholes, the median trajectory in L90 is less smooth than Q90 for river flows, often showing distinct peaks and troughs with time. While there are some intermittent spells where L90 increases, no boreholes show a consistent increase in L90 over the 21st century.
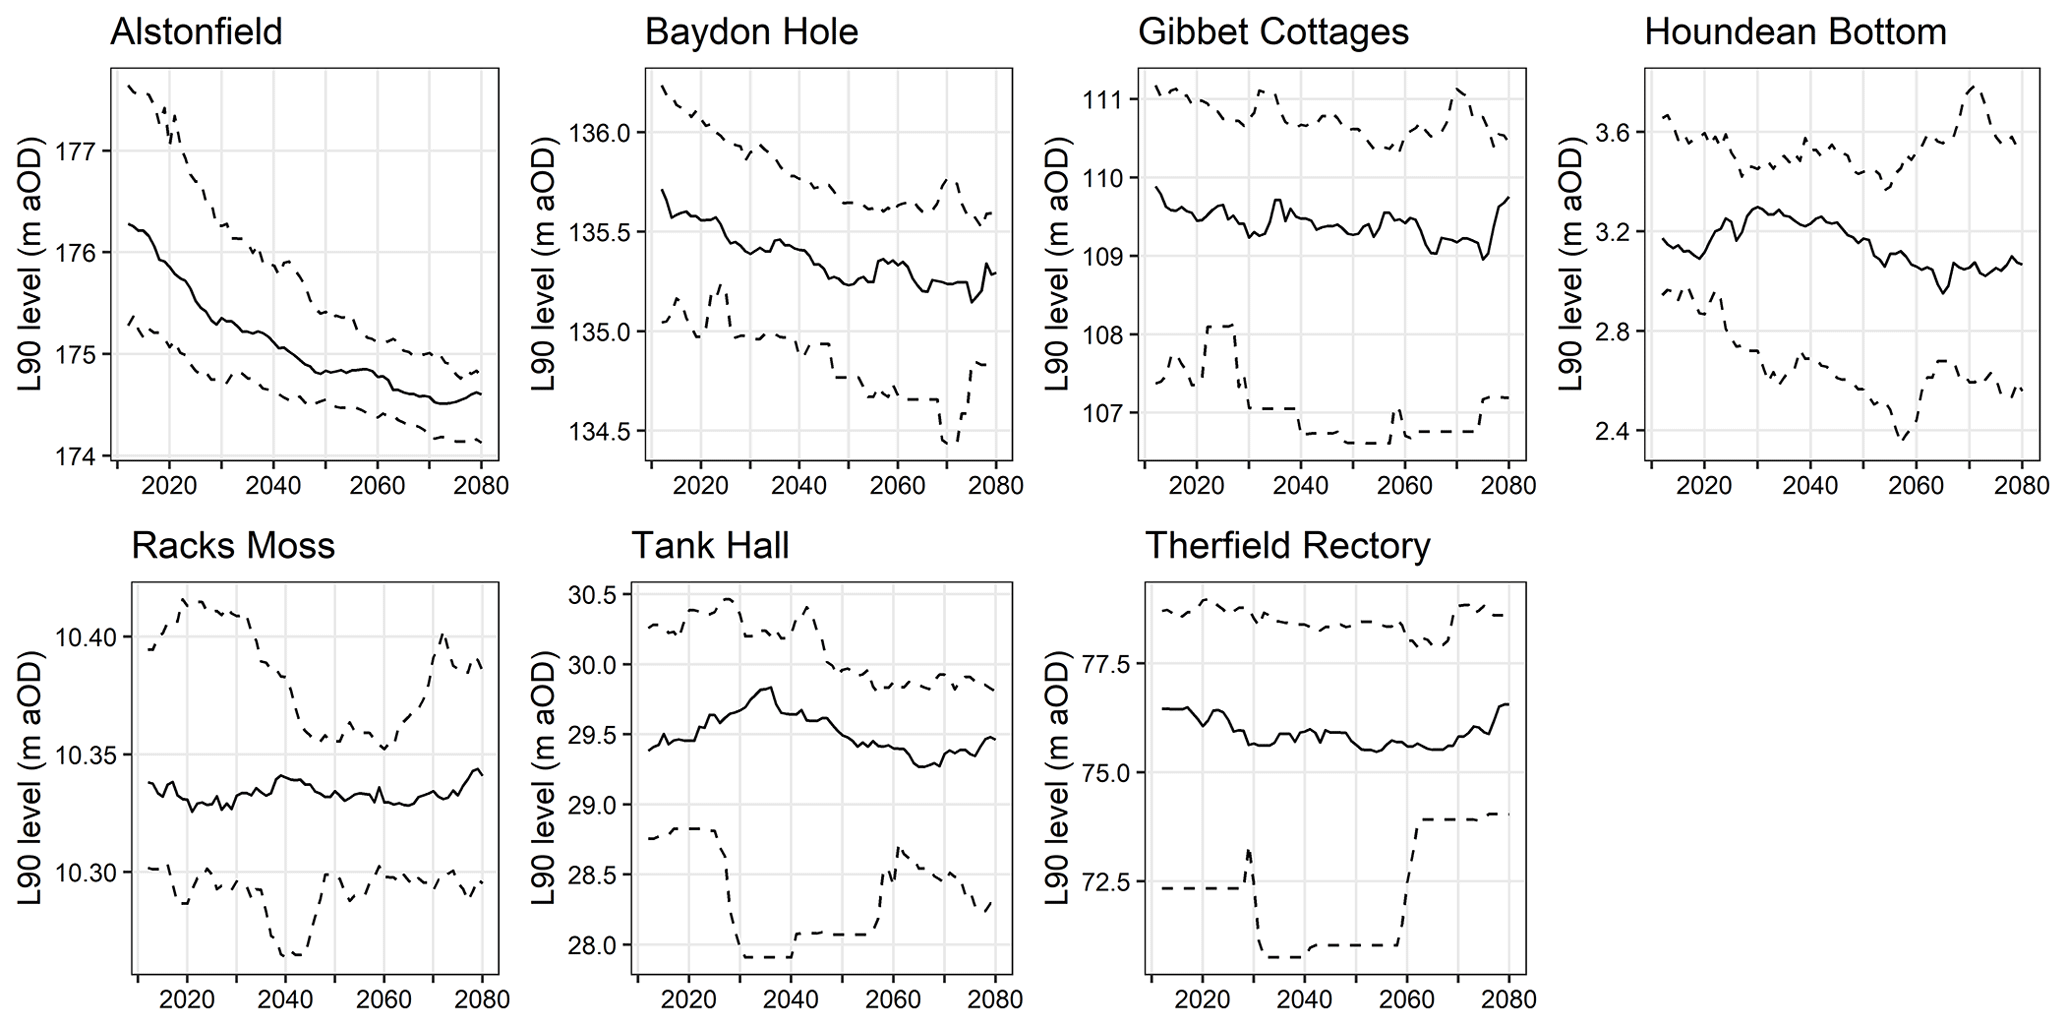
Figure 10The 90 % exceedance level (L90; mAOD – metres above ordnance datum) modelled by AquiMod over transient 30-year time slices in simrcm data, 1983–2080, for seven boreholes. L90 calculated over 1983–2012 is plotted in 2012, over 1984–2013 in 2013, and so on. Ensemble median and maxima or minima calculated over the simrcm ensemble are indicated by solid and dashed lines, respectively.
A comparison between the trajectory of L90 and the changes in drought characteristics over time shows that, in some cases, there is good correspondence between the direction of change of L90 and drought duration and severity. For example, the more responsive boreholes, such as Alstonfield, show an overall decrease in L90 over time which is consistent with the projected increase in drought duration and severity. However, others are less consistent. For example, median drought duration and severity peak in the near future (2020–2049) for at Tank Hall, which is contrary to the median L90 projections which are highest during this time frame.
The RCM-derived uncertainty around the median trajectory plots is typically large compared to the gradient of the median trajectory line. However, the relative uncertainty is smaller for more responsive boreholes such as Alstonfield (qmax= 2 months).
The maps and time series of other level percentiles are illustrated in Figs. S5–S7 and S11–S14. Transient L70 groundwater levels resemble those of L90. However, percentage changes in L50 and L30 are typically smaller in magnitude than those for L90. For the far future, 14 boreholes show an increase in L30 over time. These are situated in both south-west Scotland and south and south-west England and Wales. However, for those in southern England and south Wales, the increase is very small (up to 2 %). In the Scottish Borders, the change is more significant (3 %–5 %); however, the scarcity of boreholes in this area makes it difficult to draw any conclusions about regional variability in these different level percentiles.
4.1 Factors influencing divergent projections of future river and groundwater drought
Many of the findings identified here for the UK are consistent with future projections of drought and low river flows in international studies. Global analyses have found that declining low flows and increasing drought duration and severity are anticipated for substantial parts of the world (e.g. Wanders et al., 2015; Spinoni et al., 2021; Gu et al., 2023). Regional or global analyses of future projections of groundwater drought are relatively less common, although studies of future changes in terrestrial water storage that might be considered a proxy for combined surface and subsurface storage find similar increases in drought (Pokhrel et al., 2021). Nevertheless, as with most studies in the UK, analyses are frequently undertaken on ensembles of multiple RCM members but only a single hydrological model (e.g. Wanders et al., 2015; Cammalleri et al., 2020). Where there are exceptions that consider both climate and hydrological model uncertainty, the relative balance between these sources is found to vary between catchments and climate zones (Gu et al., 2023). To the authors' best knowledge, few studies have analysed river flows and groundwater levels in parallel using consistent approaches which enable comparison of future projections. Consequently, the authors are not aware of studies which have identified divergence in future drought prospects between surface and subsurface water resources. Discussion around divergence in projections of future drought tends to be limited to the likely increases or decreases in drought characteristics in different climate zones (e.g. in Europe; Cammalleri et al., 2020), consistent with historical variations attributed to climate change (e.g. Padron et al., 2020). Nevertheless, similar divergent projections as those identified here may emerge in other parts of the world with sufficient groundwater resources and seasonal cycles of potential evapotranspiration and/or precipitation.
Q90 flows in most UK catchments are projected to decrease through the 21st century, yielding corresponding increases in drought duration, intensity and severity. This finding is consistent with many previous studies on future projections in hydrometeorological drought in the UK (e.g. Rudd et al., 2019; Kay et al., 2021b; Chan et al., 2022). Projections of groundwater levels and groundwater drought showed more substantial variability across the study sites. Only approximately half of the boreholes indicate a steady decline in L90 levels, and a smaller number still show consistent increases in drought duration (16 of the 51) and severity (24 of the 51) for the far future. In fact, more boreholes show increases in drought duration and severity relative to the baseline period in near future than the far future, and for 26 (22) boreholes, the duration (severity) of droughts in the far future proves more moderate than over the baseline period. The reasons for this are undoubtedly complex. There is no simple geographical explanation for this response, such as the north-west–south-east divide, which is clearly evident in future projections of Q30 river flows (Fig. S7). However, there are several aspects that do provide some insight into the sources of this divergence between river flow and groundwater drought.
The first aspect to consider is the seasonality of climate change for the UK and how this is likely to influence the underlying hydrological processes that control river flows and groundwater levels. The UKCP18 climate change projections follow the long-established widely accepted “wetter winters and drier summers” headline for the UK. Of course, these are just “headlines” of the projections, and they span a wide range of uncertainty, but this headline captures the most salient aspects, with the largest increases in winter rainfall expected during the latter half of the 21st century under RCP8.5, contrasting with generally hotter, drier summers. For river flows, apart from some exceptions, catchments of the UK are primarily driven by hydrometeorology rather than groundwater levels. Whilst the lowest flows tend to occur in the summer half-year, for river flows these are generally determined by decreasing rainfall and increasing PET in the summer and to a lesser extent the spring. As such, projections of hotter, drier summers in the future (e.g. Fig. 9) are the controlling factor in declining low flows throughout the 21st century. In contrast, the period during which groundwater stores in the UK are replenished is typically constrained to a distinct recharge season in the colder months of the year when soil moisture deficits are low, and recharge pathways through the unsaturated zone are efficient. High soil moisture deficits and deeper water tables in the summer typically inhibit recharge. One can see, therefore, how wetter winters could serve to enhance annual recharge of aquifers while the impact of increased dryness in summer on annual recharge fluxes will be limited. This, of course, does not mean that groundwater drought severity should decrease universally across the UK. The picture is further complicated by regional variations in the hydrogeology, not least the responsiveness which has been shown to vary greatly between boreholes in this study and is correlated to controls on groundwater recharge efficiency like the unsaturated zone thickness. It is telling that for the six most responsive boreholes with a qmax between 1–3 months, the drought duration, intensity and severity all follow the river flow narrative, with increases in the near and far future relative to the baseline period. Local vegetation and soil characteristics are also likely to be important as these directly influence seasonal wetting and drying of soils. One must also consider local controls on groundwater discharge such as the presence of springs and rivers and the hydraulic properties (and heterogeneity) of the aquifer itself. These will all have bearing on the local groundwater level response to changes in driving climate.
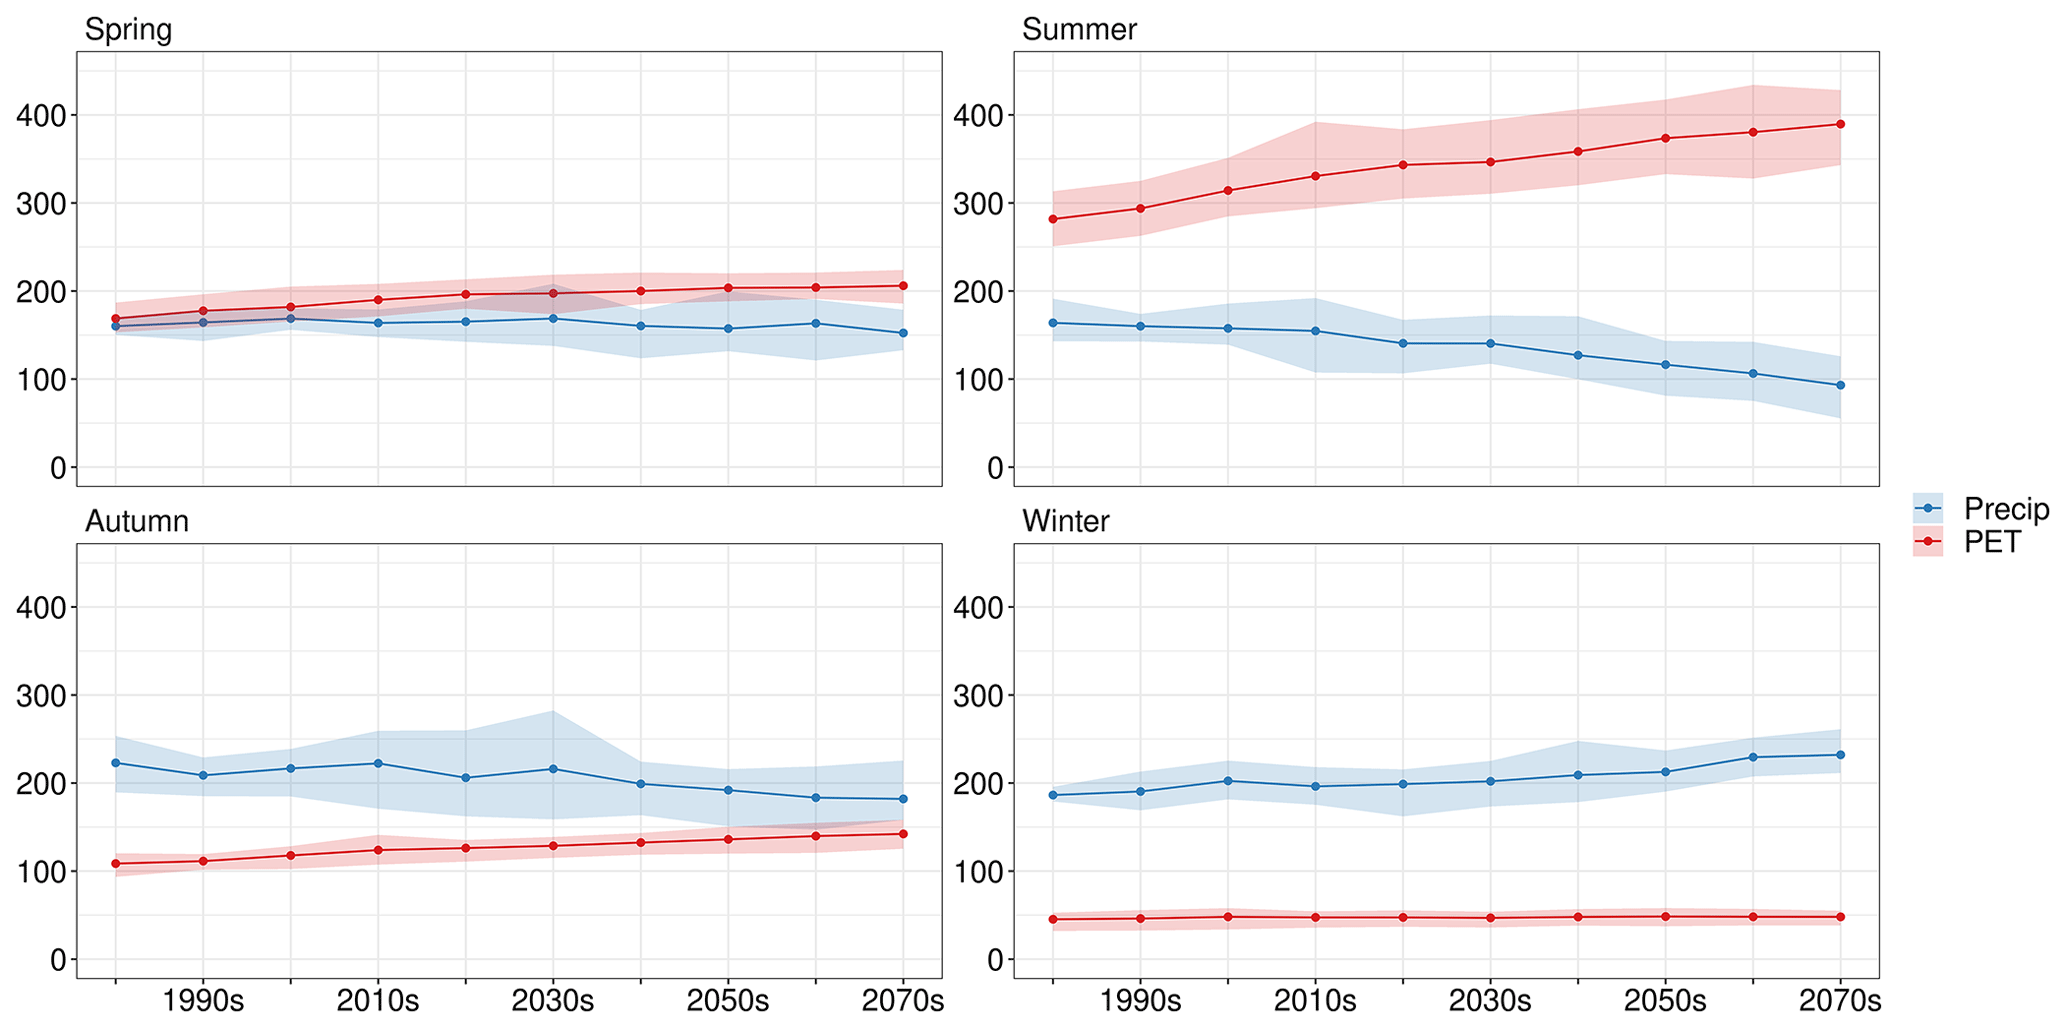
Figure 11Decadal mean seasonal precipitation (mm) and potential evapotranspiration (mm) from the regional UKCP18 projections for the Thames at Kingston catchment (NRFA number: 39 001). The line shows the ensemble mean across the 12 RCMs, with the range shown as shading.
One aspect that this study does not fully consider is the potential for higher evapotranspiration rates in the summer to deplete groundwater storage directly, especially where the water table is shallow or where the capillary fringe is thick. Bloomfield et al. (2019) attribute the apparent increase in drought severity in the absence of changes in rainfall observed at two boreholes in the Chalk. It is important to note that AquiMod does not explicitly represent any upward flux from the water table to atmosphere, and therefore, these projections do not account for this process.
There are also likely to be other drivers of the divergence. For example, it is reasonable to assume that the trajectory of groundwater drought will be sensitive to characteristics of rainfall at shorter timescales given the known influence of rain-day distribution on total recharge inputs. Any change in rain days and intensity, irrespective of changes in mean rainfall, is therefore likely to manifest in changes in recharge, and these aspects of future climate are likely to be spatially variable and uncertain. Understanding these impacts will require climate simulations at a higher resolution (e.g. Kay, 2022) that was beyond the scope of this research, but it remains an important avenue for future research.
4.2 Hydrological model uncertainty in future projections
This study includes four contrasting hydrological models to more rigorously capture the uncertainty introduced into projections of future drought by hydrological modelling. The consistency of the direction of change amongst hydrological models enhances the robustness of the conclusions that droughts are likely to be more prolonged and severe in future. Nevertheless, the magnitude of change differs between hydrological models, and when summarised as transient change, some different patterns emerge. These are worthy of exploration, given the important differences between the models in terms of their ability to simulate observations – this is covered in detail in the evaluation provided by Hannaford et al. (2023).
Of these variations, the most frequent occurrence is G2G-simulated flow projections that are an outlier from the other three models. This is most noticeable in certain catchments in southern and eastern England (e.g. 33 029, 37 005 and 39 034; Fig. 7). In these and other similar catchments, there are substantial artificial influences on river flows. Each of GR4J, GR6J and PDM are calibrated to gauged river flows which contain these artificial influences; as such, future projections also implicitly include artificial influence (under an assumption of stationarity of these factors). However, G2G has not been calibrated to gauged river flow data for each catchment; rather, G2G models the natural water balance of catchments, generating natural flows. G2G flows are often outliers for catchments in the densely populated south-east of the UK, the region with the most substantial disparity between gauged and natural flows. In this region, transient river flow projections are often steeper for G2G than the other three calibrated models. This is because models calibrated to observations are more likely to tend towards a minimum environmental flow, whereas G2G will not unless explicitly accounted for in the implementation (not done so herein). However, there are a number of catchments in Scotland for which G2G is also a noteworthy outlier (e.g. 90 003 and 94 001; Fig. 7). These catchments are generally very natural and so cannot be explained by the offset between calibrated and natural flows across the hydrological models; it is also noted that for many natural catchments in the UK, flows from all four models are expectedly comparable (e.g. 16 003, 60 002 and 79 002; Fig. 7). Instead, further assessment indicates it is the presence of large lakes or lochs within these catchments that causes the considerable offset in flows. Lakes are not modelled by the implementation of G2G model used here, with flows routed through the landscape as if the water body is not there. Whilst application of the simpler lumped catchment models (GR4J, GR6J, PDM) also did not take account of lakes explicitly, their calibration to gauged river flows implicitly includes the damped response caused by major lakes within catchments.
Despite the uniqueness of G2G within the hydrological model ensemble used here, there are occasions when other models simulate similar flows, even in non-natural catchments. Most frequently, the lumped catchment model which aligns with G2G is GR4J. This is likely to be attributable to the lower number of parameters in GR4J compared to GR6J and PDM, and the details of how inter-catchment water exchange and flow routing are represented (Moore and Bell, 2002; Pushpalatha et al., 2011; Fig. S2 of Hannaford et al., 2023), making simulation of flows more difficult in catchments with complex hydrological processes (such as those influenced by aquifers, abstractions and water transfers).
Further differences between models may also arise from variations in modelling structures, calibration and validation approaches. Whilst efforts have been made to synchronise these and whilst driving input data are identical for all models, there remain some differences as outlined in Hannaford et al. (2023), and these should be borne in mind in interpreting future drought projections. Nevertheless, despite these differences across the hydrological model ensemble, the key findings presented here around future drought are consistent in direction, if not always in magnitude, of change.
4.3 RCM uncertainty in future projections
The climate projections applied here are a bias-corrected version of the 12-member perturbed parameter ensemble (PPE) from UKCP18 (Sect. 2.1.6). This dataset does not provide a comprehensive assessment of all aspects of uncertainty because ensemble members are sourced from only one climate model and one emissions scenario, and the 12 members only represent a range of boundary conditions for the climate model. Since the PPE only partially represents climate model uncertainty, the ensemble members are considered equally plausible scenarios and have been presented as such when combined within box plots (e.g. Figs. 4 and 5). In common with many studies based on an RCM ensemble, the climatologies provided may not be fully representative of low-likelihood, high-impact events, for which storyline methodologies may be more useful (Chan et al., 2022).
RCM uncertainty is represented by ensemble maxima and minima in Figs. 4 and 5. For low river flows and groundwater levels in some boreholes, RCM uncertainty is projected to decrease through the 21st century. However, this is not necessarily to state that projections from the RCM ensemble become more similar to one another in the far future. As transient low flows and levels decline in future, they approach lower bounds below which further decreases are physically constrained by hydrological processes. This is confirmed by the opposite pattern in Q50 and Q30 river flows in which envelopes representing RCM uncertainty increase substantially towards the far future (Figs. S9–S10 and S13–S14), indicating more variability between ensemble members into the future. For the 50th and 30th exceedance percentiles of flows and levels, there are unlikely to be physical constraints inhibiting the full characterisation of RCM uncertainty. This widening RCM uncertainty in the far future (rather than linearly throughout the 21st century) is likely to be related to the late emergence of changes in precipitation (both wetter winters and drier summers), which is represented to varying degrees amongst the ensemble members (Fig. 11). There is also evidence that local catchment hydrogeology has important implications for the uncertainty around the trajectory of groundwater drought metrics where the relative uncertainty was smaller for more responsive boreholes such as those with lower qmax values.
Further analysis has been undertaken with the eFLaG ensemble data in partitioning uncertainty between the RCM and hydrological model components (Aitken et al., 2023). In addition, uncertainties from the RCM ensemble were found to be larger from UKCP18 (and therefore datasets like eFLaG) than the predecessor UKCP09, despite there being fewer members in the former (Kay et al., 2020).
4.4 Implications for management of water resources in the UK
Notwithstanding the complexities and uncertainties highlighted in the previous sections, this study points to a future of diminishing low river flows and increasing severity of hydrological droughts. If realised, these projections could have profound consequences for water management in the UK, resulting in substantial decreases of water available for public water supply as well as increased competition between sectoral demands for (in many cases already scarce) water resources, especially during increasingly extreme droughts. Moreover, trends towards lower river flows will have implications for water quality and aquatic ecosystems. Previous research using the predecessor dataset of national hydrological projections FFGWL (Prudhomme et al., 2013) has shown such future impacts on water quality determinands (e.g. Bussi et al., 2016; Charlton et al., 2018; Mortazavi-Naeini et al., 2019), ecological health (e.g. Royan et al., 2015), and increasing potential for water restrictions impacting sectors such as irrigated agriculture (e.g. Salmoral et al., 2019) and energy (e.g. Bussi and Whitehead, 2020). There is now a pressing need to update studies on future impacts using the latest state-of-the-art river flow and groundwater level projections.
Behind such headline future changes, however, there are significant regional variations, notably a pronounced north–south divide in terms of river flow projections in the UK. In the north-west, low flows are projected to decline in future (in common with the rest of the country), whilst high flows are projected to increase through the 21st century, consistent with findings of studies using previous climate projections (e.g. Collet et al., 2018; Kay et al., 2021b). This suggests that flow variability will increase markedly in future in these already generally very flashy catchments of the north-west. These areas are sensitive to relatively short periods (e.g. a few months) of dry weather and as such the outcomes suggest some worsening of single-season droughts. The corresponding increase in winter wet weather and high flows has the potential to offset water stress in those locations where there is adequate multi-season reservoir storage, provided high flows can be harnessed and utilised to maintain reservoir storage near capacity in order to buffer against drought-induced water deficiencies. More generally, however, decreased summer/low flows and increasing drought severity are likely to have severe impacts in these northern and western areas with limited storage. Recent flash droughts (e.g. 2018, Turner et al., 2021; summer 2022; NCIC, 2022) in the summer half-year, associated with intense heatwaves, highlight the vulnerability of the north and west to such events.
Projected future changes in river flows in central, southern and eastern England are more ominous for the management of water resources. In common with the majority of the country, low flows in this region are likely to decrease substantially over the course of the 21st century. However, unlike regions further north and west, median and high flows are also projected to decrease out to the far future. This represents a wholesale downward shift in hydrological regime and therefore does not offer the same potential for high flows to buffer against an increased prevalence of low flows. The exception to this pattern might be expected to be the groundwater-dominated catchments of the south and east, in which the extremely lagged response of river flows to rainfall inputs is more akin to the fluctuations of water levels in aquifers. This has not been demonstrated in future flow projections for the most groundwater-dominated of the 200 catchments, all of which demonstrate the same consistent declines in flows exhibited by more responsive catchments. The reason why this groundwater-like behaviour is not captured in river flow projections for some catchments is likely to be related to the hydrological models not explicitly incorporating a catchment's crucial storage dynamics within their process base. The inherent biases in the model simulations, relative to observations, must also be borne in mind here. This was noted in Sect. 4.2, that highlighted poorer performance in some groundwater-dominated catchments, and, for G2G especially, in catchments with high levels of human disturbance – both of which are more prevalent (and interacting) features of catchments in southeast England.
Since such catchments are important contributors to regional water resources in the south-east of the UK, the unexpected difference between projections of groundwater levels and river flows in certain groundwater-dominated catchments will require further assessment in future studies. Nevertheless, it suggests that overall water supplies are likely to be reduced in future (in the absence of new supply-side options such as reservoirs), rather than a seasonal shift in the overall water balance as projected further north and west. When juxtaposed against the anticipated increase in water demands in future, the likelihood of a “jaws of death” scenario (Bevan, 2022) is much more apparent. Arnell et al. (2021) found drought risk is likely to increase throughout the UK in future, though by spatially variable and catchment-specific magnitudes of change, and Kay et al. (2021b) also identified the more populous and drier south-east as a hotspot for future decreases in river flows.
The contrasting fortunes projected for these two regions underscore the attraction of large-scale water transfer options from the north-west to the south-east. Such options are the basis of many current long-term water resources management plans, and a number of analyses have supported their potential feasibility (e.g. Dobson et al., 2020; Murgatroyd et al., 2020, 2022). However, future change in spatial coherence of drought events could have profound implications for this, as demonstrated by Tanguy et al. (2023).
Groundwater resources are an additional component of the overall water resources management portfolio, but spatial patterns of groundwater level projections are altogether more complex. A national-scale assessment is more challenging since the location of the most productive aquifers is largely confined to central, southern and eastern England. Nevertheless, projections do not necessarily follow those of river flows in this region. Overall, there is considerably more variation between adjacent boreholes (even those very close together) than for river flow catchments. This reflects the stronger influence of aquifer characteristics on projections than the equivalent for river flow catchments, and this precludes overly simplistic attribution to geographical differences.
The divergence of river flow and groundwater level projections highlighted herein, and their varying spatial patterns, could have profound implications for the future management of water resources in the UK. It is suggested that groundwater levels in some locations are likely to be more robust to future climate change than river flows. This might require a re-framing of the balance between surface water and groundwater resources for those water management regions (predominantly those in central, southern and eastern England) in which these two resources both contribute significantly to overall water resources. It might also mean that water companies for whom groundwater assumes a greater proportion of overall water resources may be in a more favourable position than their counterparts, who are more reliant on river flows. This might have important ramifications for the direction and magnitude of inter-regional water transfers. It also suggests that options such as reservoirs filled by pumped water from surface supplies might be a less appealing option in a future of diminishing river flows. More generally, the findings presented herein may have an important impact on the significant investment decisions required to meet water demands over the next few decades and beyond.
Nevertheless, any suggestion that groundwater has the potential to assume greater significance within the overall water resources portfolio must be evaluated against a backdrop of environmental considerations within water management. Groundwater abstractions in the UK peaked in the 1980s and have since been reduced under successive programmes to protect environmental river flows and groundwater levels. Further sustainability reductions of abstractions (from a combination of groundwater and surface water resources) of up to 5 %–10 % by 2045 are planned for all regions of England and Wales (BGS, 2023). Any shift in focus towards groundwater resources threatens to undermine much of this change and may have important consequences for river water quality and ecology, as well as recreational and aesthetic value of rivers, all of which have proven to be flashpoints of contention in recent years, especially in the Chalk streams of southeast England.
Hence, while this research showcases the potential for a dataset like that of Hannaford et al. (2022) to support projections of future water availability, there remains a need for ongoing work applying these data in local- to regional-scale water supply system modelling studies that allow detailed conclusions to be drawn on the future for specific scales and sectors (e.g. Jenkins et al., 2021; Murgatroyd and Hall, 2021).
This study presents a rigorous assessment of projected future changes in low river flows and groundwater levels and hydrological drought using the latest set of climate projections for the UK. Across all RCM ensemble members, hydrological models and most catchments, river flows are very likely to be lower in future than in the recent past, and streamflow droughts are likely to be more protracted and severe in future. Should such projections materialise, there would be profound consequences for water quality, in-stream ecology and recreational use of surface water bodies, amongst other impacts. This is also an ominous finding for those regions of the UK which are predominantly reliant on surface water resources for public water supply. These also tend to be responsive parts of the north and west of the country which already more swiftly experience drought conditions in the face of dry weather.
The parallel assessment of river flow and groundwater level deficiencies herein has enabled comparisons to be drawn on their sometimes contrasting fortunes in the future. Whilst some exhibit similar patterns to those of river flows, for a substantial number of boreholes, future projections are less consistent and perhaps offer some cautious optimism on likely future drought. Due to their reliance on recharge in winter and in the face of projected wetter winters, levels in some boreholes are projected to be relatively stationary or even increase through the 21st century. In areas of the UK that are overly reliant on subsurface water resources, there could be a stabilisation or even reduction in drought conditions towards the far future. Given these areas are some of those most vulnerable to drought at present and under the most pressure from water demands, this would be a potentially welcome development.
Taken together, the divergence in some projections of future hydrological drought under climate change is likely to result in complex impacts on river flows and groundwater levels, as well as upon the water resource systems that have been built to manage their variability. Considerable effort and resources have been committed over recent decades to enhance regional and national resilience to drought in the UK, which stands the country in good stead to cope with future changes. However, it is clear that the future will pose new challenges for which novel management solutions will be required, and further research will be necessary to better understand the complex and changing interactions of drought in the UK.
The precipitation, river flow and groundwater level projections analysed herein are archived on the UKCEH Environmental Information Data Centre and are freely available as DOI datasets. These data should be cited in full if used in any application: https://catalogue.ceh.ac.uk/documents/755e0369-f8db-4550-aabe-3f9c9fbcb93d (Lane and Kay, 2022), https://doi.org/10.5285/1bb90673-ad37-4679-90b9-0126109639a9 (Hannaford et al., 2022). The analysis conducted in this study can be explored further in the eFLaG Portal, which allows users to explore similar graphics showing future projections in drought characteristics and low flows and groundwater levels. The eFLaG Portal allows users to explore the full 200 eFLaG catchments rather than just the subset used here (https://eip.ceh.ac.uk/hydrology/eflag, UKCEH, 2022b).
The supplement related to this article is available online at: https://doi.org/10.5194/hess-28-417-2024-supplement.
SP led the research including the river flow aspects, determined the metrics used and produced graphics. JDM led the groundwater level aspects. TC established computer programming scripts for the analysis of data. JH led the eFLaG project, providing overall direction and research design input. AK and RL derived the climate input to the hydrological models. VAB, KFC, TC, RJM and JW produced the river flow projections analysed herein. MT and EM contributed towards the drought analysis and produced graphics. ST oversaw data management and produced graphics. SP, JDM and JH prepared the manuscript, with co-authors providing contributions. All authors helped to shape the aims and objectives of the study.
The contact author has declared that none of the authors has any competing interests.
Publisher’s note: Copernicus Publications remains neutral with regard to jurisdictional claims made in the text, published maps, institutional affiliations, or any other geographical representation in this paper. While Copernicus Publications makes every effort to include appropriate place names, the final responsibility lies with the authors.
Jonathan D. Mackay publishes with the permission of the executive director of the British Geological Survey.
The eFLaG project that underpinned this research was funded through the Met Office-led part of the Strategic Priorities Fund Climate Resilience programme (https://www.ukclimateresilience.org/, last access: 4 January 2022) under contract no. P107493 (CR19_4 UK Climate Resilience). The work was also supported by the National Environment Research Council grant “Climate change in the Arctic-North Atlantic Region and Impacts on the UK” (CANARI) (grant no. NE/W004984/1).
This paper was edited by Yi He and reviewed by two anonymous referees.
Aitken, G., Beevers, L., Parry, S., and Facer-Childs, K.: Partitioning Model Uncertainty in Multi-member Multi-model Ensemble River Flow Climate Change Projections, Clim. Change, 176, 153, https://doi.org/10.1007/s10584-023-03621-1, 2023.
Anglian Water: Anglian Water DRAFT Drought Plan, https://www.anglianwater.co.uk/siteassets/household/about-us/aws-drought-plan-2022.pdf, last access: 4 January 2024.
Arnell, N., Kay, A., Freeman, A., Rudd, A., and Lowe, J.: Changing climate risk in the UK: A multi-sectoral analysis using policy-relevant indicators, Climate Risk Management, 31, 100265, https://doi.org/10.1016/j.crm.2020.100265, 2021.
Ascott, M. J., Bloomfield, J. P., Karapanos, I., Jackson, C. R., Ward, R. S., McBride, A. B., Dobson, B., Kieboom, N., Holman, I. P., Van Loon, A. F., Crane, E. J., Brauns, B., Rodriguez-Yebra, A., and Upton, K. A.: Managing groundwater supplies subject to drought: perspectives on current status and future priorities from England (UK), Hydrogeol. J., 921–924, https://doi.org/10.1007/s10040-020-02249-0, 2021.
Barker, L. J., Hannaford, J., Parry, S., Smith, K. A., Tanguy, M., and Prudhomme, C.: Historic hydrological droughts 1891–2015: systematic characterisation for a diverse set of catchments across the UK, Hydrol. Earth Syst. Sci., 23, 4583–4602, https://doi.org/10.5194/hess-23-4583-2019, 2019.
Bell, V., Kay, A., Jones, R., Moore, R., and Reynard, N.: Use of soil data in a grid-based hydrological model to estimate spatial variation in changing flood risk across the UK, J. Hydrol., 377, 335–350, https://doi.org/10.1016/j.jhydrol.2009.08.031, 2009.
Bell, V., Kay, A., Cole, S., Jones, R., Moore, R., and Reynard, N.: How might climate change affect river flows across the Thames Basin? An area-wide analysis using the UKCP09 Regional Climate Model ensemble, J. Hydrol., 442–443, 89–104, https://doi.org/10.1016/j.jhydrol.2012.04.001, 2012.
Bevan, J.: Drought risk in the Anthropocene: from the jaws of death to the waters of life, Philos. T. R. Soc. A, A38, 20220003, https://doi.org/10.1098/rsta.2022.0003, 2022.
BGS: Groundwater resources in the UK, https://www.bgs.ac.uk/geology-projects/groundwater-research/groundwater-resources-in-the-uk/, last access: 9 February 2023.
Bloomfield, J. P. and Marchant, B. P.: Analysis of groundwater drought building on the standardised precipitation index approach, Hydrol. Earth Syst. Sci., 17, 4769–4787, https://doi.org/10.5194/hess-17-4769-2013, 2013.
Bloomfield, J. P., Marchant, B. P., Bricker, S. H., and Morgan, R. B.: Regional analysis of groundwater droughts using hydrograph classification, Hydrol. Earth Syst. Sci., 19, 4327–4344, https://doi.org/10.5194/hess-19-4327-2015, 2015.
Bloomfield, J. P., Marchant, B. P., and McKenzie, A. A.: Changes in groundwater drought associated with anthropogenic warming, Hydrol. Earth Syst. Sci., 23, 1393–1408, https://doi.org/10.5194/hess-23-1393-2019, 2019.
Borgomeo, E., Farmer, C., and Hall, J.: Numerical rivers: A synthetic streamflow generator for water resources vulnerability assessments, Water Resour. Res., 51, 5382–5405, 2015.
Bussi, G., Dadson, S., Prudhomme, C., and Whitehead, P.: Modelling the future impacts of climate and land-use change on suspended sediment transport in the River Thames (UK), J. Hydrol., 542, 357–372, https://doi.org/10.1016/j.jhydrol.2016.09.010, 2016.
Bussi, G., and Whitehead, P.: Impacts of droughts on low flows and water quality near power stations, Hydrolog. Sci. J., 65, 898–913, https://doi.org/10.1080/02626667.2020.1724295, 2020.
Cammalleri, C., Naumann, G., Mentaschi, L., Bisselink, B., Gelati, E., De Roo, A., and Feyen, L.: Diverging hydrological drought traits over Europe with global warming, Hydrol. Earth Syst. Sci., 24, 5919–5935, https://doi.org/10.5194/hess-24-5919-2020, 2020.
Chan, W. C. H., Shepherd, T. G., Facer-Childs, K., Darch, G., and Arnell, N. W.: Storylines of UK drought based on the 2010–2012 event, Hydrol. Earth Syst. Sci., 26, 1755–1777, https://doi.org/10.5194/hess-26-1755-2022, 2022.
Charlton, M., Bowes, M., Hutchins, M., Orr, H., Soley, R., and Davison, P.: Mapping eutrophication risk from climate change: Future phosphorus concentrations in English rivers, Sci. Total Environ., 613–614, 1510–1526, https://doi.org/10.1016/j.scitotenv.2017.07.218, 2018.
Chegwidden, O, Nijssen, B., Rupp, D., Arnold, J., Clark, M., Hamman, J. J., Kao, S. C., Mao, Y., Mizukami, N., Mote, P., Pan, M., Pytlak, E., and Xiao, M.: How do modeling decisions affect the spread among hydrologic climate change projections? Exploring a large ensemble of simulations across a diversity of hydroclimates, Earth's Future, 7, 623–637, https://doi.org/10.1029/2018EF001047, 2019.
Cole, S. and Moore, R.: Distributed hydrological modelling using weather radar in gauged and ungauged basins, Adv. Water Resour., 32, 1107–1120, https://doi.org/10.1016/j.advwatres.2009.01.006, 2009.
Collet, L., Harrigan, S., Prudhomme, C., Formetta, G., and Beevers, L.: Future hot-spots for hydro-hazards in Great Britain: a probabilistic assessment, Hydrol. Earth Syst. Sci., 22, 5387–5401, https://doi.org/10.5194/hess-22-5387-2018, 2018.
Coron, L., Delaigue, O., Thirel, G., Dorchies, D., Perrin, C., and Michel, C.: airGR: Suite of GR Hydrological Models for Precipitation-Runoff Modelling, R package version 1.6.12, https://doi.org/10.15454/EX11NA, 2021.
Dobson, B., Coxon, G., Freer, J., Gavin, H., Mortazavi-Naeini, M., and Hall, J.: The spatial dynamics of droughts and water scarcity in England and Wales, Water Resour. Res., 56, e2020WR027187, https://doi.org/10.1029/2020WR027187, 2020.
Engin, B., Yücel, I., and Yilmaz, A.: Assessing different sources of uncertainty in hydrological projections of high and low flows: case study for Omerli Basin, Istanbul, Turkey, Environ. Monit. Assess., 189, 1–9, 2017.
Folland, C. K., Hannaford, J., Bloomfield, J. P., Kendon, M., Svensson, C., Marchant, B. P., Prior, J., and Wallace, E.: Multi-annual droughts in the English Lowlands: a review of their characteristics and climate drivers in the winter half-year, Hydrol. Earth Syst. Sci., 19, 2353–2375, https://doi.org/10.5194/hess-19-2353-2015, 2015.
Gu, L., Yin, J., Slater, L., Chen, J., Do, H., Wang, H.-M., Chen, L., Jiang, Z., and Zhao, T.: Intensification of global hydrological droughts under anthropogenic climate warming, Water Resour. Res., 59, e2022WR032997, https://doi.org/10.1029/2022WR032997, 2023.
Hannaford, J., Mackay, J., Ascot, M., Bell, V., Chitson, T., Cole, S., Counsell, C., Durant, M., Facer-Childs, K., Jackson, C., Kay, A., Lane, R., Mansour, M., Moore, R., Parry, S., Rudd, A., Simpson, M., Turner, S., Wallbank, J., Wells, S., and Wilcox, A.: Hydrological projections for the UK, based on UK Climate Projections 2018 (UKCP18) data, from the Enhanced Future Flows and groundwater (eFLaG) project, NERC EDS Environmental Information Data Centre, https://doi.org/10.5285/1bb90673-ad37-4679-90b9-0126109639a9, 2022.
Hannaford, J., Mackay, J. D., Ascott, M., Bell, V. A., Chitson, T., Cole, S., Counsell, C., Durant, M., Jackson, C. R., Kay, A. L., Lane, R. A., Mansour, M., Moore, R., Parry, S., Rudd, A. C., Simpson, M., Facer-Childs, K., Turner, S., Wallbank, J. R., Wells, S., and Wilcox, A.: The enhanced future Flows and Groundwater dataset: development and evaluation of nationally consistent hydrological projections based on UKCP18, Earth Syst. Sci. Data, 15, 2391–2415, https://doi.org/10.5194/essd-15-2391-2023, 2023.
Harrigan, S., Prudhomme, C., Parry, S., Smith, K., and Tanguy, M.: Benchmarking ensemble streamflow prediction skill in the UK, Hydrol. Earth Syst. Sci., 22, 2023–2039, https://doi.org/10.5194/hess-22-2023-2018, 2018.
Hollis, D., McCarthy, M., Kendon, M., Legg, T., and Simpson, I.: HadUK-Grid – A new UK dataset of gridded climate observations, Geosci. Data J., 6, 151–159, https://doi.org/10.1002/gdj3.78, 2019.
Hough, M. N. and Jones, R. J. A.: The United Kingdom Meteorological Office rainfall and evaporation calculation system: MORECS version 2.0-an overview, Hydrol. Earth Syst. Sci., 1, 227–239, https://doi.org/10.5194/hess-1-227-1997, 1997.
Huskova, I., Matrosov, E., Harou, J., Kasprzyk, J., and Lambert, C.: Screening robust water infrastructure investments and their trade-offs under global change: A London example, Global Environ. Chang., 41, 216–227, 2016.
Jackson, C., Bloomfield, J., and Mackay, J.: Evidence for changes in historic and future groundwater levels in the UK, Prog. Phys. Geog., 39, 49–67, https://doi.org/10.1177/0309133314550668, 2015.
Jenkins, K., Dobson, B., Decker, C., and Hall, J.: An integrated framework for risk-based analysis of economic impacts of drought and water scarcity in England and Wales, Water Resour. Res., 57, e2020WR027715, https://doi.org/10.1029/2020WR027715, 2021.
Kay, A.: Differences in hydrological impacts using regional climate model and nested convection-permitting model data, Clim. Change, 173, 11, https://doi.org/10.1007/s10584-022-03405-z, 2022.
Kay, A., Bell, V., Guillod, B., Jones, R., and Rudd, A.: National-scale analysis of low flow frequency: historical trends and potential future changes, Clim. Change, 147, 585–599, https://doi.org/10.1007/s10584-018-2145-y, 2018.
Kay, A., Watts, G., Wells, S., and Allen, S.: The impact of climate change on U.K. river flows: A preliminary comparison of two generations of probabilistic climate projections, Hydrol. Process., 34, 1081–1088, https://doi.org/10.1002/hyp.13644, 2020.
Kay, A., Davies, H., Lane, R., Rudd, A., and Bell, V.: Grid-based simulation of river flows in Northern Ireland: Model performance and future flow changes, J. Hydrol., 38, 100967, https://doi.org/10.1016/j.ejrh.2021.100967, 2021a.
Kay, A., Griffin, A., Rudd, A., Chapman, R., Bell, V., and Arnell, N.: Climate change effects on indicators of high and low river flow across Great Britain, Adv. Water Resour., 151, 103909, https://doi.org/10.1016/j.advwatres.2021.103909, 2021b.
Lane, R. and Kay, A.: Climate change impact on the magnitude and timing of hydrological extremes across Great Britain, Frontiers in Water, 71, 684982, https://doi.org/10.3389/frwa.2021.684982, 2021.
Lane, R. A. and Kay, A. L.: Gridded simulations of available precipitation (rainfall + snowmelt) for Great Britain, developed from observed data (1961–2018) and climate projections (1980–2080), NERC EDS Environmental Information Data Centre [data set], https://doi.org/10.5285/755e0369-f8db-4550-aabe-3f9c9fbcb93d, 2022.
Lane, R. A., Coxon, G., Freer, J., Seibert, J., and Wagener, T.: A large-sample investigation into uncertain climate change impacts on high flows across Great Britain, Hydrol. Earth Syst. Sci., 26, 5535–5554, https://doi.org/10.5194/hess-26-5535-2022, 2022.
Lowe, J., Bernie, D., Bett, P., Bricheno, L., Brown, S., Calvert, D., Clark, R., Eagle, K., Edwards, T., Fosser, G., and Fung, F.: UKCP18 science overview report, Met Office Hadley Centre, Exeter, UK, https://www.metoffice.gov.uk/pub/data/weather/uk/ukcp18/science-reports/UKCP18-Overview-report.pdf (last access: 4 January 2024), 2018.
Mackay, J., Jackson, C., and Wang, L.: A lumped conceptual model to simulate groundwater level time-series, Environ. Model. Softw., 61, 229–245, https://doi.org/10.1016/j.envsoft.2014.06.003, 2014.
Mackay, J., Jackson, C., Brookshaw, A., Scaife, A., Cook, J., and Ward, R.: Seasonal forecasting of groundwater levels in principal aquifers of the United Kingdom, J. Hydrol., 530, 815–828, https://doi.org/10.1016/j.jhydrol.2015.10.018, 2015.
Meresa, H. K. and Romanowicz, R. J.: The critical role of uncertainty in projections of hydrological extremes, Hydrol. Earth Syst. Sci., 21, 4245–4258, https://doi.org/10.5194/hess-21-4245-2017, 2017.
Moore, R. J.: The PDM rainfall-runoff model, Hydrol. Earth Syst. Sci., 11, 483–499, https://doi.org/10.5194/hess-11-483-2007, 2007.
Moore, R. J. and Bell, V. A.: Incorporation of groundwater losses and well level data in rainfall-runoff models illustrated using the PDM, Hydrol. Earth Syst. Sci., 6, 25–38, https://doi.org/10.5194/hess-6-25-2002, 2002.
Moore, R., Cole, S., Bell, V., and Jones, D.: Issues in flood forecasting: ungauged basins, extreme floods and uncertainty, in: Frontiers in Flood Research, edited by: Tchiguirinskaia, I., Thein, K., and Hubert, P., 8th Kovacs Colloquium, UNESCO, Paris, June/July 2006, IAHS Publ., 305, 103–122, 2006.
Mortazavi-Naeini, M., Bussi, G., Elliott, J., Hall, J., and Whitehead, P.: Assessment of risks to public water supply from low flows and harmful water quality in a changing climate, Water Resour. Res., 55, 10386–10404, https://doi.org/10.1029/2018WR022865, 2019.
Murgatroyd, A. and Hall, J.: The Resilience of Inter-basin Transfers to Severe Droughts With Changing Spatial Characteristics, Front. Environ. Sci., 8, 571647, https://doi.org/10.3389/fenvs.2020.571647, 2020.
Murgatroyd, A. and Hall, J.: Selecting indicators and optimizing decision rules for long-term water resources planning, Water Resour. Res., 57, e2020WR028117, https://doi.org/10.1029/2020WR028117, 2021.
Murgatroyd, A., Gavin, H., Becher, O., Coxon, G., Hunt, D., Fallon, E., Wilson, J., Cuceloglu, G., and Hall, J.: Strategic analysis of the drought resilience of water supply systems, Philos. T. R. Soc. A., 380, 20210292, https://doi.org/10.1098/rsta.2021.0292, 2022.
Murphy J., Harris, G., Sexton, D., Kendon, E., Bett, P., Brown, S., Clark, R., Eagle, K., Fosser, G., Fung, F., Lowe, J., McDonald, R., McInnes, R., McSweeney, C., Mitchell, J., Rostron, J., Thornton, H., Tucker, S., and Yamazaki, K.: UKCP18 Land Projections: Science Report, Met Office Hadley Centre, Exeter, https://www.metoffice.gov.uk/pub/data/weather/uk/ukcp18/science-reports/UKCP18-Land-report.pdf (last access: 31 January 2024), 2018.
NCIC: UK seasonal weather summary Summer 2022, Weather, 77, 357–357, https://doi.org/10.1002/wea.4305, 2022.
Padrón, R. S., Gudmundsson, L., Decharme, B., Ducharne, A., Lawrence, D. M., Mao, J., Peano, D., Krinner, G., Kim, H., and Seneviratne, S. I.: Observed changes in dry-season water availability attributed to human-induced climate change, Nat. Geosci., 13, 477–481, https://doi.org/10.1038/s41561-020-0594-1, 2020.
Parry, S., Hannaford, J., Lloyd-Hughes, B., and Prudhomme, C.: Multi-year droughts in Europe: analysis of development and causes, Hydrol. Res., 43, 689–706, https://doi.org/10.2166/nh.2012.024, 2012.
Parry, S., Wilby, R. L., Prudhomme, C., and Wood, P. J.: A systematic assessment of drought termination in the United Kingdom, Hydrol. Earth Syst. Sci., 20, 4265–4281, https://doi.org/10.5194/hess-20-4265-2016, 2016.
Perrin, C., Michel, C., and Andréassian, V.: Improvement of a parsimonious model for streamflow simulation, J. Hydrol., 279, 275–289, https://doi.org/10.1016/S0022-1694(03)00225-7 , 2003.
Pokhrel, Y., Felfelani, F., Satoh, Y., Boulange, J., Burek, P., Gädeke, A., Gerten, D., Gosling, S. N., Grillakis, M., Gudmundsson, L., Hanasaki, N., Kim, H., Koutroulis, A., Liu, J., Papadimitriou, L., Schewe, J., Schmied, H. M., Stacke, T., Telteu, C.-E., and Wada, Y.: Global terrestrial water storage and drought severity under climate change, Nat. Clim. Change, 11, 226–233, https://doi.org/10.1038/s41558-020-00972-w, 2021.
Prudhomme, C., Parry, S., Hannaford, J., Clark, D., Hagemann, S., and Voss, F.: How Well Do Large-Scale Models Reproduce Regional Hydrological Extremes in Europe?, J. Hydrometeorol., 12, 1181–1204, 2011.
Prudhomme, C., Haxton, T., Crooks, S., Jackson, C., Barkwith, A., Williamson, J., Kelvin, J., Mackay, J., Wang, L., Young, A., and Watts, G.: Future Flows Hydrology: an ensemble of daily river flow and monthly groundwater levels for use for climate change impact assessment across Great Britain, Earth Syst. Sci. Data, 5, 101–107, https://doi.org/10.5194/essd-5-101-2013, 2013.
Prudhomme, C., Hannaford, J., Harrigan, S., Boorman, D., Knight, J., Bell, V., Jackson, C., Svensson, C., Parry, S., Bachiller-Jareno, N., and Davies, H.: Hydrological Outlook UK: an operational streamflow and groundwater level forecasting system at monthly to seasonal time scales, Hydrolog. Sci. J., 62, 2753–2768, 2017.
Pushpalatha, R., Perrin, C., Le Moine, N., Mathevet, T., and Andréassian, V.: A downward structural sensitivity analysis of hydrological models to improve low-flow simulation, J. Hydrol., 411, 66–76, https://doi.org/10.1016/j.jhydrol.2011.09.034, 2011.
Rameshwaran, P., Bell, V., Brown, M., Davies, H., Kay, A., Rudd, A., and Sefton, C.: Use of abstraction and discharge data to improve the performance of a national-scale hydrological model, Water Resour. Res., 58, e2021WR029787, https://doi.org/10.1029/2021WR029787, 2022.
Rodda, J. and Marsh, T.: The 1975–76 Drought – a contemporary and retrospective review, National Hydrological Monitoring Programme series, https://nora.nerc.ac.uk/id/eprint/15011/1/CEH_1975-76_Drought_Report_Rodda_and_Marsh.pdf (last access: 4 January 2024), 2011.
Royan, A., Prudhomme, C., Hannah, D., Reynolds, S., Noble, D., and Sadler, J.: Climate-induced changes in river flow regimes will alter future bird distributions, Ecosphere, 6, 1–10, https://doi.org/10.1890/ES14-00245.1, 2015.
Rudd, A., Bell, V., and Kay, A.: National-scale analysis of simulated hydrological droughts (1891–2015), J. Hydrol., 550, 368–385, https://doi.org/10.1016/j.jhydrol.2017.05.018, 2017.
Rudd, A., Kay, A., and Bell, V.: National-scale analysis of future river flow and soil moisture droughts: potential changes in drought characteristics, Clim. Change, 156, 323–340, https://doi.org/10.1007/s10584-019-02528-0, 2019.
Salmoral, G., Rey, D., Rudd, A., de Margon, P., and Holman, I.: A probabilistic risk assessment of the national economic impacts of regulatory drought management on irrigated agriculture, Earth's Future, 7, 178–196, https://doi.org/10.1029/2018EF001092, 2019.
Smith, K. A., Barker, L. J., Tanguy, M., Parry, S., Harrigan, S., Legg, T. P., Prudhomme, C., and Hannaford, J.: A multi-objective ensemble approach to hydrological modelling in the UK: an application to historic drought reconstruction, Hydrol. Earth Syst. Sci., 23, 3247–3268, https://doi.org/10.5194/hess-23-3247-2019, 2019.
Spinoni, J., Barbosa, P., Bucchignani, E., Cassano, J., Cavazos, T., Cescatti, A., Christensen, J., Christensen, O., Coppola, E., Evans, J., Forzieri, G., Geyer, B., Giorgi, F., Jacob, D., Katzfey, J., Koenigk, T., Laprise, R., Lennard, C., Kurnaz, M. L., Li, D., Llopart, M., McCormick, N., Naumann, G., Nikulin, G., Ozturk, T., Panitz, H., Rocha, R. P., Solman, S. A., Syktus, J., Tangang, F., Teichmann, C., Vautard, R., Vogt, J. V., Winger, K., Zittis, G., and Dosio, A.: Global exposure of population and land-use to meteorological droughts under different warming levels and SSPs: A CORDEX-based study, Int. J. Climatol., 41, 6825–6853, https://doi.org/10.1002/joc.7302, 2021.
Tallaksen, L. and Van Lanen, H. (Eds.): Hydrological drought, Processes and estimation methods for streamflow and groundwater, in: Developments in water science, Elsevier, https://europeandroughtcentre.com/resources/hydrological-drought-1st-edition/, (last access: 4 January 2024), 2004.
Tanguy, M., Chevturi, A., Marchant, B., MacKay, J. D., Parry, S., and Hannaford, J.: How will climate change affect spatial coherence of droughts in Great Britain?, Environ. Res. Lett., 18, 064048, https://doi.org/10.1088/1748-9326/acd655, 2023.
Turner, S., Barker, L., Hannaford, J., Muchan, K., Parry, S., and Sefton, C.: The 2018/2019 drought in the UK: a hydrological appraisal, Weather, 76, 248–253, 2021.
UKCEH: PDM Rainfall-Runoff Model: PDM for PCs, Version 3.0.3, UK Centre for Ecology & Hydrology, Wallingford, UK, 179 pp., https://www.ceh.ac.uk/services/pdm-probability-distributed-model (last access: 4 January 2022), 2022a.
UKCEH: The eFLaG Portal, UK Centre for Ecology & Hydrology, https://eip.ceh.ac.uk/hydrology/eflag (last access: 4 January 2024), 2022b.
Van Loon, A.: Hydrological drought explained, WIRES Water, 2, 359–392, https://doi.org/10.1002/wat2.1085, 2015.
Velázquez, J. A., Schmid, J., Ricard, S., Muerth, M. J., Gauvin St-Denis, B., Minville, M., Chaumont, D., Caya, D., Ludwig, R., and Turcotte, R.: An ensemble approach to assess hydrological models' contribution to uncertainties in the analysis of climate change impact on water resources, Hydrol. Earth Syst. Sci., 17, 565–578, https://doi.org/10.5194/hess-17-565-2013, 2013.
Visser-Quinn, A., Beevers, L., Collet, L., Formetta, G., Smith, K., Wanders, N., Thober, S., Pan, M., and Kumar, R.: Spatio-temporal analysis of compound hydro-hazard extremes across the UK, Adv. Water Resour., 130, 77–90, https://doi.org/10.1016/j.advwatres.2019.05.019, 2019.
Wanders, N., Wada, Y., and Van Lanen, H. A. J.: Global hydrological droughts in the 21st century under a changing hydrological regime, Earth Syst. Dynam., 6, 1–15, https://doi.org/10.5194/esd-6-1-2015, 2015.