the Creative Commons Attribution 4.0 License.
the Creative Commons Attribution 4.0 License.
 | 27 Mar 2024
Potential for historically unprecedented Australian droughts from natural variability and climate change
Georgina M. Falster
Nicky M. Wright
Nerilie J. Abram
Anna M. Ukkola
Benjamin J. Henley
In drought-prone Australia, multi-year droughts have detrimental impacts on both the natural environment and human societies. For responsible water management, we need a thorough understanding of the full range of variability in multi-year droughts and how this might change in a warming world. But research into the long-term frequency, persistence, and severity of Australian droughts is limited. This is partly due to the length of the observational record, which is short relative to the timescales of hydroclimatic variability and hence may not capture the range of possible variability. Using simulations of Australian precipitation over the full past millennium (850–2000), we characterise the nature of multi-year meteorological droughts across Australia and include a particular focus on the Murray–Darling Basin (MDB), the largest agricultural region in Australia. We find that simulated Australian droughts in the 20th century (1900–2000) are within the bounds of pre-industrial natural variability in terms of drought intensity, severity, and frequency. A tendency for droughts to last longer in southwestern and eastern Australia (including the MDB) in the 20th century, compared with the pre-industrial period, suggests an emerging anthropogenic influence, consistent with projected rainfall changes in these regions. Large volcanic eruptions tend to promote drought-free intervals in the MDB. Model simulations of droughts over the last millennium suggest that future droughts across Australia could be much longer than what was experienced in the 20th century, even without any human influence. With the addition of anthropogenic climate change, which favours drought conditions across much of southern Australia due to reduced cool-season rainfall, it is likely that future droughts in Australia will exceed recent historical experience.
- Article
(6187 KB) - Full-text XML
-
Supplement
(14584 KB) - BibTeX
- EndNote


Droughts have severe environmental, societal, and economic impacts, which are expected to worsen in many mid-latitude regions with future anthropogenic climate change (Stevenson et al., 2022; Arias et al., 2021). Much of Australia is drought-prone, and drought risk is expected to increase in the future with ongoing human-caused climate warming (Kirono et al., 2020; Ukkola et al., 2020). Australia therefore requires careful water resource management and adaptation strategies. But despite the importance of understanding current and future hydroclimatic variability for developing water policy, research into the long-term frequency, severity, and typical duration of Australian droughts is limited (Kiem et al., 2016). This is partly due to the length of the observational record of Australian precipitation (∼120 years), which is short relative to the timescale of hydroclimatic variability (Stevenson et al., 2022; Morin, 2011). For example, Australia's Murray–Darling Basin (MDB) has experienced four major multi-year droughts since national rainfall records began: the 1895–1903 Federation, 1935–1945 World War II, 1997–2009 Millennium, and 2017–2019 Tinderbox droughts (Kiem et al., 2016; Devanand et al., 2024). Such multi-year droughts are infrequent enough in the observational record to make it challenging to acquire robust statistics on drought characteristics, such as maximum possible duration and severity, as well as return interval and overall time spent in drought. Paleoclimate evidence further indicates that precipitation observations do not capture the full possible range of variability across the Australian continent (Freund et al., 2017; Ho et al., 2015; O'Donnell et al., 2021), potentially leading to underestimation of intrinsic drought risk in water policy (Leblanc et al., 2012; Vance et al., 2022).
Droughts lasting 2 or more years have particularly detrimental impacts on both the natural environment and human society. The latter effects are felt strongly in Australia's MDB, which incorporates Australia's largest river system and is the largest agricultural region on the continent. For example, impacts of the Millennium Drought included major losses in agricultural production (van Dijk et al., 2013; Leblanc et al., 2012) as well as catastrophic ecological impacts, which were exacerbated by continued water extraction from the MDB catchment (Semple et al., 2010; van Dijk et al., 2013; Leblanc et al., 2012; Zampatti et al., 2010; Paton et al., 2009). Major droughts in the MDB have typically been initially identified via their impacts to agriculture (Helman, 2009), although individual droughts have differed in their nature, severity, and possible causes (Verdon-Kidd and Kiem, 2009; O'Loingsigh et al., 2015). Impacts causing economic loss are also typically focused on introduced or cultivated animal and plant species (e.g. cattle and wheat), which are not adapted to the large natural hydroclimatic variability of Australia.
Precipitation across most of Australia has not experienced significant negative mean state trends during the observational record (Ukkola et al., 2019). In fact, the continent has experienced increasing rainfall in the area mean, driven by a wetting trend in the northern parts of the country (Ukkola et al., 2019). However, a significant and sustained decline in cool-season rainfall has been observed in southwestern Australia and is projected to continue (Grose et al., 2020; Delworth and Zeng, 2014). Similar declining cool-season rainfall trends also appear to be developing in the southeast, though with greater uncertainty across the ensemble of available future projections (Grose et al., 2020; BoM, 2022). Information from paleoclimate records also suggests that droughts during the observational era are generally not beyond the range of variability of the past 500 years (Freund et al., 2017; Palmer et al., 2015; Cook et al., 2016; Ho et al., 2015; Vance et al., 2015), with the possible exception of parts of southern Australia (Freund et al., 2017; Palmer et al., 2015; Cook et al., 2016; Ho et al., 2015). However, paleoclimate proxies containing information about pre-historical droughts are very sparsely distributed across the Australian continent, and this can lead to an incomplete assessment of drought risk (Ault et al., 2014). Nevertheless, climate models project that with continued global warming, Australia will dry on average (Stevenson et al., 2022), and drought hazard metrics are predicted to increase significantly over the MDB (Kirono et al., 2020) and other southern parts of the country (Ukkola et al., 2020). This projected drying is particularly problematic given that we do not fully understand the natural range of Australian hydroclimate extremes and hence the degree to which intrinsic – as well as externally forced – drought risk should be considered in future planning (Leblanc et al., 2012).
Here we explore the range of variability in multi-year droughts in Australia, with a particular focus on the MDB. We explore multi-year drought variability using a range of drought metrics (e.g. length, frequency, intensity, and severity) and compare 20th-century droughts in observations and simulations with simulated drought variability during the pre-industrial last millennium (850–1849). We seek to determine if (and if so, how) simulated droughts have changed through time, including if droughts observed during the 20th century are more severe than expected from the simulated natural variability over the pre-industrial last millennium. We additionally assess whether MDB drought variability throughout the full last millennium (850–2000) is associated with any particular external forcing, for example, anthropogenic greenhouse gas emissions.
When assessing the nature of multi-year droughts, there are different ways to define drought intervals, particularly in terms of the hydroclimatic threshold that must be reached to classify a period as “drought” (e.g. Cook et al., 2022; Mishra and Singh, 2010). In its Sixth Assessment Report, the Intergovernmental Panel on Climate Change defines drought as “a period of abnormally dry weather that persists for long enough to cause a serious hydrological imbalance” (Douville et al., 2021). In this study we focus on meteorological droughts, which are characterised by periods of below-normal precipitation, as we have long-term observations of Australian precipitation against which to compare climate model data. Additionally, climate models show higher skill for precipitation compared with other drought-relevant hydrological variables (Ukkola et al., 2018).
2.1 Observations
We used monthly gridded precipitation data from the Australian Water Availability Project (AWAP; Jones et al., 2009), which is available at 0.05°×0.05° (latitude × longitude) resolution over Australia for 1900 to the present. We limited our analysis to the interval 1900–2000 since this is the interval covered by the climate model simulations we use (Sect. 2.2). We only assessed areas where primary observational data are available for >90 % of the time series (Ukkola et al., 2019). In pixels with observational data for >90 % of the time, any data gaps were filled using the monthly mean value. We converted monthly data to annual precipitation by summing monthly precipitation for calendar years (i.e. a January–December total). Precipitation seasonality varies across Australia. For example, in tropical northern Australia, “years” may be better represented by “tropical years”, where each year starts, for example, in May and finishes in April of the following year. However, this is not applicable across the entire continent, where some regions have winter-dominated precipitation and others have no distinct seasonality. Given that this study focuses on multi-year events, our choice of a calendar year for calculation of annual totals should not have a major influence on the results.
2.2 PMIP3/CMIP5 models
Long-term drought variability can be examined using multi-century climate model simulations. One of the most informative time periods for this is the pre-industrial last millennium (850–1849). With the exception of anthropogenic forcings, pre-industrial last millennium boundary conditions were very similar to those in the modern period, allowing the pre-industrial last millennium to act as a “baseline” against which we can compare modern (observed) and future (projected) climate variability. There is a specific Paleoclimate Modelling Intercomparison Project (PMIP) experiment targeting the last millennium interval (“past1000”) (Schmidt et al., 2011, 2012). Climate models with past1000 experiments are generally too coarse to accurately simulate land–atmosphere interactions (Santanello et al., 2018; Müller et al., 2021), making precipitation amount one of the most reliable indicators of drought variability in these simulations.
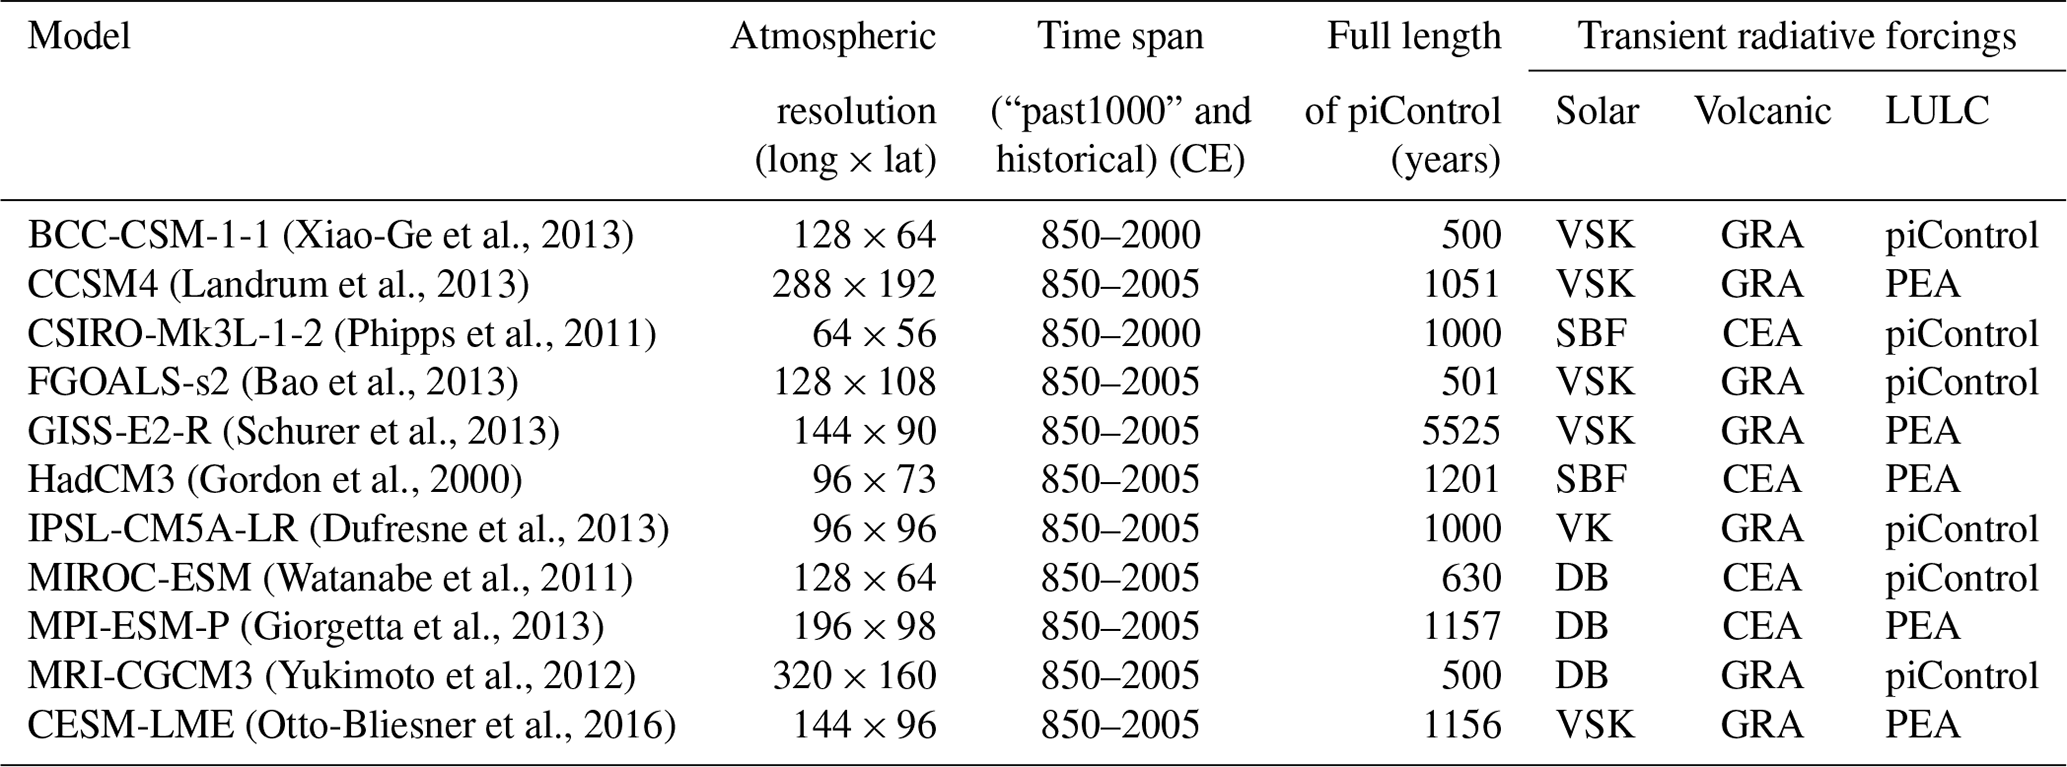
We assessed drought metrics using monthly outputs from 10 models (Table 1) submitted to the Paleoclimate Modelling Intercomparison Project Phase 3/Coupled Model Intercomparison Project Phase 5 with a past1000 experiment (PMIP3/CMIP5; Schmidt et al., 2011, 2012), as well as the Community Earth System Model Last Millennium Ensemble (CESM-LME). The CESM-LME is the most comprehensive set of simulations covering the full last millennium (Otto-Bliesner et al., 2016). The CESM-LME has 13 ensemble members with all natural and anthropogenic forcings (“fully forced”), as well as single-forcing experiments, with only one of the following external radiative forcings applied: well-mixed greenhouse gases (n=3), volcanic aerosols (n=4), orbital parameters (n=3), solar irradiance (n=4), and changes in land surface properties resulting from land use (n=3).
Table 1Details of PMIP3 models used in this study, including references for the transient radiative forcings applied to the pre-industrial last millennium (850–1849) simulations. LULC: land use and/or land cover changes; VSK: solar forcing from Vieira et al. (2011); DB: solar forcing from Delaygue and Bard (2011); SBF: solar forcing from Steinhilber et al. (2009); GRA: volcanic forcing from Gao et al. (2008); CEA: volcanic forcing from Crowley et al. (2008); PEA: LULC forcing from Pongratz et al. (2008). We used the GISS-E2-R past1000 experiment denoted “28”. The CESM-LME comprises 13 simulations with all natural and anthropogenic forcing, as well as the following single-forcing simulations: greenhouse gas only (n=3), volcanic only (n=4), orbital only (n=3), solar only (n=4), and LULC only (n=3).
Using these models (PMIP3 and CESM-LME), we assessed whether the nature of multi-year droughts across Australia differs under pre-industrial versus 20th-century forcing conditions. We focused on PMIP3 output rather than PMIP4 (Jungclaus et al., 2017) due to the greater availability of model simulations currently available. We additionally used the CESM-LME to investigate the Murray–Darling Basin multi-year drought response to external forcings.
Model outputs for the past1000 and CMIP5 historical experiments span either 850–2000 or 850–2005 (Table 1), so we truncated data from all models to the year 2000. We used total precipitation (variable “pr”) with native units (kg m−2 s−1) converted to millimetres per month by accounting for the number of days in each month. Annual precipitation was determined by summing monthly precipitation for calendar years. We restricted the spatial extent to only grid cells over continental Australia and Tasmania.
Model verification
To assess how precipitation variability in the models compares with observations, we used two metrics: (1) the mean annual precipitation amount (MAP) and (2) the coefficient of variation (CV), where the CV is the standard deviation divided by the mean for annual mean precipitation. For each metric, we compared the value in the models across 1900–2000 with observations over the same time period. For each model, we show the results as absolute bias relative to observations. As the model resolutions differ from the resolution of the gridded observational dataset, we use a bilinear interpolation to regrid the observational dataset into each model's native resolution prior to assessing model performance. We quantified the similarity of the model values for the MAP and CV metrics with observational values using spatial correlations. Spatial correlations between pairs of two-dimensional grids were calculated by flattening each grid, resulting in two directly comparable vectors with each index position of each vector representing the values at a particular latitude–longitude pair. We calculated the Pearson correlation coefficient and provide an estimate of the significance of that coefficient (reported “significant” if p<0.05). Note that we do not use the results of this verification to bias correct the models. Vogel et al. (2023) used CMIP5 simulations of Australian precipitation to demonstrate that different bias correction methods can lead to large differences in simulated rainfall climatology, variability, and extremes, and that no single bias correction method outperforms the others when evaluated for multiple metrics.
2.3 Drought definitions and metrics
2.3.1 Definitions
There are many commonly used methods for defining multi-year meteorological drought, and the specific definition used impacts drought metrics such as drought frequency and duration (Askarimarnani et al., 2021). In this study, we identified multi-year meteorological drought periods using the “2S2E” method (Coats et al., 2013), where a drought commences with 2 consecutive years of negative precipitation anomalies and continues until 2 consecutive years of positive precipitation anomalies occur (grey shading in Fig. 1). This method allows for single “wet” years during a drought. The 2S2E method has been commonly used in assessments of long-term multi-year drought variability in different regions (e.g. Coats et al., 2015; Cook et al., 2016; Stevenson et al., 2015). Metrics of multi-year drought severity are not significantly impacted by choice of drought definition (Cook et al., 2022).
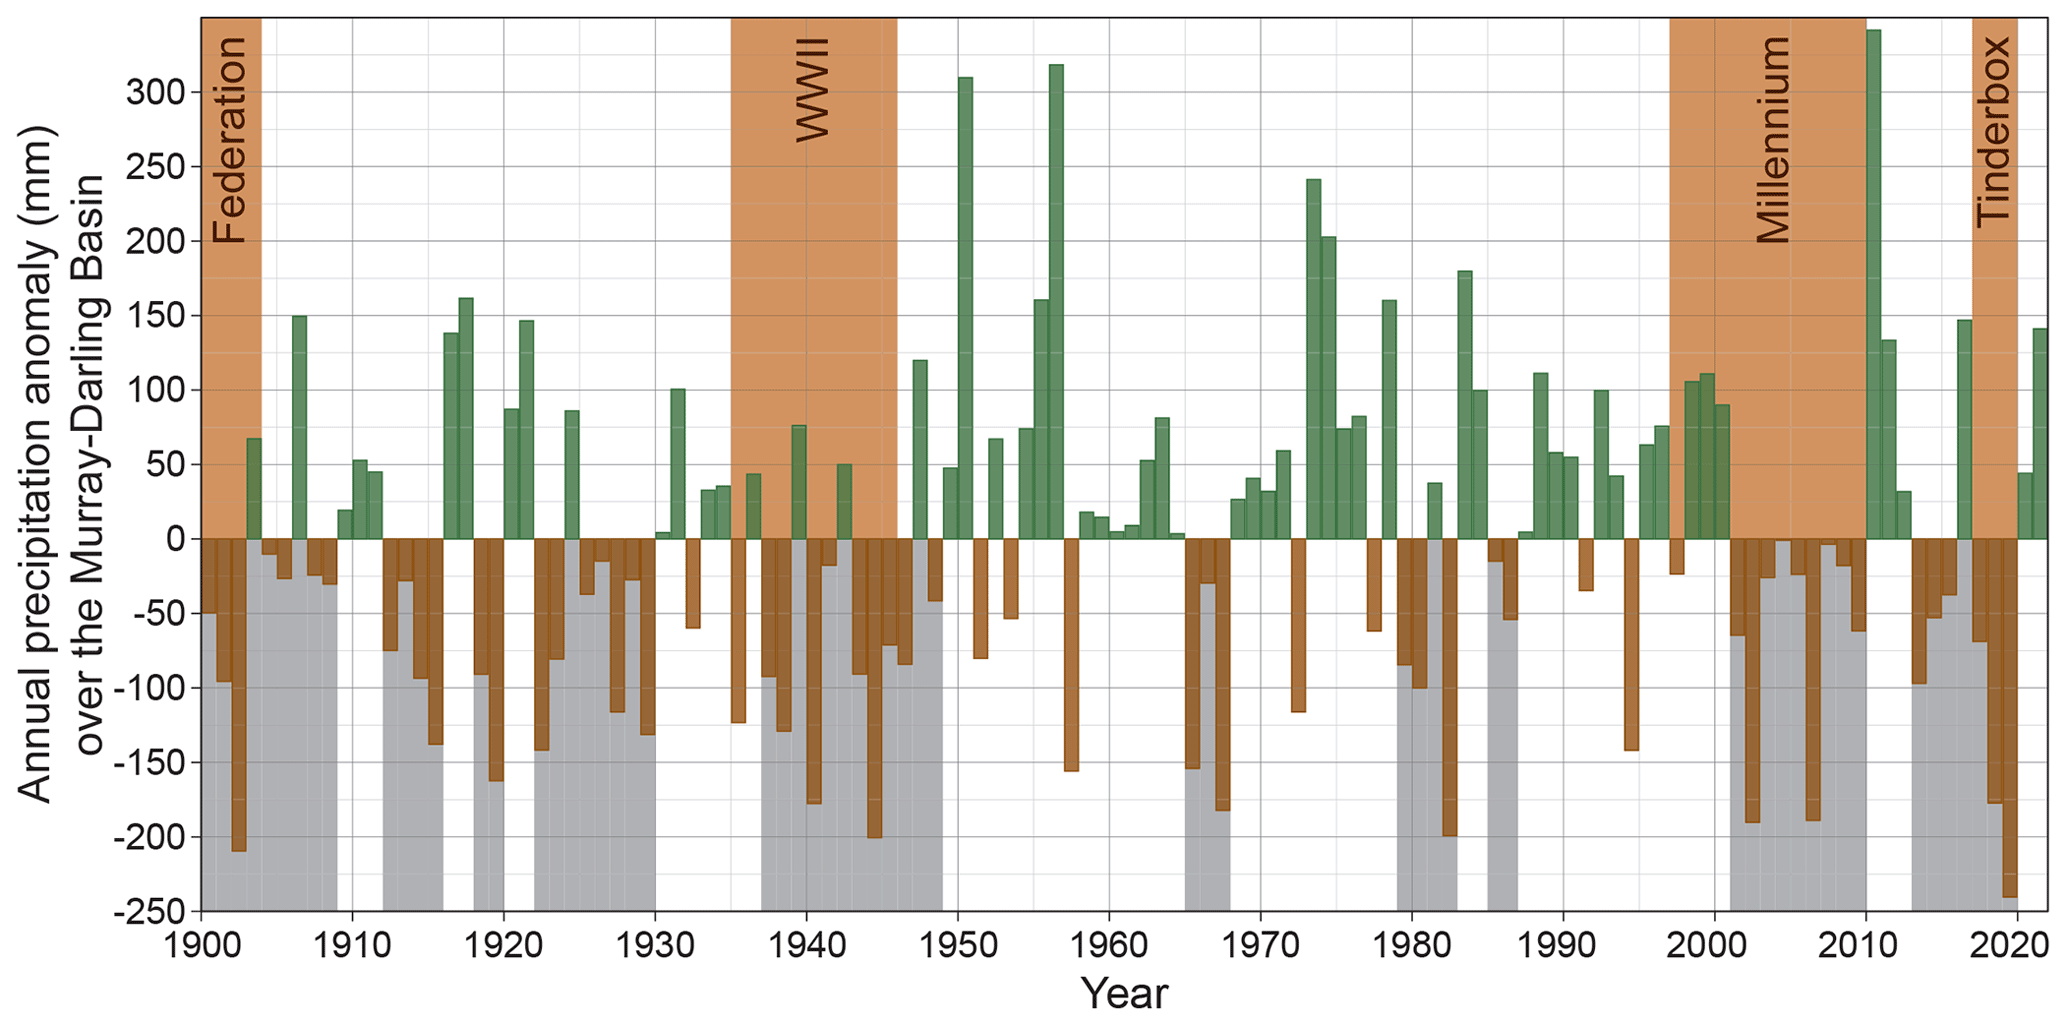
Figure 1Area-averaged observed annual precipitation anomalies over the Murray–Darling Basin (MDB) for 1900–2022. Anomalies are relative to the entire interval. Orange shading shows historical MDB droughts mentioned in the text. Grey shading shows droughts identified by the “2S2E” method (see Sect. 2.3.1).
2.3.2 Drought metrics
We characterised multi-year drought variability in observations and models using the following drought metrics: (i) length, (ii) relative intensity, (iii) relative severity, (iv) frequency, and (v) percentage of time spent in drought (Table 2). Drought length is the number of years of each drought, with the minimum drought length being 2 years. Drought intensity is the average yearly deviation from the climatology during drought events. Due to differences between models, we show drought intensity as a relative precipitation deficit (%) rather than an absolute deviation. For example, 0 % represents the climatological mean precipitation and 100 % represents zero precipitation. Drought severity is the cumulative deviation from climatology during the drought and is calculated by multiplying the relative intensity by the length. For example, a value of 200 % represents a total deficit equal to 2 years of mean precipitation. Drought frequency is the number of drought events during a given time period. For ease of comparison between the 20th century and the pre-industrial last millennium, we express drought frequency as the average number of droughts per 100 years. Percentage of time spent in drought is the total number of years spent in drought per 100 years.
We calculated drought metrics on a per-model basis for (a) their pre-industrial last millennium simulations (piLM; 850–1849) and (b) the 20th-century (1900–2000) component of their historical simulations (HIST). We calculated the same metrics for the AWAP gridded observational product (1900–2000 only). For observations and the HIST as well as piLM simulations, we used the 1900–2000 climatology for calculation of precipitation anomalies. Note that although the models' historical simulations extend back to 1850, we truncated these simulations to the 20th century to match the time period of the available observational data from AWAP.
In order to determine if any signals might have arisen without external forcing, we also calculated drought metrics on each model's pre-industrial control simulation (“piControl”). For the piControl simulations, we used the long-term piControl mean as a climatological base period for calculation of precipitation anomalies. The piControl simulations are run for many years with external forcings fixed at pre-industrial values (i.e. those appropriate for the year 1850). As the length of models' piControl runs varies across the models (Table 1), we only analysed the last 500 years from each.
In the main text we report multi-model ensemble-mean values for each drought metric for the HIST, piLM, and piControl simulations. Analyses were performed at the native resolution of each model and regridded using a bilinear interpolation into 2°×2° (latitude × longitude) resolution to calculate multi-model ensemble means. When calculating multi-model ensemble-mean values, to take into account the higher number of ensemble members in CESM-LME, we first took the mean value for all fully forced CESM-LME members and then incorporated the CESM-LME mean into the multi-model ensemble mean. For easier visual comparison, in the main text we show observational data (AWAP) on the same 2°×2° (latitude × longitude) grid. To assess the skill of individual models in reproducing each drought metric, we calculated spatial correlations between observations and HIST simulations for the 1900–2000 period, using AWAP regridded to the same resolution of the model in question.
We calculated arithmetic multi-model means rather than weighting the models according to the spatial correlations. Evidence from future projections suggests that weighting for model performance does not necessarily produce better projections (e.g. Abramowitz et al., 2019). Additionally, weighting can lead to results that are heavily weighted towards a small number of highly dependent models, and there is no universally agreed way to do such weighting (Eyring et al., 2019).
2.3.3 Comparing drought metrics in the pre-industrial era versus the 20th century
To assess whether the drought metrics were different under pre-industrial and industrial-era radiative forcing conditions, for each drought metric we subtracted the multi-model ensemble-mean piLM values from the multi-model ensemble-mean HIST values. To determine whether or not 20th-century values are significantly different from the pre-industrial last millennium, we performed t tests for each grid cell, comparing the distributions formed by the individual model values for the piLM and HIST simulations. We adjusted the p values to account for multiple comparisons (Benjamini and Hochberg, 1995).
2.3.4 Drought metrics in the Murray–Darling Basin
To explore multi-year drought variability specifically in the MDB, we calculated the same drought metrics (Table 2) for MDB area-mean precipitation. To determine which models perform the best in simulating multi-year drought characteristics in the MDB, for each metric we calculated the percent bias compared with observations in the 1900–2000 period. We then summed the absolute percent bias values and ranked the models from lowest to highest total bias. Given that the longest droughts are likely to be of interest for adaptation planning, we also calculated the relative severity of the longest single drought occurring in the MDB, for the HIST, piLM, and piControl simulations of each model, that is, the precipitation deficit during the longest drought relative to what would have been expected from average precipitation during that time period.
To assess the role of individual radiative forcings on MDB drought occurrence, we examined drought occurrence in full- and single-forcing CESM-LME members, and compared this with the radiative forcing associated with solar, volcanic, and well-mixed greenhouse gas forcing (Schmidt et al., 2012). For this analysis, for each full- and single-forcing sub-ensemble, we calculated the proportion of sub-ensemble members in drought in each year and compared this to the relevant forcings. For example, for the four-member, volcanic-only, single-forcing sub-ensemble, if no ensemble members are in drought in a particular year, then the proportion is 0. If all four ensemble members are in drought, then the proportion is 1. If a particular forcing influences drought occurrence, then we would expect changes in that forcing to coincide with periods of strong intra-ensemble agreement.
We further assessed the potential for external forcing of droughts in the MDB by examining the periods of highest agreement across the entire 30-member CESM-LME (all full- and single-forcing ensemble members). For this test we aggregated the time periods when most (>67 %) ensemble members were in drought at the same time, or most (>60 %) ensemble members were not in drought at the same time. Co-occurrence of droughts across different ensemble members would potentially indicate an externally forced component to drought occurrence. The cut-offs for the two categories were the 10th and 90th percentiles of all possible percentages of ensemble members in drought at the same time. We show the distribution of values of external radiative forcings (well-mixed greenhouse gases, volcanic aerosols, solar irradiance, and land use and/or land cover changes) applied to the models for each year in these two categories to test the significance of external forcing in promoting drought conditions (or non-drought conditions) over the MDB.
We also assessed the influence of simulation length on the difference between MDB drought metrics in the pre-industrial last millennium versus the 20th century. Hence, the question: to what degree does the fact that the lengths of the piLM simulations (1000 years) and HIST simulations (101 years) differ affect any disparity between drought metrics in the two time periods? To assess this, for each model, we randomly sampled 500 101-year segments from the 1000-year-long piLM simulations to create 500 distributions of possible values for each drought metric, all under past1000 forcing conditions. We then compared these distributions with the metrics calculated from the full piLM simulations.
2.3.5 Return period of multi-year droughts in the Murray–Darling Basin
In each model's piLM simulation, we calculated the return period of multi-year droughts in the MDB. The return period is the inverse of the exceedance probability, which is calculated in the following way:
where N is the total number of years and i is the rank of the event (with droughts ranked from shortest to longest).
3.1 Evaluation of climate models' precipitation variability
We first evaluated model skill in capturing observed precipitation variability at annual timescales. The observed spatial mean annual precipitation (MAP) pattern is characterised by lower MAP in the continental interior (particularly in the south), increasing towards the coast, and with maximum MAP at the northeastern edge of the continent and western Tasmania (Fig. 2a). Spatial variability in MAP from model simulations compares well with observations in the 1900–2000 interval (mean spatial correlation (r) of 0.72). However, most models have a positive overall MAP bias (Fig. 3). Exceptions to this are CSIRO-Mk3l-1-2 and IPSL-CM5A-LR (negative overall bias). Mean state bias aside, spatial MAP variability in IPSL-CM5A-LR is the most similar to observations (r=0.92), while FGOALS-s2 is the least similar (r=0.56). All spatial correlations are significant (p≪0.01). The spatial patterns in MAP biases vary by model, but they tend to overestimate MAP in the arid interior. Any areas of underestimation tend to be along the coast (Fig. 3).
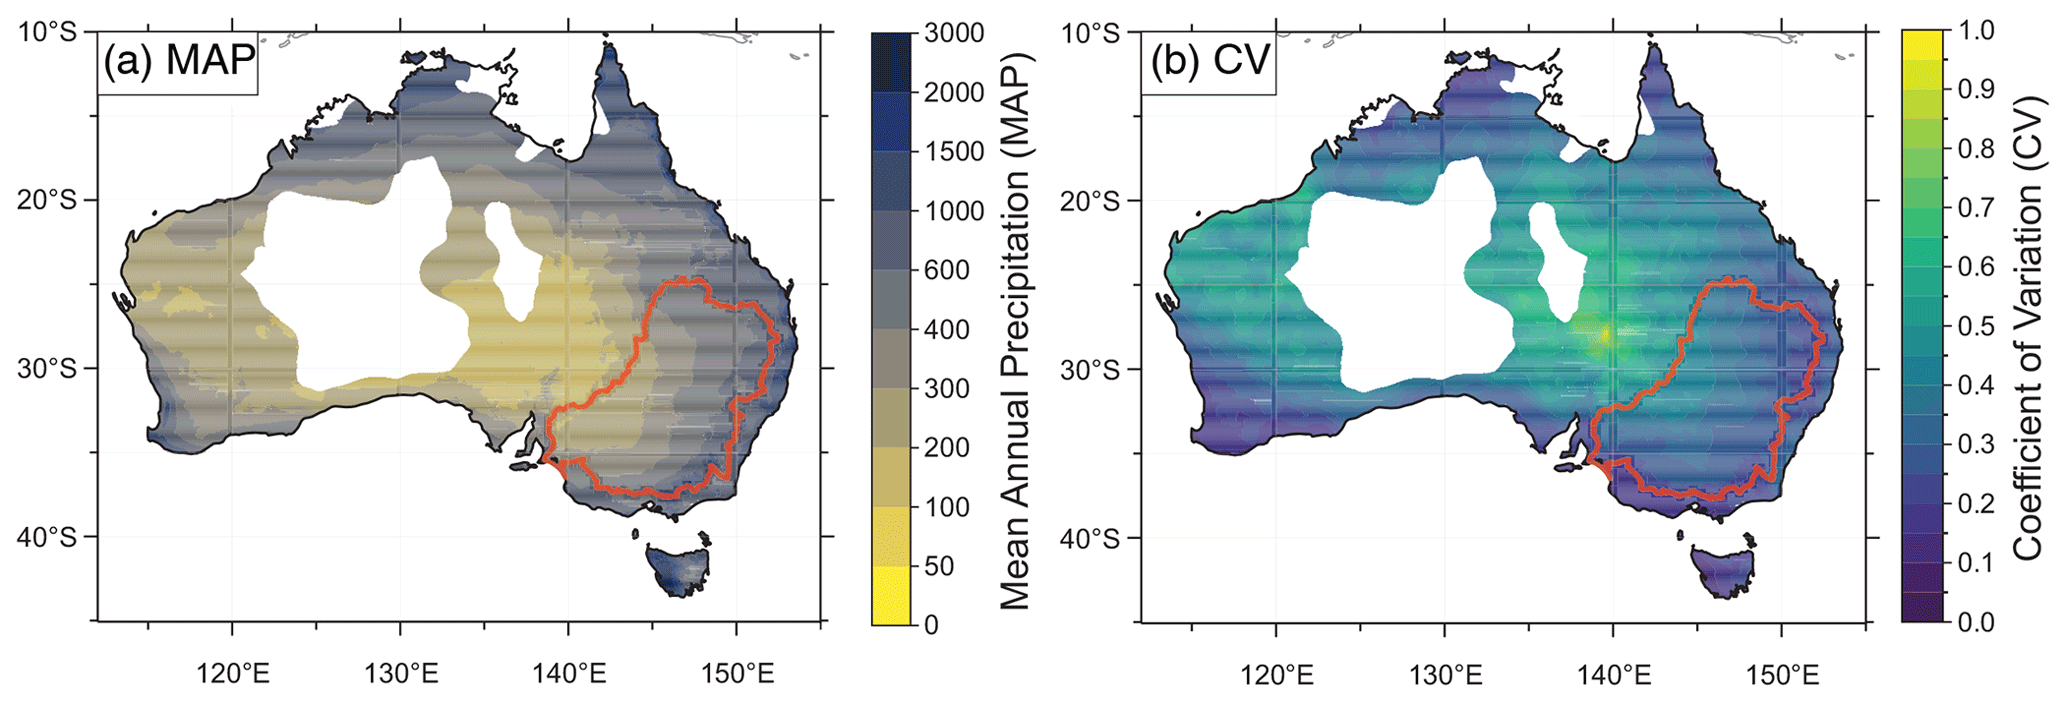
Figure 2Summary of spatial characteristics of Australian rainfall in terms of (a) mean annual precipitation (in mm yr−1) and (b) coefficient of variation. Data are from the Australian Water Availability Project, showing mean values for the 20th century (1900–2000). The Murray–Darling Basin is outlined in red.
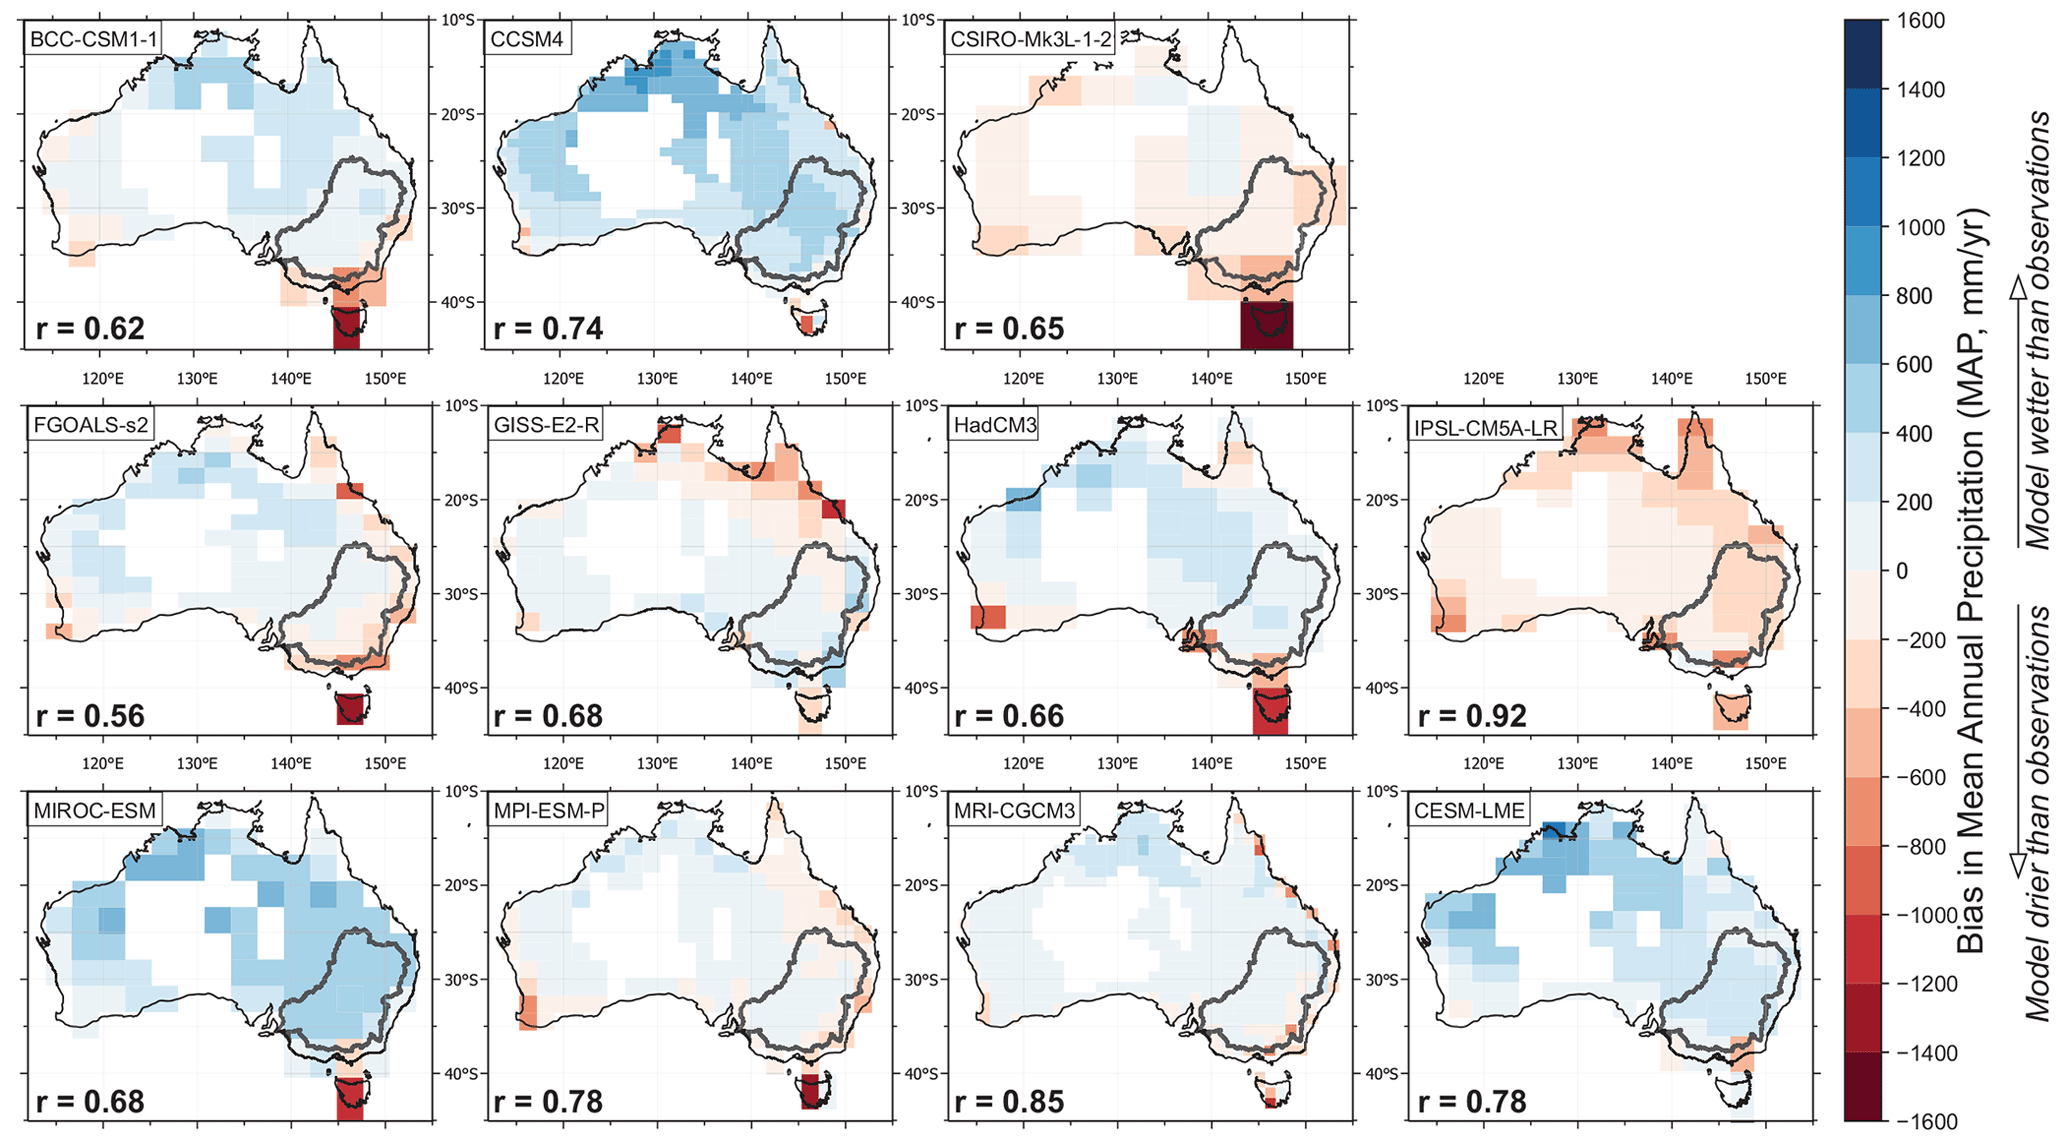
Figure 3Mean annual precipitation maps across PMIP3 simulations considered in this study (all panels except bottom right), and CESM-LME ensemble mean (bottom right panel) for the 20th century (1900–2000). The Murray–Darling Basin is outlined in black. Maps show bias (in mm yr−1) relative to the Australian Water Availability Project (AWAP). Spatial correlations of each model with AWAP are shown in the bottom left corner of each panel. All correlations are significant (p<0.05).
The observed spatial coefficient of variation (CV) pattern is characterised by lower interannual precipitation variability (CV ≈ 0.1–0.3) along the coastline (particularly in the south and east), increasing to higher CV values inland where MAP is lower (Fig. 2b). All simulations show a broadly similar spatial pattern to observations (mean r=0.69), although most models underestimate the highest CV values observed in central Australia (Fig. 4). Most models have an overall negative CV bias, i.e. the model interannual precipitation variability is too low compared with the model MAP (Fig. 4). Exceptions to this are the models with a negative MAP bias (CSIRO-Mk3l-1-2 and IPSL-CM5A-LR). Spatial variability in precipitation CV in IPSL-CM5A-LR and MRI-CGCM3 is the most similar to observations (r=0.88), while the CESM-LME mean is the least similar (r=0.48; individual LME members range 0.42–0.55). All spatial correlations are significant (p≪0.01).
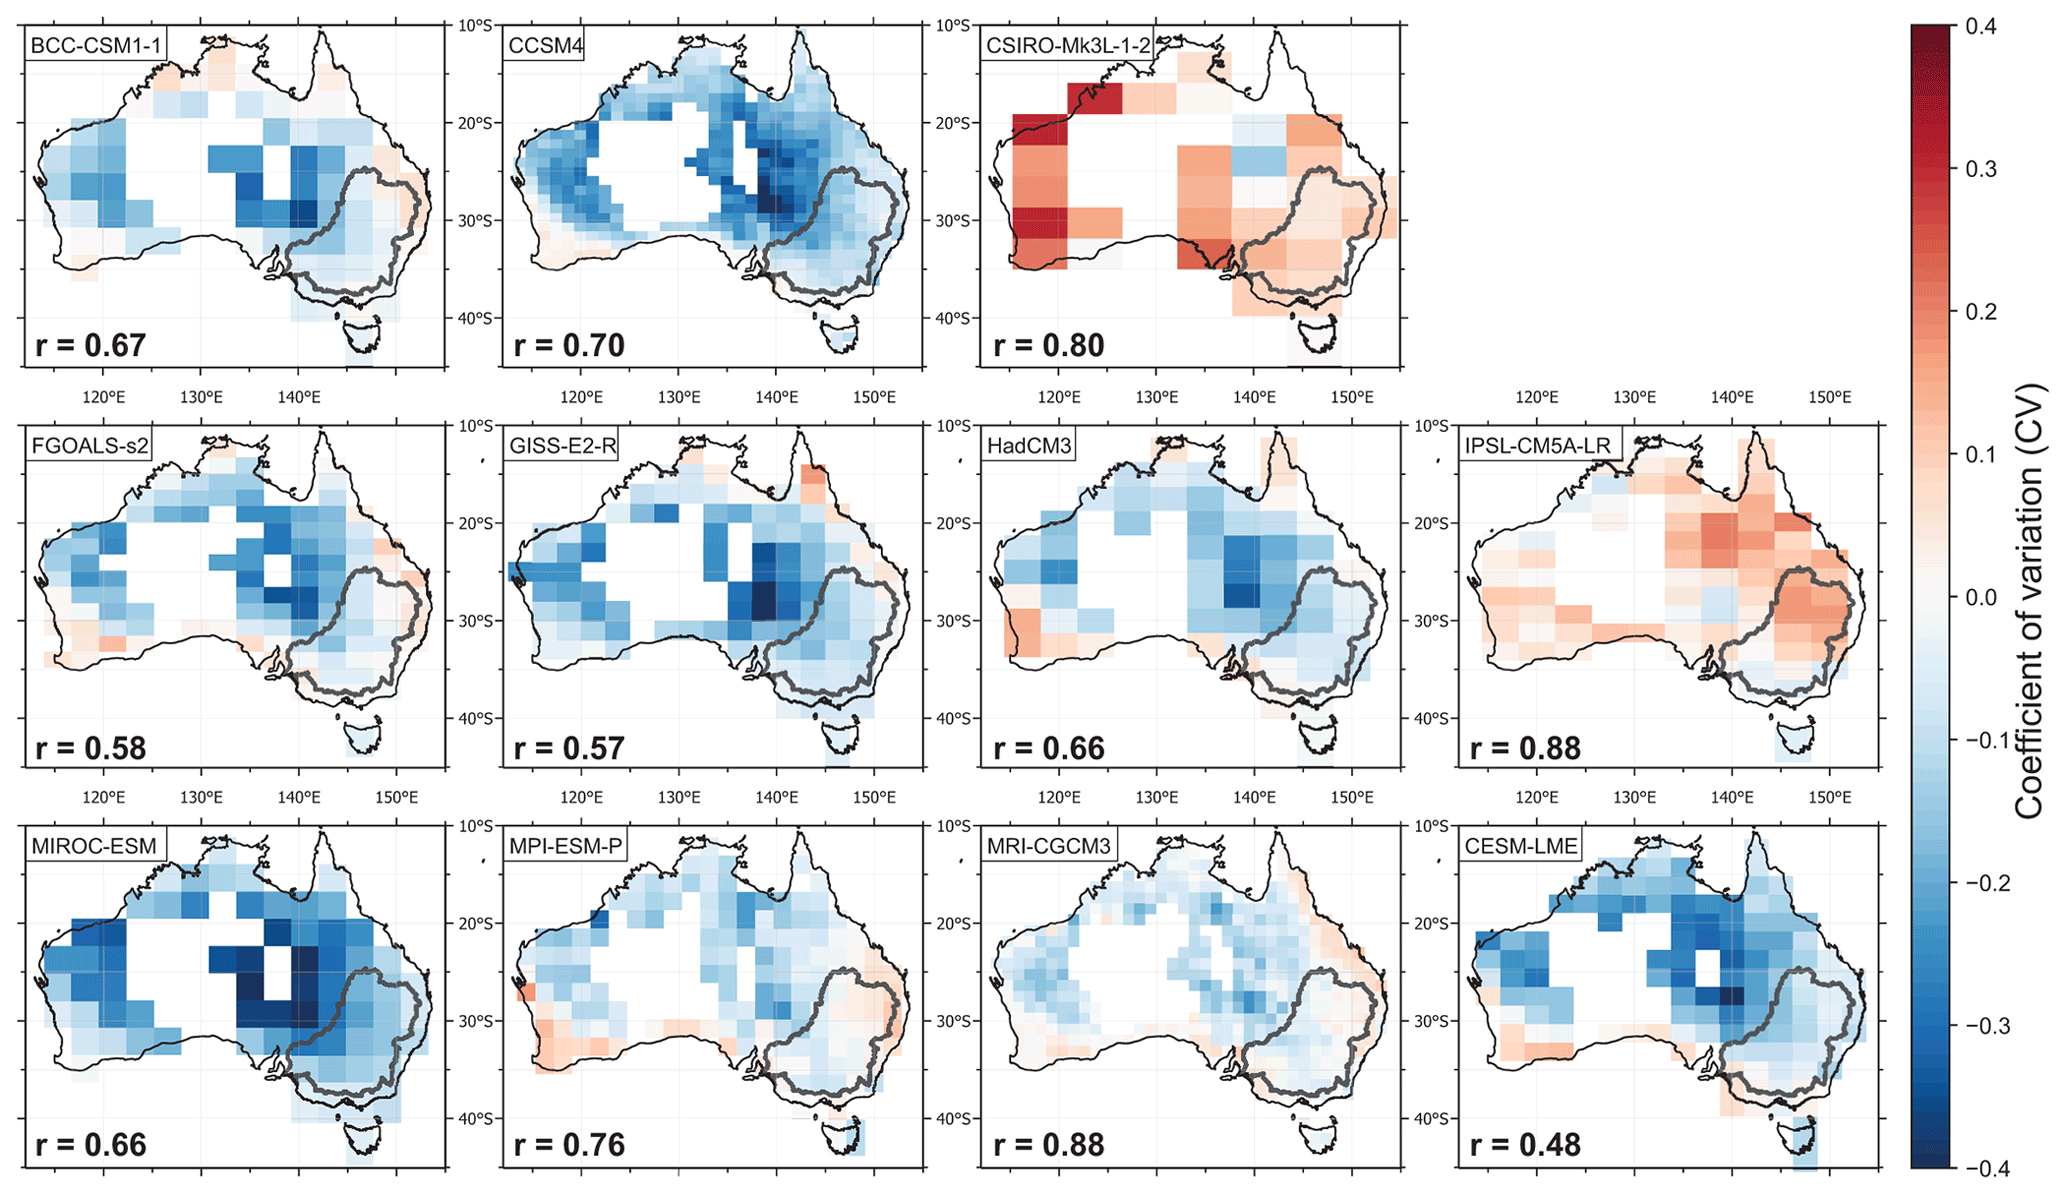
Figure 4Coefficient of variation maps across PMIP3 simulations considered in this study (all panels except bottom right), and CESM-LME (bottom right panel) for the 20th century (1900–2000). The Murray–Darling Basin is outlined in black. Maps show bias relative to the Australian Water Availability Project (AWAP). Spatial correlations of each model with AWAP are shown in the bottom left corner. All correlations are significant (p<0.05).
Together, MAP and CV provide insight into the models' ability to simulate annual precipitation variability. The models' overall skill in simulating spatial and temporal precipitation variability relative to their own means suggests that they provide a plausible representation of Australian precipitation, despite overall bias in mean MAP across the continent, and generally too-low interannual variability.
Evaluation of climate models' precipitation variability: Murray–Darling Basin
Model skill in capturing observed precipitation variability over the Murray–Darling Basin is very similar to model skill over the entire continent. Most models have a positive overall MAP bias (Fig. 3). Exceptions to this are CSIRO-Mk3l-1-2 and IPSL-CM5A-LR (negative overall bias). Although most models slightly underestimate precipitation CV in the MDB, the spatial CV patterns are reproduced fairly well (Fig. 4).
3.2 Characteristics of droughts across Australia
3.2.1 Observed characteristics of Australian multi-year droughts
Observed mean multi-year drought length across 1900–2000 varies from 4 to 5 years along the eastern parts of Australia to over 10 years in parts of central and western Australia (Fig. 5a). The longest observed multi-year drought varies between ∼8 and 20 years across Australia during the 20th century (Fig. 5e). In general, observed drought relative intensity and severity are lower along the northern, eastern, and southern Australian coastlines, then increase inland and towards the west coast (Fig. 6a and e). There is considerable spatial variation in observed drought frequency between 1900 and 2000, with eight or more multi-year droughts occurring in the MDB and across eastern Australia, and only about five multi-year drought events in parts of northern and central–western Australia (Fig. 7a). Although there are fewer discrete droughts per 100 years in central–western Australia, the overall proportion of time spent in drought is greater than in the southeast (Fig. 7e), due to the greater mean drought length.
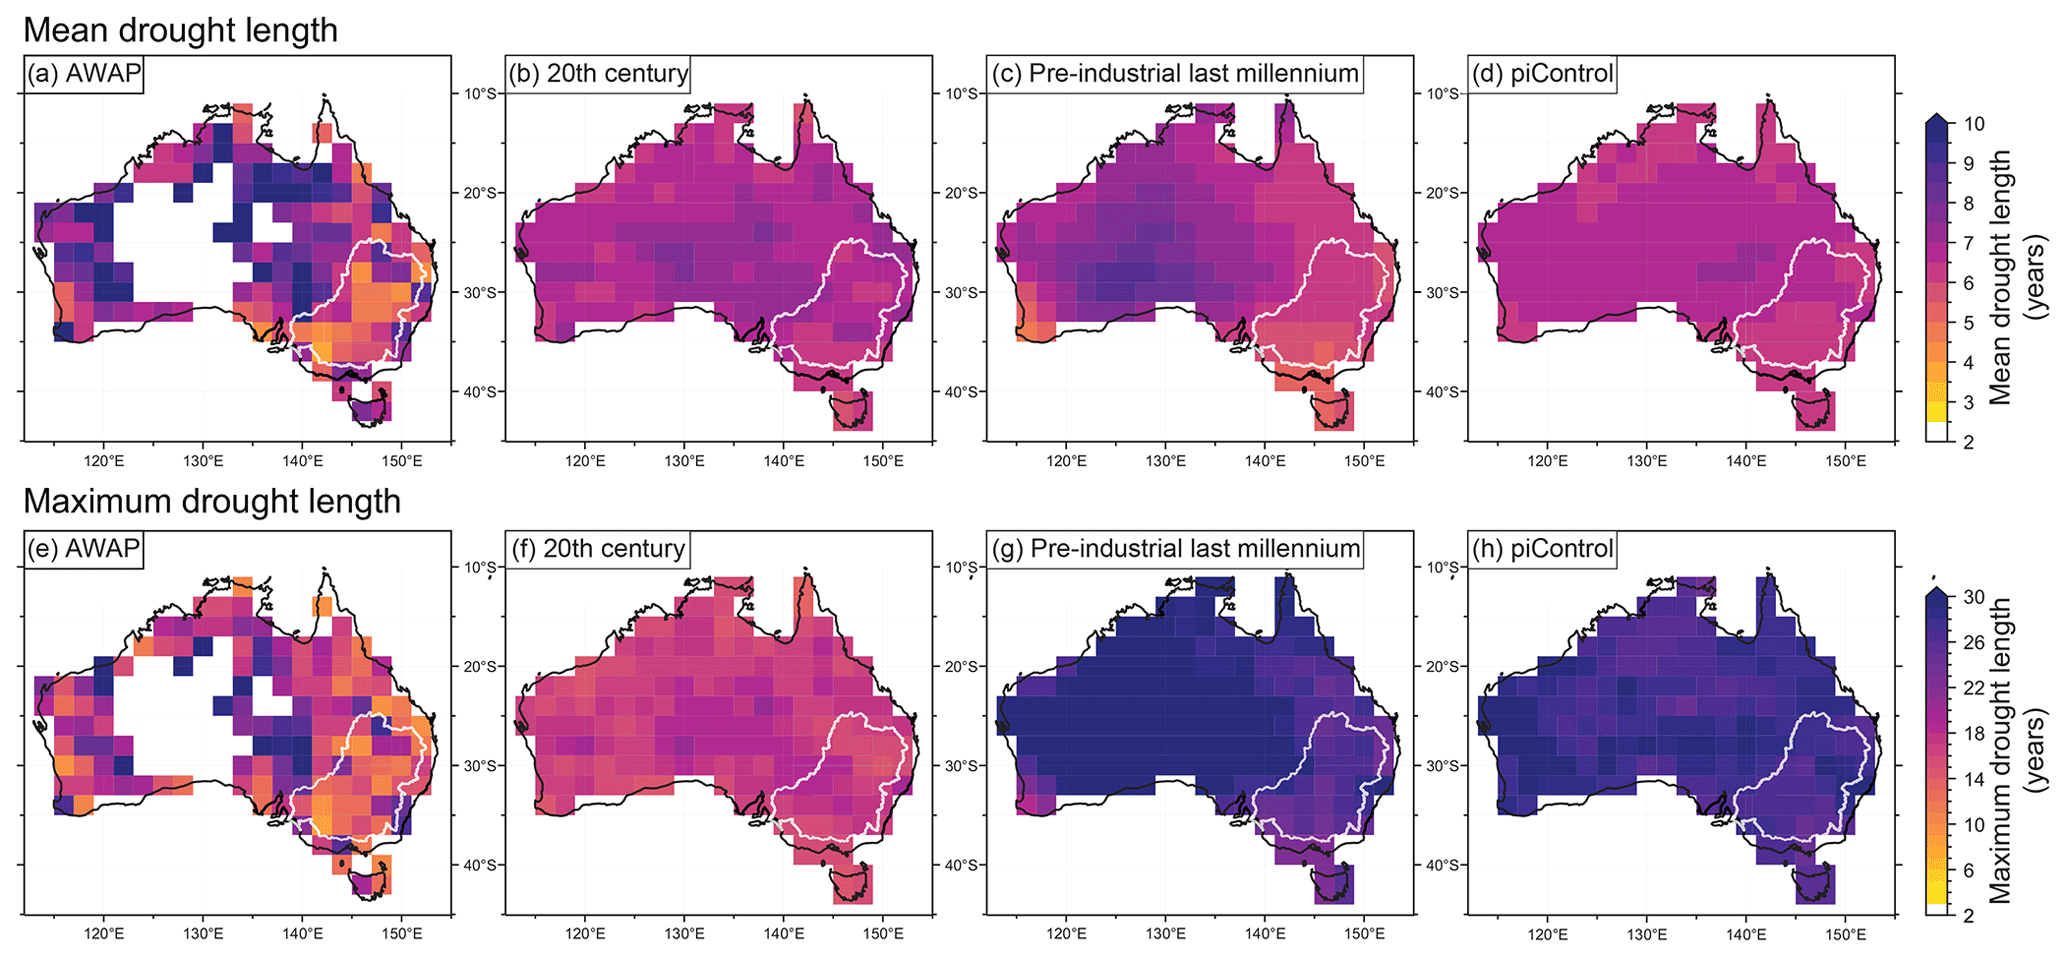
Figure 5Summary of mean (a–d) and maximum (e–h) multi-year drought length in observations (a, e); and multi-model ensemble means in the 20th century (1900–2000) (b, f), pre-industrial last millennium (850–1849) (c, g), and piControl simulations (d, h). White outline shows the Murray–Darling Basin.
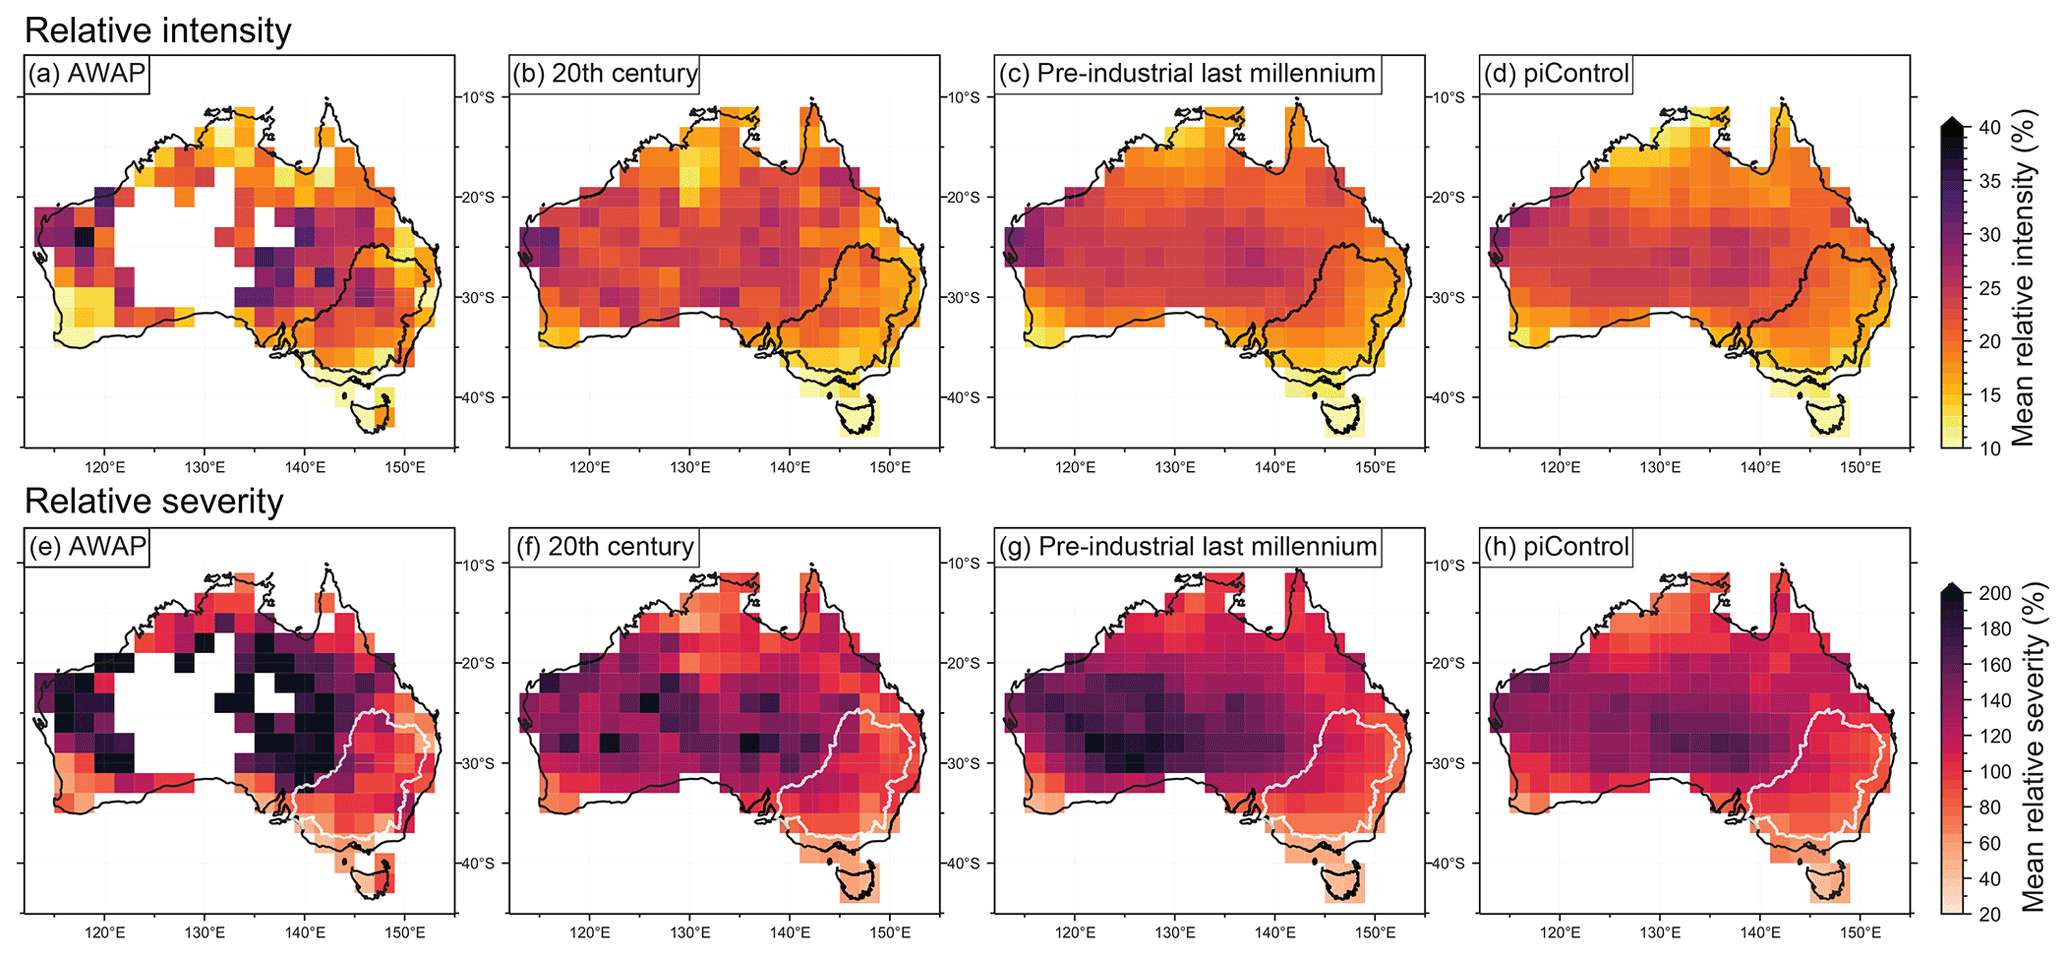
Figure 6Relative intensity (a–d) and severity (e–h) of multi-year droughts in observations (a, e); and multi-model ensemble means in the 20th century (1900–2000) (b, f), pre-industrial last millennium (850–1849) (c, g), and piControl simulations (d, h). Relative intensity is reported relative to the individual models' 1900–2000 precipitation mean. Relative severity is relative intensity multiplied by drought length. Outline shows the Murray–Darling Basin.
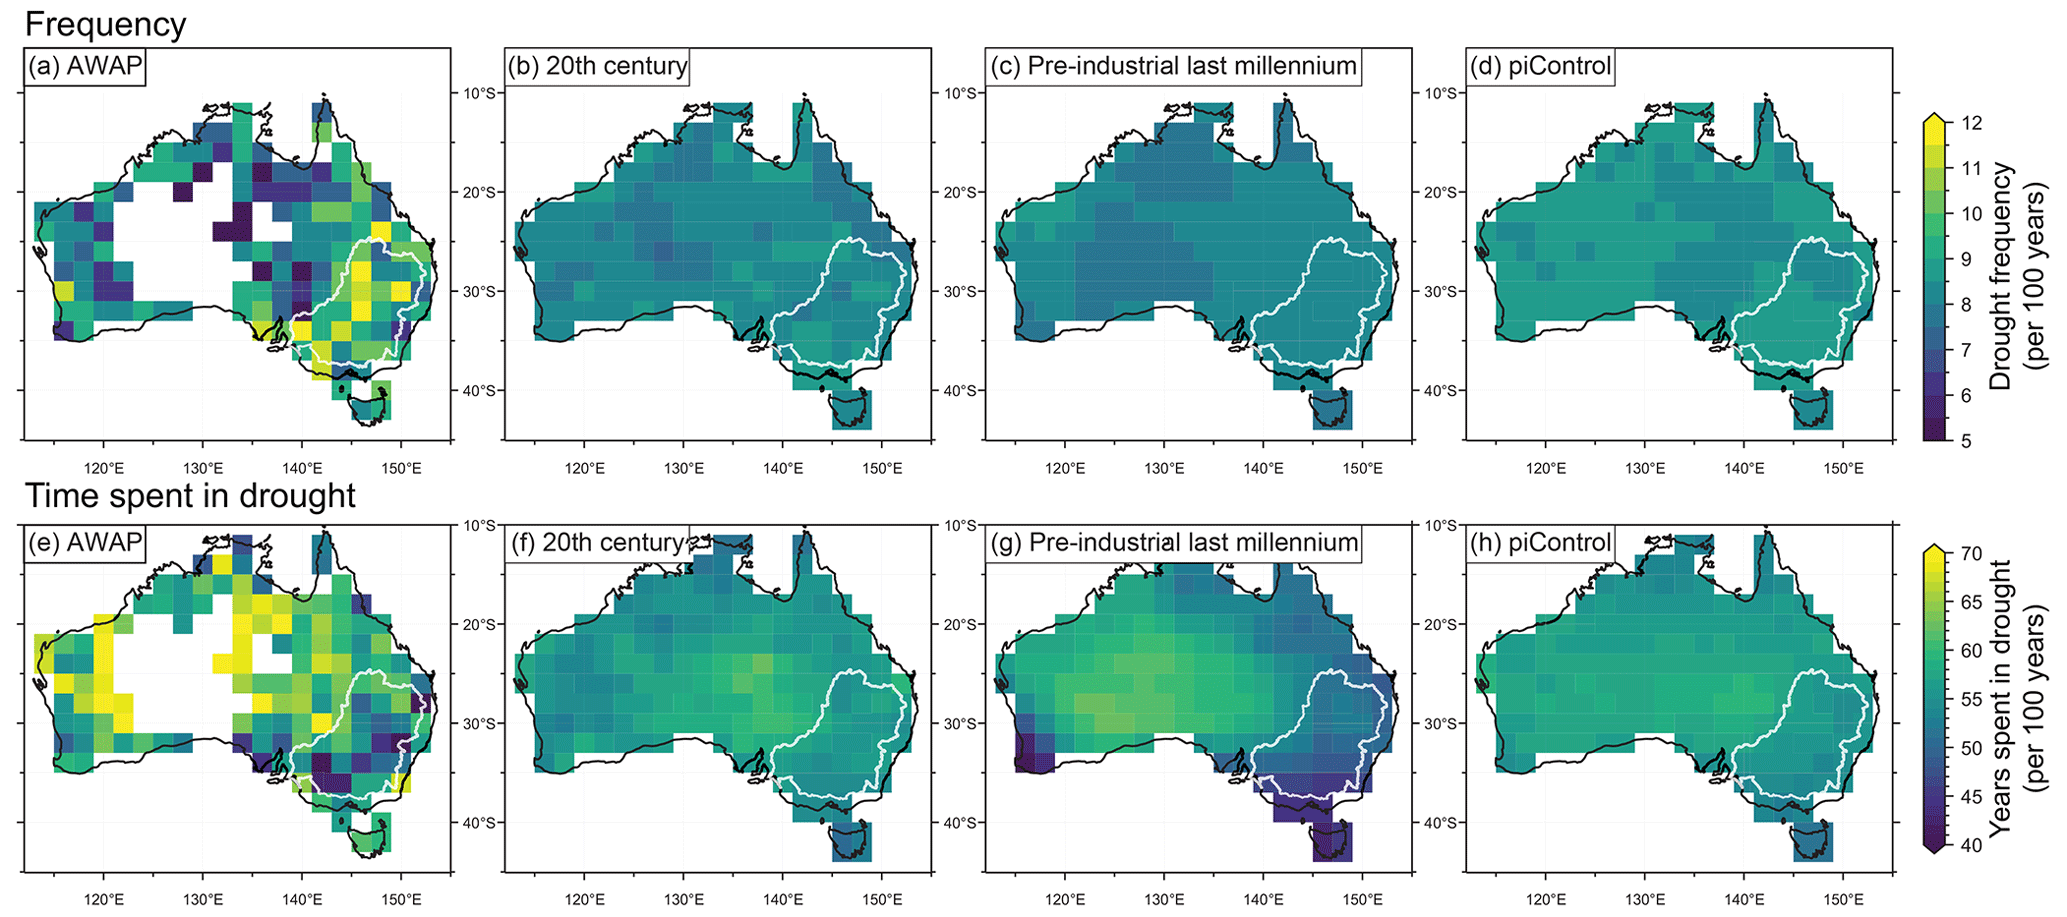
Figure 7Frequency (a–d) and number of years spent in drought (e–h) per 100 years in observations (a, e); and multi-model ensemble means in the 20th century (1900–2000) (b, f), pre-industrial last millennium (850–1849) (c, g), and piControl simulations (d, h). White outline shows the Murray–Darling Basin.
3.2.2 Characteristics of Australian multi-year droughts in model simulations of the 20th century
In the multi-model mean, the 20th-century simulations show less spatial variability in mean and maximum drought length (Fig. 5b and f) and frequency (Fig. 7b and f) than observed spatial variability, with lower values particularly in inland areas. However, the low spatial variability in the multi-model mean largely arises from the averaging-out of the individual members which show a lack of consistent spatial patterns across ensemble members (Figs. S1, S2, S5, and S6 in the Supplement). This is likely in part due to the high contribution of random variability to patterns produced in the short 101-year datasets, that is, the short time period hinders accurate characterisation of climatological patterns characterising multi-year droughts. This is also a likely contributor to the low spatial correlations between the models and observations across the 20th century (Figs. S1–S6). While the spatial patterns vary across individual models, the drought length and frequency are of a similar magnitude to those of observations. In the multi-model mean, the simulations also suggest spatial patterns and magnitudes similar to those of observations in drought intensity and severity (Fig. 6b and f).
3.2.3 Characteristics of Australian multi-year droughts in model simulations of the pre-industrial last millennium, and pre-industrial controls
Across all drought metrics, spatial patterns of variability in the piLM and piControl simulations broadly resemble the structure that is evident in 20th-century observations (Figs. 5–7a and e compared with Figs. 5–7c, d, g, and h). Individual model ensemble members also show spatial variability across all drought metrics in the pre-industrial last millennium (Figs. S7–S12). In individual ensemble members, spatial patterns also generally have more structure in the piLM (Figs. S7–S12) and piControl (Figs. S13–S18) simulations than the HIST simulations. In the case of both the multi-mean means and the individual simulations, this is likely because the greater length of the piLM and piControl simulations lessens the contribution of random variability and enhances climatic features.
The piLM and piControl simulations clearly demonstrate that Australian droughts can be much longer than what was observed in the 20th century (Fig. 5g and h versus Fig. 5e and f). This finding is common across all individual ensemble members (Fig. S2 versus Fig. S8).
For other drought metrics, the realistic spatial patterns in the past1000 ensemble means mask notable differences in spatial patterns between individual ensemble members. Across the ensemble of models used here, IPSL-CM5A-LR and MPI-ESM-P are most commonly skilful in representing the spatial pattern of observed drought characteristics in Australia (r values in Figs. S1–S6h and j). In both of these models, mean drought length has tended to be longer in the 20th century than in the pre-industrial last millennium (Fig. S7h and j versus Fig. S1h and j), whereas drought intensity is similar (Fig. S9h and j versus Fig. S3h and j). In IPSL-CM5A-LR (the most skilful on average), droughts are slightly more severe in the 20th century than in the pre-industrial last millennium, particularly in central and western Australia (Fig. S4h versus Fig. S10h). Drought frequency has minimal spatial variability in the piLM simulations of both models, suggesting that this is a feature of the long-term climate system (Fig. S11h and j). However, the proportion of time spent in drought is generally longer in the 20th century than in the pre-industrial last millennium in both models, particularly in southern and eastern Australia (Fig. S6h and j versus Fig. S12h and j).
3.3 Characteristics of droughts in the Murray–Darling Basin
Multi-year drought metrics were calculated from area-averaged annual precipitation over the MDB region to examine long-term drought characteristics for this region (Fig. 8). We analysed the results taking into account model performance. Overall, BCC-CSM1-1 performs the best across MDB drought metrics for the 20th century, with similarly good performance from HadCM3 and MRI-CGCM3 (Fig. S19). Total bias increases relatively sharply after MRI-CGCM3, with MIROC-ESM performing the worst overall for drought metrics in the MDB (Fig. S19).
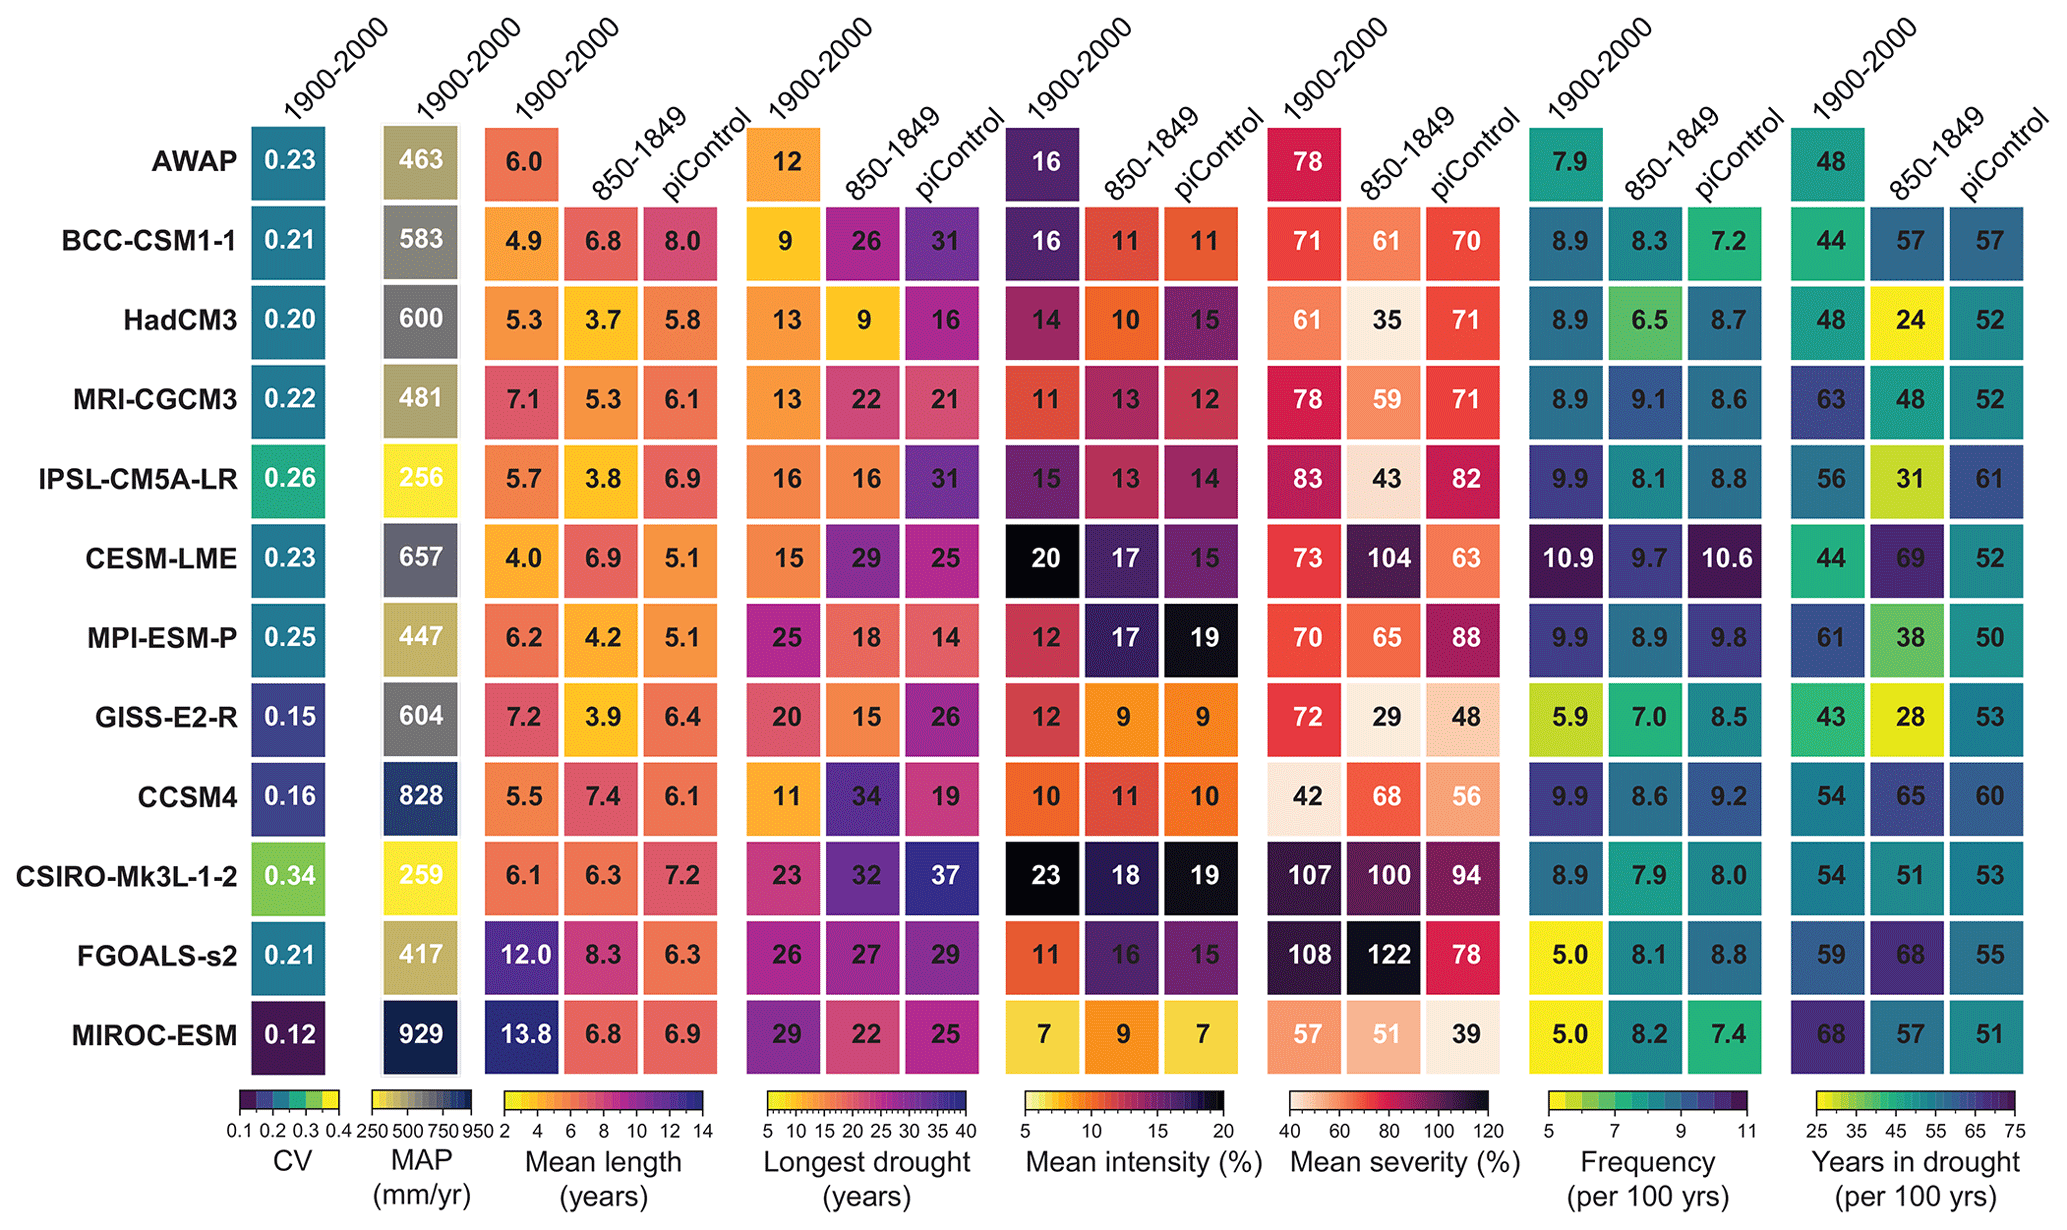
Figure 8Observed and modelled drought metrics for the Murray–Darling Basin. Summary of drought metrics for observations, individual PMIP3/CMIP5 simulations, and the CESM-LME mean, using area-averaged annual precipitation in the MDB. For each drought metric (aside from CV and MAP, which are used only to assess model skill), the first column shows metrics for the 20th century (1900–2000), the middle column shows metrics for the pre-industrial last millennium (850–1849), and the final column shows metrics for the piControl simulations. Models are ranked according to their summed percent bias across all drought metrics in the 20th century (ordered best to worst; Fig. S19).
Mean observed multi-year drought length in the MDB was 6 years during the 20th century (Fig. 8). A similar value of 7.1 years is found for the ensemble mean of the HIST simulations (range 4–13.8 years for individual simulations). Mean MDB drought length is also similar for the longer simulations, with 5.8 years (range 3.7–7.4 years) in the piLM simulations and 6.4 years (range 5.1–8 years) in the piControl. The longest observed drought in the MDB lasted 12 years (Fig. 8), which is comparable to the HIST maximum drought lengths, with a multi-model ensemble mean of 18.2 years (range 9–29 years). The mean for the three best-performing models is 11.7 years. Maximum drought length in both the piControl runs (mean 22.7 years; range 9–34 years) and the piLM simulations (mean 24.9 years; range 14–37 years) is longer than the longest drought of the 20th century, as was also evident in the full grids (Figs. S8 and S14 versus Fig. S2).
The relative intensity of 20th-century droughts in the MDB is similar in observations and HIST model simulations, with a mean observed relative drought intensity of 16 % and ensemble-mean simulated intensity of 13.8 % (range 7 %–23 %). Model ensemble-mean drought intensity in the piControl (mean 12.9 %; range 7 %–19 %) and piLM (mean 13.1 %; range 9 %–18 %) simulations is also very similar to that of the 20th century. Mean drought severity is also similar across observations (78 %), the HIST simulations (mean 79 %; range 42 %–107 %), piLM simulations (mean 67 %; range 29 %–122 %), and piControl runs (mean 69 %; range 42 %–106 %). In the three best-performing models, drought relative intensity and severity are on average more intense/severe in the 20th century than in the pre-industrial last millennium.
Cumulative precipitation deficits during the single longest drought in each simulation vary by model (Fig. S20). The relative severity of the longest observed drought in the MDB is 152 %, with an ensemble-mean relative severity of 179 % for the longest drought in the HIST simulations. Model ensemble-mean drought severity for the longest drought of the piLM simulations is 181 %, and 208 % for the piControl simulations (Fig. S20), although note that the droughts vary in length from 9 to 34 years. In the piLM simulations particularly, there is high inter-model variability. The least severe drought (in BCC-CSM-1-1) lasts 26 years, with a slightly positive overall precipitation anomaly (the only drought shown on Fig. S20 where this is the case). However, the most severe drought (in CSIRO-Mk3L-1-2) is both long (32 years) and intense, with a severity of 523 %.
Both drought frequency and the total amount of time spent in drought are also similar across observations, as well as across the HIST, piLM, and piControl simulations. From observational data, the MDB experienced 7.9 multi-year droughts per 100 years, and spent 48 % of the time from 1900 to 2000 in drought. In model simulations of the same period, the MDB experienced on average 8.4 (5–10.9) multi-year droughts per 100 years and spent 54 % (43 %–68 %) of the time in drought. In the LM simulations, the MDB experienced on average 8.2 (range 6.5–9.7) multi-year droughts per 100 years and spent 48.8 % (24 %–69 %) of the time in drought. In the piControl runs, the MDB experienced on average 8.6 (7.5–10.6) multi-year droughts per 100 years and spent 54 % (50 %–57 %) of the time in drought.
3.3.1 Return period of MDB droughts
In most models, the maximum-length drought occurs only once, rather than having two or more droughts of the same (maximum) length. Hence, for many models, the longest drought has an estimated return period of around 1000 years (i.e. the length of the piLM simulations; Fig. S21). However, most models still simulate very long MDB droughts (10–20 years) with return periods of around 100–150 years. Exceptions to this are GISS-E2-R, IPSL-CM5A-LR, and MPI-ESM-P, which simulate 10- to 20-year droughts with return periods of >300 years, and HadCM3, which simulates a maximum drought length of 9 years (Fig. S21).
3.3.2 Influence of difference in simulation length on drought metrics
During the 20th century, individual ensemble members show a large magnitude of spatial variability in drought metrics over Australia, suggesting that the 101-year sample length may not be fully representative of drought conditions (Figs. S1–S6). In other words, the presence of random spatial variability, rather than well-defined spatial patterns, implies a large random element. In this context, this suggests that there are insufficient multi-year droughts in a 101-year sample for a climatological pattern to emerge. To examine this further, we resampled MDB area-mean precipitation in the piLM runs in 101-year increments and compared the distribution of values with the mean values for individual models' full piLM simulations for each metric. Figure S22 demonstrates that the 101-year time period is not representative of the full range of piLM drought variability. This means that individual 101-year segments do not capture the full range of variability represented by the 1000-year piLM period, with the magnitude of drought duration, intensity, severity, frequency, and proportion of time spent in drought varying markedly from one 101-year period to another. This means that selecting any single 101-year period (such as the historical period) is not representative of the full variability in the models' simulated precipitation (blue dots in Fig. S22). However, the results described in Sect. 3.3 are not majorly affected by this bias. With one exception, the median value of the distributions formed by the 101-year segments is very close to the mean value for the full piLM (black dots compared with boxplots in Fig. S22). The exception is maximum drought length, where few or none of the 101-year segments captured the longest possible drought of the full pre-industrial last millennium (Fig. S22b).
Although the median values of the distributions of values from the 101-year segments mostly match the long-term mean, there is large variability in the drought metrics across the shorter segments for most models (Fig. S22). This emphasises the value of longer simulations in determining the full range of possible drought conditions in Australia's MDB. This is a particularly important consideration for assessing drought risk based only on observational data and for determining any anthropogenically forced changes in drought in observations and model data that do not contain the full possible range of natural variability.
3.4 Possible anthropogenic influence on Australian multi-year droughts
We next assessed the potential role of anthropogenic climate change in influencing drought characteristics during the 20th century. In eastern Australia and southwestern Australia, droughts in the 20th century are on average longer and have a larger proportion of time spent in drought than in the pre-industrial last millennium (Fig. 9a and f). Specifically, in far southwestern Australia, droughts are significantly longer on average in the 20th century than in the pre-industrial last millennium (stippling in Fig. 9a). Droughts also tend to be more intense, more severe, and more frequent in the 20th century than in the pre-industrial last millennium in this region (although these differences are not significant). In parts of southeastern Australia, droughts are on average longer in the 20th century than in the pre-industrial last millennium, with droughts also occurring more frequently and having a higher proportion of time spent in drought (stippling in Fig. 9a, e, and f). In all regions, the longest 20th-century drought is still much shorter than the longest drought in the pre-industrial last millennium (Fig. 9b).
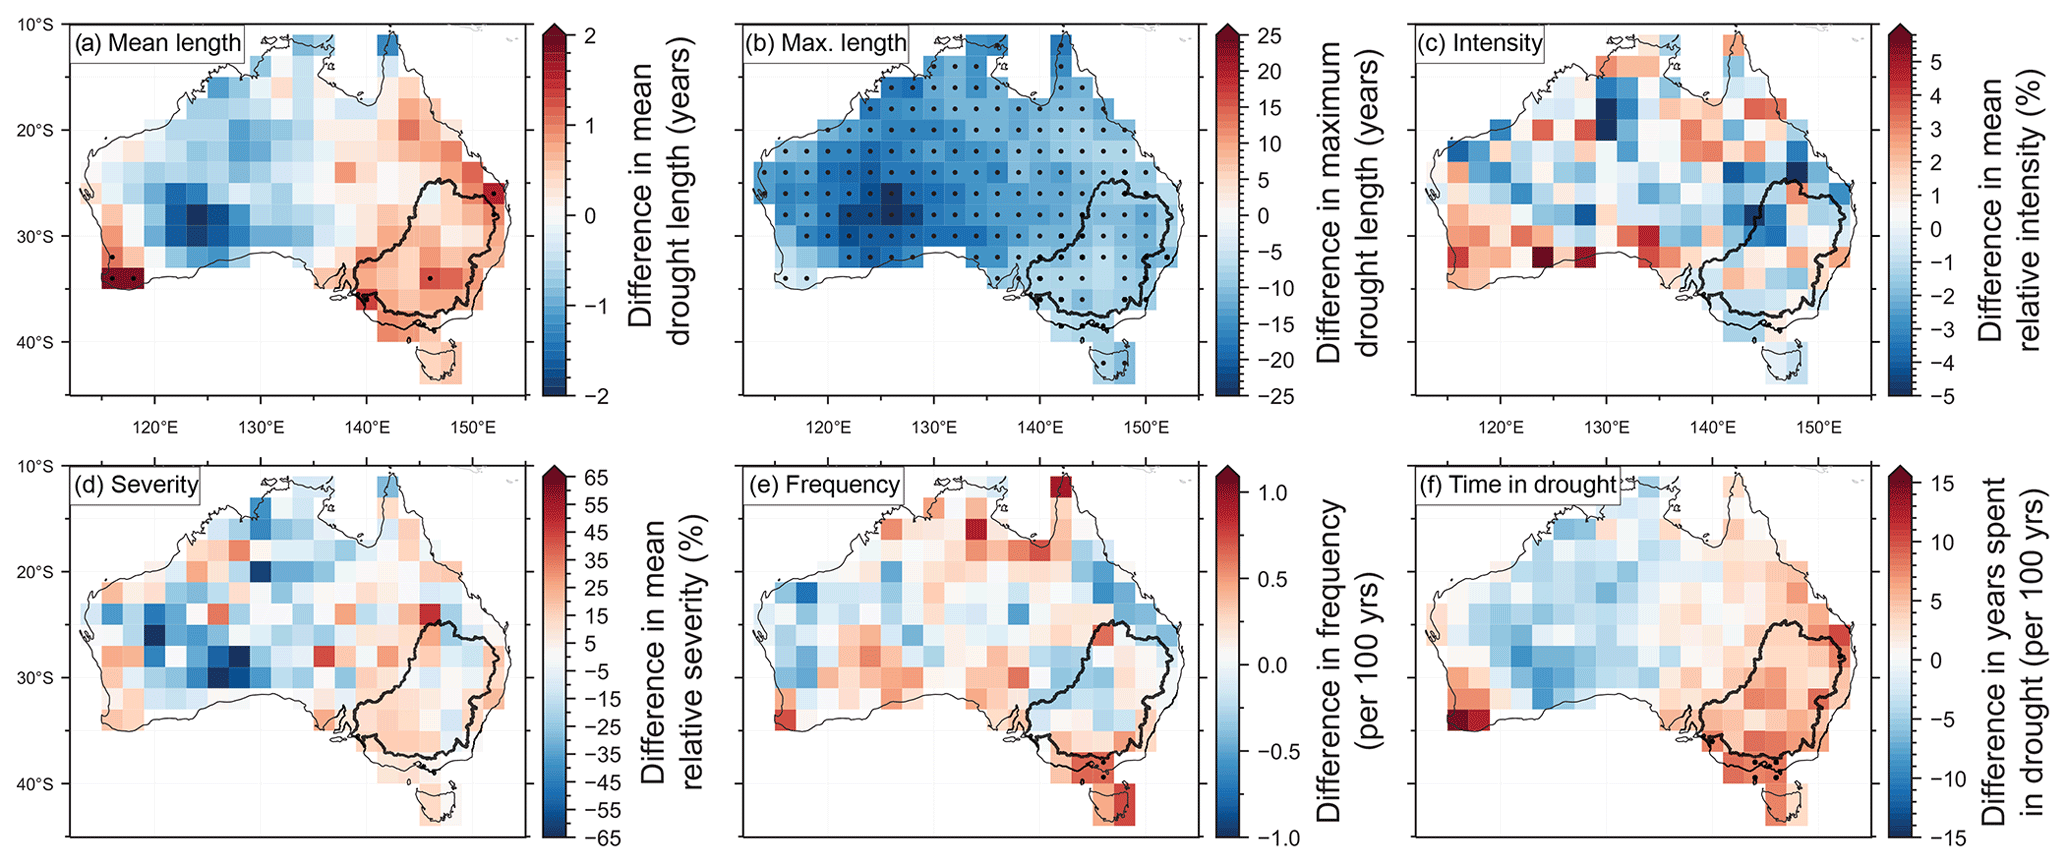
Figure 9Difference between the 20th century (1900–2000) and pre-industrial last millennium (850–1849) multi-model ensemble means for (a) mean drought length, (b) maximum drought length, (c) drought intensity, (d) drought severity, (e) drought frequency (droughts per 100 years), and (f) years spent in drought per 100 years. Reds denote that the drought metric is “worse” (longer, more intense/severe, more frequent, or more years are spent in drought) in the 20th century than in the pre-industrial last millennium. Blues denote that the drought metric is worse in the pre-industrial last millennium than in the 20th century. Stippling denotes that the 20th-century multi-model mean value is significantly different from the pre-industrial last millennium value (p<0.05). The p values have been adjusted to account for false discovery rates (Benjamini and Hochberg, 1995). The Murray–Darling Basin is outlined in black.
Accordingly, the only instance in which the HIST simulations diverge significantly from the LM simulations across a large area is for maximum possible drought length, where the longest droughts are uniformly much longer in the piLM than HIST simulations (Fig. 9b). This is unlikely to be due to the addition of anthropogenic forcings, but instead to the greater length of the piLM simulations which allow a more complete sampling of the full possible range of variability (Sect. 3.3.2). There is no significant difference between drought intensity and severity, in any part of Australia (Fig. 9c and d), in the 20th century versus the pre-industrial last millennium.
Forced droughts in the Murray–Darling Basin?
In the CESM-LME, most external radiative forcings (Fig. 10a) are not associated with periods of MDB drought agreement in the corresponding ensemble members (Fig. 10c, d, f, g, and h). The exception is volcanic forcing, where in the CESM-LME most ensemble members run with volcanic forcing are not in drought after large eruptions (Fig. 10b, c, and e). This is also clear in Fig. S23, where volcanic aerosol forcing is the only radiative forcing with a clear difference in values between periods when most CESM-LME ensemble members are in drought, and when most are not in drought. Specifically, when volcanic forcing is large, a low proportion of ensemble members are in drought (Fig. S23b).
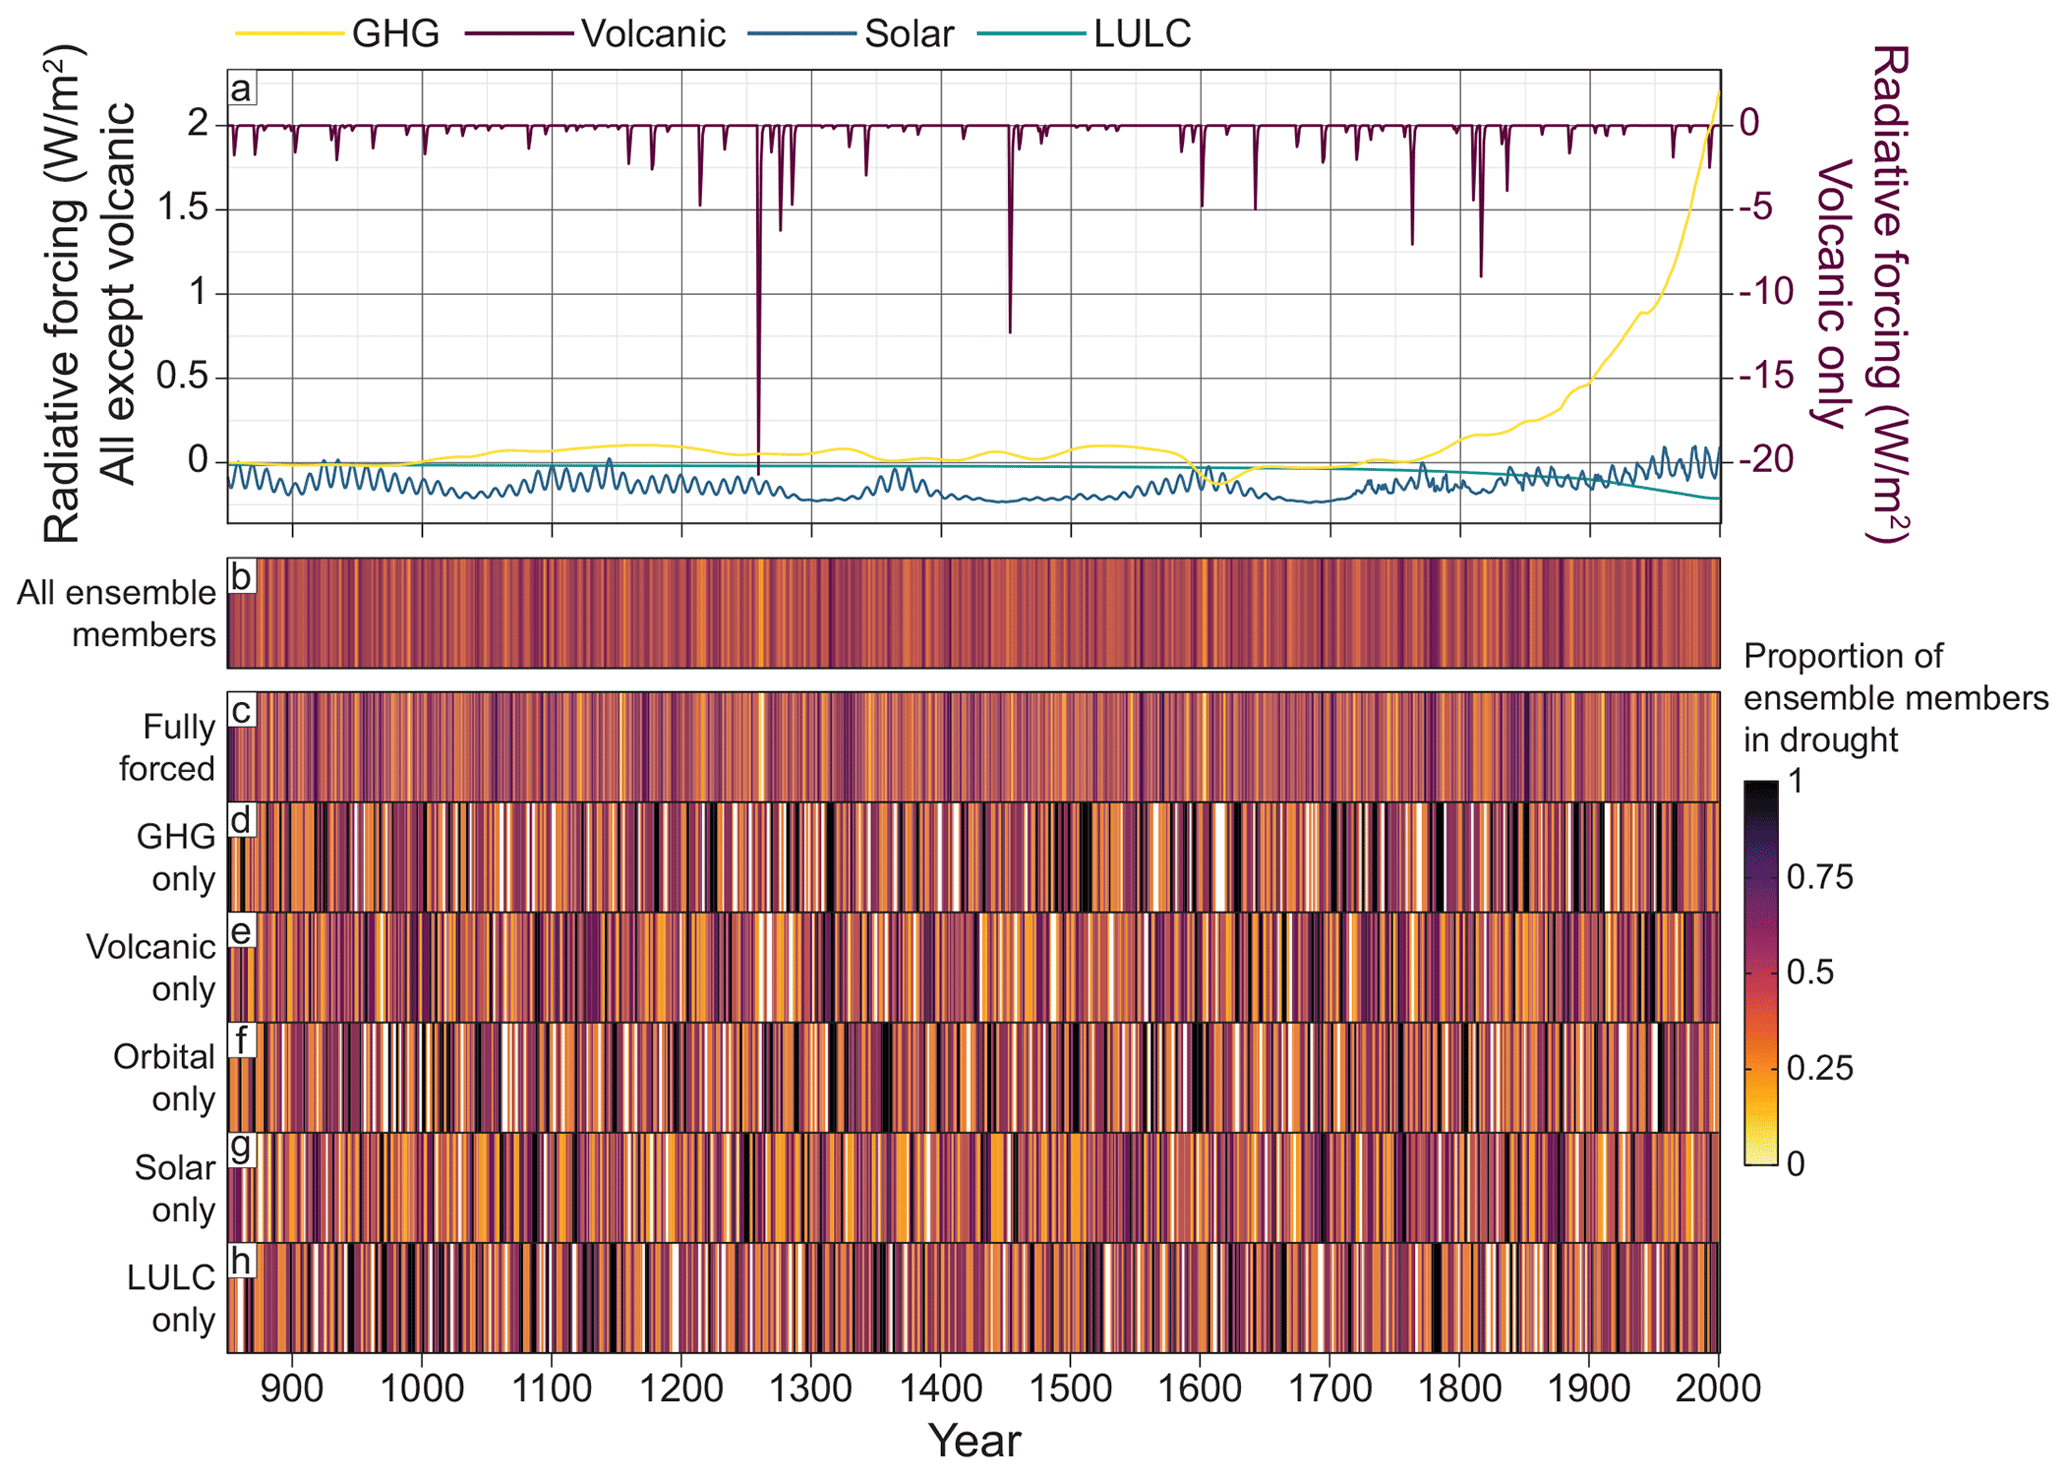
Figure 10Occurrence of multi-year droughts in the Murray–Darling Basin in each member of the CESM-LME: (a) radiative forcings applied to the CESM-LME (Schmidt et al., 2011, 2012); (b) proportion of all CESM-LME ensemble members (n=30) in drought throughout the full last millennium (850–2000); (c) proportion of fully forced CESM-LME ensemble members (n=13) in drought; (d) proportion of GHG-only CESM-LME ensemble members (n=3) in drought; (e) proportion of volcanic-only CESM-LME ensemble members (n=4) in drought; (f) proportion of orbital-only CESM-LME ensemble members (n=3) in drought; (g) proportion of solar-only CESM-LME ensemble members (n=4) in drought; (h) proportion of LULC-only CESM-LME ensemble members (n=3) in drought. In (b)–(h), the colours correspond to the proportion of full- or single-forcing sub-ensemble members that are in drought in each year. GHG: greenhouse gas; LULC: land use and/or land cover changes.
Overall, our results suggest that across most of the continent, Australian droughts had not changed substantially in the 20th century compared with model simulations of the pre-industrial last millennium. In particular, drought intensity and severity observed during 1900–2000 were similar to those from the pre-industrial last millennium model simulations. However, the simulations suggest that multi-year droughts in parts of southwestern and southeastern Australia have been longer on average in the 20th century than in the pre-industrial last millennium (Fig. 9a and f). Moreover, the maximum simulated drought length in long pre-industrial simulations is far longer than droughts Australia has experienced since commencement of widespread recording of monthly rainfall totals (Fig. 5e and f versus Fig. 5g and h). This is the case for both the forced (piLM) and unforced (piControl) simulations, suggesting that extremely long droughts of 20 years or more are a natural part of Australian hydroclimatic variability and do not necessarily require anthropogenic forcing. If a drought of this length were to happen today, it would have major societal and environmental implications beyond recent experience. Confidence in these results arises from evidence that the models used here simulate 20th-century Australian precipitation variability reasonably well, although in the ensemble mean there is less spatial variability in multi-year drought metrics than is seen in observations. This is in part due to the fact that the 20th century is too short a time period for climatological patterns to emerge (Fig. S22), resulting in a high contribution of random variability in individual models (Figs. S1–S6).
4.1 Influence of anthropogenic forcing on Australian multi-year droughts
Our findings demonstrate across a range of drought metrics that the instrumental period is not sufficiently long to experience the full possible range of natural variability in Australian multi-year droughts, particularly for drought length (Fig. S22). Hence, assessment of any anthropogenic contribution to modern multi-year droughts is difficult without the aid of model simulations and/or paleoclimate proxy data.
The lack of strong spatial agreement in drought metrics between models in the piLM simulations – despite having similar radiative forcings applied (Table 1) – suggests that on the interannual to centennial timescales assessed here, Australian multi-year drought characteristics vary according to intrinsic variability rather than being associated with any particular external forcing (Figs. S7–S12). For drought intensity, severity, and frequency, this dominance of intrinsic variability remains when considering the difference between the piLM and HIST simulations (Fig. 9c, d, and e). The distinct spatial patterns in average drought length (Fig. 9a) and total time spent in drought (Fig. 9f) suggest that these differences are climatically meaningful and hence may represent an emerging anthropogenic influence. Importantly, the regions spending on average more time in drought during the 20th century – eastern and southwestern Australia – are also the parts of Australia where we expect to see human-caused rainfall declines during the 21st century (Ukkola et al., 2020; Cook et al., 2020). Hence, the lack of significant 20th-century change across most of Australia in most drought metrics does not imply that there has been no human influence on Australian droughts during the 20th and 21st centuries, but rather that the 101-year HIST simulations are too short for any significant anthropogenically driven changes to emerge. It is noteworthy that the severe 2017–2019 Tinderbox Drought (Devanand et al., 2024) was not included in this analysis. However, calculating observed multi-year drought metrics on observations extending to 2021 (i.e. encompassing the Millennium and Tinderbox droughts) results in negligible changes to mean and maximum drought length, relative severity and intensity, and proportion of time spent in drought (not shown). Drought frequency increases slightly with the addition of the extra 21 years, particularly in eastern Australia (not shown).
4.2 Multi-year droughts in the Murray–Darling Basin
In the MDB, the difference between maximum drought length in the 20th century versus the pre-industrial last millennium is relatively small compared with the rest of the continent (Fig. 9b). Nevertheless, during the long pre-industrial simulations, very long (>10 years) droughts have return periods ranging from ∼40 to ∼200 years (Fig. S21). This suggests that the possibility of such “megadroughts” should be considered in decadal-scale water management plans. There is low model agreement on the overall severity of the single longest drought occurring in the MDB during the long pre-industrial last millennium and piControl simulations (Fig. S20). This may in part be an artefact of the 2S2E drought identification method, which allows single wet years during the drought. Hence, droughts can be very long, but not necessarily severe. The nature and drivers of the longest theoretical droughts occurring in the MDB should therefore be investigated in more detail.
Across the MDB the mean drought length is almost uniformly longer in the 20th century than in the pre-industrial last millennium (Fig. 9a and f), suggesting a possible role for anthropogenic forcing in increasing both mean drought length and the total proportion of time spent in drought. We note that the PMIP3 past1000 simulations do not cover two of the MDB's most impactful droughts of the historical period: the Millennium and 2017–2019 Tinderbox droughts. However, the occurrence of two major droughts in the first two decades of the 21st century provides additional support for our finding that the MDB is spending more time in drought during the historical period compared with natural variability during the pre-industrial last millennium.
There is no obvious impact of anthropogenic forcing on drought occurrence in the MDB (Figs. 10a, b, c, d, h, and S23a, d). However, large volcanic eruptions are associated with periods of less drought over the MDB (Figs. 10a, b, c, e, and S23b). Volcanic eruptions generally trigger a transient “El Niño-like” ocean–atmosphere response in climate models (McGregor et al., 2020), including in the CESM-LME (Stevenson et al., 2016). The co-occurrence of volcanic eruptions and suppressed drought conditions over the MDB appears to contradict current understanding of the impacts of eruptions on the El Niño–Southern Oscillation (ENSO) and subsequent impacts on rainfall in the MDB (Gillet et al., 2023). Hence, this response requires further investigation.
4.3 Comparison with paleoclimate proxy evidence
Our findings support the available evidence from the sparsely distributed proxy records for Australian hydroclimate throughout the last millennium, which similarly suggest that observational-era droughts up until 2000 are not unprecedented in the context of the past few hundred years. Hydroclimatic reconstructions for southwestern Australia (February–October cool-season rainfall reconstruction for 1350–2017 CE; O'Donnell et al., 2021), eastern Australia (December–February austral summer Palmer drought severity index reconstruction for 1500–2012 CE; Cook et al., 2016; Palmer et al., 2015), the MDB (annual rainfall reconstruction for 749 BCE to 1980 CE; Ho et al., 2015), and southeastern Queensland (annual rainfall reconstruction for 1000–2012 CE; Vance et al., 2015; Kiem et al., 2020) almost uniformly suggest that observational-era droughts are not unusual in a multi-centennial context. In fact, each of these reconstructions suggests that droughts in their respective regions have been longer in the past and/or more severe than those experienced in the late 19th and 20th centuries. This includes an annually resolved reconstruction leveraging the synoptic connection between sea salt in the Law Dome ice core and rainfall over southeast Queensland that has been used to infer a 39-year-long megadrought during the 12th century that occurred during a century of unusual aridity (Vance et al., 2015). This paleoclimate reconstruction supports our model-based finding that very long droughts far exceeding those in observational rainfall records have previously occurred in Australia.
The only exception to paleoclimate evidence that observational-era droughts are not unusual is Freund et al. (2017), who concluded that the cool-season precipitation deficit during the Millennium Drought in southeastern Australia was highly unusual in the context of the past 400 years. A possible explanation for this discrepancy is that our analyses only examined annual-mean precipitation, whereas observed eastern Australian rainfall declines of the past decades have been focused in the cool season (Pepler et al., 2021; Speer et al., 2021). Additionally, Freund et al.'s (2017) reconstruction also does not extend far enough back into the last millennium to intersect earlier dry intervals inferred from other reconstructions (Ho et al., 2015; Vance et al., 2015; Cook et al., 2016).
In PMIP3/CMIP5 models and the CESM-LME, multi-year droughts in parts of southwestern and eastern Australia (including the MDB) have been longer on average in the 20th century than in the pre-industrial last millennium, with a larger proportion of overall time spent in drought. Anthropogenic forcing is the likely cause of this difference. Conversely, droughts in inland western Australia are slightly shorter than those in the pre-industrial last millennium.
Throughout the last millennium, large volcanic eruptions have been associated with relatively drought-free intervals in the Murray–Darling Basin. However, although we assessed the possible role of external forcing on Australian multi-year droughts, we did not investigate the role internal ocean–atmosphere variability plays in predisposing various regions of Australia to multi-year drought. This will also be a topic of future study and of particular interest as several major modes of variability, including ENSO and the Indian Ocean Dipole, are projected to intensify in the future (Arias et al., 2021).
Finally, the longest droughts of the 1000-year-long pre-industrial last millennium simulations are much longer than the longest droughts of the 20th century. This suggests that very long (20 years or more) megadroughts are a natural feature of Australian hydroclimate, but that the historical period has not yet been long enough to record one of these megadroughts. Given that droughts are likely to intensify with future anthropogenic forcings (Kirono et al., 2020), water management authorities should plan for significantly longer, as well as more intense, droughts than were experienced in the 20th century.
All climate model data used in this study are freely available from online repositories. PMIP3/CMIP5 simulations are available from Earth System Grid Federation nodes https://esgf.llnl.gov/index.html (ESGF, 2024). The CESM1 Last Millennium Ensemble is available from the Earth System Grid https://www.earthsystemgrid.org/ (NCAR, 2024). The version of AWAP used in this study is available from AMU upon request. Code used to perform the analyses and produce the figures is available from https://github.com/nickywright/aus-droughts-last-millennium (Wright and Falster, 2024).
The supplement related to this article is available online at: https://doi.org/10.5194/hess-28-1383-2024-supplement.
GMF and NMW contributed equally to the paper and are listed in alphabetical order. GMF and NMW performed the analyses and made the figures with input from AMU, BJH, and NJA. GMF and NMW wrote the paper and all authors contributed to editing and review.
The contact author has declared that none of the authors has any competing interests.
Publisher's note: Copernicus Publications remains neutral with regard to jurisdictional claims made in the text, published maps, institutional affiliations, or any other geographical representation in this paper. While Copernicus Publications makes every effort to include appropriate place names, the final responsibility lies with the authors.
This article is part of the special issue “Drought, society, and ecosystems (NHESS/BG/GC/HESS inter-journal SI)”. It is not associated with a conference.
This research was made possible by computational resources provided by the Australian National Computational Infrastructure (NCI), including resources awarded through the NCI and Australian National University merit allocation schemes. Thanks to Michael Roderick for initial discussions leading to the conception of this paper.
This research has been supported by the Australian Research Council Centre of Excellence for Climate Extremes (grant no. CE170100023). Anna M. Ukkola acknowledges support from an ARC Discovery Early Career Researcher Award (grant no. DE200100086).
This paper was edited by Elena Toth and reviewed by two anonymous referees.
Abramowitz, G., Herger, N., Gutmann, E., Hammerling, D., Knutti, R., Leduc, M., Lorenz, R., Pincus, R., and Schmidt, G. A.: ESD Reviews: Model dependence in multi-model climate ensembles: weighting, sub-selection and out-of-sample testing, Earth Syst. Dynam., 10, 91–105, https://doi.org/10.5194/esd-10-91-2019, 2019.
Arias, P. A., Bellouin, N., Coppola, E., Jones, R. G., Krinner, G., Marotzke, J., Naik, V., Palmer, M. D., Plattner, G.-K., Rogelj, J., Rojas, M., Sillmann, J., Storelvmo, T., Thorne, P. W., Trewin, B., Achuta Rao, K., Adhikary, B., Allan, R. P., Armour, K., Bala, G., Barimalala, R., Berger, S., Canadell, J. G., Cassou, C., Cherchi, A., Collins, W., Collins, W. D., Connors, S. L., Corti, S., Cruz, F., Dentener, F. J., Dereczynski, C., Di Luca, A., Diongue Niang, A., Doblas-Reyes, F. J., Dosio, A., Douville, H., Engelbrecht, F., Eyring, V., Fischer, E., Forster, P., Fox-Kemper, B., Fuglestvedt, J. S., Fyfe, J. C., Gillett, N. P., Goldfarb, L., Gorodetskaya, I., Gutierrez, J. M., Hamdi, R., Hawkins, E., Hewitt, H. T., Hope, P., Islam, A. S., Jones, C., Kaufman, D. S., Kopp, R. E., Kosaka, Y., Kossin, J., Krakovska, S., Lee, J.-Y., Li, J., Mauritsen, T., Maycock, T. K., Meinshausen, M., Min, S.-K., Monteiro, P. M. S., Ngo-Duc, T., Otto, F., Pinto, I., Pirani, A., Raghavan, K., Ranasinghe, R., Ruane, A. C., Ruiz, L., Sallée, J.-B., Samset, B. H., Sathyendranath, S., Seneviratne, S. I., Sörensson, A. A., Szopa, S., Takayabu, I., Tréguier, A.-M., van den Hurk, B., Vautard, R., von Schuckmann, K., Zaehle, S., Zhang, X., and Zickfeld, K.: Technical Summary, in: Climate Change 2021: The Physical Science Basis, Contribution of Working Group I to the Sixth Assessment Report of the Intergovernmental Panel on Climate Change, edited by: Masson-Delmotte, V., Zhai, P., Pirani, A., Connors, S. L., Péan, C., Berger, S., Caud, N., Chen, Y., Goldfarb, L., Gomis, M. I., Huang, M., Leitzell, K., Lonnoy, E., Matthews, J. B. R., Maycock, T. K., Waterfield, T., Yelekçi, O., Yu, R., and Zhou, B., Cambridge University Press, Cambridge, UK and New York, NY, USA, 33–144., https://doi.org/10.1017/9781009157896.002, 2021.
Askarimarnani, S. S., Kiem, A. S., and Twomey, C. R.: Comparing the performance of drought indicators in Australia from 1900 to 2018, Int. J. Climatol., 41, E912–E934, https://doi.org/10.1002/joc.6737, 2021.
Ault, T. R., Cole, J. E., Overpeck, J. T., Pederson, G. T., and Meko, D. M.: Assessing the Risk of Persistent Drought Using Climate Model Simulations and Paleoclimate Data, J. Climate, 27, 7529–7549, 2014.
Bao, Q., Lin, P., Zhou, T., Liu, Y., Yu, Y., Wu, G., He, B., He, J., Li, L., Li, J., Li, Y., Liu, H., Qiao, F., Song, Z., Wang, B., Wang, J., Wang, P., Wang, X., Wang, Z., Wu, B., Wu, T., Xu, Y., Yu, H., Zhao, W., Zheng, W., and Zhou, L.: The Flexible Global Ocean-Atmosphere-Land system model, Spectral Version 2: FGOALS-s2, Adv. Atmos. Sci., 30, 561–576, https://doi.org/10.1007/s00376-012-2113-9, 2013.
Benjamini, Y., and Hochberg, Y.: Controlling the false discovery rate: a practical and powerful approach to multiple testing, J. Roy. Stat. Soc., 57, 289–300, 1995.
BoM: State of the Climate 2022, Commonwealth of Australia, http://www.bom.gov.au/state-of-the-climate/2022/documents/2022-state-of-the-climate-web.pdf (last access: June 2023), 2022.
Coats, S., Smerdon, J. E., Seager, R., Cook, B. I., and González-Rouco, J. F.: Megadroughts in Southwestern North America in ECHO-G Millennial Simulations and Their Comparison to Proxy Drought Reconstructions, J. Climate, 26, 7635–7649, 2013.
Coats, S., Smerdon, J. E., Cook, B. I., and Seager, R.: Are Simulated Megadroughts in the North American Southwest Forced?, J. Climate, 28, 124–142, 2015.
Cook, B. I., Palmer, J. G., Cook, E. R., Turney, C. S. M., Allen, K., Fenwick, P., O'Donnell, A., Lough, J. M., Grierson, P. F., Ho, M., and Baker, P. J.: The paleoclimate context and future trajectory of extreme summer hydroclimate in eastern Australia, J. Geophys. Res.-Atmos., 121, 12820–12838, 2016.
Cook, B. I., Mankin, J. S., Marvel, K., Williams, A. P., Smerdon, J. E., and Anchukaitis, K. J.: Twenty-first century drought projections in the CMIP6 forcing scenarios, Earths Future, 8, e2019EF001461, https://doi.org/10.1029/2019ef001461, 2020.
Cook, B. I., Smerdon, J. E., Cook, E. R., Williams, A. P., Anchukaitis, K. J., Mankin, J. S., Allen, K., Andreu-Hayles, L., Ault, T. R., Belmecheri, S., Coats, S., Coulthard, B., Fosu, B., Grierson, P., Griffin, D., Herrera, D. A., Ionita, M., Lehner, F., Leland, C., Marvel, K., Morales, M. S., Mishra, V., Ngoma, J., Nguyen, H. T. T., O'Donnell, A., Palmer, J., Rao, M. P., Rodriguez-Caton, M., Seager, R., Stahle, D. W., Stevenson, S., Thapa, U. K., Varuolo-Clarke, A. M., and Wise, E. K.: Megadroughts in the Common Era and the Anthropocene, Nat. Rev. Earth Environ., 3, 741–757, 2022.
Crowley, T. J., Zielinski, G., Vinther, B., Udisti, R., Kreutz, K., Cole-Dai, J., and Castellano, E.: Volcanism and the little ice age, PAGES News, 16, 22–23, 2008.
Delaygue, G. and Bard, E.: An Antarctic view of Beryllium-10 and solar activity for the past millennium, Clim. Dynam., 36, 2201–2218, 2011.
Delworth, T. L. and Zeng, F.: Regional rainfall decline in Australia attributed to anthropogenic greenhouse gases and ozone levels, Nat. Geosci., 7, 583–587, 2014.
Devanand, A., Falster, G., Gillett, Z., Hobeichim, S., Holgate, C., Jin, C., Mu, M., Parker, T., Rifai, S., Rome, K., Stojanovic, M., Vogel, E., Abram, N., Abramowitz, G., Coats, S., Evans, J., Gallant, A., Pitman, A., Power, S., Rauniyar, S., Taschetto, A., and Ukkola, A.: Australia's Tinderbox Drought: An extreme natural event likely worsened by human-caused climate change, Sci. Adv., 10, eadj3460, https://doi.org/10.1126/sciadv.adj3460, 2024.
Douville, H., Raghavan, K., Renwick, J., Allan, R. P., Arias, P. A., Barlow, M., Cerezo-Mota, R., Cherchi, A., Gan, T. Y., Gergis, J., Jiang, D., Khan, A., Pokam Mba, W., Rosenfeld, D., Tierney, J., and Zolina, O.: Water Cycle Changes, in: Climate Change 2021: The Physical Science Basis. Contribution of Working Group I to the Sixth Assessment Report of the Intergovernmental Panel on Climate Change, edited by: Masson-Delmotte, V., Zhai, P., Pirani, A., Connors, S. L., Péan, C., Berger, S., Caud, N., Chen, Y., Goldfarb, L., Gomis, M. I., Huang, M., Leitzell, K., Lonnoy, E., Matthews, J. B. R., Maycock, T. K., Waterfield, T., Yelekçi, O., Yu, R., and Zhou, B., Cambridge University Press, Cambridge, UK and New York, NY, USA, 1055–1210, https://doi.org/10.1017/9781009157896.010, 2021.
Dufresne, J.-L., Foujols, M.-A., Denvil, S., Caubel, A., Marti, O., Aumont, O., Balkanski, Y., Bekki, S., Bellenger, H., Benshila, R., Bony, S., Bopp, L., Braconnot, P., Brockmann, P., Cadule, P., Cheruy, F., Codron, F., Cozic, A., Cugnet, D., de Noblet, N., Duvel, J.-P., Ethé, C., Fairhead, L., Fichefet, T., Flavoni, S., Friedlingstein, P., Grandpeix, J.-Y., Guez, L., Guilyardi, E., Hauglustaine, D., Hourdin, F., Idelkadi, A., Ghattas, J., Joussaume, S., Kageyama, M., Krinner, G., Labetoulle, S., Lahellec, A., Lefebvre, M.-P., Lefevre, F., Levy, C., Li, Z. X., Lloyd, J., Lott, F., Madec, G., Mancip, M., Marchand, M., Masson, S., Meurdesoif, Y., Mignot, J., Musat, I., Parouty, S., Polcher, J., Rio, C., Schulz, M., Swingedouw, D., Szopa, S., Talandier, C., Terray, P., Viovy, N., and Vuichard, N.: Climate change projections using the IPSL-CM5 Earth System Model: from CMIP3 to CMIP5, Clim. Dynam., 40, 2123–2165, https://doi.org/10.1007/s00382-012-1636-1, 2013.
ESGF – Earth System Grid Federation: What is ESGF?, https://esgf.llnl.gov/index.html (last access: 22 March 2024), 2024.
Eyring, V., Cox, P. M., Flato, G. M., Gleckler, P. J., Abramowitz, G., Caldwell, P., Collins, W. D., Gier, B. K., Hall, A. D., Hoffman, F. M., Hurtt, G. C., Jahn, A., Jones, C. D., Klein, S. A., Krasting, J. P., Kwiatkowski, L., Lorenz, R., Maloney, E., Meehl, G. A., Pendergrass, A. G., Pincus, R., Ruane, A. C., Russell, J. L., Sanderson, B. M., Santer, B. D., Sherwood, S. C., Simpson, I. R., Stouffer, R. J., and Williamson, M. S.: Taking climate model evaluation to the next level, Nat. Clim. Change, 9, 102–110, 2019.
Freund, M., Henley, B. J., Karoly, D. J., Allen, K. J., and Baker, P. J.: Multi-century cool- and warm-season rainfall reconstructions for Australia's major climatic regions, Clim. Past, 13, 1751–1770, https://doi.org/10.5194/cp-13-1751-2017, 2017.
Gao, C., Robock, A., and Ammann, C.: Volcanic forcing of climate over the past 1500 years: An improved ice core-based index for climate models, J. Geophys. Res., 113, D23111, https://doi.org/10.1029/2008jd010239, 2008.
Gillett, Z. E., Taschetto, A. S., Holgate, C. M., and Santoso, A.: Linking ENSO to synoptic weather systems in eastern Australia, Geophys. Res. Lett., 50, e2023GL104814, https://doi.org/10.1029/2023GL104814, 2023.
Giorgetta, M. A., Jungclaus, J., Reick, C. H., Legutke, S., Bader, J., Böttinger, M., Brovkin, V., Crueger, T., Esch, M., Fieg, K., Glushak, K., Gayler, V., Haak, H., Hollweg, H.-D., Ilyina, T., Kinne, S., Kornblueh, L., Matei, D., Mauritsen, T., Mikolajewicz, U., Mueller, W., Notz, D., Pithan, F., Raddatz, T., Rast, S., Redler, R., Roeckner, E., Schmidt, H., Schnur, R., Segschneider, J., Six, K. D., Stockhause, M., Timmreck, C., Wegner, J., Widmann, H., Wieners, K.-H., Claussen, M., Marotzke, J., and Stevens, B.: Climate and carbon cycle changes from 1850 to 2100 in MPI-ESM simulations for the Coupled Model Intercomparison Project phase 5, J. Adv. Model. Earth Syst., 5, 572–597, https://doi.org/10.1002/jame.20038, 2013.
Gordon, C., Cooper, C., Senior, C. A., Banks, H., Gregory, J. M., Johns, T. C., Mitchell, J. F. B., and Wood, R. A.: The simulation of SST, sea ice extents and ocean heat transports in a version of the Hadley Centre coupled model without flux adjustments, Clim. Dynam., 16, 147–168, https://doi.org/10.1007/s003820050010, 2000.
Grose, M. R., Narsey, S., Delage, F. P., Dowdy, A. J., Bador, M., Boschat, G., Chung, C., Kajtar, J. B., Rauniyar, S., Freund, M. B., Lyu, K., Rashid, H., Zhang, X., Wales, S., Trenham, C., Holbrook, N. J., Cowan, T., Alexander, L., Arblaster, J. M., and Power, S.: Insights from CMIP6 for Australia's future climate, Earths Future, 8, e2019EF001469, https://doi.org/10.1029/2019EF001469, 2020.
Helman, P.: Droughts in the Murray Darling Basin Since European Settlement, Murray Darling Basin Authority, https://silo.tips/download/droughts-in-the-murray-darling-basin-since-european-settlement (last access: February 2023), 2009.
Ho, M., Kiem, A. S., and Verdon-Kidd, D. C.: A paleoclimate rainfall reconstruction in the Murray-Darling Basin (MDB), Australia: 2. Assessing hydroclimatic risk using paleoclimate records of wet and dry epochs, Water Resour. Res., 51, 8380–8396, 2015.
Jones, D. A., Wang, W., and Fawcett, R.: High-quality spatial climate data-sets for Australia, Aust. Meteorol. Oceanogr. J., 58, 233–248, 2009.
Jungclaus, J. H., Bard, E., Baroni, M., Braconnot, P., Cao, J., Chini, L. P., Egorova, T., Evans, M., González-Rouco, J. F., Goosse, H., Hurtt, G. C., Joos, F., Kaplan, J. O., Khodri, M., Klein Goldewijk, K., Krivova, N., LeGrande, A. N., Lorenz, S. J., Luterbacher, J., Man, W., Maycock, A. C., Meinshausen, M., Moberg, A., Muscheler, R., Nehrbass-Ahles, C., Otto-Bliesner, B. I., Phipps, S. J., Pongratz, J., Rozanov, E., Schmidt, G. A., Schmidt, H., Schmutz, W., Schurer, A., Shapiro, A. I., Sigl, M., Smerdon, J. E., Solanki, S. K., Timmreck, C., Toohey, M., Usoskin, I. G., Wagner, S., Wu, C.-J., Yeo, K. L., Zanchettin, D., Zhang, Q., and Zorita, E.: The PMIP4 contribution to CMIP6 – Part 3: The last millennium, scientific objective, and experimental design for the PMIP4 past1000 simulations, Geosci. Model Dev., 10, 4005–4033, https://doi.org/10.5194/gmd-10-4005-2017, 2017.
Kiem, A. S., Johnson, F., Westra, S., van Dijk, A., Evans, J. P., O'Donnell, A., Rouillard, A., Barr, C., Tyler, J., Thyer, M., Jakob, D., Woldemeskel, F., Sivakumar, B., and Mehrotra, R.: Natural hazards in Australia: droughts, Climatic Change, 139, 37–54, 2016.
Kiem, A. S., Vance, T. R., Tozer. C. R., Roberts, J. L., Dalla Pozza, R., Vitkovsky, J., Smolders, K., and Curran, M. A. J.: Learning from the past – Using palaeoclimate data to better understand and manage drought in South East Queensland (SEQ), Australia, J. Hydrol.: Reg. Stud., 29, 100686, https://doi.org/10.1016/j.ejrh.2020.100686, 2020.
Kirono, D. G. C., Round, V., Heady, C., Chiew, F. H. S., and Osbrough, S.: Drought projections for Australia: Updated results and analysis of model simulations, Weather Clim. Extrem., 30, 100280, https://doi.org/10.1016/j.wace.2020.100280, 2020.
Landrum, L., Otto-Bliesner, B. L., Wahl, E. R., Conley, A., Lawrence, P. J., Rosenbloom, N., and Teng, H.: Last Millennium Climate and Its Variability in CCSM4, J. Climate, 26, 1085–1111, https://doi.org/10.1175/JCLI-D-11-00326.1, 2013.
Leblanc, M., Tweed, S., Van Dijk, A., and Timbal, B.: A review of historic and future hydrological changes in the Murray-Darling Basin, Global Planet. Change, 80–81, 226–246, 2012.
McGregor, S., Khodri, M., Maher, N., Ohba, M., Pausata, F. S. R., and Stevenson, S.: The Effect of Strong Volcanic Eruptions on ENSO, in: El Niño Southern Oscillation in a Changing Climate, edited by: McPhaden, M. J., Santoso, A., and Cai, W., Wiley, 267–287, https://doi.org/10.1002/9781119548164.ch12, 2020.
Mishra, A. K. and Singh, V. P.: A review of drought concepts, J. Hydrol., 391, 202–216, 2010.
Morin, E.: To know what we cannot know: Global mapping of minimal detectable absolute trends in annual precipitation, Water Resour. Res., 47, W07505, https://doi.org/10.1029/2010wr009798, 2011.
Müller, O. V., Vidale, P. L., Vannière, B., Schiemann, R., Senan, R., Haarsma, R. J., and Jungclaus, J. H.: Land–Atmosphere Coupling Sensitivity to GCMs Resolution: A Multimodel Assessment of Local and Remote Processes in the Sahel Hot Spot, J. Climate, 34, 967–985, 2021.
NCAR: Climate Data at the NSF National Center for Atmospheric Research, https://www.earthsystemgrid.org/ (last access: 22 March 2024), 2024.
O'Donnell, A. J., McCaw, W. L., Cook, E. R., and Grierson, P. F.: Megadroughts and pluvials in southwest Australia: 1350–2017 CE, Clim. Dynam., 57, 1817–1831, 2021.
O'Loingsigh, T., McTainsh, G. H., Parsons, K., Strong, C. L., Shinkfield, P., and Tapper, N. J.: Using meteorological observer data to compare wind erosion during two great droughts in eastern Australia; the World War II Drought (1937–1946) and the Millennium Drought (2001–2010), Earth Surf. Proc. Land., 40, 123–130, https://doi.org/10.1002/esp.3668, 2014.
Otto-Bliesner, B. L., Brady, E. C., Fasullo, J., Jahn, A., Landrum, L., Stevenson, S., Rosenbloom, N., Mai, A., and Strand, G.: Climate Variability and Change since 850 CE: An Ensemble Approach with the Community Earth System Model, B. Am. Meteorol. Soc., 97, 735–754, https://doi.org/10.1175/BAMS-D-14-00233.1, 2016.
Palmer, J. G., Cook, E. R., Turney, C. S. M., Allen, K., Fenwick, P., Cook, B. I., O'Donnell, A., Lough, J., Grierson, P., and Baker, P.: Drought variability in the eastern Australia and New Zealand summer drought atlas (ANZDA, CE 1500–2012) modulated by the Interdecadal Pacific Oscillation, Environ. Res. Lett., 10, 124002, 2015.
Paton, D. C., Rogers, D. J., Hill, B. M., Bailey, C. P., and Ziembicki, M.: Temporal changes to spatially stratified waterbird communities of the Coorong, South Australia: implications for the management of heterogenous wetlands, Anim. Conserv., 12, 408–417, 2009.
Pepler, A. S., Dowdy, A. J., and Hope, P.: The differing role of weather systems in southern Australian rainfall between 1979–1996 and 1997–2015, Clim. Dyn., 56, 2289–2302, 2021.
Phipps, S. J., Rotstayn, L. D., Gordon, H. B., Roberts, J. L., Hirst, A. C., and Budd, W. F.: The CSIRO Mk3L climate system model version 1.0 – Part 1: Description and evaluation, Geosci. Model Dev., 4, 483–509, https://doi.org/10.5194/gmd-4-483-2011, 2011.
Pongratz, J., Reick, C., Raddatz, T., and Claussen, M.: A reconstruction of global agricultural areas and land cover for the last millennium, Global Biogeochem. Cy., 22, GB3018, https://doi.org/10.1029/2007gb003153, 2008.
Santanello, J. A., Dirmeyer, P. A., Ferguson, C. R., Findell, K. L., Tawfik, A. B., Berg, A., Ek, M., Gentine, P., Guillod, B. P., van Heerwaarden, C., Roundy, J., and Wulfmeyer, V.: Land–Atmosphere Interactions: The LoCo Perspective, B. Am. Meteorol. Soc., 99, 1253–1272, 2018.
Schmidt, G. A., Jungclaus, J. H., Ammann, C. M., Bard, E., Braconnot, P., Crowley, T. J., Delaygue, G., Joos, F., Krivova, N. A., Muscheler, R., Otto-Bliesner, B. L., Pongratz, J., Shindell, D. T., Solanki, S. K., Steinhilber, F., and Vieira, L. E. A.: Climate forcing reconstructions for use in PMIP simulations of the last millennium (v1.0), Geosci. Model Dev., 4, 33–45, https://doi.org/10.5194/gmd-4-33-2011, 2011.
Schmidt, G. A., Jungclaus, J. H., Ammann, C. M., Bard, E., Braconnot, P., Crowley, T. J., Delaygue, G., Joos, F., Krivova, N. A., Muscheler, R., Otto-Bliesner, B. L., Pongratz, J., Shindell, D. T., Solanki, S. K., Steinhilber, F., and Vieira, L. E. A.: Climate forcing reconstructions for use in PMIP simulations of the Last Millennium (v1.1), Geosci. Model Dev., 5, 185–191, https://doi.org/10.5194/gmd-5-185-2012, 2012.
Schurer, A. P., Hegerl, G. C., Mann, M. E., Tett, S. F. B., and Phipps, S. J.: Separating Forced from Chaotic Climate Variability over the Past Millennium, J. Climate, 26, 6954–6973, https://doi.org/10.1175/JCLI-D-12-00826.1, 2013.
Semple, B., Rankin, M., Koen, T., and Geeves, G.: A Note on Tree Deaths during the Current (2001–?) Drought in South-eastern Australia, Aust. Geogr., 41, 391–401, 2010.
Speer, M. S., Leslie, L. M., MacNamara, S., and Hartigan, J.: From the 1990s climate change has decreased cool season catchment precipitation reducing river heights in Australia's southern Murray-Darling Basin, Sci. Rep., 11, 16136, https://doi.org/10.1038/s41598-021-95531-4, 2021.
Steinhilber, F., Beer, J., and Fröhlich, C.: Total solar irradiance during the Holocene, Geophys. Res. Lett., 36, L19704, https://doi.org/10.1029/2009gl040142, 2009.
Stevenson, S., Timmermann, A., Chikamoto, Y., Langford, S., and DiNezio, P.: Stochastically Generated North American Megadroughts, J. Climate, 28, 1865–1880, 2015.
Stevenson, S., Otto-Bliesner, B., Fasullo, J., and Brady, E.: “El Niño Like” Hydroclimate Responses to Last Millennium Volcanic Eruptions, J. Climate, 29, 2907–2921, 2016.
Stevenson, S., Coats, S., Touma, D., Cole, J., Lehner, F., Fasullo, J., and Otto-Bliesner, B.: Twenty-first century hydroclimate: A continually changing baseline, with more frequent extremes, P. Natl. Acad. Sci. USA, 119, e2108124119, https://doi.org/10.1073/pnas.2108124119, 2022.
Ukkola, A. M., Pitman, A. J., De Kauwe, M. G., Abramowitz, G., Herger, N., Evans, J. P., and Decker, M.: Evaluating CMIP5 Model Agreement for Multiple Drought Metrics, J. Hydrometeorol., 19, 969–988, 2018.
Ukkola, A. M., Roderick, M. L., Barker, A., and Pitman, A. J.: Exploring the stationarity of Australian temperature, precipitation and pan evaporation records over the last century, Environ. Res. Lett., 14, 124035, https://doi.org/10.1088/1748-9326/ab545c, 2019.
Ukkola, A. M., De Kauwe, M. G., Roderick, M. L., Abramowitz, G., and Pitman, A. J.: Robust future changes in meteorological drought inCMIP6Projections despite uncertainty in precipitation, Geophys. Res. Lett., 47, e2020GL087820, https://doi.org/10.1029/2020gl087820, 2020.
Vance, T. R., Roberts, J. L., Plummer, C. T., Kiem, A. S., and van Ommen, T. D.: Interdecadal Pacific variability and eastern Australian megadroughts over the last millennium, Geophys. Res. Lett., 42, 129–137, 2015.
Vance, T. R., Kiem, A. S., Jong, L. M., Roberts, J. L., Plummer, C. T., Moy, A. D., Curran, M. A. J., and van Ommen, T. D.: Pacific decadal variability over the last 2000 years and implications for climatic risk, Commun. Earth Environ., 3, 1–9, 2022.
van Dijk, A. I. J. M., Beck, H. E., Crosbie, R. S., de Jeu, R. A. M., Liu, Y. Y., Podger, G. M., Timbal, B., and Viney, N. R.: The Millennium Drought in southeast Australia (2001–2009): Natural and human causes and implications for water resources, ecosystems, economy, and society, Water Resour. Res., 49, 1040–1057, 2013.
Verdon-Kidd, D. C. and Kiem, A. S.: Nature and causes of protracted droughts in southeast Australia: Comparison between the Federation, WWII, and Big Dry droughts, Geophys. Res. Lett., 36, L22707, https://doi.org/10.1029/2009gl041067, 2009.
Vieira, L. E. A., Solanki, S. K., Krivova, N. A., and Usoskin, I.: Evolution of the solar irradiance during the Holocene, Astron. Astrophys., 531, A6, https://doi.org/10.1051/0004-6361/201015843, 2011.
Vogel, E., Johnson, F., Marshall, L., Bende-Michl, U., Wilson, L., Peter, J. R., Wasko, C., Srikanthan, S., Sharples, W., Dowdy, A., Hope, P., Khan, Z., Mehrotra, R., Sharma, A., Matic, V., Oke, A., Turner, M., Thomas, S., Donnelly, C., and Duong, V. C.: An evaluation framework for downscaling and bias correction in climate change impact studies, J. Hydrol., 622, 129693, https://doi.org/10.1016/j.jhydrol.2023.129693, 2023.
Watanabe, S., Hajima, T., Sudo, K., Nagashima, T., Takemura, T., Okajima, H., Nozawa, T., Kawase, H., Abe, M., Yokohata, T., Ise, T., Sato, H., Kato, E., Takata, K., Emori, S., and Kawamiya, M.: MIROC-ESM 2010: model description and basic results of CMIP5-20c3m experiments, Geosci. Model Dev., 4, 845–872, https://doi.org/10.5194/gmd-4-845-2011, 2011.
Wright, N. and Falster, G.: aus-droughts-last-millennium, GitHub repository [code], https://github.com/nickywright/aus-droughts-last-millennium (last access: March 2024), 2024.
Xiao-Ge, X., Tong-Wen, W., and Jie, Z.: Introduction of CMIP5 Experiments Carried out with the Climate System Models of Beijing Climate Center, Adv. Clim. Change Res., 4, 41–49, https://doi.org/10.3724/SP.J.1248.2013.041, 2013.
Yukimoto, S., Adachi, Y., Hosaka, M., Sakami, T., Yoshimura, H., Hirabara, M., Tanaka, T. Y., Shindo, E., Tsujino, H., Deushi, M., Mizuta, R., Yabu, S., Obata, A., Nakano, H., Koshiro, T., Ose, T., and Kitoh, A.: A New Global Climate Model of the Meteorological Research Institute: MRI-CGCM3 – Model Description and Basic Performance –, J. Meteorol. Soc. Jpn., 90A, 23–64, https://doi.org/10.2151/jmsj.2012-A02, 2012.
Zampatti, B. P., Bice, C. M., and Jennings, P. R.: Temporal variability in fish assemblage structure and recruitment in a freshwater-deprived estuary: The Coorong, Australia, Mar. Freshwater Res., 61, 1298–1312, 2010.
megadroughtsare a natural feature of the Australian hydroclimate. Human-caused climate change is also driving a tendency towards longer droughts in eastern and southwestern Australia.