the Creative Commons Attribution 4.0 License.
the Creative Commons Attribution 4.0 License.
 | 13 Nov 2023
Inferring reservoir filling strategies under limited-data-availability conditions using hydrological modeling and Earth observations: the case of the Grand Ethiopian Renaissance Dam (GERD)
Awad M. Ali
Lieke A. Melsen
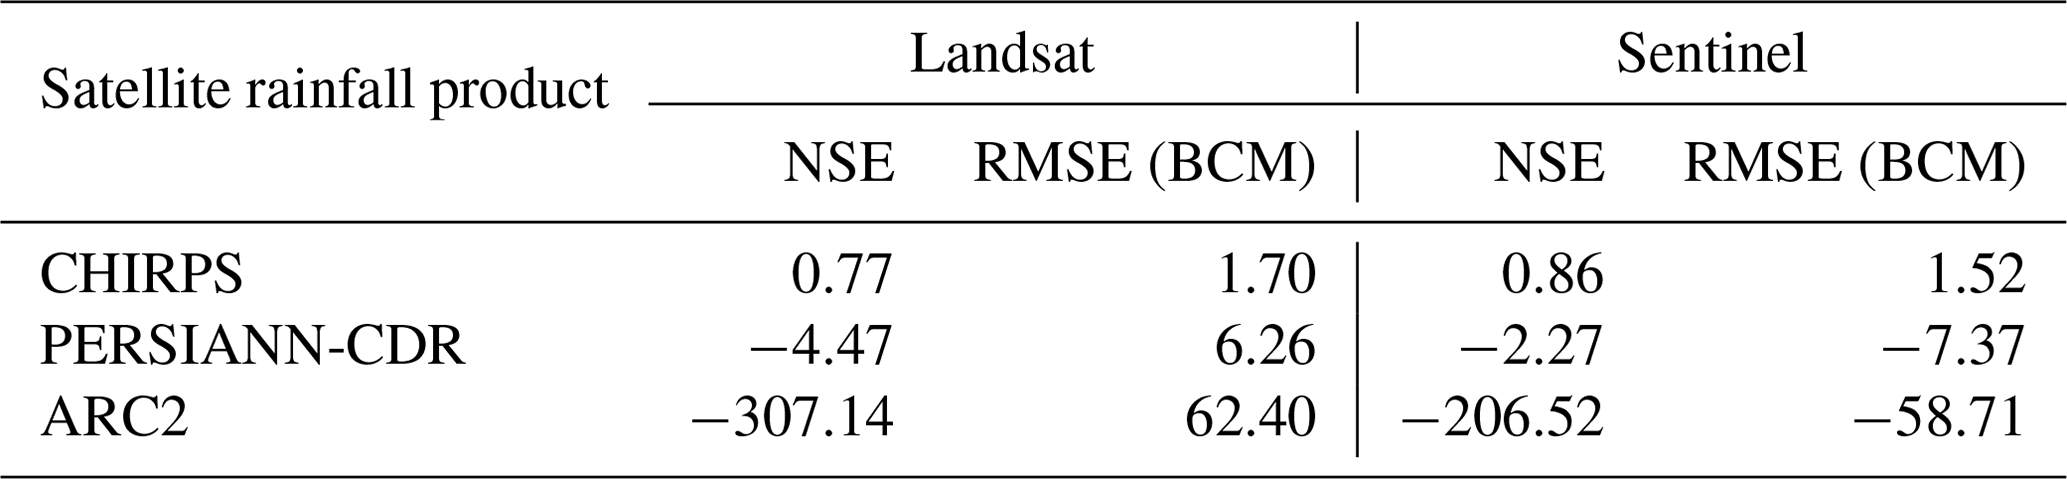
The filling of the Grand Ethiopian Renaissance Dam (GERD) started in 2020, posing additional challenges for downstream water management in the Blue Nile River in the Republic of the Sudan, which is already struggling to cope with the effects of climate change. This is also the case for many transboundary rivers that are affected by a lack of cooperation and transparency during the filling and operation of new dams. Without information about water supply from neighboring countries, it is risky to manage downstream dams as usual, but operational information is needed to apply modifications. This study aims to develop a novel approach/framework that utilizes hydrological modeling in conjunction with remote-sensing data to retrieve reservoir filling strategies under limited-data-availability conditions. Firstly, five rainfall products (i.e., ARC2, CHIRPS, ERA5, GPCC, and PERSIANN-CDR; see Sect. 2.3 for more information) were evaluated against historical measured rainfall at 10 stations. Secondly, to account for input uncertainty, the three best-performing rainfall products were forced in the conceptual hydrological model HBV-light with potential evapotranspiration and temperature data from ERA5. The model was calibrated during the period from 2006 to 2019 and validated during the period from 1991 to 1996. Thirdly, the parameter sets that obtained very good performance (Nash–Sutcliffe efficiency, NSE, greater than 0.75) were utilized to predict the inflow of GERD during the operation period (2020–2022). Then, from the water balance of GERD, the daily storage was estimated and compared with the storage derived from Landsat and Sentinel imageries to evaluate the performance of the selected rainfall products and the reliability of the framework. Finally, 3 years of GERD filling strategies was retrieved using the best-performing simulation of CHIRPS with an RMSE of 1.7 ×10⁹ and 1.52 ×10⁹m3 and an NSE of 0.77 and 0.86 when compared with Landsat- and Sentinel-derived reservoir storage, respectively. It was found that GERD stored 14 % of the monthly inflow of July 2020; 41 % of July 2021; and 37 % and 32 % of July and August 2022, respectively. Annually, GERD retained 5.2 % and 7.4 % of the annual inflow in the first two filling phases and between 12.9 % and 13.7 % in the third phase. The results also revealed that the retrieval of filling strategies is more influenced by input uncertainty than parameter uncertainty. The retrieved daily change in GERD storage with the measured outflow to the Republic of the Sudan allowed further interpretation of the downstream impacts of GERD. The findings of this study provide systematic steps to retrieve filling strategies, which can serve as a base for future development in the field, especially for data-scarce regions. Locally, the analysis contributes significantly to the future water management of the Roseires and Sennar dams in the Republic of the Sudan.
- Article
(10652 KB) - Full-text XML
- BibTeX
- EndNote


The optimal management of water resources is challenging as we increasingly experience the impacts of climate change and increasing water demand due to population growth (Stakhiv, 2011). Transboundary rivers pose even greater challenges to water management, for example, when structures such as dams are built by upstream countries, as upstream changes impact the downstream flow regime (Biswas, 2008) and mean water availability during the filling phase. The absence of collaboration has disastrous impacts in these regions, as collaboration increases water revenue and reduces the risk of extreme events (Basheer et al., 2018; Wheeler et al., 2018). There is, however, the possibility of conflicting dynamics in many transboundary basins due to the different policies and strategies between neighboring countries (Warner and Zawahri, 2012). As a result, a lack of transparency on the filling/operation of dams and other infrastructure is often witnessed.
The Blue Nile River is an example of a transboundary river in which infrastructure influences downstream dynamics. A current challenge faced by the Ministry of Irrigation and Water Resources (MoIWR) of the Republic of the Sudan (hereafter Sudan) is the management of the Nile River. Around two-thirds of Nile water is supplied by the Blue Nile River (Dumont, 1986). This river originates in Lake Tana, Ethiopia, and subsequently flows northward to meet the White Nile River (which originates in Lake Victoria, Uganda), where the main Nile River starts in Khartoum, the capital of Sudan (as shown in Fig. 1a). In April 2011, the Ethiopian government started the construction of the Grand Ethiopian Renaissance Dam (GERD) in the Upper Blue Nile (UBN) basin, around 15 km east of the Ethiopian–Sudanese border. The dam, when completed, will be the largest hydropower dam in Africa with a storage capacity of 74 ×109m3 (with volumes expressed as BCM, billion cubic meters, hereafter) and a power capacity of 5150 MW (Ezega News, 2019). It was constructed without an agreement with downstream countries (i.e., Sudan and Egypt), which caused hydro-political tension between Sudan, Egypt, and Ethiopia (Gebrehiwet, 2020). Moreover, water management in Sudan is very closely tied to reservoirs. The Roseires Dam, for example, plays a significant role in managing drinking water as well as irrigation water for downstream projects and is closely coordinated with the Sennar Dam downstream (Alrajoula et al., 2016) (see Fig. 1b). Around 35 % of the Sudanese allocation of Nile water is consumed by the Gezira Scheme, which is supplied by the Sennar Dam (Adam et al., 2003). The Gezira Scheme, with a total area of 8800 km2, is regarded as one of the largest irrigation schemes in the world under a single management structure (Ahmed et al., 2006). Therefore, it plays a considerable role in the socio-economy of Sudan.
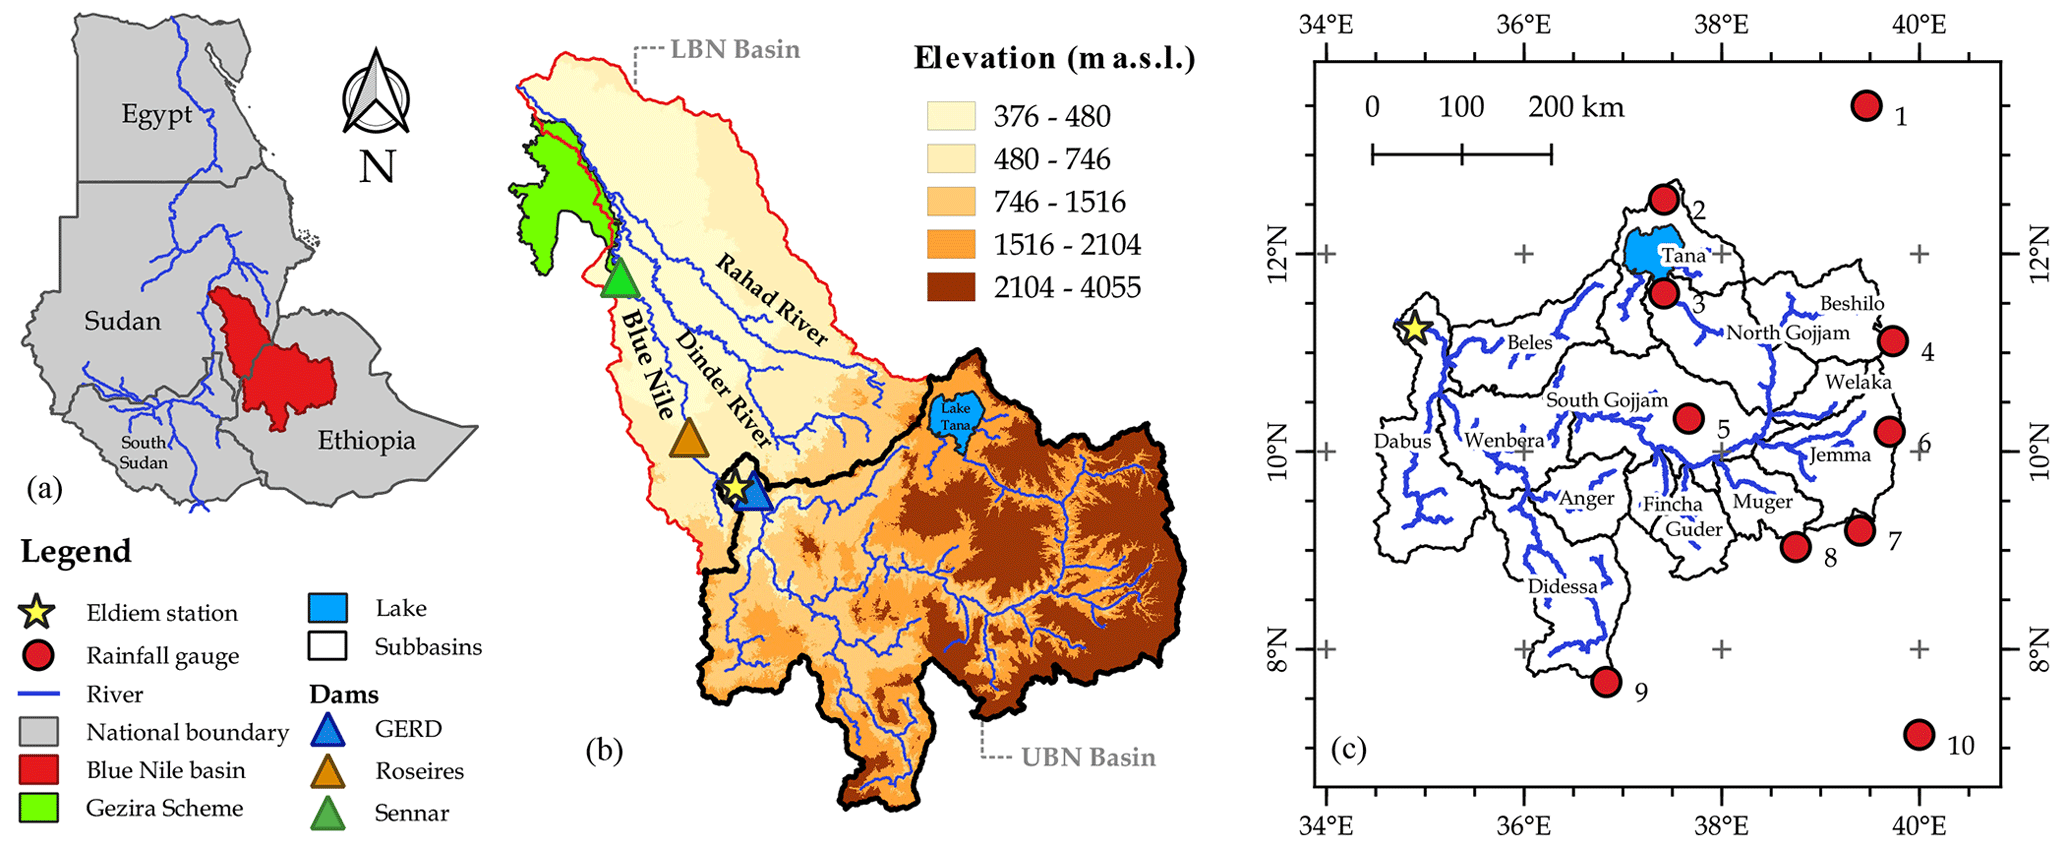
Figure 1Study area overview: (a) the geographical location of the Blue Nile Basin showing the upper and lower parts; (b) a digital elevation model (Shuttle Radar Topography Mission, SRTM, 30 m) map of the Blue Nile Basin and the location of the Gezira Scheme, dams, and the Eldiem streamflow station; and (c) the Upper Blue Nile subbasins with the location of rainfall gauge stations. Basin boundaries and the drainage network were obtained from the HydroSHEDS dataset (Lehner et al., 2008), and national boundaries were based on the Database of Global Administrative Areas (Hijmans et al., 2012). The name and coordinates of each rainfall gauge station are given in Table 3.
The construction of GERD, in combination with the low level of coordination between Ethiopia and Sudan, poses a threat to water management in Sudan. For instance, floods are frequently experienced in Khartoum State, where 16 % of the population lives (World Population Review, 2022). In the past 35 years, flood events have been observed, on average, every 5 years. The latest flood in 2020 was unprecedented, and water levels exceeded all previous events (NASA Earth Observatory, 2020). In the same year, the filling of GERD started without sharing information with Sudan and Egypt. As shown in Fig. 1b, Roseries Dam is located only around 120 km downstream of GERD. Without knowledge of GERD operational strategies, management of the Roseires Dam is a considerable challenge. Thus, knowledge of operational strategies is essential for flow prediction and water management in downstream areas.
It is clear that the operation of the dams along the Blue Nile River has significant implications for food security, flood protection, water availability, and hydropower generation downstream in the main Nile River. Nonetheless, Ethiopia has yet to share information on GERD filling, thereby hindering water management in Sudan. Thus, obtaining filling/operation information using alternative means is urgently needed to support the operation of both the Roseires and Sennar dams. Different approaches exist to understand dam operation and reservoir water storage. One approach relies on satellite remote sensing and radar altimetry. At a global scale, satellite-derived water heights and extents have been used to reconstruct storage dynamics (Hou et al., 2022). Vu et al. (2022) revealed reservoir filling strategies and operating rules of 10 dams along the Upper Mekong River using Landsat images and radar altimetry. Another approach is using a process-based hydrological model to simulate water inflow, storage, and release. Eldardiry and Hossain (2019) predicted reservoir operating rules of High Aswan Dam in the lower Nile River basin using satellite hydrometeorological observations and a macroscale hydrologic model. Furthermore, Wannasin et al. (2021) simulated the daily storage of two reservoirs using a distributed hydrological model and a reservoir operation module.
In this study, we aim to develop a novel approach to infer reservoir management strategies under limited-data-availability conditions. In our approach, two techniques, hydrological modeling and Earth observation, are combined to retrieve reliable reservoir records. Then, we reconstruct management strategies based on further analysis of the retrieved records. The merits of this approach include (1) facilitating proactive flow forecasting for real-time operations; (2) generating refined and more consistent reservoir data, thereby supporting hydrological analyses at various temporal scales; and (3) permitting the assessment of the influence of different input uncertainties on the inference of the management strategies.
As part of this study, we will analyze the implications of input data and parameter uncertainty in inferring the filling strategies. As a case study, the research will be conducted using the UBN basin in order to understand the filling stages of GERD and its impact on downstream discharge. Specifically, the study will quantify the volume of water stored behind GERD based on known outgoing flow to Sudan as well as the daily reservoir storage change. The output of this study intends to provide information to support the management of the Lower Blue Nile in Sudan. Nonetheless, the work does not attempt to use the findings to optimize current management practices, as this would go beyond the goal of this study. Therefore, we will aim to answer the following questions:
-
How can hydrological modeling and remote sensing be leveraged to effectively infer GERD management strategies?
-
What is the implication of rainfall selection and parameter uncertainty on the inference of GERD management strategies?
-
What is the impact of GERD reservoir filling on the flow to Sudan during the first three filling phases (2020–2022)?
The outline of the study is as follows: the study area and data are briefly described in Sect. 2; the methodology, including the evaluation of selected rainfall products, the use of hydrological modeling, and the inference of reservoir storage, is detailed in Sect. 3; in Sect. 4, the results of the study are presented; the results are discussed in Sect. 5; and, finally, the work is summarized in Sect. 6.
2.1 Upper Blue Nile basin
The Blue Nile River basin has a drainage area of 310 000 km2 that is shared between Ethiopia (64 %) and Sudan (36 %). The water is supplied from Lake Tana, in the northwestern Ethiopian Highlands at 1780 m a.s.l, and flows clockwise through the eastern mountainous side of the basin to the western lower-altitude side. A few kilometers after the Ethiopian–Sudanese border, the water is measured at the outlet of the UBN basin at Eldiem station (481 m a.s.l). Afterward, the water is drained from the Lower Blue Nile (LBN) basin through the Blue Nile River and its tributaries, the Dinder River and the Rahad River, to the main Nile River (as shown in Fig. 1b).
The UBN basin, which covers an area of around 176 000 km2, is the region of interest for this study. The basin is subdivided into 14 subbasins, as shown in Fig. 1c. The rainfall in the UBN basin ranges from 1000 mm yr−1 near the Ethiopian–Sudanese border to 2200 mm yr−1 in the Didessa and Dabus subbasins, reflecting the high spatial variability in the precipitation associated with topographical features (i.e., so-called water towers) that is typical of much of East Africa (Wamucii et al., 2021). There is a high but spatially variable mean potential evapotranspiration that varies between 1000 and 1800 mm yr−1 (Conway, 2000). The typical annual air temperature in the basin ranges from 13 to 26 ∘C (Tekleab et al., 2013). The discharge regime of the Blue Nile River is highly seasonal, with more than 80 % of its annual discharge occurring between July and October and only 4 % between January and April (Kim and Kaluarachchi, 2009; Sutcliffe and Parks, 1999).
Four main land uses dominate in the UBN basin – cropland (54.74 %), open forest (23.62 %), shrubland (8.29 %), and closed forest (7.94 %); the remaining land uses cover only 5.41 % of the total area based on the Copernicus Global Land Service (Buchhorn et al., 2020). The large basin is composed of heterogeneous soil types. According to the SoilGrids dataset (Hengl et al., 2017), the most common types are Leptosols, Luvisols, Vertisols, and Nitisols, which collectively occupy 96 % of the area.
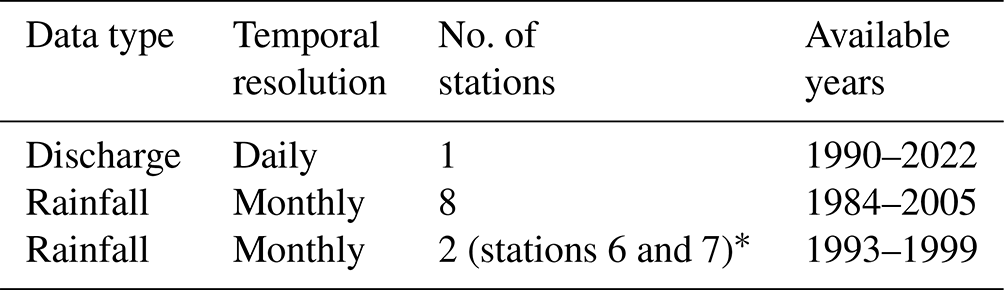
2.2 Ground measurements
The scarcity of ground measurements in terms of availability and accessibility is a challenge and motivation for this study. Streamflow stations are scattered in the basin and cover many subbasins, but their data are not publicly available. Downstream of GERD, after the border, Sudan has been measuring the incoming water at Eldiem station since the 1960s (Fig. 1b). These data were obtained from the MoIWR for the period from 1990 to 2022 with a daily time step. Consequently, the calibration and validation of the hydrological model will be based on these measurements, as will be detailed later. It is worth mentioning that the discharge at Eldiem station is estimated from measured water levels using rating curves. From 2012 onwards, Eldiem station is influenced by the backwater effect of the Roseires Dam during filling months (June–October). During these months, the MoIWR estimates the discharge from the water balance of the Roseires Dam.
Despite the availability of more than 1200 meteorological stations in Ethiopia, the existing stations within the UBN basin are not sufficient to cover the spatial variability in rainfall. Additionally, the measured rainfall data are not freely available from the National Meteorological Agency of Ethiopia. However, historical monthly rainfall measurements at 10 stations were obtained from the National Meteorological Agency of Ethiopia, as indicated in Fig. 1c and Table 1. Therefore, rainfall measurements will be used to validate the satellite and reanalysis rainfall products available for this region, as remote-sensing products cover the entire basin and recent data are available.
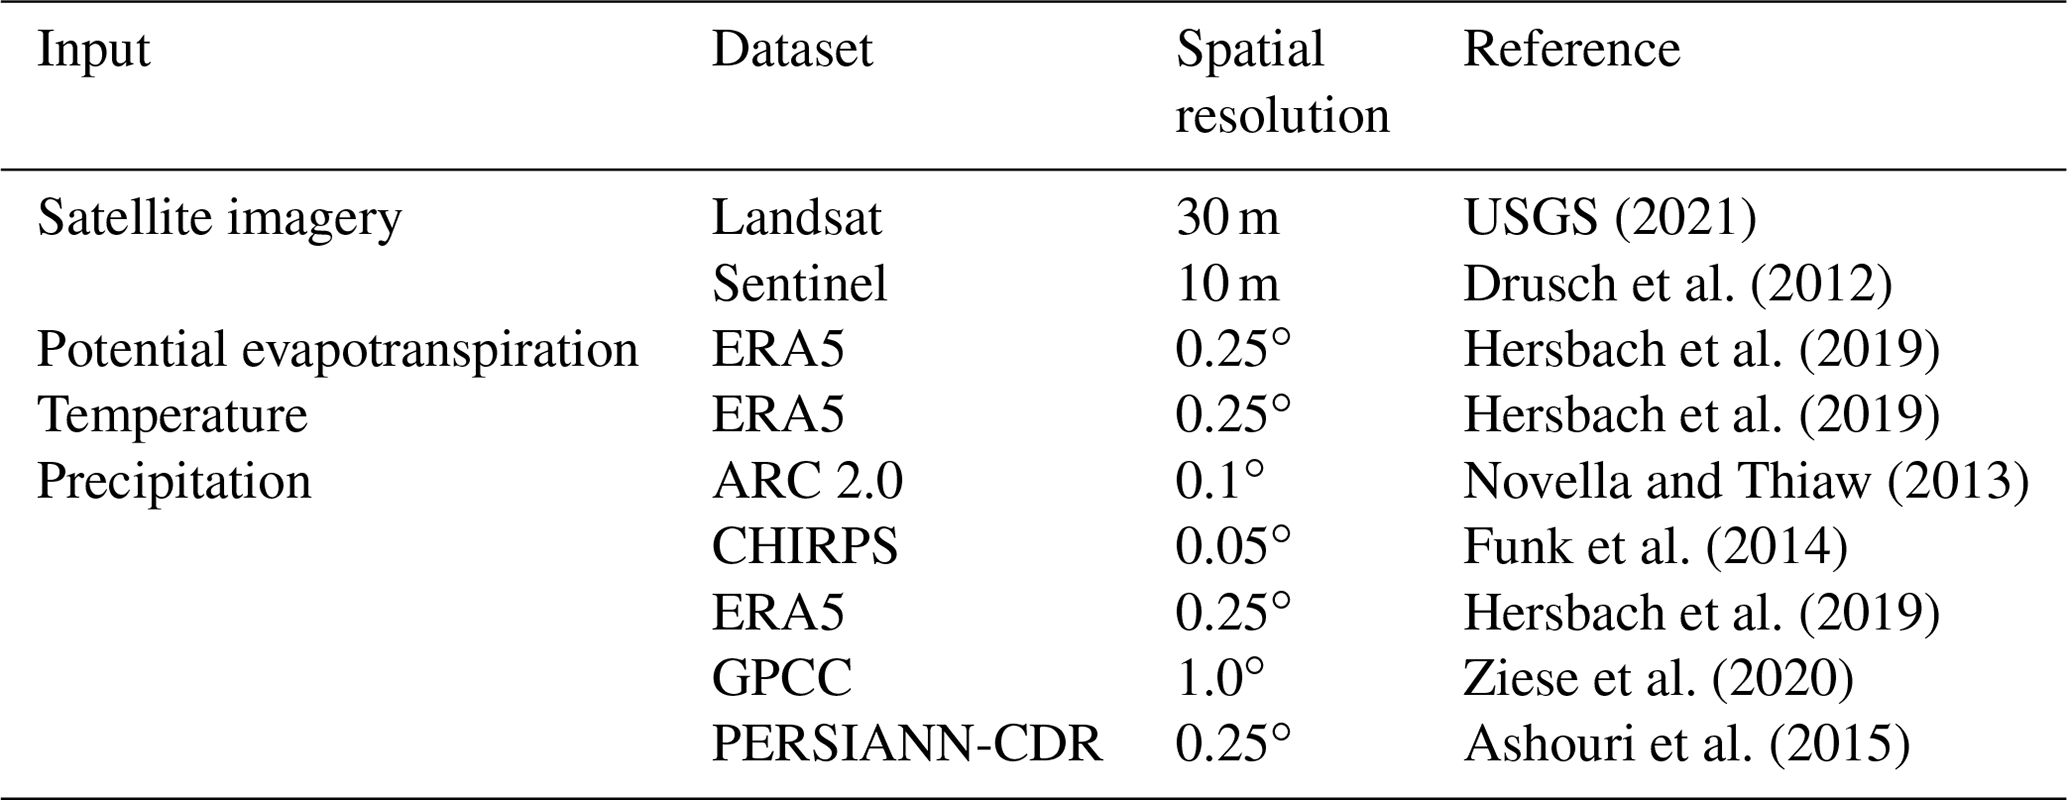
2.3 Input data
Due to the unavailability of the required observed input data, remote-sensing products will be used in this study. These products include meteorological forcing data (precipitation, potential evapotranspiration, and temperature) and satellite imagery (Landsat and Sentinel). The spatial resolution and references of the selected datasets are summarized in Table 2 and will be utilized for different purposes, as detailed in the following sections.
In this study, the quality of five rainfall products will be tested: the African Rainfall Climatology, version 2 (ARC2); the Climate Hazards Group InfraRed Precipitation with Station, version 2 (CHIRPS); the fifth-generation ECMWF atmospheric reanalysis (ERA5); the Global Precipitation Climatology Centre Full Data Reanalysis, version 7 (GPCC); and the Precipitation Estimation from Remotely Sensed Information using Artificial Neural Networks – Climate Data Record (PERSIANN-CDR). The potential evaporation and temperature data are retrieved from ERA5.
USGS (2021)Drusch et al. (2012)Hersbach et al. (2019)Hersbach et al. (2019)Novella and Thiaw (2013)Funk et al. (2014)Hersbach et al. (2019)Ziese et al. (2020)Ashouri et al. (2015)Table 2Summary of the remote-sensing products used as input in the hydrological modeling over the Upper Blue Nile (UBN) basin.
3.1 Evaluation of selected rainfall products
As rainfall products will be used as forcing data, it is important to understand how these data perform in comparison with the available ground measurements. The selection of a representative product is likely to be crucial for minimizing model output uncertainty. In this step, the available monthly rainfall observations at the sites shown in Fig. 1c were used to investigate the performance of the five mentioned rainfall products using a point-to-pixel approach (see Fig. 2). The approach compares the time series of observed rainfall to the gridded products assuming that grid-cell values are represented by the corresponding rain gauge measurements (e.g., Thiemig et al., 2012; Basheer and Elagib, 2019; McNamara et al., 2021). This approach is useful for data-scarce regions.
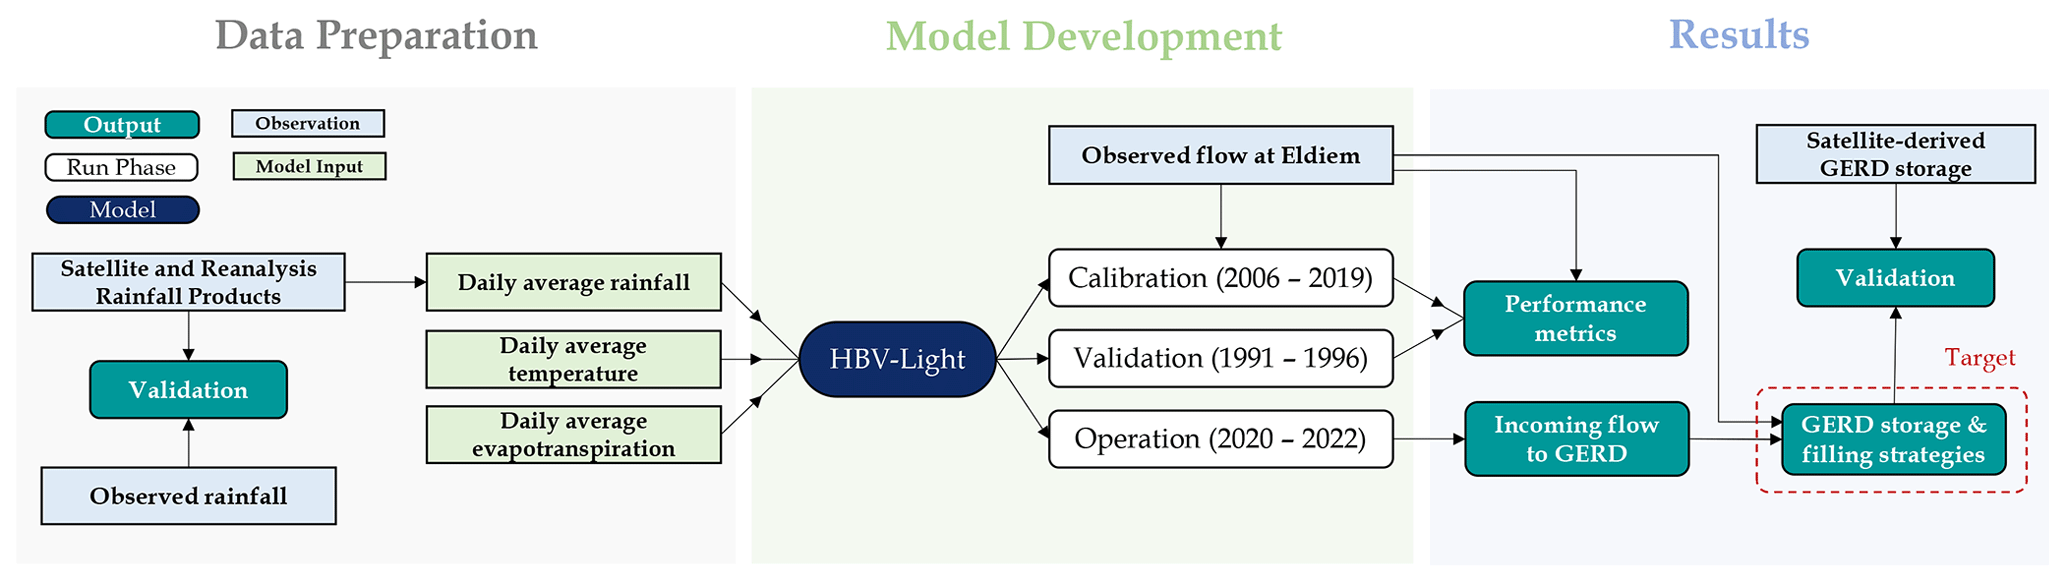
Figure 2Flowchart representing the research methodology. Steps are shown in chronological order, and the execution is carried out from left to right. For rainfall product validation, five products are selected: ARC 2.0, CHIRPS 2.0, ERA5, GPCC, and PERSIANN-CDR. For storage validation, observed storage is computed by converting the water surface area observed by Landsat/Sentinel to water volume using the elevation–area–storage relationship of the GERD reservoir.
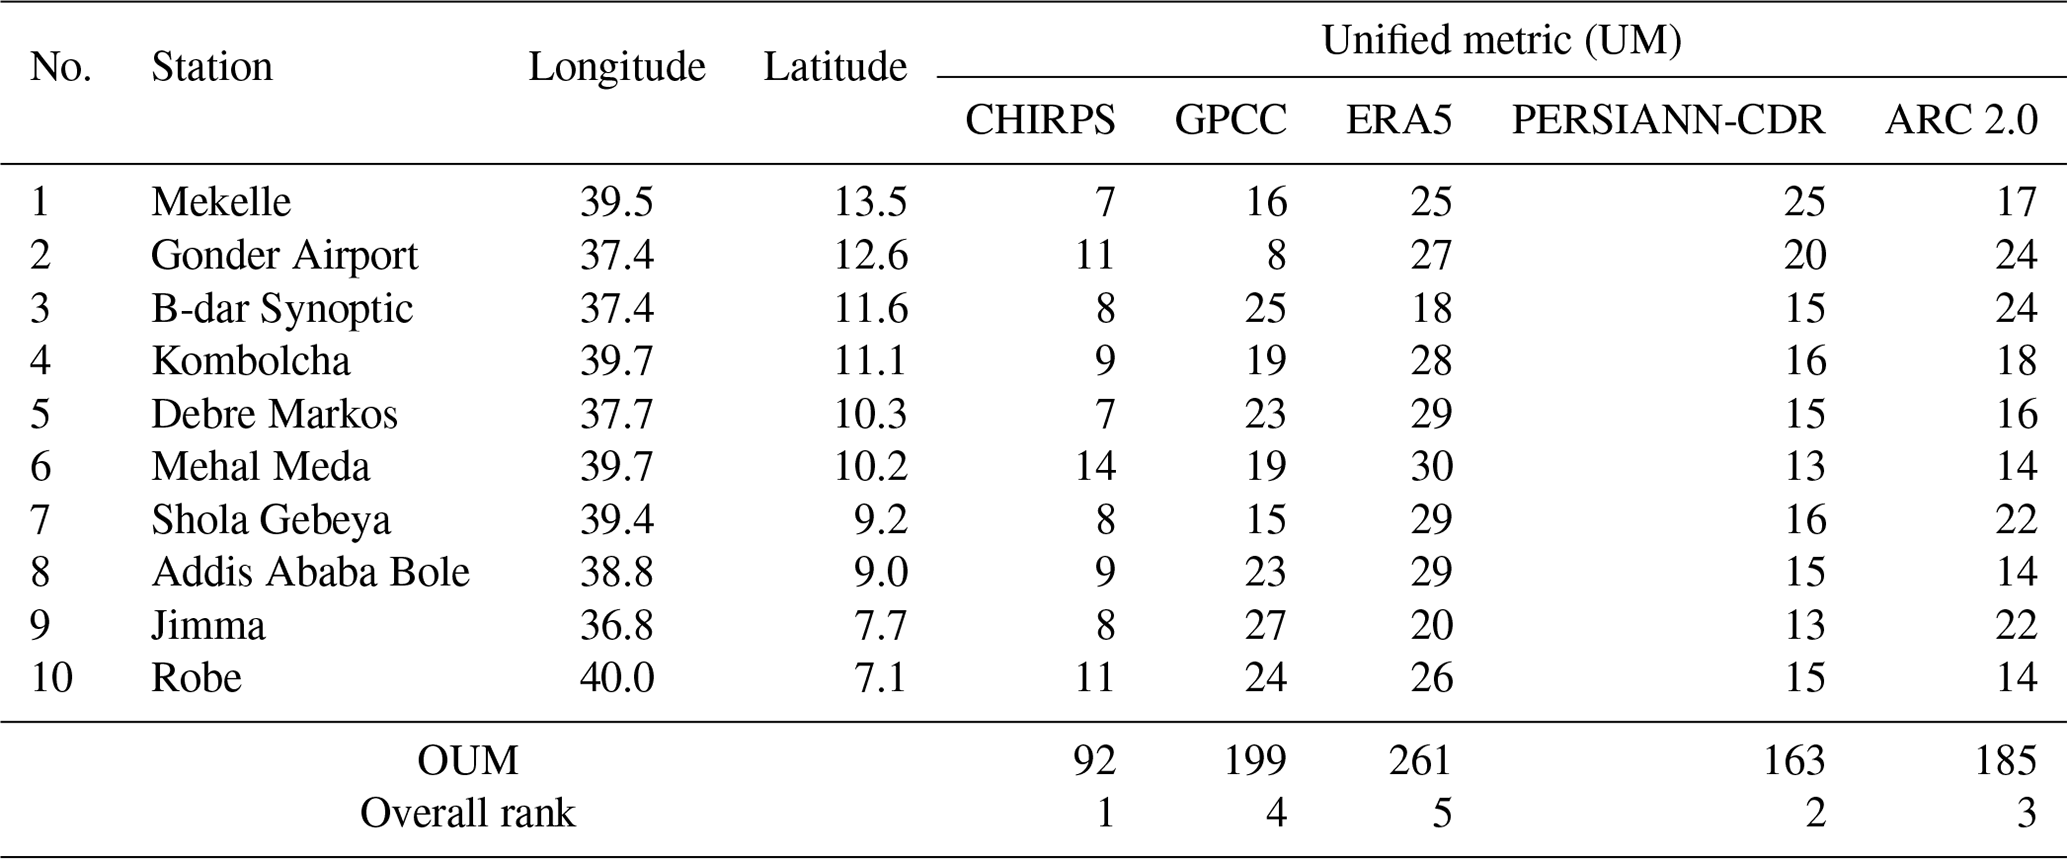
A statistical validation using six performance metrics (three linear fit metrics – coefficient of determination, R2; intercept; and slope – and three error metrics – mean absolute error, MAE; mean bias error, MBE; and root-mean-square error, RMSE) was carried out using the equations in Table B1 in the Appendix. Additionally, to draw general conclusions, the products were ranked based on the calculation of the unified metric (UM; Eq. 1) and the overall unified metric (OUM; Eq. 2) (Elagib and Mansell, 2000). The UM indicates the ranking of each product at each station, while the OUM is the sum of the UM values for each product at all stations. Firstly, each product is ranked per station for each metric. Secondly, the performance rankings are summed up per product, with a low value indicating good performance and a high value indicating poor performance relative to each other.
Here, is the rank of the product p based on the performance metric m at station i; OUMp is the overall unified metric of the rainfall product p; and K and L are the number of considered performance metrics and rainfall stations, respectively. UM ranges from K=6 to K× No. of rainfall products = 30. While the minimum OUM value is 60 (K×L) and the maximum value is 300 ( No. of rainfall products).
Based on this analysis, the first three highest-ranked rainfall products will be selected to analyze the influence of the uncertainty in the rainfall product on retrieving reservoir storage strategies. This is due to the fact that precipitation changes can dominate reservoir volume changes (Hou et al., 2022). It is important to note that the rank of the rainfall products might differ if the analysis was based on the daily time step that is used in our hydrological model simulations.
3.2 Hydrological modeling
From 57 previous studies in the literature between 2007 and 2022, 26 hydrological models have been implemented in the Upper Blue Nile basin (see Table C1). The Soil and Water Assessment Tool (SWAT) and the Hydrologiska Byråns Vattenbalansavdelning (HBV) are the most commonly used models, utilized in 23 and 11 studies, respectively. Both models performed well with respect to simulating the runoff at the outlet of the UBN basin (Betrie et al., 2009; Teklesadik et al., 2017). Bizuneh et al. (2021) compared the models' performance in the UBN basin and concluded that SWAT showed better performance in the three studied watersheds. However, the HBV conceptual model will be used in this work due to its lower demand for input data compared with the SWAT model as well as the limited number of parameters. HBV is a widely used conceptual hydrological model developed by Bergström (1995), although several different implementations have been used (Jansen et al., 2021). In this study, a lumped representation of the original HBV model will be used, namely HBV-light (Seibert and Vis, 2012). The lumped model simulates daily discharge using daily average precipitation, temperature, and potential evapotranspiration over the basin as input (Seibert, 1996). In addition to its flexibility and computational efficiency, HBV has been successfully applied in the UBN basin (e.g., Uhlenbrook et al., 2010).
HBV-light will be calibrated for a period of 14 years (70 %), from 2006 to 2019, and afterward validated for 6 years (30 %), from 1991 to 1996 (see Fig. 2). The selection of the years was due to a considerable gap in the measurements from 1997 to 2000. Although the climate might show non-stationarity, we still consider the optimized parameters robust enough to draw conclusions for two reasons. First, the calibration and validation periods extend over a long duration. Second, as noted by Melsen et al. (2018), parameter sets are not typically the dominating source of uncertainty when considering long-term changes simulated with hydrological models such as HBV, which was also employed in this study. Additionally, as a warm-up year, 1 year before each period (i.e., 2005 and 1990) will be used to avoid the effect of the initial values. Furthermore, to account for parameter uncertainty, the generalized likelihood uncertainty estimation (GLUE) method will be adopted (Beven and Freer, 2001). The GLUE method was employed because it is simple and commonly used in hydrology. In hydrological models, the Nash–Sutcliffe efficiency (NSE), proposed by Nash and Sutcliffe (1970), is widely used as the objective function (Setegn et al., 2010). Therefore, different parameter sets will be selected based on the NSE exceeding a threshold value of 0.75, which is classified as very good performance according to Moriasi et al. (2007). Moreover, to evaluate the performance of the hydrological model, the Moriasi et al. (2007) classification will be used.
3.3 Retrieving GERD filling strategies
3.3.1 Reservoir area and storage from satellite observations
As observations of GERD filling are currently not available, the quantification of the reservoir storage using satellite imagery will allow researchers to validate the ability of the hydrological modeling to retrieve the filling strategies (see Fig. 2). This can also provide insights into the sensitivity of storage estimation to the selection of rainfall products.
On the one hand, to derive reservoir storage from Landsat images, The Landsat Collection 2 Level-2 product was obtained. Landsat was selected due to its high spatial resolution (30 m) as well as its reasonable revisit time (16 d). Additionally, to increase the temporal resolution up to 8 d, images from multiple satellites (i.e., Landsat 7, 8, and 9) were used (the steps are shown in Fig. A1a). Different indices allow the estimation of the water surface area (WSA); in this study, the normalized difference water index (NDWI), based on Eq. (3), was selected. Hence, three bands are needed from Landsat: the green (GRN), near-infrared (NIR), and quality assessment bands.
Firstly, the images over the GERD reservoir were obtained from the three satellites. However, Landsat 7 images contain missing data stripes caused by the scan line corrector (SLC) failure (Scaramuzza and Barsi, 2005). The missing data were filled using the “Fill nodata” tool in Quantum GIS (QGIS, 2009). Then, as the GERD reservoir is covered by two tiles, the tiles were mosaicked and clipped over the reservoir extent. Based on the NDWI maps, the algorithm of Vu et al. (2022) was used to estimate the WSA. This algorithm is an improvement on the algorithm introduced by Gao et al. (2012) and modified by Zhang et al. (2014) to allow for the use of Landsat Collection 1 data. The algorithm improves the estimation of the images with clouds by using cloudless images and removing clouds, cloud shadows, and no-data pixels. The improvement is two-fold: the selection of cloudless images and the identification of additional water zones. From 2022 onwards, only Collection 2 structures will be used for new Landsat data. Therefore, the algorithm was adapted for the processing of all new Landsat acquisitions.
On the other hand, the computation of WSA from Sentinel-2 imagery was performed using the PyGEE-SWToolbox (Owusu et al., 2022). This open-source toolbox was observed to be a user-friendly, adaptable, and dependable method for quantifying WSA. The software provides a graphical user interface for obtaining WSA time-series data from diverse satellite imagery datasets, including Sentinel-2. Consequently, by utilizing NDWI calculations and a predetermined threshold value of zero, we can accurately detect and classify pixels as waterbodies (i.e., NDWI > 0). Detailed steps can be seen in Fig. A1b.
Finally, to convert the estimated WSA to storage, an area–storage relationship is required. For this, the elevation–area–storage relationship of the reservoir was produced from the Shuttle Radar Topography Mission (SRTM) digital elevation model (Farr et al., 2007) using the Python code written by Vu et al. (2022). Finally, dates with suspicious values were checked manually and erroneous values were removed. The unrealistic values were found to occur mainly when the images were completely covered with clouds.
3.3.2 Reservoir storage from hydrological modeling
In July 2020, GERD started filling; thus, the assumption that the observed flow to Sudan (at Eldiem) is equal to the incoming flow to GERD is no longer valid. Accordingly, to predict the unknown inflow to GERD after 2020, calibrated hydrological models will be utilized. HBV-light will be run for the period from 2020 to 2022 using the optimized parameter sets (see Fig. 2). Thereafter, the observed and simulated discharge will be used together to estimate the water storage volume at the reservoir with the following equations:
Here, Qin and Qout are the daily inflow to and outflow from the dam, respectively; is the daily change in reservoir storage volume; E is the evaporated volume of water from the reservoir; and θ is the fraction of the inflow volume retained by the reservoir, which ranges between 0 and 1. The last two equations (i.e., Eqs. 5 and 6) are used to estimate the daily storage that, when accumulated, gives the total stored water in the reservoir. The daily inflow Qin will be estimated from the hydrological modeling, whereas the daily outflow Qout will be based on discharge measurements at Eldiem station. To calculate E for each time step, the estimated daily average evaporation per month obtained from Khairy et al. (2019) is multiplied by the reservoir surface area at that time step. The area is estimated from the storage using the acquired area–storage relationship.
4.1 Performance of the rainfall products
The performance of the five selected rainfall products based on 10 rain gauge stations was estimated and is illustrated in a boxplot for each performance metric (see Fig. 3). From the boxplots, it can be revealed that CHIRPS has the most accurate estimates, as it is the closest product to the optimal values (horizontal dashed red lines) in most of the evaluated metrics. CHIRPS has a high mean R2 of 0.89, a mean slope of 0.96, and a relatively low mean intercept of 10 mm. CHIRPS has the lowest values for the error metrics: 36.66 mm for the RMSE, 5.31 mm for the MBE, and 23.7 mm for the MAE. Moreover, GPCC and ARC2 exhibited the best mean slope and intercept, respectively. On the other hand, ERA5 shows the highest overestimation (mean slope of 1.28) and the highest error values. Additionally, it is also clear that ARC2 consistently underestimates the rainfall at all locations (negative MBE values). The performance of the rainfall products also varied spatially at the different stations. The spatial distribution of the calculated metrics (see Fig. B1) demonstrated consistent performance of CHIRPS over the spatial extent and high spatial variation in ERA5. For further demonstration of the metrics' values and spatial distribution, the reader is referred to Figs. B1 and B2 in the Appendix.
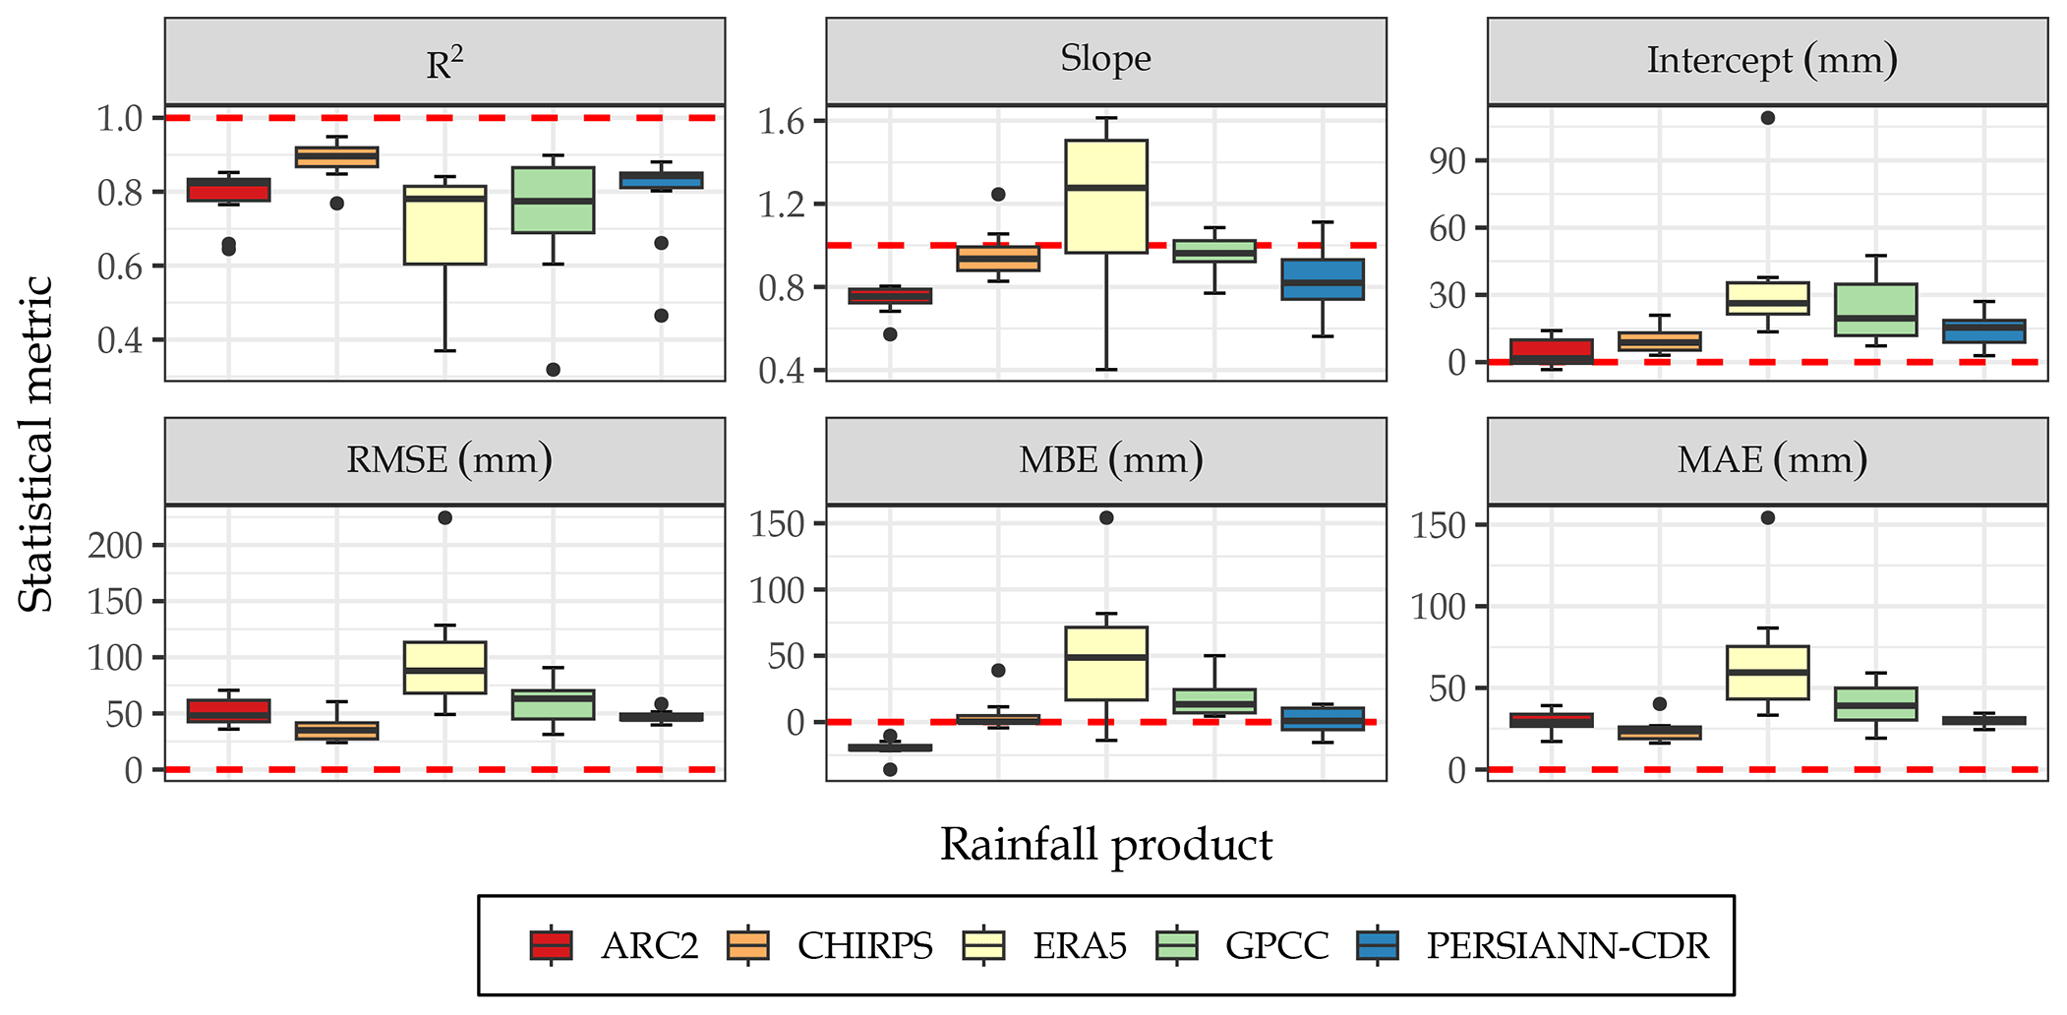
Furthermore, the UM in Table 3 emphasizes the accuracy of CHIRPS (i.e., has the lowest values) at almost all stations, unlike ERA5, which was the least accurate product. Additionally, the calculation of the OUM showed that the overall best-performing product is CHIRPS, followed by PERSIANN-CDR, ARC2, GPCC, and ERA5. Therefore, CHIRPS is expected to perform better with respect to simulating the discharge in the river, estimating the water stored behind the dam, and retrieving the filling strategies. However, the first three rainfall products were selected as forcing data for the hydrological modeling to account for the input uncertainty in retrieving the filling strategies.
Table 3Ranking of the satellite and reanalysis rainfall products for each station based on 10 selected rain gauge stations. UM is the unified metric and OUM is the overall unified metric.
4.2 Hydrological modeling using HBV-light
4.2.1 Model calibration and validation
The HBV-light model was forced by ERA5 temperature and potential evapotranspiration estimates, and CHIRPS, PERSIANN-CDR, and ARC2 rainfall data were provided to account for input uncertainty. Initially, the parameter ranges tested in the Gilgel Abay catchment in the UBN basin by Uhlenbrook et al. (2010) were adopted. However, the model performance was limited by the initial range of the maximum soil moisture (FC), which was 200 to 600 mm. Therefore, a new range of 200 to 1000 mm was selected that was sufficient to tackle this issue. HBV-light routines, parameter symbols and descriptions, and parameter ranges are listed in Table D1.
To account for parameter uncertainty, 10 000 random parameter sets were generated by the Monte Carlo runs of HBV-light based on the parameter ranges and assuming a uniform distribution. After running the model during the calibration period, 1756 model simulations achieved an NSE > 0.75 when using CHIRPS, whereas only 269 and 244 simulations achieved this performance in the case of PERSIANN-CDR and ARC2, respectively. In further analysis, we rely on the parameter set that resulted in the best model performance (best simulation). However, we acknowledge that other parameter sets with high performance may be equally valid. Figure D1 shows the range of each parameter for the very good simulations in comparison to the applied parameter range (with narrower ranges indicating sensitivity). As a result, the simulated discharge was found to be sensitive to FC, the shape coefficient BETA, and the regression coefficients K1 and K2 when using the three rainfall products.
Figure 4a and b show the daily time series of simulated (using CHIRPS) and observed discharge over the calibration and validation periods, respectively (see Fig. D2a and b for both PERSIANN-CDR and ARC2). The parameter set that obtained the highest performance for each rainfall product is indicated in Table D1. Looking at the best simulation, it can be revealed that HBV-light was able to capture the intra-annual seasonality in the three rainfall cases and in both periods, but it hardly captured the daily variation in discharge, especially for high flows, as also noted by Uhlenbrook et al. (2010). Accordingly, the models resulted in very good NSE values (as shown in Table 4), but they dropped to satisfactory (0.51) and unsatisfactory (−0.32 and −0.25) values for CHIRPS, PERSIANN-CDR, and ARC2 during calibration years, respectively, after removing the seasonality.
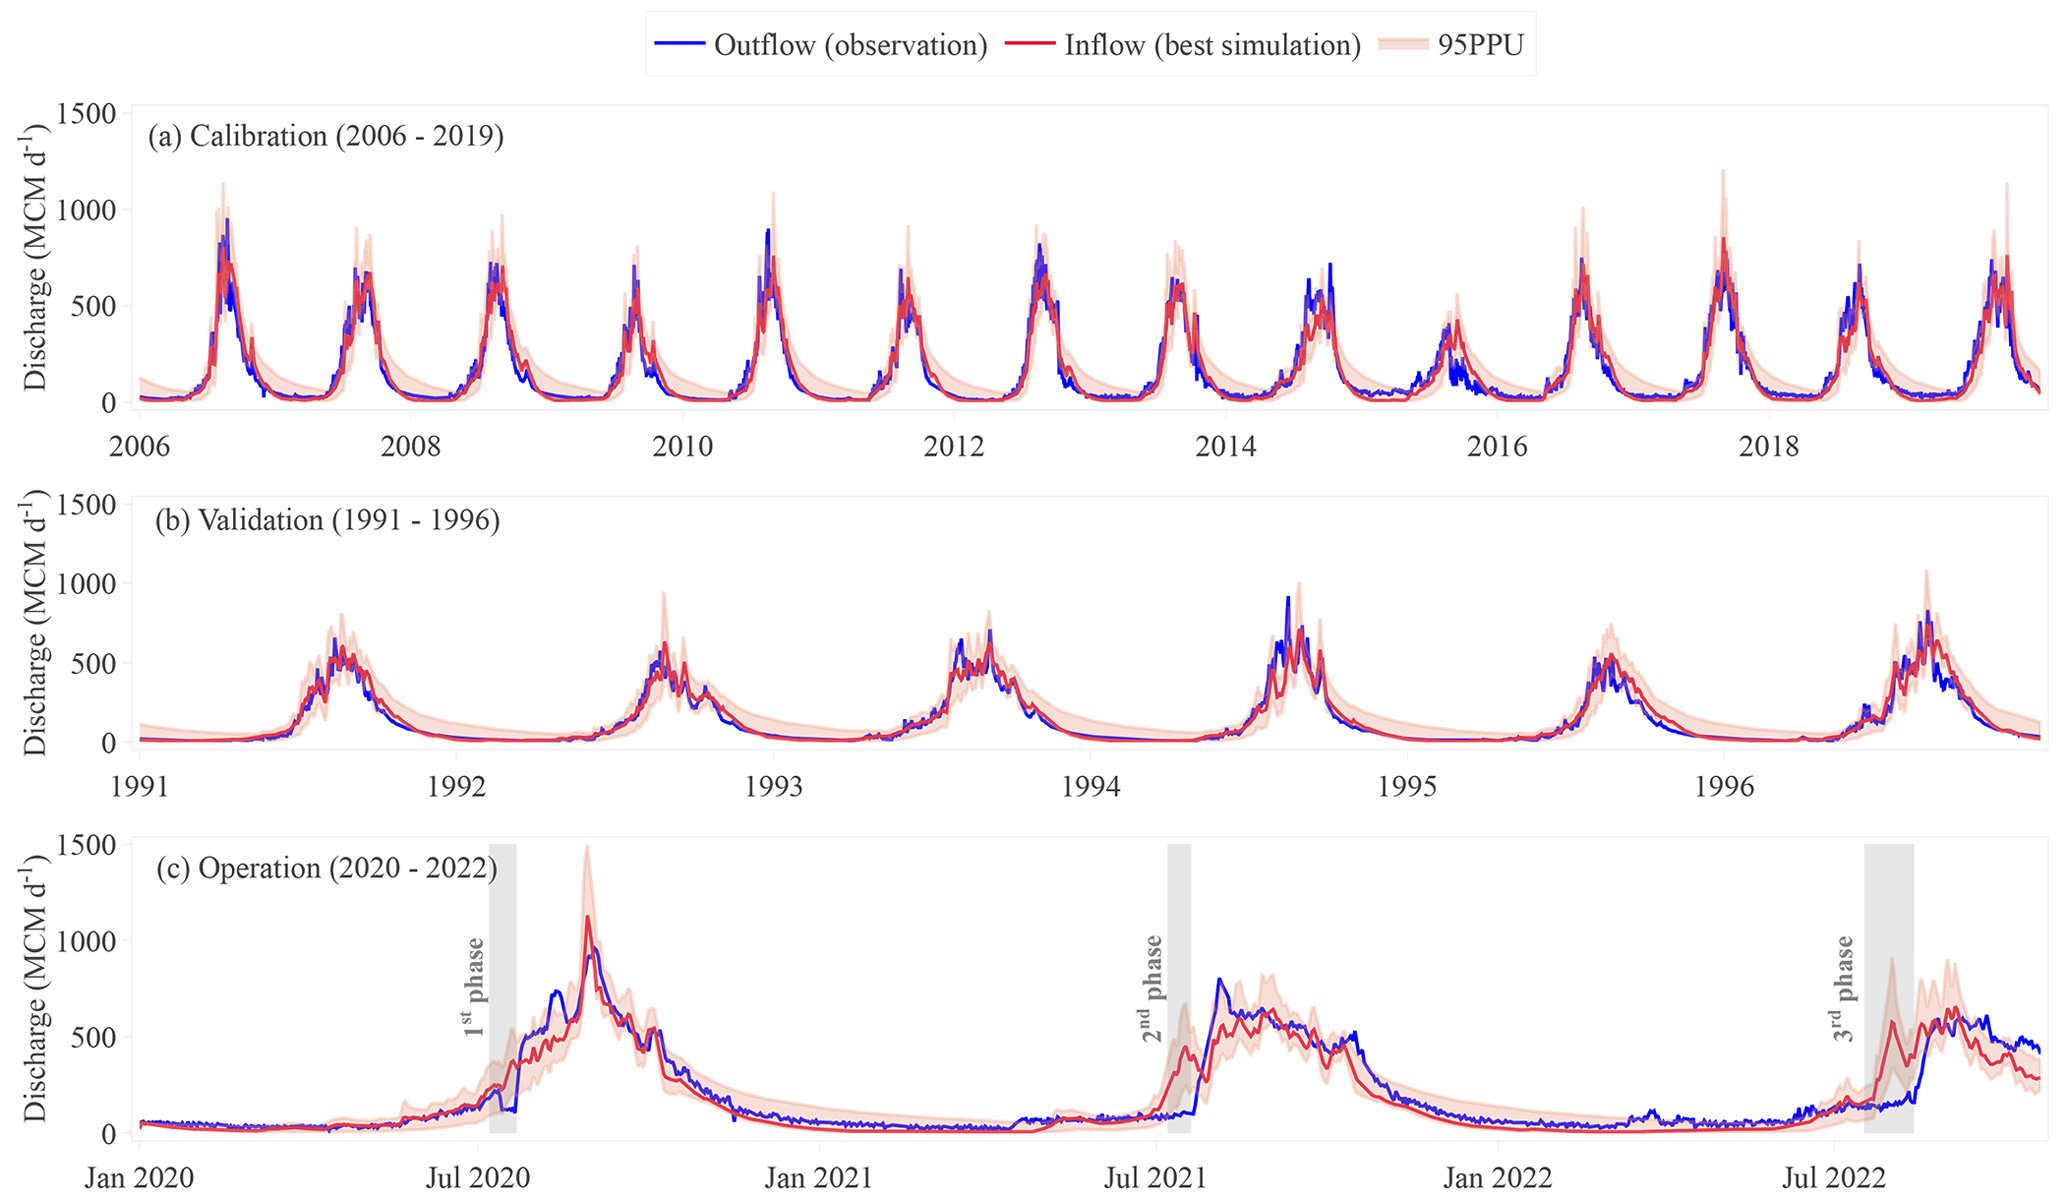
Figure 4Temporal dynamics of daily simulated and observed discharge at the Upper Blue Nile basin outlet. Simulations forced with CHIRPS rainfall are shown during (a) the calibration period, (b) the validation period, and (c) the operation period. The best simulation was based on the parameter sets that achieved the highest NSE value during calibration. The 95 % prediction uncertainty (95PPU) represents the 95th percentile of all very good simulations (NSE > 0.75) obtained by random generation of the parameter sets. The vertical gray shaded areas in the operation period roughly indicate the days on which the dam is filling. MCM stands for million cubic meters (106m3).
Table 4The statistical summary of HBV-light simulations. The P factor measures the proportion of observations falling within the uncertainty range, while the R factor characterizes the extent of uncertainty relative to the variation in the measurements.
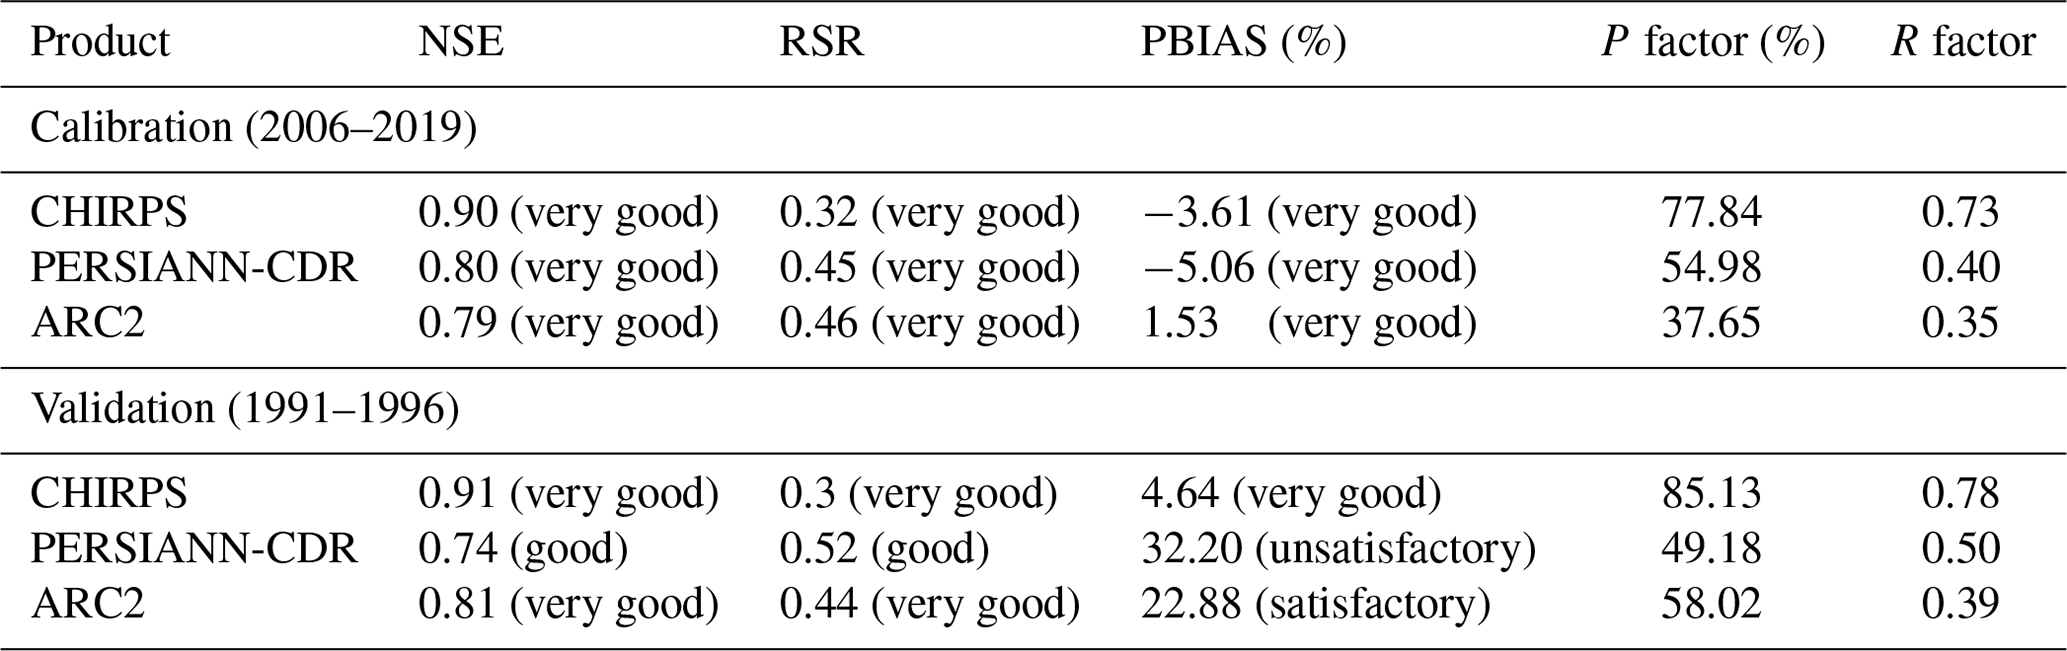
The classification according to Moriasi et al. (2007) is as follows: very good (0.75 < NSE ≤ 1.0; 0 ≤ RSR ≤ 0.5; PBIAS < ±10); good (0.65 < NSE ≤ 0.75; 0.5 < RSR ≤ 0.6; ±10 ≤ PBIAS < ±15); satisfactory (0.50 < NSE ≤ 0.65; 0.6 < RSR ≤ 0.7; ±15 ≤ PBIAS < ±25);
unsatisfactory (NSE ≤ 0.5; RSR > 0.7; PBIAS ≥ ±25).
Table 4 also allows for a comparison of the behavior of the model when utilizing the different rainfall products. Firstly, the performance of the best simulations was represented by the first three metrics (NSE; percentage bias, PBIAS; and the ratio of RMSE to measured standard deviation, RSR), the equations of which are given in Table B1. For all rainfall products, the NSE and RSR values were found to be very good in the calibration and validation runs, except for PERSIANN-CDR during validation which presented good values, thereby confirming the skillful predictive ability of the HBV-light model. On the other hand, the PBIAS was generally very good, but ARC2 and PERSIANN-CDR overestimated the discharge when applied from 1991 to 1996, resulting in satisfactory and unsatisfactory performance, respectively. Secondly, the P factor and R factor were used to measure the uncertainty. The highest percentage of the observations bracketed by the 95PPU was found for CHIRPS (78 % and 85 %), whereas the lowest percentages were found for ARC2 during calibration (38 %) and PERSIANN-CDR during validation (49 %). Additionally, the uncertainty range of CHIRPS was found to be the widest (0.73 and 0.78) and ARC2 the narrowest (0.35 and 0.39). Overall, from the analysis of model performance and uncertainty, it can be concluded that CHIRPS is the best product for simulating the discharge at the outlet of the UBN basin, followed by ARC2 and then PERSIANN-CDR.
4.2.2 Predicted inflow to GERD
Since 2020, the inflow to GERD has been unknown in Sudan due to data-sharing challenges. Therefore, the main purpose of the HBV-light model in this study was the prediction of inflow to GERD. The selected parameter sets in the last step were run from 2020 to 2022. Figure 4c illustrates the daily inflow (from HBV-light using CHIRPS) and outflow (from Eldiem station) of GERD (see Fig. D2c for both PERSIANN-CDR and ARC2). It is important to note that PERSIANN-CDR data were available up to June 2022 (before the third filling phase).
Firstly, for the three rainfall products, it is obvious that the inflows were greater than the outflow during filling dates (vertical gray shaded areas), indicating the occurrence of reservoir filling. However, the filling periods were better captured by CHIRPS, followed by PERSIANN-CDR and ARC2 which gave longer filling periods (longer periods where inflow was greater than outflow). Moreover, PERSIANN-CDR demonstrated two filling phases in July and August of the first year.
Secondly, during no-fill dates, water passes through the dam; therefore, it is expected that inflow is equal to the outflow. However, due to model, parameter, and data uncertainties, this is difficult to ascertain; thus, outflow should be within the uncertainty range. The 95PPU range was only able to bracket the discharge during no-fill dates for CHIRPS runs. In the case of PERSIANN-CDR, the inflow was significantly lower than the outflow, falsely indicating a release from the reservoir (no emptying of the reservoir occurred during this period). Lastly, ARC2 showed very high inflows from June to October, suggesting a large storage amount.
Overall, based on the analysis during the filling period, CHIRPS was efficient with respect to reproducing the hydrological properties of the system after 2020, whereas PERSIANN-CDR and ARC2 missed important features (i.e., filling dates).
4.3 Reservoir storage estimation
4.3.1 Elevation–area–storage (E–A–S) relationship
The elevation–area–storage (E–A–S) relationship is essential in this work for two reasons: (1) converting the WSA values observed by satellite imageries to storage values and (2) estimating the WSA corresponding to daily modeled GERD storage and, hence, calculating the total daily evaporation from the reservoir. Therefore, the E–A–S relationship was derived from the SRTM, starting with estimating the area corresponding to each water level (E–A relationship) at 1 m increments. Next, the reservoir volume corresponding to each water level was calculated using trapezoidal approximation (Gao et al., 2012; Bonnema and Hossain, 2019). The obtained E–A, A–S, and E–S relationships were fitted with a fifth-degree polynomial, as illustrated in Fig. 5. Further detailed information about the approximation can be found in the study by Vu et al. (2022).
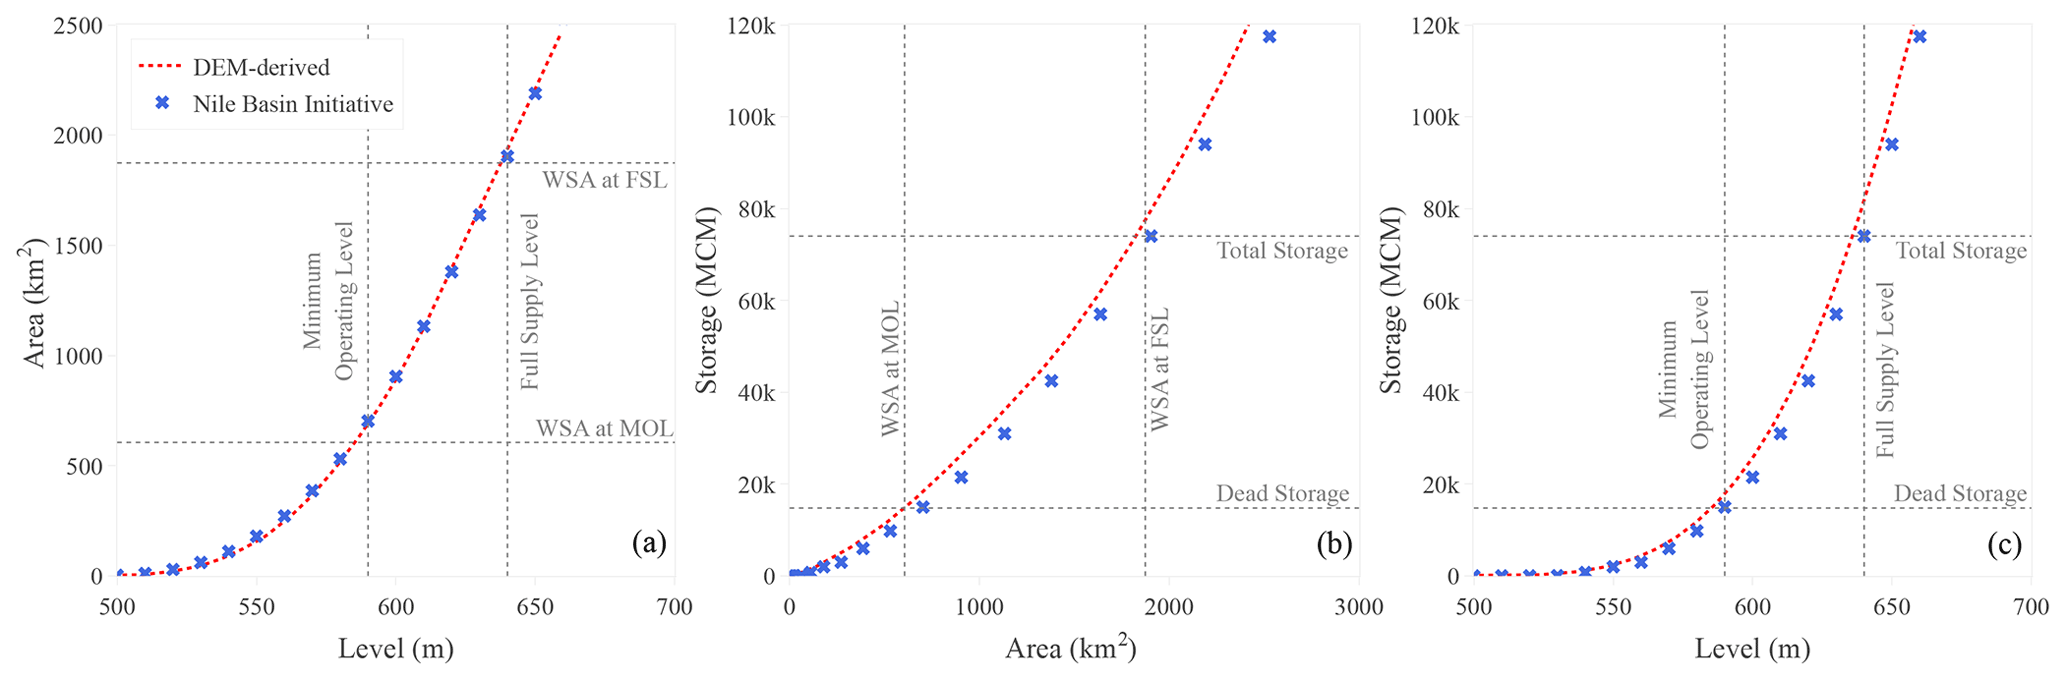
Figure 5Elevation–area–storage (E–A–S) relationship of GERD reservoir obtained from the SRTM DEM in comparison with the Nile Basin Initiative relationship: (a) elevation–area relationship, (b) area–storage relationship, and (c) elevation–storage relationship. The DEM-derived lines are the results of a fifth-degree polynomial fitting to the data points obtained at 1 m water level intervals.
On behalf of 10 Nile Basin countries, the Nile Basin Initiative (NBI) has been commissioned to conduct studies in the region. The Eastern Nile Technical Regional Office of the NBI produced the E–A–S relationship for the GERD reservoir, and it was published in Wheeler et al. (2016). When comparing the relationships derived from the digital elevation model (DEM) with the NBI, there is agreement with respect to the E–A relationship (see Fig. 5a). However, the NBI underestimates the storage corresponding to the water levels and surface areas (see Fig. 5b and c).
To validate the relationship, the intersected dotted gray lines in Fig. 5 demonstrate the characteristics of GERD reported by the International Panel of Experts (IPoE; IPoE, 2013). The most important for this study is the A–S relationship, especially for areas less than 1000 km2 in size, as GERD recently started to fill. For this range, the DEM-derived relationship intersects with the values reported by the IPoE, indicating better estimation than the NBI (see Fig. 5b). Moreover, SRTM data have commonly been applied to obtain the E–A–S relationship of GERD (Kansara et al., 2021; Chen et al., 2021; Salama et al., 2022). For this reason, the following analysis will be based on the DEM-derived relationship.
4.3.2 Satellite-derived reservoir area and storage
The water surface area (WSA) of the GERD reservoir was estimated using Landsat and Sentinel images (steps are shown in Fig. A1). The results (i.e., reservoir area and storage) were more or less similar. Therefore, we will focus on discussing Landsat results and refer to Sentinel when necessary.
WSA estimation from Landsat images was based on the algorithm modified by Vu et al. (2022). This algorithm uses the cloudless images (i.e., images with less than 20 % clouds) to create an expanded mask as well as a zone mask to correct the disturbed images. A total of 133 Landsat images are available from January 2020 to September 2022, 70 images (53 %) of which are classified as cloudless. Figure 6a presents the WSA time series and reveals a significant increase in the WSA after improvement (green points) when compared with the WSA before improvement (light orange points). Additionally, the abrupt changes in the reservoir area are observed less after improvement, showing an important enhancement due to the algorithm. However, the WSA was underestimated in some images due to high cloud coverage.
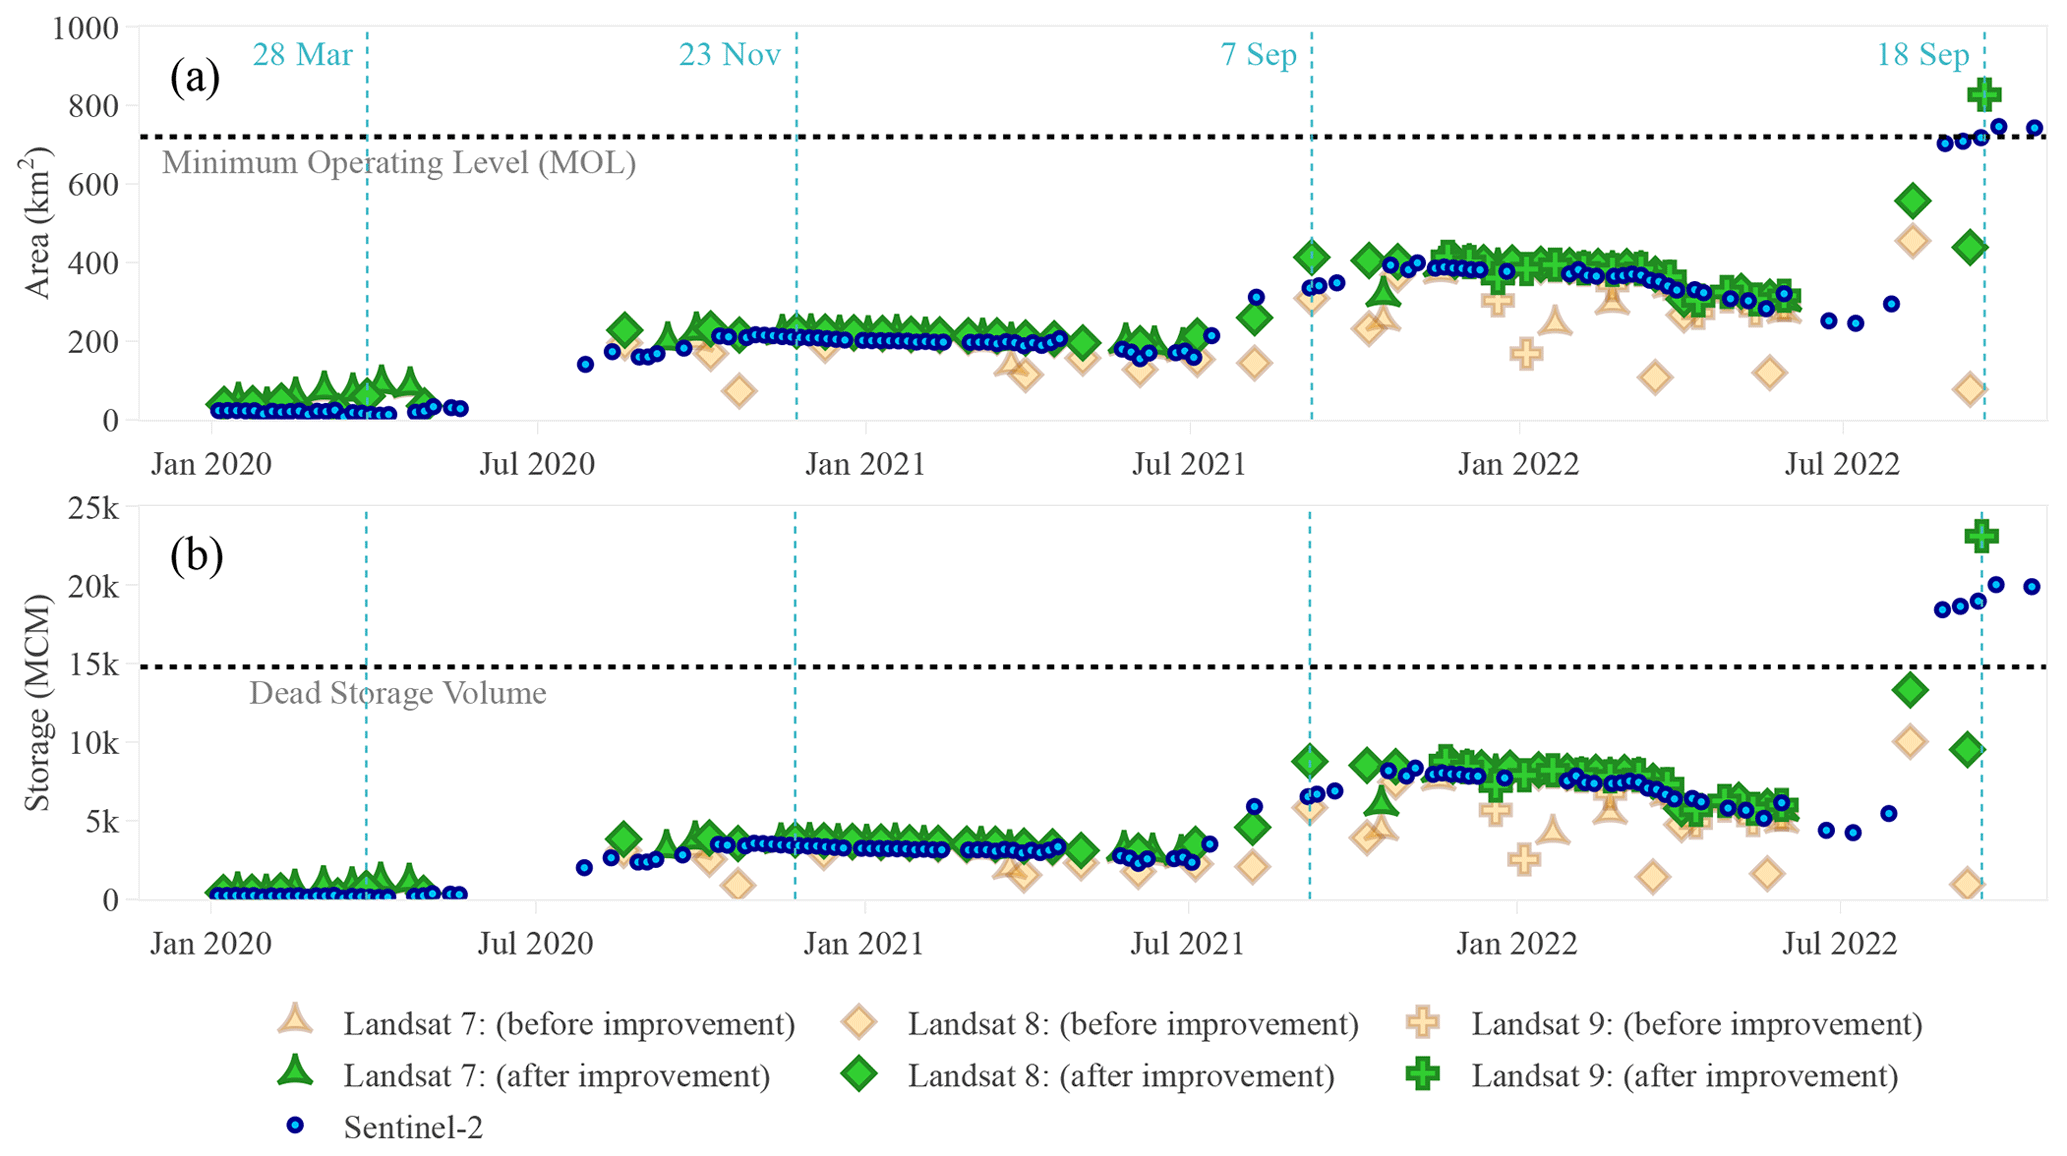
Figure 6Satellite-derived GERD reservoir information during the filling period from 2020 to 2022. Panel (a) shows the derived water surface area, while panel (b) shows the derived storage volume of GERD using Landsat (green: before improvement; light orange: after improvement) and Sentinel (blue) information. The WSA maps of the dates specified using the dotted cyan lines are illustrated in Fig. 7. Note that not filling the gaps induced by the scan line failure of Landsat 7 produces NDWI = 0 in these gaps when using the algorithm of Vu et al. (2022). Therefore, for negative NDWI thresholds (which were the case here), Landsat 7 overestimates the area and storage.
As can be seen in Fig. 6a and b, there are missing data during the wetting season (between June and September) of the 3 years, due to high cloud coverage. The first observed storage after the filling was on 19 August 2020 with a volume of 3.82 BCM; this value gradually decreased to 2.97 BCM on 11 June 2021. After the second phase, the storage jumped to 8.76 BCM (increased by 5.8 BCM) and gradually decrease until 2 March 2022 when a sudden decrease occurred. The water stored decreased from 8.06 BCM to reach 5.77 BCM by 3 April 2022. This decrease can be attributed to the announced 375 MW of electricity generation that began on 20 February 2022 according to Africa News (2022). In the third phase, storage increased by 17 BCM reaching 23.1 BCM.
Furthermore, the increase in the WSA due to filling was well captured by Landsat (and Sentinel), as illustrated in Fig. 7. The area was estimated to be 3.1 % of the WSA at the full supply level (FSL; 1874 km2) before filling started and dramatically increased to reach 12 %, 22 %, and 44 % during the first three filling phases, respectively. This indicates that a considerable amount of water was stored and, thus, the importance of understanding the filling process for downstream water management.
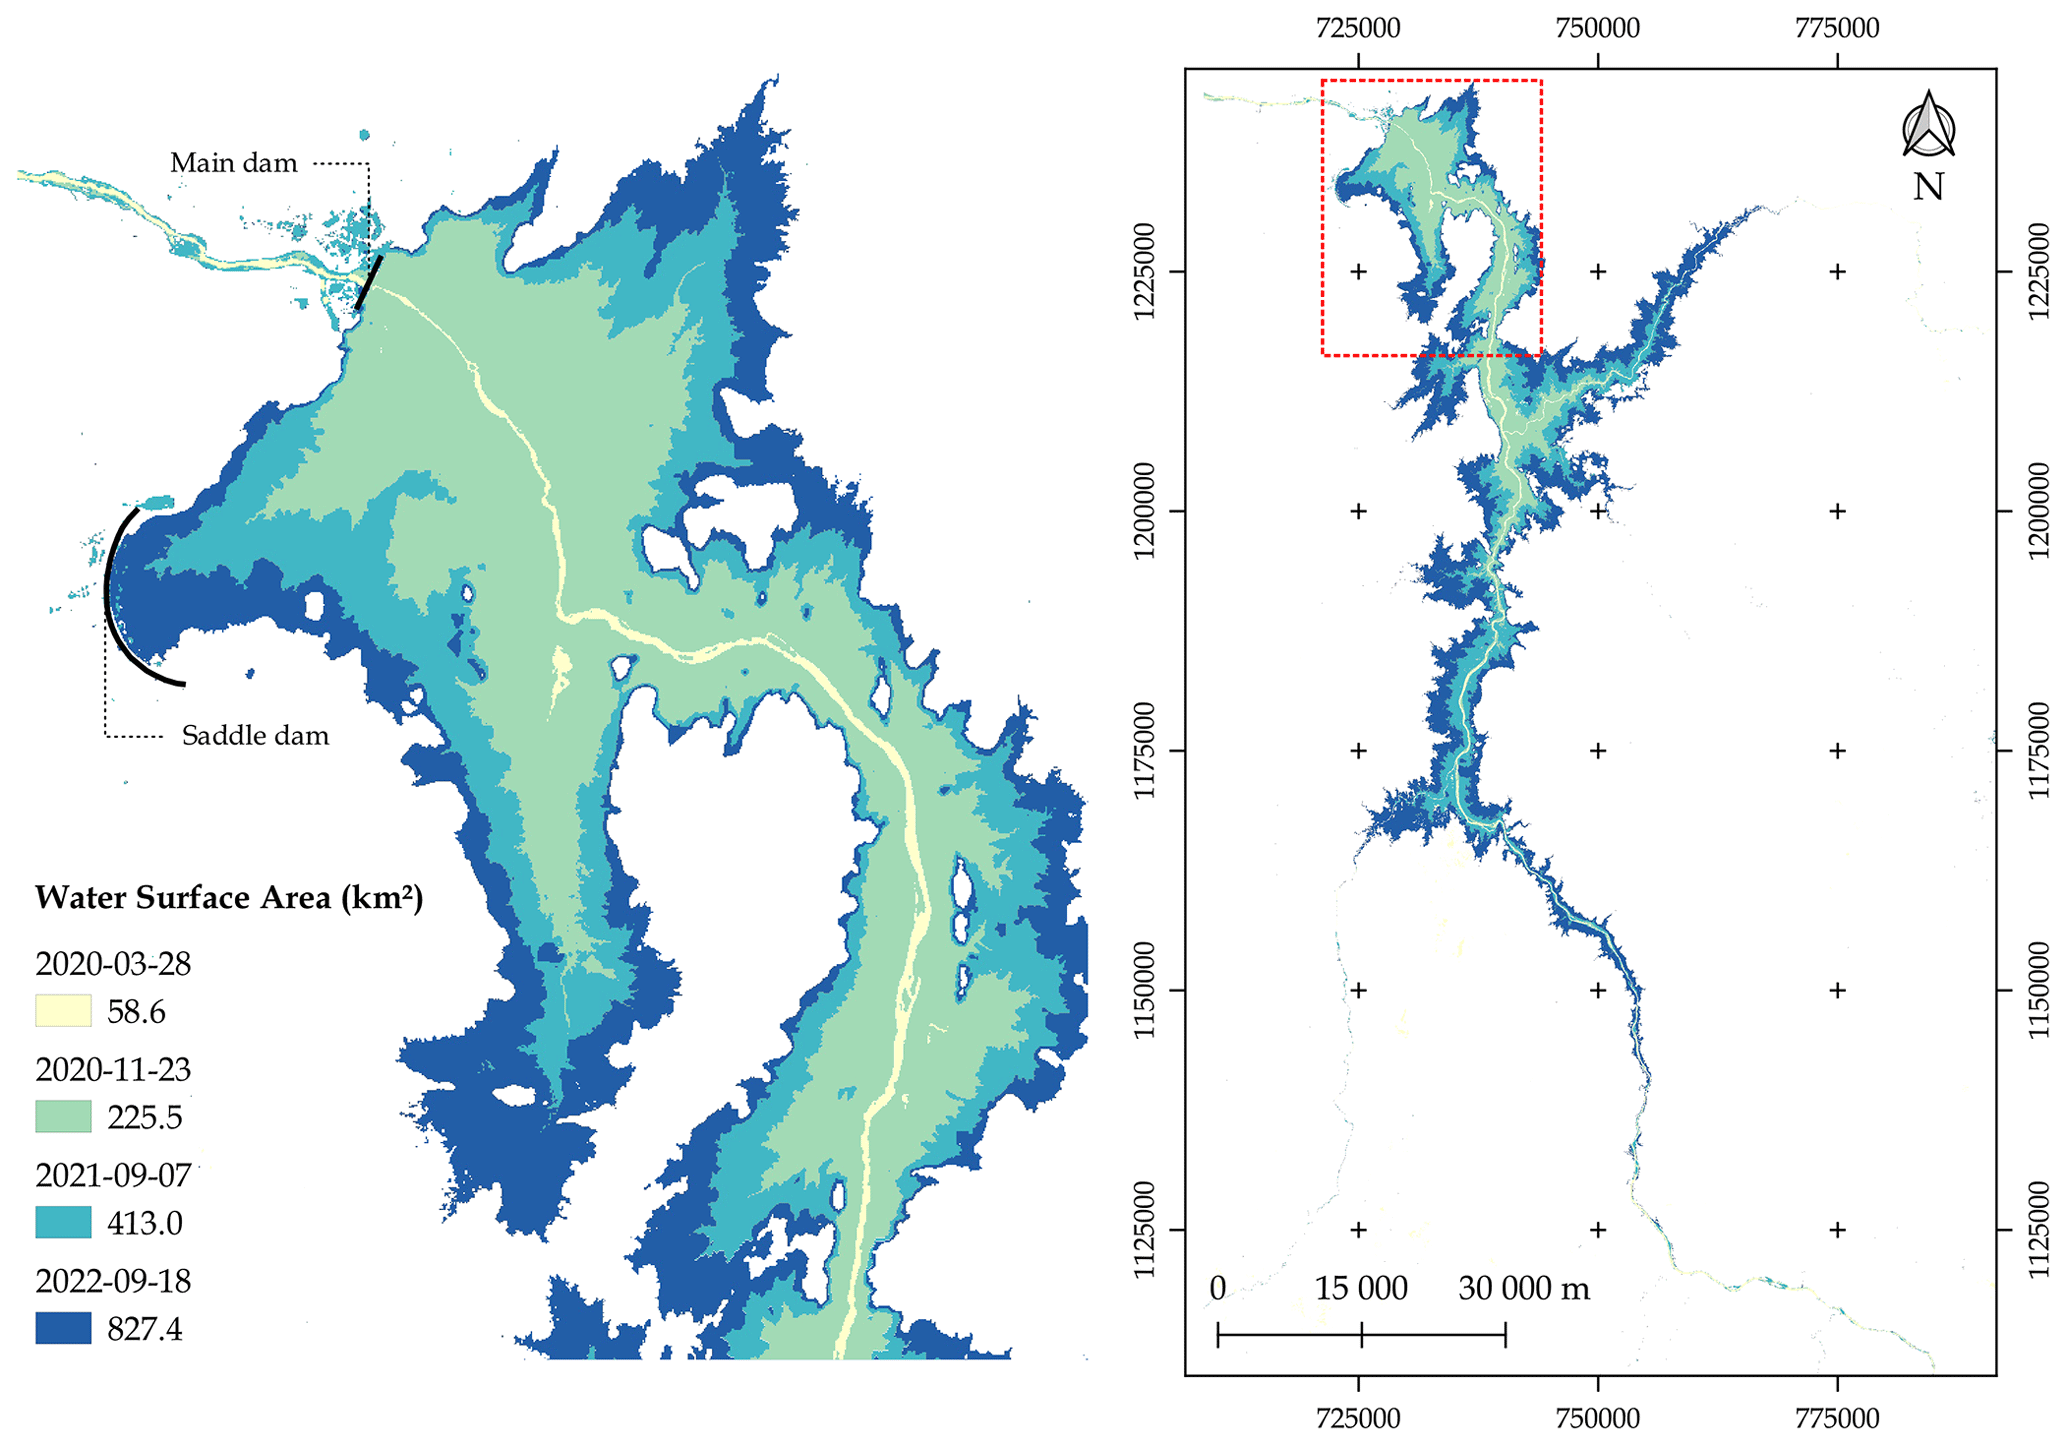
Figure 7Landsat-derived water surface areas of GERD, using the modified algorithm of Vu et al. (2022), showing reservoir development through the first three filling phases from 2020 to 2022. The location of the zoomed area in the left panel is indicated by the rectangle (dotted red line) in the right panel.
The utilized algorithm was not always accurate in determining the threshold value of the NDWI which, in turn, influenced the quantification of the area. Therefore, a visual inspection of the threshold was done to improve the estimation. Additionally, in fully cloudy images, the algorithm still provided additional water, which is not true and needs to be checked manually.
It is important to point out that open-access radar altimetry datasets provide valuable information for this validation step. Therefore, for further validation, we also considered radar altimetry data from G-REALM (Birkett et al., 2011) using the elevation–storage relationship shown in Fig. 5c. However, the storage volume derived from G-REALM showed unrealistic behavior in the recession and only added a few data points during the filling periods, which made us decide to exclude this source from the validation.
4.3.3 Model-derived reservoir storage
The performance of storage volume quantification from HBV-light and the uncertainty due to model parameters and rainfall product selection are highlighted in Fig. 8. The very high modeled storage due to the use of PERSIANN-CDR and ARC2 only resulted in negative NSE values, whereas CHIRPS was the only product that provided reliable reservoir storage, as suggested by Fig. 8a and b. Around 629 runs of CHIRPS (out of 1756) have positive NSE values, 407 of which have NSE > 0.5. Additionally, the long filling periods suggested by ARC2 produced the highest RMSE values and range (between 44 and 78 BCM). Comparing the other two products, Fig. 8c displays a higher and narrower interquartile range in the case of PERSIANN-CDR compared with CHIRPS. The performance of the best simulation of each rainfall product is exhibited in Table 5. Ultimately, the large difference between the rainfall products compared with the deviation caused by parameter uncertainty seen in Fig. 8 infers that filling strategies are more influenced by input uncertainty than parameter uncertainty.
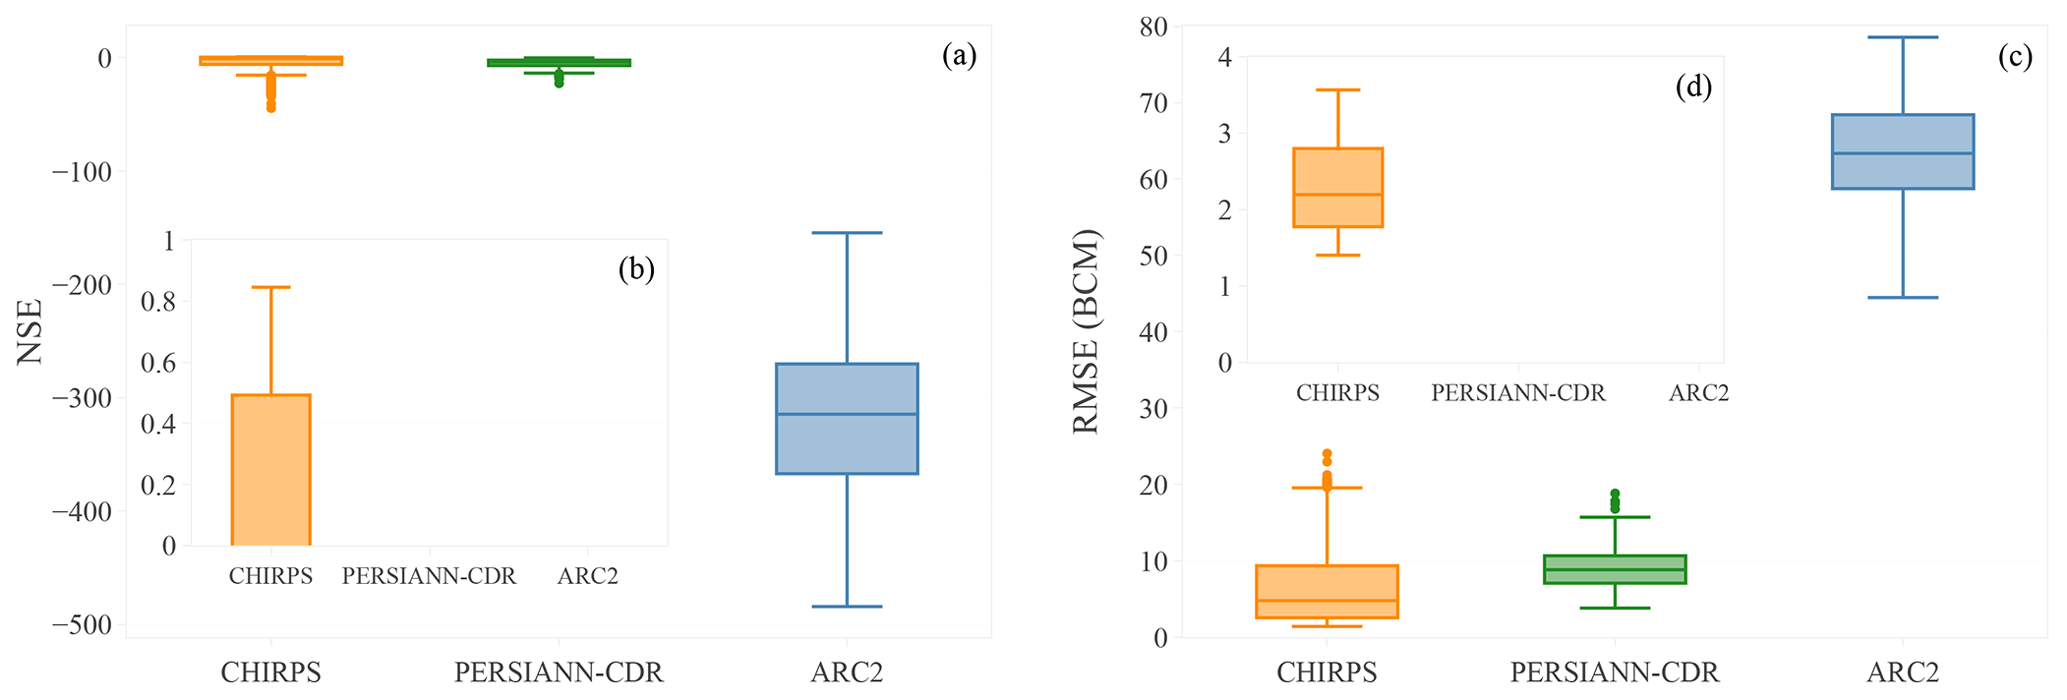
Figure 8HBV-light performance with respect to retrieving the storage volume of GERD from 2020 to 2022. (a, b) The Nash–Sutcliffe efficiency (NSE) and (c, d) the root-mean-square error (RMSE) between the satellite-observed storage (using Landsat) and the simulated GERD reservoir storage (using HBV-light) are shown. Panel (b) is a zoom-in of panel (a) that shows NSE values between 0 and 1, while panel (d) presents the RMSE values of all simulations with an NSE > 0. The x axis is the three tested rainfall products for input uncertainty, while the whiskers demonstrate HBV-light parameter uncertainty. The performance against Sentinel is shown in Fig. D3.
Table 5The performance of the HBV-light best simulation with respect to retrieving the storage volume of the GERD reservoir using the satellite-derived storage volume as a reference.
The modeled daily fractions of retained inflow, reservoir storage and area, and evaporated volume of water from HBV-light using CHIRPS are shown in Fig. 9 (see Fig. D4 for PERSIANN-CDR and ARC2). From the first row of the figure, it is clear that the duration of filling increases with time, suggesting around 13, 20, and 25 d for the first three phases, respectively. Looking at the storage retrieved from HBV-light (shown in the second row of the figure), one can see the increase in the uncertainty through time, which is due to the accumulation of discharge uncertainty with time. It is also important to note that the decrease witnessed by Landsat/Sentinel in 2022, due to the hydropower generation, was not captured by the model, which does not include release/operation terms, resulting in additional errors (i.e., lower RMSE can be achieved if this release was included). Additionally, the best simulation suggests that the dead storage (14.79 BCM) was exceeded after the filling in 2022. The last two rows of Fig. 9 exhibit the daily area of the reservoir and the evaporation from the reservoir surface. Obviously, the evaporation increases with time due to the surface area increase which results in a slight gradual decrease in the storage.
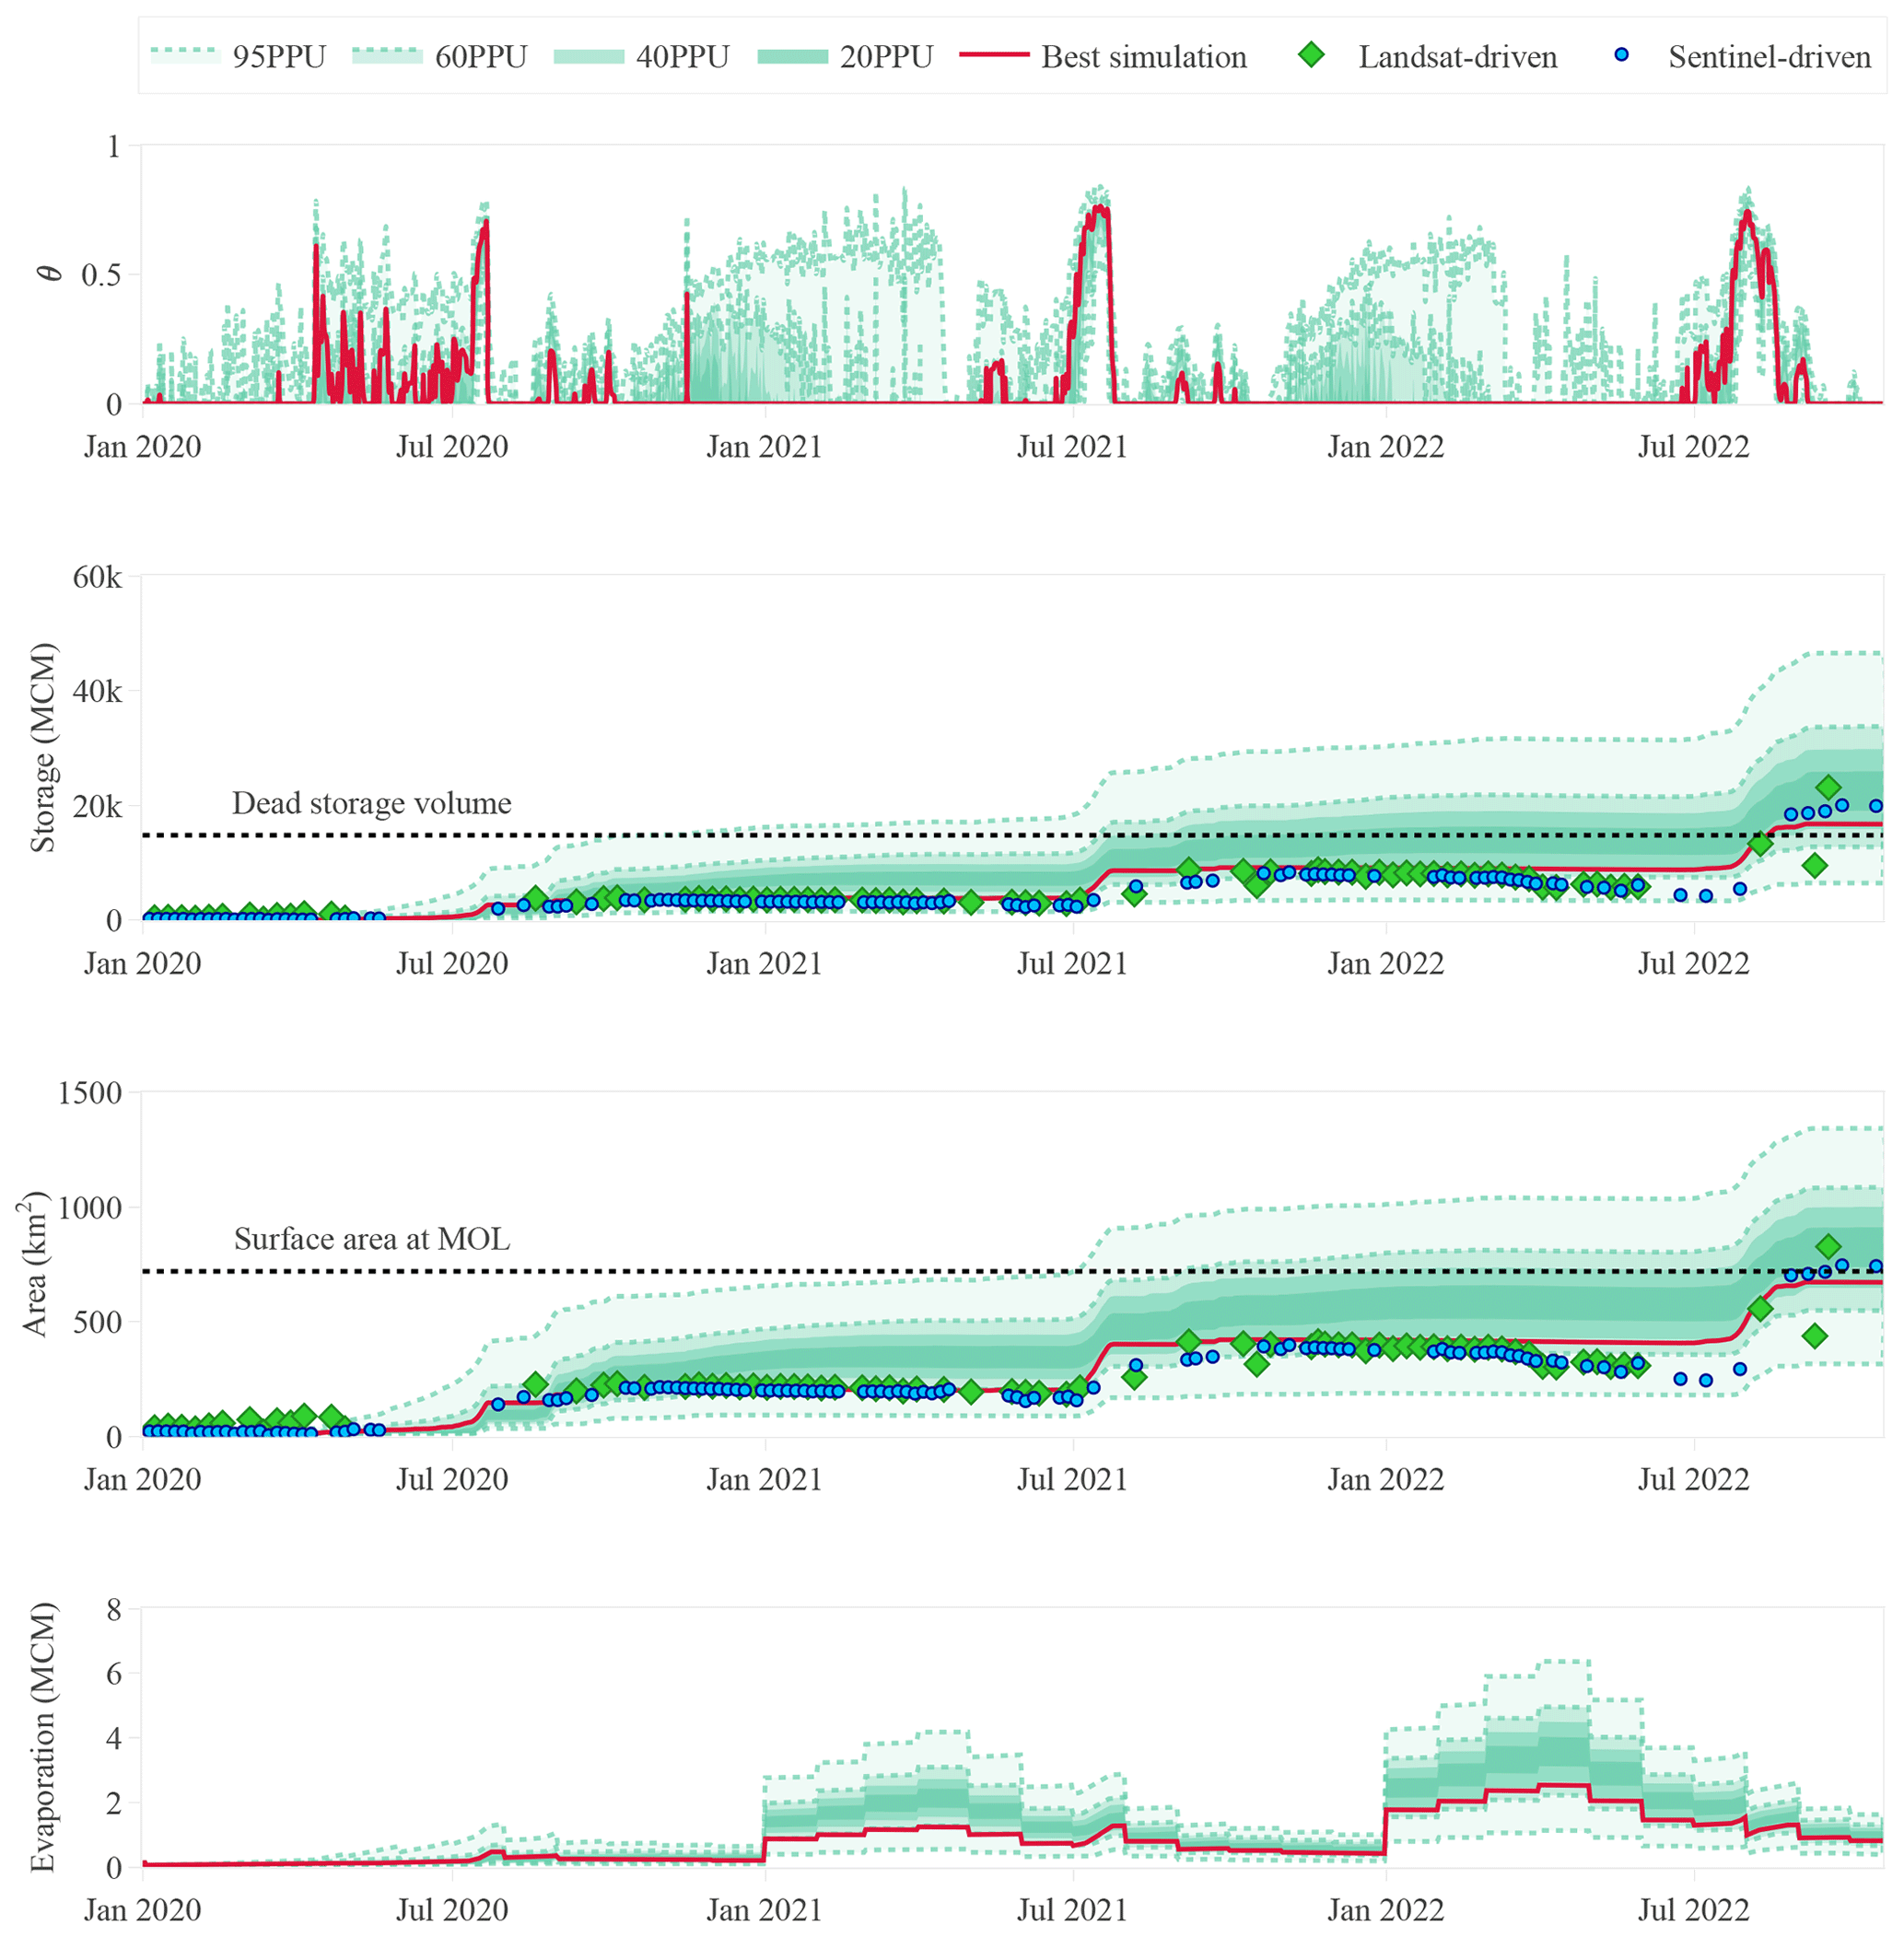
Figure 9Temporal dynamics of inferred GERD filling strategies. The first 3 years of GERD filling strategies was retrieved from the HBV-light lumped model using CHIRPS. The first row is the daily fraction of inflow volume retained by GERD. The second and third rows are the daily water storage and the corresponding water surface area of the GERD reservoir, respectively. The last row is the daily evaporated volume of water from the reservoir surface. The prediction uncertainty ranges indicate the 95, 60, 40, and 20 percentiles of the results obtained from the 1756 simulations classified as very good.
4.4 Filling strategies and downstream discharge
4.4.1 GERD filling strategies
Figure 10 exemplifies GERD filling strategies retrieved from CHIRPS, as the other two rainfall products provided insufficient results. The figure shows a time series of monthly θ values and the percentage of reservoir filling. The θ values of May and June 2020 are more than zero due to the low flows in these months and the uncertainty in the model (see also θ in Fig. 9). According to the red line in Fig. 10, the filling of the 3 years took place in July but continued until August in the year 2022. The percentage of the retained flow was found to be 14 % in July 2020; 41 % in July 2021; and 37 % and 32 % in July and August 2022, respectively. Besides the best simulation, the parameter sets that reached an NSE > 0.8 with respect to retrieving the storage (Fig. 8b) were able to capture the filling dates well. For other parameter sets, they suggest filling during other months (see green areas in Fig. 10). Moreover, in terms of annual volume, volumes equivalent to 5.2 % and 7.4 % of the total annual flow were retained in the first 2 years, and between 12.9 % and 13.7 % was retained in the following year. Retaining more than 10 % of the yearly flow in weeks is significant in terms of volume, and it impacts downstream management. Due to parameter uncertainty, the minimum and maximum retained friction values based on the 407 parameter sets (i.e., with an NSE > 0.5) are given in Fig. 10. As far as the percentage of filling is concerned, HBV-light suggests that filling reached 5.3 % of the full storage capacity in the first year and then rose considerably to reach 12.3 % and 22.6 % in 2021 and 2022, respectively.
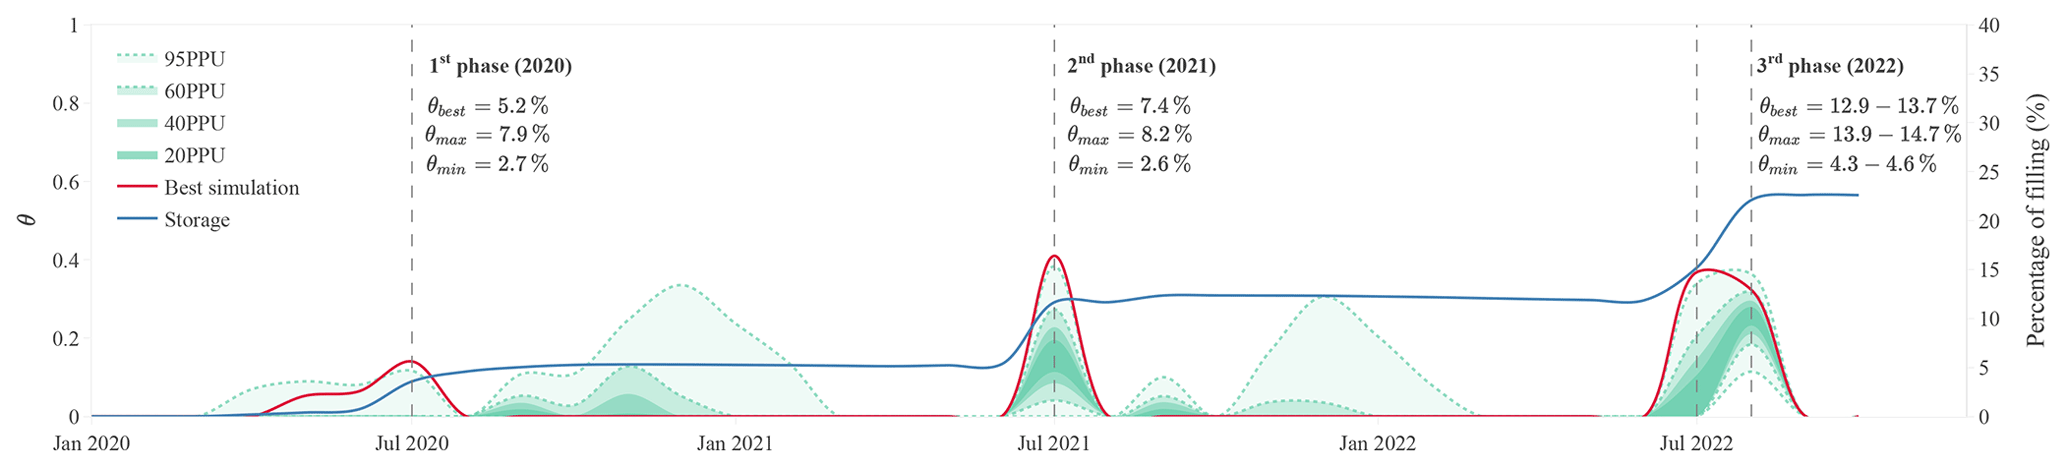
Figure 10GERD filling strategies. θ expresses the fraction of the monthly inflow volume retained by the dam. The three values θmax, θmin, and θbest (i.e., maximum, minimum, and best simulation, respectively) are the fraction of the annual inflow volume retained. The range in the values of the year 2022 is due to the unknown volume of November and December. The percentage of filling was calculated based on the best simulation and the GERD full storage capacity of 74 BCM. The uncertainty ranges (95–20 PPU) are based on the 407 runs with NSE > 0.5.
4.4.2 The effect of GERD filling on the inflow to Sudan
With the filling strategies retrieved from the hydrological modeling, the observed daily discharge flowing to Sudan can be better interpreted. Figure 11 shows further analysis of the filling phases of GERD. It is noted that the discharge in the last 3 years showed unnatural behavior when compared with the discharge before 2020 (see blue lines in Fig. 4). To investigate the role of GERD in the observed hydrograph, the difference in the inflow to Sudan after the construction of GERD and without GERD was estimated and is demonstrated in Fig. 11a. The filling of GERD altered the hydrograph of the water flowing to Sudan. The monthly discharge to Sudan after 2020 showed a notable increase throughout the year except in the filling months (i.e., July 2020–2022 and August 2022), when the flow substantially decreased. This increase was partly due to heavy rains in 2020 and partly due to the operation of GERD. In terms of volume, the filling of the first 2 years did not influence the annual volume flowing to Sudan, in contrast to 2022. However, the decrease in the filling months influences the management of the Roseires and Sennar dams with respect to storing and diverting enough water to the Gezira Scheme and to meet other downstream demands.
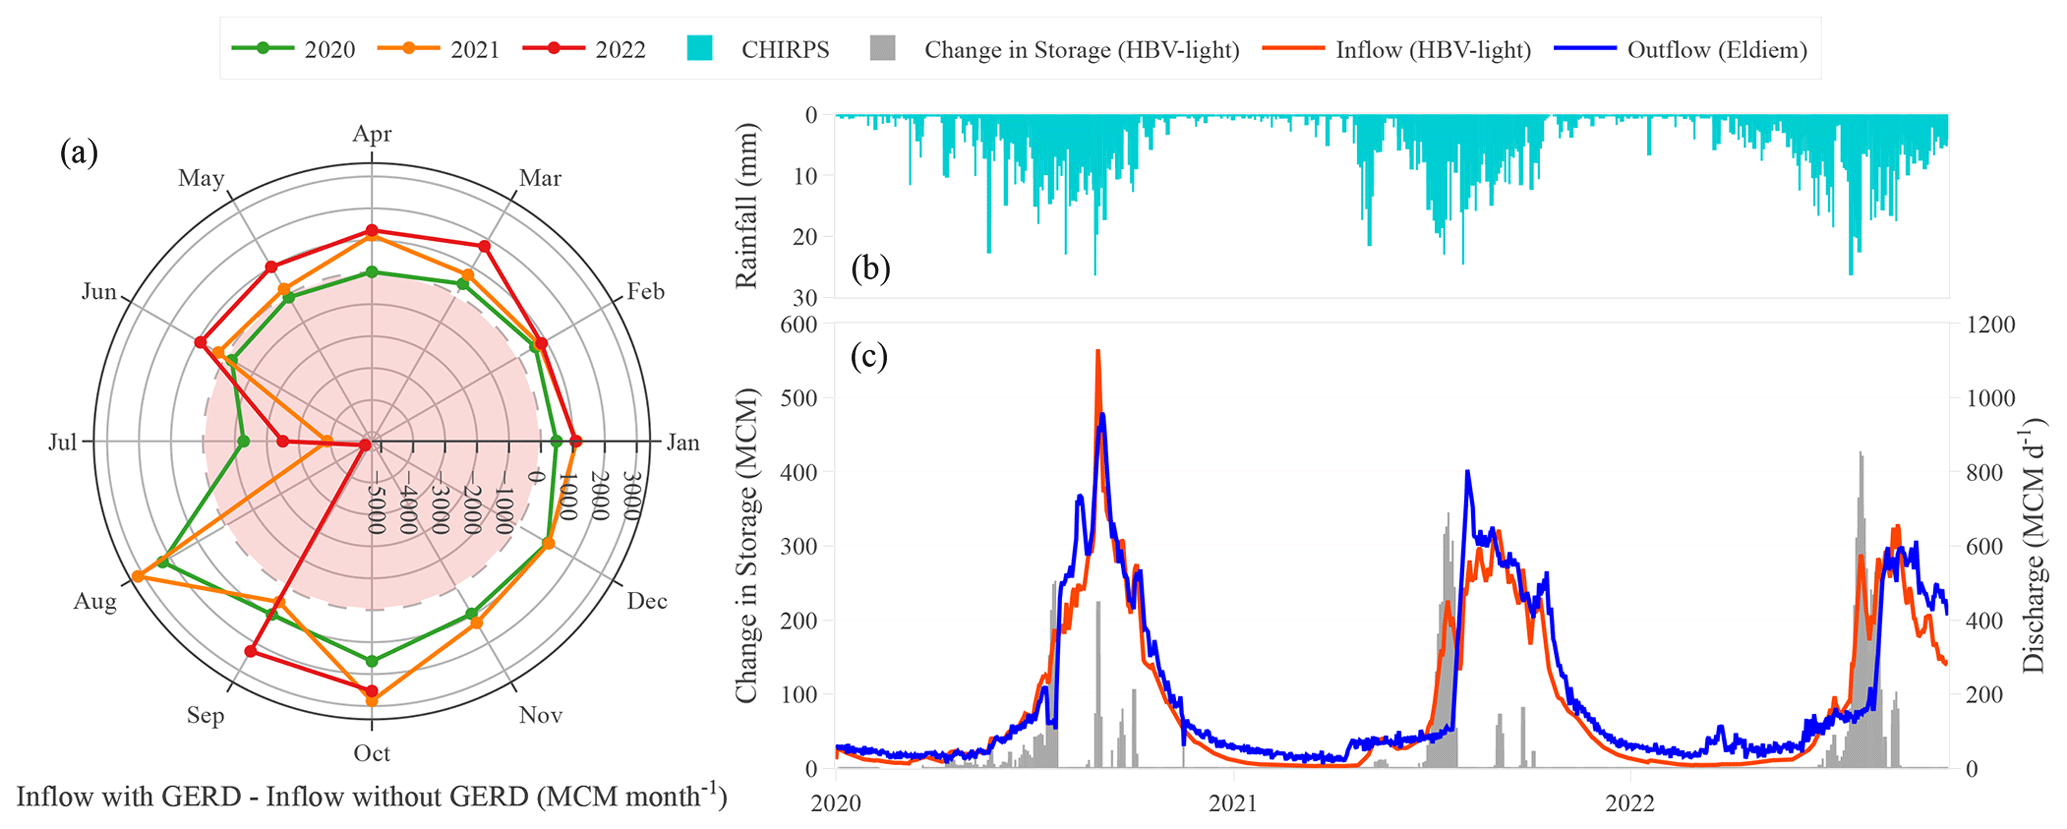
Figure 11The impact of GERD filling on flow to Sudan: (a) the monthly impact of GERD on the incoming flow to Sudan, calculated as the difference between the inflow to Sudan with GERD and the inflow without GERD; (b) the rainfall time series retrieved from CHIRPS; and (c) the daily change in storage of GERD reservoir and its implication for downstream daily discharge measured in Sudan. The change in storage is defined as the difference between two consecutive daily storage volumes.
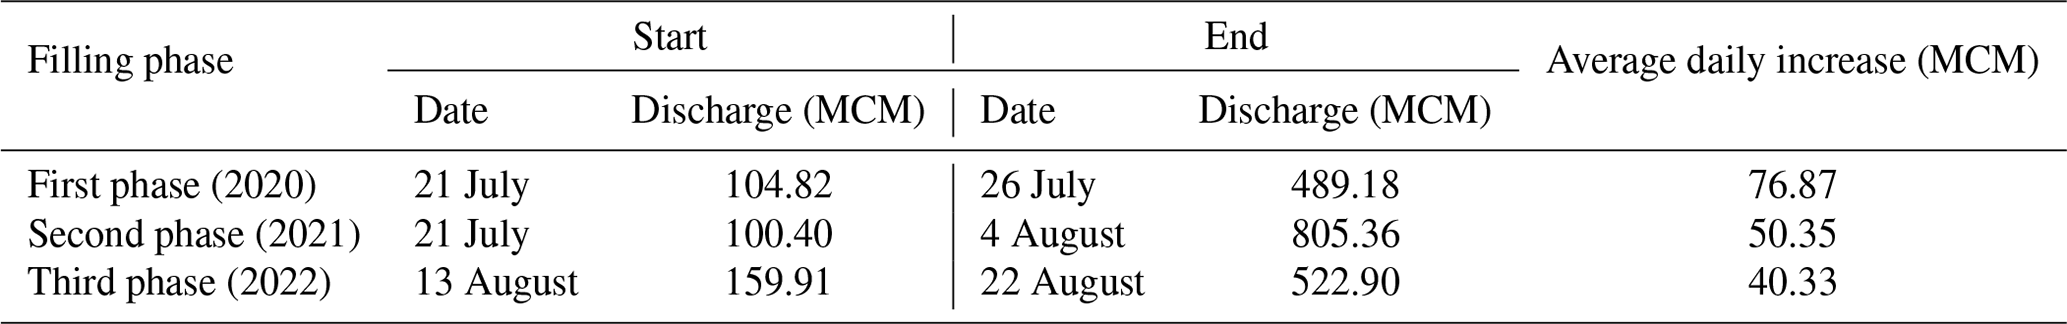
Moreover, there are abnormally high flows caused by highly intense rainfall events, such as in August to October 2020 and May 2021 (see Fig. 11b and c). However, the considerable rise in the water flow observed in March and April 2022 occurred as a result of hydropower generation that began in February 2022 (see GERD release in Fig. 6b). Paying attention to the storage change in Fig. 11c, the relatively low outflows during filling days are followed by a sudden and steady increase in the outflow causing a linear hydrograph. Additionally, Table 6 illustrates the start and end dates of these changes and the magnitude of daily increase. The results reveal that the outflow increments are significant and decreased from around 77 MCM d−1 in 2020 to 40 MCM d−1 in 2022.
Table 6Dates and volumes of the sudden changes in the downstream discharge after the completion of each GERD filling phase.
The current work might be of interest for studies on ungauged basins. One of the remaining challenges in ungauged basins is the need for more easily accessible data (Hrachowitz et al., 2013). The deficiencies in meteorological stations were replaced by a selection of a representative rainfall product based on the performance rankings adopted from Elagib and Mansell (2000). The ranking was found to give a first impression of the hydrological model performance to quantify the discharge as well as retrieve the filling strategies. Additionally, the calibration and validation of the hydrological model based on pre-operation years allowed for successful prediction of the inflow during post-operation years, which was proved by the utilization of Earth observation. Moreover, coupling the retrieved change in storage with the measured outflow of the dam allowed for a greater understanding of the downstream impact of the filling process (Vu et al., 2022).
The retrieved GERD storage results are dependent on HBV-light performance, which is subject to various sources of uncertainty, including observed discharge, meteorological products, and model parameters and structures. Rainfall products were found to be a main source of uncertainty with a high influence on the HBV-light results, followed by model parameters (as discussed in Sect. 4.3.3). Although uncertainty arising from potential evapotranspiration products was not investigated, previous studies (Nonki et al., 2021; Wang et al., 2022) have concluded that it is unlikely to have a significant effect on HBV-light performance and simulations. The selected model structure, HBV-light, is also likely to impact the results. However, the limited data availability restricts the opportunity to explore more complex structures.
The unforeseeable construction progress of GERD complicates the predictability of the years required to completely fill the dam. Nevertheless, some trends can be expected based on the results of the current research. Retaining 20 % of the average annual flow at the dam location (around 50 BCM) is equivalent to storing 10 BCM yr−1. Therefore, given the current stored water (Landsat: 23.1 BCM; Sentinel: 20 BCM) and the retrieved friction of retained annual flow, GERD will need at least 5 more years (8 years in total) to complete filling (up to the FSL) under average flow conditions. However, a minimum of an additional 3 years will be needed under wet conditions (6 years in total). During these years, it is important to reduce the risk of water diversions in Sudan by the adaptive management of reservoir operations (Wheeler et al., 2016). Other cooperative options for mitigating the effect of GERD on downstream flow are coupling the operation of GERD with solar and wind power (Sterl et al., 2021) and applying a water sharing policy during drought conditions (Wheeler et al., 2016; Yang and Block, 2021).
The operation of downstream dams (i.e., Roseires and Sennar) depends on the management of GERD. Thus, the outcomes of this approach provide information that can support downstream dam operation. This study creates an opportunity, for instance, to adjust the scheduling of the Roseires Dam filling to coincide with agricultural needs in the upcoming years, specifically during the filling phase. Upon examining Fig. 10, one could speculate that the fourth filling might occur around July and August, encompassing approximately 40 % (potentially up to 50 %) of the monthly inflow. In addition, the findings of this study indicate that lower discharge levels were observed during July and August, while higher discharge rates were observed during other periods. This suggests that additional water should be stored during GERD non-filling periods to achieve the targeted monthly elevation of the Roseires reservoir. A substantial increase in discharge is noted during March–June and October–December. We propose that effective management of Roseires and Sennar should involve storing additional water during these months to compensate for shortages during filling periods. Additionally, for adaptive management of Sudanese reservoirs, the existing model should be expanded to include the Lower Blue Nile basin and used to evaluate alternative operation scenarios for the Roseires and Sennar dams. This approach will enable a comprehensive understanding of the implications of various management decisions and facilitate the development of optimized reservoir management plans. Moreover, our method has the potential to predict upcoming reservoir management by integrating our developed hydrological model with forthcoming discharge measurements, allowing for the reconstruction of operational strategies.
It is worth mentioning the main advantages of the proposed approach. Besides the approach discussed here, downstream analysis can also be based on satellite images using, for example, the method proposed by Vu et al. (2022). However, relying on the latter approach for real-time operation presents certain challenges. Firstly, given the current availability of free satellite data (such as Sentinel and Landsat), it is not feasible to achieve daily time steps, in contrast to the case of hydrological modeling. Secondly, waiting for a few days to acquire satellite data can be problematic, particularly during flood events such as those experienced in Sudan in 2020. Moreover, hydrological modeling generally offers the capability to simulate potential future scenarios, assess their impacts, and explore alternative management strategies. However, our proposed approach relies on outflow observations, which may not always be available or accessible. As such, both satellite imagery and hydrological modeling have their respective advantages and limitations. Furthermore, our approach necessitates further research to validate its forecasting skill (including reservoir filling and operational dynamics).
Worldwide, there are 286 transboundary rivers covering 50 % of the global land surface (De Stefano et al., 2017; Draper, 2007). Going a step forward, the novel methodology described in this paper can be adopted on a global scale, especially for data-scarce regions and transboundary rivers. However, discharge observations and the selection of representative precipitation products are crucial. Global implementation will raise the following practical questions: “How should the precipitation product be selected?” and “Should it be the best product globally, a precipitation product per climate zone, or a precipitation product per reservoir?”. Another important aspect is the reliability of the current methodology. With the current error of around 1.7 BCM (or 1.52 BCM as suggested by Sentinel), the reliability increases with the increase in reservoir storage capacity. Thus, it is preferable to adopt the methodology for dams with large storage capacities. Nonetheless, further improvements to the methodology are needed to increase model efficiency and, thus, cover small reservoirs. These improvements are (but are not limited to) as follows:
-
including more observations (e.g., soil moisture, groundwater measurements) – with these additional data, independent validation can be done which can help to eliminate many of the high-performing discharge values due to the low performance of the corresponding simulated water balance components such as groundwater storage or evapotranspiration;
-
validating both the precipitation and evapotranspiration when using remote-sensing data to minimize the uncertainty;
-
utilizing actual evaporation measurements/a validated product to improve the capture of day-to-day variation in reservoir storage;
-
including a seepage term in the quantification of reservoir storage from reservoir water balance – new water levels are reached during filling, initially requiring more water than that obtained from the elevation–storage relationship to reach a certain level;
-
using a more spatially representative hydrological model – daily variation in discharge can be better captured, but it requires extra information which may not be available.
The work done in this paper demonstrates a novel approach that utilizes hydrological modeling with limited ground measurements to infer GERD filling strategies using a three-step validation process. These steps are as follows: (1) validating precipitation products with rain gauges, (2) validating simulated discharge with streamflow gauge, and (3) validating inferred storage with satellite-driven storage. Therefore, the lack of information was compensated for by using available Earth observations. First, from the evaluation of five selected rainfall products, CHIRPS was found to be the best-performing product in time (monthly) and space when compared with 10 rain gauge stations, followed by PERSIANN-CDR, ARC2, GPCC, and ERA5. Second, considering the top three products, HBV-light was calibrated and validated, resulting in high performance when the model was forced by CHIRPS, ARC2, and PERSIANN-CDR, respectively. Third, during the operation period (2020 onwards), CHIRPS outperformed PERSIANN-CDR and ARC2 with respect to capturing the filling properties (dates and magnitudes). The retrieved 3 years of GERD storage was compared with Landsat and Sentinel imagery, CHIRPS was the only product that produced positive NSE values and, thus, the lowest RMSE values. Subsequently, the selection of the rainfall product was found to have more influence on inferring the GERD filling strategies than parameter uncertainty. Additionally, the best simulation of CHIRPS (i.e., the simulation with the highest NSE value during calibration) was found to have an NSE of 0.77 and 0.86 and an RMSE of 1.7 and 1.52 BCM when compared with Landsat and Sentinel, respectively. This inferred that the friction of the monthly retained inflow was 14 % for July 2020; 41 % for July 2021; and 37 % and 32 % for July and August 2022, respectively. Moreover, GERD retained 5.2 % and 7.4 % of the annual inflow to Sudan in 2020 and 2021, respectively; after the third phase, in 2022, the reservoir retained between 12.9 % and 13.7 % of the annual inflow, reaching around 22.6 % of the full storage capacity. Furthermore, it was revealed that the first 3 years started to impact the flow downstream. During filling months, the inflow to Sudan significantly decreased below average (2002–2019), suggesting the need to adapt reservoir management of the Roseires and Sennar dams to meet downstream demands.
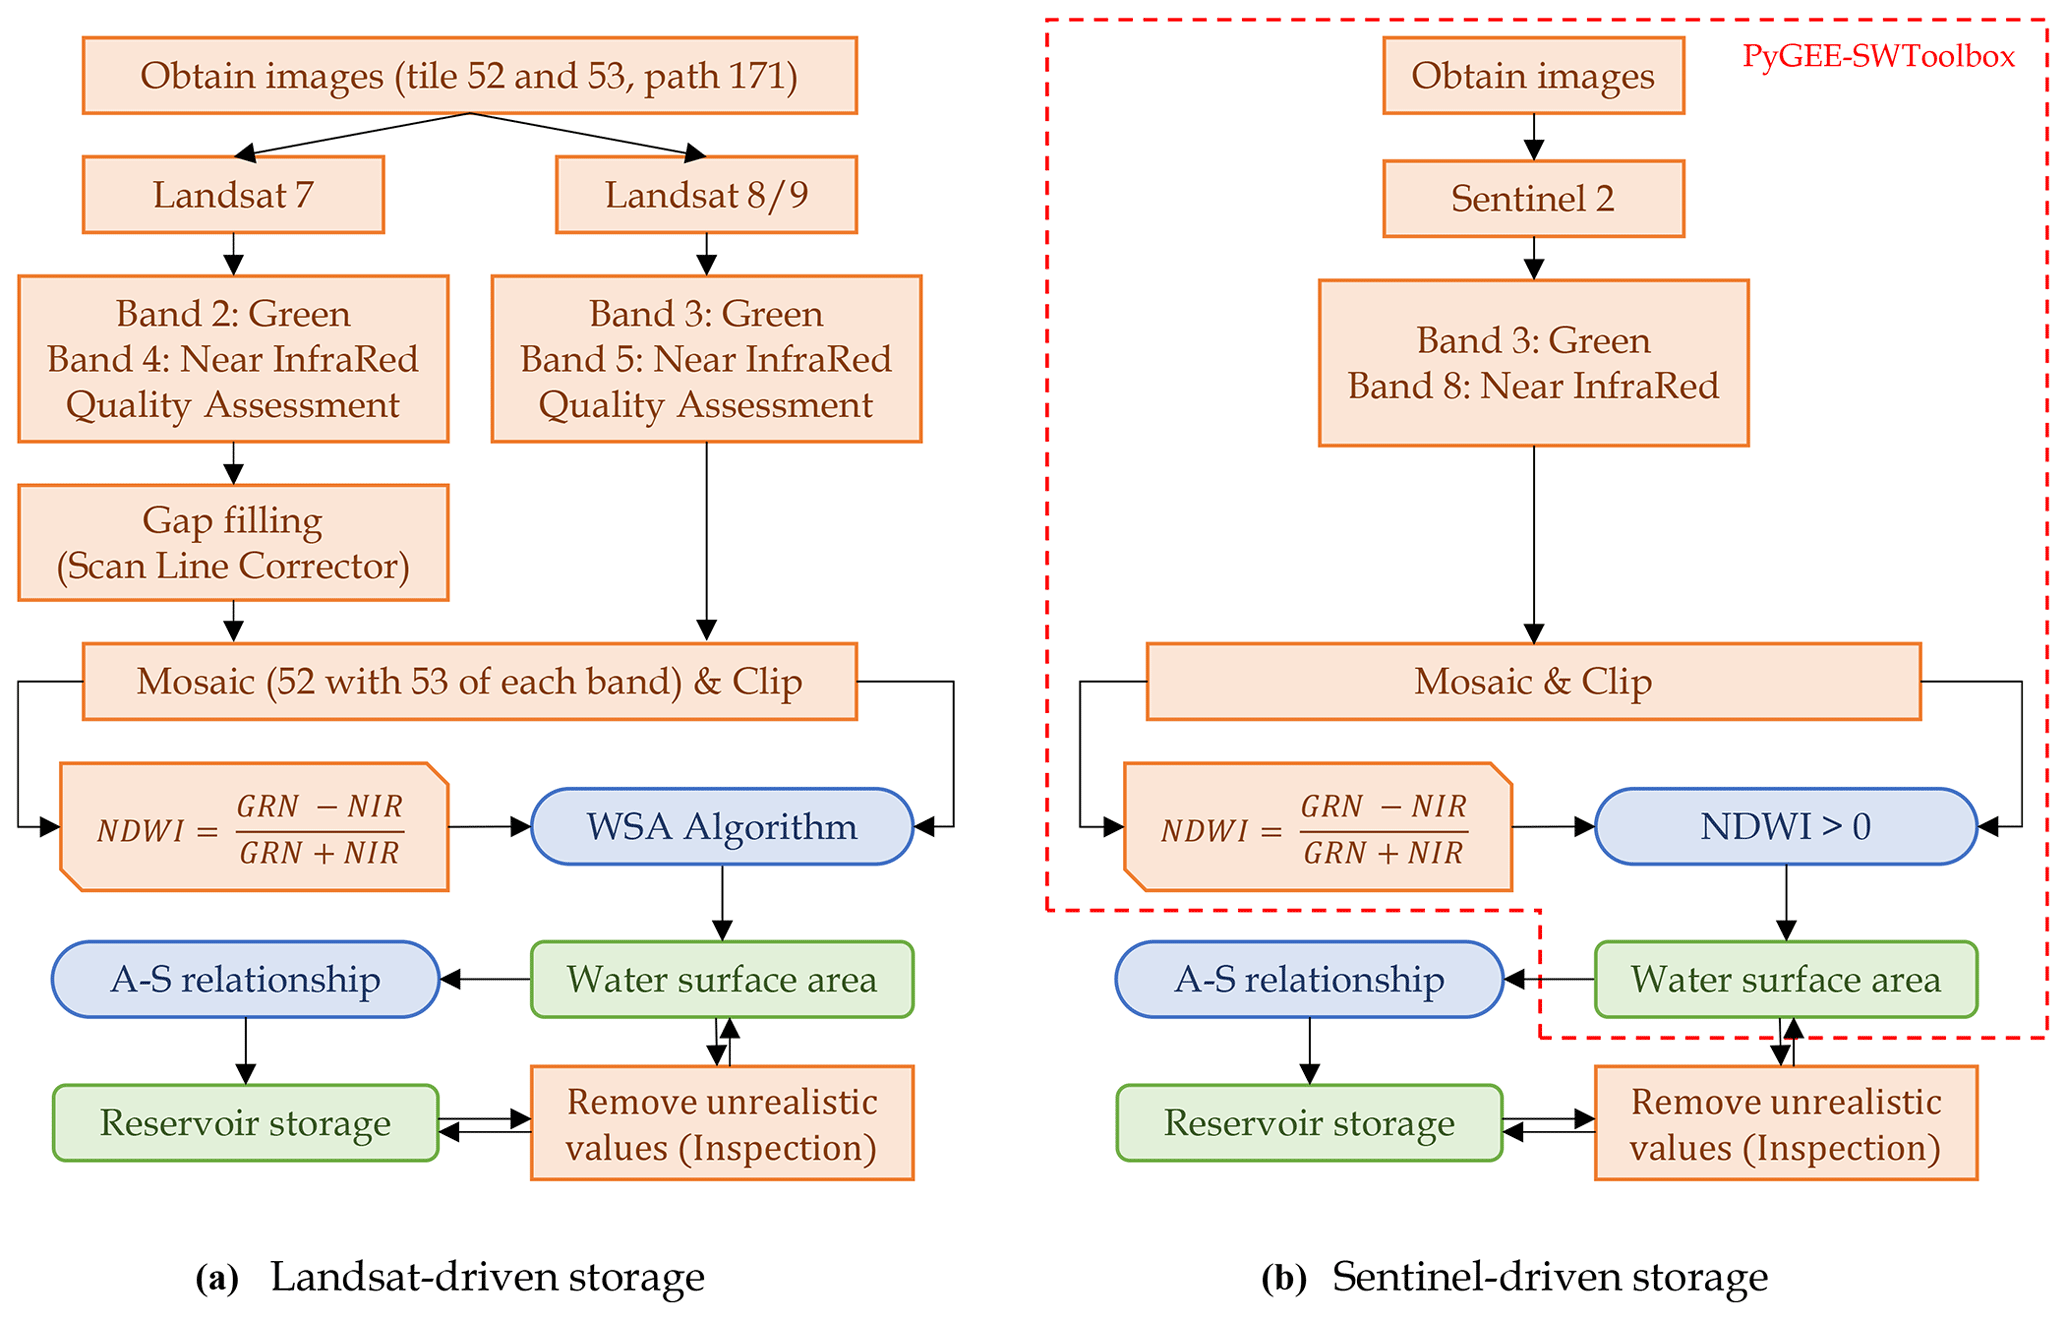
Figure A1Procedure to derive GERD reservoir characteristics using Landsat (a) and Sentinel (b). Landsat water surface area (WSA) was estimated based on the modified algorithm by Vu et al. (2022). A fixed NDWI threshold was employed to estimate the WSA for Sentinel images using PyGEE-SWToolbox (Owusu et al., 2022).
Table B1Statistical performance metrics applied in the evaluation of the satellite rainfall products and/or the simulated discharge and reservoir storage.
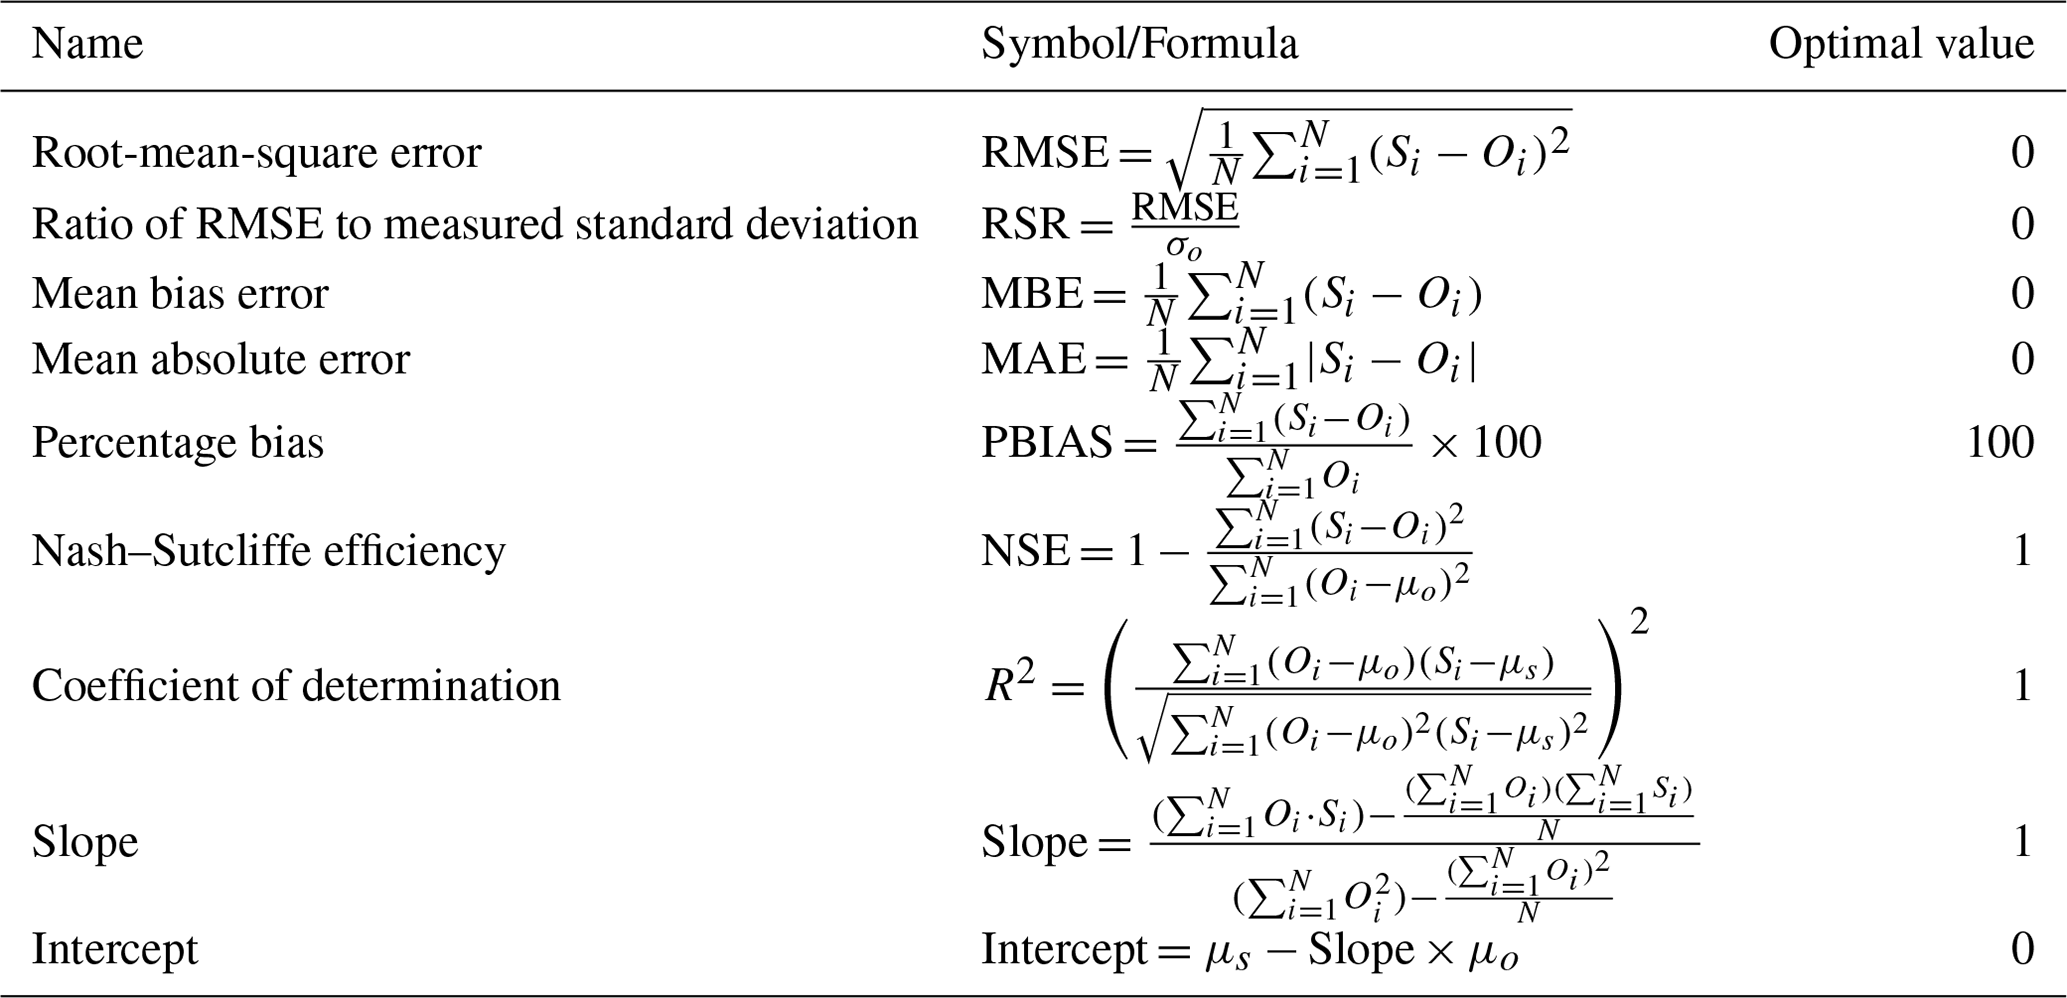
The parameters used in the table are as follows: O – observed value; S – gridded product or simulated value; N – number of samples; μo – mean value of O; μs – mean value of S; σo – standard deviation value of O; σs – standard deviation value of S. The coefficient of determination, intercept, and slope are computed using a linear fit.
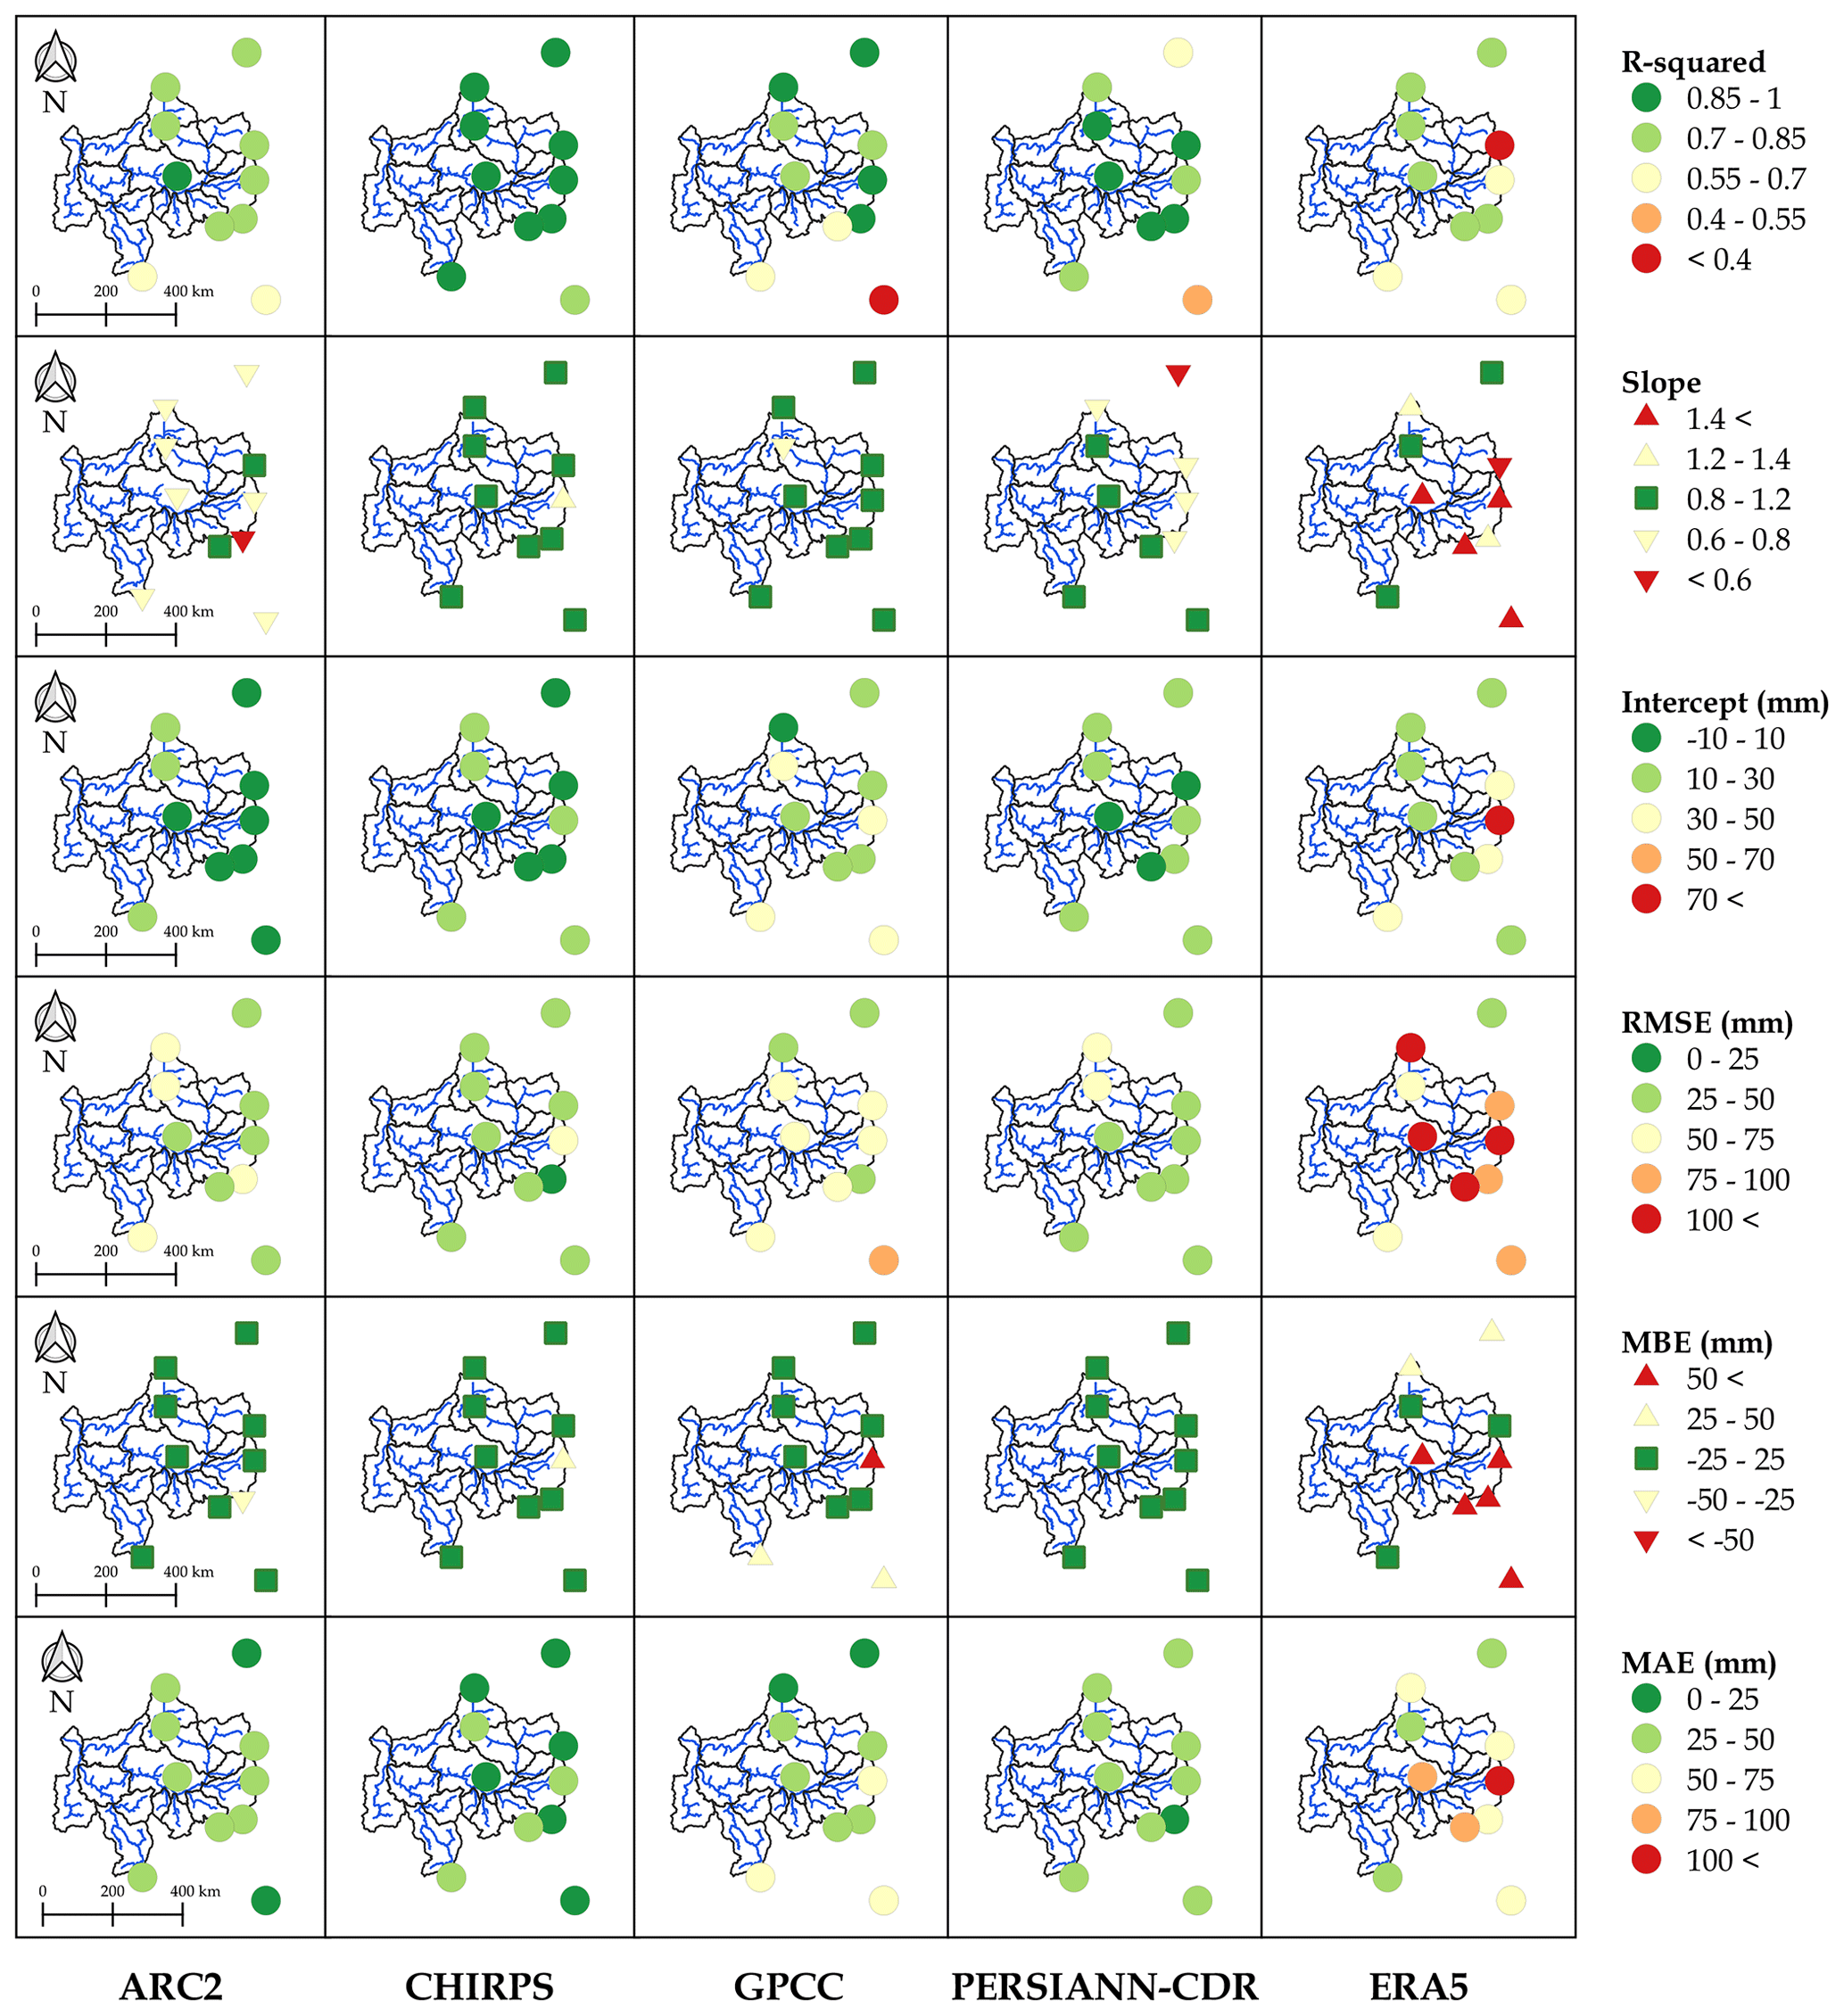
Figure B1Spatial distribution of the statistical performance metrics over the Upper Blue Nile basin based on the point-to-pixel approach at a monthly scale from 1984 to 2005. A total of 6 of the 10 stations are outside the UBN boundaries; however, all are included in the analysis to strengthen the evaluation of the rainfall products over the region. The basins boundaries and drainage network are obtained from the HydroSHEDS dataset (Lehner et al., 2008).
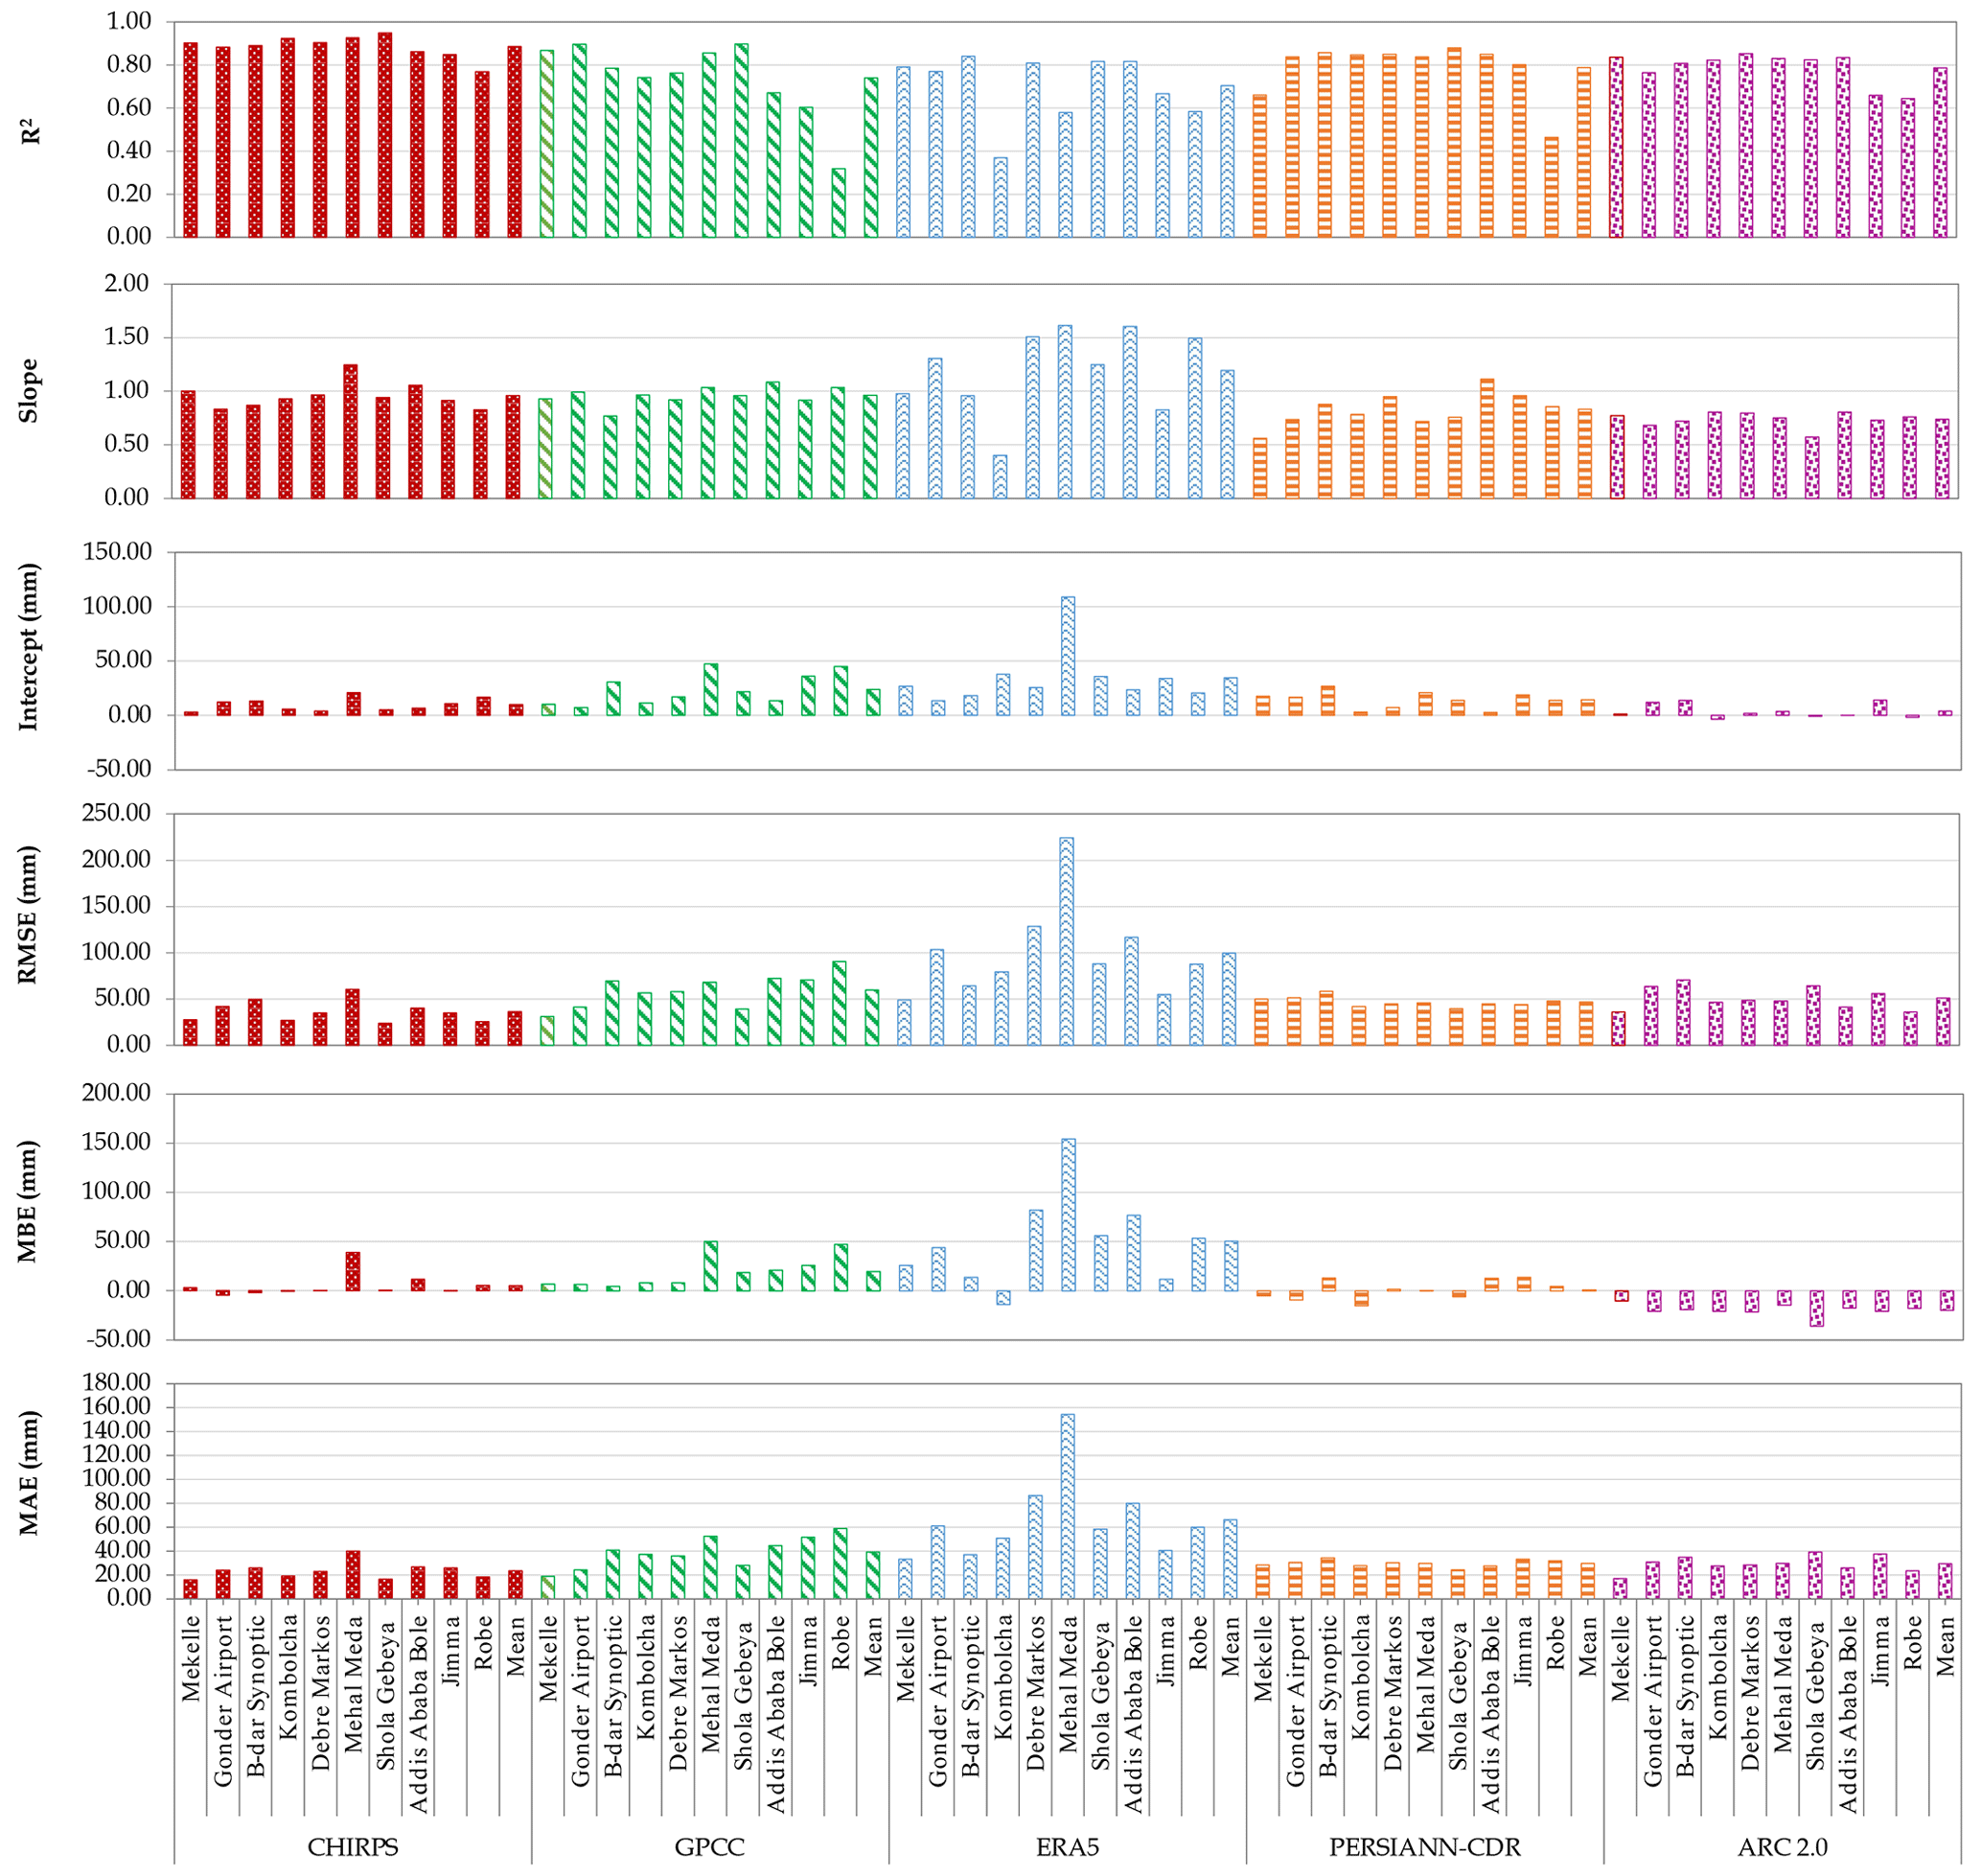
Table C1Hydrological models applied over the Upper Blue Nile basin from 57 studies in the literature.
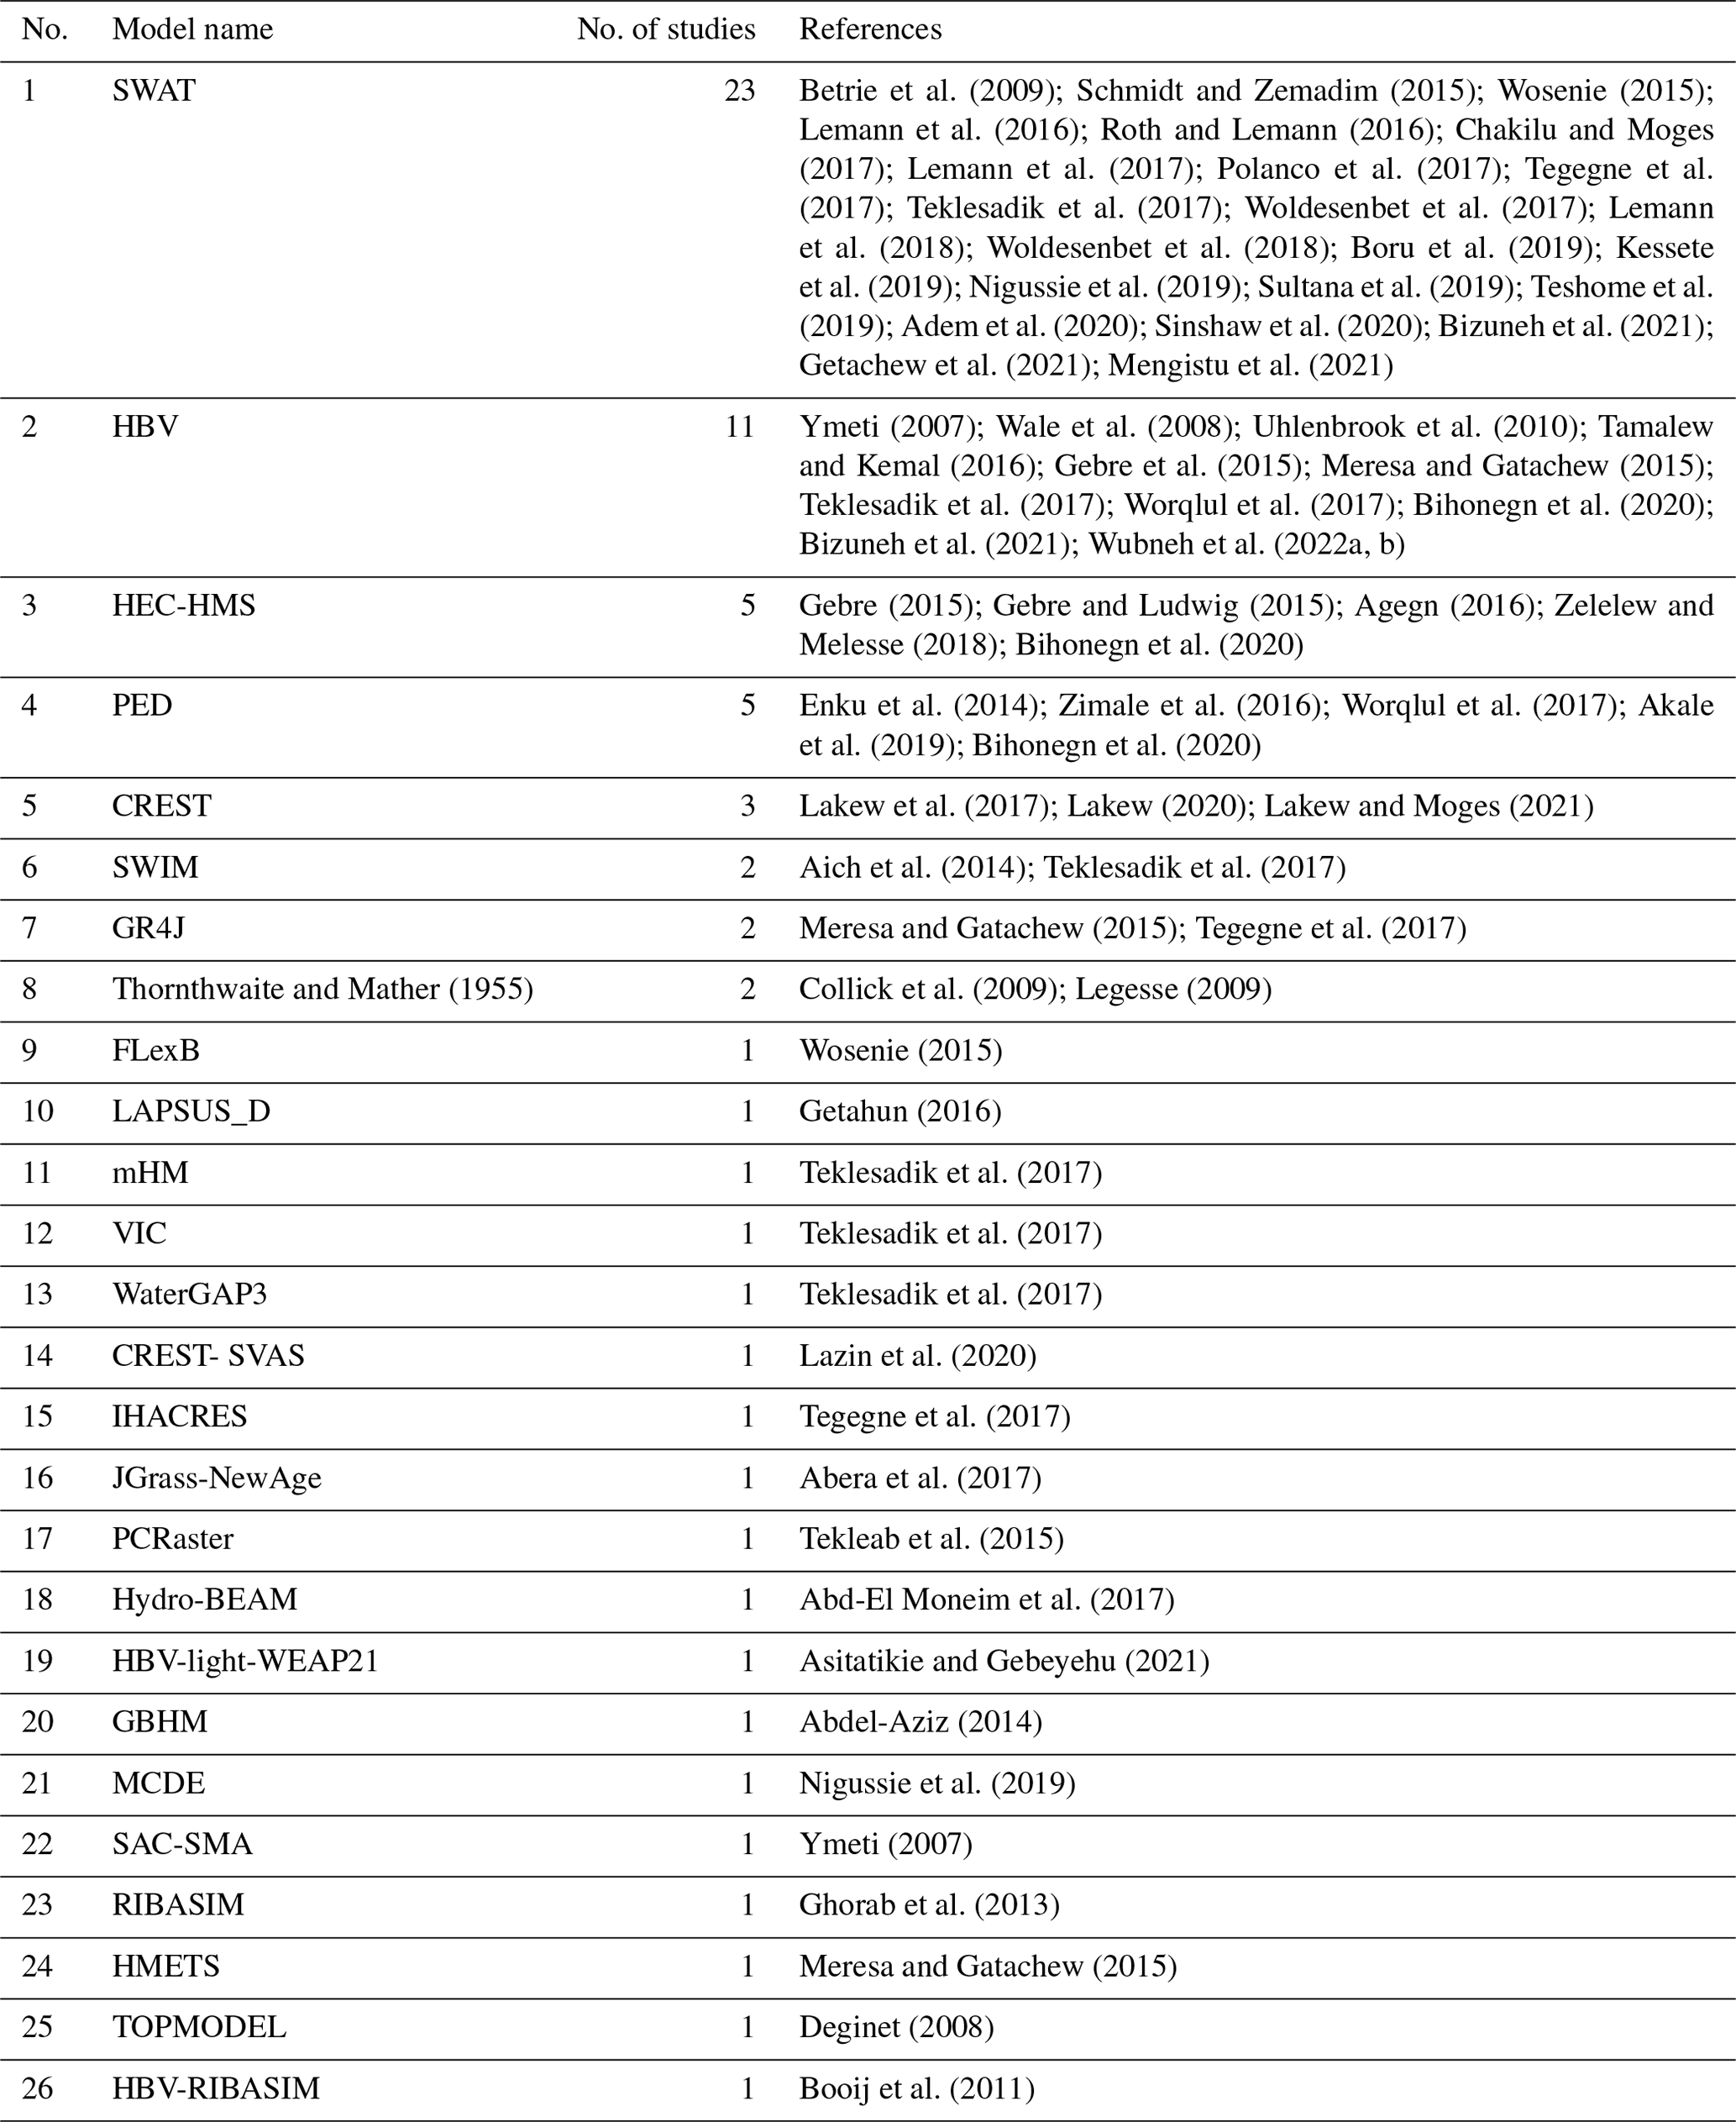
Table D1HBV-light parameters, selected parameter ranges for Monte Carlo simulations, and the optimized values of each selected satellite rainfall product.
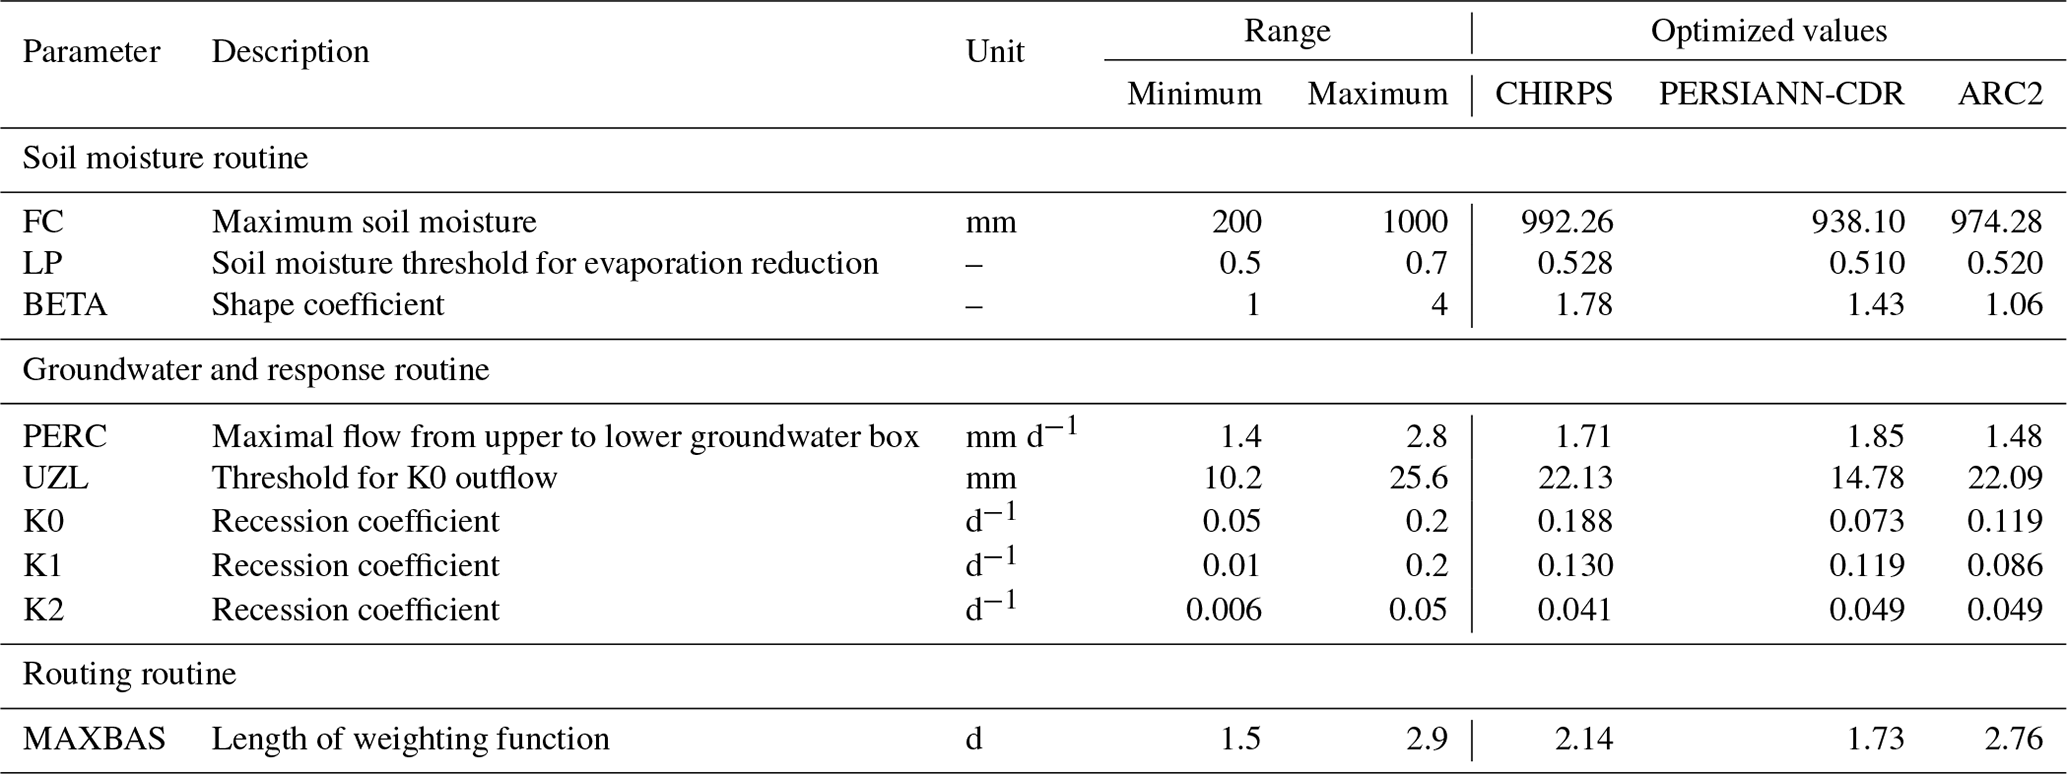
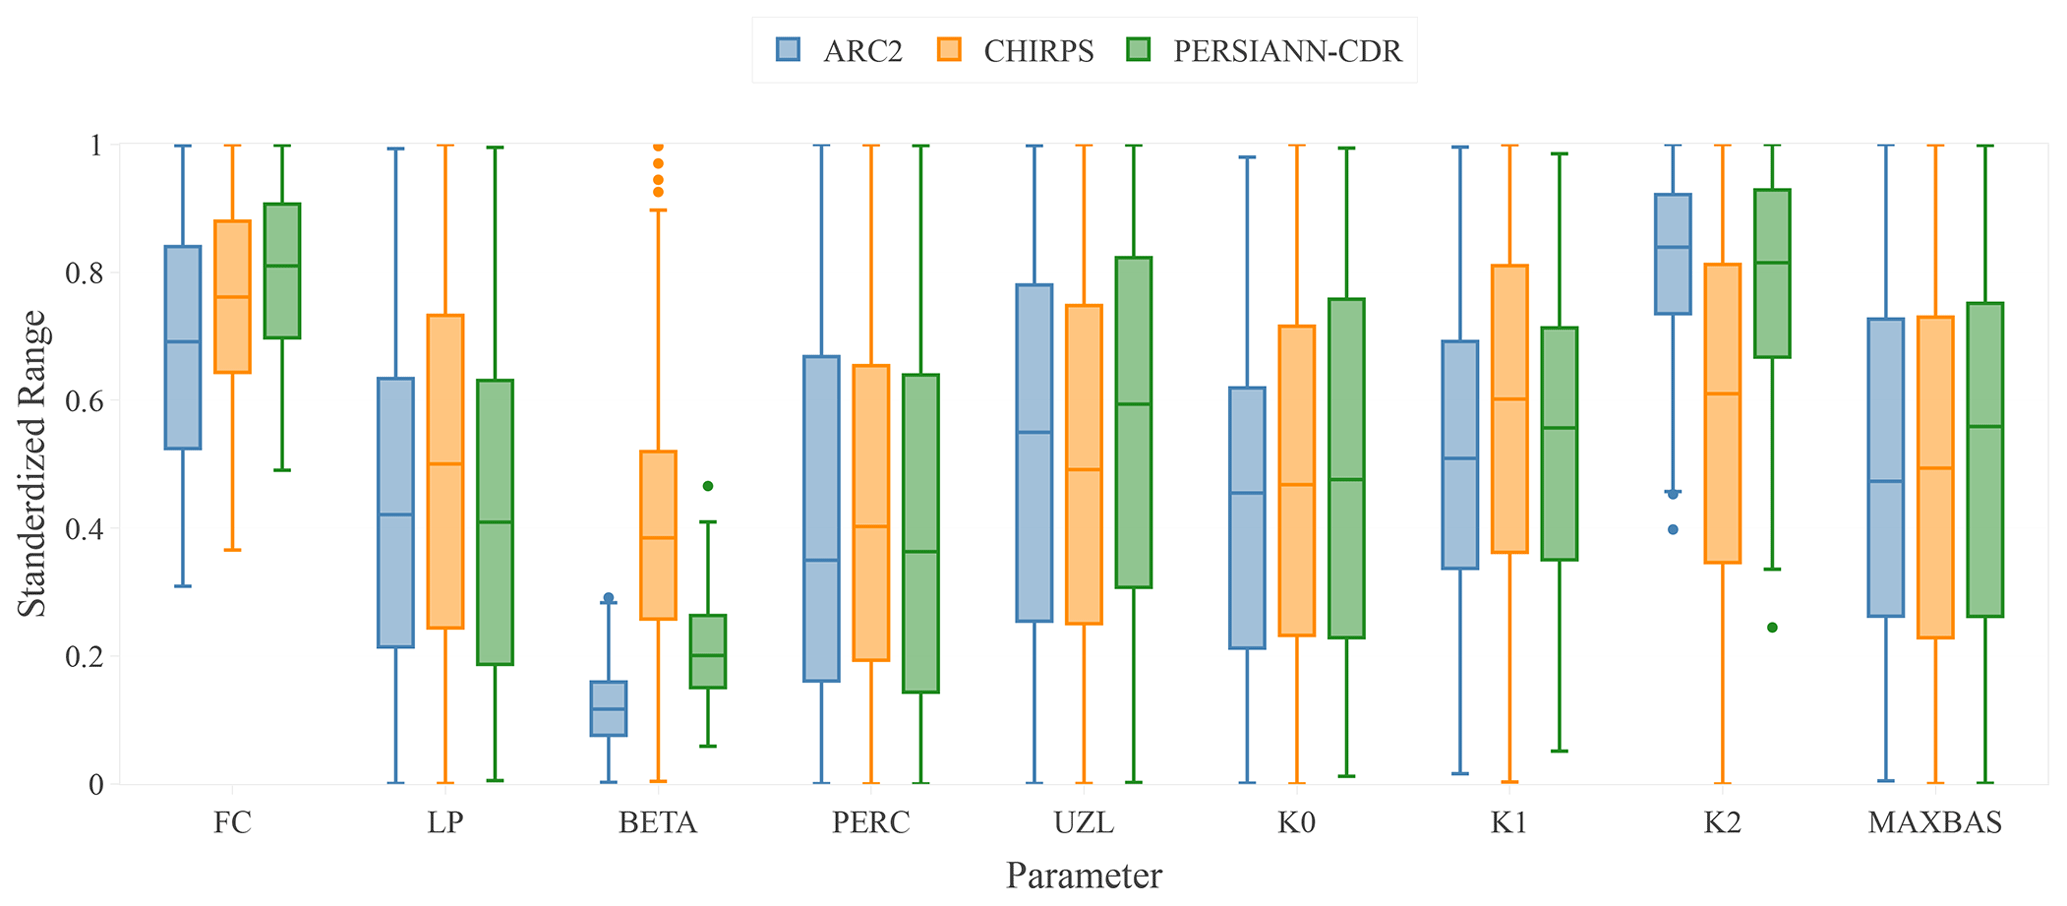
Figure D1The standardized sensitive value ranges of HBV-light parameters for the simulations that were classified as very good (i.e., NSE > 0.75) when using ARC2, CHIRPS, and PERSIANN-CDR as forcing data.
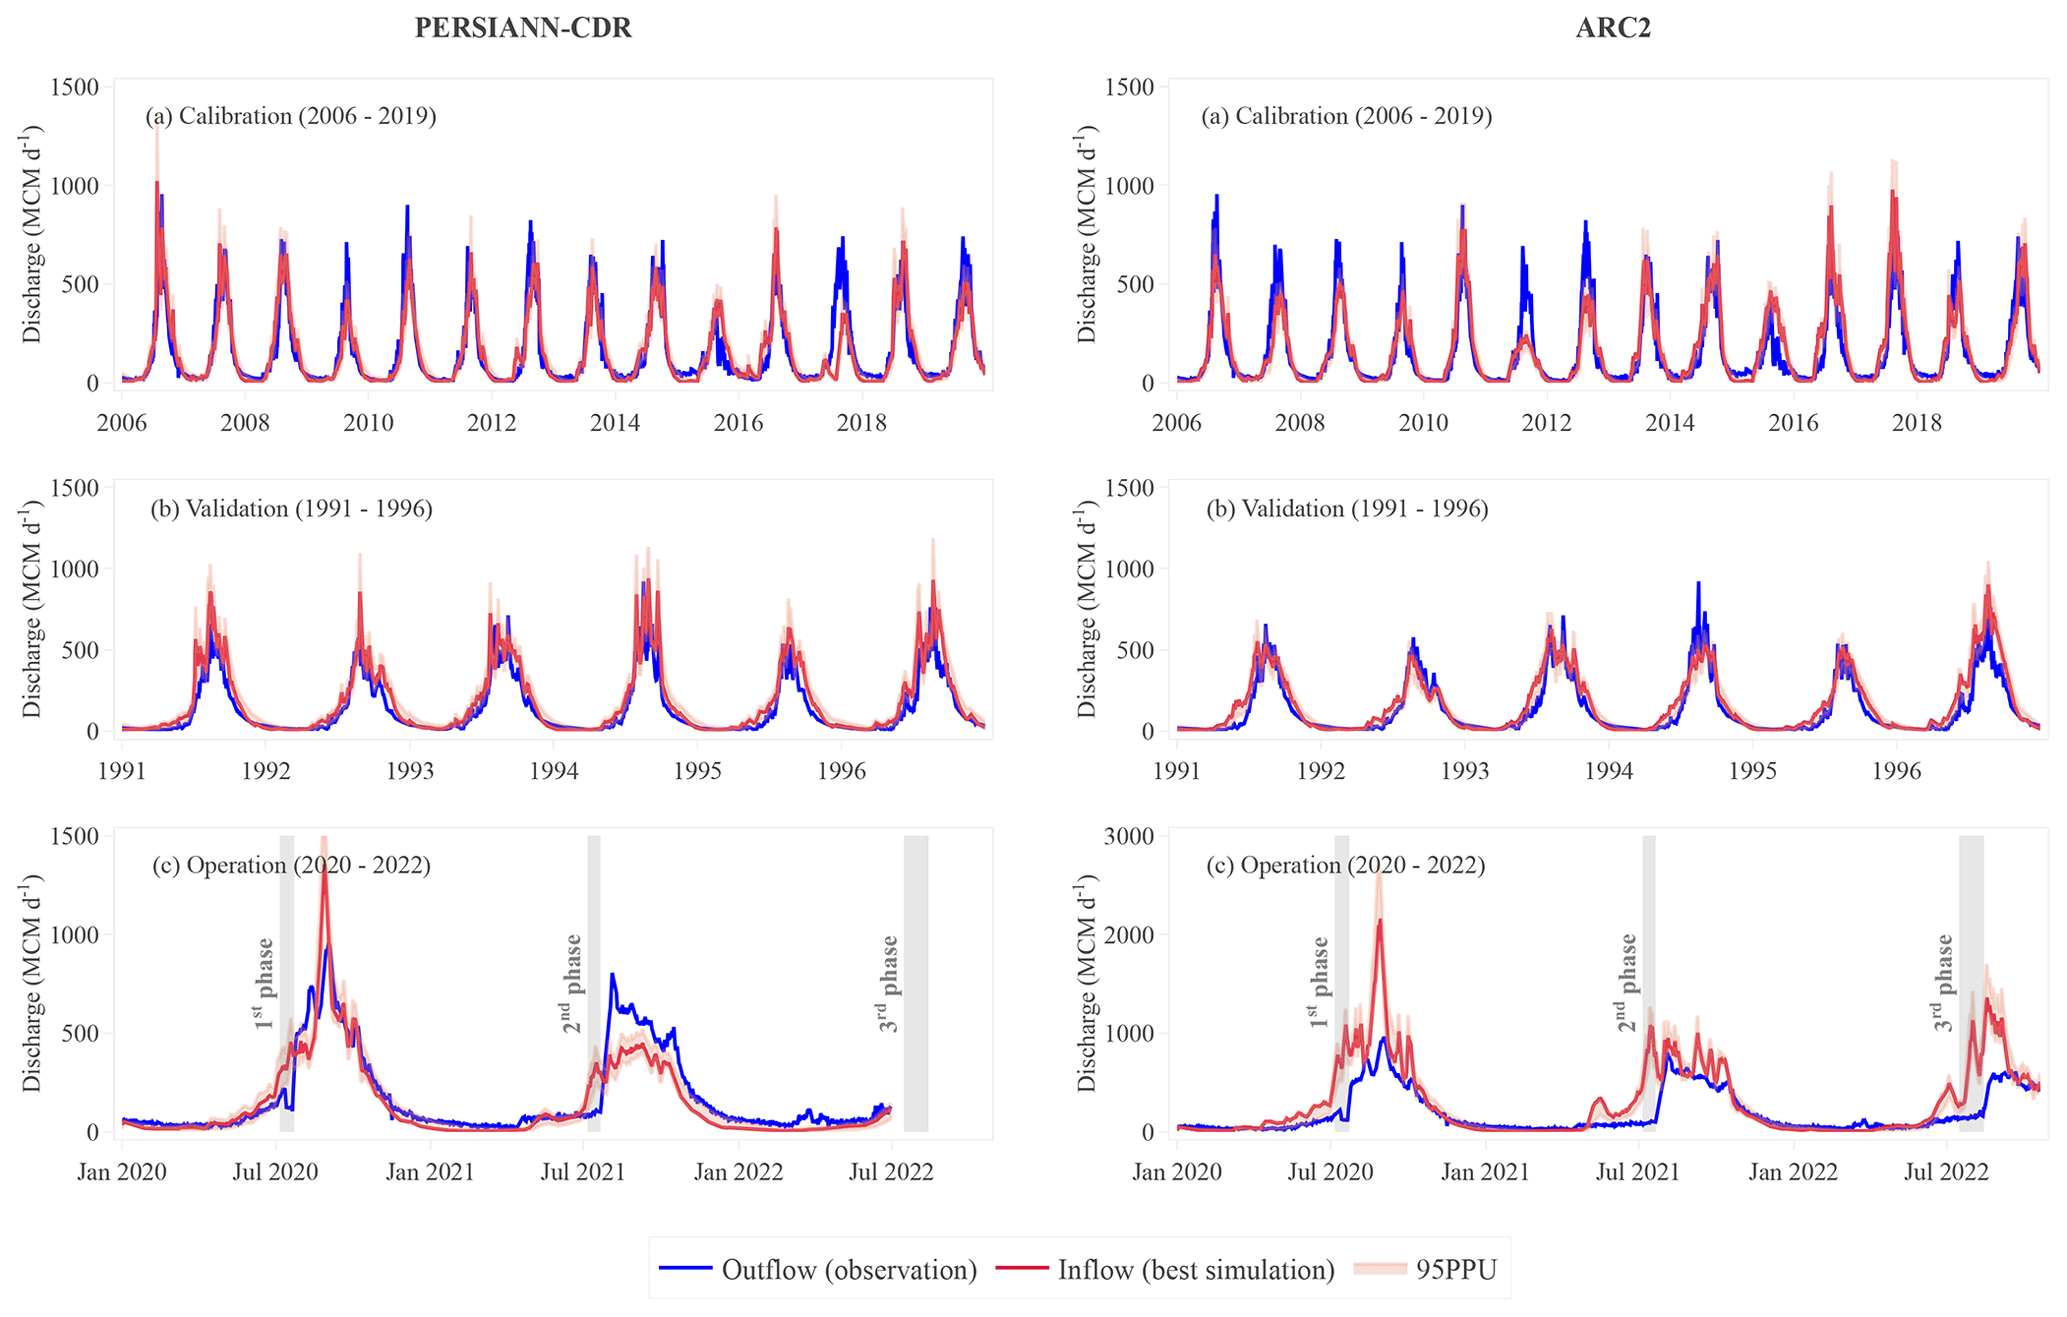
Figure D2Temporal dynamics of daily simulated and observed discharge at the Upper Blue Nile basin outlet. Simulations forced with PERSIANN-CDR (left column) and ARC2 (right column) are shown during the (a) calibration period, (b) validation period, and (c) operation period. The best simulation was based on the parameter sets that achieved the highest NSE value during calibration. The 95 % prediction uncertainty (95 PPU) represents the 95th percentile of all very good simulations (NSE > 0.75) obtained by random generation of the parameter sets. The vertical gray shaded areas in the operation period roughly indicate the days on which the dam is filling.
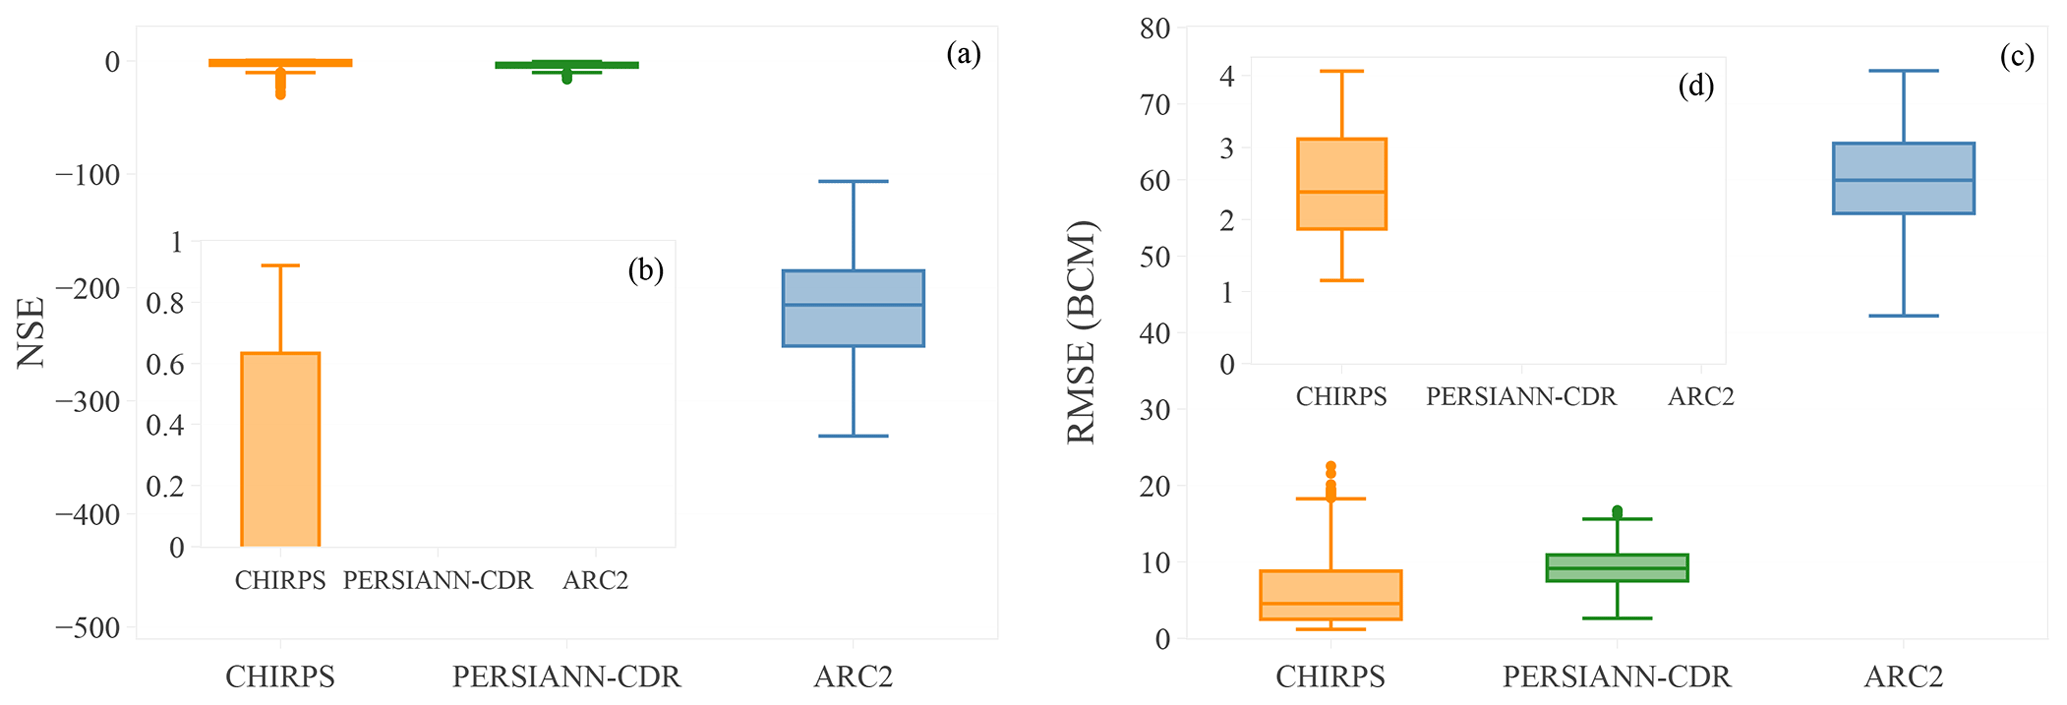
Figure D3The HBV-light performance with respect to retrieving the storage volume of GERD from 2020 to 2022 shown using (a, b) the Nash–Sutcliffe efficiency (NSE) and (c, d) the root-mean-square error (RMSE) between the satellite-observed storage (using Sentinel) and the simulated GERD reservoir storage (using HBV-light). Panel (b) is a zoom-in of panel (a) showing the NSE between 0 and 1, while panel (d) presents the RMSE of all simulations with NSE > 0. The x axis presents the three tested rainfall products for input uncertainty, while the whiskers demonstrate HBV-light parameter uncertainty.
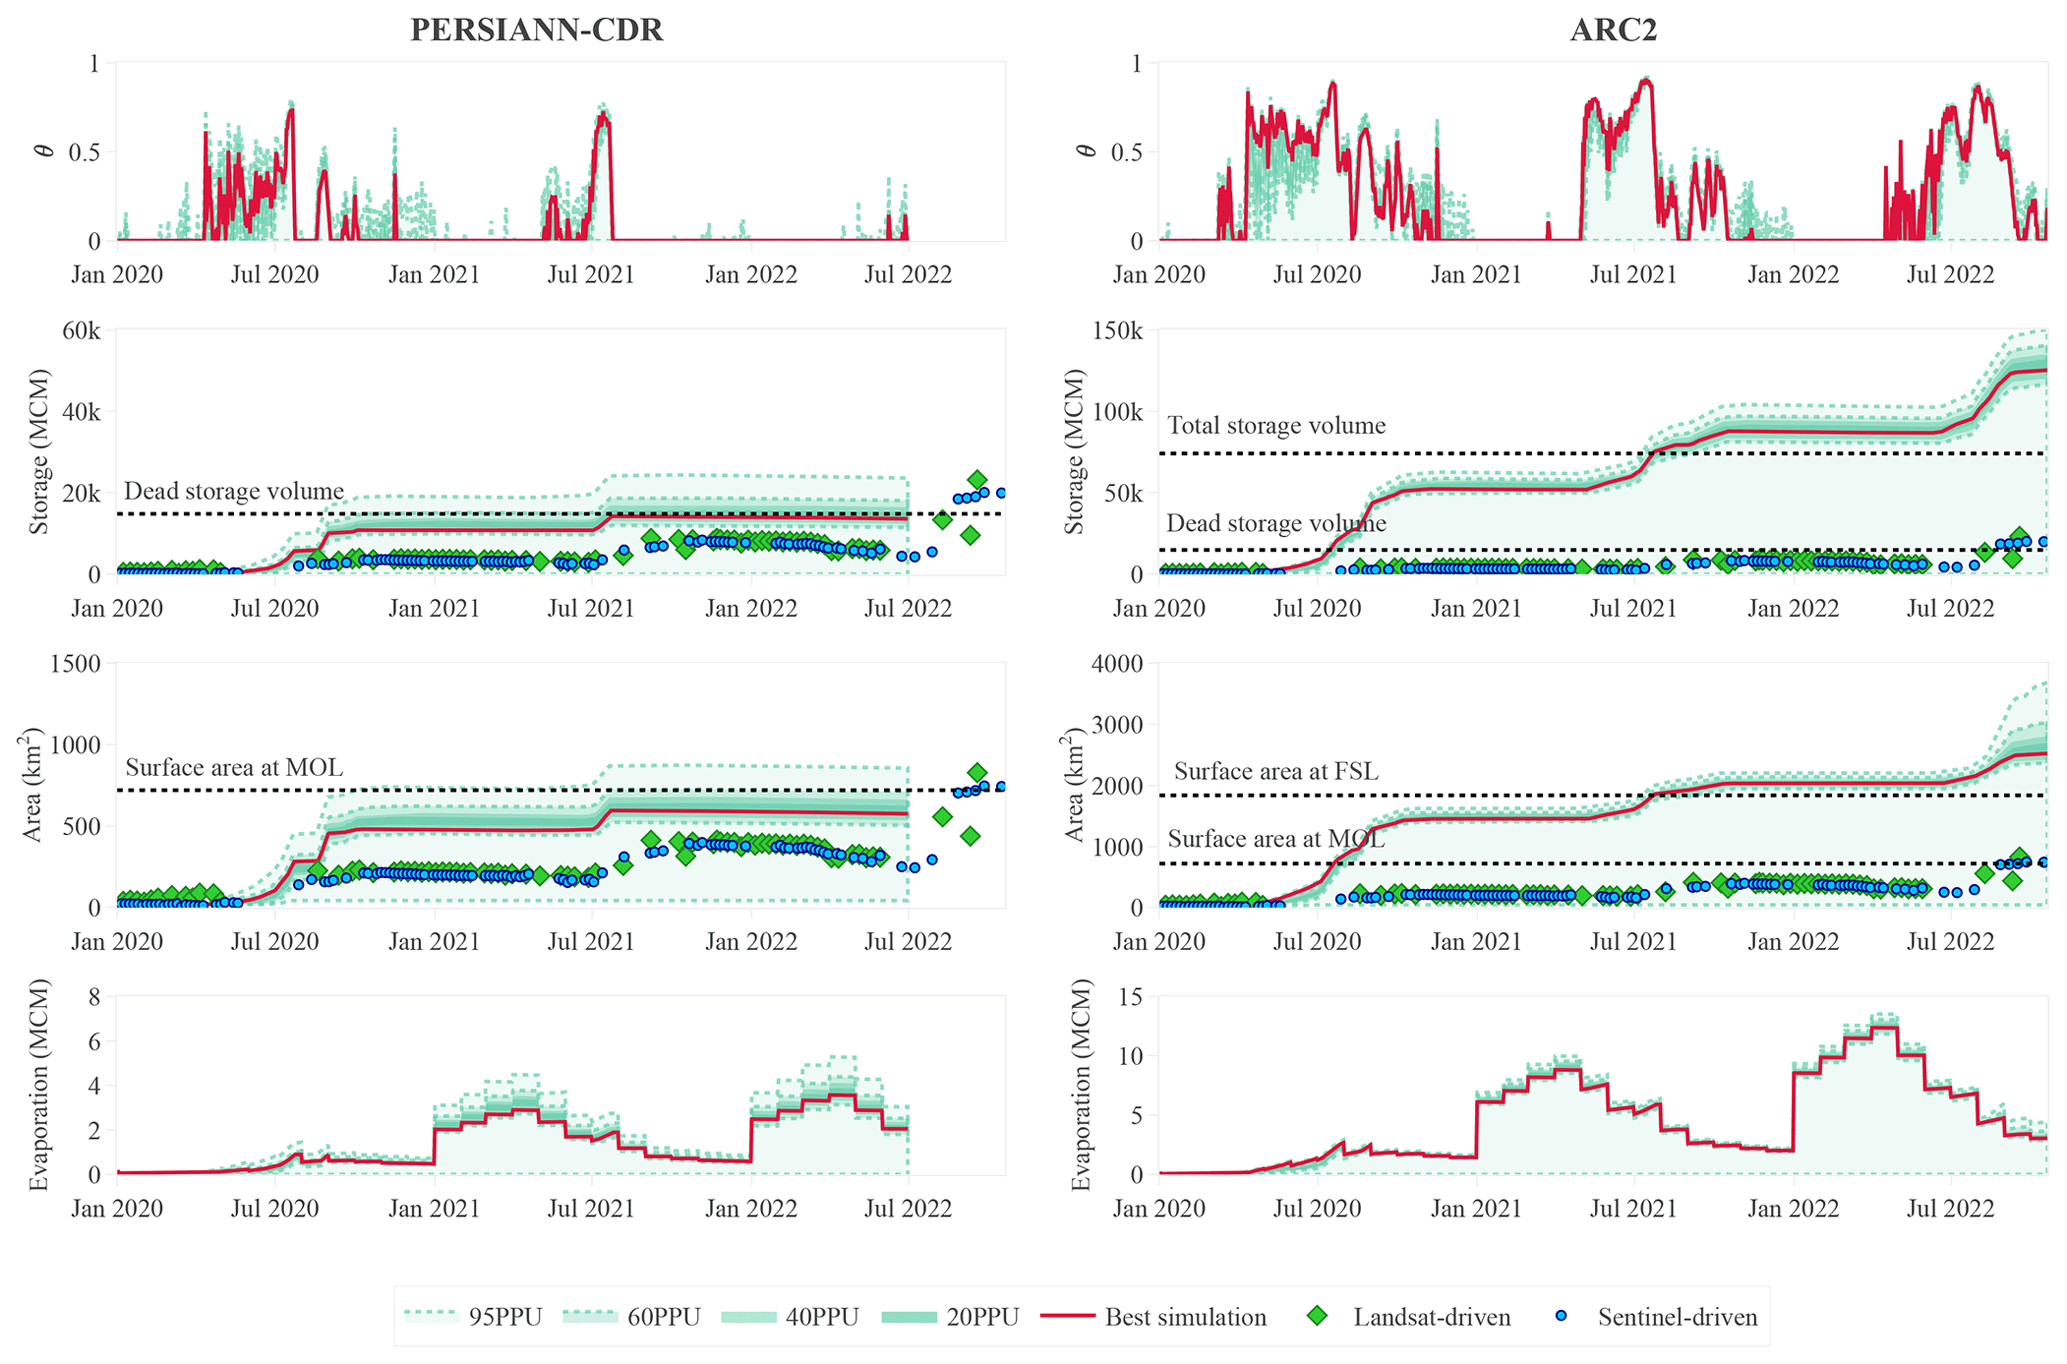
Figure D4Temporal dynamics of inferred GERD filling strategies. The first 3 years of GERD filling strategies was retrieved from the HBV-light lumped model using PERSIANN-CDR (left column) and ARC2 (right column). The first row is the daily fraction of inflow volume retained by GERD. The second and third rows are the daily water storage and the corresponding water surface area of the GERD reservoir, respectively. The last row is the daily evaporated volume of water from the reservoir surface. The prediction uncertainty ranges indicate the 95, 60, 40, and 20 percentiles of the results obtained from the simulations classified as very good (269 simulations for PERSIANN-CDR and 244 simulations for ARC2).
The publicly available data used in this study comprise the hydrological modeling forcing data (i.e., rainfall, temperature, and potential evapotranspiration) and the satellite imagery. The Landsat Collection 2 Level-2 product was retrieved from https://earthexplorer.usgs.gov/ (USGS, 2021). The CHIRPS, PERSIANN-CDR, and ERA5 datasets were downloaded from the Climate Engine Research App (Huntington et al., 2017). The ARC2 data are available from http://ftp.cpc.ncep.noaa.gov/fews/fewsdata/africa/arc2/geotiff/ (NOAA-CPC, 2017). Additionally, the GPCC dataset can be downloaded from https://opendata.dwd.de/climate_environment/GPCC/full_data_daily_v2020/ (DWD, 2020). The rain gauge data are not publicly available, but they can be obtained upon request from the Ethiopian National Meteorological Agency website at http://www.ethiomet.gov.et/ (The National Meteorological Agency, 2016) (navigate to “Data Service” and then select “Station Information”; a request form will appear once a station has been selected). The hydrological data for the Nile system are not publicly available due to governmental restrictions; however, the flow data collected and maintained by the Nile Waters Directorate of the Ministry of Irrigation and Water Resources, Sudan, were made available for this study. As we cannot share these data directly, we provide the successful HBV-light parameter sets and runs (NSE > 0.75) as a best approximation of the observed flow (https://doi.org/10.4211/hs.ed4530307dda435e9d3dcdb74da86a30) in addition to the E–A–S relationship derived from the SRTM DEM (Ali, 2023).
AMA was responsible for the data curation, formal analysis, investigation, methodology development, resource acquisition, software development, validation of data collection and analyses, visualization of results, and writing of the original manuscript. AJT and LAM supervised the study, which started as AMA's thesis towards a Master of Science degree. AJT acted as the primary supervisor and LAM as the secondary. All of the authors contributed to conceptualizing, reviewing, and editing the paper.
At least one of the (co-)authors is a member of the editorial board of Hydrology and Earth System Sciences. The peer-review process was guided by an independent editor, and the authors also have no other competing interests to declare.
Publisher’s note: Copernicus Publications remains neutral with regard to jurisdictional claims made in the text, published maps, institutional affiliations, or any other geographical representation in this paper. While Copernicus Publications makes every effort to include appropriate place names, the final responsibility lies with the authors.
This article is part of the special issue “Representation of water infrastructures in large-scale hydrological and Earth system models”. It is not associated with a conference.
The authors wish to thank the Ministry of Irrigation and Water Resources of Sudan for providing the discharge data at Eldiem.
This research has been supported by the Africa Scholarship Programme (ASP) offered by the Wageningen University Fellowship Programme (WUFP).
This paper was edited by Marc Bierkens and reviewed by two anonymous referees.
Abdel-Aziz, O. R.: Flood forecasting in Blue Nile basin using a process-based hydrological model, Int. J. Environ., 3, 10–21, https://doi.org/10.3126/ije.v3i1.9938, 2014. a
Abd-El Moneim, H., Soliman, M. R., and Moghazy, H. M.: Numerical simulation of Blue Nile Basin using distributed hydrological model, in: 11th international conference on the role of engineering towards a better environment (RETBE'17), 8–20 December 2017, Alexandria, Egypt, https://www.researchgate.net/publication/321978918 (last access: 8 November 2023), 2017. a
Abera, W., Formetta, G., Brocca, L., and Rigon, R.: Modeling the water budget of the Upper Blue Nile basin using the JGrass-NewAge model system and satellite data, Hydrol. Earth Syst. Sci., 21, 3145–3165, https://doi.org/10.5194/hess-21-3145-2017, 2017. a
Adam, H., AW, A., and Hata, T.: The Future of Participatory Water Management in Gezira Scheme, Sudan, in: Proceedings of the International Workshop on Participatory Management of Irrigation Systems, 16–23 March 2003, Kyoto, Osaka, Japan, 18–24, https://www.researchgate.net/publication/374762917 (last access: 8 November 2023), 2003. a
Adem, A. A., Dile, Y. T., Worqlul, A. W., Ayana, E. K., Tilahun, S. A., and Steenhuis, T. S.: Assessing digital soil inventories for predicting streamflow in the headwaters of the Blue Nile, Hydrology, 7, 8, https://doi.org/10.3390/hydrology7010008, 2020. a
Africa News: Ethiopia dismisses rumours Nile mega-dam will starve Egypt and Sudan, https://www.africanews.com/2022/02/21/ethiopia-dismisses-rumours-nile-mega-dam-will-starve-egypt-and-sudan/ (last access: 2 December 2022), 2022. a
Agegn, G. K.: Climate change impact on stream flow of upper blue nile basin: based on CMIP5 climate model outputs, MS thesis, Arba Minch University, Arba Minch, Ethiopia, https://scholar.archive.org/work/2fvrnezlfff6tcxwkjpjosbsua/access/wayback/https://nadre.ethernet.edu.et/record/2724/files/GizachewThesisddddd.pdf (lass access: 10 November 2023), 2016. a
Ahmed, A., Osman, I., and Babiker, A.: Sediment and aquatic weeds management challenges in Gezira irrigated scheme, in: International Sediment Initiative Conference, 12–15 November 2006, Khartoum, Sudan, https://scholar.google.com/scholar?cluster=337559190028257090&hl=en&oi=scholarr (last access: 22 July 2022), 2006. a
Aich, V., Liersch, S., Vetter, T., Huang, S., Tecklenburg, J., Hoffmann, P., Koch, H., Fournet, S., Krysanova, V., Müller, E. N., and Hattermann, F. F.: Comparing impacts of climate change on streamflow in four large African river basins, Hydrol. Earth Syst. Sci., 18, 1305–1321, https://doi.org/10.5194/hess-18-1305-2014, 2014. a
Akale, A. T., Dagnew, D. C., Moges, M. A., Tilahun, S. A., and Steenhuis, T. S.: The effect of landscape interventions on groundwater flow and surface runoff in a watershed in the upper reaches of the Blue Nile, Water, 11, 2188, https://doi.org/10.3390/w11102188, 2019. a
Ali, A. M.: Data underlying the paper “Inferring reservoir filling strategies under limited data availability using hydrological modelling and Earth observation: the case of the Grand Ethiopian Renaissance Dam (GERD)”, HydroShare [data set], https://doi.org/10.4211/hs.15d3cf37ad934fe7a1e52f5fb5a56145, 2023. a
Alrajoula, M. T., Al Zayed, I. S., Elagib, N. A., and Hamdi, M. R.: Hydrological, socio-economic and reservoir alterations of Er Roseires Dam in Sudan, Sci. Total Environ., 566, 938–948, https://doi.org/10.1016/j.scitotenv.2016.05.029, 2016. a
Ashouri, H., Hsu, K.-L., Sorooshian, S., Braithwaite, D. K., Knapp, K. R., Cecil, L. D., Nelson, B. R., and Prat, O. P.: PERSIANN-CDR: Daily precipitation climate data record from multisatellite observations for hydrological and climate studies, B. Am. Meteorol. Soc., 96, 69–83, https://doi.org/10.1175/BAMS-D-13-00068.1, 2015. a
Asitatikie, A. N. and Gebeyehu, W. Z.: Assessment of hydrology and optimal water allocation under changing climate conditions: The case of Megech river sub basin reservoir, Upper Blue Nile Basin, Ethiopia, Modeling Earth Systems and Environment, 7, 2629–2642, https://doi.org/10.1007/s40808-020-01024-0, 2021. a
Basheer, M. and Elagib, N. A.: Performance of satellite-based and GPCC 7.0 rainfall products in an extremely data-scarce country in the Nile Basin, Atmos. Res., 215, 128–140, https://doi.org/10.1016/j.atmosres.2018.08.028, 2019. a
Basheer, M., Wheeler, K. G., Ribbe, L., Majdalawi, M., Abdo, G., and Zagona, E. A.: Quantifying and evaluating the impacts of cooperation in transboundary river basins on the Water-Energy-Food nexus: The Blue Nile Basin, Sci. Total Environ., 630, 1309–1323, https://doi.org/10.1016/j.scitotenv.2018.02.249, 2018. a
Bergström, S.: The HBV model, Computer models of watershed hydrology, 443–476, ISBN 978-09-1833-491-6, 1995. a
Betrie, G. D., Mohamed, Y. A., Ann van Griensven, I., and Mynett, A.: Modeling of soil erosion and sediment transport in the Blue Nile Basin using the Open Model Interface Approach, Improved Water and Land Management in the Ethiopian Highlands: Its Impact on Downstream Stakeholders Dependent on the Blue Nile, p. 132, ISBN 978-92-9090-716-9, 2009. a, b
Beven, K. and Freer, J.: Equifinality, data assimilation, and uncertainty estimation in mechanistic modelling of complex environmental systems using the GLUE methodology, J. Hydrol., 249, 11–29, https://doi.org/10.1016/S0022-1694(01)00421-8, 2001. a
Bihonegn, B. G., Moges, M. A., Mulu, G. F., and Sinshaw, B. G.: Evaluation of Stream Flow Prediction Capability of Hydrological Models in the Upper Blue Nile Basin, Ethiopia, in: International Conference on Advances of Science and Technology, Springer, 210–227, https://doi.org/10.1007/978-3-030-43690-2_14, 2020. a, b, c
Birkett, C., Reynolds, C., Beckley, B., and Doorn, B.: From research to operations: The USDA global reservoir and lake monitor, in: Coastal altimetry, Springer, 19–50, https://doi.org/10.1007/978-3-642-12796-0_2, 2011. a
Biswas, A. K.: Management of transboundary waters: an overview, Management of transboundary rivers and lakes, Springer, 1–20, https://doi.org/10.1007/978-3-540-74928-8_1, 2008. a
Bizuneh, B. B., Moges, M. A., Sinshaw, B. G., and Kerebih, M. S.: SWAT and HBV models’ response to streamflow estimation in the upper Blue Nile Basin, Ethiopia, Water-Energy Nexus, 4, 41–53, https://doi.org/10.1016/j.wen.2021.03.001, 2021. a, b, c
Bonnema, M. and Hossain, F.: Assessing the potential of the surface water and ocean topography mission for reservoir monitoring in the Mekong River Basin, Water Resour. Res., 55, 444–461, https://doi.org/10.1029/2018WR023743, 2019. a
Booij, M. J., Tollenaar, D., van Beek, E., and Kwadijk, J. C.: Simulating impacts of climate change on river discharges in the Nile basin, Phys. Chemi. Earth Pt. A/B/C, 36, 696–709, https://doi.org/10.1016/j.pce.2011.07.042, 2011. a
Boru, G. F., Gonfa, Z. B., and Diga, G. M.: Impacts of climate change on stream flow and water availability in Anger sub-basin, Nile Basin of Ethiopia, Sustainable Water Resources Management, 5, 1755–1764, https://doi.org/10.1007/s40899-019-00327-0, 2019. a
Buchhorn, M., Smets, B., Bertels, L., De Roo, B., Lesiv, M., Tsendbazar, N.-E., Herold, M., and Fritz, S.: Copernicus global land service: Land cover 100 m: collection 3: epoch 2019: Globe, Version V3. 0.1), Zenodo [data set], https://doi.org/10.5281/zenodo.3518038, 2020. a
Chakilu, G. and Moges, M.: Assessing the land use/cover dynamics and its impact on the low flow of Gumara Watershed, Upper Blue Nile Basin, Ethiopia, Hydrol. Current Res., 8, 1–6, https://doi.org/10.4172/2157-7587.1000268, 2017. a
Chen, Y., Ahmed, M., Tangdamrongsub, N., and Murgulet, D.: Reservoir-Induced Land Deformation: Case Study from the Grand Ethiopian Renaissance Dam, Remote Sensing, 13, 874, https://doi.org/10.3390/rs13050874, 2021. a
Collick, A. S., Easton, Z. M., Ashagrie, T., Biruk, B., Tilahun, S., Adgo, E., Awulachew, S. B., Zeleke, G., and Steenhuis, T. S.: A simple semi-distributed water balance model for the Ethiopian highlands, Hydrol. Process., 23, 3718–3727, https://doi.org/10.1002/hyp.7517, 2009. a
Conway, D.: The climate and hydrology of the Upper Blue Nile River, Geogr. J., 166, 49–62, https://doi.org/10.1111/j.1475-4959.2000.tb00006.x, 2000. a
Deginet, M. D.: Land surface representation for regional rainfall-runoff modelling, upper Blue Nile basin, Ethiopia, https://webapps.itc.utwente.nl/librarywww/papers_2008/msc/wrem/moges.pdf (last access: 8 November 2023), 2008. a
De Stefano, L., Petersen-Perlman, J. D., Sproles, E. A., Eynard, J., and Wolf, A. T.: Assessment of transboundary river basins for potential hydro-political tensions, Global Environ. Chang., 45, 35–46, https://doi.org/10.1016/j.gloenvcha.2017.04.008, 2017. a
Draper, S. E.: Introduction to transboundary water sharing, J. Water Res. Pl., 133, 377–381, https://doi.org/10.1061/(ASCE)0733-9496(2007)133:5(377), 2007. a
Drusch, M., Bello, U. D., Carlier, S., Colin, O., Fernandez, V., Gascon, F., Hoersch, B., Isola, C., Laberinti, P., Martimort, P., Meygret, A., Spoto, F., Sy, O., Marchese, F., and Bargellini, P.: Sentinel-2: ESA's Optical High-Resolution Mission for GMES Operational Services, Remote Sens. Environ., 120, 25–36, https://doi.org/10.1016/j.rse.2011.11.026, 2012. a
Dumont, H. J.: The Nile river system, in: The Ecology of River Systems, Springer, 61–88, https://doi.org/10.1007/978-94-017-3290-1_3, 1986. a
DWD – the German Meteorological Service: Index of /climate_environment/GPCC/full_data_daily_v2020/, DWD [data set], https://opendata.dwd.de/climate_environment/GPCC/full_data_daily_v2020/, (last access: 8 November 2023), 2020. a
Elagib, N. A. and Mansell, M. G.: New approaches for estimating global solar radiation across Sudan, Energ. Convers. Manage., 41, 419–434, https://doi.org/10.1016/S0196-8904(99)00123-5, 2000. a, b
Eldardiry, H. and Hossain, F.: Understanding reservoir operating rules in the transboundary nile river basin using macroscale hydrologic modeling with satellite measurements, J. Hydrometeorol., 20, 2253–2269, https://doi.org/10.1175/JHM-D-19-0058.1, 2019. a
Enku, T., Tadesse, A., Yilak, D., Gessesse, A., Addisie, M., Abate, M., Zimale, F., Moges, M., Tilahun, S., and Steenhuis, T.: Biohydrology of low flows in the humid Ethiopian highlands: The Gilgel Abay catchment, Biologia, 69, 1502–1509, https://doi.org/10.2478/s11756-014-0462-9, 2014. a
Ezega News: Power Generation Capacity of GERD Slashed to 5150MW – Ethiopian Minister, https://www.ezega.com/News/NewsDetails/7331/Power-Generation-Capacity-of-GERD-Slashed-to-5150MW-Ethiopian-Minister (last access: 4 July 2022), 2019. a
Farr, T. G., Rosen, P. A., Caro, E., Crippen, R., Duren, R., Hensley, S., Kobrick, M., Paller, M., Rodriguez, E., Roth, L., Seal, D., Shaffer, S., Shimada, J., Umland, J., Werner, M., Oskin, M., Burbank, D., and Alsdorf, D.: The Shuttle Radar Topography Mission, Rev. Geophys., 45, 1–33, https://doi.org/10.1029/2005rg000183, 2007. a
Funk, C. C., Peterson, P. J., Landsfeld, M. F., Pedreros, D. H., Verdin, J. P., Rowland, J. D., Romero, B. E., Husak, G. J., Michaelsen, J. C., and Verdin, A. P.: A quasi-global precipitation time series for drought monitoring, US Geological Survey data series, 832, 1–12, https://doi.org/10.3133/ds832, 2014. a
Gao, H., Birkett, C., and Lettenmaier, D. P.: Global monitoring of large reservoir storage from satellite remote sensing, Water Resour. Res., 48, W09504, https://doi.org/10.1029/2012WR012063, 2012. a, b
Gebre, S., Tadele, K., and Mariam, B.: Potential impacts of climate change on the hydrology and water resources availability of Didessa Catchment, Blue Nile River Basin, Ethiopia, J. Geol. Geosci., 4, 193, https://doi.org/10.4172/2329-6755.1000193, 2015. a
Gebre, S. L.: Application of the HEC-HMS model for runoff simulation of Upper Blue Nile River Basin, Hydrology, 6, 1, https://doi.org/10.4172/2157-7587.1000199, 2015. a
Gebre, S. L. and Ludwig, F.: Hydrological response to climate change of the upper blue Nile River Basin: based on IPCC fifth assessment report (AR5), Journal of Climatology & Weather Forecasting, 3, 1–15, https://doi.org/10.4172/2332-2594.1000121, 2015. a
Gebrehiwet, K.: Hydro-hegemony, an antiquated notion, in the contemporary Nile River basin: the rise of water utilization in up-stream riparian countries, Heliyon, 6, e04877, https://doi.org/10.1016/j.heliyon.2020.e04877, 2020. a
Getachew, B., Manjunatha, B., and Bhat, H. G.: Modeling projected impacts of climate and land use/land cover changes on hydrological responses in the Lake Tana Basin, upper Blue Nile River Basin, Ethiopia, J. Hydrol., 595, 125974, https://doi.org/10.1016/j.jhydrol.2021.125974, 2021. a
Getahun, M. M.: Adapting LAPSUS_D model to simulate runoff and sediment yield in Minizr catchment, NW Ethiopia, Sustaining reservoir use through sediment trapping in NW Ethiopia, Wageningen University & Research, p. 87, https://doi.org/10.18174/388775, 2016. a
Ghorab, E., Helal, Y. E., Mahgoub, S., Sobeih, M., and Shalash, A.: Numerical investigations to the effects of the proposed dams on the blue nile basin discharge, ERJ Engineering Research Journal, 36, 69–77, 2013. a
Hengl, T., de Jesus, J. M., Heuvelink, G. B. M., Gonzalez, M. R., Kilibarda, M., Blagotić, A., Shangguan, W., Wright, M. N., Geng, X., Bauer-Marschallinger, B., Guevara, M. A., Vargas, R., MacMillan, R. A., Batjes, N. H., Leenaars, J. G. B., Ribeiro, E., Wheeler, I., Mantel, S., and Kempen, B.: SoilGrids250m: Global gridded soil information based on machine learning, PLOS ONE, 12, e0169748, https://doi.org/10.1371/journal.pone.0169748, 2017. a
Hersbach, H., Bell, W., Berrisford, P., Horányi, A., J., M.-S., Nicolas, J., Radu, R., Schepers, D., Simmons, A., Soci, C., and Dee, D.: Global reanalysis: goodbye ERA-Interim, hello ERA5, ECMWF Newsletter, https://doi.org/10.21957/VF291HEHD7, 2019. a, b, c
Hijmans, R., Garcia, N., and Wieczorek, J.: GADM database of global administrative areas, https://gadm.org/ (last access: 8 November 2023), 2012. a
Hou, J., van Dijk, A. I. J. M., Beck, H. E., Renzullo, L. J., and Wada, Y.: Remotely sensed reservoir water storage dynamics (1984–2015) and the influence of climate variability and management at a global scale, Hydrol. Earth Syst. Sci., 26, 3785–3803, https://doi.org/10.5194/hess-26-3785-2022, 2022. a, b
Hrachowitz, M., Savenije, H., Blöschl, G., McDonnell, J., Sivapalan, M., Pomeroy, J., Arheimer, B., Blume, T., Clark, M., Ehret, U., Fenicia, F., Freer, J., Gelfan, A., Gupta, H., Hughes, D., Hut, R., Montanari, A., Pande, S., Tetzlaff, D., Troch, P., Uhlenbrook, S., Wagener, T., Winsemius, H., Woods, R., Zehe, E., and Cudennec, C.: A decade of Predictions in Ungauged Basins (PUB) – a review, Hydrolog. Sci. J., 58, 1198–1255, https://doi.org/10.1080/02626667.2013.803183, 2013. a
Huntington, J. L., Hegewisch, K. C., Daudert, B., Morton, C. G., Abatzoglou, J. T., McEvoy, D. J., and Erickson, T.: Climate engine: Cloud computing and visualization of climate and remote sensing data for advanced natural resource monitoring and process understanding, B. Am. Meteorol. Soc., 98, 2397–2410, https://doi.org/10.1175/BAMS-D-15-00324.1, 2017. a
IPoE: International Panel of Experts on the Grand Ethiopian Renaissance Dam Project Final Report, https://www.scidev.net/wp-content/uploads/site_assets/docs/international_panel_of_experts_for_ethiopian_renaissance_dam-_final_report.pdf (last access: 8 November 2023), 2013. a
Jansen, K. F., Teuling, A. J., Craig, J. R., Dal Molin, M., Knoben, W. J., Parajka, J., Vis, M., and Melsen, L. A.: Mimicry of a Conceptual Hydrological Model (HBV): What's in a Name?, Water Resour. Res., 57, e2020WR029143, https://doi.org/10.1029/2020WR029143, 2021. a
Kansara, P., Li, W., El-Askary, H., Lakshmi, V., Piechota, T., Struppa, D., and Abdelaty Sayed, M.: An assessment of the filling process of the Grand Ethiopian Renaissance Dam and its impact on the downstream countries, Remote Sensing, 13, 711, https://doi.org/10.3390/rs13040711, 2021. a
Kessete, N., Moges, M. A., and Steenhuis, T. S.: Evaluating the applicability and scalability of bias corrected CFSR climate data for hydrological modeling in upper Blue Nile basin, Ethiopia, in: Extreme Hydrology and Climate Variability, Elsevier, 11–22, https://doi.org/10.1016/B978-0-12-815998-9.00002-6, 2019. a
Khairy, W., El-Motasem, M., Mehanna, A., and Hefny, K.: Estimation of evaporation losses from water bodies in the Sudan and Ethiopia, International Journal of Energy and Water Resources, 3, 233–246, https://doi.org/10.1007/s42108-019-00031-x, 2019. a
Kim, U. and Kaluarachchi, J. J.: Climate change impacts on water resources in the upper blue Nile River Basin, Ethiopia 1, J. Am. Water Resour. As., 45, 1361–1378, https://doi.org/10.1111/j.1752-1688.2009.00369.x, 2009. a
Lakew, H. B.: Investigating the effectiveness of bias correction and merging MSWEP with gauged rainfall for the hydrological simulation of the upper Blue Nile basin, J. Hydrol., 32, 100741, https://doi.org/10.1016/j.ejrh.2020.100741, 2020. a
Lakew, H. B. and Moges, S. A.: Comparison of Spatial Interpolation Techniques of Rainfall for Hydrological Applications in a Complex Mountainous Region of the Upper Blue Nile Basin, in: Nile and Grand Ethiopian Renaissance Dam, Springer, 461–474, https://doi.org/10.1007/978-3-030-76437-1_24, 2021. a
Lakew, H. B., Moges, S. A., and Asfaw, D. H.: Hydrological evaluation of satellite and reanalysis precipitation products in the Upper Blue Nile Basin: A case study of Gilgel Abbay, Hydrology, 4, 39, https://doi.org/10.3390/hydrology4030039, 2017. a
Lazin, R., Shen, X., Koukoula, M., and Anagnostou, E.: Evaluation of the hyper-resolution model-derived water cycle components over the upper Blue Nile Basin, J. Hydrol., 590, 125231, https://doi.org/10.1016/j.jhydrol.2020.125231, 2020. a
Legesse, E. S.: Modeling rainfall-runoff relationships for the Anjeni watershed in the Blue Nile basin, PhD thesis, Citeseer, http://refhub.elsevier.com/S0016-7061(14)00451-0/rf0220 (last access: 8 November 2023), 2009. a
Lehner, B., Verdin, K., and Jarvis, A.: New global hydrography derived from spaceborne elevation data, Eos T. Am. Geophys. Un., 89, 93–94, https://doi.org/10.1029/2008EO100001, 2008. a, b
Lemann, T., Zeleke, G., Amsler, C., Giovanoli, L., Suter, H., and Roth, V.: Modelling the effect of soil and water conservation on discharge and sediment yield in the upper Blue Nile basin, Ethiopia, Appl. Geogr., 73, 89–101, https://doi.org/10.1016/j.apgeog.2016.06.008, 2016. a
Lemann, T., Roth, V., and Zeleke, G.: Impact of precipitation and temperature changes on hydrological responses of small-scale catchments in the Ethiopian Highlands, Hydrolog. Sci. J., 62, 270–282, https://doi.org/10.1080/02626667.2016.1217415, 2017. a
Lemann, T., Roth, V., Zeleke, G., Subhatu, A., Kassawmar, T., and Hurni, H.: Spatial and temporal variability in hydrological responses of the Upper Blue Nile basin, Ethiopia, Water, 11, 21, https://doi.org/10.3390/w11010021, 2018. a
McNamara, I., Baez-Villanueva, O. M., Zomorodian, A., Ayyad, S., Zambrano-Bigiarini, M., Zaroug, M., Mersha, A., Nauditt, A., Mbuliro, M., Wamala, S., and Ribbe, L.: How well do gridded precipitation and actual evapotranspiration products represent the key water balance components in the Nile Basin?, J. Hydrol., 37, 100884, https://doi.org/10.1016/j.ejrh.2021.100884, 2021. a
Melsen, L. A., Addor, N., Mizukami, N., Newman, A. J., Torfs, P. J. J. F., Clark, M. P., Uijlenhoet, R., and Teuling, A. J.: Mapping (dis)agreement in hydrologic projections, Hydrol. Earth Syst. Sci., 22, 1775–1791, https://doi.org/10.5194/hess-22-1775-2018, 2018. a
Mengistu, D., Bewket, W., Dosio, A., and Panitz, H.-J.: Climate change impacts on water resources in the upper blue nile (Abay) river basin, ethiopia, J. Hydrol., 592, 125614, https://doi.org/10.1016/j.jhydrol.2020.125614, 2021. a
Meresa, H. and Gatachew, M.: Modeling of hydrological extremes under climate change scenarios in the Upper Blue Nile River Basin, Ethiopia, Journal of Civil & Environmental Engineering, 6, 252, https://doi.org/10.4172/2165-784X.1000252, 2015. a, b, c
Moriasi, D. N., Arnold, J. G., Van Liew, M. W., Bingner, R. L., Harmel, R. D., and Veith, T. L.: Model evaluation guidelines for systematic quantification of accuracy in watershed simulations, T. ASABE, 50, 885–900, https://doi.org/10.13031/2013.23153, 2007. a, b, c
NASA Earth Observatory: Record Flooding in Sudan, https://earthobservatory.nasa.gov/images/147288/record-flooding-in-sudan (last access: 22 July 2022), 2020. a
Nash, J. E. and Sutcliffe, J. V.: River flow forecasting through conceptual models part I – A discussion of principles, J. Hydrol., 10, 282–290, https://doi.org/10.1016/0022-1694(70)90255-6, 1970. a
Nigussie, G., Moges, M. A., Moges, M. M., and Steenhuis, T. S.: Assessment of suitable land for surface irrigation in ungauged catchments: Blue Nile basin, Ethiopia, Water, 11, 1465, https://doi.org/10.3390/w11071465, 2019. a, b
NOAA-CPC: The NOAA African Rainfall Climatology (ARC) Version 2 dataset (ARC2), NOAA-CPC [data set], http://ftp.cpc.ncep.noaa.gov/fews/fewsdata/africa/arc2/geotiff/ (last access: 8 November 2023), 2017. a
Nonki, R. M., Lenouo, A., Lennard, C. J., Tshimanga, R. M., and Tchawoua, C.: Comparison between dynamic and static sensitivity analysis approaches for impact assessment of different potential evapotranspiration methods on hydrological models’ performance, J. Hydrometeorol., 22, 2713–2730, https://doi.org/10.1175/JHM-D-20-0192.1, 2021. a
Novella, N. S. and Thiaw, W. M.: African rainfall climatology version 2 for famine early warning systems, J. Applied Meteorol. Clim., 52, 588–606, https://doi.org/10.1175/JAMC-D-11-0238.1, 2013. a
Owusu, C., Snigdha, N. J., Martin, M. T., and Kalyanapu, A. J.: PyGEE-SWToolbox: A Python Jupyter Notebook Toolbox for Interactive Surface Water Mapping and Analysis Using Google Earth Engine, Sustainability, 14, 2557, https://doi.org/10.3390/su14052557, 2022. a, b
Polanco, E. I., Fleifle, A., Ludwig, R., and Disse, M.: Improving SWAT model performance in the upper Blue Nile Basin using meteorological data integration and subcatchment discretization, Hydrol. Earth Syst. Sci., 21, 4907–4926, https://doi.org/10.5194/hess-21-4907-2017, 2017. a
QGIS, D. T.: QGIS Geographic Information System, Open Source Geospatial Foundation, http://qgis.osgeo.org/ (last access: 8 November 2023), 2009. a
Roth, V. and Lemann, T.: Comparing CFSR and conventional weather data for discharge and soil loss modelling with SWAT in small catchments in the Ethiopian Highlands, Hydrol. Earth Syst. Sci., 20, 921–934, https://doi.org/10.5194/hess-20-921-2016, 2016. a
Salama, A., ElGabry, M., El-Qady, G., and Moussa, H. H.: Evaluation of Grand Ethiopian Renaissance Dam Lake Using Remote Sensing Data and GIS, Water, 14, 3033, https://doi.org/10.3390/w14193033, 2022. a
Scaramuzza, P. and Barsi, J.: Landsat 7 scan line corrector-off gap-filled product development, in: Proceeding of Pecora, vol. 16, 23–27, https://scholar.google.com/scholar_lookup?title=Landsat 7 scan line corrector-off gap filled product development&publication_year=2005&author=J. Storey&author=P. Scaramuzza&author=G. Schmidt (last access: 8 November 2023), 2005. a
Schmidt, E. and Zemadim, B.: Expanding sustainable land management in Ethiopia: Scenarios for improved agricultural water management in the Blue Nile, Agr. Water Manage., 158, 166–178, https://doi.org/10.1016/j.agwat.2015.05.001, 2015. a
Seibert, J.: HBV light, User’s manual, Uppsala University, Institute of Earth Science, Department of Hydrology, Uppsala, https://scholar.google.com/scholar_lookup?title=HBV+light&author=Seibert,+J.&publication_year=1996 (last access: 8 November 2023), 1996. a
Seibert, J. and Vis, M. J. P.: Teaching hydrological modeling with a user-friendly catchment-runoff-model software package, Hydrol. Earth Syst. Sci., 16, 3315–3325, https://doi.org/10.5194/hess-16-3315-2012, 2012. a
Setegn, S. G., Srinivasan, R., Melesse, A. M., and Dargahi, B.: SWAT model application and prediction uncertainty analysis in the Lake Tana Basin, Ethiopia, Hydrol. Process., 24, 357–367, https://doi.org/10.1002/hyp.7457, 2010. a
Sinshaw, B. G., Moges, M. A., Tilahun, S. A., Dokou, Z., Moges, S., Anagnostou, E., Eshete, D. G., Kindie, A. T., Bekele, E., Asese, M., and Getie, W. A.: Integration of SWAT and Remote Sensing Techniques to Simulate Soil Moisture in Data Scarce Micro-watersheds: A Case of Awramba Micro-watershed in the Upper Blue Nile Basin, Ethiopia, in: Lecture Notes of the Institute for Computer Sciences, Social Informatics and Telecommunications Engineering, Springer International Publishing, 294–314, https://doi.org/10.1007/978-3-030-43690-2_20, 2020. a
Stakhiv, E. Z.: Pragmatic approaches for water management under climate change uncertainty 1, J. Am. Water Resour. As., 47, 1183–1196, https://doi.org/10.1111/j.1752-1688.2011.00589.x, 2011. a
Sterl, S., Fadly, D., Liersch, S., Koch, H., and Thiery, W.: Linking solar and wind power in eastern Africa with operation of the Grand Ethiopian Renaissance Dam, Nature Energy, 6, 407–418, https://doi.org/10.1038/s41560-021-00799-5, 2021. a
Sultana, R., Dhungana, S., and Bhatta, N.: Application of SWAT Model for Estimating Runoff in Upper Nile River Basin, European Journal of Engineering Science and Technology, 2, 20–35, https://doi.org/10.33422/EJEST.2019.09.35, 2019. a
Sutcliffe, J. V. and Parks, Y. P.: The hydrology of the Nile, IAHS Special Publication, 5, http://refhub.elsevier.com/S0048-9697(16)31936-2/rf0445 (last access: 8 November 2023), 1999. a
Tamalew, C. and Kemal, A.: Estimation of Discharge for Ungauged Catchments Using Rainfall-runoff Model in Didessa Sub-basin: the Case of Blue Nile River Basin, Ethiopia, Int. J. Innov. Eng. Res. Technol., 3, 1–11, 2016. a
Tegegne, G., Park, D. K., and Kim, Y.-O.: Comparison of hydrological models for the assessment of water resources in a data-scarce region, the Upper Blue Nile River Basin, J. Hydrol., 14, 49–66, https://doi.org/10.1016/j.ejrh.2017.10.002, 2017. a, b, c
Tekleab, S., Mohamed, Y., and Uhlenbrook, S.: Hydro-climatic trends in the Abay/upper Blue Nile basin, Ethiopia, Phys. Chem. Earth Pt. A/B/C, 61, 32–42, https://doi.org/10.1016/j.pce.2013.04.017, 2013. a
Tekleab, S., Uhlenbrook, S., Savenije, H. H., Mohamed, Y., and Wenninger, J.: Modelling rainfall–runoff processes of the Chemoga and Jedeb meso-scale catchments in the Abay/Upper Blue Nile basin, Ethiopia, Hydrolog. Sci. J., 60, 2029–2046, https://doi.org/10.1080/02626667.2015.1032292, 2015. a
Teklesadik, A. D., Alemayehu, T., Van Griensven, A., Kumar, R., Liersch, S., Eisner, S., Tecklenburg, J., Ewunte, S., and Wang, X.: Inter-model comparison of hydrological impacts of climate change on the Upper Blue Nile basin using ensemble of hydrological models and global climate models, Climatic Change, 141, 517–532, https://doi.org/10.1007/s10584-017-1913-4, 2017. a, b, c, d, e, f, g
Teshome, F., Moges, S. A., and Hailu, D.: Evaluation of globally available water resources reanalysis (WRR-1) runoff products for assessment and management water resources in the Upper Blue Nile basin: A data scarce major subbasins of the Nile basin, in: Extreme Hydrology and Climate Variability, Elsevier, 165–173, https://doi.org/10.1016/B978-0-12-815998-9.00014-2, 2019. a
The National Meteorological Agency: Meteorological Station Information, http://www.ethiomet.gov.et/ (last access: 8 November 2023), 2016. a
Thiemig, V., Rojas, R., Zambrano-Bigiarini, M., Levizzani, V., and De Roo, A.: Validation of satellite-based precipitation products over sparsely gauged African river basins, J. Hydrometeorol., 13, 1760–1783, https://doi.org/10.1175/JHM-D-12-032.1, 2012. a
Uhlenbrook, S., Mohamed, Y., and Gragne, A. S.: Analyzing catchment behavior through catchment modeling in the Gilgel Abay, Upper Blue Nile River Basin, Ethiopia, Hydrol. Earth Syst. Sci., 14, 2153–2165, https://doi.org/10.5194/hess-14-2153-2010, 2010. a, b, c, d
USGS – United States Geological Survey: Landsat Collection-1 Level-2, USGS [data set], https://earthexplorer.usgs.gov/ (last access: 4 July 2023), 2021. a, b
Vu, D. T., Dang, T. D., Galelli, S., and Hossain, F.: Satellite observations reveal 13 years of reservoir filling strategies, operating rules, and hydrological alterations in the Upper Mekong River basin, Hydrol. Earth Syst. Sci., 26, 2345–2364, https://doi.org/10.5194/hess-26-2345-2022, 2022. a, b, c, d, e, f, g, h, i, j
Wale, A., Rientjes, T., Dost, R., and Gieske, A.: Hydrological Balance of Lake Tana Upper Blue Nile Basin, Ethiopia, ITC The Netherlands, https://doi.org/10.1007/978-94-007-0689-7_3, 2008. a
Wamucii, C. N., van Oel, P. R., Ligtenberg, A., Gathenya, J. M., and Teuling, A. J.: Land use and climate change effects on water yield from East African forested water towers, Hydrol. Earth Syst. Sci., 25, 5641–5665, https://doi.org/10.5194/hess-25-5641-2021, 2021. a
Wang, C., Si, J., Li, Z., Zhao, C., Jia, B., Celestin, S., He, X., Zhou, D., Qin, J., and Zhu, X.: Evaluation of three gridded potential evapotranspiration datasets for streamflow simulation in three inland river basins in the arid Hexi Corridor, Northwest China, J. Hydrol., 44, 101234, https://doi.org/10.1016/j.ejrh.2022.101234, 2022. a
Wannasin, C., Brauer, C., Uijlenhoet, R., van Verseveld, W., and Weerts, A. H.: Daily flow simulation in Thailand Part I: Testing a distributed hydrological model with seamless parameter maps based on global data, J. Hydrol., 34, 100794, https://doi.org/10.1016/j.ejrh.2021.100794, 2021. a
Warner, J. and Zawahri, N.: Hegemony and asymmetry: Multiple-chessboard games on transboundary rivers, Int. Environ. Agreem.-P., 12, 215–229, https://doi.org/10.1007/s10784-012-9177-y, 2012. a
Wheeler, K. G., Basheer, M., Mekonnen, Z. T., Eltoum, S. O., Mersha, A., Abdo, G. M., Zagona, E. A., Hall, J. W., and Dadson, S. J.: Cooperative filling approaches for the grand Ethiopian renaissance dam, Water Int., 41, 611–634, https://doi.org/10.1080/02508060.2016.1177698, 2016. a, b, c
Wheeler, K. G., Hall, J. W., Abdo, G. M., Dadson, S. J., Kasprzyk, J. R., Smith, R., and Zagona, E. A.: Exploring cooperative transboundary river management strategies for the Eastern Nile Basin, Water Resour. Res., 54, 9224–9254, https://doi.org/10.1029/2017WR022149, 2018. a
Woldesenbet, T. A., Elagib, N. A., Ribbe, L., and Heinrich, J.: Hydrological responses to land use/cover changes in the source region of the Upper Blue Nile Basin, Ethiopia, Sci. Total Environ., 575, 724–741, https://doi.org/10.1016/j.scitotenv.2016.09.124, 2017. a
Woldesenbet, T. A., Elagib, N. A., Ribbe, L., and Heinrich, J.: Catchment response to climate and land use changes in the Upper Blue Nile sub-basins, Ethiopia, Sci. Total Environ., 644, 193–206, https://doi.org/10.1016/j.scitotenv.2018.06.198, 2018. a
World Population Review: Sudan Population 2022 (Demographics, Maps, Graphs), https://worldpopulationreview.com/countries/sudan-population (last access: 4 July 2022), 2022. a
Worqlul, A. W., Yen, H., Collick, A. S., Tilahun, S. A., Langan, S., and Steenhuis, T. S.: Evaluation of CFSR, TMPA 3B42 and ground-based rainfall data as input for hydrological models, in data-scarce regions: The upper Blue Nile Basin, Ethiopia, Catena, 152, 242–251, https://doi.org/10.1016/j.catena.2017.01.019, 2017. a, b
Wosenie, M. D.: Water balance modelling of the Lake Tana area, Ethiopia, PhD thesis, Ghent University, http://refhub.elsevier.com/S0378-3774(18)30072-6/sbref0385 (last access: 8 November 2023), 2015. a, b
Wubneh, M. A., Fikadie, F. T., Worku, T. A., Aman, T. F., and Kifelew, M. S.: Hydrological impacts of climate change in gauged sub-watersheds of Lake Tana sub-basin (Gilgel Abay, Gumara, Megech, and Ribb) watersheds, Upper Blue Nile Basin, Ethiopia, Sustainable Water Resources Management, 8, 1–14, https://doi.org/10.1007/s40899-022-00665-6, 2022a. a
Wubneh, M. A., Worku, T. A., Fikadie, F. T., Aman, T. F., and Kifelew, M. S.: Climate change impact on Lake Tana water storage, Upper Blue Nile Basin, Ethiopia, Geocarto International, 1–23, https://doi.org/10.1080/10106049.2022.2032397, 2022b. a
Yang, G. and Block, P.: Water sharing policies conditioned on hydrologic variability to inform reservoir operations, Hydrol. Earth Syst. Sci., 25, 3617–3634, https://doi.org/10.5194/hess-25-3617-2021, 2021. a
Ymeti, I.: Rainfall estimation by Remote Sensing for conceptual rainfall-runoff modeling in the Upper Blue Nile basin, ITC Enschede, the Netherlands, https://webapps.itc.utwente.nl/librarywww/papers_2007/msc/wrem/ymeti.pdf (last access: 8 November 2023), 2007. a, b
Zelelew, D. G. and Melesse, A. M.: Applicability of a spatially semi-distributed hydrological model for watershed scale runoff estimation in Northwest Ethiopia, Water, 10, 923, https://doi.org/10.3390/w10070923, 2018. a
Zhang, S., Gao, H., and Naz, B. S.: Monitoring reservoir storage in South Asia from multisatellite remote sensing, Water Resour. Res., 50, 8927–8943, https://doi.org/10.1002/2014WR015829, 2014. a
Ziese, M., Rauthe-Schöch, A., Becker, A., Finger, P., Rustemeier, E., and Schneider, U.: GPCC Full Data Daily Version 2020 at 1.0°: Daily land-surface precipitation from rain-gauges built on GTS-based and historic data, DWD [data set], https://doi.org/10.5676/DWD_GPCC/FD_D_V2020_100, 2020. a
Zimale, F. A., Mogus, M. A., Alemu, M. L., Ayana, E. K., Demissie, S. S., Tilahun, S. A., and Steenhuis, T. S.: Calculating the sediment budget of a tropical lake in the Blue Nile basin: Lake Tana, SOIL Discuss. [preprint], https://doi.org/10.5194/soil-2015-84, 2016. a
- Abstract
- Introduction
- Study area and data
- Methodology
- Results
- Discussion
- Conclusions
- Appendix A: Satellite-based reservoir information
- Appendix B: Additional data on performance metrics
- Appendix C: Hydrological models applied in the Upper Blue Nile basin
- Appendix D: HBV-light simulations
- Data availability
- Author contributions
- Competing interests
- Disclaimer
- Special issue statement
- Acknowledgements
- Financial support
- Review statement
- References