the Creative Commons Attribution 4.0 License.
the Creative Commons Attribution 4.0 License.
 | 16 Mar 2023
Projected changes in droughts and extreme droughts in Great Britain strongly influenced by the choice of drought index
Timothy J. Osborn
Nans Addor
Geoff Darch
Droughts cause enormous ecological, economical and societal damage, and they are already undergoing changes due to anthropogenic climate change. The issue of defining and quantifying droughts has long been a substantial source of uncertainty in understanding observed and projected trends. Atmosphere-based drought indicators, such as the Standardised Precipitation Index (SPI) and the Standardised Precipitation Evapotranspiration Index (SPEI), are often used to quantify drought characteristics and their changes, sometimes as the sole metric representing drought. This study presents a detailed systematic analysis of SPI- and SPEI-based drought projections and their differences for Great Britain (GB), derived from the most recent set of regional climate projections for the United Kingdom (UK). We show that the choice of drought indicator has a decisive influence on the resulting projected changes in drought frequency, extent, duration and seasonality using scenarios that are 2 and 4 ∘C above pre-industrial levels. The projected increases in drought frequency and extent are far greater based on the SPEI than based on the SPI. Importantly, compared with droughts of all intensities, isolated extreme droughts are projected to increase far more with respect to frequency and extent and are also expected to show more pronounced changes in the distribution of their event durations. Further, projected intensification of the seasonal cycle is reflected in an increasing occurrence of years with (extremely) dry summers combined with wetter-than-average winters. Increasing summer droughts also form the main contribution to increases in annual droughts, especially using the SPEI. These results show that the choice of atmospheric drought index strongly influences the drought characteristics inferred from climate change projections, with a comparable impact to the uncertainty from the climate model parameters or the warming level; therefore, potential users of these indices should carefully consider the importance of potential evapotranspiration in their intended context. The stark differences between SPI- and SPEI-based projections highlight the need to better understand the interplay between increasing atmospheric evaporative demand, moisture availability and drought impacts under a changing climate. The region-dependent projected changes in drought characteristics by two warming levels have important implications for adaptation efforts in GB, and they further stress the need for rapid mitigation.
- Article
(8644 KB) - Full-text XML
-
Supplement
(4557 KB) - BibTeX
- EndNote


Anthropogenic climate change is already affecting the frequency and intensity of droughts on all continents, due to both increases in atmospheric evaporative demand and, in some regions, precipitation (Seneviratne et al., 2021). How much larger these changes become depends on current and future emissions, and understanding the impact of climate change on droughts is of crucial importance given the serious ecological and socio-economic damage these events can inflict. However, quantitatively assessing changes in droughts is complicated by the difficulty involved with defining and quantifying droughts (Yevjevich, 1967). Distilled to its most simple form, a drought can be defined as a water deficit relative to normal conditions (Sheffield et al., 2012). As this generalised definition is not very helpful for assessing drought hazards (Lloyd-Hughes, 2014), different types of drought are typically recognised based on the context and the moisture quantity in which the deficit takes place (Wilhite and Glantz, 1985). A meteorological drought, indicating a period of below-normal precipitation, can develop into a soil moisture drought (also called agricultural drought due to its relevance for crop growth). These conditions can develop into low flows in rivers or low water levels in lakes, called hydrological drought (of which groundwater drought can be considered a subtype).
Drought indices, a large number of which can be found in literature (e.g. Keyantash and Dracup, 2002), are frequently used to quantify different types of drought conditions. While indicators exist for variables relevant to different drought types, drought indices that only rely on atmospheric data are a popular choice due to (historical) data availability and the indices' ease of use (they do not require the deployment of an impact model, such as a hydrological model). The Drought Severity Index (DSI; Phillips and McGregor, 1998), for example, only uses precipitation, and it has been used in previous studies on the impact of climate change on drought in the United Kingdom (UK) (e.g. Blenkinsop and Fowler, 2007; Rahiz and New, 2013; Hanlon et al., 2021). One of the most widely used drought indicators is the Standardised Precipitation Index (SPI; McKee et al., 1993), a precipitation-based index recommended by the World Meteorological Organisation (World Meteorological Organization and Global Water Partnership, 2016). It is one of the indicators shown on the UK Water Resources Portal (https://eip.ceh.ac.uk/hydrology/water-resources, last access: 30 January 2023) and has been used in earlier work on drought under climate change in the UK (e.g. Vidal and Wade, 2009; Arnell and Freeman, 2021). Since the introduction of the SPI, other standardised indicators have been developed that apply the standardisation principle of the SPI to different (combinations of) drought-relevant variables. This includes the Standardised Precipitation Evapotranspiration Index (SPEI; Vicente-Serrano et al., 2009), which gives the anomaly as a simple climatic water balance, computed as the difference between precipitation and potential evapotranspiration (PET). This indicator was developed to be sensitive to the effect of global-warming-induced increases in atmospheric evaporative demand (AED), which represents the potential of the atmosphere to evaporate water (depending on radiation, temperature, humidity and wind speed; Robinson et al., 2017). A high AED can aggravate the effects of sustained precipitation deficits and accelerate drought development (e.g. Manning et al., 2018; Bloomfield et al., 2019; Pendergrass et al., 2020). Thus, contrary to the SPI, the SPEI is not purely an indicator of meteorological drought; instead, it is an atmosphere-based index that is “mostly related to the actual water balance in humid regions”, reflects “an upper bound for overall water-balance deficits” during dry periods and in water-limited regions, and is also linked to vegetation stress (Seneviratne et al., 2021). These atmosphere-based indicators are widely used in climate change impact studies, although the consequences of their implicit assumptions with regards to evaporative stress are not always expressly considered. Along similar lines, a study by Satoh et al. (2021) found that, if it is considered as such, drought type constitutes a major source of uncertainty for projections of future droughts in many parts of the world.
This study focuses on Great Britain (GB) and aims to compare projected drought changes quantified using the SPI and SPEI. Despite not typically being thought of as a particularly drought-prone area, GB has experienced several droughts in the past which have led to widespread ramifications, including impacts on ecosystems (such as algal blooms and fish kills), agriculture and domestic water supply (Rodda and March, 2011; Kendon et al., 2013; Turner et al., 2018). The impacts of climate change on future droughts in the UK are, therefore, a key concern for stakeholders, including water managers and farmers (e.g. Watts et al., 2015). In this study, we aim to answer the following questions:
-
With respect to atmosphere-based standardised drought indices, how are drought and extreme drought frequency, duration, extent and seasonal timing expected to change under different global warming levels?
-
What is the potential contribution of changes in PET and precipitation to the changes in these drought characteristics?
-
How sensitive are the quantified projected changes in drought characteristics to the choice of atmosphere-based drought indicator, and how does this compare to other sources of uncertainty?
To this end, we identify and characterise droughts and their projected changes in the most recent ensemble of regional climate projections for GB, using both the SPI and SPEI (hereafter referred to as SIs – standardised indicators). We compare projected drought characteristics for both indices in order to identify the potential role of changing PET. Although previous studies have compared historical and projected changes using these SIs in different regions of the world (e.g. Stagge et al., 2017; Chiang et al., 2021), this study adds a new level of detail via an in-depth analysis of different drought characteristics and attention to within-GB regional differences; moreover, to our knowledge, it is the first work to use UKCP18 climate projections with these SIs to assess projected changes in drought characteristics for GB. This aids in further understanding the potential future changes in the nature of GB droughts due to on global warming and demonstrating the importance of the drought index choice for climate change impact studies and stakeholder usage.
2.1 Observations
Datasets of PET and precipitation observations were needed for evaluation, bias correction of the UKCP18 regional climate model (RCM), calibration of the SIs and calculation of historical SIs. The CHESS-PE (Robinson et al., 2020) and HadUK-Grid (Hollis et al., 2019) datasets were employed for PET and precipitation respectively, using the following time periods: 1961–2010 for SI calibration (see Sect. 3.4), 1981–2010 for bias correction and 1981–2005 (referred to as '81–'05 in Figs. 4–9) for comparison to the reference period UKCP18 data in this study. Both datasets were first regridded from their native 1 km resolution to the 12 km resolution grid of the UKCP18 RCM by averaging the 1 km grid cells falling in each 12 km cell. A land fraction was obtained based on the proportion of 1 km grid cells with observations on land within each 12 km grid cell, and it was used to exclude grid cells with a land fraction lower than 50 % from the analysis. As no observation-based PET information was available for Northern Ireland in CHESS-PE, this region was excluded from our study. The method used to obtain PET in the production of CHESS-PE is an implementation of the Penman–Monteith PET for a reference grass crop (Allen et al., 1998), in which the calculation of the vapour pressure deficit from temperature is based on Richards (1971) (Robinson et al., 2017).
2.2 The UKCP18 regional climate projections
UKCP18 is the most recent set of national climate projections for the UK and was produced by the Met Office Hadley Centre (Murphy et al., 2018). This study makes use of its third strand, produced with the aim of providing a range of storylines to support adaptation efforts in the UK: a perturbed physics ensemble (PPE) of regional climate projections (UKCP18 RCM; Met Office Hadley Centre, 2018), available from the Centre for Environmental Data Analysis. This ensemble of 12 simulations was constructed by dynamically downscaling global HadGEM3-GC3.05 simulations via one-way nesting with the same model at a finer resolution. At both resolutions, the values of 47 parameters spread over model representations of convection, gravity wave drag, boundary layer, cloud, large-scale precipitation, aerosols and land surface interactions were perturbed in HadGEM3-GC3.05 (Murphy et al., 2018). Thus, the ensemble does not sample global climate model–regional climate model (GCM–RCM) structural uncertainty, only parameter uncertainty, and was designed to cover a range of possible futures. While multiple GCM–RCM structures would add another interesting dimension to the study, expanding the ensemble was outside the scope and capacity of the study. The horizontal resolution of the RCM simulations is 12 km over GB (available on the OSGB36 grid projection). As droughts tend to be more spread out in space and time, we judged that the 12 km daily resolution of the UKCP18 RCM provided a better trade-off between practicality and spatio-temporal detail in this work than the higher-resolution convection-permitting simulations. Simulations of different variables are available from 1 December 1980 to 30 November 2080 at a daily time step (for practical reasons, December 1980 was left out of our analysis).
3.1 Calculation of potential evapotranspiration
While the AED increases with rising temperatures, changes in humidity, net radiation and wind speed can also play a significant role. Therefore, we represented the AED using the PET calculated with the Penman–Monteith method, which includes the effect of all of these variables. This method leads to a more robust correlation between the resulting SPEI and soil moisture under a warming climate compared with using the temperature-only Thornthwaite method (Feng et al., 2017), and it is recommended over simpler temperature-based methods (e.g. Dewes et al., 2017); however, it is still subject to significant limitations (Milly and Dunne, 2016; Greve et al., 2019). The calculation of PET for the UKCP18 RCM follows the same variant of the Penman–Monteith method used by Robinson et al. (2017) in order to ensure consistency with CHESS-PE. It utilises the following variables simulated by the UKCP18 RCM ensemble: specific humidity, pressure at sea level, net downwelling long-wave radiation, net downwelling short-wave radiation, wind speed at 10 m and daily average surface air temperature. PET was set to zero if a calculated value was negative (which occurred for less than 1 % of the values overall and, when split by ensemble member and month, also for less than 1 % of all cases – except for December in ensemble member 1 which had 1.2 % negative values).
3.1.1 Detrending temperature
To investigate the influence of the projected temperature trend on changes in SPEI-based droughts and the deviation of the SPEI from the SPI, we also computed an alternate version of the SPEI projections (SPEIdtr-tas) using a detrended version of UKCP18 RCM temperature. For this, a linear trend was fitted to, and subsequently subtracted from, the simulated temperature time series for each grid cell and month separately. This detrended temperature dataset was used to compute PET as described above, resulting in a PETdtr-tas variable in which any trend left is due to trends in other variables (specific humidity, radiation, wind speed and pressure) or in interactions between variables. As these variables are closely intertwined in the climate models, this unavoidably introduces a physical discrepancy between temperature and the other variables used in the PET calculation. This is taken into account in the interpretation.
3.2 Bias adjustment
As comparison to observations revealed significant bias in the simulation of both precipitation and PET (see Figs. S1 and S2), these variables were statistically post-processed using the ISIMIP3b change-preserving bias adjustment method (Lange, 2019), version 2.4.1 (Lange, 2020). The biases that we observed for different quantiles were not equal to the biases observed in the mean, which is why we selected a bias adjustment method that took this into account. Similarly, biases also varied between months and locations, so the bias adjustment needed to be specific for each month and grid cell. The ISIMIP3b bias adjustment method is based on quantile mapping but also preserves projected changes in the variables being corrected and enables separate adjustment of the frequency of dry days – a desirable feature for drought research. For precipitation, the gamma distribution and mixed additive–multiplicative per-quantile change preservation were used. For PET and PETdtr-tas, the Weibull distribution, detrending and mixed additive–multiplicative per-quantile change preservation were used. A dry threshold of 0.1 mm d−1 was selected below which there is considered to be no precipitation or PET. In what follows, the UKCP18 RCM indicates the bias-adjusted data.
3.3 Time slice selection
The UKCP18 RCM simulations used in this study are available for the Representative Concentration Pathway (RCP) 8.5 (RCP8.5) emissions scenario, and the models used have high global climate sensitivity compared with the Coupled Model Intercomparison Project – Phase 5 (CMIP5) ensemble and the probabilistic projections (Murphy et al., 2018). Therefore, to assess the impact of climate change on drought characteristics in scenarios with lower climate sensitivity and more mitigation (resulting in lower warming levels above pre-industrial times), a time slice approach was implemented to investigate changes at two specific global mean warming levels. A common fixed reference period (1981–2005) was used for all ensemble members for comparison with these future time slices and observations. For each ensemble member, a time slice was selected from 12 years before to 12 years after the year in which the centred 25-year rolling mean global temperature exceeds +2 and +4 ∘C above pre-industrial levels (defined as 1850–1900) in the driving global model (see Table 2 in Gohar et al., 2018). As opposed to the fixed reference period, the time periods used to represent different levels of warming are, thus, different for each ensemble member, depending on when their global driving models reach +2 and +4 ∘C above pre-industrial levels. Both warming levels are reached in all 12 ensemble members; however the time slice representing +4 ∘C is cut short by 2 years for ensemble member 8 by the end of the simulated period.
This approach would result in an accurate assessment of changes in GB drought projected at these warming levels if these changes would scale directly with global temperature increase (independent of the speed of change) and if the regional model had the same climate sensitivity as its driving global model. Neither of these requirements are likely to be fully met. UKCP18 RCM projects slightly weaker UK temperature responses towards the end of the simulated period than the driving global simulations (Fig. 5.2 in Murphy et al., 2018). Further, mid-latitude atmospheric circulation patterns in the selected time slices (which influence UK weather and, therefore, drought events) may respond to a higher level of radiative forcing than the global temperature increase levels used to select them (Ceppi et al., 2018). Nevertheless, the applied time slice approach is a reasonable approximation and is frequently used for investigating impacts at different levels of global warming.
3.4 Drought and aridity indicators
While drought refers to a period of below-normal water availability for a given context, aridity refers to the climatic average moisture availability (Dai, 2011). This is included in this study in order to help establish an understanding of the mean climatic changes projected for precipitation and PET in UKCP18 RCM before we proceed to assessing projected changes in drought characteristics. To this end, the aridity index (AI) was calculated as the annual average ratio of precipitation to PET (e.g. UNEP, 1992; Feng and Fu, 2013; Greve et al., 2019), which is more intuitive to interpret than the SIs. For time slices of 25 years, this gives the following:
The drought indices compared in this study are the SPI and SPEI. Both are widely used in the literature to quantify droughts, and they imply contrasting assumptions of the surface water balance: for the SPI, no evaporation takes place, whereas for the SPEI, evaporation takes place and is not limited by moisture availability. Multi-scalar standardised climate indicators such as those mentioned above allow for comparison of unusually dry (or wet) periods across locations with different climates. The SIs are calculated as follows. First, the time series of a variable D (precipitation for the SPI and precipitation minus PET for the SPEI) is aggregated using a specified accumulation period length of n months, such that the value for each month in the resulting time series is the average of that month and the n preceding months. Then, for each month and location, a suitable distribution FD for that variable is fit to the aggregated time series. The SI value for an accumulation period length n at a time step t is then defined as follows:
with Dn,t indicating D accumulated over the n time steps preceding t (inclusive) and ϕ indicating the standard normal distribution. Monthly values of the SPI and SPEI are calculated using an n value of 3 to 24 months. Following the recommendations provided by Stagge et al. (2015b), a two-parameter gamma distribution was used for calculating the SPI and a generalised extreme value (GEV) distribution was used for calculating the SPEI. For shorter SPI accumulation periods (1–3 months) and further into the future in the UKCP18 RCM simulations (with drying summers), there may be occurrences of zero accumulated precipitation for grid cells in drier regions. To take this possibility into account, the SPI values corresponding to the probability of zero accumulated precipitation were calculated separately following the method proposed by Stagge et al. (2015b), which avoids the mean SPI becoming larger than zero. A 50-year period (1961–2010) of observation-based data (regridded HadUK-Grid and CHESS-PE) was used to fit the distributions for the SPI and SPEI calculation. This observation-based calibration was also applied to the UKCP18 RCM data to allow a direct comparison of the results between climate model ensemble members and observations. This is appropriate because the bias adjustment brings the distributions of the reference period climate model data close to the observed distributions.
3.5 Drought characteristics
In order to compare changes in overall drought conditions with changes in more extremely dry conditions, we consider a category of “all/total drought” covering all SI values of −1 and lower, and a category of “extreme” drought covering SI values of −2 and lower. These threshold values are a subset of the classification originally introduced by McKee et al. (1993), which has been extensively used in studies using standardised drought indicators. As in Stagge et al. (2015b), SI values were capped at −3 to limit the uncertainty induced by extrapolating into the very extreme tails of a distribution fitted to the relatively short time series available (see Sect. 3.4).
Given the importance of both space (e.g. extent, spatial connectivity and local vulnerability) and time (e.g. seasonal timing and duration) for drought impacts, the spatio-temporal characterisation of droughts is an important element of any drought study. It is approached here in three ways. First, for each ensemble member and the observations, the frequency (fraction of the time in drought) of dry and extremely dry conditions was computed for each individual grid cell of GB separately. Second, the drought area extent was quantified as the fraction of the total GB area simultaneously in (extreme) drought. We then computed the frequency with which different drought extents were exceeded (fraction of time). Third, regionally averaged SI values were used to investigate drought seasonality and duration. To compute these regional averages, we used the UKCP18 administrative regions (ukcp18 data, 2021) shown in Fig. 1, as they represented a decent trade-off between the size of the regions; the number of regions available for comparison; and relevant differences in climatology, projected changes and societal relevance. To investigate the seasonal contributions to longer-term deficits (seasonality), we compared the 6-month aggregated regionally averaged SI (SI6) for March and September for each year to represent the winter and summer contributions to that year's overall dryness (SI12). Durations of individual drought events are defined as periods of continuously negative regionally averaged SI values reaching a threshold value of −1 or lower, following the “theory of runs” (Yevjevich, 1967). Each event is then assigned to the time slice (reference period, +2 or +4 ∘C) that contains its central time step, and the number of occurrences of droughts with different duration categories is assessed. Extreme droughts are identified as events that have a peak (i.e. minimum) SI value below −2. To assess changes in drought duration and the occurrence of multi-year droughts, an SI computed with an aggregation period of 6 months was used. This sub-yearly aggregation period is frequently used and linked to impacts (e.g. Stagge et al., 2017; Parsons et al., 2019), and it ensures any resulting drought durations of a year or longer were sustained throughout all seasons. For seasonality, duration, and the seasonal cycles of precipitation and PET, four regions are shown in the main text to represent the main results found across all regions; results for the other regions are included in the Supplement.
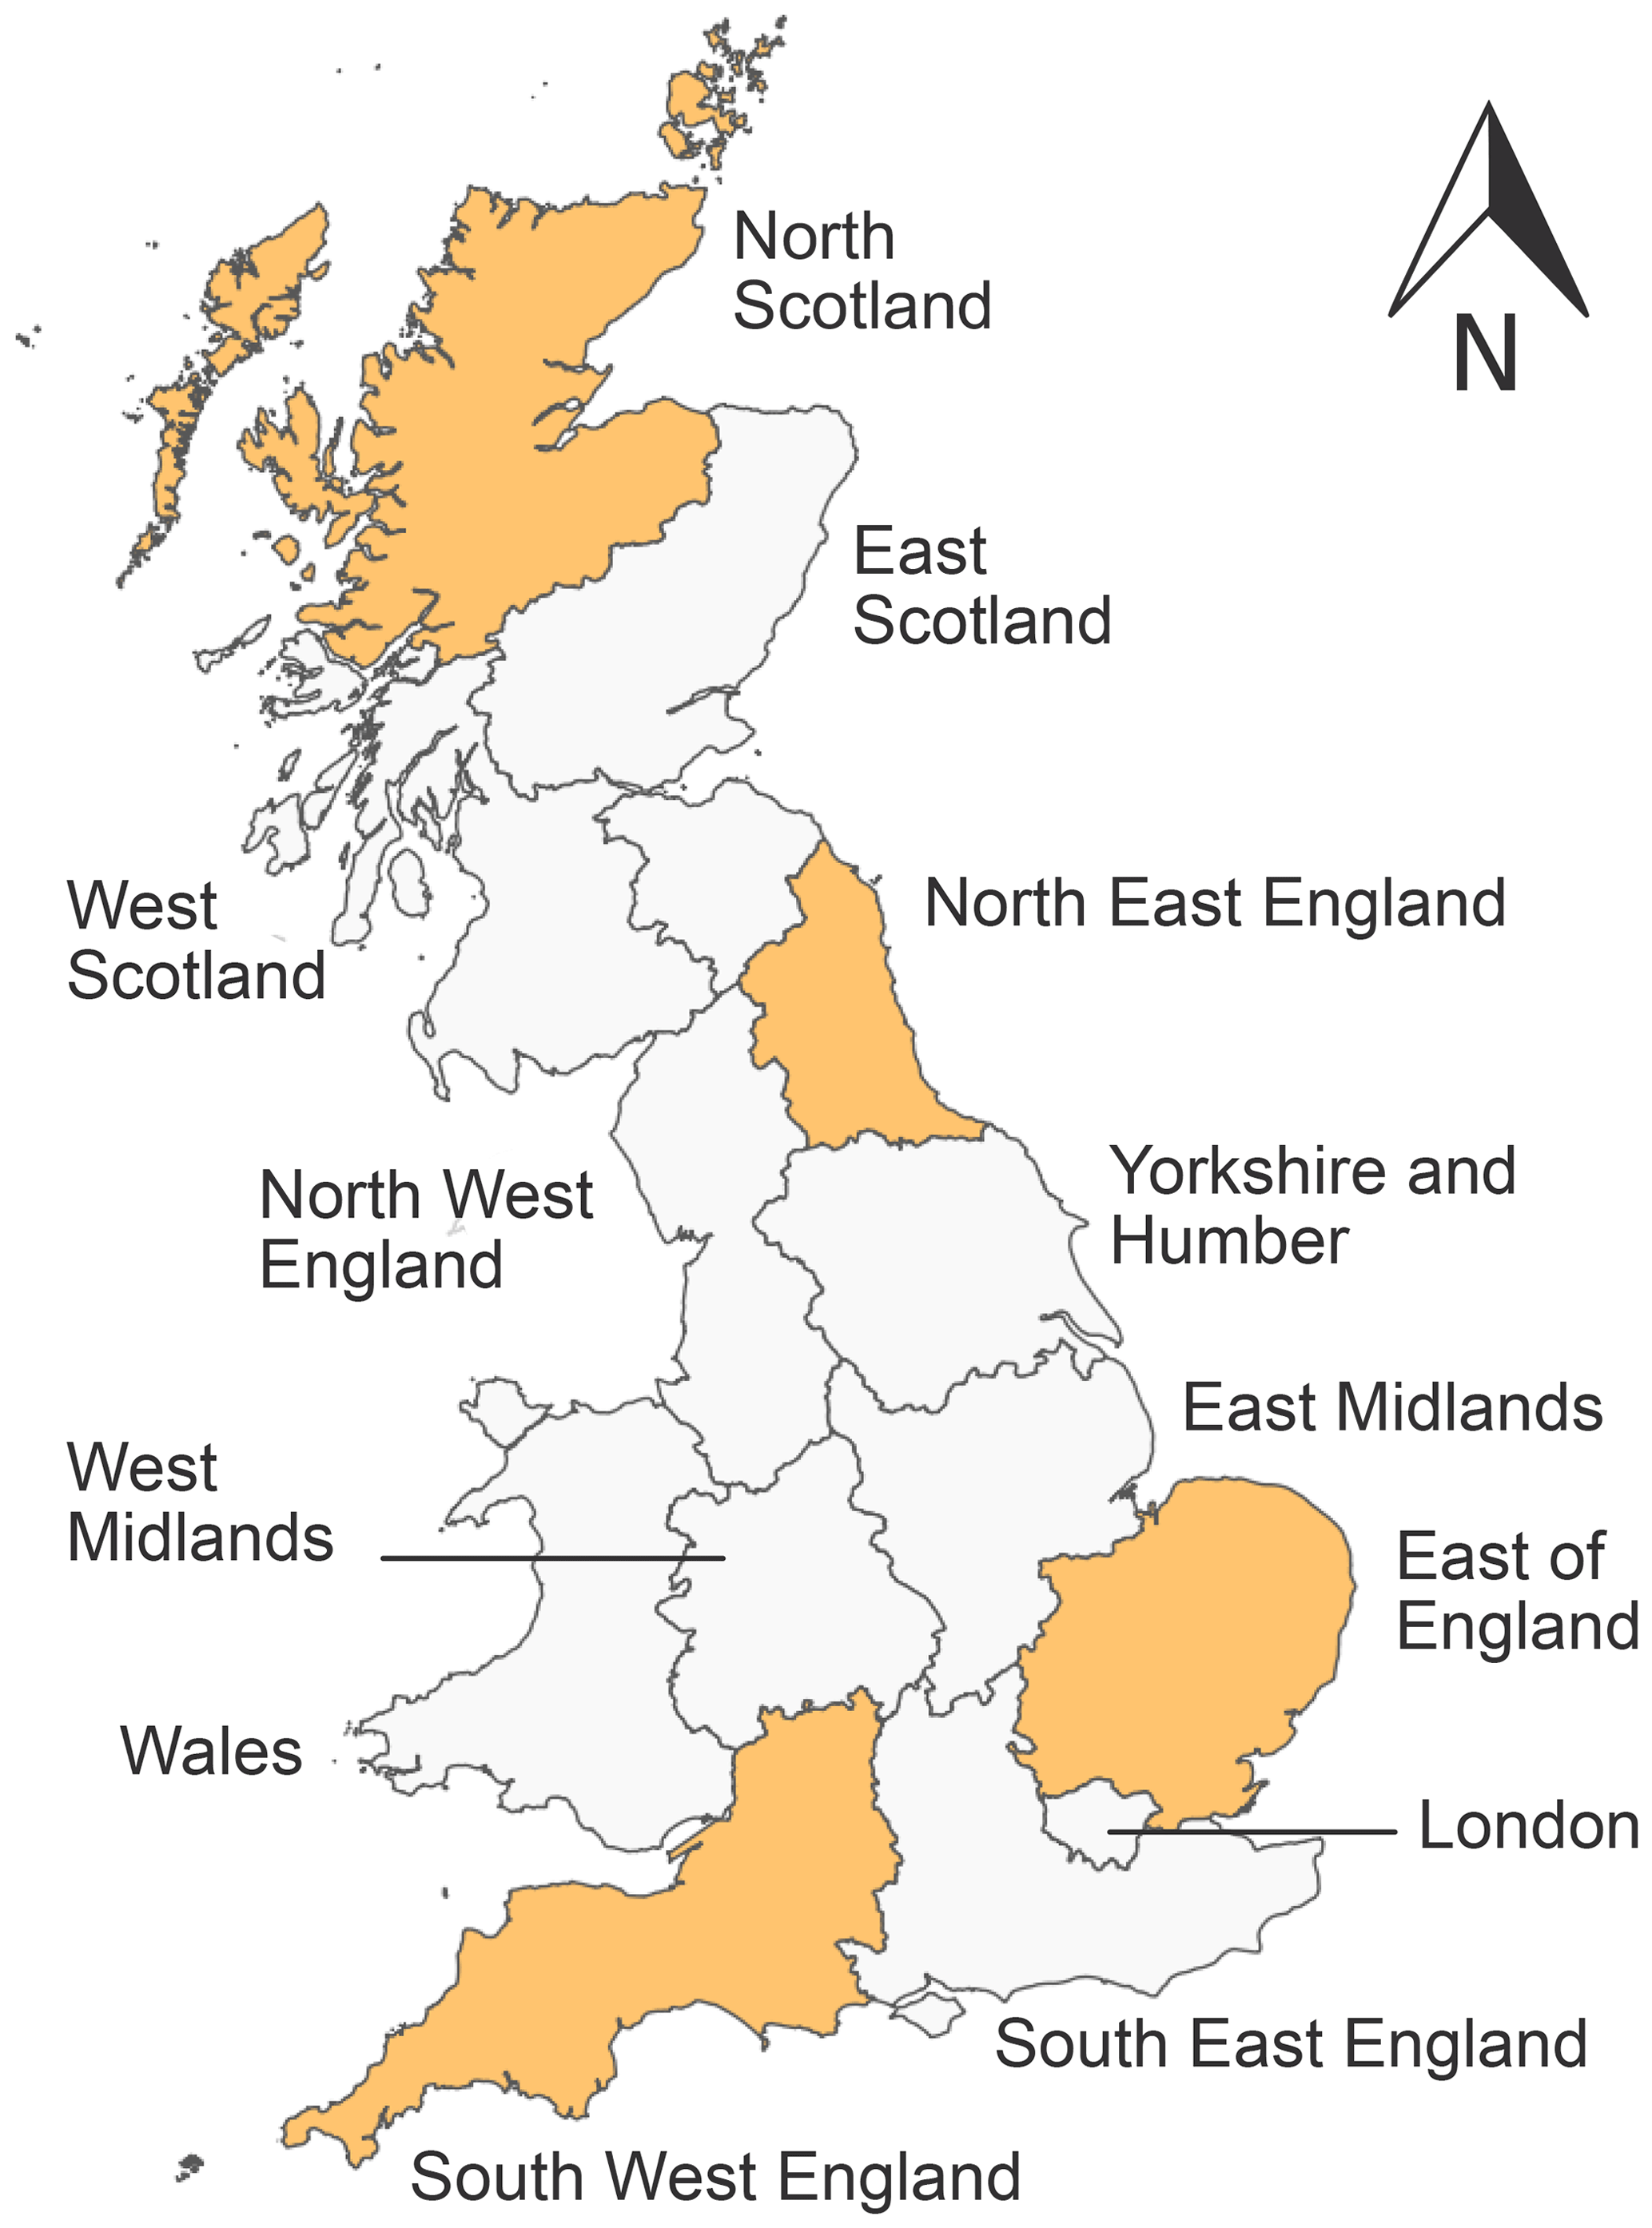
Figure 1Map of administrative UKCP18 regions used for regional drought characterisation. Regions for which results are shown in the main text are highlighted in yellow.
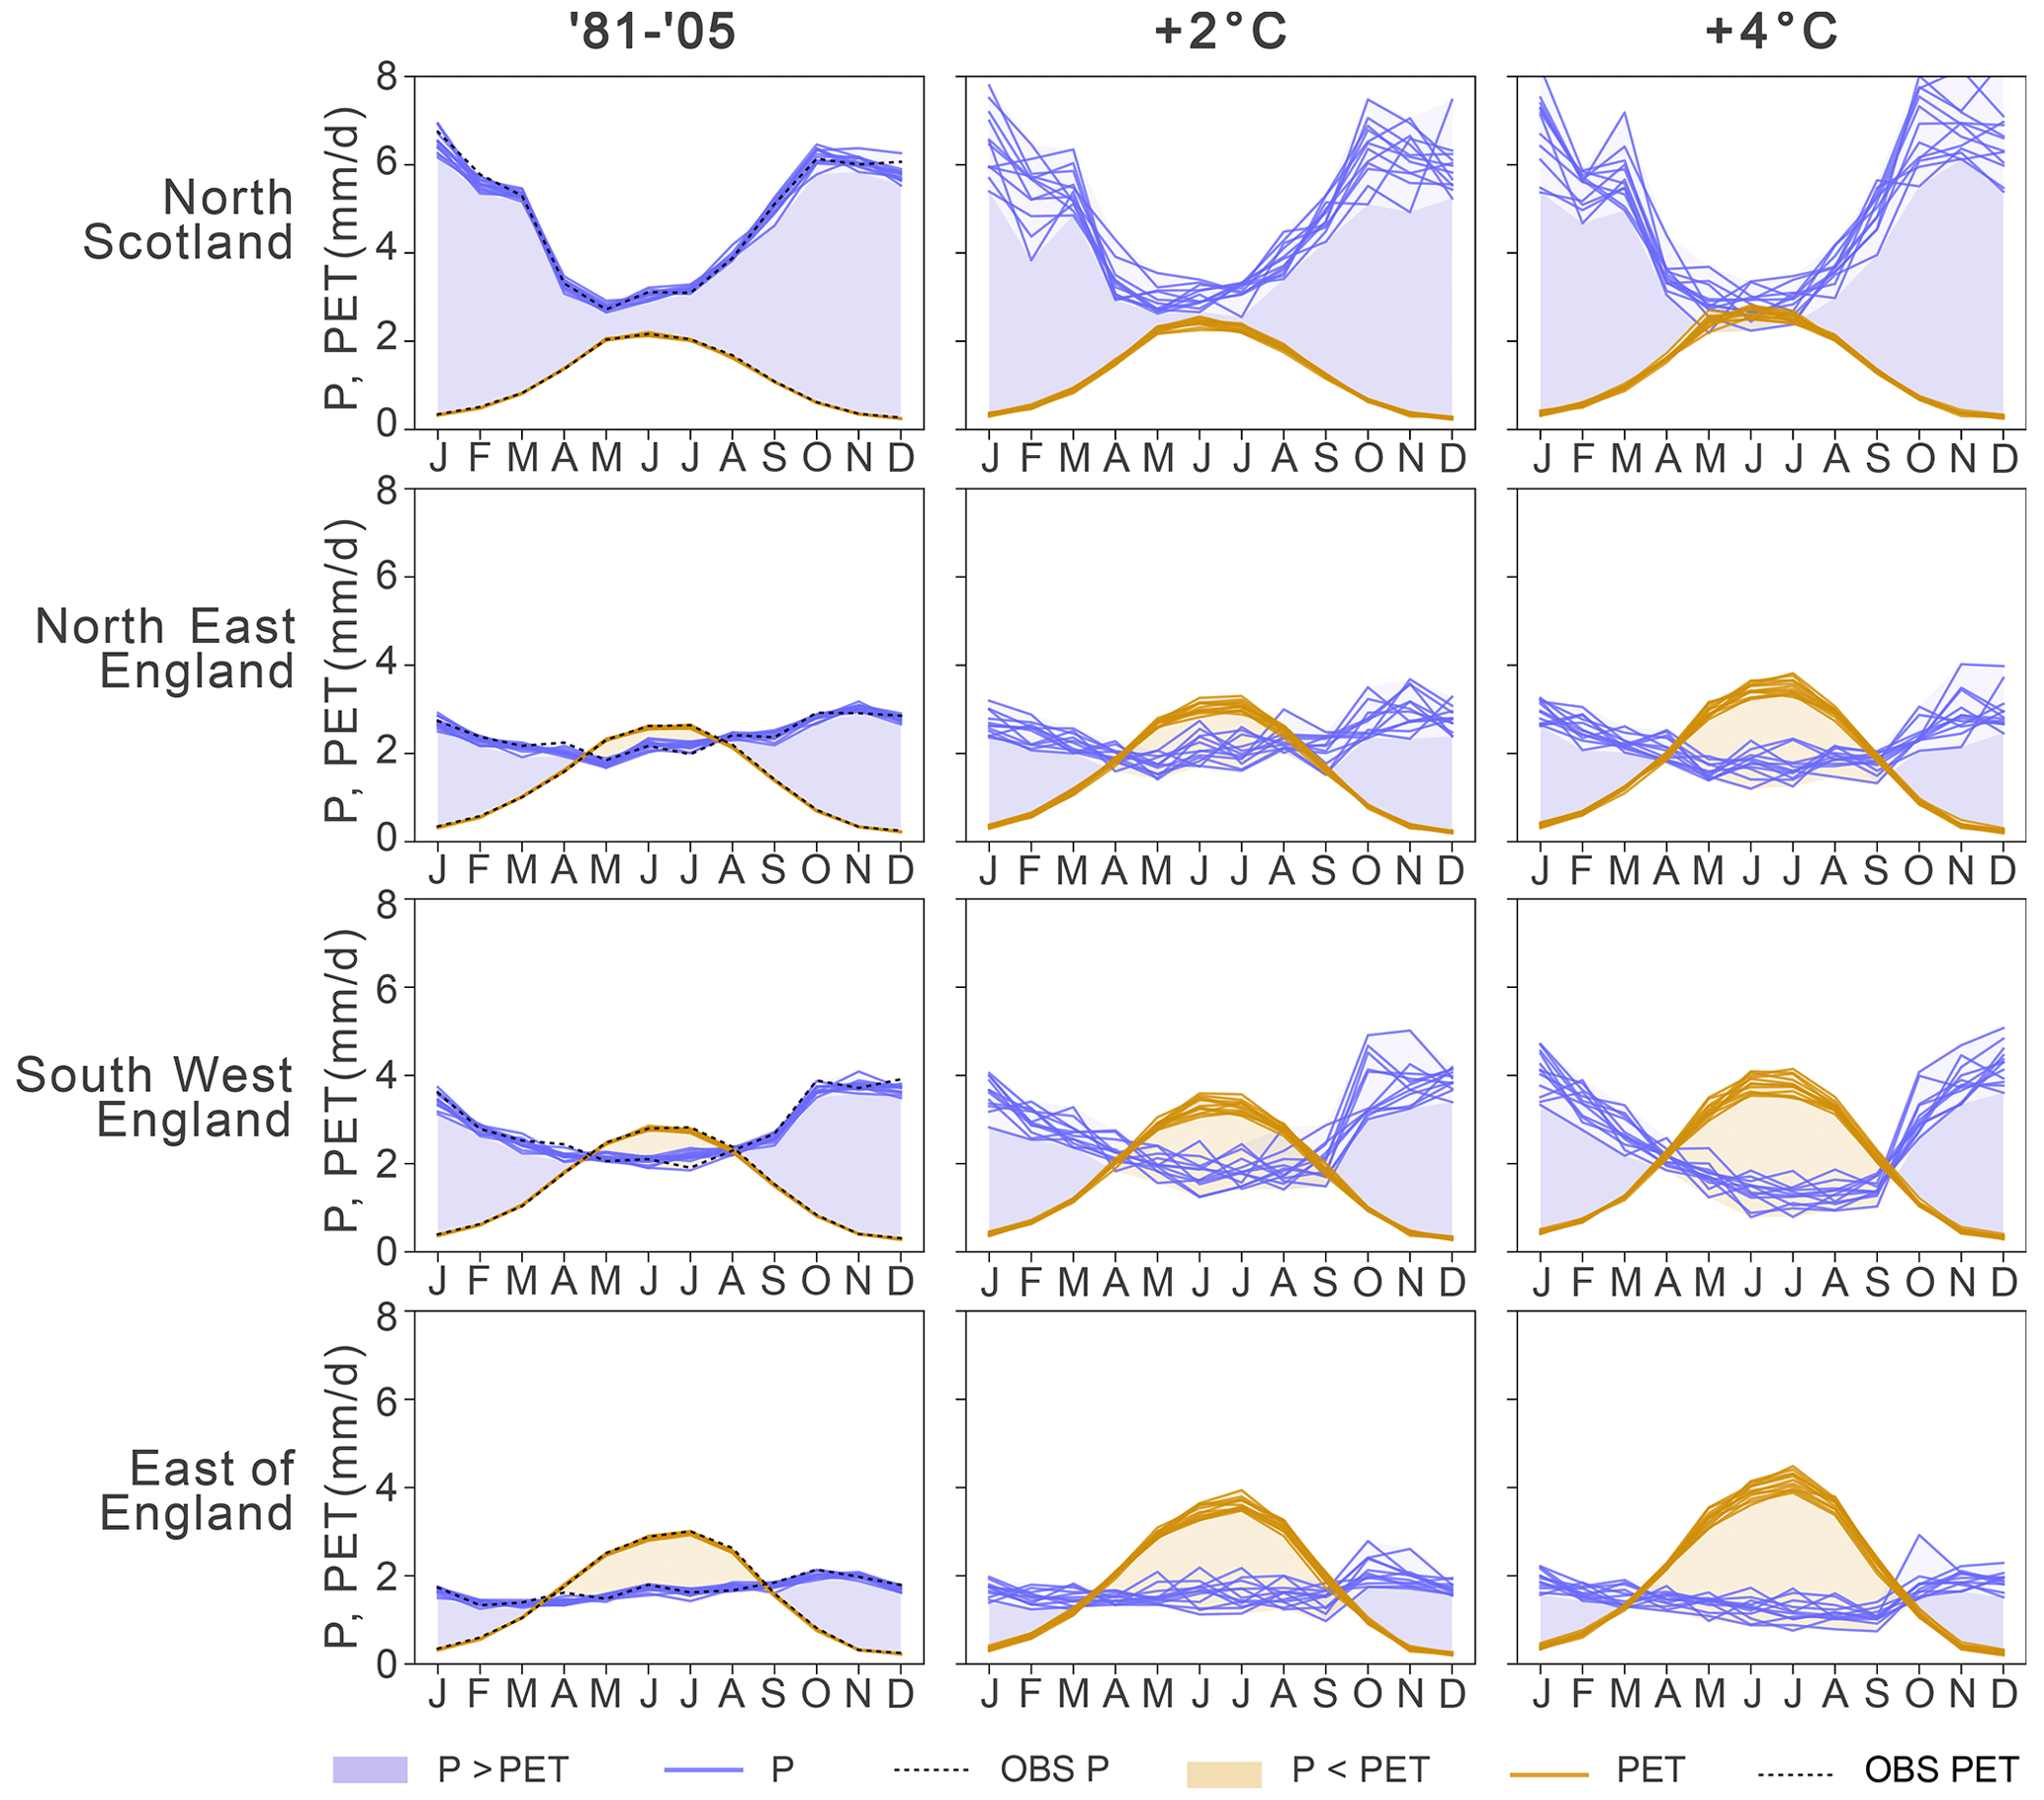
Figure 2Seasonal cycle of precipitation (P; blue lines) and potential evapotranspiration (PET; orange lines) in four selected regions with respect to the 12 bias-adjusted UKCP18 RCM ensemble members. The different lines represent different ensemble members, and the observations are plotted in the first column using darker dashed lines. The reader is referred to Fig. S3 for the seasonal cycles for all 13 regions.
Regionally averaged seasonal cycles of precipitation (blue) and PET (yellow) are shown in Fig. 2 for North Scotland, North East England, South West England and East of England; Fig. S3 presents the seasonal cycles for all regions. The four regions shown in Fig. 2 were selected to represent the spread of climatic regions and projected changes in climate and drought indicators of all 12 regions, and they will be used throughout this paper to discuss the spatial variability in projected changes. The observations plotted in the reference period column show a very close match with the UKCP18 RCM ensemble, which is the result of successful bias adjustment for each season. In all regions, existing seasonal patterns become more pronounced under a warming climate, and there is also a shift in rainfall seasonality delaying the driest months in most regions (clearly visible in South West England). In summer, especially in the south and in the east, increasing PET and decreasing precipitation lead to an increasing gap between the two as well as to an increasing period in which atmospheric demand for moisture exceeds supply (light yellow area). In some areas (e.g. North Scotland), the reference period precipitation exceeds PET year-round (light blue area), but a warming climate causes this gap to diminish or even disappear in late spring to summer. The ensemble spread in the simulated changes in precipitation, which is driven more by dynamical processes, is greater than that of PET. However, the ensemble broadly agrees with respect to the pattern of projected changes.
Considering the annual average ratio of precipitation and PET, parts of GB are projected to become more arid in most ensemble members (Fig. 3). This is mostly the case in the south-east and east of GB and in the English Midlands: the AI is already closer to 1 (annual PET roughly equal to annual precipitation) in the reference period, and PET starts to exceed precipitation on an annual basis under a +2 ∘C warming scenario. While the ensemble agrees very well with respect to the spatial patterns of aridity changes, there is significant ensemble spread in the magnitude of change. In the +4 ∘C scenario, widespread AI decreases in the south-east and east of GB and in the English Midlands are projected by all ensemble members, but only three ensemble members simulate small isolated areas in the south-east crossing the threshold from a humid to a dry sub-humid climate (aridity index <0.65). The strong similarity of the reference period simulations to the observations (top row maps in Fig. 3) shows successful bias adjustment of daily precipitation and PET in the ratio of annual averages.
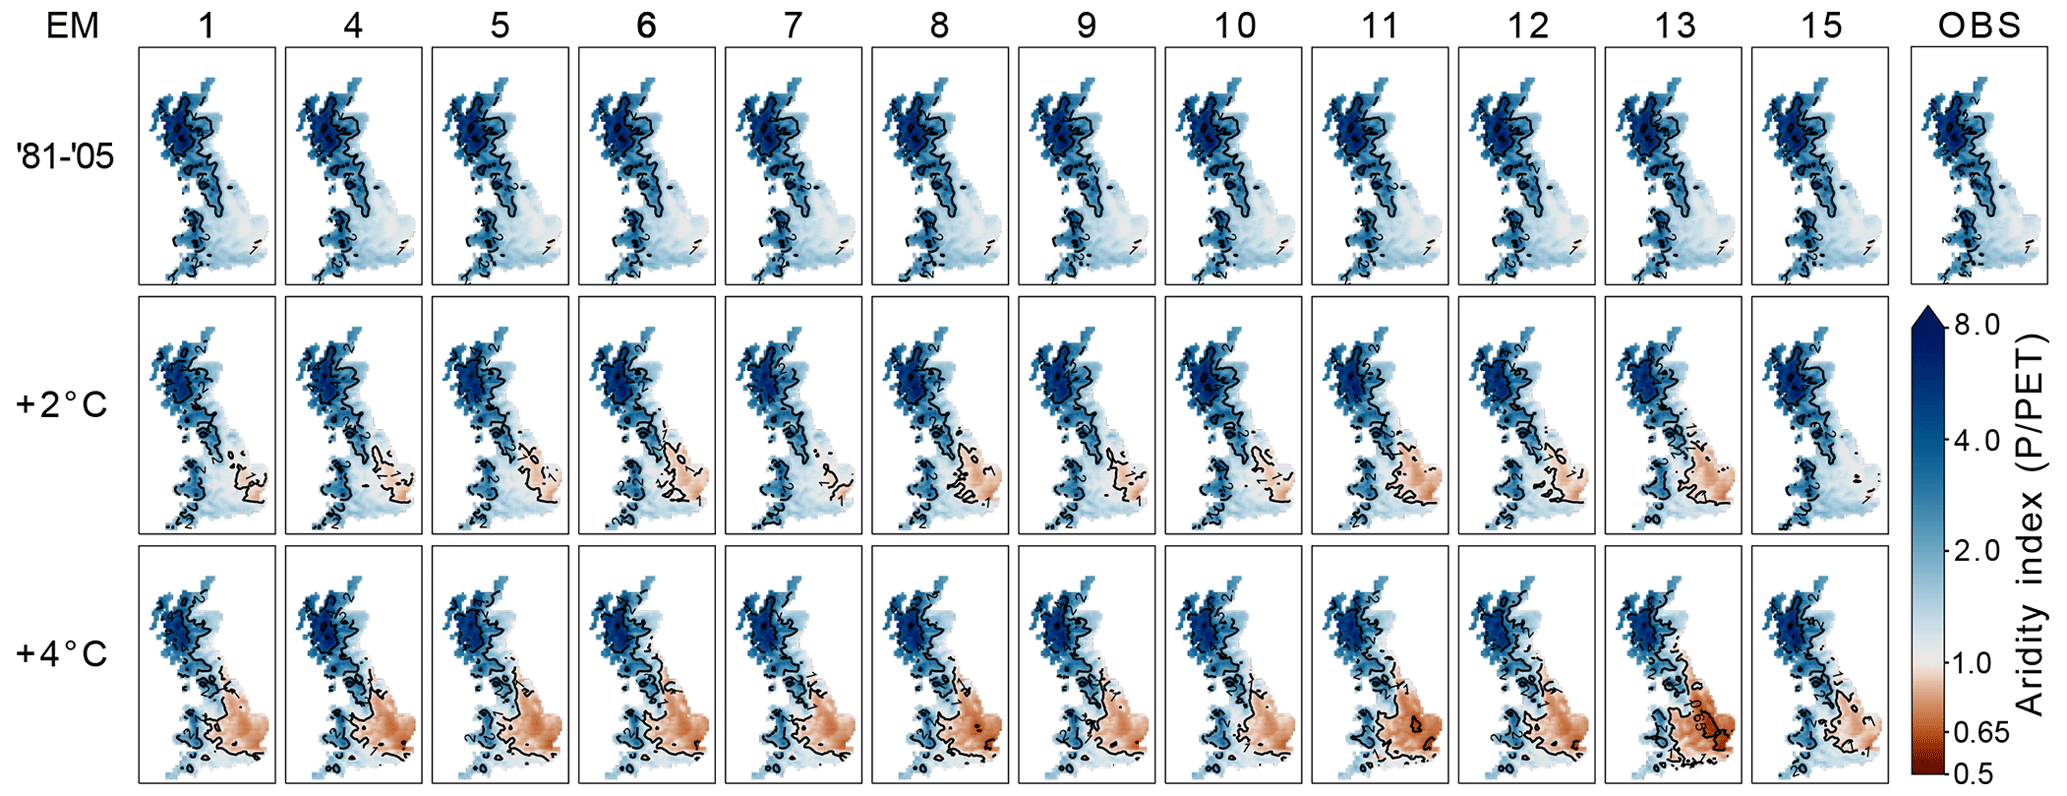
Figure 3Aridity index (average annual ) for the 12 bias-adjusted UKCP18 RCM ensemble members. The contours shown in black are powers of 2 and the level of 0.65 (below which a climate is classified as dry sub-humid).
5.1 Drought frequency
Figure 4 shows the spatially averaged frequency of dry and extremely dry conditions based on the SPI6 and SPEI6, SP(E)I computed using a 6-month aggregation window (as in Eq. 2), for three time slices representing different warming levels. The scatter plots show the relationship between GB-averaged drought frequencies using the SPI6 and SPEI6, as projected at different global mean warming levels (GMWLs) in the 12 ensemble members and the observations. Considering a GB average, the UKCP18 RCM ensemble generally projects an increased frequency of moderate to extreme drought conditions with each warming level using both indicators. In the scatter plots, all points move upwards (more frequent SPEI6 events) with increasing global warming level, and most move to the right (more frequent SPI6 events), except for a few ensemble members for +2 ∘C. However, the GB-averaged drought frequency increases, and future projections are, for each ensemble member and warming level, greater when quantified using the SPEI6 than when using the SPI6. For those three ensemble members that project a slight decrease in total drought frequency based on the SPI6 for +2 ∘C, including PET in the drought indicator (SPEI6) changes the sign of the projected change. To compare the differences between SIs and GMWLs, the SPEI6-based GB-averaged drought frequency projected at +2 ∘C is equal to or greater than the SPI6-based frequency projected at +4 ∘C for at least half the ensemble members in each drought category. For drought frequency quantified with the SPI6, by +4 ∘C, the projected increases range from a few percentage points to more than double the reference frequency, whereas they range between 2- and 8-fold the reference frequency for the extreme droughts. At the same high warming level, the ensemble projects SPEI6-based droughts almost half of the time (ensemble average of 46 %), about half of which (ensemble average of 23 %) are classed as extremely dry conditions. The ensemble spread (scatter) of future projections is substantial and grows with increasing warming level. Importantly, the projected relative increase in extreme drought frequency is far greater than for the total drought frequency. With respect to +4 ∘C, the ensemble mean spatially averaged total drought frequency increases by a factor 1.7 for the SPI6 and by a factor 3.1 for the SPEI. For extreme droughts, however, these multiplication factors are 3.7 and 11.5 respectively. This disproportionate increase in the extreme drought category, which shows in projections based on both indicators, has potentially important implications for drought impacts, such as stakeholders or ecosystems vulnerable only to extremely dry conditions (e.g. Parsons et al., 2019).

Figure 4Spatially averaged projections of drought frequency, expressed as the fraction of months that the SI is below the threshold, for each ensemble member (rows) and the ensemble mean (bottom row), for three time slices (sub-columns) that correspond to the reference period and two different levels of global mean surface warming compared with pre-industrial levels, using both drought indices (columns). Frequencies are shown for all droughts (a), for extreme droughts (b), and as scatter plots (one point per ensemble member) comparing SPI6- and SPEI6-based frequencies of all droughts (c) and of extreme droughts (d). Spatial averages are across the whole of Great Britain.
The maps in Fig. 5 show the spatial patterns of these drought frequency changes (for the ensemble average) and their differences between the SPI6 and SPEI6. For the reference period, the ensemble-averaged GB mean total and extreme drought frequencies are 0.15 and 0.023 respectively, which are close to the respective theoretically expected values of 0.158 and 0.022. There is some variation around these values in space (Fig. 5) and among ensemble members (Fig. 4), which is not unexpected. Imperfections in the distribution fits in the calculation of the SPI and SPEI, differences between the climates of the 1961–2010 and 1981–2005 periods (black markers in Fig. 4), any model errors remaining after bias adjustment, and internal climate variability can all result in differences between the simulated drought frequency in the reference period and the theoretical frequencies that would be expected for the calibration data.
There is significant regional variability in projected drought frequency across GB inferred with either drought indicator, especially for extreme drought (Fig. 5). Both SIs show a similar pattern, with the mildest increases or even decreases along the west coast, most notably in north-west Scotland. However, the areas projected to experience the greatest increase in the frequency of dry conditions differ between the drought indices. In the SPI6-based projections, the greatest increases are projected in the rain shadows of highly elevated areas. For the SPEI6, the largest increases are seen in these areas as well as in a larger area covering most of England (except near the west coast), including the East Midlands and East England where SPEI6-based drought conditions are projected around 60 % of the time under the +4 ∘C scenario. These are already the least humid regions of GB (Fig. 3). For both indices, these regional patterns of change are amplified when looking at the higher warming level and when isolating extreme droughts.
The bottom row of Fig. 5 shows the SPEI6dtr-tas, which is the SPEI6 using PET calculated with detrended temperature simulations. With the projected temperature increase removed, the SPEI6 shows only minor changes in drought frequency. Furthermore, at +4 ∘C, the projected drought frequencies using the SPEI6dtr-tas are much less than those found for the precipitation-only SPI6. At face value, this suggests that non-temperature-related influences may reduce PET (offsetting some of the temperature-driven increase) and that PET calculation methods which only rely on temperature (e.g. Thornthwaite) may overestimate drought risk based on the UKCP18 RCM simulations. However, the effects of physically interdependent variables (especially temperature and humidity) cannot be truly separated. Crucially, we use simulated specific, not relative, humidity here to compute PET (Robinson et al., 2017). Whereas specific humidity is projected to increase over GB, relative humidity is projected to decrease, as the saturated humidity increases faster with rising temperatures (not shown), thereby contributing to the increased future PET. However, by detrending the temperature, the saturation humidity level computed in the PET calculation was reduced for future simulations, which, combined with the unadjusted specific humidity projections, resulted in artificially increased relative humidity and, thus, a decreased vapour pressure deficit term. The temperature effect shown by the difference between SPEI6 and SPEI6dtr-tas (Fig. 5) therefore implies a far greater effect of temperature than if a PET formulation using the relative humidity projections would have been used (Fu and Feng, 2014; Robinson et al., 2017).

Figure 5Ensemble-averaged projected frequency of all (a) and extreme (b) dry conditions expressed as the fraction of time that the SI falls below −1 or −2 respectively. The top row shows the SPI6, the middle row displays the SPEI6 with projected temperature changes and the bottom row shows the SPEI6 with detrended temperature.
5.2 Spatial extent
Figures 6 and 7 show the observed and simulated extent–frequency curves of drought conditions for the SPI and SPEI respectively for different global warming levels (i.e. time slices) and using different aggregation levels. Moving upwards in this plot means an increase in the frequency of drought conditions with at least the spatial extent given by the horizontal axis (not necessarily in the same locations). Moving to the right in this plot means an increase in the spatial extent of drought conditions that is exceeded with a particular frequency (given by the vertical axis).
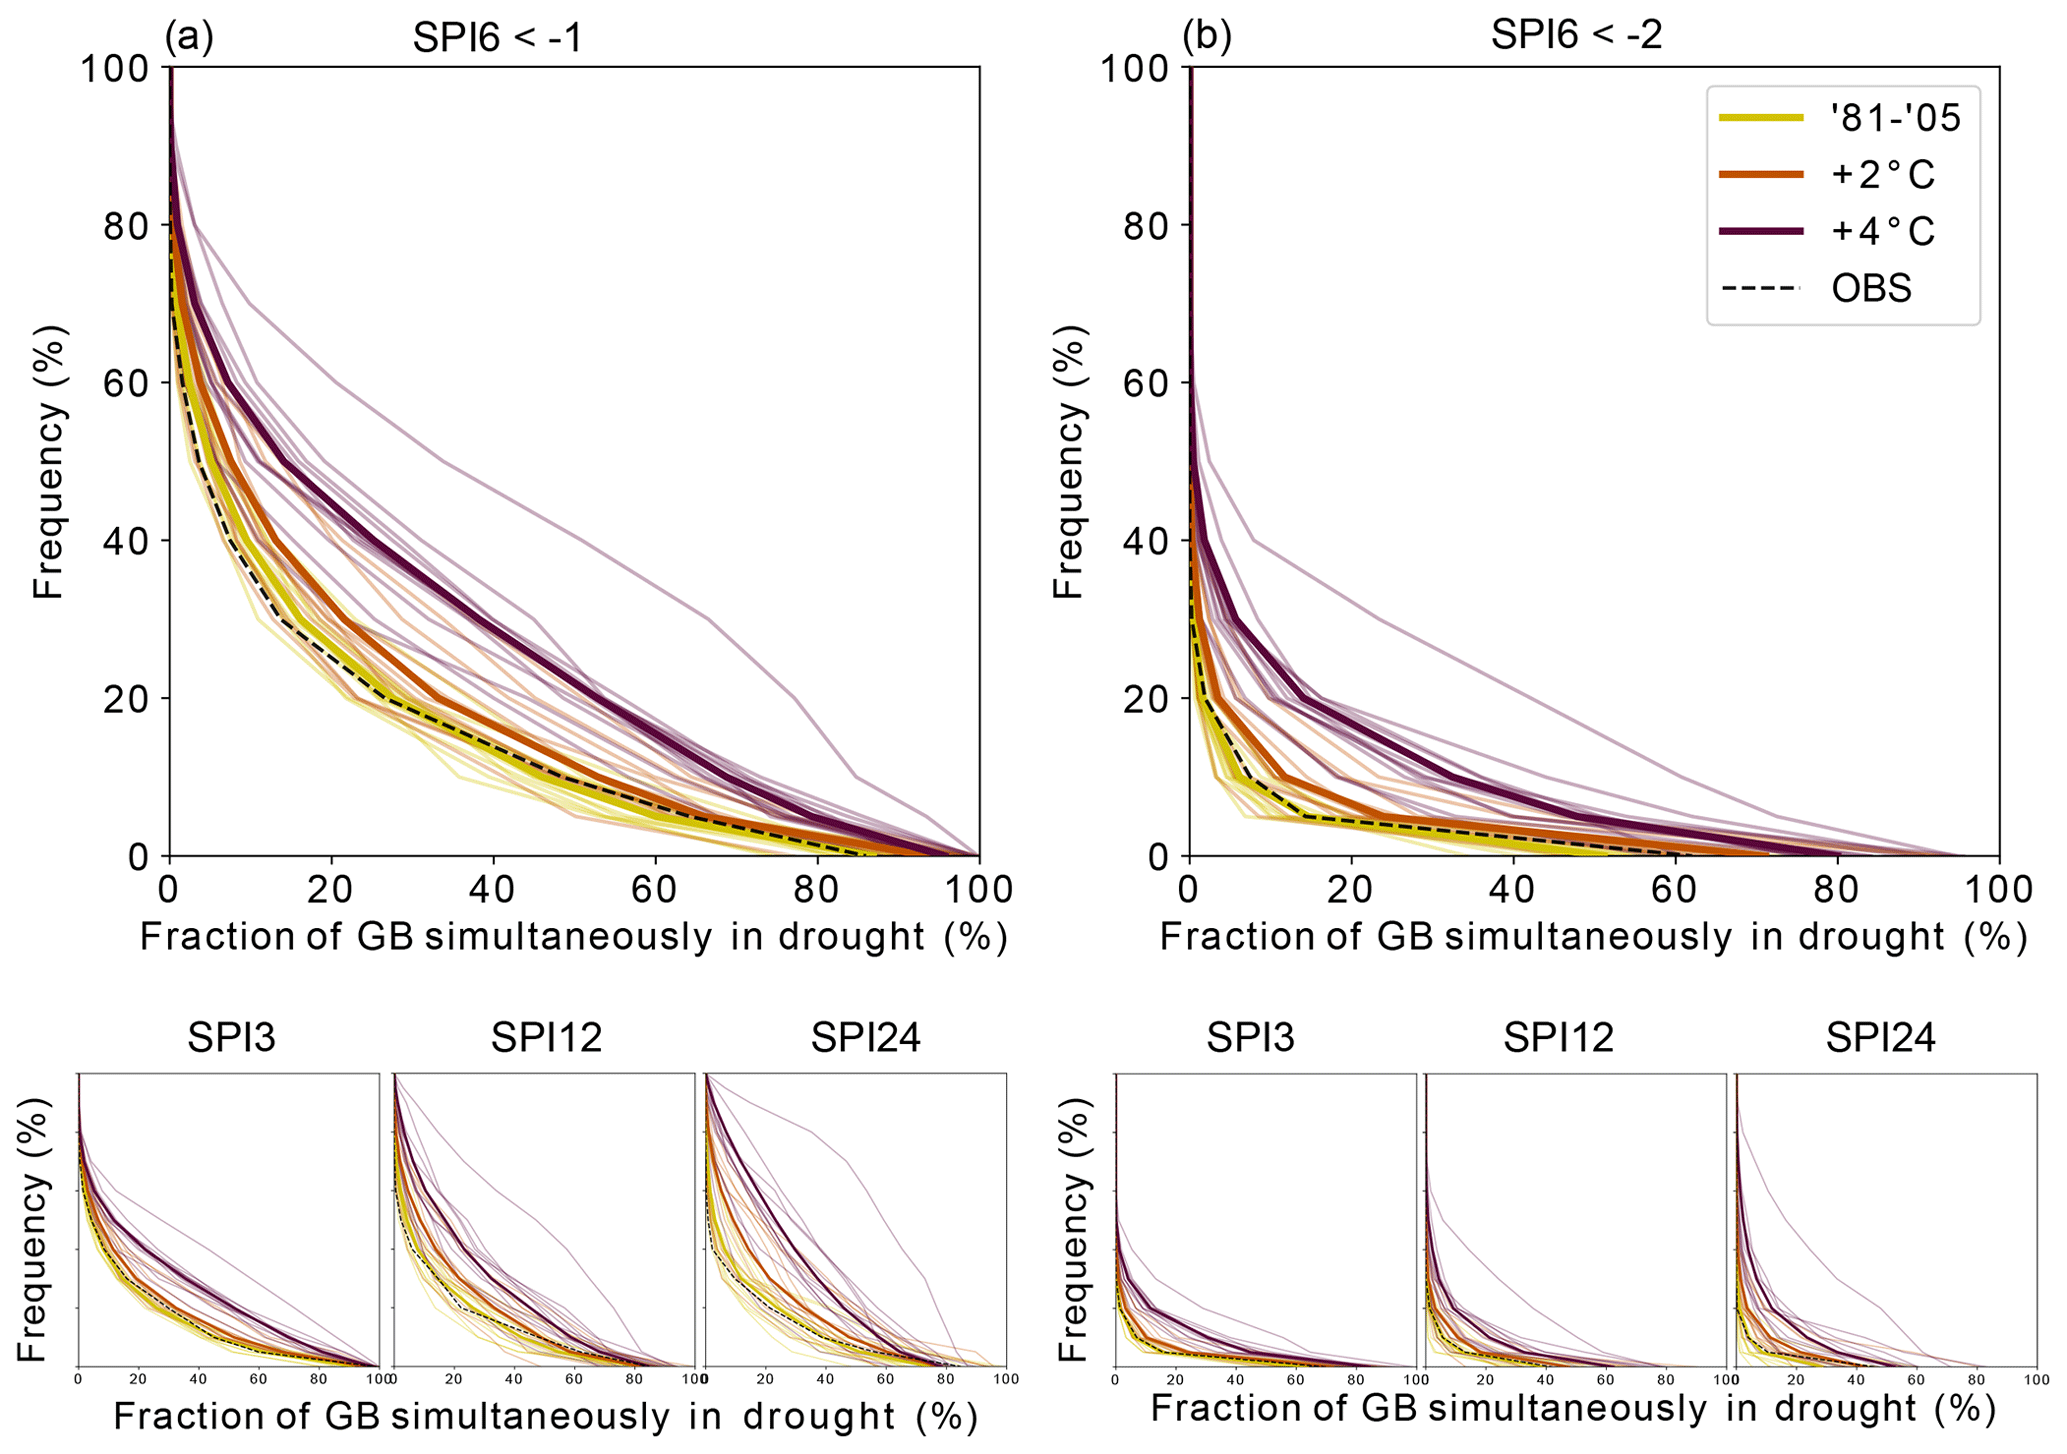
Figure 6Extent–frequency curves for all (a) and extreme (b) drought extents based on the SPI at different aggregation levels (subplots). The horizontal axis gives the drought extent (as a fraction of GB area) that is reached or exceeded with a frequency given by the vertical axis.
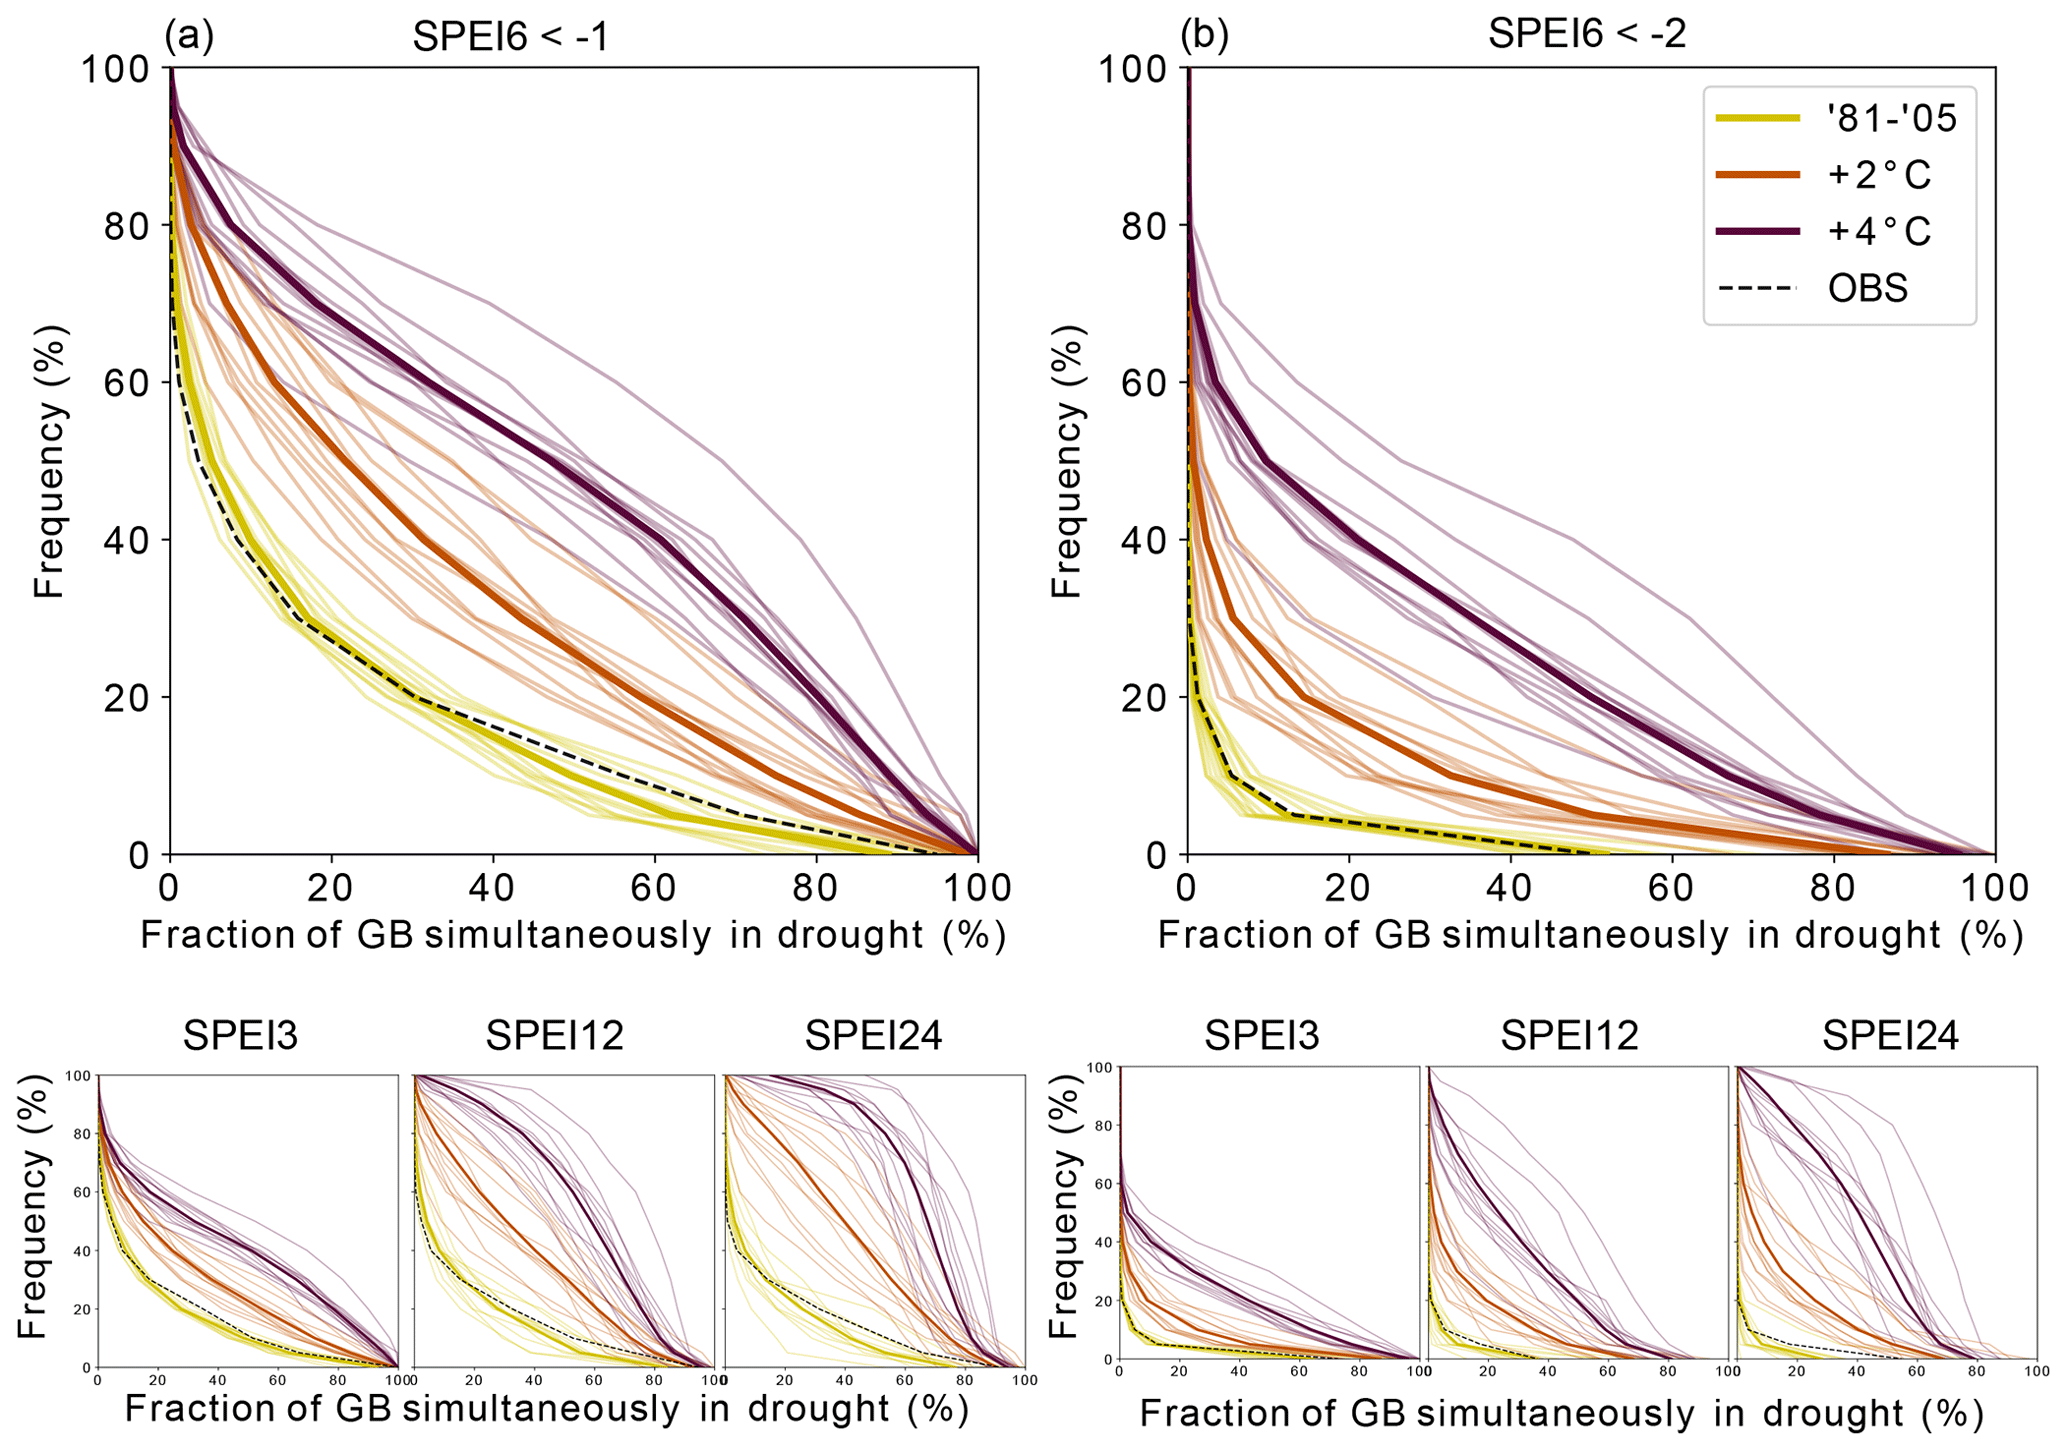
The relationships between frequency and drought extent for the reference period simulations generally match well with the observations. However, as the aggregation period increases, the frequencies of smaller drought extents are increasingly overestimated in the simulations, whereas the frequencies of larger drought extents are on average well represented (SPI) or become slightly underestimated (primarily the SPEI), especially for the 12- and 24-month aggregation periods. The ensemble spread for the reference period simulations also increases with the aggregation level, enveloping the observations in all cases. The bias adjustment was done on the distributions of daily values of individual grid cells, not considering the spatial coherence in longer-term statistics, and without considering correlations between precipitation and PET. These might be the reasons for these minor mismatches.
For a given drought extent, the relative change in frequency as global temperature increases is far greater for extreme droughts than for all droughts (for both the SPI and SPEI). For instance, based on the SPI6, the frequency of events during which at least 20 % of GB simultaneously experiences a drought is currently 26 %, whereas it increases to 44 % with +4 ∘C of warming (mean of the ensemble). In contrast, SPI6-based extreme droughts covering 20 % of GB have a frequency of occurrence that is currently less than 4 %, but this frequency is projected to jump to 16 % for +4 ∘C warming (mean of the ensemble). Climate-change-induced changes in the relationship between the frequency and extent of droughts depend strongly on the drought metric used. The SPI and SPEI both show increasing frequency of droughts of most extents; however, the increase is much greater for the SPEI. Moreover, different frequency changes are projected for droughts with different extents (e.g. greater changes for smaller drought extents using the SPI). Using longer aggregation periods, the future projections move toward higher frequencies and extents, the ensemble spread increases, the difference between GMWLs grows and differences between drought indicators become more pronounced. For the extreme drought class, the maximum extent is projected to increase greatly with global warming (based on both the SPI and SPEI). The ensemble mean maximum SPI6 area fraction in drought increases from just over 51.2 % (an underestimation of the observation-based maximum extent) to just over 71.1 % with +2 ∘C of warming and to 80.0 % with +4 ∘C of warming. For the SPEI6, the ensemble-averaged simulated maximum extent and the overall extent–frequency relationship matches observations very closely, and the maximum extent is projected to increase from just over 51.8 % to 86.5 % under the +2 ∘C scenario and to 95.4 % (i.e. almost all of GB simultaneously in extreme drought) under the +4 ∘C scenario. The relative increase in the maximum extreme drought extent projected due to global warming is greater for longer aggregation periods for both indicators. Finally, the drought-free frequency, given by the difference between 100 % and the intercept on the y axis, is generally projected to decrease under climate change, again far more strongly for the extreme drought category and for SPEI-based drought.
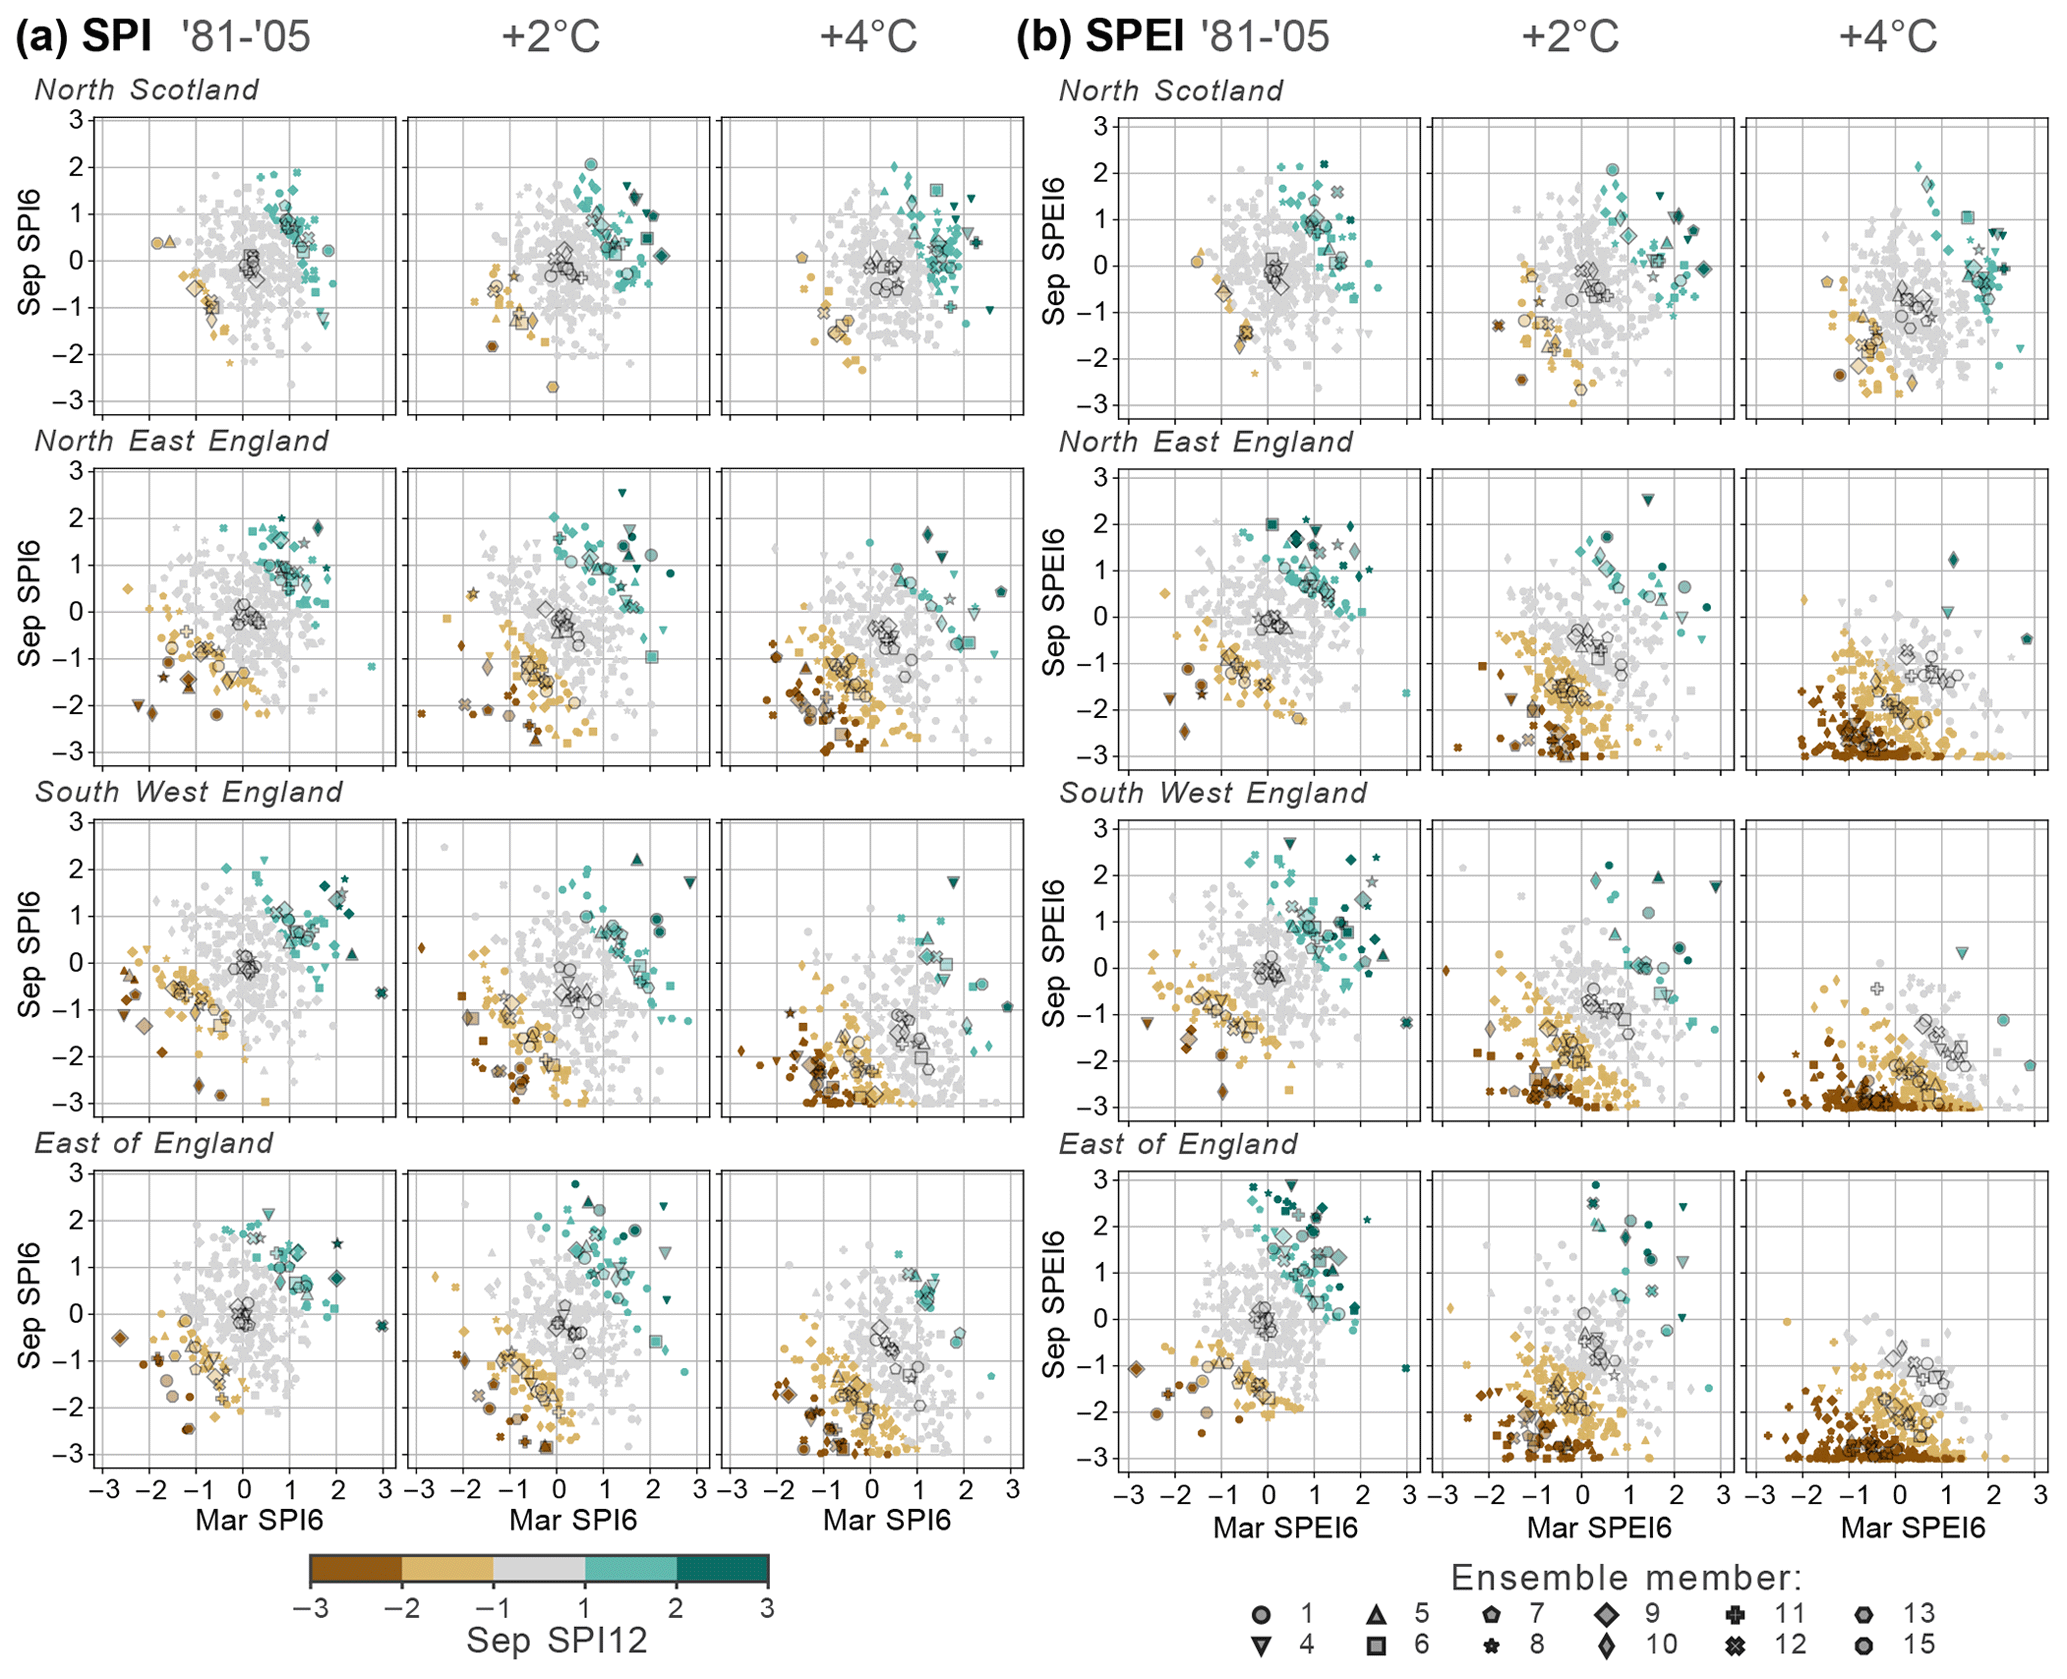
Figure 8Values of the September SI12 (hydrological year) plotted against the September SI6 (hydrological summer) and the March SI6 (hydrological winter) from the same year used to compute SI12 for the SPI (a) and the SPEI (b). All years are shown for each time slice and ensemble member. SI6 values that exceed −3 or +3 are plotted at −3 or +3 respectively. The larger, transparent markers show the centroids of five SI12 classes: extremely dry, dry but not extremely dry, normal, wet but not extremely wet, and extremely wet. The reader is referred to Figs. S4 and S5 for results for all 13 regions.
5.3 Seasonal timing
Figure 8 shows the contributions that summer and winter deficits make to annual droughts according to the SPI and SPEI for three global warming levels for the selected GB regions. Results for the other regions can be found in Figs. S4 and S5. The horizontal and vertical axes show SI6 for March and September respectively, indicating how dry or wet the hydrological winter and summer were in a given year. The September SI12, indicating the dryness of the corresponding hydrological year, is represented by the colours of the dots. For example, a grey dot with coordinates (1.1, −2.2) represents a normal annual value consisting of a wet winter and an extremely dry summer.
The increasing summer dryness is reflected by a general downwards shift in the point cloud, while a rightward shift reflects wetter winters in some regions. Increases in the proportion of dry years are projected in most regions and can be attributed mainly to the summers of those dry years, especially for SPEI-based droughts. In several regions, such as the East of England, most summers in the ensemble are classified as dry under the +4 ∘C scenario, leading to their respective years being classified as dry in about half (SPI +4 ∘C and SPEI +2 ∘C) or almost all (SPEI +4 ∘C) cases. With increasing global warming levels, a growing number of years consist of a wet winter followed by a dry summer (bottom right corner beyond the (1, −1) coordinate), which is rare in the reference period simulations. In South West England, this even becomes the norm under the +4 ∘C scenario in these simulations (grey centroid dots). Using the SPEI, in all except the Scottish regions, an increasing number of these “contrasting” years are categorised as dry (or even extremely dry, in some regions under +4 ∘C), which is not observed at all for the SPI. Using the SPI, the number of contrasting years classified as wet based on their SI12 increases in most of the western regions, which is observed to a lesser extent in the SPEI. Thus, the implicit assumptions regarding evapotranspiration in these indicators have a decisive influence on seasonal droughts and how they tip the annual water balance, demonstrating the importance of understanding the influence of these PET increases.
5.4 Duration
Figure 9 shows the number of simulated drought events within six drought duration categories (horizontal axis), based on the SPI6 and SPEI6. Results for the other regions as well as droughts that reached extreme levels are shown in Figs. S6 and S7.
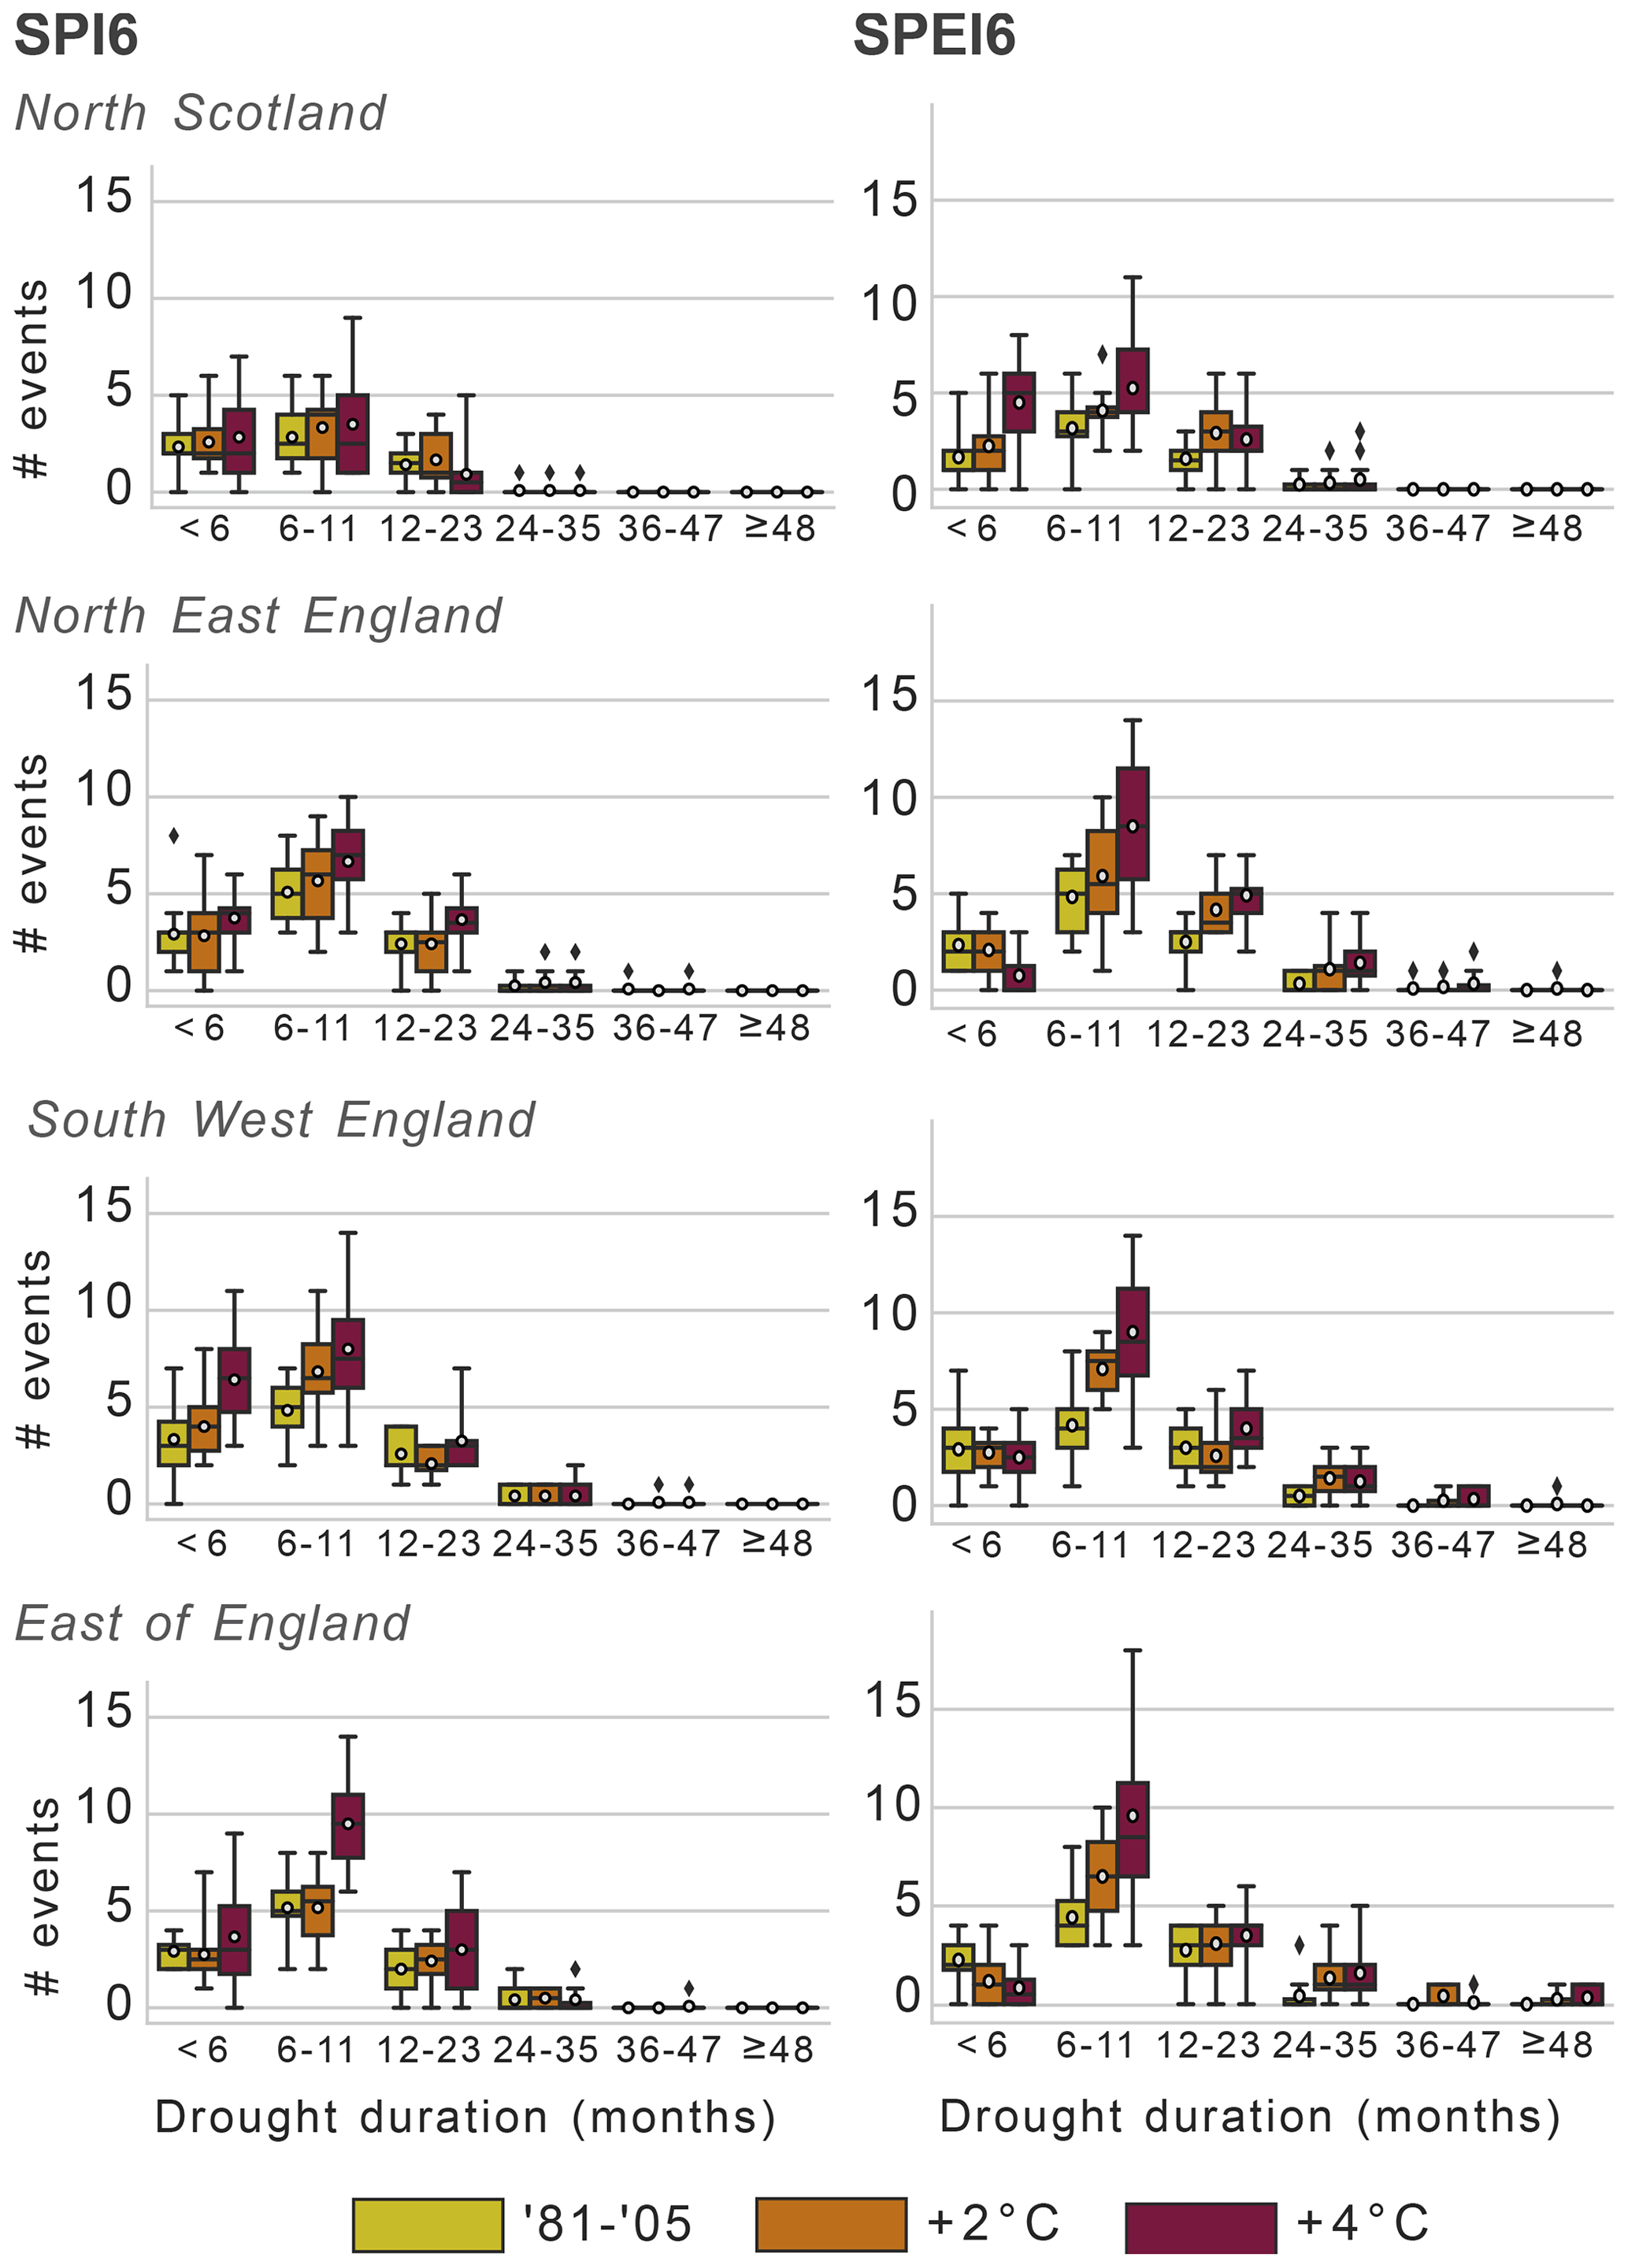
Figure 9Number of drought events of all severities by duration for three 25-year periods corresponding to progressive warming scenarios in the selected regions (based on the SPI6). White circles indicate the ensemble mean, boxes show the interquartile range and whiskers show the ensemble range except for members exceeding 5× the interquartile range (diamonds). The reader is referred to Fig. S6 for the other regions.
Overall, the drought indicator makes a large difference in the projected changes in the distribution of drought durations. The ensemble spread of the number of events in each drought category is large, for both indicators, and there is often a strong overlap between GMWLs which is diminished when isolating droughts that reach extreme levels. In most regions, the SPI6-based projections show increases in droughts shorter than 6 months, while the SPEI6-based projections for this category are divided between decreases in the drier region (south and central to east) and increases or little change in the other regions. In almost all regions, however, there is an increase in 6- to 11-month droughts using both indicators. The decreases projected in the shortest SPEI6-drought category in half of the regions are generally paired with increases in longer droughts, suggesting that the larger projected drought frequency in these regions (see Fig. 5) is concentrated in fewer consecutive dry periods, with seasonal droughts getting pooled together into longer events.
Sustained multi-year droughts are a major concern for water managers (e.g. Marsh et al., 2007). They can also have fewer occurrences in a 25-year time slice by definition, and a larger share of the ensemble members contain zero multi-year events for a given time slice and region. Droughts lasting at least 2 years rarely occur more than once in a given time slice in our analysis, and they never occur more than twice for a given duration bin. Therefore, for these events, we discuss the total number of ensemble members that project at least one such event in any given time slice. Based on the SPI6, the number of ensemble members projecting at least one drought lasting from 2 to 3 years is not expected to change for most regions, although an increasing share of events reaching extreme levels is found in about half of the regions. Using the SPEI6, the number of ensemble members projecting at least one 2- to 3-year event increases with GMWL in the southern and central to eastern regions; for events reaching extreme levels, this increases in almost all regions. The number of these events simulated in a single time slice by a single ensemble member also increases in several regions using the SPEI6. Droughts lasting 3 years or longer in the reference period are simulated in either none or one of the ensemble members depending on the region, irrespective of the SI (with the exception of the West Midlands for the SPEI6: two ensemble members). A drought of 4 years or longer in the reference period is only simulated by one ensemble member in one region for each indicator. With increasing warming levels, more ensemble members simulated at least one SPEI6-drought event with a duration of more than 3 years in the English regions and Wales, most of which reach extreme levels at some point. This is in contrast with SPI6, where little change can be found in the number of ensemble members simulating such events (a maximum of two ensemble members in any time slice and region). As increasing multi-year droughts across the ensemble are almost exclusively seen using the SPEI, any indication toward a possible increased likelihood of these events depends on the influence of the AED.
6.1 Projected changes in atmospheric droughts
This section discusses the results presented above in the context of previous studies that have used meteorology- and atmosphere-based drought indices to investigate climate change impacts on droughts in GB.
The spatial pattern of the drought frequency changes in Fig. 5 is very broadly in agreement with the spatial patterns of drought intensity found by Hanlon et al. (2021), using UKCP18 RCM and the DSI, and increases in drought event occurrence found by Spinoni et al. (2018), using EURO-CORDEX and a combined atmosphere-based drought indicator. Nevertheless, the differences between our SPI6 drought frequency maps and the DSI6 drought severity maps in Hanlon et al. (2021) reveal how drought projections can be sensitive to the exact method used for drought quantification and characterisation, even considering the same variable (precipitation) and aggregation timescale (6 months). For example, the SPI6 drought frequency increase hot spots in Fig. 5 are further west than the DSI6 drought severity increases along the east of GB found by Hanlon et al. (2021). Moreover, by discriminating between all and extreme drought, we showed how the spatial patterns of drought frequency projections are similar but amplified in the extreme drought class. Furthermore, this study analysed, for the first time, the projected changes in drought extent as a function of frequency. The difference in the shape of the observation-based extent–frequency curves between extreme and all drought conditions (Figs. 6, 7) confirms the finding of Tanguy et al. (2021), who reported that the most extreme droughts tend to be more localised than when all droughts are considered; moreover, the aforementioned authors showed that this is also true using a drought definition including PET. Rahiz and New (2013) found a projected increase in drought spatial coherence using UKCP09 and the DSI6. Here, we not only showed increased drought extent and frequency but also, notably, a larger relative increase in the frequency of widespread extreme drought conditions as well as strong increases in more localised extreme droughts. This is the case for the SPI, although it is greatly amplified when including PET. Moreover, we showed that the observed and projected drought extent–frequency relationship is timescale dependent. As discussed in Sect. 6.4, widespread dry and extremely dry conditions identified using an SI with one specific aggregation period would likely lead to differential agricultural and water resource impacts depending on the relevant timescales in the affected regions.
Previous studies have often assessed changes in drought duration using the mean and/or median duration or overall trends (e.g. Touma et al., 2015; García-Valdecasas Ojeda et al., 2021; Vicente-Serrano et al., 2021). Here, in contrast, we isolated changes in events of different duration categories, which revealed the possibility of increasing multi-year droughts in some regions based on the SPEI6 but not on the SPI6. Multi-year droughts were also assessed by Lehner et al. (2017), who found that, for some studied regions (including central Europe and the Mediterranean), progressive climate change is projected to increase the risk of 4 consecutive drought years (based on the Palmer drought severity index, PDSI, which is also sensitive to projected increases in PET). Rahiz and New (2013) considered changes in drought events lasting at least 3, 6, 10 and 12 months, based on the DSI6 using the previous generation of UKCP regional projections (UKCP09), and found widespread increases in the number of events of at least 3 months, generally with stronger increases and ensemble agreement toward the south-west. Seasonal timing and contributions of drought were assessed by investigating changes in the combination of the March SI6, September SI6 and September SI12 for a given year. By visualising the relationship between annual conditions and the summer and winter half-years, this approach goes beyond assessing changes in the seasonal and annual SIs independently (e.g. Spinoni et al., 2018; Vicente-Serrano et al., 2021), making use of the multi-scalar property of these indices. In this way, it has been shown that the dominant contribution to increasing deficits in the annual SIs in many regions consists of increasing deficits in the hydrological summer SI6 (especially for the SPEI) and that more years consisting of a dry summer preceded by a wet winter are projected in many regions. With an accumulation period of 3 months, Spinoni et al. (2018) found the decreasing occurrence of drought events in winter and the increasing occurrence of drought events in the other seasons (the strongest increases were reported in summer), with a spatial pattern dependent on the scenario and drought intensity considered. These and our results are in disagreement with Rahiz and New (2013), who found larger and more widespread drought frequency and intensity in the hydrological wet season, most likely due to a methodological difference in delineating seasons.
6.2 Differences between the SPI and SPEI projections
We show that the magnitude of the difference between SPI- and SPEI-inferred projected changes is substantial for all considered drought characteristics. For drought frequency, using the 6-month aggregation period, it is comparable to the difference between +2 and +4 ∘C of warming above pre-industrial levels for the extent and frequency of drought and extreme drought. Within both warming scenarios, the difference in the GB-averaged projected total drought frequency between the SPI and SPEI is similar to the ensemble range (for either SI). For extreme drought, the difference between the SPI6 and SPEI6 is similar in size to the ensemble range according to the SPI at +2 ∘C, and it lies between the ensemble ranges of the SPI and SPEI at +4 ∘C.
Previous studies have found divergence in the trends of drought characteristics between the SPI and SPEI in observations (Stagge et al., 2017; Karimi et al., 2020; Ionita and Nagavciuc, 2021), historical climate simulations (Chiang et al., 2021) and future climate projections (e.g. Arnell and Freeman, 2021; García-Valdecasas Ojeda et al., 2021; Wang et al., 2021), with the SPEI indicating increased drying compared with the SPI. Increases in PET under a changing climate, combined with the high sensitivity of the SPEI to PET changes, cause amplified projections of climatological drying and even a reversal of wetting trends in some parts of the world compared with when only changes in precipitation are considered (Cook et al., 2014). For the UK, Arnell and Freeman (2021) found that projected increases in drought frequency based on the SPEI6 exceeded those based on the SPI3, which is attributed to the inclusion of the effect of PET in the SPEI, although the difference in aggregation period should also have contributed. Ionita and Nagavciuc (2021) found a divergence of observed SPI12 and SPEI12 trends over Europe for 1901–2019, with the strongest drying trends located over the Mediterranean and central European regions. For GB, they found mostly non-significant SPEI12 trends, from wetting in the north-west to drying in the south-east (mostly due to a summer drying trend), alongside (also mostly non-significant) wetting SPI12 trends, especially toward the north. For 1958–2014, Stagge et al. (2017) found a decreasing SPI6-based drought extent that was not reflected in the SPEI6-based drought extent trends over Europe. For GB, they found a non-significant difference between SPI6- and SPEI6-based drought frequency trends, with both SI6 scenarios showing significant wetting in the north. Through a detailed analysis, the present study showed substantial differences between SPI- and SPEI-based projections for drought frequency, the distribution of drought spatial extents (using different temporal aggregations), the distribution of drought event durations and the seasonal contributions to 12-month deficits. The stark differences between SIs in projections of all of these drought characteristics, combined with their emerging divergence in observations documented in literature, invites more critical consideration before using one of these indicators in drought studies or monitoring, based on an understanding of the likely impacts of increasing PET.
6.3 The role of the AED
The strong sensitivity of drought projections based on PET-reliant drought indicators to global warming has been discussed before (e.g. Seneviratne, 2012; Dewes et al., 2017; Berg and Sheffield, 2018; Manning et al., 2018; Scheff et al., 2021), considering the following aspects. First, overly warming-sensitive PET formulations can lead to overestimated increases in drought. This is not only true for temperature-based methods such as Thornthwaite (Sheffield et al., 2012) but also for the FAO56 reference crop Penman–Monteith method used in this study and many others. Assuming a fixed stomatal resistance of the reference crop neglects the effects of increasing CO2 on plant growth and stomatal conductivity, which has been identified as an important source (Milly and Dunne, 2016; Greve et al., 2019), but not the full explanation (Scheff et al., 2021), of offline PET overestimation in climate change studies. The impact of the representation of influences of CO2, temperature and vapour pressure deficit (Grossiord et al., 2020) on transpiration is likely highly relevant for the results presented in this study, as transpiration and bare-soil evaporation make up the respective largest and smallest fractions of total evapotranspiration in GB, with transpiration constituting the majority of the actual evapotranspiration (AET) in the English Lowlands (Blyth et al., 2019). Second, when looking at the variables standardised in the SPI and SPEI as proxies for the surface water balance, the respective assumptions are that no AET occurs or that the AET always occurs at its maximum rate (PET), neglecting possible limitations from moisture supply. In reality, the response of the AET to increasing AED is complex, and the land–atmosphere interactions contributing to drought development and propagation, including the role of evapotranspiration under a high AED, are active areas of ongoing research (e.g. Miralles et al., 2019; Vicente‐Serrano et al., 2020; Gampe et al., 2021; Denissen et al., 2022; Massari et al., 2022; Zhao et al., 2022). Intuitively, an enhanced AED leads to enhanced AET until moisture availability becomes limiting, after which the effect of the AED on AET decreases. This implies a temporally variable response of the AET to AED during drought development, evolution and recovery, dependent on moisture availability (e.g. Zhao et al., 2022), and different responses based on the regional climate (e.g. Vicente‐Serrano et al., 2020). The sensitivity of the SPEI to AED also varies between climates (Tomas-Burguera et al., 2020). Moreover, the behaviour of the AET under drought conditions crucially depends on land cover and plant physiology (e.g. Teuling et al., 2010; Grossiord et al., 2020), soil structure (e.g. Massari et al., 2022; Zhao et al., 2022) and geology (e.g. Bloomfield et al., 2019). Finally, due to equal aggregation periods used for precipitation and PET in the SPEI, it is inherently implied that the drought development contributions of low-precipitation and high-PET anomalies are influential over the same timescales, which is not always the case (Manning et al., 2018).
Interestingly, GB sits in the transition between humid, radiation-controlled northern and central Europe and more arid, precipitation-controlled southern Europe (Teuling et al., 2009). On an annual basis, evaporation is generally more water-limited and negatively correlated with temperature in summer toward the south and east of GB, whereas it is more energy-limited and positively correlated with temperature in summer in the north and west (Seneviratne et al., 2006; Kay et al., 2013). This has important implications for the expected impacts of increasing AED on future droughts across GB, as the influence of the AED varies between energy- and water-limited evaporation regimes, and the effect of AED increases can be more complicated in transitional regions (Vicente‐Serrano et al., 2020). Indeed, Kay et al. (2013) found that observed trends in PET between 1961 and 2012 are greater than those for the AET for England and Wales, while PET and AET trends are very similar in energy-limited Scotland. This is in contrast with Blyth et al. (2019), who found that the modelled AET increased at a greater rate than PET in GB between 1961 and 2015, due to increases in precipitation and the large contribution of interception to the total AET. An enhanced AED has already been shown to enhance streamflow droughts in GB, with a stronger effect in some regions than in others (Vicente-Serrano et al., 2019; Massari et al., 2022), as well as groundwater droughts in the major aquifer in south-east GB (Bloomfield et al., 2019).
The importance of the range of evaporation regimes for explaining drought propagation and drought impacts across GB has not received much attention in the existing literature, but it presents a valuable direction for further research. For example, the currently least humid areas of GB are projected to experience large increases in SPEI drought, increases in aridity, and on average longer and more intense seasons during which PET exceeds precipitation. The effect of extreme SPEI-drought conditions on soil moisture and streamflow droughts in these areas could be smaller than suggested by the magnitude of the PET contribution due to moisture availability becoming limited. Under such conditions, vegetation may still be significantly impacted due to a high AED and its components (Schönbeck et al., 2022). Understanding potential shifts in these evaporation regimes under climate change could help inform climate change adaptation strategies related to land and water use. To better understand the PET component of the projected SPEI-based drought projections for GB, we detrended temperature (which affected the vapour pressure deficit term and the slope of the Clausius–Clapeyron relation), after which no increases in the SPEIdtr-tas drought frequency were projected in most regions of GB. Further research into projected changes for the different variables influencing PET (radiation, temperature, relative and specific humidity, and wind speed) is needed to better understand the strong contribution of PET to SPEI-based drought projections as well as to help understand possible shifts in evaporative regimes over GB.
Based on the discussion above (and depending on the drought type or impact of interest), the SPEI-based results in this work may present a (conservative) upper limit of future drought risk, whereas using the SPI (and other precipitation-only indicators) is expected to underestimate these increases. Thus, future changes in other drought types may end up in the range between SPI- or SPEI-based projections, depending on the region (Touma et al., 2015; Lee et al., 2019). Thus, these results highlight the importance of understanding (changes in) the role that the AED plays in GB droughts and overall hydroclimatic changes under a changing climate.
6.4 From atmospheric indicators to impacts
Many studies have used a range of drought-impact-related data to investigate the relationships of SIs with different aggregation periods in GB and beyond (Stagge et al., 2015a; Folland et al., 2015; Barker et al., 2016; Bachmair et al., 2016, 2018; Haro-Monteagudo et al., 2018; Parsons et al., 2019; Gampe et al., 2021). This is not straightforward, as impact variables and reports of past droughts (based, for instance, on observed flow) are also influenced by water fluxes driven by the land surface (e.g. evaporation limited by soil moisture) and human actions (e.g. irrigation and water abstractions), which are not accounted for by the SPI or SPEI. While studies linking SIs to impacts agree with respect to some aspects (e.g. longer SI aggregation periods for predicting streamflow drought in the south-east than in the north-west; Bachmair et al., 2016; Barker et al., 2016), there is a lot of uncertainty left. In the UK, due to regional differences in climatology, hydrogeology and agricultural practice, the links between SIs and various impacts are more meaningful at regional or local levels than at the national scale (Barker et al., 2016; Parsons et al., 2019). Socio-economic and physical vulnerability factors also influence the impacts resulting from droughts characterised by certain SPEI or SPI values (Blauhut et al., 2016). Additionally, previously established relationships between drought indicators and impacts may change under a changing climate (Feng et al., 2017). Therefore, despite established links between SIs and impacts, it is difficult to quantitatively infer changes in agricultural, ecological and hydrological drought from drought projections based on the SPI and SPEI alone. For example, agricultural drought impacts may be expected to increase due to a projected increase in summer drought frequency and intensity (Stagge et al., 2015a; Haro-Monteagudo et al., 2018; Parsons et al., 2019), which is found for both indicators in most of GB, including in agriculturally important regions (Fig. 8). However, as the projections based on the SPI are much milder than those based on the SPEI, the magnitude of this increase depends on the importance of increasing AED and temperature for root-zone-accessible soil moisture and crop growth as well as the importance of the crop response to components of the AED itself. The greater frequency and intensity of dry years (SI12), as well as the increasing extent and frequency of drought and extreme drought with longer aggregation periods, may indicate a greatly increased risk of drought impacts on water resources in the south-east and east and, by extension, irrigated agriculture in these regions. Smaller projected increases in drought frequency based on SI3 may indicate similarly smaller increases in streamflow drought in the north-west (Barker et al., 2016; Bachmair et al., 2016).
6.5 Study limitations
The set of regional climate projections in UKCP18, which this study relies upon, is not intended to represent a comprehensive, probabilistic view of possible changes but rather to sample a broad range of possible futures and provide storylines suited for analysis of impacts (Murphy et al., 2018). The UKCP18 RCM projections were produced using the same GCM and RCM structure with perturbed parameter values, meaning that the climate model structural uncertainty has not been sampled. Finally, as opposed to an ensemble where only the initial conditions differ, the projections of such a perturbed physics ensemble cannot be combined in order to obtain longer time series for each level of global warming. This primarily limits our analysis of multi-year droughts. For those events, the length of the time slices used is also a limiting factor for investigating projected changes in the occurrence of such events.
The drought indices that this study uses are among the most widely used ones. However, other indices exist that rely on precipitation or some combination of precipitation and the AED. Choosing a different drought index that includes both moisture supply and demand, with a different degree of sensitivity to each component, could lead to slightly different results (Vicente-Serrano et al., 2015). Indeed, as emphasised in this study, the drought index choice itself can be a substantial source of uncertainty due to both the use of different variables representing different drought types (Satoh et al., 2021) and the uncertainty between different drought quantifications based on the same variable (Sutanto and Van Lanen, 2021).
Aside from the vegetation assumptions in the PET calculation (see Sect. 6.3), vegetation assumptions in the UKCP18 RCM projections themselves present another potentially important limitation. In the UKCP18 “Soil Moisture and the Water Balance” fact sheet, Pirret et al. (2020) write that “the models use prescribed vegetation, which means that the model does not represent how increasing atmospheric carbon or reduced soil moisture would affect vegetation, or any feedbacks that this may have on the atmosphere or land surface”. This may lead to unrealistic changes in the AET under a warming atmosphere with increasing CO2, and thereby introduce errors in the simulated temperature and humidity, affecting PET.
Finally, using a different observation-based dataset for bias adjustment of PET, such as the recently produced Hydro-PE dataset (Robinson et al., 2022), may also lead to quantitative differences in the results.
We used the regional climate model perturbed parameter ensemble from the latest set of national climate projections for the UK, UKCP18, to quantify projected changes in drought characteristics. For this, two related but contrasting atmosphere-based standardised drought indices were used and their results compared: the Standardised Precipitation Index (SPI) and the Standardised Precipitation Evapotranspiration Index (SPEI). The SPI gives the standardised anomaly of n-month aggregated precipitation. The SPEI is similar, except the variable being standardised is a climatological moisture balance given by precipitation minus potential evapotranspiration. When regarding these indicators as standardised proxies for the surface water balance, their implied assumptions are either that no evapotranspiration occurs (SPI) or that evapotranspiration is never limited by moisture availability (SPEI). We assess, in detail, the difference between these indices with respect to investigating the impact of climate change on drought frequency, extent, seasonality and duration, for two categories of drought intensity. This is the first detailed systematic analysis of SPI- and SPEI-based drought projections and their differences for GB.
Drought risk over GB increases almost everywhere with increasing global mean surface temperature, including extreme drought risk. We find projected increases in drought frequency and extent with increasing global warming levels. These changes are far more pronounced for extremely dry conditions than for all drought conditions. The projected changes in drought frequency, seasonality and duration show large regional differences across GB, with the greatest increases generally found in English regions and Wales, notably including some of the already least humid regions toward the south-east, and little change (or even decreases) in drought in North and West Scotland. By assessing the relationship between drought spatial extents and their frequency in observations, reference period simulations and future projections, we showed that the reference period simulations capture the observed extent–frequency relationship quite well for both extreme and all droughts, and all (extreme) drought extents are projected to increase in frequency. Moreover, extreme droughts with extents greater than the most widespread drought in the reference period are projected to occur more often, depending on the warming level and especially for the SPEI. Linking shorter-term contributions to longer-term deficits is an underutilised possibility of (standardised) drought indicators that are applied over different timescales. By exploiting the multi-scalar nature of the standardised drought indicators, we found that increasing summer droughts are found to be the main contributor of the increasing frequency of increasing longer-term dry conditions. Additionally, contrasting years, consisting of a wet winter combined with a dry summer, are also projected to increase in occurrence. However, the combined result of contrasting seasonal changes is a projected increase in dry years for most regions. Finally, the distribution of drought event durations is also projected to change. For both indicators (but especially for the SPI), the changes are far greater under the +4 ∘C scenario than under the +2 ∘C scenario, supporting the consensus that every additional degree translates into increasing extreme events.
The choice of atmosphere-based drought indicator can have a great impact on the derived drought characteristics; thus, great care should be taken when selecting a drought index for climate change studies. This study clearly showed this for drought frequency, the distribution of drought extents, drought event durations and the seasonal character of annual deficits. The difference between the 6-month-aggregation-period-based SPI and SPEI is similar in magnitude to the UKCP18 RCM ensemble range of GB-averaged total and extreme drought frequency, and the +2 ∘C SPEI projections better resemble the SPI-based projections under the +4 ∘C scenario than under the +2 ∘C scenario for drought and extreme drought frequency, spatial extent and seasonality. The spatial pattern of simulated drought frequency is similar between the indicators, although there are differences in the regions with the strongest projected changes. Projected changes in the distribution of drought durations also differ between the indicators. Droughts shorter than 6 months are projected to increase in occurrence in most regions based on the SPI, but they are projected to decrease based on the SPEI in about half of these regions. On the other end of the spectrum, multi-year droughts lasting over 3 years (based on 6-month aggregated indicators) only occur in some of the SPEI-based projections.
With the sizeable divide between projections based on both indicators, it becomes increasingly important to understand how atmospheric evaporative demand and temperature affect droughts and their propagation to impacts in GB. The large difference between the SPI and SPEI in our results calls attention to the need to understand the influence of atmospheric evaporative demand changes on GB drought through land–atmosphere interactions as well as its adequate representation in models. In particular, further research is needed to understand the effects of the contribution of PET to projected drought conditions across the range of climatological evaporation regimes in GB (from energy-limited to transitional and water-limited regimes) and to explore likely changes in these regimes. Moreover, analysing the contributions of changes in radiation, relative and specific humidity, temperature and wind speed can shed light on the PET component itself. Different modelling approaches can help understand how changes in atmospheric moisture demand and precipitation can affect future droughts. This can include making use of the simulated soil moisture, evaporation and runoff calculated in the UKCP18 RCM itself (Pirret et al., 2020) as well as land surface modelling and hydrological modelling approaches which are valuable to shed light on projected changes in different components of the hydrological system (e.g. Lane and Kay, 2021; Kay et al., 2022). More generally, this work raises the question of how these changing drought characteristics translate into impacts for agriculture, water resources and ecosystems in GB. Under the current climate, according to the reviewed literature, there is little difference between the SPI and SPEI regarding their ability to predict different drought impacts. However, this is likely to change as the SPI and SPEI diverge due to increasing PET. Understanding how the projected increases in atmospheric evaporative demand can be expected to affect different drought types through land–atmosphere interactions is, therefore, of paramount importance for understanding future drought risk in GB.
The SPEI and SPI data produced in this study are available on Zenodo (https://doi.org/10.5281/zenodo.6123020) (Reyniers et al., 2022b) alongside the bias-adjusted UKCP18-based PET (https://doi.org/10.5281/zenodo.6320707) (Reyniers et al., 2022a). Python code for the computations and analyses is available from the corresponding author upon reasonable request. The CHESS-PE data used in this study were obtained from the UK Centre for Ecology and Hydrology (CEH) Environmental Information Data Centre (https://doi.org/10.5285/9116e565-2c0a-455b-9c68-558fdd9179ad) (Robinson et al., 2020). HadUK-Grid data (https://doi.org/10.5285/d134335808894b2bb249e9f222e2eca8) (Met Office et al., 2019) and the raw UKCP18 RCM simulations (https://catalogue.ceda.ac.uk/uuid/589211abeb844070a95d061c8cc7f604) (Met Office Hadley Centre, 2018) were obtained from the Centre for Environmental Data Analysis.
The supplement related to this article is available online at: https://doi.org/10.5194/hess-27-1151-2023-supplement.
All co-authors were involved in designing the study. NR carried out the research; NR wrote the manuscript and designed the visualisations, with input from TJO and NA; and all co-authors provided helpful feedback on the manuscript and approved its final version.
The contact author has declared that none of the authors has any competing interests.
Publisher’s note: Copernicus Publications remains neutral with regard to jurisdictional claims in published maps and institutional affiliations.
Nele Reyniers is funded on a basis by Anglian Water Ltd. and the University of East Anglia. The authors would also like to acknowledge the data made available by the Met Office (UKCP18, Had-UK Grid) and CEH (CHESS-PE). Moreover, the authors are grateful to Marie-Claire ten Veldhuis and one anonymous reviewer for their time and helpful comments, which led to significant improvements to the manuscript, and to Nicole Forstenhäusler for the use of her visualisation of the precipitation biases shown in Fig. S1.
This research has been supported by the Anglian Water Ltd. (grant no. R207645) and the University of East Anglia (grant no. 100295261RA1).
This paper was edited by Adriaan J. (Ryan) Teuling and reviewed by Marie-Claire ten Veldhuis and one anonymous referee.
Allen, R. G., Pereira, L. S., Raes, D., and Smith, M.: Crop evapotranspiration-Guidelines for computing crop water requirements, FAO Irrigation and drainage paper 56, Food and Agricultural Organisation of the United Nations (FAO), Rome, 300 pp., D05109, ISBN 92-5-104219-5, 1998. a
Arnell, N. and Freeman, A.: The effect of climate change on agro-climatic indicators in the UK, Climatic Change, 165, 1–26, https://doi.org/10.1007/s10584-021-03054-8, 2021. a, b, c
Bachmair, S., Svensson, C., Hannaford, J., Barker, L. J., and Stahl, K.: A quantitative analysis to objectively appraise drought indicators and model drought impacts, Hydrol. Earth Syst. Sci., 20, 2589–2609, https://doi.org/10.5194/hess-20-2589-2016, 2016. a, b, c
Bachmair, S., Tanguy, M., Hannaford, J., and Stahl, K.: How well do meteorological indicators represent agricultural and forest drought across Europe?, Environ. Res. Lett., 13, 034042, https://doi.org/10.1088/1748-9326/aaafda, 2018. a
Barker, L. J., Hannaford, J., Chiverton, A., and Svensson, C.: From meteorological to hydrological drought using standardised indicators, Hydrol. Earth Syst. Sci., 20, 2483–2505, https://doi.org/10.5194/hess-20-2483-2016, 2016. a, b, c, d
Berg, A. and Sheffield, J.: Climate Change and Drought: The Soil Moisture Perspective, Current Climate Change Reports, 4, 180–191, https://doi.org/10.1007/s40641-018-0095-0, 2018. a
Blauhut, V., Stahl, K., Stagge, J. H., Tallaksen, L. M., De Stefano, L., and Vogt, J.: Estimating drought risk across Europe from reported drought impacts, drought indices, and vulnerability factors, Hydrol. Earth Syst. Sci., 20, 2779–2800, https://doi.org/10.5194/hess-20-2779-2016, 2016. a
Blenkinsop, S. and Fowler, H. J.: Changes in Drought Frequency, Severity and Duration for the British Isles Projected by the PRUDENCE Regional Climate Models, J. Hydrol., 342, 50–71, https://doi.org/10.1016/j.jhydrol.2007.05.003, 2007. a
Bloomfield, J. P., Marchant, B. P., and McKenzie, A. A.: Changes in groundwater drought associated with anthropogenic warming, Hydrol. Earth Syst. Sci., 23, 1393–1408, https://doi.org/10.5194/hess-23-1393-2019, 2019. a, b, c
Blyth, E. M., Martínez-de la Torre, A., and Robinson, E. L.: Trends in Evapotranspiration and Its Drivers in Great Britain: 1961 to 2015, Prog. Phys. Geog., 43, 666–693, https://doi.org/10.1177/0309133319841891, 2019. a, b
Ceppi, P., Zappa, G., Shepherd, T. G., and Gregory, J. M.: Fast and slow components of the extratropical atmospheric circulation response to CO2 forcing, J. Climate, 31, 1091–1105, https://doi.org/10.1175/JCLI-D-17-0323.1, 2018. a
Chiang, F., Mazdiyasni, O., and AghaKouchak, A.: Evidence of anthropogenic impacts on global drought frequency, duration, and intensity, Nat. Commun., 12, 1–10, https://doi.org/10.1038/s41467-021-22314-w, 2021. a, b
Cook, B. I., Smerdon, J. E., Seager, R., and Coats, S.: Global Warming and 21st Century Drying, Clim. Dynam., 43, 2607–2627, https://doi.org/10.1007/s00382-014-2075-y, 2014. a
Dai, A.: Drought under Global Warming: A Review, WIRES Clim Change, 2, 45–65, https://doi.org/10.1002/wcc.81, 2011. a
Denissen, J., Teuling, A., Pitman, A., Koirala, S., Migliavacca, M., Li, W., Reichstein, M., Winkler, A., Zhan, C., and Orth, R.: Widespread Shift from Ecosystem Energy to Water Limitation with Climate Change, Nat. Clim. Change, 12, 677–684, https://doi.org/10.1038/s41558-022-01403-8, 2022. a
Dewes, C. F., Rangwala, I., Barsugli, J. J., Hobbins, M. T., and Kumar, S.: Drought Risk Assessment under Climate Change Is Sensitive to Methodological Choices for the Estimation of Evaporative Demand, PLOS ONE, 12, e0174045, https://doi.org/10.1371/journal.pone.0174045, 2017. a, b
Feng, S. and Fu, Q.: Expansion of global drylands under a warming climate, Atmos. Chem. Phys., 13, 10081–10094, https://doi.org/10.5194/acp-13-10081-2013, 2013. a
Feng, S., Trnka, M., Hayes, M., and Zhang, Y.: Why Do Different Drought Indices Show Distinct Future Drought Risk Outcomes in the U.S. Great Plains?, J. Climate, 30, 265–278, https://doi.org/10.1175/JCLI-D-15-0590.1, 2017. a, b
Folland, C. K., Hannaford, J., Bloomfield, J. P., Kendon, M., Svensson, C., Marchant, B. P., Prior, J., and Wallace, E.: Multi-annual droughts in the English Lowlands: a review of their characteristics and climate drivers in the winter half-year, Hydrol. Earth Syst. Sci., 19, 2353–2375, https://doi.org/10.5194/hess-19-2353-2015, 2015. a
Fu, Q. and Feng, S.: Responses of Terrestrial Aridity to Global Warming, J. Geophys. Res.-Atmos., 119, 7863–7875, https://doi.org/10.1002/2014JD021608, 2014. a
Gampe, D., Zscheischler, J., Reichstein, M., O’Sullivan, M., Smith, W. K., Sitch, S., and Buermann, W.: Increasing impact of warm droughts on northern ecosystem productivity over recent decades, Nat. Clim. Change, 11, 772–779, https://doi.org/10.1038/s41558-021-01112-8, 2021. a, b
García-Valdecasas Ojeda, M., Gámiz-Fortis, S. R., Romero-Jiménez, E., Rosa-Cánovas, J. J., Yeste, P., Castro-Díez, Y., and Esteban-Parra, M. J.: Projected changes in the Iberian Peninsula drought characteristics, Sci. Total Environ., 757, 143702, https://doi.org/10.1016/j.scitotenv.2020.143702, 2021. a, b
Gohar, L., Bernie, D., Good, P., and Lowe, J. A.: UKCP18 Derived Projections of Future Climate over the UK, Met Office Hadley Centre, Exeter, UK, 2018. a
Greve, P., Roderick, M. L., Ukkola, A. M., and Wada, Y.: The Aridity Index under Global Warming, Environ. Res. Lett., 14, 124006, https://doi.org/10.1088/1748-9326/ab5046, 2019. a, b, c
Grossiord, C., Buckley, T. N., Cernusak, L. A., Novick, K. A., Poulter, B., Siegwolf, R. T. W., Sperry, J. S., and McDowell, N. G.: Plant Responses to Rising Vapor Pressure Deficit, New Phytol., 226, 1550–1566, https://doi.org/10.1111/nph.16485, 2020. a, b
Hanlon, H. M., Bernie, D., Carigi, G., and Lowe, J. A.: Future Changes to High Impact Weather in the UK, Climatic Change, 166, 50, https://doi.org/10.1007/s10584-021-03100-5, 2021. a, b, c, d
Haro-Monteagudo, D., Daccache, A., and Knox, J.: Exploring the utility of drought indicators to assess climate risks to agricultural productivity in a humid climate, Hydrol. Res., 49, 539–551, https://doi.org/10.2166/nh.2017.010, 2018. a, b
Hollis, D., McCarthy, M., Kendon, M., Legg, T., and Simpson, I.: HadUK-Grid – A new UK dataset of gridded climate observations, Geosci Data J, 6, 151–159, https://doi.org/10.1002/gdj3.78, 2019. a
Ionita, M. and Nagavciuc, V.: Changes in drought features at the European level over the last 120 years, Nat. Hazards Earth Syst. Sci., 21, 1685–1701, https://doi.org/10.5194/nhess-21-1685-2021, 2021. a, b
Karimi, M., Vicente-Serrano, S. M., Reig, F., Shahedi, K., Raziei, T., and Miryaghoubzadeh, M.: Recent trends in atmospheric evaporative demand in Southwest Iran: implications for change in drought severity, Theor. Appl. Climatol., 142, 945–958, https://doi.org/10.1007/s00704-020-03349-3, 2020. a
Kay, A. L., Bell, V. A., Blyth, E. M., Crooks, S. M., Davies, H. N., and Reynard, N. S.: A Hydrological Perspective on Evaporation: Historical Trends and Future Projections in Britain, J. Water Clim. Change, 4, 193–208, https://doi.org/10.2166/wcc.2013.014, 2013. a, b
Kay, A. L., Lane, R. A., and Bell, V. A.: Grid-Based Simulation of Soil Moisture in the UK: Future Changes in Extremes and Wetting and Drying Dates, Environ. Res. Lett., 17, 074029, https://doi.org/10.1088/1748-9326/ac7a4e, 2022. a
Kendon, M., Marsh, T., and Parry, S.: The 2010–2012 Drought in England and Wales, Weather, 68, 88–95, https://doi.org/10.1002/wea.2101, 2013. a
Keyantash, J. and Dracup, J. A.: The Quantification of Drought: An Evaluation of Drought Indices, B. Am. Meteorol. Soc., 83, 1167–1180, https://doi.org/10.1175/1520-0477-83.8.1167, 2002. a
Lane, R. A. and Kay, A. L.: Climate Change Impact on the Magnitude and Timing of Hydrological Extremes Across Great Britain, Frontiers in Water, 3, 684982, https://doi.org/10.3389/frwa.2021.684982, 2021. a
Lange, S.: Trend-preserving bias adjustment and statistical downscaling with ISIMIP3BASD (v1.0), Geosci. Model Dev., 12, 3055–3070, https://doi.org/10.5194/gmd-12-3055-2019, 2019. a
Lange, S.: ISIMIP3BASD (2.4.1.), Zenodo [code], https://doi.org/10.5281/zenodo.3898426, 2020. a
Lee, M.-H., Im, E.-S., and Bae, D.-H.: A Comparative Assessment of Climate Change Impacts on Drought over Korea Based on Multiple Climate Projections and Multiple Drought Indices, Clim. Dynam., 53, 389–404, https://doi.org/10.1007/s00382-018-4588-2, 2019. a
Lehner, F., Coats, S., Stocker, T. F., Pendergrass, A. G., Sanderson, B. M., Raible, C. C., and Smerdon, J. E.: Projected Drought Risk in 1.5 ∘C and 2 ∘C Warmer Climates, Geophys. Res. Lett., 44, 7419–7428, https://doi.org/10.1002/2017GL074117, 2017. a
Lloyd-Hughes, B.: The Impracticality of a Universal Drought Definition, Theor. Appl. Climatol., 117, 607–611, https://doi.org/10.1007/s00704-013-1025-7, 2014. a
Manning, C., Widmann, M., Bevacqua, E., Loon, A. F. V., Maraun, D., and Vrac, M.: Soil Moisture Drought in Europe: A Compound Event of Precipitation and Potential Evapotranspiration on Multiple Time Scales, J. Hydrometeorol., 19, 1255–1271, https://doi.org/10.1175/JHM-D-18-0017.1, 2018. a, b, c
Marsh, T., Cole, G., and Wilby, R.: Major Droughts in England and Wales, 1800–2006, Weather, 62, 87–93, https://doi.org/10.1002/wea.67, 2007. a
Massari, C., Avanzi, F., Bruno, G., Gabellani, S., Penna, D., and Camici, S.: Evaporation enhancement drives the European water-budget deficit during multi-year droughts, Hydrol. Earth Syst. Sci., 26, 1527–1543, https://doi.org/10.5194/hess-26-1527-2022, 2022. a, b, c
McKee, T. B., Doesken, N. J., and Kleist, J.: The relationship of drought frequency and duration to time scales, in: Proceedings of the 8th Conference on Applied Climatology, vol. 17, 179–183, Boston, 1993. a, b
Met Office, Hollis, D., McCarthy, M., Kendon, M., Legg, T., and Simpson, I.: HadUK-Grid Gridded Climate Observations on a 1 km grid over the UK, v1.0.1.0 (1862–2018), Centre for Environmental Data Analysis [data set], https://doi.org/10.5285/d134335808894b2bb249e9f222e2eca8, 2019. a
Met Office Hadley Centre: UKCP18 Regional Projections on a 12 km Grid over the UK for 1980–2080, [data set], https://catalogue.ceda.ac.uk/uuid/589211abeb844070a95d061c8cc7f604 (last access: 21 April 2020), 2018. a, b
Milly, P. C. D. and Dunne, K. A.: Potential Evapotranspiration and Continental Drying, Nat. Clim. Change, 6, 946–949, https://doi.org/10.1038/nclimate3046, 2016. a, b
Miralles, D. G., Gentine, P., Seneviratne, S. I., and Teuling, A. J.: Land–Atmospheric Feedbacks during Droughts and Heatwaves: State of the Science and Current Challenges, Ann. NY Acad. Sci., 1436, 19–35, https://doi.org/10.1111/nyas.13912, 2019. a
Murphy, J. M., Harris, G. R., Sexton, D. M. H., Kendon, E. J., Bett, P. E., Clark, R. T., Eagle, K. E., Fosser, G., Fung, F., Lowe, J. A., McDonald, R. E., McInnes, R. N., McSweeney, C. F., Mitchell, J. F. B., Rostron, J. W., Thornton, H. E., Tucker, S., and Yamazaki, K.: UKCP18 Land Projections: Science Report, Met Office, 2018. a, b, c, d, e
Parsons, D. J., Rey, D., Tanguy, M., and Holman, I. P.: Regional variations in the link between drought indices and reported agricultural impacts of drought, Agr. Syst., 173, 119–129, https://doi.org/10.1016/j.agsy.2019.02.015, 2019. a, b, c, d, e
Pendergrass, A. G., Meehl, G. A., Pulwarty, R., Hobbins, M., Hoell, A., AghaKouchak, A., Bonfils, C. J. W., Gallant, A. J. E., Hoerling, M., Hoffmann, D., Kaatz, L., Lehner, F., Llewellyn, D., Mote, P., Neale, R. B., Overpeck, J. T., Sheffield, A., Stahl, K., Svoboda, M., Wheeler, M. C., Wood, A. W., and Woodhouse, C. A.: Flash Droughts Present a New Challenge for Subseasonal-to-Seasonal Prediction, Nat. Clim. Change, 10, 191–199, https://doi.org/10.1038/s41558-020-0709-0, 2020. a
Phillips, I. D. and McGregor, G. R.: The Utility of a Drought Index for Assessing the Drought Hazard in Devon and Cornwall, South West England, Meteorol. Appl., 5, 359–372, https://doi.org/10.1017/S1350482798000899, 1998. a
Pirret, J., Fung, F., Lowe, J., McInnes, R., Mitchell, J., and Murphy, J.: UKCP Factsheet: Soil Moisture, Met Office, 2020. a, b
Rahiz, M. and New, M.: 21st Century Drought Scenarios for the UK, Water Resour. Manag., 27, 1039–1061, https://doi.org/10.1007/s11269-012-0183-1, 2013. a, b, c, d
Reyniers, N., Osborn, T., Addor, N., and Darch, G.: Projected changes in droughts and extreme droughts in Great Britain are strongly influenced by the choice of drought index: UKCP18-based bias adjusted potential evapotranspiration, Zenodo [data set], https://doi.org/10.5281/zenodo.6320707, 2022a. a
Reyniers, N., Osborn, T., Addor, N., and Darch, G.: Projected changes in droughts and extreme droughts in Great Britain are strongly influenced by the choice of drought index: UKCP18-based SPI and SPEI data, Zenodo [data set], https://doi.org/10.5281/zenodo.6123020, 2022b. a
Richards, J.: A simple expression for the saturation vapour pressure of water in the range −50 to 140∘ C, J. Phys. D Appl. Phys., 4, L15, https://doi.org/10.1088/0022-3727/4/4/101, 1971. a
Robinson, E., Blyth, E., Clark, D., Comyn-Platt, E., and Rudd, A.: Climate hydrology and ecology research support system potential evapotranspiration dataset for Great Britain (1961–2017) [CHESS-PE], NERC Environmental Information Data Centre [data set], https://doi.org/10.5285/9116e565-2c0a-455b-9c68-558fdd9179ad, 2020. a, b
Robinson, E. L., Blyth, E. M., Clark, D. B., Finch, J., and Rudd, A. C.: Trends in atmospheric evaporative demand in Great Britain using high-resolution meteorological data, Hydrol. Earth Syst. Sci., 21, 1189–1224, https://doi.org/10.5194/hess-21-1189-2017, 2017. a, b, c, d, e
Robinson, E. L., Brown, M. J., Kay, A. L., Lane, R. A., Chapman, R., Bell, V. A., and Blyth, E. M.: Hydro-PE: gridded datasets of historical and future Penman-Monteith potential evaporation for the United Kingdom, Earth Syst. Sci. Data Discuss. [preprint], https://doi.org/10.5194/essd-2022-288, in review, 2022. a
Rodda, J. and March, T.: The 1975/76 Drought – a Contemporary and Retrospective View, Centre for Ecology & Hydrology, p. 58, http://nora.nerc.ac.uk/id/eprint/15011/1/CEH_1975-76_Drought_Report_Rodda_and_Marsh.pdf (last access: 30 January 2023), 2011. a
Satoh, Y., Shiogama, H., Hanasaki, N., Pokhrel, Y., Boulange, J. E. S., Burek, P., Gosling, S. N., Grillakis, M., Koutroulis, A., Müller Schmied, H., Thiery, W., and Yokohata, T.: A quantitative evaluation of the issue of drought definition: a source of disagreement in future drought assessments, Environ. Res. Lett., 16, 104001, https://doi.org/10.1088/1748-9326/ac2348, 2021. a, b
Scheff, J., Mankin, J. S., Coats, S., and Liu, H.: CO2-plant Effects Do Not Account for the Gap between Dryness Indices and Projected Dryness Impacts in CMIP6 or CMIP5, Environ. Res. Lett., 16, 034018, https://doi.org/10.1088/1748-9326/abd8fd, 2021. a, b
Schönbeck, L. C., Schuler, P., Lehmann, M. M., Mas, E., Mekarni, L., Pivovaroff, A. L., Turberg, P., and Grossiord, C.: Increasing Temperature and Vapour Pressure Deficit Lead to Hydraulic Damages in the Absence of Soil Drought, Plant, Cell Environ., 45, 3275–3289, https://doi.org/10.1111/pce.14425, 2022. a
Seneviratne, S. I.: Historical Drought Trends Revisited, Nature, 491, 338–339, https://doi.org/10.1038/491338a, 2012. a
Seneviratne, S. I., Lüthi, D., Litschi, M., and Schär, C.: Land–Atmosphere Coupling and Climate Change in Europe, Nature, 443, 205–209, https://doi.org/10.1038/nature05095, 2006. a
Seneviratne, S. I., Zhang, X., Adnan, M., Badi, W., Dereczynski, C., Di Luca, A., Ghosh, S., Iskandar, I., Kossin, J., Lewis, S., Otto, F., Pinto, I., Satoh, M., Vicente-Serrano, S. M., Wehner, M., and Zhou, B.: Weather and Climate Extreme Events in a Changing Climate, in: Climate Change 2021: The Physical Science Basis. Contribution of Working Group I to the Sixth Assessment Report of the Intergovernmental Panel on Climate Change, edited by: Masson-Delmotte, V., Zhai, P., Pirani, A., Connors, S. L., Péan, C., Berger, S., Caud, N., Chen, Y., Goldfarb, L., Gomis, M. I., Huang, M., Leitzell, K., Lonnoy, E., Matthews, J. B. R., Maycock, T. K., Waterfield, T., Yelekçi, O., Yu, R., and Zhou, B., Cambridge University Press, Cambridge, United Kingdom and New York, NY, USA, 1513–1766, https://doi.org/10.1017/9781009157896.013, 2021. a, b
Sheffield, J., Wood, E. F., and Roderick, M. L.: Little Change in Global Drought over the Past 60 Years, Nature, 491, 435–438, https://doi.org/10.1038/nature11575, 2012. a, b
Spinoni, J., Vogt, J. V., Naumann, G., Barbosa, P., and Dosio, A.: Will Drought Events Become More Frequent and Severe in Europe?, Int. J. Climatol., 38, 1718–1736, https://doi.org/10.1002/joc.5291, 2018. a, b, c
Stagge, J. H., Kohn, I., Tallaksen, L. M., and Stahl, K.: Modeling drought impact occurrence based on meteorological drought indices in Europe, J. Hydrol., 530, 37–50, https://doi.org/10.1016/j.jhydrol.2015.09.039, 2015a. a, b
Stagge, J. H., Tallaksen, L. M., Gudmundsson, L., Van Loon, A. F., and Stahl, K.: Candidate distributions for climatological drought indices (SPI and SPEI), Int. J. Climatol., 35, 4027–4040, https://doi.org/10.1002/joc.4267, 2015b. a, b, c
Stagge, J. H., Kingston, D. G., Tallaksen, L. M., and Hannah, D. M.: Observed drought indices show increasing divergence across Europe, Sci. Rep.-UK, 7, 1–10, https://doi.org/10.1038/s41598-017-14283-2, 2017. a, b, c, d
Sutanto, S. J. and Van Lanen, H. A. J.: Streamflow drought: implication of drought definitions and its application for drought forecasting, Hydrol. Earth Syst. Sci., 25, 3991–4023, https://doi.org/10.5194/hess-25-3991-2021, 2021. a
World Meteorological Organization and Global Water Partnership: Handbook of Drought Indicators and Indices (Svoboda, M. and Fuchs, B. A.), Integrated Drought Management Programme (IDMP), Integrated Drought Management Tools and Guidelines Series 2, Geneva, 45 pp., ISBN 978-92-63-11173-9 and 978-91-87823-24-4, 2016. a
Tanguy, M., Haslinger, K., Svensson, C., Parry, S., Barker, L. J., Hannaford, J., and Prudhomme, C.: Regional differences in spatiotemporal drought characteristics in Great Britain, Frontiers in Environmental Science, 9, 639649, https://doi.org/10.3389/fenvs.2021.639649, 2021. a
Teuling, A. J., Hirschi, M., Ohmura, A., Wild, M., Reichstein, M., Ciais, P., Buchmann, N., Ammann, C., Montagnani, L., Richardson, A. D., Wohlfahrt, G., and Seneviratne, S. I.: A Regional Perspective on Trends in Continental Evaporation, Geophys. Res. Lett., 36, L02404, https://doi.org/10.1029/2008GL036584, 2009. a
Teuling, A. J., Seneviratne, S. I., Stöckli, R., Reichstein, M., Moors, E., Ciais, P., Luyssaert, S., van den Hurk, B., Ammann, C., Bernhofer, C., Dellwik, E., Gianelle, D., Gielen, B., Grünwald, T., Klumpp, K., Montagnani, L., Moureaux, C., Sottocornola, M., and Wohlfahrt, G.: Contrasting Response of European Forest and Grassland Energy Exchange to Heatwaves, Nat. Geosci., 3, 722–727, https://doi.org/10.1038/ngeo950, 2010. a
Tomas-Burguera, M., Vicente-Serrano, S. M., Peña-Angulo, D., Domínguez-Castro, F., Noguera, I., and El Kenawy, A.: Global characterization of the varying responses of the standardized precipitation evapotranspiration index to atmospheric evaporative demand, J. Geophys. Res.-Atmos., 125, e2020JD033017, https://doi.org/10.1029/2020JD033017, 2020. a
Touma, D., Ashfaq, M., Nayak, M. A., Kao, S.-C., and Diffenbaugh, N. S.: A Multi-Model and Multi-Index Evaluation of Drought Characteristics in the 21st Century, J. Hydrol., 526, 196–207, https://doi.org/10.1016/j.jhydrol.2014.12.011, 2015. a, b
Turner, S., Barker, L. J., Hannaford, J., Muchan, K., Parry, S., and Sefton, C.: The 2018/2019 Drought in the UK: A Hydrological Appraisal, Weather, 76, 248–253, https://doi.org/10.1002/wea.4003, 2018. a
ukcp18 data: UKCP18 Spatial Files, GitHub [data set], https://github.com/ukcp-data/ukcp-spatial-files, last access: 12 October 2021. a
UNEP: World atlas of desertification, ISBN/ISSN: 0340555122, 1992. a
Vicente-Serrano, S. M., Beguería, S., and López-Moreno, J. I.: A Multiscalar Drought Index Sensitive to Global Warming: The Standardized Precipitation Evapotranspiration Index, J. Climate, 23, 1696–1718, https://doi.org/10.1175/2009JCLI2909.1, 2009. a
Vicente-Serrano, S. M., Van der Schrier, G., Beguería, S., Azorin-Molina, C., and Lopez-Moreno, J.-I.: Contribution of Precipitation and Reference Evapotranspiration to Drought Indices under Different Climates, J. Hydrol., 526, 42–54, https://doi.org/10.1016/j.jhydrol.2014.11.025, 2015. a
Vicente-Serrano, S. M., Peña-Gallardo, M., Hannaford, J., Murphy, C., Lorenzo-Lacruz, J., Dominguez-Castro, F., López-Moreno, J. I., Beguería, S., Noguera, I., Harrigan, S., and Vidal, J.-P.: Climate, Irrigation, and Land Cover Change Explain Streamflow Trends in Countries Bordering the Northeast Atlantic, Geophys. Res. Lett., 46, 10821–10833, https://doi.org/10.1029/2019GL084084, 2019. a
Vicente-Serrano, S. M., Domínguez-Castro, F., Murphy, C., Hannaford, J., Reig, F., Peña-Angulo, D., Tramblay, Y., Trigo, R. M., Mac Donald, N., Luna, M. Y., Mc Carthy, M., Van der Schrier, G., Turco, M., Camuffo, D., Noguera, I., García-Herrera, R., Becherini, F., Della Valle, A., Tomas-Burguera, M., and El Kenawy, A.: Long-Term Variability and Trends in Meteorological Droughts in Western Europe (1851–2018), Int. J. Climatol., 41, E690–E717, https://doi.org/10.1002/joc.6719, 2021. a, b
Vicente‐Serrano, S. M., McVicar, T. R., Miralles, D. G., Yang, Y., and Tomas‐Burguera, M.: Unraveling the Influence of Atmospheric Evaporative Demand on Drought and Its Response to Climate Change, WIRES Clim. Change, 11, e632, https://doi.org/10.1002/wcc.632, 2020. a, b, c
Vidal, J.-P. and Wade, S.: A Multimodel Assessment of Future Climatological Droughts in the United Kingdom, Int. J. Climatol., 29, 2056–2071, https://doi.org/10.1002/joc.1843, 2009. a
Wang, T., Tu, X., Singh, V. P., Chen, X., and Lin, K.: Global data assessment and analysis of drought characteristics based on CMIP6, J. Hydrol., 596, 126091, https://doi.org/10.1016/j.jhydrol.2021.126091, 2021. a
Watts, G., Battarbee, R. W., Bloomfield, J. P., Crossman, J., Daccache, A., Durance, I., Elliott, J. A., Garner, G., Hannaford, J., Hannah, D. M., Hess, T., Jackson, C. R., Kay, A. L., Kernan, M., Knox, J., Mackay, J., Monteith, D. T., Ormerod, S. J., Rance, J., Stuart, M. E., Wade, A. J., Wade, S. D., Weatherhead, K., Whitehead, P. G., and Wilby, R. L.: Climate Change and Water in the UK – Past Changes and Future Prospects, Prog. Phys. Geog., 39, 6–28, https://doi.org/10.1177/0309133314542957, 2015. a
Wilhite, D. A. and Glantz, M. H.: Understanding the Drought Phenomenon: The Role of Definitions, Water Int., 111–120, 1985. a
Yevjevich, V.: An Objective Approach to Definitions and Investigations of Continental Hydrologic Droughts, J. Hydrol., 7, 353, https://doi.org/10.1016/0022-1694(69)90110-3, 1967. a, b
Zhao, M., A, G., Liu, Y., and Konings, A. G.: Evapotranspiration Frequently Increases during Droughts, Nat. Clim. Change, 12, 1024–1030, https://doi.org/10.1038/s41558-022-01505-3, 2022. a, b, c