the Creative Commons Attribution 4.0 License.
the Creative Commons Attribution 4.0 License.
 | 07 Nov 2022
A large-sample investigation into uncertain climate change impacts on high flows across Great Britain
Gemma Coxon
Jim Freer
Jan Seibert
Thorsten Wagener
Climate change may significantly increase flood risk globally, but there are large uncertainties in both future climatic changes and how these propagate into changing river flows. Here, the impact of climate change on the magnitude and frequency of high flows is analysed for Great Britain (GB) to provide the first spatially consistent GB projections to include both climate ensembles and hydrological model parameter uncertainties. We use the latest high-resolution (12 km) regional climate model ensemble from the UK Climate Projections (UKCP18). These projections are based on a perturbed-physics ensemble of 12 regional climate model simulations and allow exploration of climate model uncertainty beyond the variability caused by the use of different models. We model 346 larger (>144 km2) catchments across GB using the DECIPHeR hydrological modelling framework. Generally, results indicated an increase in the magnitude and frequency of high flows (Q10, Q1, and annual maximum) along the western coast of GB in the future (2050–2075), with increases in annual maximum flows of up to 65 % for western Scotland. In contrast, median flows (Q50) were projected to decrease across GB. Even when using an ensemble based on a single regional climate model (RCM) structure, all flow projections contained large uncertainties. While the RCM parameters were the largest source of uncertainty overall, hydrological modelling uncertainties were considerable in eastern and south-eastern England. Regional variations in flow projections were found to relate to (i) differences in climatic change and (ii) catchment conditions during the baseline period as characterised by the runoff coefficient (mean discharge divided by mean precipitation). Importantly, increased heavy-precipitation events (defined by an increase in 99th percentile precipitation) did not always result in increased flood flows for catchments with low runoff coefficients, highlighting the varying factors leading to changes in high flows. These results provide a national overview of climate change impacts on high flows across GB, which will inform climate change adaptation, and highlight the impact of hydrological model parameter uncertainties when modelling climate change impact on high flows.
- Article
(9815 KB) - Full-text XML
-
Supplement
(3872 KB) - BibTeX
- EndNote


Climate change will likely significantly alter hydrological regimes in many parts of the world, with vast implications for water resource planning and policy (Brown et al., 2015; IPCC, 2014; Wagener et al., 2010). Projections indicate an intensification of the hydrological cycle, with a warmer climate leading to more rain falling in high-intensity events (Eicker et al., 2016; Huntington, 2006; IPCC, 2014; Trenberth, 2011). This increase in the frequency and severity of extreme rainfall events is likely to increase flood risk in many regions. However, the conversion of rainfall to runoff is not straightforward, as changes in river flows result from complex and non-linear interactions between changing precipitation and evapotranspiration and the influence of basin properties (Arnell, 2011; Laizé and Hannah, 2010; Sawicz et al., 2014). There are also many uncertainties surrounding future climate projections. While climate models show general agreement on rising temperatures and increasing extreme precipitation throughout the 21st century, they differ in the magnitude and spatial patterns of change (Fowler and Ekström, 2009; Met Office, 2019; Nikulin et al., 2011). To guide water-related policy and decision making and to ensure adequate adaptation to future changes in flooding, we therefore need hydrological modelling studies to help understand and quantify climate change impacts on the hydrological regime and the uncertainties surrounding these projections (Reynard et al., 2017).
Hydrological climate change impact studies often use information from global climate models or regional climate models (e.g. rainfall and temperature projections) to drive hydrological models. Throughout this modelling chain there are many uncertainties, which cascade from one step through to another. These include uncertainties in global climate model (GCM) structure and sub-grid parameterisations, uncertainties in regional climate model (RCM) structure and parameterisations, uncertainties in the chosen downscaling and bias-correction techniques, and uncertainties in the selection of hydrological model structures and their parameters (Clark et al., 2016; Kundzewicz et al., 2018). Many studies have attempted to quantify the impact of these uncertainties by using multiple GCMs/RCMs, bias-correction techniques, hydrological model structures, and/or hydrological model parameter sets and propagating these uncertainties through the modelling chain. However, these studies are often focused on small catchment samples as the large numbers of simulations needed are computationally demanding (e.g. Bosshard et al., 2013; De Niel et al., 2019; Kay et al., 2009; Smith et al., 2014; Wilby and Harris, 2006). Studies generally agree that modelling of the future climate presents the largest source of uncertainty (Engin et al., 2017; Kay et al., 2009; Meresa and Romanowicz, 2017; De Niel et al., 2019). However, hydrological modelling uncertainties are not negligible. The relative contribution of hydrological modelling uncertainties to total uncertainty has been shown to vary depending on catchment characteristics (Addor et al., 2014) and for different aspects of the flow regime (Meresa and Romanowicz, 2017). Understanding and communicating modelling uncertainties has been widely recognised as important for informing robust decision making (Clark et al., 2016; Reynard et al., 2017).
Many water-related policy decisions are made at the regional to national scales. For example, England has a national flood and coastal erosion risk management strategy (Environment Agency, 2020b). To inform these regional to national policy decisions, hydrological modelling studies which apply a consistent methodology across a large domain/large sample of catchments are most valuable, as they (i) provide a broad overview of future changes, (ii) provide locally relevant information, in contrast to global impact studies, and (iii) enable direct comparison between catchments to identify regions that will experience the most significant climate change impacts (Watts et al., 2015). Using a large sample of catchments also ensures a more robust evaluation of the relationship between climate change impacts and hydrological response.
Over the last decade, large-scale studies evaluating climate change impacts on hydrology have emerged, facilitated by the increased availability of data and computational resources. For example, Köplin et al. (2014) evaluated the changing seasonality and magnitude of floods for 189 catchments covering Switzerland, Thober et al. (2018) modelled changing river floods across Europe, Wang et al. (2012) evaluated changing water resources using the distributed VIC model across China, and a national grid-based model has been applied to explore climate change impact on floods and droughts across Great Britain (Bell et al., 2007, 2016; Kay and Crooks, 2014; Lane and Kay, 2021; Rudd et al., 2019). While the use of a GCM/RCM ensemble to evaluate climate uncertainties has become increasingly common (e.g. Bell et al., 2016; Lane and Kay, 2021; Prudhomme et al., 2012; Rudd et al., 2019), the inclusion of hydrological model parameter uncertainties at the national scale is still rare. A notable exception is Christierson et al. (2012), who modelled the impact of changing climate for 70 catchments across the UK using two different hydrological model structures and ensembles of model parameters. However, this study was based on probabilistic climate projections which were not spatially coherent (i.e. projected variables were not consistent over space, and rainfall and precipitation products were not produced from the same simulation) and therefore did not present possible GB-wide changes but rather individual scenarios for each catchment. Incorporating hydrological model parameter uncertainties is important, as it has been shown that very different projections for future catchment behaviour can be provided by parameter sets with similar performance over a baseline period (Mendoza et al., 2015; Singh et al., 2014). However, there is still a lack of studies providing spatially coherent projections of future changes in flooding across national domains while including both RCM and hydrological parameter uncertainties, and no studies for Great Britain.
An updated set of national climate projections has recently been released for the UK, UKCP18 (Lowe et al., 2019; Murphy et al., 2018). These have advanced upon previously available national projections (UKCP09) through (1) increased resolution of the global climate model from ∼300 to ∼60 km, providing better representation of synoptic-scale weather systems, mountains, and coastlines, (2) increased resolution of the regional climate model from 25 to 12 km, which may improve the representation of extreme precipitation, (3) updated atmosphere model and improved parameterisations of many sub-grid-scale processes, and (4) improved representation of dynamical influences on regional climate variability such as improvements in predictions of the winter North Atlantic Oscillation (NAO) (Murphy et al., 2018). Preliminary analysis has shown that probabilistic projections produced as part of UKCP18 result in greater uncertainty ranges than the comparable UKCP09 projections (Kay et al., 2020). The UKCP18 projections include a perturbed physics ensemble of RCM projections at 12 km resolution, providing 12 possible climate futures varying due to RCM parameter uncertainties. The implications of these new climate simulations for river flows are of great interest, as the improved simulation of precipitation may improve projections of future flooding.
This paper aims to explore the impacts of climate change and hydrological model uncertainties on high flows using the new UKCP18 climate projections across GB. A climate–hydrological model cascade was employed, with output from a perturbed-physics ensemble of 12 regional climate model simulations. These ensemble members were used to drive a nationally applied hydrological model with 30 distributed parameter fields. The resulting 360 future flow scenarios were analysed to answer the following research questions:
-
What is the range in potential changes to median and higher flows (including median flows (Q50), high flow quantiles (Q10 and Q1), annual maximum flows (AMAX) and the number of peaks) across GB when including parameter uncertainties in climate and hydrological modelling?
-
How will changes in the magnitude and frequency of high flows vary spatially and by region?
-
How large is the hydrological variability resulting from different realisations of the same climate model structure?
-
What is the relationship between changing climate (precipitation and potential evapotranspiration) and high flow response, and how does this vary by region?
Our study presents the first consistent climate change projections for high flows across GB (i.e. using spatially coherent climate projections and spatially consistent hydrological model parameter fields) to include both climate model and hydrological model parameter uncertainties. The incorporation of a large sample of catchments also enabled robust and generalisable analysis of the relationship between climate forcing, catchment characteristics and hydrological response, which will be highly relevant to future studies in GB and elsewhere.
2.1 Overview
This paper uses a climate–hydrological modelling chain to assess the implications of the UKCP18 climate projections for river high flows across 346 catchments covering GB (see Sect. 2.2 for catchment selection). An ensemble of 12 spatially coherent RCM projections is first bias-corrected (see Sect. 2.3) and then used directly as inputs to the DECIPHeR hydrological modelling framework to produce flow projections (see Sect. 2.4). For each RCM ensemble member, DECIPHeR simulations are carried out using 30 nationally consistent hydrological model parameter fields (see Sect. 2.4). The use of 12 RCMs and 30 hydrological model parameter sets results in 360 national simulations, representing uncertainty due to RCM and hydrological model parameterisation.
To explore climate change impacts on high flows, flow metrics were selected to assess median flows (Q50), high flow quantiles (Q10 and Q1), the magnitude of peak flows (AMAX), and the frequency of peak flows (see Sect. 2.5). The skill of the climate–hydrological modelling chain was first evaluated relative to observed flow metrics, and then changes in flow metrics between the baseline (1985–2010) and future (2050–2075) periods were evaluated.
2.2 Catchment selection
A large sample of 346 catchments covering GB was selected for this study. This sample provides a dense coverage across GB, with catchments in all river basin districts, as shown in Fig. 1. Gauging stations were selected from the UK National River Flow Archive (NRFA) Service Level Agreement (SLA) Network (Centre for Ecology and Hydrology, 2016; Dixon et al., 2013). This network of 715 gauges forms a subset of strategically valuable NRFA catchments, where additional validation and quality testing procedures have been carried out (Dixon et al., 2013). As hydrometeorological data were available on 12 km grids at daily resolution, we chose to exclude catchments that were smaller than 144 km2 (i.e. one RCM grid), because for these small catchments local variation in precipitation could be problematic for the RCM ensemble scale, and for small flashy catchments sub-daily data would be required to capture high flow and peak responses effectively.
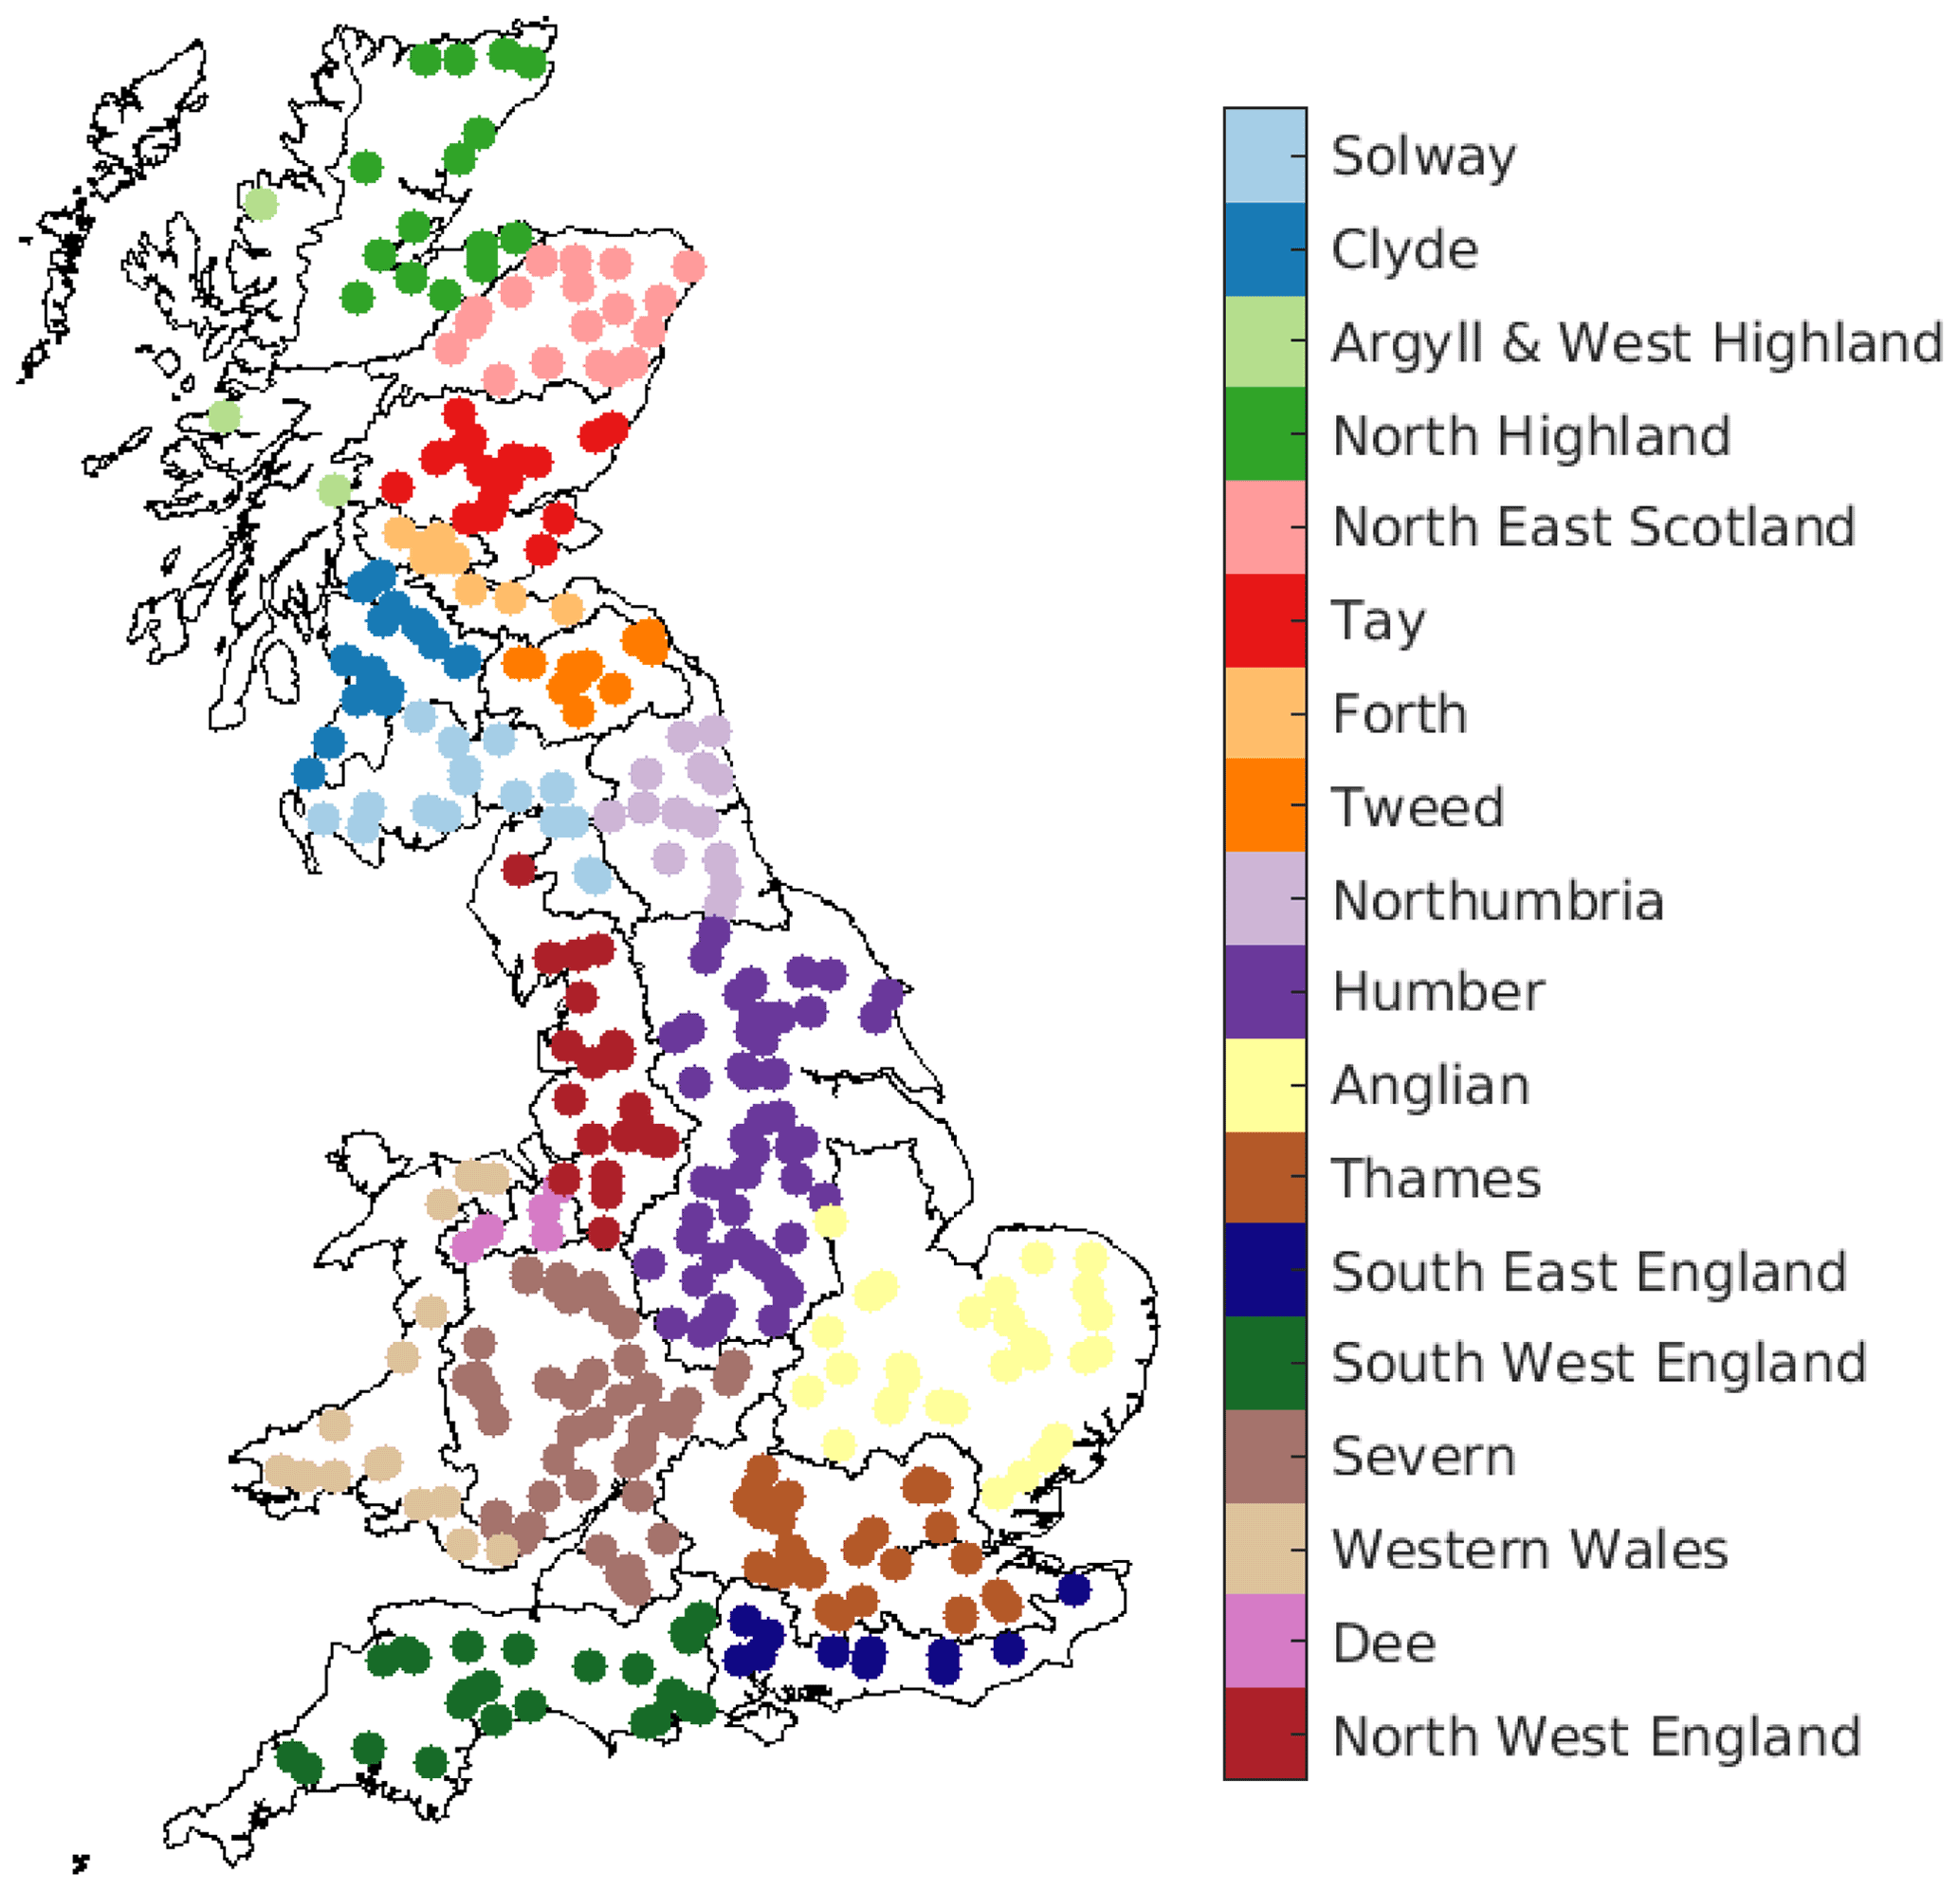
Figure 1Locations of the catchments used in this study, grouped according to the so-called “river basin districts”.
2.3 Climate model data
Climate scenarios representing changes in precipitation and potential evapotranspiration (PET) were derived from the UKCP18 regional climate projections (Murphy et al., 2018). These comprised a perturbed-physics ensemble of 12 regional climate model simulations, run at 12 km resolution with daily output from 1981 to 2080 (Met Office Hadley Centre, 2019). These projections were chosen because they have many advantages over other available products for UK impact assessments, including that (1) they were the highest-resolution (12 km) RCM climate model outputs available for a continuous run period over GB, (2) they were specifically developed for the UK and form the basis of UK climate policy (Murphy et al., 2018), (3) they included a measure of climate uncertainty through the use of an RCM ensemble, (4) they are UK-specific climate projection tools designed to help decision makers assess their risk exposure to climate and thus will for the first time inform important discussions on the uncertainty within climate impacts across GB, and (5) they were the newest national climate projections for GB, including the latest developments in climate modelling capability and scientific understanding, and therefore have not yet been comprehensively analysed in other impact studies. A key advantage of the RCM data over other UKCP18 products is that they have full spatial and temporal coherence and therefore allow for the assessment of interactions between changes in precipitation and PET and provide a nationally consistent picture of future changes (Met Office, 2020).
The 12 RCM projections were all driven by the same GCM (GC3.05), and only the RCP8.5 emissions scenario was provided. We considered this to be the most important emissions scenario to look at for two reasons: (1) it shows the “worst case” and so will most likely show the largest expected changes, and (2) the emissions in RCP8.5 are in close agreement with historical total cumulative CO2 emissions and are therefore increasingly looking like a plausible future up to 2100 (Schwalm et al., 2020). The GC3.05 GCM has been shown to sample the warmer range of global outcomes (Lowe et al., 2019), and so, combined with a single emissions scenario, it is important to note that we only sample the warmer range of possible climate outcomes.
While precipitation data were available as an RCM output variable, PET time series needed to be derived from other relevant UKCP18 model outputs. There are many possible approaches to calculating PET from climate model data, with the choice of PET equation shown to impact the subsequent changes in PET over time (Kay and Davies, 2008; Prudhomme and Williamson, 2013). Here, PET was calculated to be consistent with the CHESS-PE dataset used for hydrological model parameterisation (Robinson et al., 2020). The CHESS-PE dataset uses the Penman–Monteith equation, calculating PET as a function of air temperature, specific humidity, wind speed, shortwave radiation, longwave radiation, and air pressure. These variables were all available as UKCP18 output, apart from air pressure, which was calculated using the integral of the hypsometric equation with modelled temperature as an input (Shuttleworth, 2012).
Bias correction of climate model output data is often required for hydrological impact studies due to the occurrence of considerable biases in hydrologically relevant variables (Addor and Seibert, 2014; Cloke et al., 2013; Ning et al., 2012; Teutschbein and Seibert, 2012). An analysis of biases in the UKCP18 regional projections identified systematic biases in the model output precipitation and model-derived PET data (see Sect. S1 in the Supplement for more information). For precipitation, RCM biases included overpredictions of mean annual precipitation across GB by up to 50 %, underpredictions of rainfall in wetter areas along the western coast, and an increased number of wet days (an average of around 15 % more rainy days per year than observations). RCMs tend to overpredict the variance in PET, resulting in overestimations of PET in the south-east, where observed PET is high, and underestimations in Scotland as well as an incorrect seasonal variation with overestimations in summer (up to around + 40 %) and underestimations in winter (up to −100 %). A bias-correction method was required to reduce these biases in RCM precipitation and PET, so that they were suitable for hydrological modelling.
The choice of bias correction has been shown to impact the magnitude and spread of projected changes in flood-producing flows (Cloke et al., 2013; Smith et al., 2014) and should, therefore, be carefully considered. Techniques to directly adjust RCM simulations range from relatively simple linear scaling to more complex approaches such as quantile mapping (Teutschbein and Seibert, 2012). As well as correcting for the distribution of simulated precipitation, correcting for persistence attributes has been shown to be useful when considering the security of water resource systems (Johnson and Sharma, 2012). The delta change method, which modifies historical time series based on RCM-simulated changes, is commonly applied (e.g. Veijalainen et al., 2010). However, this method cannot change the temporal sequencing of events, so it cannot evaluate changes in flood timing. The quantile mapping bias-correction approach was selected here for both precipitation and PET (this method has also been referred to as distribution mapping, probability mapping, model output statistics, or histogram equalisation). The quantile mapping approach accounts for errors in the variability of PET and ensures that heavy precipitation events important for high flows were appropriately corrected as well as mean precipitation. It also corrected for biases in the number of wet days in the RCM data.
Observed precipitation and PET data used for bias correction came from the CEH-GEAR (Keller et al., 2015; Tanguy et al., 2014) and CHESS-PE (Robinson et al., 2020) datasets respectively. For each grid cell and month for precipitation, the following steps were performed.
-
Empirical cumulative distribution functions (CDFs) were calculated for the observed precipitation and RCM-simulated precipitation for the control/baseline period (all dates where observed and simulated precipitation was available).
-
The fractional difference between observed and simulated precipitation was calculated for each cumulative probability.
-
The whole simulated precipitation series was then bias-corrected. The cumulative probability of each precipitation value was calculated, and the value was modified by the fractional change for that cumulative probability.
The same method was carried out for PET, with a minor modification. It was found that, for some Scottish catchments, fractional changes could become very large when PET values were low (<0.1 mm d−1) as a result of dividing by values close to 0. To prevent unrealistic spikes in future PET at low cumulative probabilities, a check was added to ensure that PET values at a low cumulative probability were always smaller than values at a higher cumulative probability. This bias-correction methodology successfully reduced biases in RCM data over the observational period (see Sect. S1 in the Supplement for more information). However, it is important to note that bias correction assumes that (i) despite biases in hydrometeorological variables, the RCM output is still meaningful and changes in hydrometeorological variables are well simulated, (ii) biases in RCM output are stationary and so methods of bias-correcting baseline data also hold into the future, and (iii) the observed data used in bias correction are not erroneous. The quantile mapping bias-correction approach is also limited because there will be few observations to constrain the CDF at the extreme high end of observations (e.g. exceptionally heavy rainfall events), and therefore bias correction is likely to be less robust for the rarest events. Whilst potentially another interesting avenue of research in bias correction, namely wet/dry persistence bias, we decided not to pursue this analysis. Because we feel the matter is complex and requires a more dedicated paper on these issues and potential impacts, for example, Moon et al. (2019) showed more wet/dry persistence biases between observed gridded rainfall products than between those and climate model outputs.
The bias-corrected RCM data were used directly as hydrological model input, with no further downscaling. This was possible due to the size of the catchments we have chosen to analyse coupled with the high resolution (12 km) of the RCM data, which is a key advantage of the UKCP18 climate product over previous climate projections.
2.4 Hydrological modelling
The DECIPHeR hydrological modelling framework was selected to transform precipitation and PET into river flows (Coxon et al., 2019; Lane et al., 2021). DECIPHeR is a semi-distributed hydrological modelling framework which discretises the modelling domain into hydrological response units (HRUs). Here, the model was configured to be consistent with the 12 km UKCP18 data, with HRUs defined by splitting the landscape into 12 km input grids which were further sub-divided by three accumulated area classes, three slope classes and sub-catchment boundaries. This HRU definition aimed to capture topographic and catchment attribute controls in hydrological processes. The HRU-based approach enabled representation of the spatial variation of input time series while being computationally efficient to facilitate the use of multiple hydrological and RCM parameter sets across the large sample of catchments. In contrast to a gridded approach, it meant that the model runs at much higher resolution for critical areas (where there are large variations in slope/accumulated area or at sub-catchment boundaries). Here, we have selected the default model structure, which is based on the widely used TOPMODEL and has previously been shown to perform well across GB and selected catchments (Coxon et al., 2019; Lane et al., 2021). This model structure does not include a snow module, as snow processes were assumed not to substantially impact many GB catchments (95 % of the catchments included in this study have less than 6 % of precipitation falling as snow).
National fields of model parameters have been generated using the multi-scale parameter regionalisation technique (Samaniego et al., 2010), as described in Lane et al. (2021). This method relates model parameters to spatial catchment attribute data (including soil texture, land use, and hydrogeology) via transfer functions. The coefficients of the transfer functions were then constrained simultaneously on a large sample of 437 British catchments instead of directly constraining model parameters. Model parameters were calibrated over the period January 1991 to December 2000 and then evaluated over the period January 2001 to December 2010. Over 3500 possible parameter fields were produced, and of these, the top 30 parameter fields were selected for this study to explore the uncertainty due to model parameter selection. These parameter fields were selected as they produced non-parametric KGE scores (Pool et al., 2018) above 0.8 when taking the average value across the large sample of catchments in GB (Lane et al., 2021). Using catchment attribute data to define the spatial distribution of model parameters means that parameter fields are spatially coherent with no artificial discontinuities (Mizukami et al., 2017; Samaniego et al., 2017). This is advantageous when modelling climate impacts for larger regions or entire countries, as it has been shown that artificial discontinuities in parameter fields can lead to discontinuities in modelled variables (Mizukami et al., 2017).
The DECIPHeR framework requires inputs of precipitation and PET as well as spatial catchment attribute data for parameterisation. The model was driven continuously with climate data over the period 1 January 1981 to 30 December 2075, with 1 September 1985 to 30 August 2010 extracted as the baseline period and 1 September 2050 to 30 August 2075 being used as the future period in all further analysis. These 25-year baseline and future periods were selected to allow the maximum distance between the baseline and future. The choice to start the baseline period in 1985 was due to the need for a long hydrological model spin-up period (1981–1985), which is required for some catchments in the south-east of England. Hydrological simulations were also carried out using observed data over the period 1 January 1981 to 30 August 2010 to provide a benchmark of model performance which the RCM-driven simulations could be compared against over the baseline. For these simulations, potential evapotranspiration data from the CHESS-PE dataset (Robinson et al., 2020) and precipitation data from CEH-GEAR (Keller et al., 2015) were re-gridded to match the UKCP18 12 km data. All observed river flow data were from the UK National River Flow Archive (NRFA) (Centre for Ecology and Hydrology, 2016).
2.5 Hydrological indicators
To explore changes in the magnitude of high flows, we calculated the percentage changes in four different flow metrics between the baseline (1985–2010) and future (2050–2075) periods. Flow metrics calculated were (1) the AMAX flow, (2) Q1, the flow value exceeded 1 % of the time, (3) Q10, the flow value exceeded 10 % of the time, and (4) Q50, the median flow or flow value exceeded 50 % of the time. These were selected to give a broad overview of future higher flow changes, ranging from flood flows (AMAX and Q1) to median flows (Q50).
To analyse changes in the frequency of high flows, a peaks-over-threshold (POT) analysis was carried out. Thresholds were defined for each catchment to extract an average of three peaks per year over the baseline period. To ensure flood events were independent, no peak was selected within 7 d of a larger peak. This selection was consistent with previous studies: for example, Svensson et al. (2005) used a 5 d window for catchments smaller than 45 000 km2 (the largest catchments in the UK are ∼10 000 km2), while Petrow and Merz (2009) used 10 d for catchments across Germany. Having found a POT threshold for each catchment over the baseline that resulted in an average of three peaks per year, the number of peaks exceeding this threshold in the future period was counted. The percentage change between the count of 75 peaks in total gained in the baseline and peaks gained in the future was then calculated as an indication of changes in the frequency of flood events.
3.1 Meteorological changes
Median precipitation is projected to decrease almost everywhere. GB-average median precipitation is projected to decrease by 31 %–61 % between the different RCMs, with the only exception being in western Scotland (Fig. 2a). This decreasing median precipitation contrasts with very high precipitation (99th percentile), which is expected to increase across most of GB, by an average of 5 %–20 %. The 90th percentile precipitation shows a more mixed picture, with GB-average changes of −9 % to +6 %. Generally, increases were simulated for areas along the western coast and in western Scotland, while decreases can be seen across southern England and Wales.
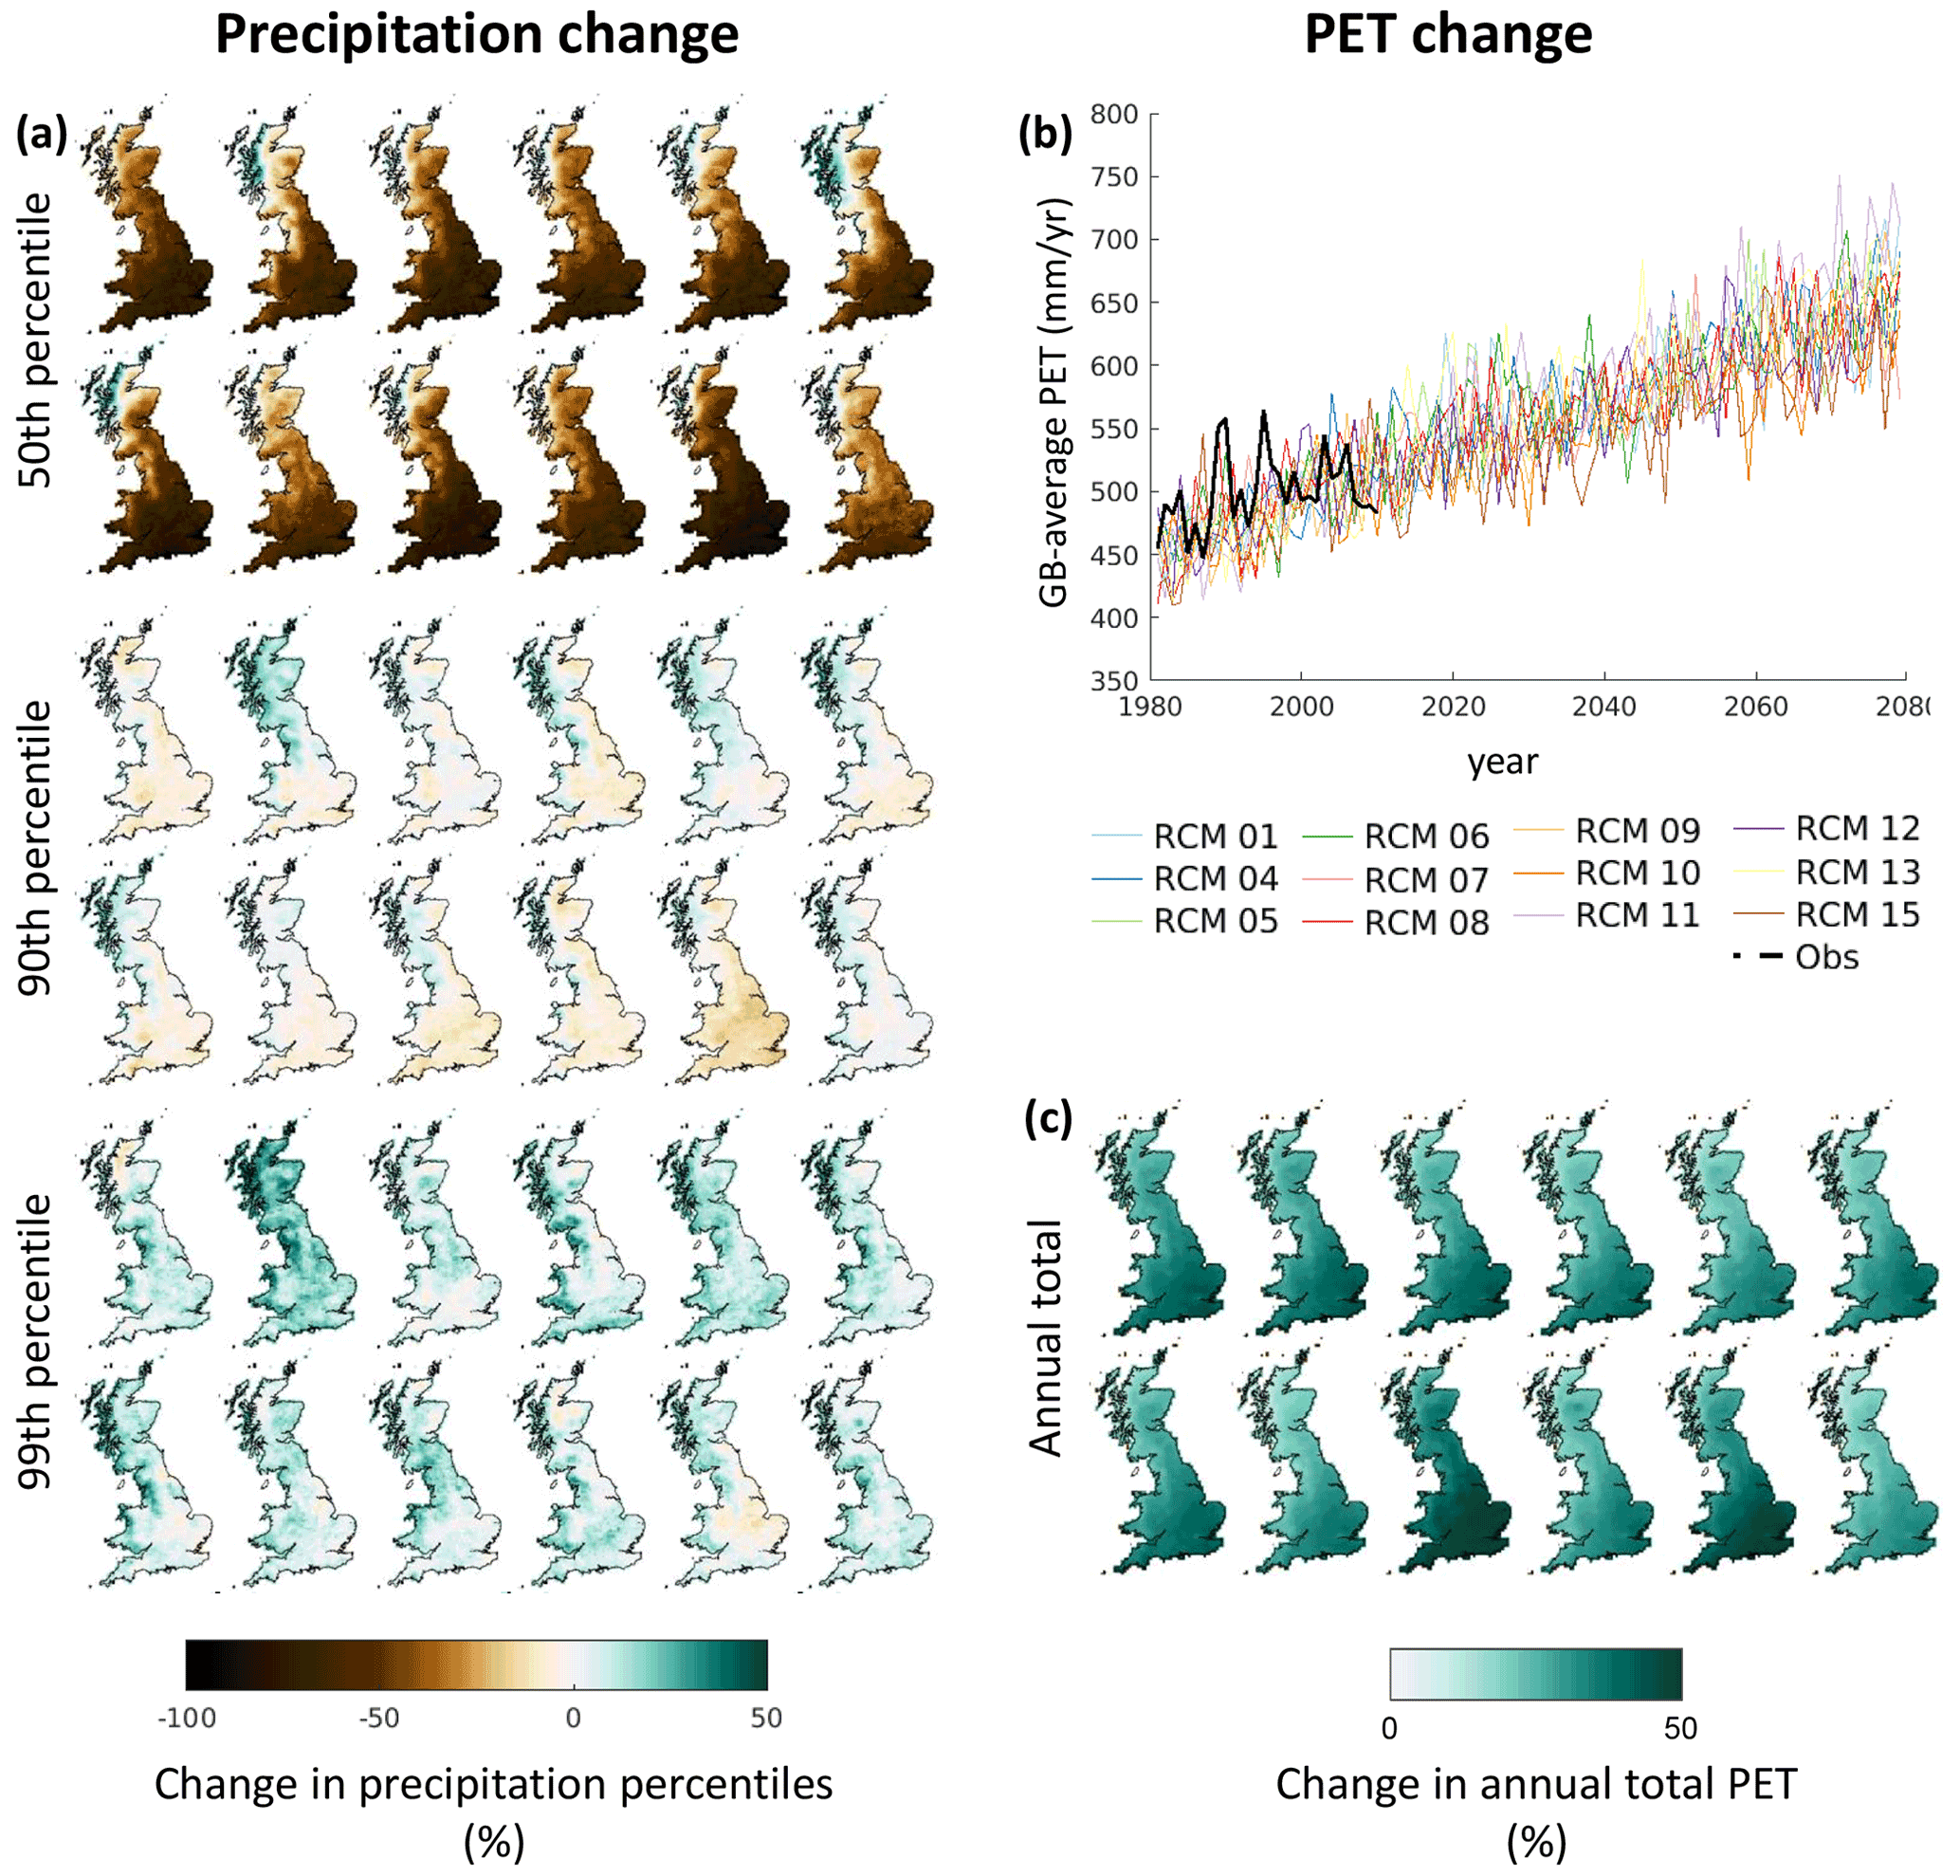
Figure 2Precipitation (a) and PET (b, c) change. GB maps are presented for each ensemble member in order. Top row: RCM01, RCM04, RCM05, RCM06, RCM07, RCM08; bottom row: RCM09, RCM10, RCM11, RCM12, RCM13, RCM15.
All RCMs indicate increasing PET over the modelled period (Fig. 2b, c). These broadly align with observed PET across GB between 1980 and 2010, although it is difficult to distinguish an upward trend in the observed PET data over such a short period. GB-average PET values show increases of 23 %–38 % between the baseline and future period, with the largest PET increases (33 %–50 %) seen in the south and the smallest PET increases (11 %–19 %) simulated for north-western Scotland. Note that these increases in PET are likely linked to the fact that the UKCP18 projections sample the warmer range of possible climate outcomes (Lowe et al., 2019).
3.2 Evaluation of the climate–hydrological modelling chain
Overall, the simulations of the climate–hydrological modelling chain across GB bounded the observations (Fig. 3). Our evaluation focused on the performance for hydrological indicators relevant for higher flows, namely flow quantiles Q50, Q10, and Q1 and AMAX flows. Catchments where storage reservoirs and regulated flow regimes impacted runoff were removed for the model performance evaluation, as these processes are not included in the model, meaning any errors in these catchments would not be due to the driving data. However, the presence of reservoirs was not found to lead to a reduction in model performance (see Sect. S2 in the Supplement). The maps in Fig. 3a show biases in the highest (i.e. wettest) and lowest (i.e. driest) simulations for each individual catchment from the ensemble of 12 RCMs and 30 hydrological model parameter sets compared to observed flows. For catchments which are well represented by the modelling chain, we would expect simulated flows to bound the observations. Therefore the highest simulation would show a small positive bias, and the lowest simulation would show a small negative bias. For the majority of catchments (75 % for Q50, 64 % for Q10 and 65 % for Q1) the model simulations bound observed discharge. The model tends to underestimate AMAX flows in north-western England and Wales and overestimate them in the south-east, with only 47 % of simulations bounding the observed AMAX. For at least 70 % of catchments, median biases are less than 30 % for Q50, Q10 and Q1 and less than 36 % for AMAX flows. However, the modelling chain overestimated flows in the south-east across all high flow metrics. The difficulties in modelling catchments in south-eastern England have been documented in previous studies (Coxon et al., 2019; Lane et al., 2019; Seibert et al., 2018) and are likely due to complex aquifer systems facilitating inter-catchment groundwater flow. These catchments should, therefore, be treated with caution when interpreting the results.
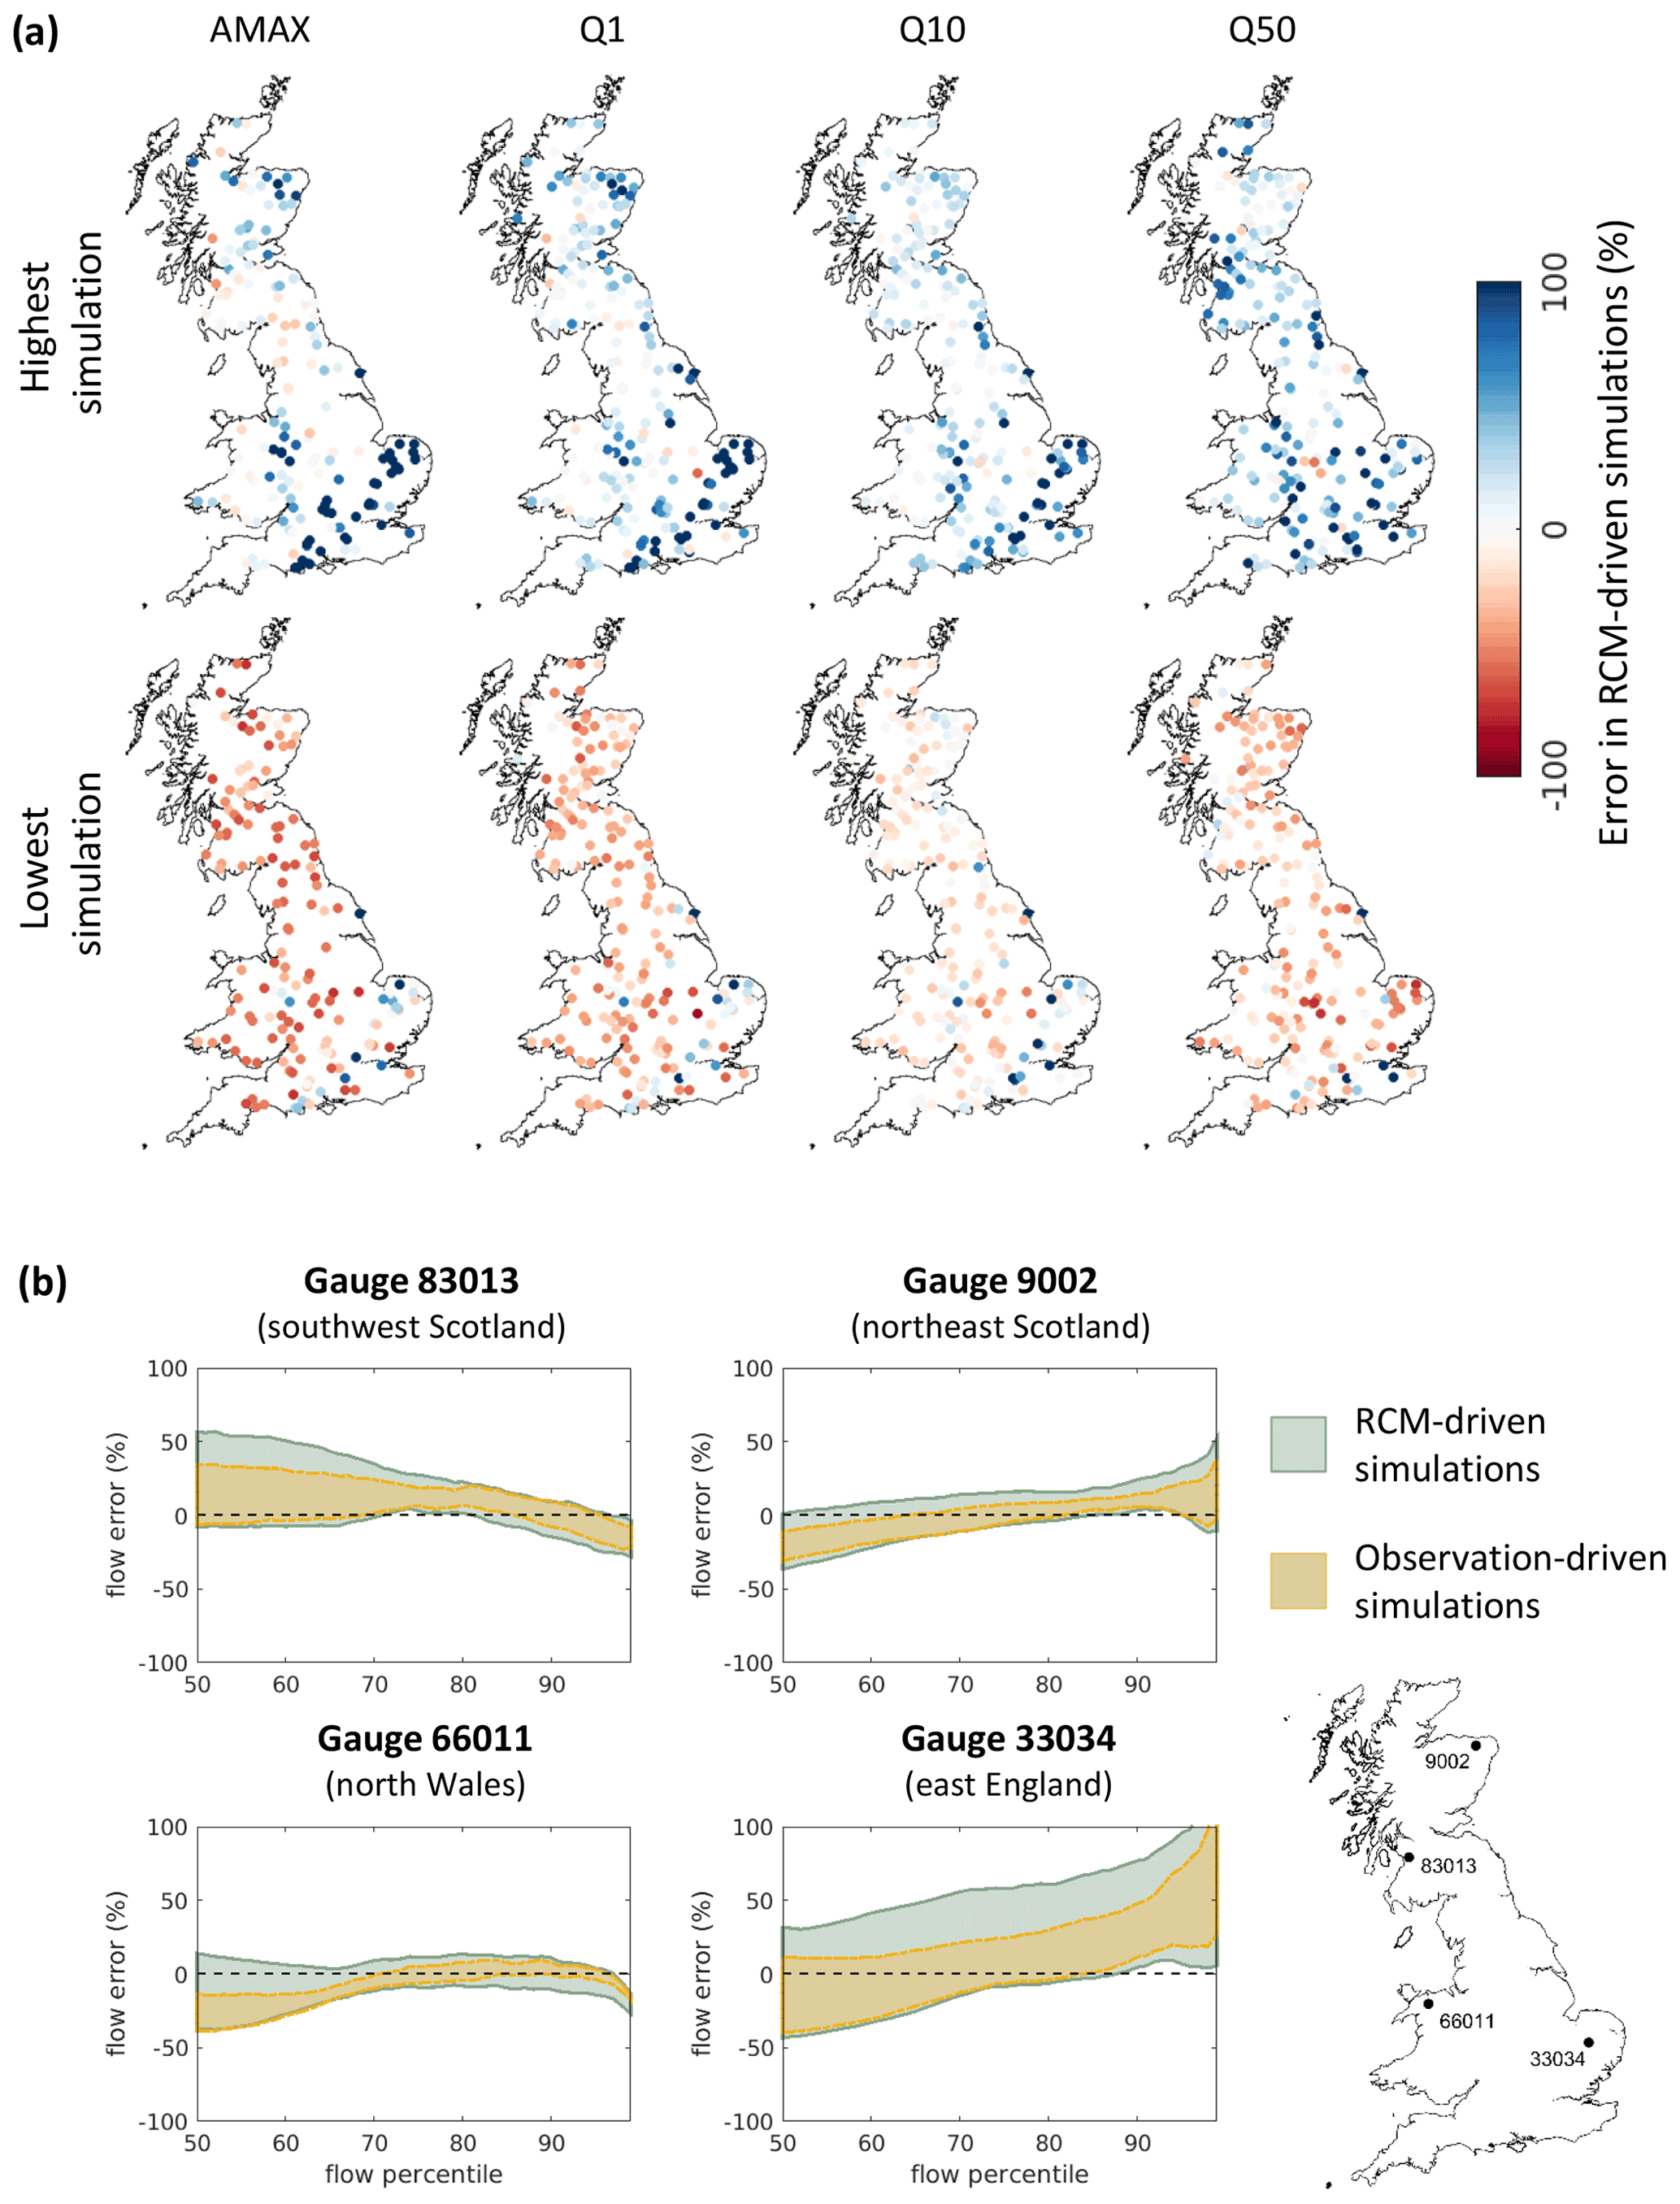
Figure 3Evaluation of model performance, showing how well the modelled flow statistics from the climate–hydrological cascade bound the observed flow statistics over the baseline period. The maps (a) show errors in RCM-driven simulations compared to the observed ones. The top row shows the highest positive error from the 360 simulations, while the bottom row shows the lowest negative error, calculated separately for each catchment. When considered together, these show how well the RCM-driven simulations bound the observed flows. Four gauges are shown in more detail (b), giving error across median and higher flow percentiles compared to observations, showing both simulations driven by observations and simulations driven by RCM data.
Model performances are shown in more detail for a selection of catchments covering a variety of error characteristics (Fig. 3b). Here, error (i.e. bias) in modelled flow driven by RCM output (green) is compared to modelled flows driven by observations (yellow) using the same 30 hydrological model parameter sets. For most gauges, simulated flows bound the observations, even when driven by the RCM meteorological data. This result was expected as the RCM data have been bias-corrected against observations, and therefore the RCM data will be similar to observations in magnitude, albeit with different sequencing of events. There is no consistent relationship between model biases and flow percentiles, with gauge 9002 showing an increased tendency to overestimate higher flows, while gauge 83013 showed a decreased tendency to overestimate higher flows.
3.3 Spatial changes in high flows across GB
Maps showing the spatial pattern of changes in high flow magnitude and frequency are presented for three example simulations in Fig. 4. As the spatial pattern was similar between the ensemble members, we have focused on RCMs 13, 8, and 4, which represent low, average, and high GB-average projections respectively (calculated based on GB-average Q10 changes). These projections were selected to indicate the range in flow changes across GB, but plots for a larger number of scenarios, and showing absolute changes as well as percentage changes, are given in Sect. S3 in the Supplement. It is important to note that the maps in Fig. 4 are spatially coherent futures from single RCM ensemble projections and a single hydrological model parameter set. Therefore, they do not reflect the full range of flow changes for each individual catchment that would be obtained by evaluating the entire RCM ensemble driven by all hydrological model parameter sets. Plots showing the ensemble range for each catchment are therefore also given in Sect. S3 in the Supplement.
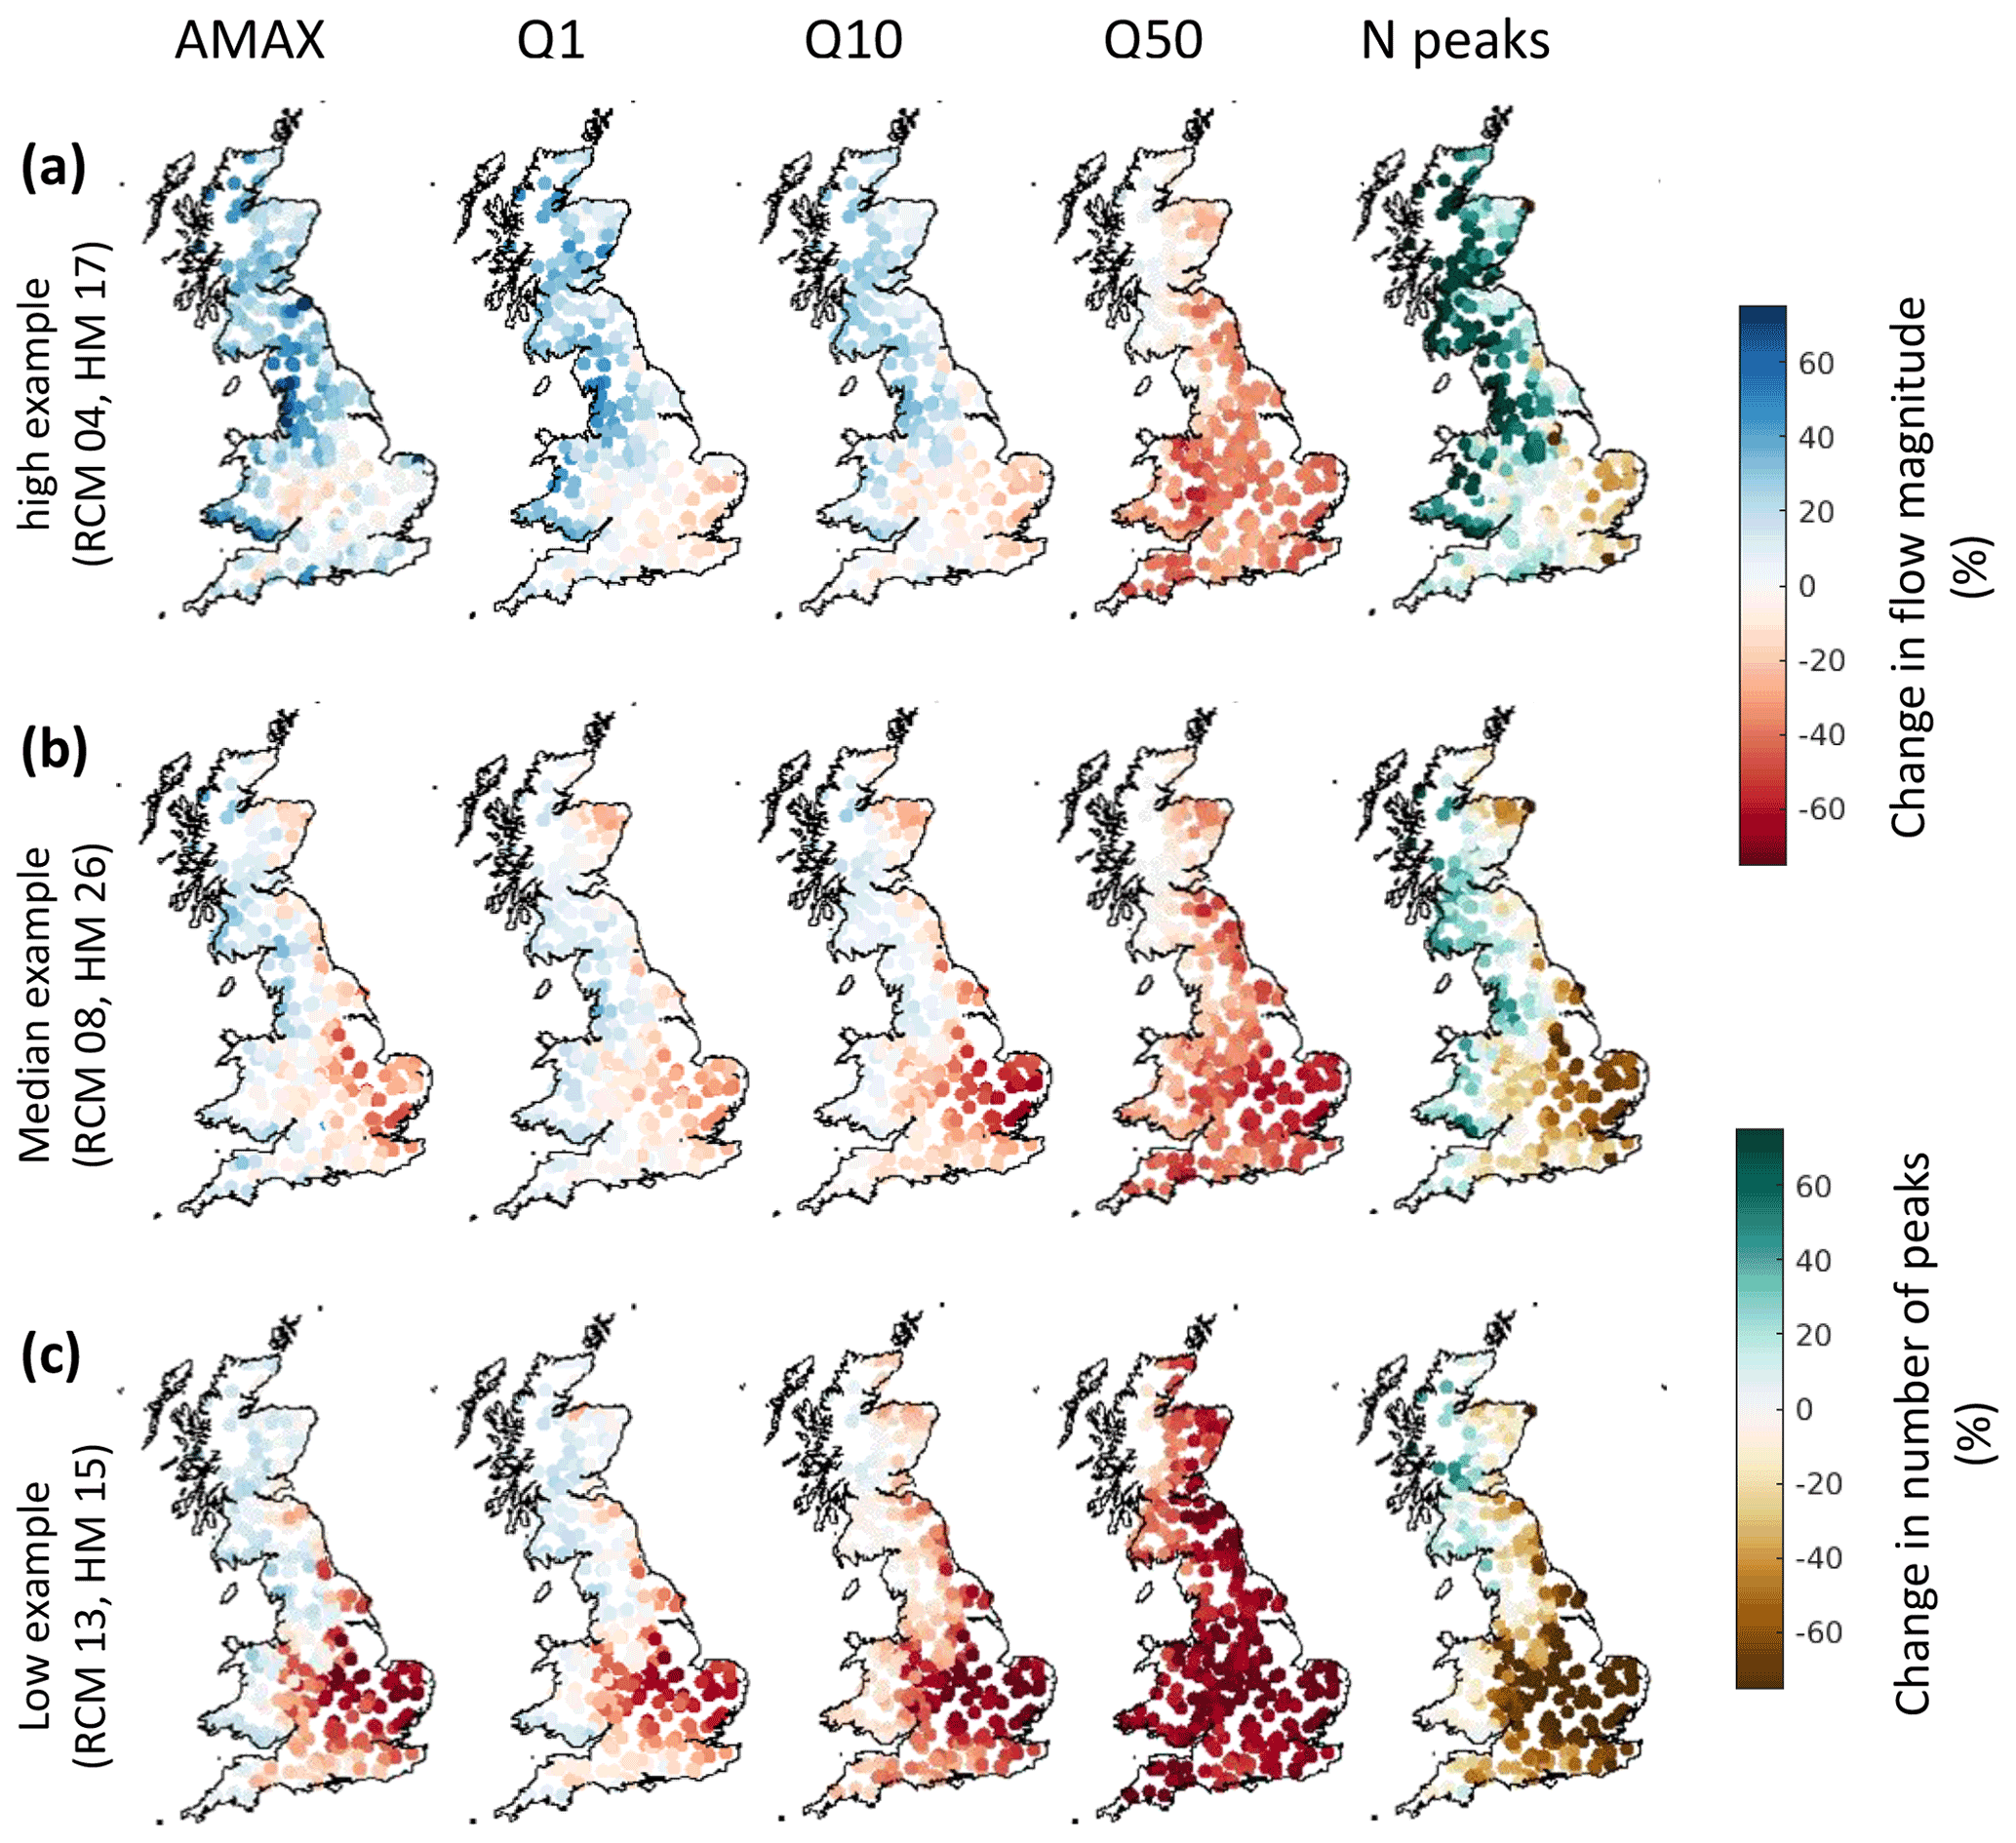
Figure 4Maps showing changes in the magnitude and frequency of peak flows between the baseline and future periods for example simulations. Each row shows a nationally coherent projection, with plots of changes in five flow metrics (AMAX, Q1, Q10, Q50 and the number of peak flows above a threshold). This combination of RCMs and hydrological parameter sets was selected from the ensemble of 360 simulations to give an indication of the ensemble spread, as they provided the highest, median, and lowest GB-average change in Q10, but they do not show the full range of possible changes for individual catchments or all flow metrics.
Despite differences between the example projections, there is a clear east–west divide for high flow magnitude metrics (AMAX, Q1, and Q10) with increased flows for catchments in the west and decreasing flows in the east. The largest percentage decreases in high flows are in eastern England, particularly in the Anglian river basin district, while the largest increases in flow are along the western coast. It is important to note that the large percentage changes in flows for the south-east could be due to the low baseline flow values, so small absolute changes will result in larger percentage changes (see Sect. S3 in the Supplement for presentation of absolute and percentage change maps). Median flow (Q50) projections indicate reductions in flow almost everywhere, but these reductions are generally lower for catchments in western Scotland. The frequency of high flow events, represented by changes to the number of peaks over threshold events, also shows general increases in the west and reductions in the south-east. The spatial pattern is very similar to the changes to high flow magnitude, indicating that western catchments could experience larger annual maximum floods combined with more frequent high flow events.
3.4 Regional changes and uncertainties
Changes in the hydrological indices for the different RCMs and across regions were visualised by heat maps to enable easy comparison (Figs. 5 and 6). Heat maps in Fig. 5 present the median flow values from the sample of hydrological model parameters for each flow statistic, with the full range of regional projections presented in Table 1. They highlight similarities between RCM members: most RCM ensembles result in increasing AMAX flows in Scotland, northern England, and western Wales and decreasing AMAX flows in the Anglian river basin district. Most RCM ensembles also result in decreasing Q50 flows everywhere except for the Argyll and West Highland districts in western Scotland. However, there are also important differences between the different RCM projections, including (i) differences in the spatial variation of changes across GB, for example RCM 15 showing relatively little variation between regions (range of 28 % between AMAX projections) and RCM 11 showing a large variation (range of 104 %), (ii) differences in the magnitude of projected changes for each region, for example north-western England projections for Q10 ranging from −16 % to +20 % between RCMs, and (iii) the tendency for some RCMs to simulate increases in flow (e.g. RCM 04) and others to tend towards decreases (e.g. RCM 13), which relates to the relative change in 99th percentile precipitation (see Fig. 2). These differences demonstrate the importance of considering multiple RCM parameterisations to show a more complete picture of potential future changes.
Table 1Ensemble range in projected changes for each flow metric. All changes are given as percentage differences between the baseline and future periods. “Low”, “Med”, and “High” refer to the lowest, median, and highest region-average changes from the ensemble of RCM and hydrological model parameters.
Figure 5Heat maps showing region-average changes in flow magnitude between the baseline and future periods, for all 12 RCMs. Regions have been ordered by location, with the relative position within GB given on the left. To focus on differences between RCMs, the median flow value from the hydrological model parameter sets is presented.
Figure 6Heat map showing region-average changes in Q10 flow magnitude between the baseline and future periods. The 12 columns on the left focus on the difference between RCM parameterisations, using the median flow value from all hydrological model parameter sets. The 30 columns on the right focus on the difference between hydrological model parameterisations, using the median flow value from all RCMs. Regions have been ordered by location, with the relative position within GB given on the left.
Heat maps in Fig. 6 present regional changes to Q10 (see Sect. S4 in the Supplement for other metrics), evaluated using (1) the median flow values from the sample of hydrological model parameters for each RCM ensemble member and (2) the median flow values from the RCM ensemble for each hydrological model parameter set. This highlights similarities and differences between hydrological model parameter sets compared to RCM ensemble members. There are some hydrological model parameter sets that tend towards increases in Q10 (e.g. hydrological models (HMs) 5 or 12), while others tend towards decreases (e.g. HMs 1 or 9) across the regions. Hydrological model parameter sets also result in considerable differences in projections for some regions; for example, the change in Q10 flow magnitude for the Anglian river basin varies from −36 % to −14 % for the hydrological model parameters, compared to −44 % to −11 % for the RCM parameters. Figure 7 summarises these ranges across all regions and metrics.
Figure 7Relative uncertainties from inclusion of different RCM and hydrological model (HM) parameter sets. The RCM range was calculated as the full range in regional-average changes between the RCMs, using the median of all HM parameter sets. Similarly, the HM range was calculated using the median output of all RCMs.
Overall, RCM parameters were a larger source of uncertainty in median and high flow changes than hydrological model parameters (see Figs. 6 and 7). This finding agrees with previous studies that have investigated high flows, which generally find climate models to be the largest source of uncertainty in hydrological climate impact assessments (Addor et al., 2014; Bosshard et al., 2013; Kay et al., 2009). However, hydrological model parameter selection is a large source of uncertainty in the south-east, especially in the Anglian river basin region. This region receives relatively little precipitation compared to the rest of GB. Previous studies have shown that drier catchments are more sensitive to parameter selection, with fewer good parameter sets for drier than for wet catchments (Lane et al., 2019). It is however possible that high percentage differences in the south-east are due to the lower river flow values magnifying the percentage value of any changes.
3.5 Relationship between climate changes, flow changes, and catchment characteristics
The relationship between precipitation change (95th precipitation percentile) and change in flood flows (Q1) across all catchments and RCMs is presented in Fig. 8. Additional plots showing this relationship for other precipitation change metrics, flow change metrics and hydrological model parameter selections are given in Sect. S5 in the Supplement. This shows that there is a strong positive correlation between precipitation change and flood response, albeit with a large variation between catchments. The non-linearity between changing precipitation and changing Q1 flows can be seen, with a 25 % increase in precipitation leading to a 20 %–50 % increase in Q1. Surprisingly, for some catchments, heavy precipitation increases, yet there is a reduction in Q1 flows (i.e. catchments in the bottom right quadrant of Fig. 8). This flow reduction could be due to the contrasting effect of increasing PET, resulting in generally drier antecedent conditions for catchments and thus reduced flows due to the increases in soil moisture storage deficits.

Figure 8Relationship between precipitation change and Q1 change across all catchments. Results are presented for all RCMs using the median of all hydrological parameter sets.
The relationship between change in 95th percentile precipitation, total PET, and Q1 is given in Fig. 9; other variations of precipitation, PET, and flow changes produced similar results (but are not shown). There is a clear relationship between climate forcing and hydrological response. Increased heavy precipitation tends to lead to increased Q1, while decreased or unchanged heavy precipitation, combined with increasing PET, leads to reduced Q1 flows. The range in climatic changes is different for each region (see Fig. 9b), which is a key reason for the regional differences in Q1 changes. However, the hydrological response differed between regions for the same climate forcing. For example, a 6 % decrease in 95th percentile precipitation and an over 45 % increase in total PET lead to an average 53 % reduction in Q1 in the Anglian river basin district but only an average 15 % decrease in Q1 in the Thames region in the south-east. These results highlight the importance of how multiple climatic factors impact regional flow responses differently due to the non-linearity within the hydrological processes.
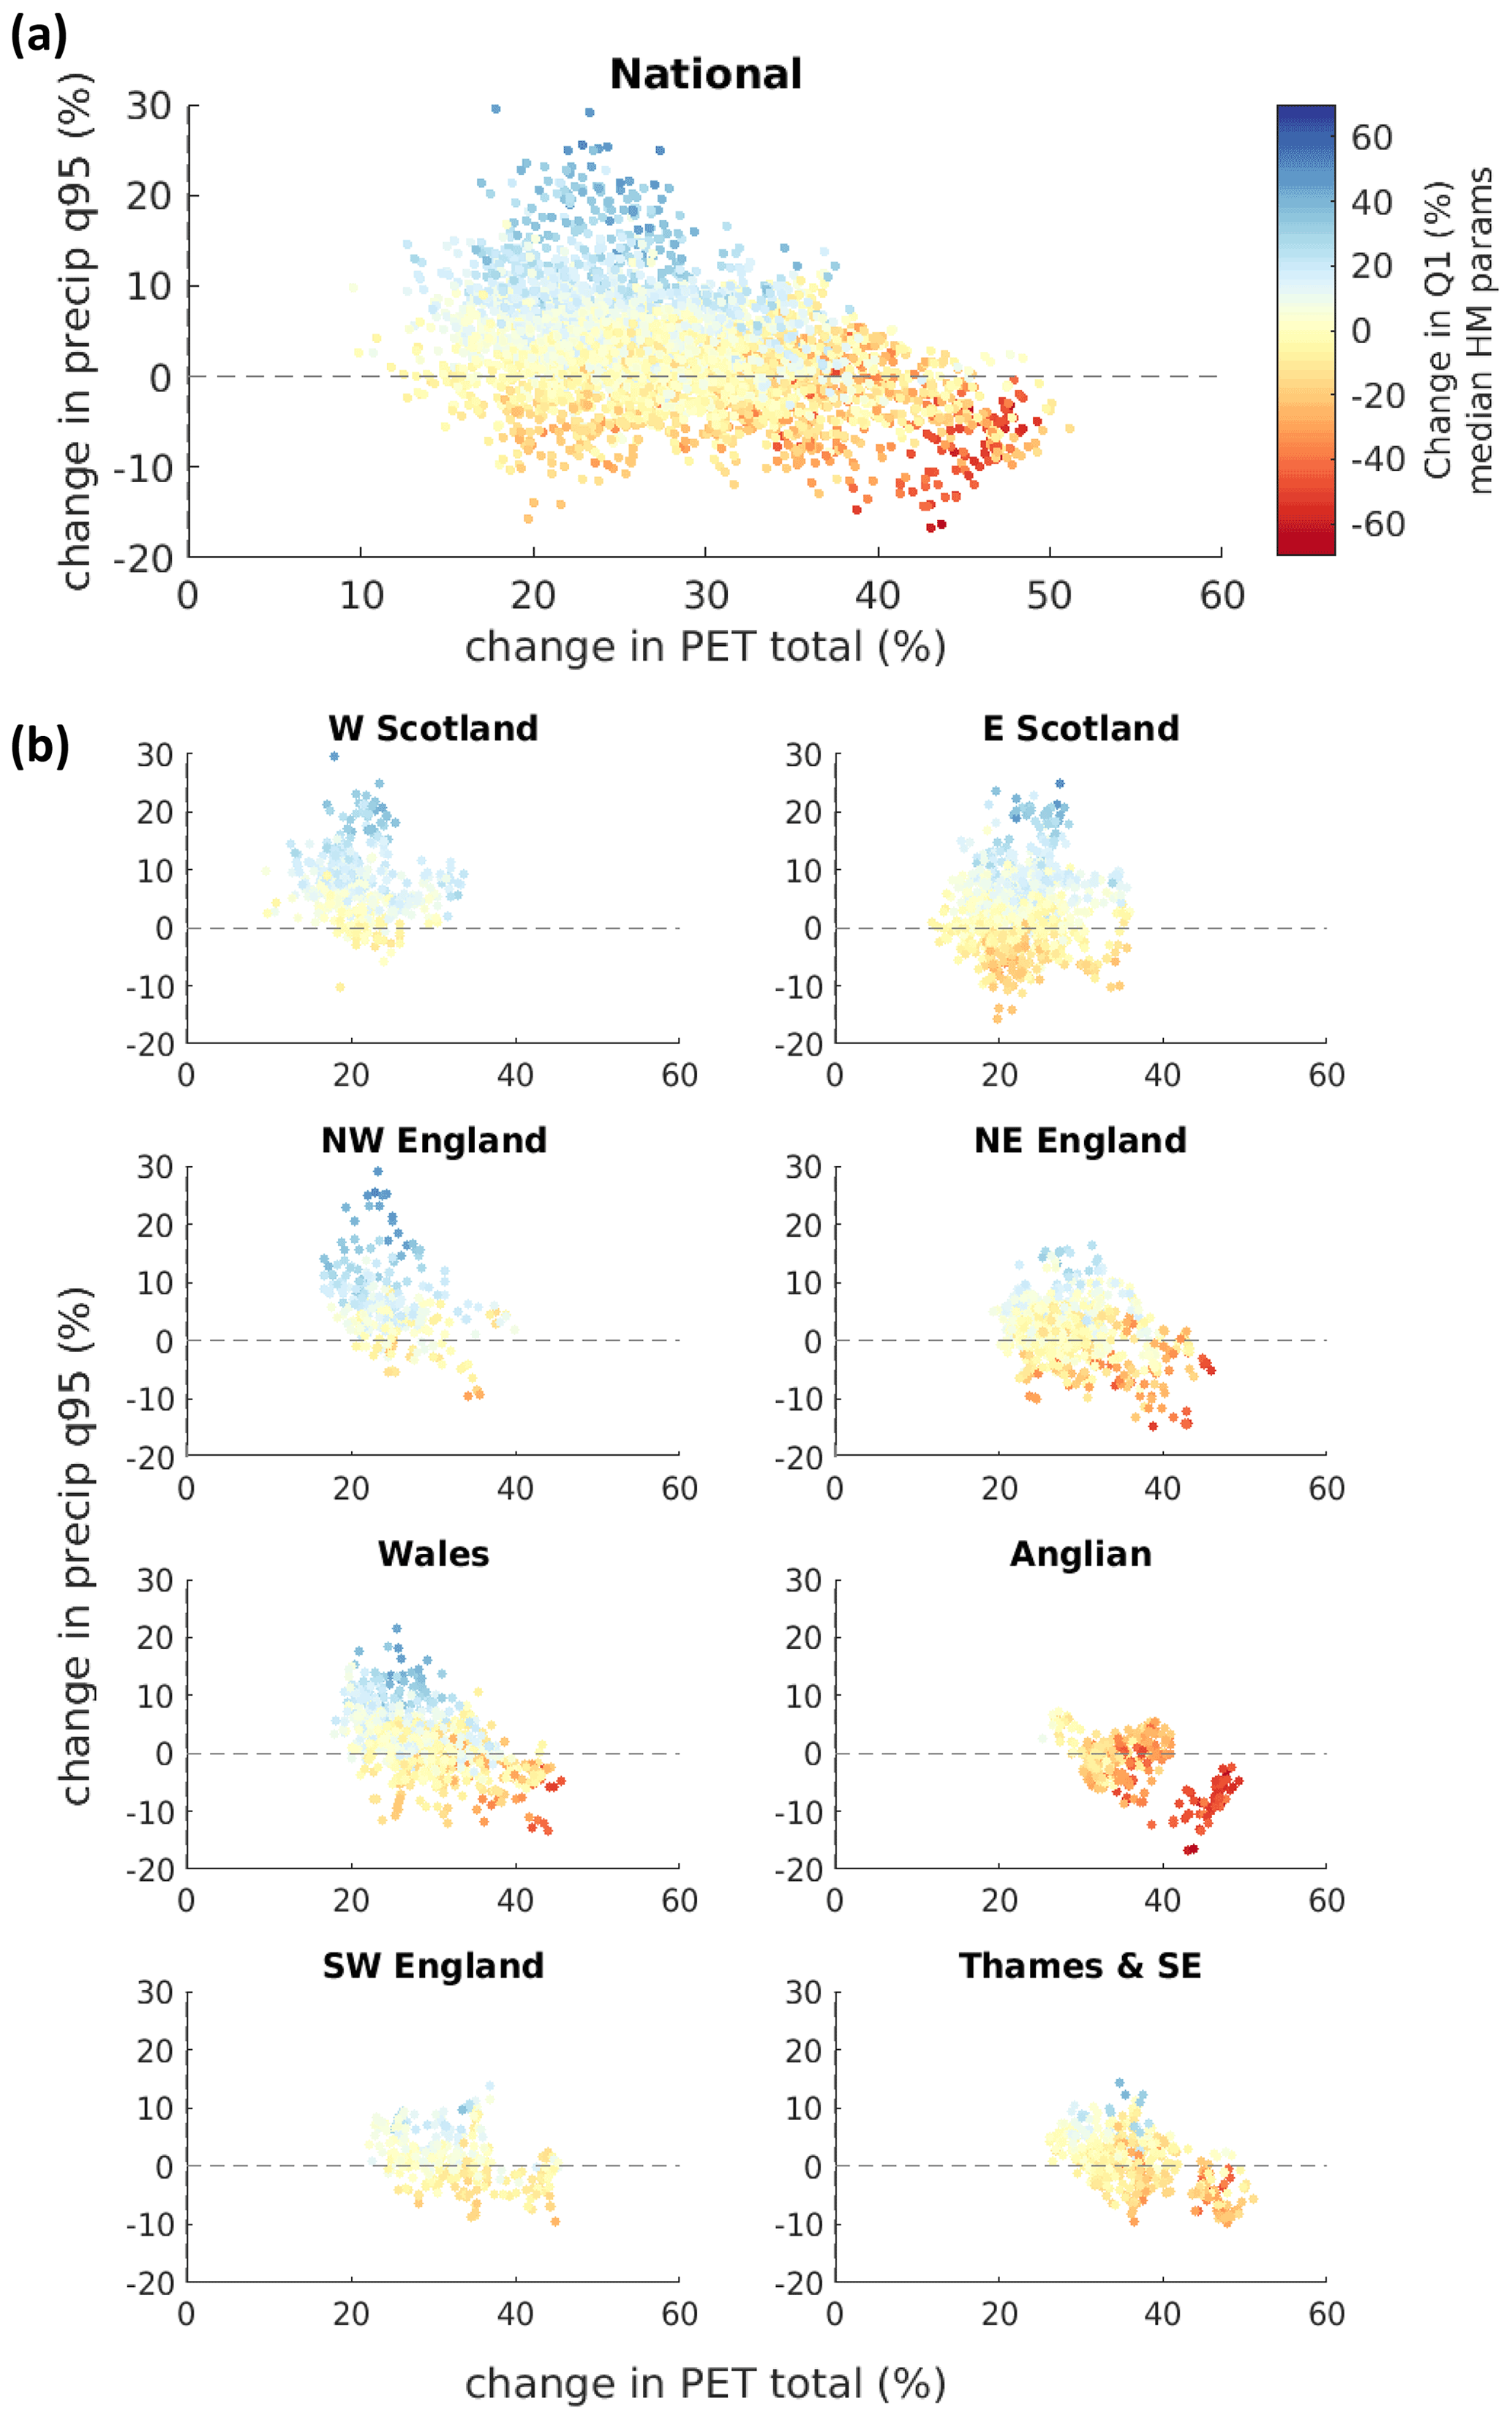
Figure 9Relationship between changing climate and changing high flows (Q1), shown for all catchments nationally (a) and by region (b). Plots show climatic changes from all RCMs, coloured by the median change in Q1 flows from the ensemble of hydrological model parameter sets. Regions which are shown together exhibited similar patterns.
The observed runoff coefficient (runoff divided by precipitation) helped to explain these regional differences in catchment flow response to climatic change inputs. Figure 10 shows the relationship between 95th percentile precipitation, PET, and Q1 changes, with catchments grouped by runoff coefficient classes. Catchments with relatively low runoff coefficients tend to show a higher sensitivity to the increasing PET. They are therefore more likely to see decreasing Q1 flows even with small (<5 %) increases in heavy precipitation. These catchments are often drier catchments, and so heavy precipitation events may fill storage deficits rather than result in increased river flow. Other catchment properties, such as deep soils or permeable geology, may also contribute to water being retained in the catchment. By contrast, catchments with high runoff coefficients show more sensitivity to changes in heavy precipitation, and very small (5 %) increases in precipitation can lead to increases in Q1 of up to 25 %. These are often wetter catchments, or catchments with other properties such as steep slopes or impermeable soils, where increases in heavy rainfall will directly result in increases in flood flows.
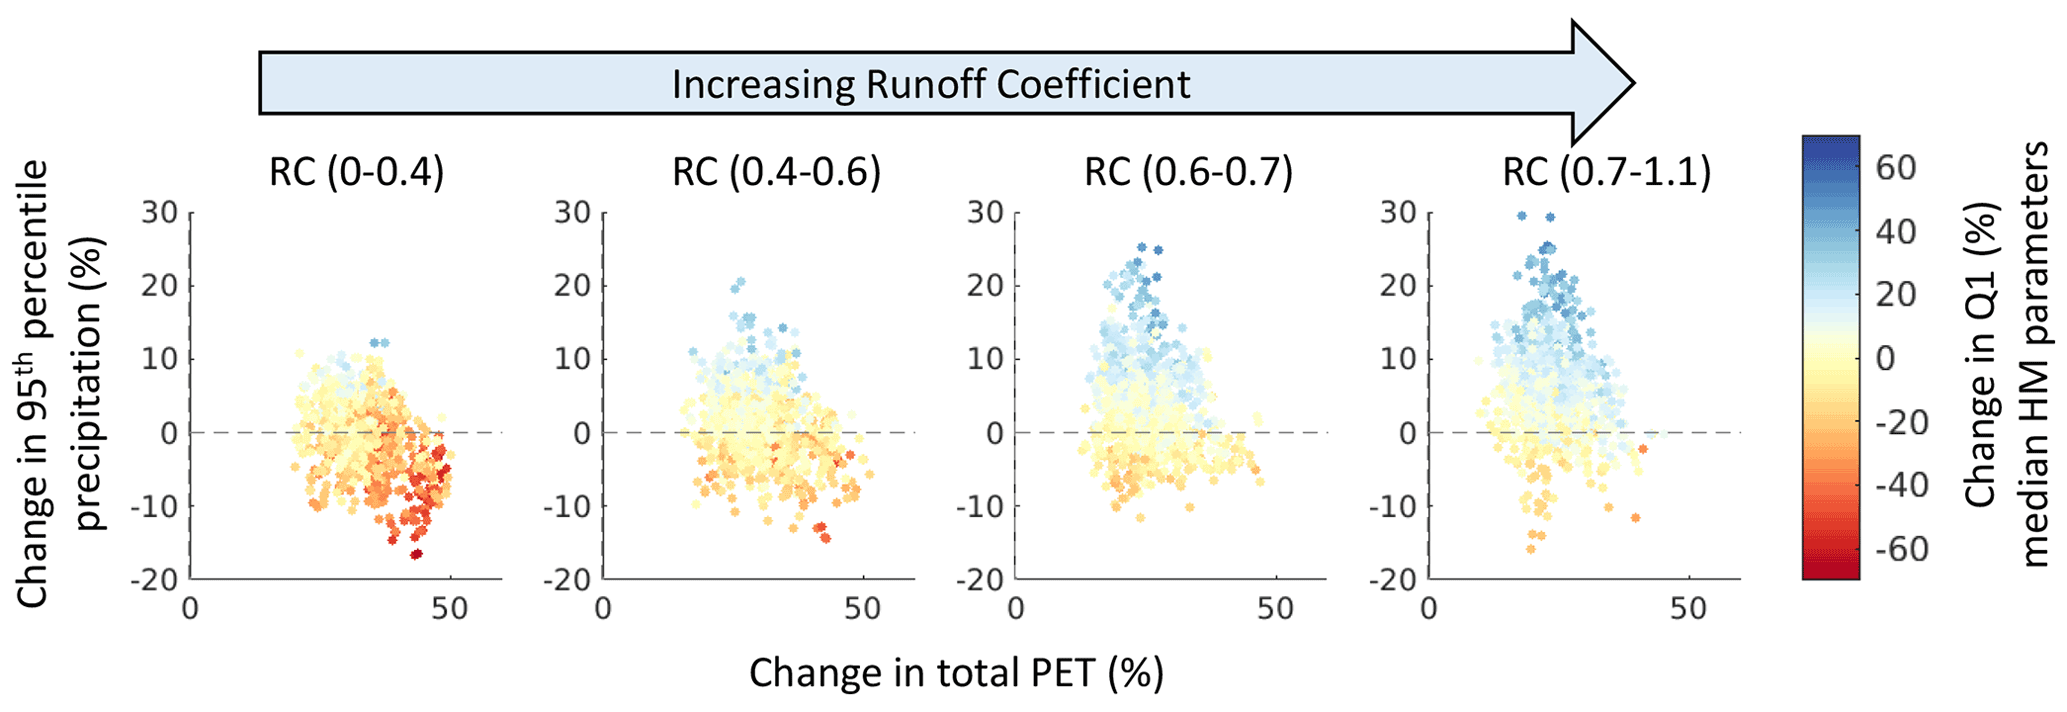
Figure 10Runoff coefficient (runoff divided by precipitation) vs. flow sensitivity to climatic changes.
4.1 Future changes to high flows across GB
Despite large uncertainties, some clear patterns of climate change impact on flooding across GB emerged. Projections indicated decreasing median flows (Q50) across all regions except for the Clyde and West Highland river basin regions where Q50 changes ranged between −42 % and +19 %. The overall decrease in Q50 was likely due to reduced average precipitation and nationwide increases in PET projected by all the RCMs.
Increased flood flow magnitudes (AMAX) and frequency were projected for all RCMs along the western coast and across most of Scotland, while decreasing flood flows were projected for the Anglian river basin region in eastern England using the median of all hydrological model parameter sets. These results are consistent with previous studies on the hydrological impacts of climate change for GB, which broadly find increasing flood flows for Wales, northern England, and Scotland (Chan et al., 2022). For example, Collet et al. (2018) found that hydro-hazard hotspots were likely to develop along the western coast and north-eastern Scotland. Kay et al. (2014b) also modelled large increases in flood peaks in north-western Scotland. However, our results contrast with Bell et al. (2016) and Kay et al. (2014a), which both found relatively large increases in flood flows in the south-east and Anglian in particular. This contrast could be due to the different metric studied (Bell et al., 2016, and Kay et al., 2014, both showed percentage changes in 20-year return period floods, while we show changes in AMAX floods) or other methodological differences such as hydrological model or climate projections. Chan et al. (2022) summarise the results from 122 publications on the hydrological impacts of climate change for GB, concluding that changes in flooding over south-eastern England were uncertain. This is consistent with our finding that hydrological modelling uncertainties were particularly large for the Anglian region. Therefore increases or decreases in AMAX flows were within the total uncertainty range of a −74 % to +19 % change.
Our modelled changes in AMAX and high flow magnitudes (Table 1) will be useful for informing climate change adaptation, for example in ensuring correct allowances are made for changing fluvial flood risk in new developments. To account for the potential impact of changing flood risk, the national planning policy for England requires that developments are safe from flood risk throughout their lifetime by applying an allowance for the potential impact of climate change (Reynard et al., 2017). These have evolved from a simple 20 % allowance applied nationally to a range of allowances for each river basin district that represent the central (50th percentile), higher central (70th percentile), upper end (90th percentile), and H (highest) projections of changes to peak river flows (Environment Agency, 2020a). Our highest regional projections are within the H government allowances for southern and central England, but our highest projections exceed the government H peak flow allowances for northern England (Solway, Tweed, Northumbria, and North-west England river basin districts). In particular, the H allowance for peak flow changes in the Tweed River basin is 35 % for the 2050s (Environment Agency, 2020a), but our projections include peak flow changes of up to 59 %. Therefore, our projections indicate that current guidance could be underestimating the potential risks from climate change for northern England. However, the use of different time periods (we modelled changes by 2050–2075, whereas the government allowances cover the period 2040–2069) restricts the comparability of these results.
4.2 Relationship between climate changes and hydrological response
It is often assumed that increases in extreme precipitation will lead to increases in flood flows (Sharma et al., 2018). However, while there is observational evidence of increasing precipitation extremes, there is no compelling evidence for any systematic increases in flooding which can be attributed to climate change (Hannaford, 2015; Watts et al., 2015). Understanding the link between changing precipitation and changing floods has, therefore, been highlighted as an important challenge for the hydrologic community (Sharma et al., 2018). Here we found that while there was a strong positive relationship between changes in heavy precipitation (as characterised by changes in the 95th percentile precipitation) and changes in high flows (Q1), there were catchments where precipitation was increasing yet modelled flood flows were decreasing. These catchments tend to be located in the south-east of England, where we have drier conditions and large increases in PET – and therefore the impact of drier soils and increased storage deficits could have moderated the impact of increased heavy precipitation on river flows.
We found that the relationship between changes in heavy precipitation, total PET, and changes to flood flows varied between river basin regions. The catchment runoff coefficient (average river flow divided by average precipitation) helped to explain this variation; for catchments with high runoff coefficients, precipitation increases most directly related to increased flood flows, while catchments with low runoff coefficients showed a greater response to increasing PET. This in part relates to previous studies finding that there is a more direct link between heavy rainfall and high flows in wetter catchments (Charlton and Arnell, 2014; Ivancic and Shaw, 2015), as there is a general relationship between the runoff coefficient and catchment wetness. It is important to realise that the interplay between general runoff coefficients of different catchment typologies and the amount they are impacted by changes in both evaporation and precipitation to Q1 high flow sensitivity is not consistent, as shown in Fig. 10. Therefore we recognise that impacts to high flows are multifaceted, and the uniqueness of catchment characteristics and climatological differences needs to be taken into account when quantifying climate change impacts. This result highlights that it is important to recognise the complexities of flow change resulting from multiple climatic drivers and non-linear hydrological processes.
4.3 Uncertainties in climate impacts on high flows
Our results highlight the importance of considering uncertainty in projections of climate change on flood flows. The selection of RCM parameters impacted not only the range of future changes for each region (often disagreeing on the direction of change), but also variation in changes between regions and to some extent the spatial pattern of changes across GB. This, combined with hydrological modelling uncertainties, resulted in the large ranges in future changes given in Table 1. The overall picture of climate change impact on flows differed between the four selected metrics, showing the importance of metric selection and consideration of multiple metrics in model evaluation and impact studies. The incorporation of multiple uncertainty sources, therefore, prevents an overconfident portrayal of climate change impacts on high flows, which could be misleading if used to inform future planning or policy decisions (Buurman and Babovic, 2016; Kundzewicz et al., 2018).
Previous studies found hydrological modelling uncertainties to be small relative to climate modelling uncertainties, especially when considering high flows (Chegwidden et al., 2019; Chen et al., 2011; Velázquez et al., 2013). For example, Chegwidden et al. (2019) used an ensemble of two RCPs, 10 GCMs, two downscaling methods, and four hydrological model structures in their analysis of climate change impacts on annual streamflow across the Pacific Northwest of North America, finding that GCMs were overall the dominant contributor to the variance in projected changes. Similarly, Thober et al. (2018) used an ensemble of three RCPs, five GCMs, and three hydrological model structures in an analysis of climate change impact on European floods, finding that the GCM contribution to total uncertainty was generally higher than the hydrological model contribution. Our results generally support these previous findings, showing that the variation in future changes between RCMs is much larger than the variation between behavioural hydrological model parameter sets. However, we observed substantial hydrological modelling uncertainties for catchments in England, particularly for the Anglian river basin and drier catchments in the south-east.
Many studies have explored the impact of climate model structural uncertainty when evaluating climate impact on flows by using different GCMs/RCMs (Kay et al., 2009; Meresa and Romanowicz, 2017; De Niel et al., 2019). When comparing uncertainty sources, GCM structures are commonly found to be one of the largest sources of uncertainty for peak flows (Kay et al., 2009; De Niel et al., 2019). However, the impact of climate model parameter uncertainties has hardly been studied so far. Here, we had the unique opportunity to use simulations from a perturbed-physics ensemble of 12 regional climate model simulations; i.e. the situations were all based on the same GCM/RCM structure. We demonstrate that even when using a single GCM/RCM structure, there are considerable differences in the magnitude of projected changes as well as the spatial pattern. This implies that using single realisations of different GCMs/RCMs likely does not represent the full variability of the climate model simulations.
It is likely that interactions between the RCMs and hydrological model parameters also contribute to the total uncertainty where behaviour is not linear. For example, the AMAX variation between different hydrological model parameter sets may depend on the winter rainfall projection from the driving RCM, where certain RCM projections may lie on a threshold which produces a large difference in hydrological response between models. It has previously been shown that interactions between uncertainty sources can account for 5 %–40 % of the total uncertainty in hydrological climate change impact studies (Bosshard et al., 2013). This emphasised that, while uncertainties in future climate may dominate, uncertainties due to hydrological model parameters are not negligible.
4.4 Limitations and future work
This study focused on the uncertainties in flow projections due to RCM and hydrological model parameter uncertainties. Additional sources of uncertainty in hydrological climate impact studies include the future emissions scenario, GCM structure, bias-correction methods, PE estimation equation, and hydrological model structure (Bosshard et al., 2013; Kay et al., 2009; Prudhomme and Davies, 2009; Wilby and Harris, 2006). Therefore, while our results provide a useful indication of the range in future changes to high flow metrics across GB, the true uncertainty ranges are likely to be much larger.
The RCM ensemble projections applied here were all driven by the same GCM and emissions scenario and so do not sample the full range of climate uncertainty. Other GCMs may have resulted in different precipitation trends and levels of warming into the future and would therefore have resulted in different flow changes. For example, Kay et al. (2021) evaluated climate change impacts on flood indicators using the UKCP18 regional projections applied here alongside lower-resolution projections from a range of GCMs, finding a clear distinction in results driven by different climate models. However, the UKCP18 projections used here were the only high-resolution, spatially consistent projections available covering GB for a continuous time period up to 2080. There is therefore a need to develop more spatially consistent climate projections at high resolution from a range of GCMs/RCMs to assess the impacts of climate model uncertainty on river flows. This is particularly important for flood flows, where high-resolution outputs are critical for capturing rainfall extremes.
This study focused on changes between a baseline and mid- to far-future scenario. However, it is important to recognise that the relative importance of different uncertainty sources could change depending on the time horizon considered (Chan et al., 2022). For example, climate uncertainty in the near term (2020s) is dominated by natural variability, but the impact of the emissions scenario and GCM configuration becomes more important in the mid to long term (2050s onwards) (Hawkins and Sutton, 2009). Furthermore, a study comparing uncertainty sources for flow projections in the Mekong basin found that the Soil and Water Assessment Tool (SWAT) parameters were the major source of uncertainty in the short term (2030s) but that GCMs were the major source of uncertainty in the long term (2060s) (Shrestha et al., 2016). The relative contribution of hydrological modelling and RCM parameter uncertainties over time is therefore an interesting avenue for future research.
A further limitation of this study is that the hydrological modelling framework used a single model structure, which did not include snow accumulation and melt processes. However, snow fractions are generally very low across GB, with a median snow fraction of 0.01, except for catchments in north-eastern Scotland, where it reaches a maximum of 0.17 (Coxon et al., 2020). Bell et al. (2016) investigated the impact of including a snow module on climate change projections for peak flows. They found that across most of GB the inclusion of a snowmelt regime led to small percentage differences in peak flow changes of less than 6 %. However, snowmelt processes were shown to be important for upland parts of GB, mainly in eastern Scotland, where the reduced presence of snow in the future could have a large impact on river flows. Therefore, the results of our study need to be interpreted with caution in these upland catchments.
This study considers both RCM and hydrological model parameter uncertainties for the first time at the national scale through modelling climate change impact on the magnitude and frequency of high flows across 346 catchments in GB. The latest UK Climate Projections (UKCP18) were used to generate 12 spatially coherent and equally plausible time series of precipitation and PET. These were then used to drive the DECIPHeR hydrological modelling framework using 30 nationally consistent parameter fields. The resultant 360 future flow projections were used to investigate the range of changes in high flow magnitude and frequency between baseline (1985–2010) and future (2050–2075) scenarios as well as the relationship between climatic change and hydrological response.
This paper provides a national overview of projected future changes in median and higher flows across GB, with the full ensemble range in projected changes given for each region. Generally, results indicated increasing magnitude and frequency of flood flows for catchments along the western coast of GB and across most of Scotland. For western Scotland, region-average increases in annual maximum flows of up to 65 % were projected. The Anglian and Thames river basins in eastern England generally showed decreasing flood magnitude and frequency. However, hydrological modelling uncertainty was high for these areas, and therefore increases in flood magnitude were also within the ensemble range. This information will be useful for decision makers who have a role in managing or planning water in GB, for example in water companies, regulators, and government.
More broadly, we have shown that regional differences in high flow changes were related to (i) differences in climatic change signals and (ii) differences in catchment conditions during the baseline period as characterised by the runoff coefficient (total discharge/precipitation). A strong relationship was found between increasing heavy precipitation and increasing flood flows, alongside the moderating impact of increased PET. This relationship differed between catchments: catchments with high runoff coefficients were found to have a more direct response of flood flows to precipitation change, while catchments with low runoff coefficients were more responsive to increased PET, often resulting in very large reductions in Q1 flows (−50 %) in areas with small (−5 %) reductions in 95th percentile precipitation. Furthermore, our results highlight the importance of considering uncertainties in climate impact studies. The variation in results within a single RCM was a large source of uncertainty, with differences in both the magnitude of projected changes for individual regions and the variability between regions. While hydrological modelling uncertainties were smaller, they were still considerable for catchments in eastern and south-eastern England. This demonstrates the importance of incorporating hydrological model uncertainties into future climate change impact studies.
The DECIPHeR model code is open-source and freely available under the terms of the GNU General Public License version 3.0. The model code is written in Fortran and is provided through a Github repository (https://github.com/uob-hydrology/DECIPHeR, last access: 3 November 2022) or https://doi.org/10.5281/zenodo.2604120 (Coxon and Dunne, 2019). Code for the model parameterisation is available to view at https://doi.org/10.5281/zenodo.4646179 (Lane, 2021b).
All precipitation, PET, and discharge datasets used in this study are freely available. The CEH-GEAR and CHESS-PE datasets are freely available from CEH's Environmental Information Data Centre and can be accessed through https://doi.org/10.5285/5dc179dc-f692-49ba-9326-a6893a503f6e (Tanguy et al., 2014) and https://doi.org/10.5285/8baf805d-39ce-4dac-b224-c926ada353b7 (Robinson et al., 2020) respectively. Observed discharge data from the NRFA are available from the NRFA website. The UK Climate Projections data are available for download from the CEDA archive (http://catalogue.ceda.ac.uk/uuid/b4d24b3df3754b9d9028447eb3cd89c6, Met Office Hadley Centre, 2018). Model outputs presented in this paper can be made available on request from the main author but unfortunately cannot be made open-access due to license restrictions on the datasets used to parameterise the model.
The supplement related to this article is available online at: https://doi.org/10.5194/hess-26-5535-2022-supplement.
RAL, JF, GC, JS, and TW were involved in the project conceptualisation and the design of the methodology. RAL, GC, and JF were involved in the data curation. RAL and GC set up the DECIPHeR model to run using UKCP18 data. RAL carried out the model parameterisation, model runs, data analysis, visualisation and writing with comments and edits from all the co-authors.
The contact author has declared that none of the authors has any competing interests.
Publisher's note: Copernicus Publications remains neutral with regard to jurisdictional claims in published maps and institutional affiliations.
We are grateful to Emma Robinson for providing the code used to calculate PET for the CHESS-PE dataset and for her advice in applying this to the UKCP18 data. We also thank Louise Slater and Jeff Neal for their helpful comments on the manuscript. Jim Freer was partly funded for his time by the Global Water Futures programme, University of Saskatchewan. Support for Thorsten Wagener comes from the Alexander von Humboldt Foundation in the framework of the Alexander von Humboldt Professorship endowed by the German Federal Ministry of Education and Research.
This work has been supported by the Engineering and Physical Sciences Research Council (grant no. EP/L016214/1), as part of the Water Informatics Science and Engineering Centre for Doctoral Training.
This paper was edited by Nadav Peleg and reviewed by four anonymous referees.
Addor, N. and Seibert, J.: Bias correction for hydrological impact studies – beyond the daily perspective, Hydrol. Process., 28, 4823–4828, https://doi.org/10.1002/hyp.10238, 2014.
Addor, N., Rössler, O., Köplin, N., Huss, M., Weingartner, R., and Seibert, J.: Robust changes and sources of uncertainty in the projected hydrological regimes of Swiss catchments, Water Resour. Res., 50, 7541–7562, https://doi.org/10.1002/2014WR015549, 2014.
Arnell, N. W.: Uncertainty in the relationship between climate forcing and hydrological response in UK catchments, Hydrol. Earth Syst. Sci., 15, 897–912, https://doi.org/10.5194/hess-15-897-2011, 2011.
Bell, V. A., Kay, A. L., Jones, R. G., and Moore, R. J.: Use of a grid-based hydrological model and regional climate model outputs to assess changing flood risk, Int. J. Climatol., 27, 1657–1671, https://doi.org/10.1002/joc.1539, 2007.
Bell, V. A., Kay, A. L., Davies, H. N., and Jones, R. G.: An assessment of the possible impacts of climate change on snow and peak river flows across Britain, Clim. Change, 136, 539–553, https://doi.org/10.1007/s10584-016-1637-x, 2016.
Bosshard, T., Carambia, M., Goergen, K., Kotlarski, S., Krahe, P., Zappa, M., and Schar, C.: Quantifying uncertainty sources in an ensemble of hydrological climate-impact projections, Water Resour. Res., 49, 1523–1536, https://doi.org/10.1029/2011WR011533, 2013.
Brown, C. M., Lund, J. R., Cai, X., Reed, P. M., Zagona, E. A., Ostfeld, A., Hall, J., Characklis, G. W., Yu, W., and Brekke, L.: The future of water resources systems analysis: Toward a scientific framework for sustainable water management, Water Resour. Res., 51, 6110–6124, https://doi.org/10.1002/2015WR017114, 2015.
Buurman, J. and Babovic, V.: Adaptation Pathways and Real Options Analysis: An approach to deep uncertainty in climate change adaptation policies, Policy Soc., 35, 137–150, https://doi.org/10.1016/j.polsoc.2016.05.002, 2016.
Centre for Ecology and Hydrology: National River Flow Archive, Centre for Ecology and Hydrology [data set], http://nrfa.ceh.ac.uk/ (last access: 23 January 2017), 2016.
Chan, W. C., Shepherd, T. G., Facer-Childs, K., Darch, G., and Arnell, N. W.: Tracking the methodological evolution of climate change projections for UK river flows, Prog. Phys. Geograph., 46, 589–612, https://doi.org/10.1177/03091333221079201, 2022.
Charlton, M. B. and Arnell, N. W.: Assessing the impacts of climate change on river flows in England using the UKCP09 climate change projections, J. Hydrol., 519, 1723–1738, https://doi.org/10.1016/j.jhydrol.2014.09.008, 2014.
Chegwidden, O. S., Nijssen, B., Rupp, D. E., Arnold, J. R., Clark, M. P., Hamman, J. J., Kao, S., Mao, Y., Mizukami, N., Mote, P. W., Pan, M., Pytlak, E., and Xiao, M.: How Do Modeling Decisions Affect the Spread Among Hydrologic Climate Change Projections? Exploring a Large Ensemble of Simulations Across a Diversity of Hydroclimates, Earth's Future, 7, 623–637, https://doi.org/10.1029/2018EF001047, 2019.
Chen, J., Brissette, F. P., Poulin, A., and Leconte, R.: Overall uncertainty study of the hydrological impacts of climate change for a Canadian watershed, Water Resour. Res., 47, W12509, https://doi.org/10.1029/2011WR010602, 2011.
Christierson, B. V., Vidal, J.-P., and Wade, S. D.: Using UKCP09 probabilistic climate information for UK water resource planning, J. Hydrol., 424–425, 48–67, https://doi.org/10.1016/j.jhydrol.2011.12.020, 2012.
Clark, M. P., Wilby, R. L., Gutmann, E. D., Vano, J. A., Gangopadhyay, S., Wood, A. W., Fowler, H. J., Prudhomme, C., Arnold, J. A., and Brekke, L. D.: Characterizing uncertainty of the hydrologic impacts of climate change, Curr. Clim. Chang. Reports, 2, 55–64, https://doi.org/10.1007/s40641-016-0034-x, 2016.
Cloke, H. L., Wetterhall, F., He, Y., Freer, J. E., and Pappenberger, F.: Modelling climate impact on floods with ensemble climate projections, Q. J. Roy. Meteor. Soc., 139, 282–297, https://doi.org/10.1002/qj.1998, 2013.
Collet, L., Harrigan, S., Prudhomme, C., Formetta, G., and Beevers, L.: Future hot-spots for hydro-hazards in Great Britain: a probabilistic assessment, Hydrol. Earth Syst. Sci., 22, 5387–5401, https://doi.org/10.5194/hess-22-5387-2018, 2018.
Coxon, G. and Dunne, T.: uob-hydrology/DECIPHeR: DECIPHeR V1 (v1.0), Zenodo [code], https://doi.org/10.5281/zenodo.2604120, 2019.
Coxon, G., Freer, J., Lane, R., Dunne, T., Knoben, W. J. M., Howden, N. J. K., Quinn, N., Wagener, T., and Woods, R.: DECIPHeR v1: Dynamic fluxEs and ConnectIvity for Predictions of HydRology, Geosci. Model Dev., 12, 2285–2306, https://doi.org/10.5194/gmd-12-2285-2019, 2019.
Coxon, G., Addor, N., Bloomfield, J. P., Freer, J., Fry, M., Hannaford, J., Howden, N. J. K., Lane, R., Lewis, M., Robinson, E. L., Wagener, T., and Woods, R.: CAMELS-GB: hydrometeorological time series and landscape attributes for 671 catchments in Great Britain, Earth Syst. Sci. Data, 12, 2459–2483, https://doi.org/10.5194/essd-12-2459-2020, 2020.
Dixon, H., Hannaford, J., and Fry, M. J.: The effective management of national hydrometric data: experiences from the United Kingdom, Hydrolog. Sci. J., 58, 1383–1399, https://doi.org/10.1080/02626667.2013.787486, 2013.
Eicker, A., Forootan, E., Springer, A., Longuevergne, L., and Kusche, J.: Does GRACE see the terrestrial water cycle “intensifying”?, J. Geophys. Res., 121, 733–745, https://doi.org/10.1002/2015JD023808, 2016.
Engin, B. E., Yücel, I., and Yilmaz, A.: Assessing different sources of uncertainty in hydrological projections of high and low flows: case study for Omerli Basin, Istanbul, Turkey, Environ. Monit. Assess., 189, 1–9, https://doi.org/10.1007/s10661-017-6059-3, 2017.
Environment Agency: Flood risk assessments: climate change allowances' Guidance, https://www.gov.uk/guidance/flood-risk-assessments-climate-change-allowances, last access: 25 November 2020a.
Environment Agency: National Flood and Coastal Erosion Risk Management Strategy for England, Environment Agency, https://www.gov.uk/government/publications/ (last access: 26 October 2022), 2020b.
Fowler, H. J. and Ekström, M.: Multi-model ensemble estimates of climate change impacts on UK seasonal precipitation extremes, Int. J. Climatol., 29, 385–416, https://doi.org/10.1002/joc.1827, 2009.
Hannaford, J.: Climate-driven changes in UK river flows: A review of the evidence, Prog. Phys. Geogr., 39, 29–48, https://doi.org/10.1177/0309133314536755, 2015.
Hawkins, E. and Sutton, R.: The potential to narrow uncertainty in regional climate predictions, Bull. Am. Meteorol. Soc., 90, 1095–1108, 2009.
Huntington, T. G.: Evidence for intensification of the global water cycle: Review and synthesis, J. Hydrol., 319, 83–95, https://doi.org/10.1016/j.jhydrol.2005.07.003, 2006.
IPCC: Climate Change 2013 – The Physical Science Basis, Contribution of Working Group I to the Fifth Assessment Report of the Intergovernmental Panel on Climate Change, edited by: Stocker, T. F., Qin, D., Plattner, G.-K., Tignor, M., Allen, S. K., Boschung, J., Nauels, A., Xia, Y., Bex, V., and Midgley, P. M., Intergovernmental Panel on Climate Change, Cambridge University Press, Cambridge, United Kingdom and New York, NY, USA, 1535 pp., 2014.
Ivancic, T. J. and Shaw, S. B.: Examining why trends in very heavy precipitation should not be mistaken for trends in very high river discharge, Clim. Change, 133, 681–693, https://doi.org/10.1007/s10584-015-1476-1, 2015.
Johnson, F. and Sharma, A.: A nesting model for bias correction of variability at multiple time scales in general circulation model precipitation simulations, Water Resour. Res., 48, W01504, https://doi.org/10.1029/2011WR010464, 2012.
Kay, A. L. and Crooks, S. M.: An investigation of the effect of transient climate change on snowmelt, flood frequency and timing in northern Britain, Int. J. Climatol., 34, 3368–3381, https://doi.org/10.1002/joc.3913, 2014.
Kay, A. L. and Davies, H. N.: Calculating potential evaporation from climate model data: A source of uncertainty for hydrological climate change impacts, J. Hydrol., 358, 221–239, https://doi.org/10.1016/j.jhydrol.2008.06.005, 2008.
Kay, A. L., Davies, H. N., Bell, V. A., and Jones, R. G.: Comparison of uncertainty sources for climate change impacts: flood frequency in England, Clim. Change, 92, 41–63, https://doi.org/10.1007/s10584-008-9471-4, 2009.
Kay, A. L., Crooks, S. M., Davies, H. N., Prudhomme, C., and Reynard, N. S.: Probabilistic impacts of climate change on flood frequency using response surfaces I: England and Wales, Reg. Environ. Chang., 14, 1215–1227, https://doi.org/10.1007/s10113-013-0563-y, 2014a.
Kay, A. L., Crooks, S. M., Davies, H. N., and Reynard, N. S.: Probabilistic impacts of climate change on flood frequency using response surfaces II: Scotland, Reg. Environ. Chang., 14, 1243–1255, https://doi.org/10.1007/s10113-013-0564-x, 2014b.
Kay, A. L., Watts, G., Wells, S. C., and Allen, S.: The impact of climate change on U. K. river flows: A preliminary comparison of two generations of probabilistic climate projections, Hydrol. Process., 34, 1081–1088, https://doi.org/10.1002/hyp.13644, 2020.
Kay, A. L., Griffin, A., Rudd, A. C., Chapman, R. M., Bell, V. A., and Arnell, N. W.: Climate change effects on indicators of high and low river flow across Great Britain, Adv. Water Res., 151, 103909, https://doi.org/10.1016/j.advwatres.2021.103909, 2021.
Keller, V. D. J., Tanguy, M., Prosdocimi, I., Terry, J. A., Hitt, O., Cole, S. J., Fry, M., Morris, D. G., and Dixon, H.: CEH-GEAR: 1 km resolution daily and monthly areal rainfall estimates for the UK for hydrological and other applications, Earth Syst. Sci. Data, 7, 143–155, https://doi.org/10.5194/essd-7-143-2015, 2015.
Köplin, N., Schädler, B., Viviroli, D., and Weingartner, R.: Seasonality and magnitude of floods in Switzerland under future climate change, Hydrol. Process., 28, 2567–2578, https://doi.org/10.1002/hyp.9757, 2014.
Kundzewicz, Z. W., Krysanova, V., Benestad, R. E., Hov, Ø., Piniewski, M., and Otto, I. M.: Uncertainty in climate change impacts on water resources, Environ. Sci. Policy, 79, 1–8, https://doi.org/10.1016/j.envsci.2017.10.008, 2018.
Laizé, C. L. R. and Hannah, D. M.: Modification of climate-river flow associations by basin properties, J. Hydrol., 389, 186–204, https://doi.org/10.1016/j.jhydrol.2010.05.048, 2010.
Lane, R.: DECIPHeR_MPR (1.0), Zenodo [code], https://doi.org/10.5281/zenodo.4646179, 2021b.
Lane, R. A. and Kay, A. L.: Climate Change Impact on the Magnitude and Timing of Hydrological Extremes Across Great Britain, Front. Water, 3, 71, https://doi.org/10.3389/frwa.2021.684982, 2021.
Lane, R. A., Coxon, G., Freer, J. E., Wagener, T., Johnes, P. J., Bloomfield, J. P., Greene, S., Macleod, C. J. A., and Reaney, S. M.: Benchmarking the predictive capability of hydrological models for river flow and flood peak predictions across over 1000 catchments in Great Britain, Hydrol. Earth Syst. Sci., 23, 4011–4032, https://doi.org/10.5194/hess-23-4011-2019, 2019.
Lane, R., Freer, J., Coxon, G., and Wagener, T.: Incorporating uncertainty into multiscale parameter regionalisation to produce national parameter fields for a hydrological model, Water Resour. Res., 57, e2020WR028393, https://doi.org/10.1029/2020WR028393, 2021.
Lowe, J. A., Bernie, D., Bett, P., Bricheno, L., Brown, S., Calvert, D., Clark, R., Eagle, K., Edwards, T., Fosser, G., Fung, F., Gohar, L., Good, P., Gregory, J., Harris, G., Howard, T., Kaye, N., Kendon, E., Krijnen, J., Maisey, P., McDonald, R., McInnes, R., McSweeney, C., Mitchell, J., Murphy, J., Palmer, M., Roberts, C., Rostron, J., Sexton, D., Thornton, H., Tinker, J., Tucker, S., Yamazaki, K., and Belcher, S.: UKCP18 Science Overview Report: Version 2.0, https://www.metoffice.gov.uk/pub/data (last access: 17 October 2022), 2019.
Mendoza, P. A., Clark, M. P., Mizukami, N., Newman, A. J., Barlage, M., Gutmann, E. D., Rasmussen, R. M., Rajagopalan, B., Brekke, L. D., and Arnold, J. R.: Effects of Hydrologic Model Choice and Calibration on the Portrayal of Climate Change Impacts, J. Hydrometeorol., 16, 762–780, https://doi.org/10.1175/JHM-D-14-0104.1, 2015.
Meresa, H. K. and Romanowicz, R. J.: The critical role of uncertainty in projections of hydrological extremes, Hydrol. Earth Syst. Sci., 21, 4245–4258, https://doi.org/10.5194/hess-21-4245-2017, 2017.
Met Office: UK Climate Projections: Headline Findings, Exeter, https://www.metoffice.gov.uk/binaries/content/assets/metofficegovuk/pdf/research/ukcp/ukcp-headline-findings-v2.pdf (last access: 17 October 2022), 2019.
Met Office: Regional (12 km) and Local (2.2 km) Projections, https://www.metoffice.gov.uk/research/approach/collaboration/ukcp/high-res-projections, last access: 30 June 2020.
Met Office Hadley Centre: UKCP18 Regional Climate Model Projections for the UK, Centre for Environmental Data Analysis [data set], http://catalogue.ceda.ac.uk/uuid/b4d24b3df3754b9d9028447eb3cd89c6 (last access: 26 October 2022), 2018.
Met Office Hadley Centre: UKCP18 Guidance: Data availability, access and formats, https://www.metoffice.gov.uk/binaries/content/assets/metofficegovuk/pdf/research/ukcp/ukcp18-guidance-data-availability-access-and-formats.pdf (last access: 17 October 2022), 2019.
Mizukami, N., Clark, M. P., Newman, A. J., Wood, A. W., Gutmann, E. D., Nijssen, B., Rakovec, O., and Samaniego, L.: Towards seamless large-domain parameter estimation for hydrologic models, Water Resour. Res., 53, 8020–8040, https://doi.org/10.1002/2017WR020401, 2017.
Moon, H., Gudmundsson, L., Guillod, B. P., Venugopal, V., and Seneviratne, S. I.: Intercomparison of daily precipitation persistence in multiple global observations and climate models, Environ. Res. Lett., 14, 105009, https://doi.org/10.1088/1748-9326/ab4169, 2019.
Murphy, J. M., Harris, G. R., Sexton, D. M. H., Kendon, E. J., Bett, P. E., Clark, R. T., Eagle, K. E., Fosser, G., Fung, F., Lowe, J. A., McDonald, R. E., McInnes, R. N., McSweeney, C. F., Mitchell, J. F. B., Rostron, J. W., Thornton, H. E., Tucker, S., and Yamazaki, K.: UKCP18 Land Projections: Science Report, https://www.metoffice.gov.uk/pub/data/weather/uk/ukcp18/science-reports/UKCP18-Land-report.pdf (last access: 17 October 2022), 2018.
De Niel, J., Van Uytven, E., and Willems, P.: Uncertainty Analysis of Climate Change Impact on River Flow Extremes Based on a Large Multi-Model Ensemble, Water Resour. Manag., 33, 4319–4333, https://doi.org/10.1007/s11269-019-02370-0, 2019.
Nikulin, G., Kjellström, E., Hansson, U., Strandberg, G., and Ullerstig, A.: Evaluation and future projections of temperature, precipitation and wind extremes over Europe in an ensemble of regional climate simulations, Tellus, 63, 41–55, https://doi.org/10.1111/j.1600-0870.2010.00466.x, 2011.
Ning, L., Mann, M. E., Crane, R., and Wagener, T.: Probabilistic projections of climate change for the mid-Atlantic region of the United States: Validation of precipitation downscaling during the historical era, J. Climate, https://doi.org/10.1175/2011JCLI4091.1, 2012.
Petrow, T. and Merz, B.: Trends in flood magnitude, frequency and seasonality in Germany in the period 1951–2002, J. Hydrol., 371, 129–141, https://doi.org/10.1016/j.jhydrol.2009.03.024, 2009.
Pool, S., Vis, M., and Seibert, J.: Evaluating model performance: towards a non-parametric variant of the Kling-Gupta efficiency, Hydrolog. Sci. J., 63, 1941–1953, https://doi.org/10.1080/02626667.2018.1552002, 2018.
Prudhomme, C. and Davies, H.: Assessing uncertainties in climate change impact analyses on the river flow regimes in the UK. Part 2: future climate, Clim. Change, 93, 197–222, https://doi.org/10.1007/s10584-008-9461-6, 2009.
Prudhomme, C. and Williamson, J.: Derivation of RCM-driven potential evapotranspiration for hydrological climate change impact analysis in Great Britain: a comparison of methods and associated uncertainty in future projections, Hydrol. Earth Syst. Sci., 17, 1365–1377, https://doi.org/10.5194/hess-17-1365-2013, 2013.
Prudhomme, C., Young, A., Watts, G., Haxton, T., Crooks, S., Williamson, J., Davies, H., Dadson, S., and Allen, S.: The drying up of Britain? A national estimate of changes in seasonal river flows from 11 Regional Climate Model simulations, Hydrol. Process., 26, 1115–1118, https://doi.org/10.1002/hyp.8434, 2012.
Reynard, N. S., Kay, A. L., Anderson, M., Donovan, B., and Duckworth, C.: The evolution of climate change guidance for fluvial flood risk management in England, Prog. Phys. Geogr. Earth Environ., 41, 222–237, https://doi.org/10.1177/0309133317702566, 2017.
Robinson, E. L., Blyth, E. M., Clark, D. B., Comyn-Platt, E., and Rudd, A.: Climate hydrology and ecology research support system potential evapotranspiration dataset for Great Britain (1961–2012) [CHESS-PE], NERC Environmental Information Data Centre [data set], https://doi.org/10.5285/8baf805d-39ce-4dac-b224-c926ada353b7, 2020.
Rudd, A. C., Kay, A. L., and Bell, V. A.: National-scale analysis of future river flow and soil moisture droughts: potential changes in drought characteristics, Clim. Change, 156, 323–340, https://doi.org/10.1007/s10584-019-02528-0, 2019.
Samaniego, L., Kumar, R., and Attinger, S.: Multiscale parameter regionalization of a grid-based hydrologic model at the mesoscale, Water Resour. Res., 46, 1–25, https://doi.org/10.1029/2008WR007327, 2010.
Samaniego, L., Kumar, R., Thober, S., Rakovec, O., Zink, M., Wanders, N., Eisner, S., Müller Schmied, H., Sutanudjaja, E. H., Warrach-Sagi, K., and Attinger, S.: Toward seamless hydrologic predictions across spatial scales, Hydrol. Earth Syst. Sci., 21, 4323–4346, https://doi.org/10.5194/hess-21-4323-2017, 2017.
Sawicz, K. A., Kelleher, C., Wagener, T., Troch, P., Sivapalan, M., and Carrillo, G.: Characterizing hydrologic change through catchment classification, Hydrol. Earth Syst. Sci., 18, 273–285, https://doi.org/10.5194/hess-18-273-2014, 2014.
Schwalm, C. R., Glendon, S., and Duffy, P. B.: RCP8.5 tracks cumulative CO2 emissions, P. Natl. Acad. Sci. USA, 117, 19656–19657, https://doi.org/10.1073/pnas.2007117117, 2020.
Seibert, J., Vis, M. J. P., Lewis, E., and van Meerveld, H. J.: Upper and lower benchmarks in hydrological modelling, Hydrol. Process., 32, 1120–1125, https://doi.org/10.1002/hyp.11476, 2018.
Sharma, A., Wasko, C., and Lettenmaier, D. P.: If Precipitation Extremes Are Increasing, Why Aren't Floods?, Water Resour. Res., 54, 8545–8551, https://doi.org/10.1029/2018WR023749, 2018.
Shrestha, B., Cochrane, T. A., Caruso, B. S., Arias, M. E., and Piman, T.: Uncertainty in flow and sediment projections due to future climate scenarios for the 3S Rivers in the Mekong Basin, J. Hydrol., 540, 1088–1104, 2016.
Shuttleworth, W. J.: Terrestrial Hydrometeorology, John Wiley & Sons, Ltd, Chichester, UK, ISBN 978-0-470-65937-3, 2012.
Singh, R., van Werkhoven, K., and Wagener, T.: Hydrological impacts of climate change in gauged and ungauged watersheds of the Olifants basin: a trading-space-for-time approach, Hydrolog. Sci. J., 59, 29–55, https://doi.org/10.1080/02626667.2013.819431, 2014.
Smith, A., Bates, P., Freer, J., and Wetterhall, F.: Investigating the application of climate models in flood projection across the UK, Hydrol. Process., 28, 2810–2823, https://doi.org/10.1002/hyp.9815, 2014.
Svensson, C., Kundzewicz, Z. W., and Maurer, T.: Trend detection in river flow series: 2. Flood and low-flow index series, Hydrolog. Sci. J., 50, 824, https://doi.org/10.1623/hysj.2005.50.5.811, 2005.
Tanguy, M., Dixon, H., Prosdocimi, I., Morris, D., and Keller, V. D. J.: Gridded estimates of daily and monthly areal rainfall for the United Kingdom (1890–2012) [CEH-GEAR], NERC Environmental Information Data Centre [data set], https://doi.org/10.5285/5dc179dc-f692-49ba-9326-a6893a503f6e, 2014.
Teutschbein, C. and Seibert, J.: Bias correction of regional climate model simulations for hydrological climate-change impact studies: Review and evaluation of different methods, J. Hydrol., 456–457, 12–29, https://doi.org/10.1016/j.jhydrol.2012.05.052, 2012.
Thober, S., Kumar, R., Wanders, N., Marx, A., Pan, M., Rakovec, O., Samaniego, L., Sheffield, J., Wood, E. F., and Zink, M.: Multi-model ensemble projections of European river floods and high flows at 1.5, 2, and 3 degrees global warming, Environ. Res. Lett., 13, 014003, https://doi.org/10.1088/1748-9326/aa9e35, 2018.
Trenberth, K.: Changes in precipitation with climate change, Clim. Res., 47, 123–138, https://doi.org/10.3354/cr00953, 2011.
Veijalainen, N., Lotsari, E., Alho, P., Vehviläinen, B., and Käyhkö, J.: National scale assessment of climate change impacts on flooding in Finland, J. Hydrol., 391, 333–350, https://doi.org/10.1016/j.jhydrol.2010.07.035, 2010.
Velázquez, J. A., Schmid, J., Ricard, S., Muerth, M. J., Gauvin St-Denis, B., Minville, M., Chaumont, D., Caya, D., Ludwig, R., and Turcotte, R.: An ensemble approach to assess hydrological models' contribution to uncertainties in the analysis of climate change impact on water resources, Hydrol. Earth Syst. Sci., 17, 565–578, https://doi.org/10.5194/hess-17-565-2013, 2013.
Wagener, T., Sivapalan, M., Troch, P. A., McGlynn, B. L., Harman, C. J., Gupta, H. V., Kumar, P., Rao, P. S. C., Basu, N. B., and Wilson, J. S.: The future of hydrology: An evolving science for a changing world, Water Resour. Res., 46, 1–10, https://doi.org/10.1029/2009WR008906, 2010.
Wang, G. Q., Zhang, J. Y., Jin, J. L., Pagano, T. C., Calow, R., Bao, Z. X., Liu, C. S., Liu, Y. L., and Yan, X. L.: Assessing water resources in China using PRECIS projections and a VIC model, Hydrol. Earth Syst. Sci., 16, 231–240, https://doi.org/10.5194/hess-16-231-2012, 2012.
Watts, G., Battarbee, R. W., Bloomfield, J. P., Crossman, J., Daccache, A., Durance, I., Elliott, J. A., Garner, G., Hannaford, J., Hannah, D. M., Hess, T., Jackson, C. R., Kay, A. L., Kernan, M., Knox, J., Mackay, J., Monteith, D. T., Ormerod, S. J., Rance, J., Stuart, M. E., Wade, A. J., Wade, S. D., Weatherhead, K., Whitehead, P. G., and Wilby, R. L.: Climate change and water in the UK – past changes and future prospects, Prog. Phys. Geogr. Earth Environ., 39, 6–28, https://doi.org/10.1177/0309133314542957, 2015.
Wilby, R. L. and Harris, I.: A framework for assessing uncertainties in climate change impacts: Low-flow scenarios for the River Thames, UK, Water Resour. Res., 42, 1–10, https://doi.org/10.1029/2005WR004065, 2006.