the Creative Commons Attribution 4.0 License.
the Creative Commons Attribution 4.0 License.
 | 11 May 2022
The importance of non-stationary multiannual periodicities in the North Atlantic Oscillation index for forecasting water resource drought
William Rust
John P. Bloomfield
Mark Cuthbert
Ron Corstanje
Ian Holman
Drought forecasting and early warning systems for water resource extremes are increasingly important tools in water resource management in Europe where increased population density and climate change are expected to place greater pressures on water supply. In this context, the North Atlantic Oscillation (NAO) is often used to indicate future water resource behaviours (including droughts) over Europe, given its dominant control on winter rainfall totals in the North Atlantic region. Recent hydroclimate research has focused on the role of multiannual periodicities in the NAO in driving low frequency behaviours in some water resources, suggesting that notable improvements to lead-times in forecasting may be possible by incorporating these multiannual relationships. However, the importance of multiannual NAO periodicities for driving water resource behaviour, and the feasibility of this relationship for indicating future droughts, has yet to be assessed in the context of known non-stationarities that are internal to the NAO and its influence on European meteorological processes. Here we quantify the time–frequency relationship between the NAO and a large dataset of water resources records to identify key non-stationarities that have dominated multiannual behaviour of water resource extremes over recent decades. The most dominant of these is a 7.5-year periodicity in water resource extremes since approximately 1970 but which has been diminishing since 2005. Furthermore, we show that the non-stationary relationship between the NAO and European rainfall is clearly expressed at multiannual periodicities in the water resource records assessed. These multiannual behaviours are found to have modulated historical water resource anomalies to an extent that is comparable to the projected effects of a worst-case climate change scenario. Furthermore, there is limited systematic understanding in existing atmospheric research for non-stationarities in these periodic behaviours which poses considerable implications to existing water resource forecasting and projection systems, as well as the use of these periodic behaviours as an indicator of future water resource drought.
- Article
(3160 KB) - Full-text XML
- BibTeX
- EndNote


Oscillatory ocean–atmosphere systems (such as El Niño Southern Oscillation, ENSO; North Atlantic Oscillation, NAO; and Pacific Decadal Oscillation, PDO) are known to modulate hydrometeorological processes over a large domain, often driving multiannual periodicities in hydrological records (Kuss and Gurdak, 2014; Labat, 2010; Trigo et al., 2002). As such, indices of these systems can be useful when explaining decadal-scale variations in water resource behaviour in Europe (Svensson et al., 2015; Kingston et al., 2006), North America (Coleman and Budikova, 2013) and Asia (Gao et al., 2021). In the North Atlantic region, the NAO represents the principal mode of atmospheric variability and is a leading control on European winter rainfall totals (Hurrel, 1995; Hurrel and Deser, 2010). As such, many studies have found strong and significant relationships between the winter NAO index (NAOI) and hydrological variables across Europe (Wrzesiński and Paluszkiewicz, 2011; Brady et al., 2019; Burt and Howden, 2013), leading to the development of seasonal and long-lead forecasting systems of hydrological behaviour (Svensson et al., 2015; Bonaccorso et al., 2015).
A growing number of studies have identified stronger relationships between the NAOI and certain water resource variables at multiannual periodicities (Holman et al., 2011; Neves et al., 2019; Uvo et al., 2021) than at an annual scale. This is particularly apparent where longer hydrological response times predominate (Rust et al., 2021a). For instance, Neves et al. (2019) identified significant relationships between the NAOI and groundwater level in Portuguese aquifers and at approximately 6- and 10-year periodicities, with associations to episodes of recorded groundwater drought. Furthermore, Liesch and Wunsch (2019) found significant coherence between NAOI and groundwater level at approximately 6- to 16-year periodicities across the UK, Germany, the Netherlands and Denmark. Rust et al. (2019, 2021a) identified a similar significant 6- to 9-year cycle across a large dataset of groundwater level (59 boreholes) and streamflow (705 gauges) in the UK, which was associated with the principal periodicity of the NAO (of a similar length; Hurrell et al., 2003; Zhang et al., 2011). In the instance of groundwater level, this periodicity was found to represent a notable portion of overall behaviour (40 % of the standard deviation), and minima in the cycle were shown to align with recorded instances of widespread groundwater drought (Rust et al., 2019). Given their association with recorded droughts across Europe, these studies highlight the potential benefit of an a priori knowledge of multiannual NAO periodicities in water resources for improving preparedness for water resource drought in Europe. While water resources may refer to multiple types of hydrological stores (e.g. streamflow, groundwater, reservoirs and lakes), in this paper we are exclusively considering streamflow and groundwater stores.
However, the value of a multiannual relationship between the NAO and European water resources has yet to be assessed in the context of reported non-stationarities in hydroclimate systems. For instance, the NAO is an intrinsic mode of atmospheric variability (Deser et al., 2017), but it can also be influenced by multiple other teleconnection systems such as the Madden–Julien Oscillation, Quasi–Biennial Oscillation (Feng et al., 2021) or El-Niño Southern Oscillation (Zhang et al., 2019). As such, it is currently unclear whether periodicities in the NAOI are emergent behaviours or the result of external forcing. This has been compounded by a relatively weak signal-to-noise ratio for NAO periodicities, making confident multiannual signal detection difficult (O'Reilly et al., 2019; Hurrell and Van Loon, 1997). Stronger NAO-like multiannual periodicities have been detected in water resource variables in both wet and dry seasons (Rust et al., 2021b), even where weaker relationships exist between winter NAOI and summer water resources (e.g. West et al., 2022), due to the high-band filtering function and protracted response of some hydrological processes (Van Loon, 2013). However, the degree to which these behaviours are sufficiently stable to enable development of predictive utilities is currently unclear. Furthermore, existing research has shown that the sign of the relationship between NAOI and European rainfall is non-stationary at decadal timescales (Rust et al., 2021b; Vicente-Serrano and López-Moreno, 2008). This is expected to add a degree of uncertainty to the detection of lead times between multiannual periodic components in the NAO and water resource response, which is necessary in the development of early warning systems for water resource drought. While some studies have ascribed lags to this multiannual relationship for European water resources (Neves et al., 2019; Holman et al., 2011), the extent to which this non-stationarity is present at multiannual periodicities has yet to be assessed.
Finally, a critical application of early warning systems for water resource extremes is in the design of drought management regimes for existing and projected climate change (Sutanto et al., 2020). While some studies have quantified the degree of modulation that multiannual ocean–atmosphere systems can have on water resources (Kuss and Gurdak, 2014; Neves et al., 2019; Velasco et al., 2015), few have compared these to the expected modulations from projected climate change scenarios. As such, the benefit of incorporating multiannual NAO periodicities into early warning systems for improving preparedness for water resource extremes in climate change scenarios has not been assessed.
The aim of this paper is to assess the utility of multiannual relationships between the NAO and water resources for improving preparedness for future water resource drought. This aim will be met by addressing the following research objectives:
-
quantify significant covariances between multiannual periodicities in the NAOI and water resource extremes, and assess the extent to which these periodicities are stable over time;
-
assess multiannual periodicity phase differences between the NAOI and water resources over time, to understand the extent to which annual-scale non-stationarities between the NAO and rainfall in the UK are expressed at multiannual scales;
-
quantify the modulations of water resource variables caused by key multiannual periodicities in the NAO, during the dry season, and compare this with projected modulations of water resources due to climate change.
These objectives will be implemented on UK water resource records, given the considerable coverage of recorded water resource data in time and across the space (Marsh and Hannaford, 2008); however, the implications of findings for the UK will be discussed within a wider European context.
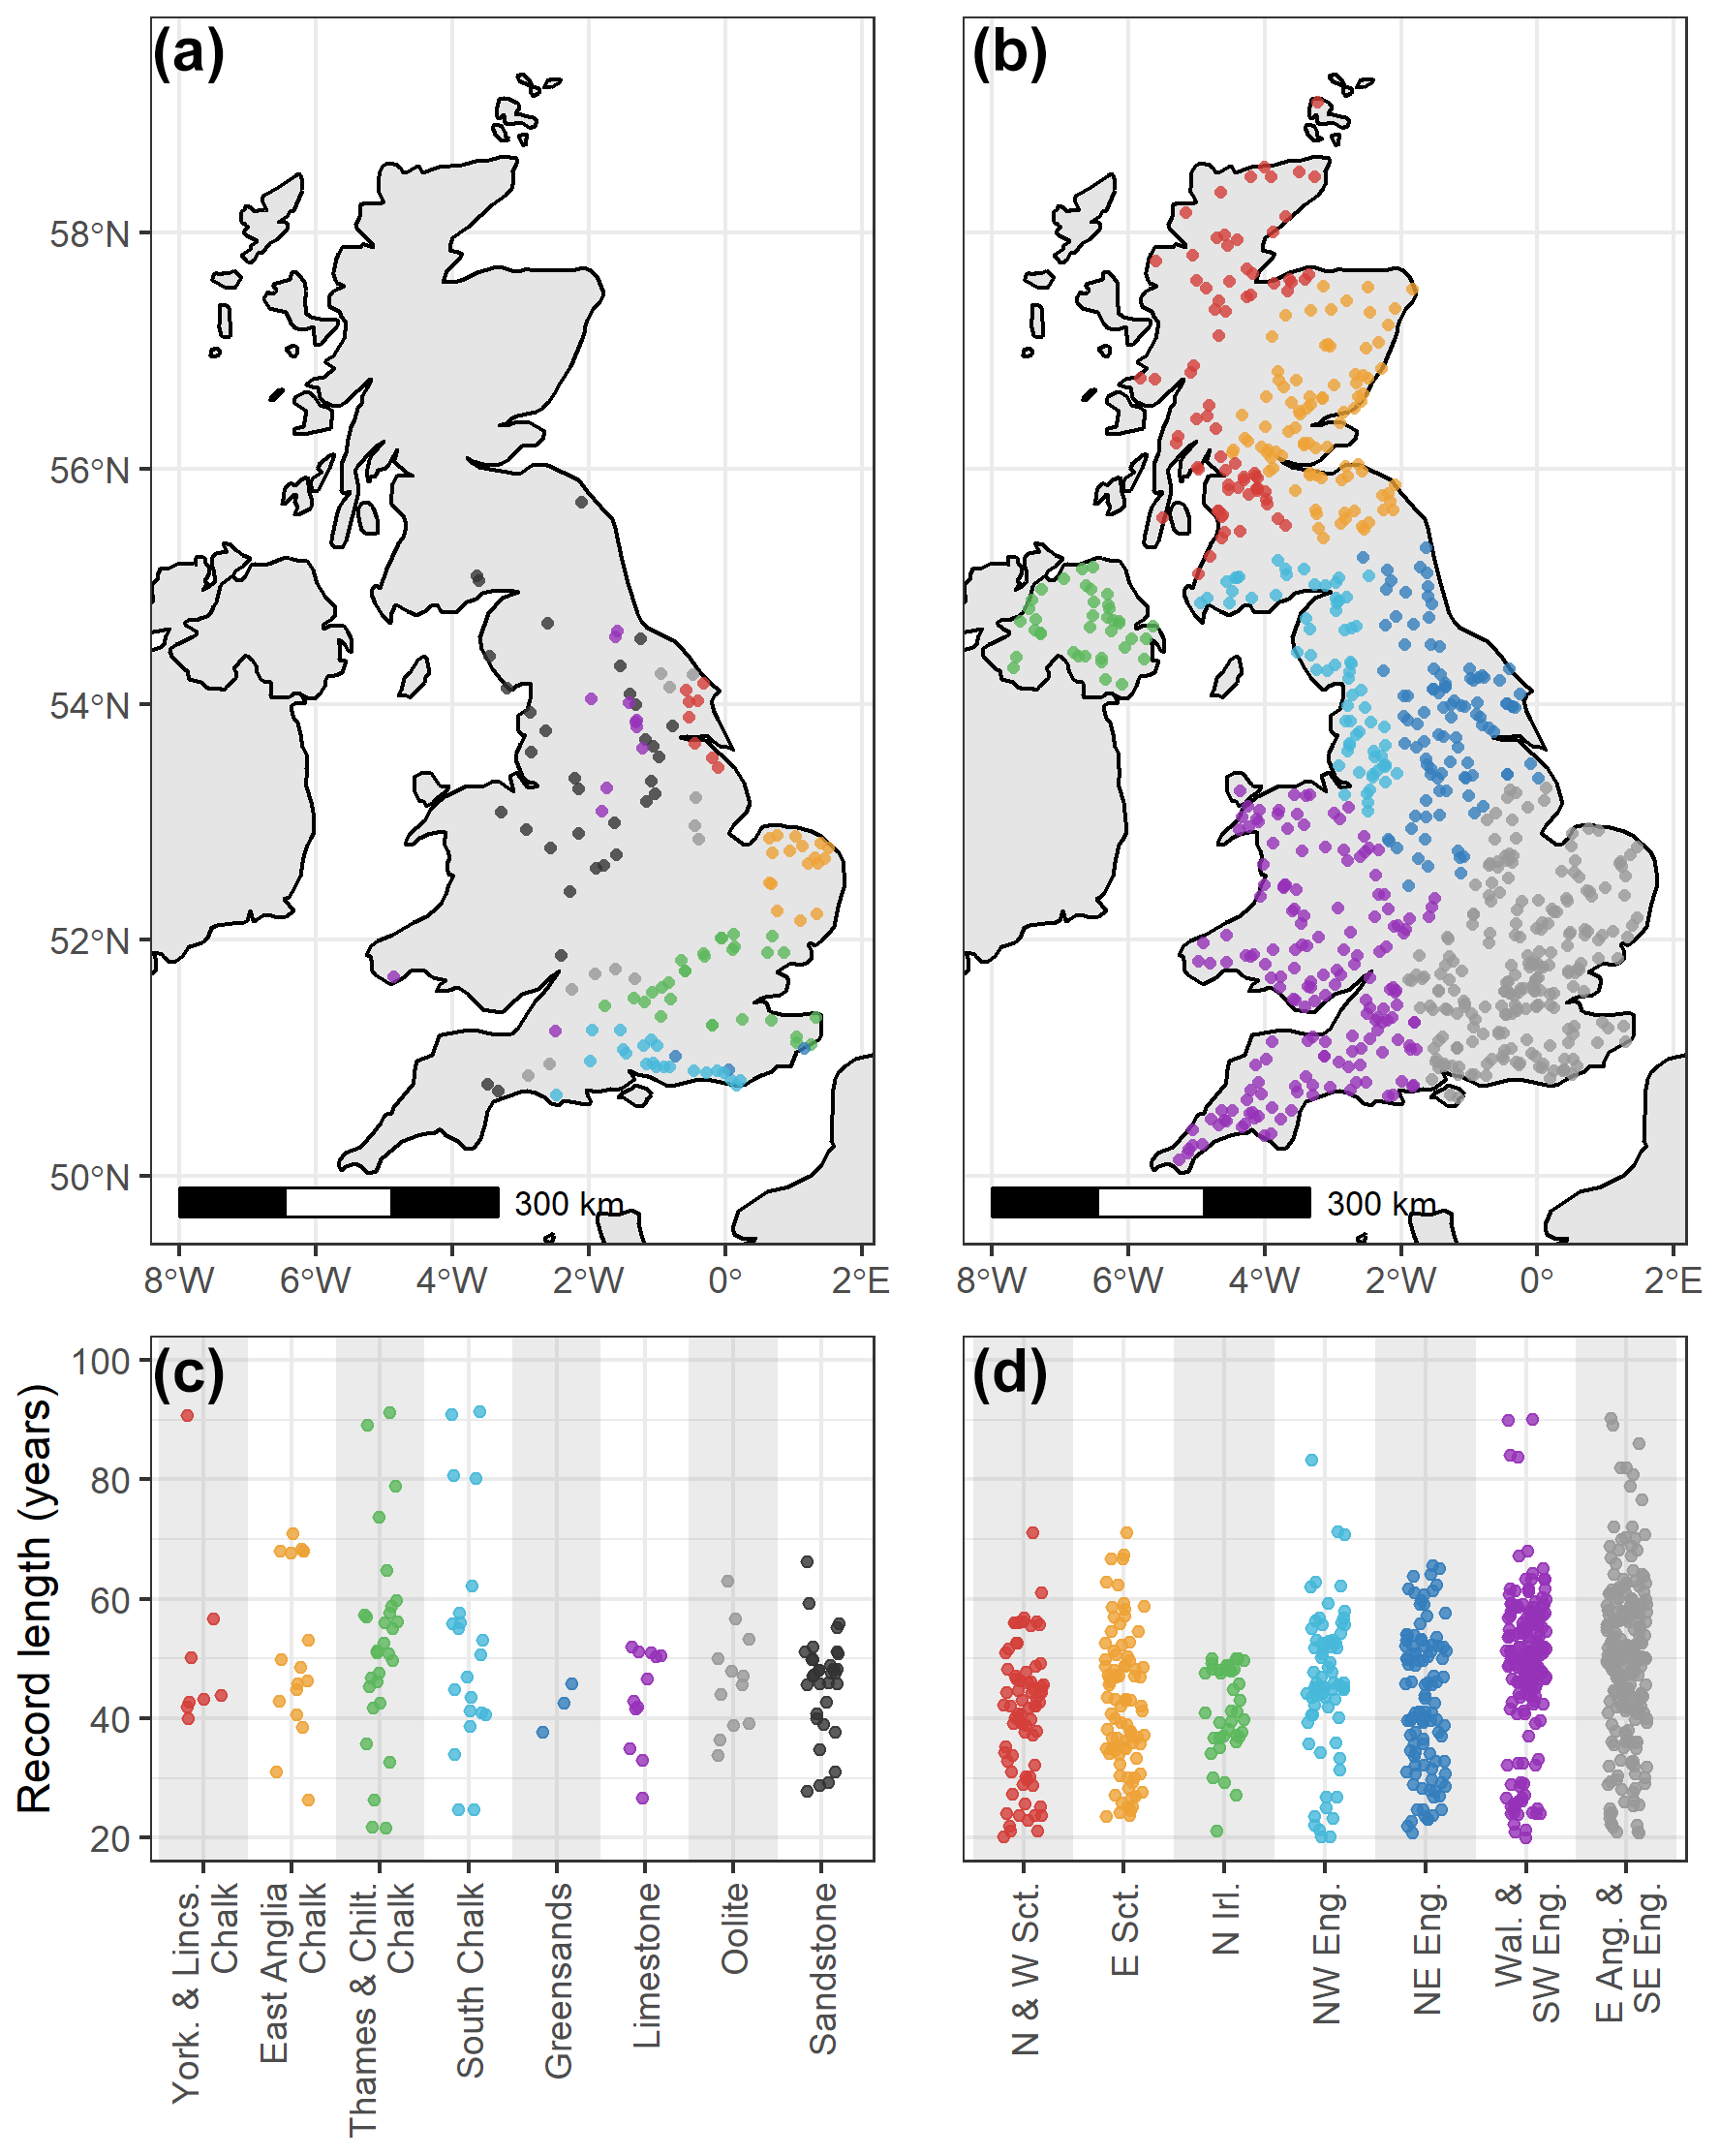
Figure 1Spatial and temporal distributions of water resource records: (a) location of groundwater boreholes coloured by associated aquifer group; (b) jitter plot of groundwater record lengths within each aquifer group; (c) location of streamflow gauges coloured by associated regional group; and (d) jitter plot of streamflow record lengths within each regional group.
2.1 Water resource data
The National Groundwater Level Archive (NGLA) and National River Flow Archive (NRFA) provide high-resolution spatiotemporal coverage of groundwater level records and streamflow across the UK.
2.2 Groundwater data
Monthly NGLA groundwater level data from 136 boreholes covering all of the major UK aquifers, with record lengths of more than 20 years and data gaps no longer than 24 months, have been used (Fig. 1). While some meta-analysis was conducted on monthly data, the primary analysis was undertaken on seasonally averaged data, meaning a data gap of no more than two points. They cover a range of unconfined and confined consolidated aquifer types and have been categorised into generalised aquifer groups of Chalk (78 sites), Limestone (12 sites), Oolite (12 sites), Sandstone (34 sites) and variably cemented mixed clays and sands (3 sites) (Lower Greensand Group; Allen et al., 1997). Given the spatially heterogenous response of the Chalk aquifer to droughts (Marchant and Bloomfield, 2018), Chalk sites were subdivided into four groups based on aquifer region: Lincolnshire basin (8 sites), East Anglian basin (17 sites), Thames and Chiltern basin (29 sites) and Southern basin (21 sites) (Allen et al., 1997; Marchant and Bloomfield, 2018).
Broad aquifer groups can be described as follows: Chalk, a limestone aquifer comprising a dual porosity system with localised areas where it exhibits confined characteristics, characterised by fast-responding fracture porosity (Bloomfield, 1997); Oolite characterised by a highly fractured lithology with low intergranular permeability; Sandstone, composed of sands silts and muds with principle intergranular flow but fracture flow where fractures persist; and Lower Greensand, characterised by intergranular flow with lateral fracture flow depending on depth and formation (Allen et al., 1997).
2.3 Streamflow data
We used monthly streamflow data from the UK National River Flow Archive (NRFA; Dixon et al., 2013: http://nrfa.ceh.ac.uk/, last access: 11 November 2021). Gauging stations with more than 20 years of continuous streamflow data and no data gaps greater than 24 months were initially selected. Sites serving the largest catchment were selected where there are multiple sites within a single river catchment. This produced a final list of 767 streamflow gauging stations for use. To understand broad spatial relationships across the streamflow dataset, records have been divided into groups based on the NRFA river drainage basin (RDB). These are grouped by seven generalised regions of the UK: North and West Scotland (75 records); East Scotland (89 records); Northern Ireland (38 records); north-west England (70 records); north-east England (102 records); Wales and south-west England (170 records); and East Anglia and south-east England (223 records). Streamflow with minimal influence from human factors is often used in hydroclimate studies to avoid confounding mechanisms; however, no such large-scale dataset exists for the UK. Furthermore, over the period of analysis and the broad scale of this assessment, inconsistencies in the way water resource management practices are implemented is expected to result in noise to the observations rather than some systematic signal or bias that would affect the results of this study.
2.4 North Atlantic Oscillation data
We used monthly North Atlantic Oscillation Index (NAOI) data calculated by the National Centre for Atmospheric Research (NCAR) using the principal component (PC) method for the period 1899–2021. The PC NAOI is a time series of the leading empirical orthogonal functions (EOFS) of sea level pressure grids across the North Atlantic region (20–80∘ N, 90∘ W–40∘ E).
3.1 Data pre-processing
In this study we use the continuous and cross-wavelet transform to understand behaviours and relationships across different periodicities within the different water resource variable time series.
Only records with a data length of 20 years or greater have been used in this analysis to ensure that all of the sites have sufficient data to quantify (as a minimum) the strength of the dominant ∼7-year cycle detected in water resources in previous research. Here, we assess periodicities between 2 and 32 years. The wavelet transform provides an instantaneous measure of frequency power within a dataset; as such, it can quantify periodicities beyond the length of the dataset but with lower precision. The median record length of groundwater is 48 years, and 47 years in streamflow, meaning the influence of these record lengths on the detection of periodicities up to 32 years is expected to be minimal.
For all datasets, gaps less than 2 years were infilled to a monthly time step using a cubic spline to produce a complete time series for the wavelet transform. For time series with gaps greater than 2 years, the shortest time period before or after the data gap was removed. The records were not trimmed to obtain a common period of data coverage; instead, all data were trimmed to start at a minimum of 1930. This approach was taken in order to capture data from long-term records (where available). All of the time series were standardised by dividing by their standard deviation and subtracting their mean.
Finally, three time-aggregated series for each water resource record were used: monthly, winter-average (DJF) and summer average (JJA).
3.2 Quantifying widespread water resource drought
In order to meet objective 1, we produced a time series which describes the behaviour of widespread water resource drought across each resource variable (i.e. groundwater or streamflow). In this study we use the drought threshold methodology proposed by Peters (2003). While other measures of drought are available (e.g. standardised precipitation index, SPI; and standardised groundwater index, SGI) (Bloomfield and Marchant, 2013), we adopted a threshold approach as it can be easily applied to both streamflow and groundwater variables.
To calculate a drought series from monthly groundwater level and streamflow series, we first used the threshold methodology given by Eq. (5) from Peters (2003):
where
and M is the full length of the data series. Here we use a threshold level of c=0.3 for groundwater level and c=0.01 for streamflow. Peters (2003) found that a value of 0.3 for groundwater level was comparable to other commonly used thresholds. A value of 0.01 for streamflow was chosen as it produced a similar distribution of drought events as the groundwater drought series. The chosen value of c for either variable is not expected to affect the outcomes of the study as the focus is on the frequency structure of water resource drought, rather than magnitude.
For each measurement site, the monthly time series of drought status (whether in drought according to the threshold criteria or not) was converted into a yearly series describing whether that site experienced a drought in the calendar year. Then, for each year, the number of sites that experienced drought were summed and divided by the number of sites with coverage of that year. This produced a time series of the proportion of sites experiencing drought each year, for groundwater level and streamflow variables. This is referred to as the drought coverage time series. In the case of streamflow, this drought series is analogous to low flows; however, when used in conjunction with a frequency analysis of multi-year periodicities, the method assesses multi-year low flow conditions which may be defined as drought.
3.3 Frequency transformations
3.3.1 Continuous-wavelet transform
The continuous-wavelet transform (CWT) was performed on the drought coverage time series for groundwater and streamflow to understand the frequency behaviour of widespread water resource drought over time. The CWT is often used in geoscience to understand non-stationarities of a variable over time and frequency space (Sang, 2013).
The cross-wavelet transform, W, consists of the convolution of the data sequence (xt) with scaled and shifted versions of a mother wavelet (daughter wavelets):
where the asterisk represents the complex conjugate, τ is the localised time index, s is the daughter-wavelet scale and dt is the increment of time shifting of the daughter wavelet. The choice of the set of scales s determines the wavelet coverage of the series in its frequency domain. The Morlet wavelet was favoured over other candidates due to its good definition in the frequency domain and its similarity with the signal pattern of the environmental time series used (Tremblay et al., 2011; Holman et al., 2011).
The modulus of the transform can be interpreted as the continuous-wavelet power (CWP):
The CWP is therefore an absolute measure of instantaneous frequency strength. We use the package “WaveletComp” produced by Rosch and Schmidbauer (2018) for all wavelet transformations in this paper.
The CWT was also undertaken on the summer-average water resource records for the purpose of reconstructing the influence of dominant periodicities on dry-season water resource behaviour.
3.3.2 Cross-wavelet transform
The bivariate cross-wavelet transform (XWT) was applied between the NAOI and each of the winter-average water resources records (groundwater level, GWL; and streamflow, SF). This produces a cross-wavelet power (XWP) which is analogous to the covariance between the two variables over a time and frequency spectrum. We selected this over the cross-wavelet coherence (analogous to correlation) as this metric requires a high degree of spectral smoothing, making the resultant coherence spectra sensitive to the choice of smoothing approach (Rosch and Schmidbauer, 2018). Here we use the covariance spectrum to compare against the drought series frequency spectrum to understand where strong coherences are reflective of dominant behaviours in water resource drought.
In order to calculate XWP for the bivariate case, it is first necessary to calculate the CWT for each of the variables separately. The XWT between variables x and y is given by
The modulus of the transform can be interpreted as the XWP:
3.3.3 Wavelet significance
Lag-1 autocorrelations (AR1) in environmental datasets can produce emergent low frequency behaviours, making the detection of externally forced behaviours more difficult (Allen and Smith, 1996; Meinke et al., 2005; Velasco et al., 2015). In this study, a significance test was undertaken to test the red-noise null hypothesis that wavelet powers calculated are the result of the recorded variables' AR1 properties. This was based on 1000 synthetic Monte Carlo series with the original AR1 values. In this paper we test significance to the 95 % CI.
The significance spectra for the XWT for each variable pair (e.g. GWL and NAOI) form the primary results for the XWT method in this paper, since the XWP is heavily dependent on the individual series and its frequency composition. The overall relationship between the NAOI and water resources as a whole are investigated by showing the proportion of sites over time and frequency that exhibit a significant relationship with the NAOI (95 % CI). This average significance spectrum is produced by summing the significance matrices across each resource (groundwater level or streamflow) and dividing by the number of records used in year each.
3.3.4 Phase difference
In the bivariate case, the instantaneous phase difference for the XWP spectrum (between wavelets pairs from the CWT spectrum for each variable) can also be calculated as
This is the difference of the individual phases from both variables at an instantaneous time and frequency (period), converted to an angle between −π and π. Values close to 0 indicate the two series move in-phase, with absolute values close to π indicating an out-of-phase relationship. Values between 0 and π indicate degrees of phase difference or phase shift. Phase differences between 0 and π can indicate the degree to which variable x is leading variable y; however a phase difference between 0 and −π can either indicate that variable y is leading variable x, or that variable x is leading by more than half the phase rotation (period length). The degree to which a certain variable is leading is analogous to a lag between the two variables.
3.4 Modulation measurement
In order to understand the degree of modulation that the NAO teleconnection has on water resources, an absolute and relative modulation value has been calculated for each series. Here, we use modulation to describe the degree to which the NAO (or other process) has increased or decreased a water resource measure from its mean. This has been derived by reconstructing a specific principal periodicity range from the XWP, within the summer-average wavelet transform, using the following equation:
where dj is the frequency step and dt is the time step.
This produces a periodic reconstruction of a component of the original dataset that conforms to the set of periodicities (scale steps) selected within the summer-averaged water resource records. The mean and maximum amplitude of this periodic reconstruction was calculated from the absolute values of minima and maxima. Since the data were standardised by dividing by the standard deviation prior to the wavelet transform, this calculated mean and maximum amplitude are also relative to the standard deviation of the original data. Multiplying the calculated amplitude by the original standard deviation converts this back into a real-valued measurement. This was only done for groundwater, since streamflow is highly dependent on catchment size. In the case of streamflow, amplitudes are reported as relative to the standard deviation of the streamflow record. All calculated modulations were produced using reconstructed wavelets from after 1970 where the majority of records are present in both groundwater and streamflow variables. This was done to mitigate the effect of differing record lengths.
4.1 Multiannual water resource covariance with NAOI
Figure 2 shows the NAOI covariance significance spectrum (Fig. 2a and b) and drought frequency spectrum (Fig. 2c and d) for the groundwater level records. These have been plotted together to allow for easier interpretation and comparison of the results, and to indicate broad-scale behaviours. Black lines in the spectral plots show the 95 % CI. The calculated drought series (Fig. 2e) and record coverage (Fig. 2f) have also been plotted alongside for comparison.
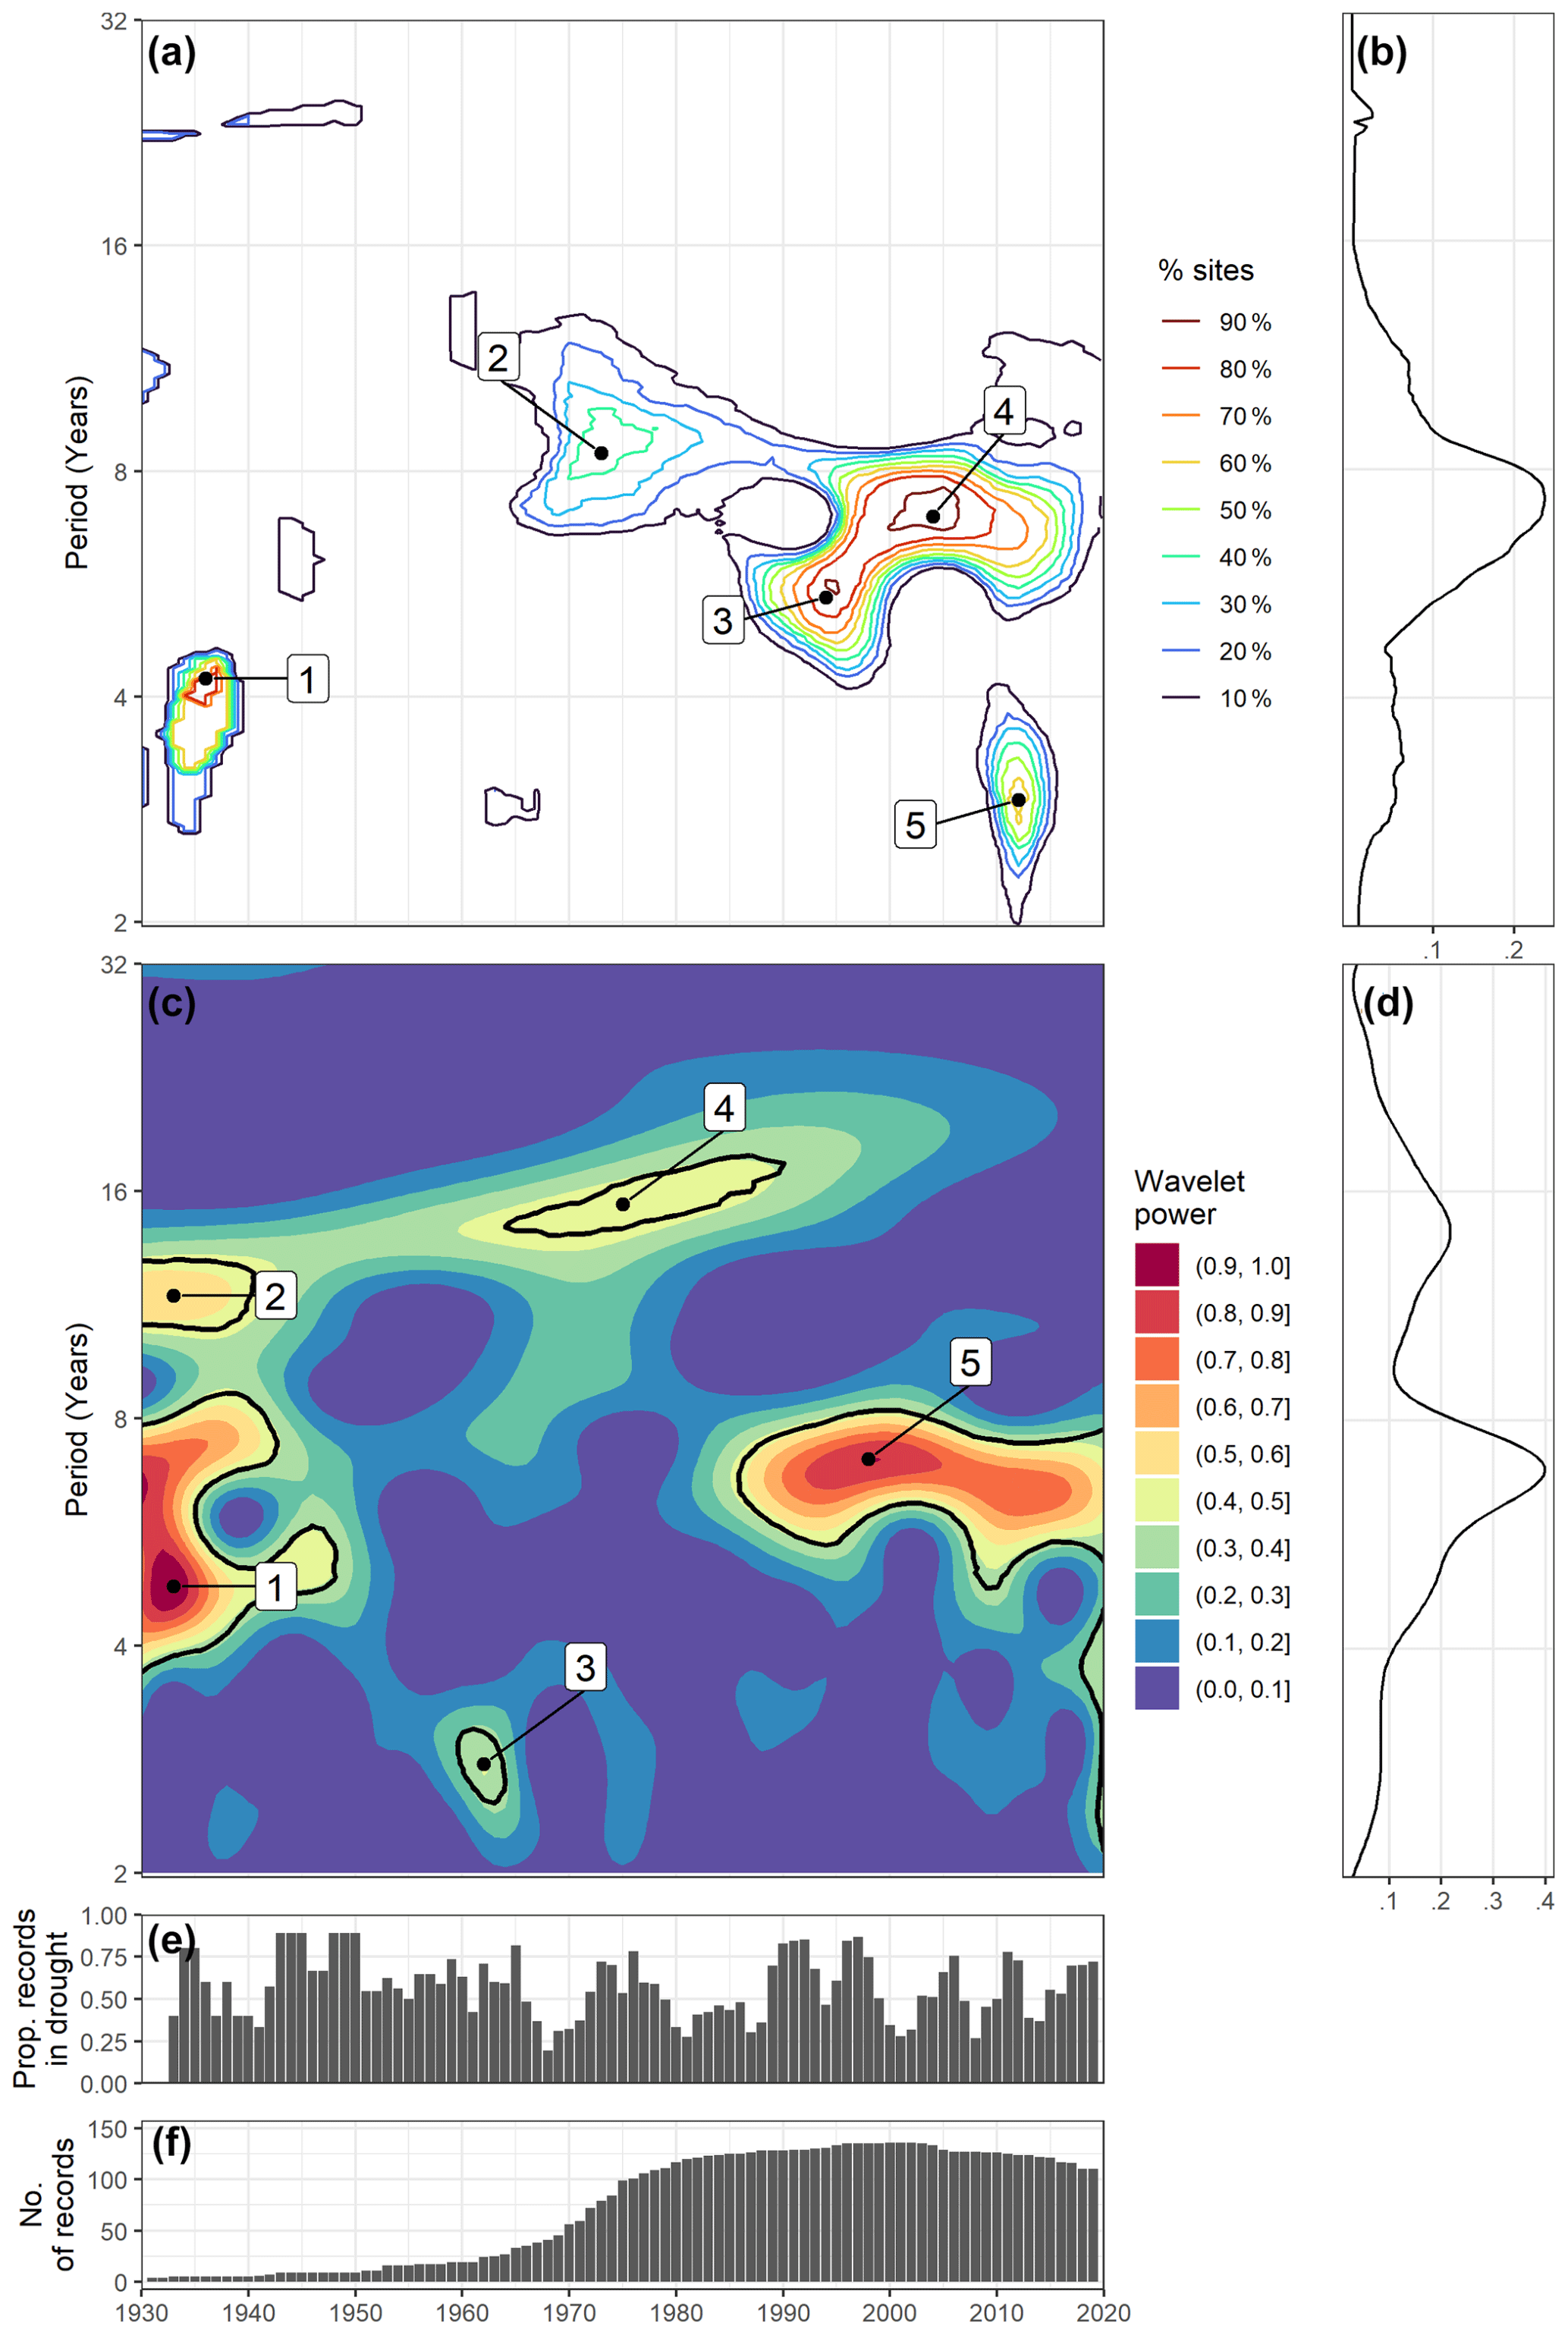
Figure 2(a) Significance (95 % CI) contours between GWL and NAOI, (b) time-averaged proportion of GWL records with a significant XWP with the NAOI (measured as a decimal fraction), (c) wavelet (spectral) power of GWL drought series, (d) time-averaged wavelet (spectral) power of GWL drought series, (e) GWL drought coverage time series and (f) temporal coverage of records.
Figure 2a shows the results from the XWT significance testing between the NAOI and the 136 groundwater level records. Results are displayed as contours showing the percentages of sites that exhibited a significant (0.05 a) XWP within the time–frequency spectrum. There are five localised regions within the NAOI × GWL XWP spectrum that denote a widespread significance between the GWL records and the NAOI. The greatest significance contours of these regions (referred to here as focal points, FPs) are labelled in Fig. 2a as FP 1: 1934 at the 4.2 years periodicity (80 % of records); FP 2: 1974 at the 8.5 years periodicity (40 % of records); FP 3: 1995 at 5.4 years (80 % of records); FP 4: 2005 at 7 years (90 % of records); and FP 5: 2012 at 2.9 years (60 % of records).
These focal points are grouped into three larger regions within the 10 % contour: 1933–1940 spanning the 3- to 5-year periodicity; 1964–2020 spanning the 4- to 12-year periodicity; and 2007–2017 spanning the 2- to 4-year periodicity. There is a single peak in the time-averaged percentage plots (Fig. 2b) at the 7.5-year periodicity (average of 26 % of records).
Figure 2c shows the results from the CWT of the groundwater drought series (shown in Fig. 2e). There are five regions of significant wavelet power in the groundwater drought frequency spectra that are labelled in Fig. 2c as region 1: 1930–1950 in the 4- to 8-year periodicity range (greatest power at 4.8 years); region 2: 1930–1945 in the 10- to 13-year periodicity range (greatest power at 11.7 years); region 3: 1960–1965 in the 2.5- to 3.5-year periodicity range (greatest power at 2.8 years); region 4: 1960–1990 centred at the 12- to 17-year periodicity range (greatest power at 15.4 years); and region 5: 1980–2020 at the 6- to 8-year periodicity range (greatest power at 7 years). There is a sixth significant region starting in 2019 and covering periods between 2 and 5 years; however, this is very close to the end of the record and may be subject to edge effects. As such, this region has not been taken forward for discussion.
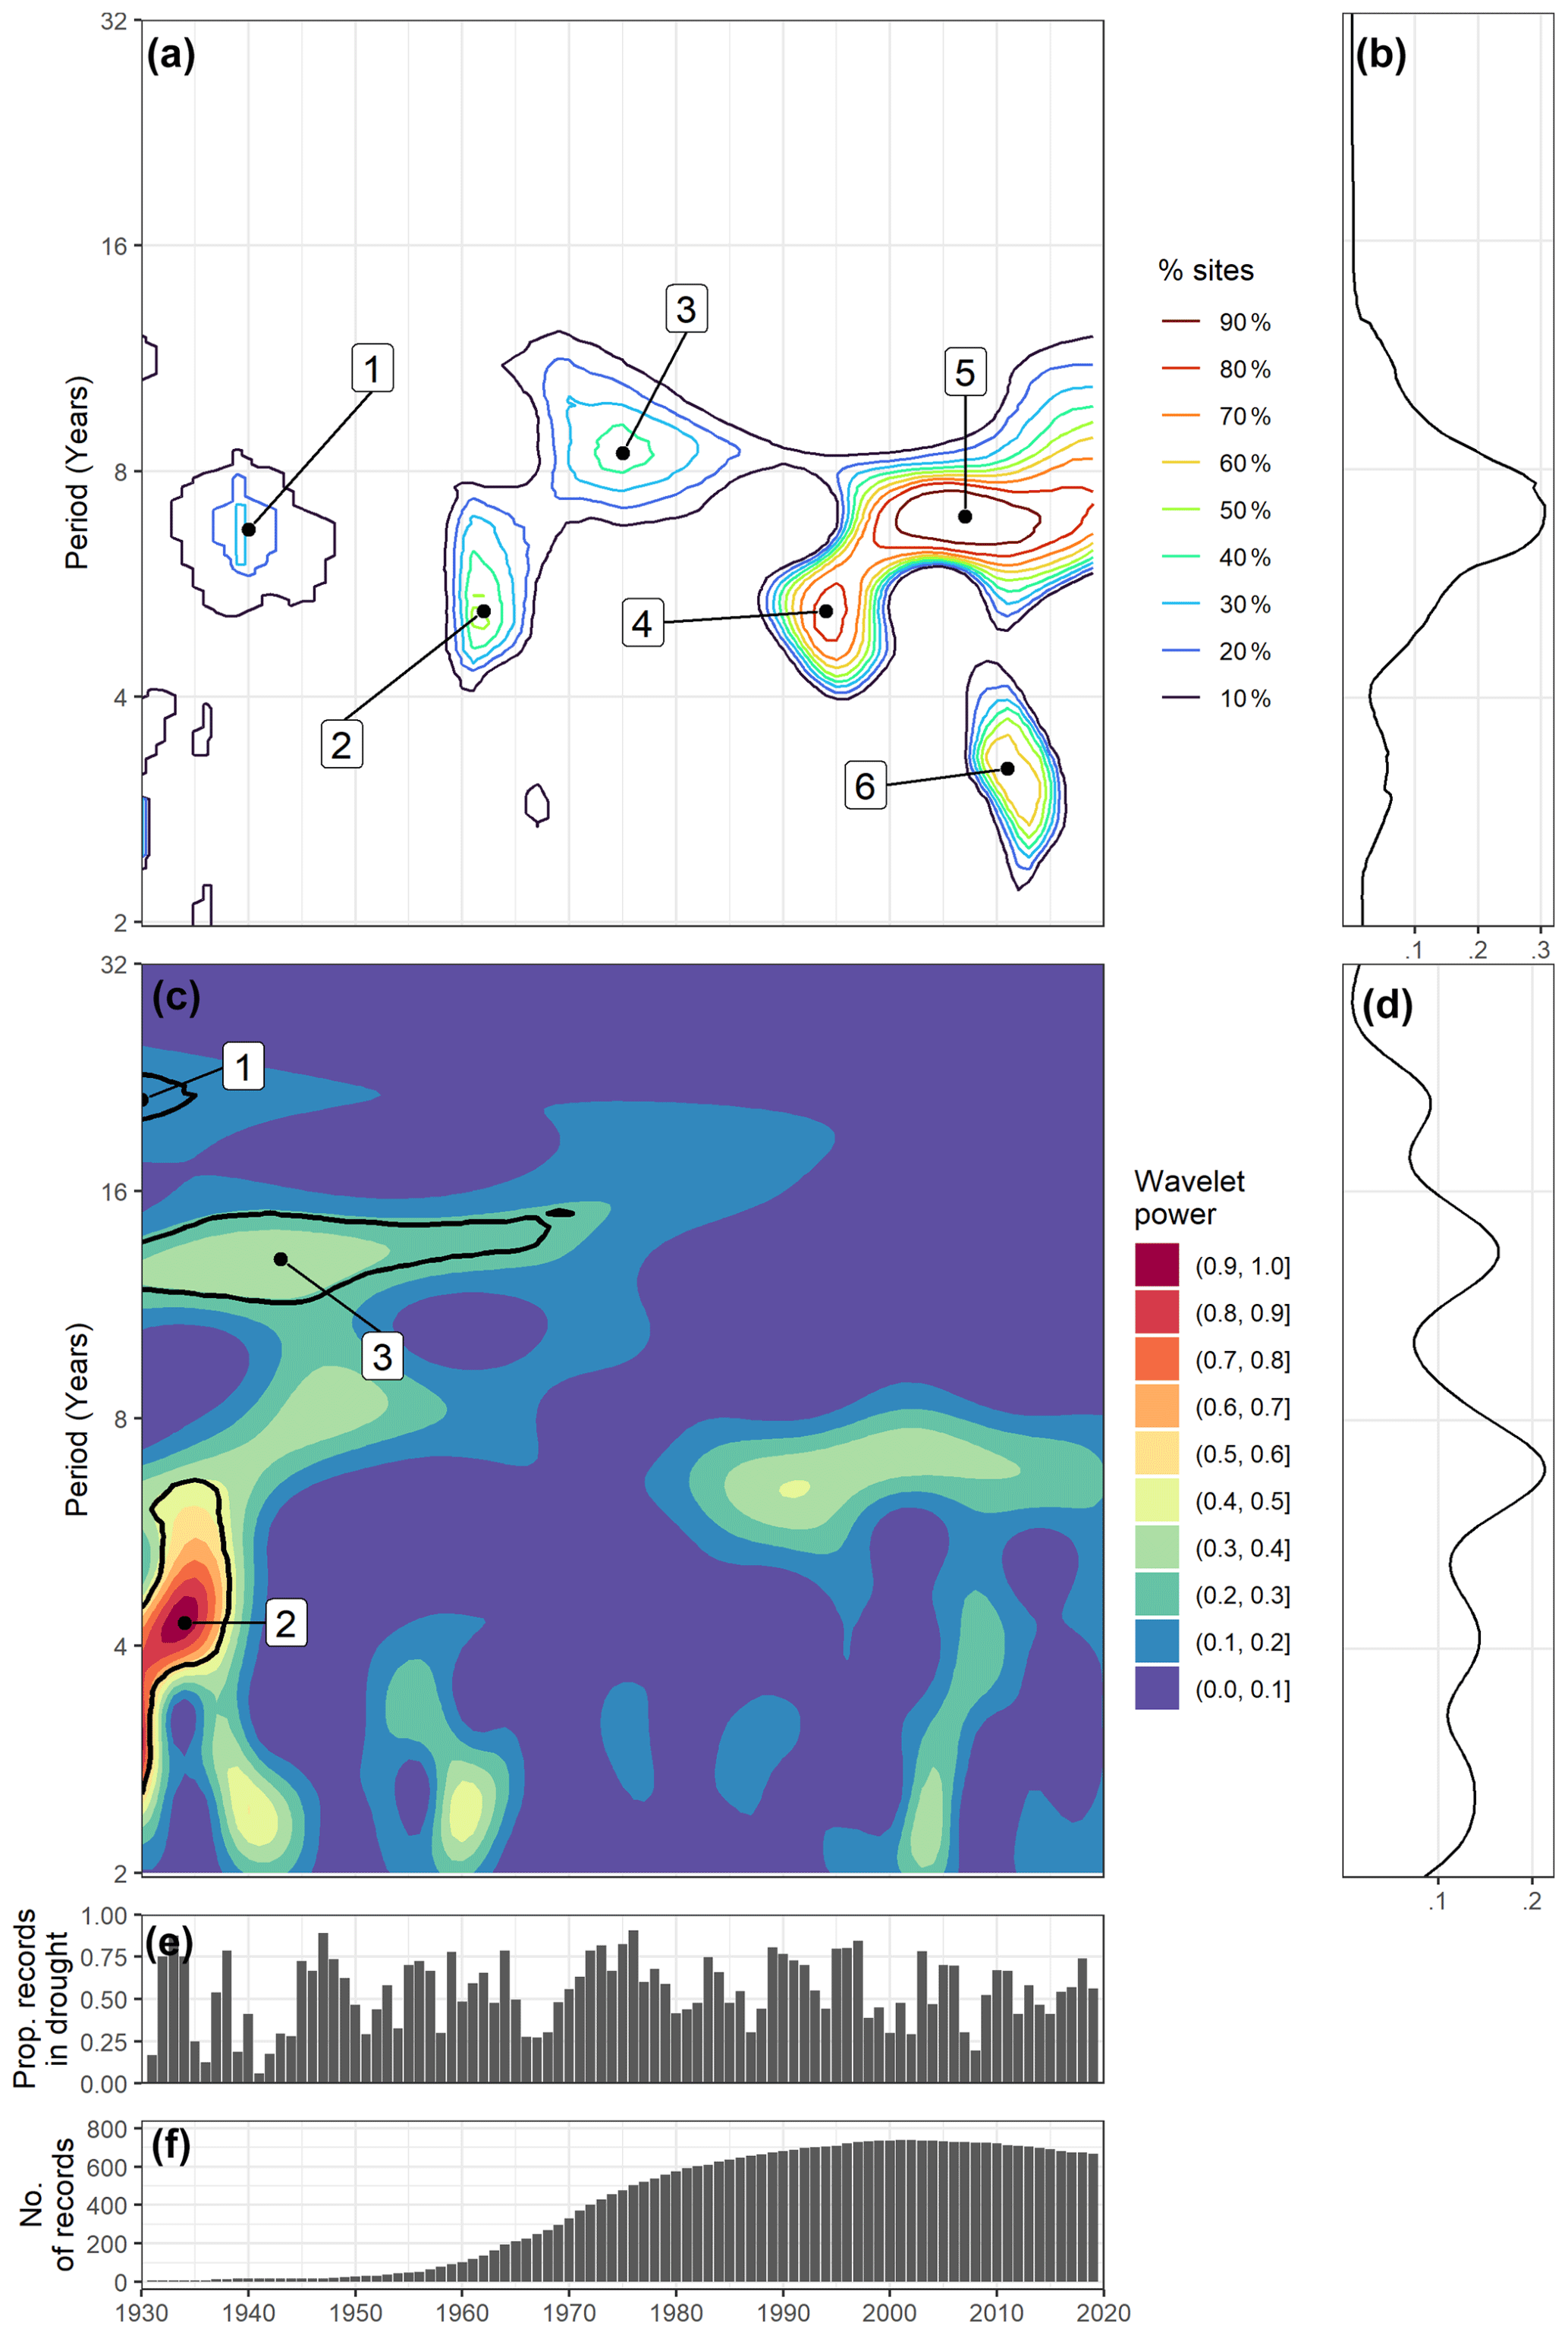
Figure 3(a) Significance (95 % CI) contours between SF and NAOI, (b) time-averaged proportion of SF records with a significant XWP with the NAOI (measured as a decimal fraction), (c) wavelet (spectral) power of SF drought series, (d) time-averaged wavelet (spectral) power of SF drought series, (e) SF drought series showing proportion of records in drought each year and (f) temporal coverage of records.
There are also two notable non-significant regions of medium strength wavelet power (≥0.4): 1930–2000 at the 14- to 23-year periodicity range (centred at 16 years), and 1960–1970 at the 8- to 16-year periodicity range (centred at 9 years). There are two notable peaks in time-averaged wavelet power for the GWL drought series (Fig. 2d); the greatest at the 7-year periodicity (average wavelet power of 0.38), and the second at the 14-year periodicity (average wavelet power of 0.24).
Figure 3 shows the same as Fig. 2 but for the streamflow (SF) case. There are six localised regions within the NAOI × SF XWP spectrum that denote a widespread significance between the SF records and the NAOI. The FPs of these regions are labelled in Fig. 2a as FP 1: 1940 at the 6.7-year periodicity (30 % of records); FP 2: 1962 at the 5.2-year periodicity (50 % of records); FP 3: 1975 at the 8.5-year periodicity (40 % of records); FP 4: 1994 at the 5.2-year periodicity (80 % of records); FP 5: 2007 at the 7-year periodicity (90 % of records); and FP 6: 2011–2015 at the 3.2-year periodicity (60 % of records). These centres are grouped into larger regions within the 10 % contour; these are 1933–1947 spanning the 5.5- to 8-year periodicity; 1960–1970 spanning the 4- to 8-year periodicity; 1965–1990 spanning the 7- to 11-year periodicity; 1988–2000 spanning the 4- to 5.5-year periodicity; 1995–2020 spanning the 4.5- to 11-year periodicity; and 2007–2017 spanning the 2.5- to 4.5-year periodicity. There is a single peak in the time-averaged percentage plots (Fig. 3b) at the 7.5-year periodicity (average of 29 % of records).
Figure 3c shows the results from the CWT of the streamflow drought series (shown in Fig. 3e). There are three regions of significant wavelet power in the groundwater drought frequency spectrum that are labelled in Fig. 3c as region 1: 1930–1935 in the 21-year periodicity (this region appears clipped by the record start date, so the strongest wavelet power for this region may not be captured); region 2: 1930–1937 in the 2.5- to 6.5-year periodicity range (strongest power at 4.3 years); and region 3: 1930–1960 in the 11- to 15-year periodicity range (strongest power at 13 years).
There are four non-significant regions of medium strength wavelet power (≥0.4): 1935–1945 at the 2- to 3-year periodicity; 1955–1965 at the 2- to 4-year periodicity; 1960–2015 at the 5.5- to 8-year periodicity; and 2000–2005 at the 2- to 5-year periodicity. The time-averaged wavelet power for the SF drought series (Fig. 3d) contains multiple peaks suggesting no dominant periodicity. The greatest peak is at the 7-year periodicity with an average wavelet power of 0.21.
4.2 Cross-wavelet phase difference
The cross-wavelet phase difference (ϕ) between water resource variables and the NAOI at the 7.5-year periodicity (identified as prevailing in the previous section) has been displayed in Fig. 4 for the GWL records and Fig. 5 for the streamflow records. The phase difference is a circular measurement where 0 indicates an in-phase relationship (analogous to zero lag) and ±π indicates an out-of-phase relationship between the selected periodicity within the two variables (analogous to half a periodicity lag (3.75 years)). The purpose of these plots of phase differences are to visualise and understand the difference in phase between the NAO and water resources. Records have been split by their aquifer group in Fig. 4, and by catchment region in Fig. 5, to understand if there are any general differences between regions.
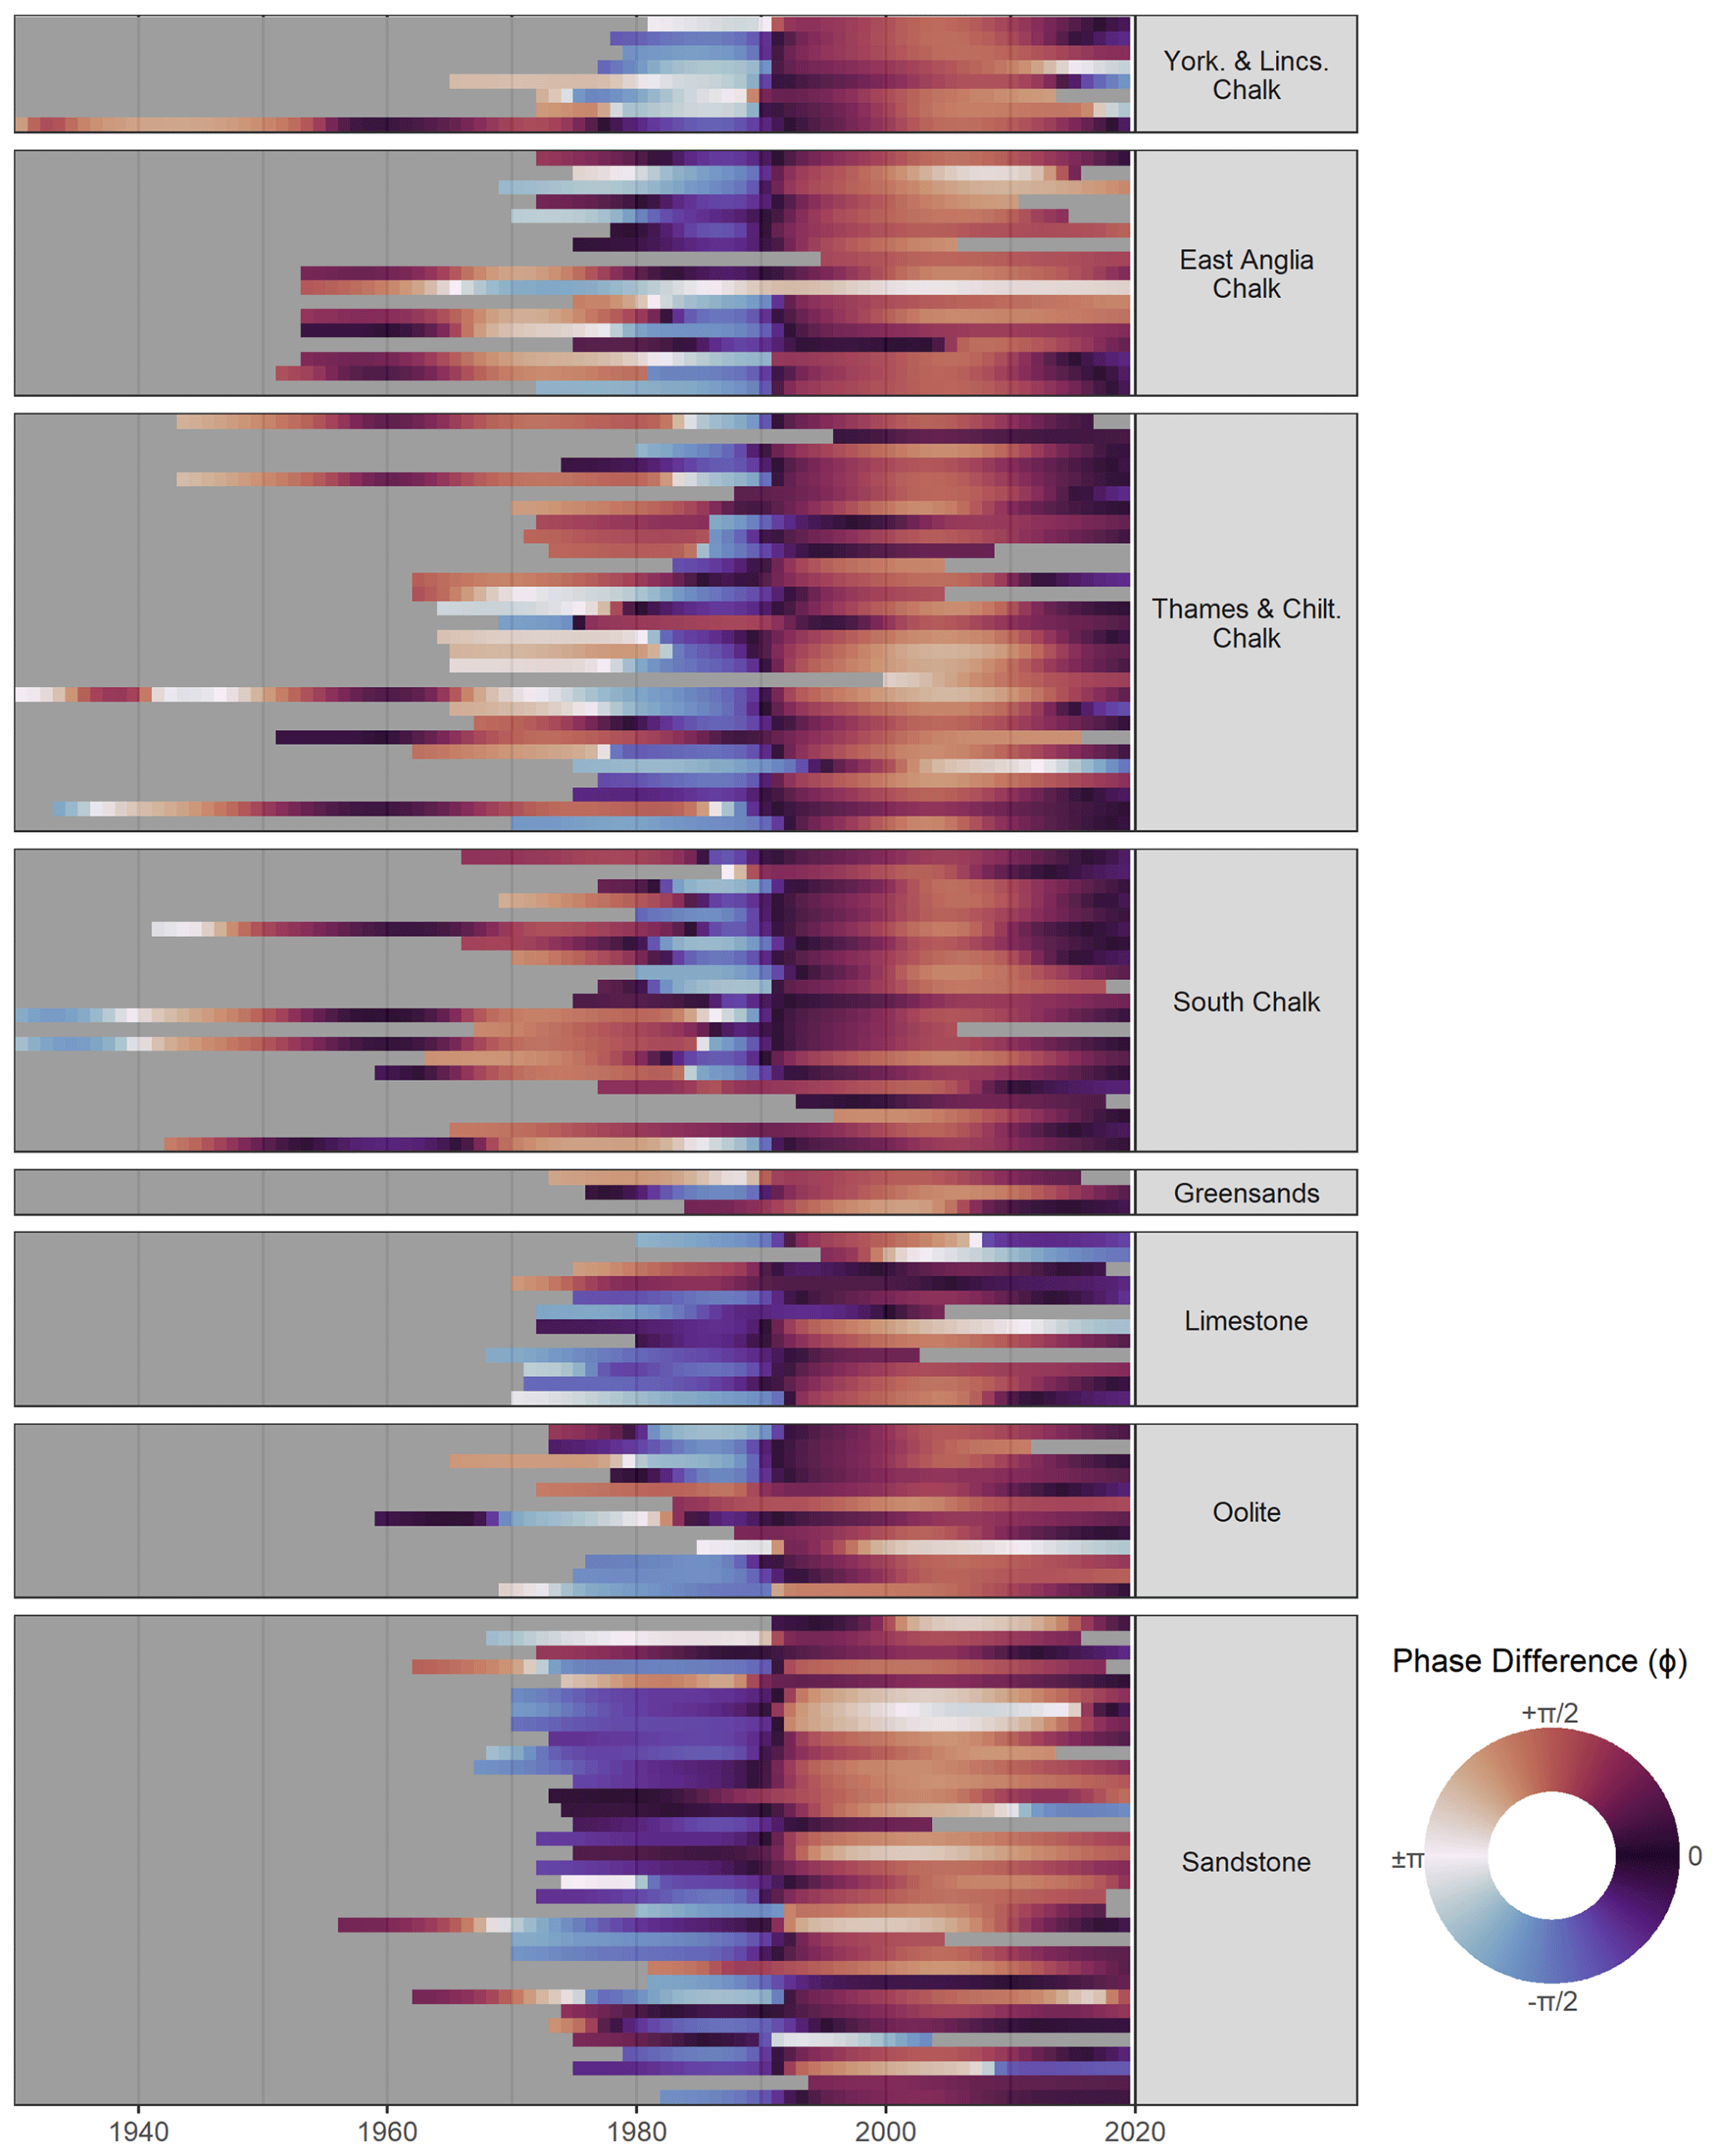
Figure 4Phase difference between the NAOI and each GWL record for the GWL record period. Results are grouped by aquifer regions. ϕ=0 is equivalent to an in-phase relationship and is equivalent to an anti-phase relationship.
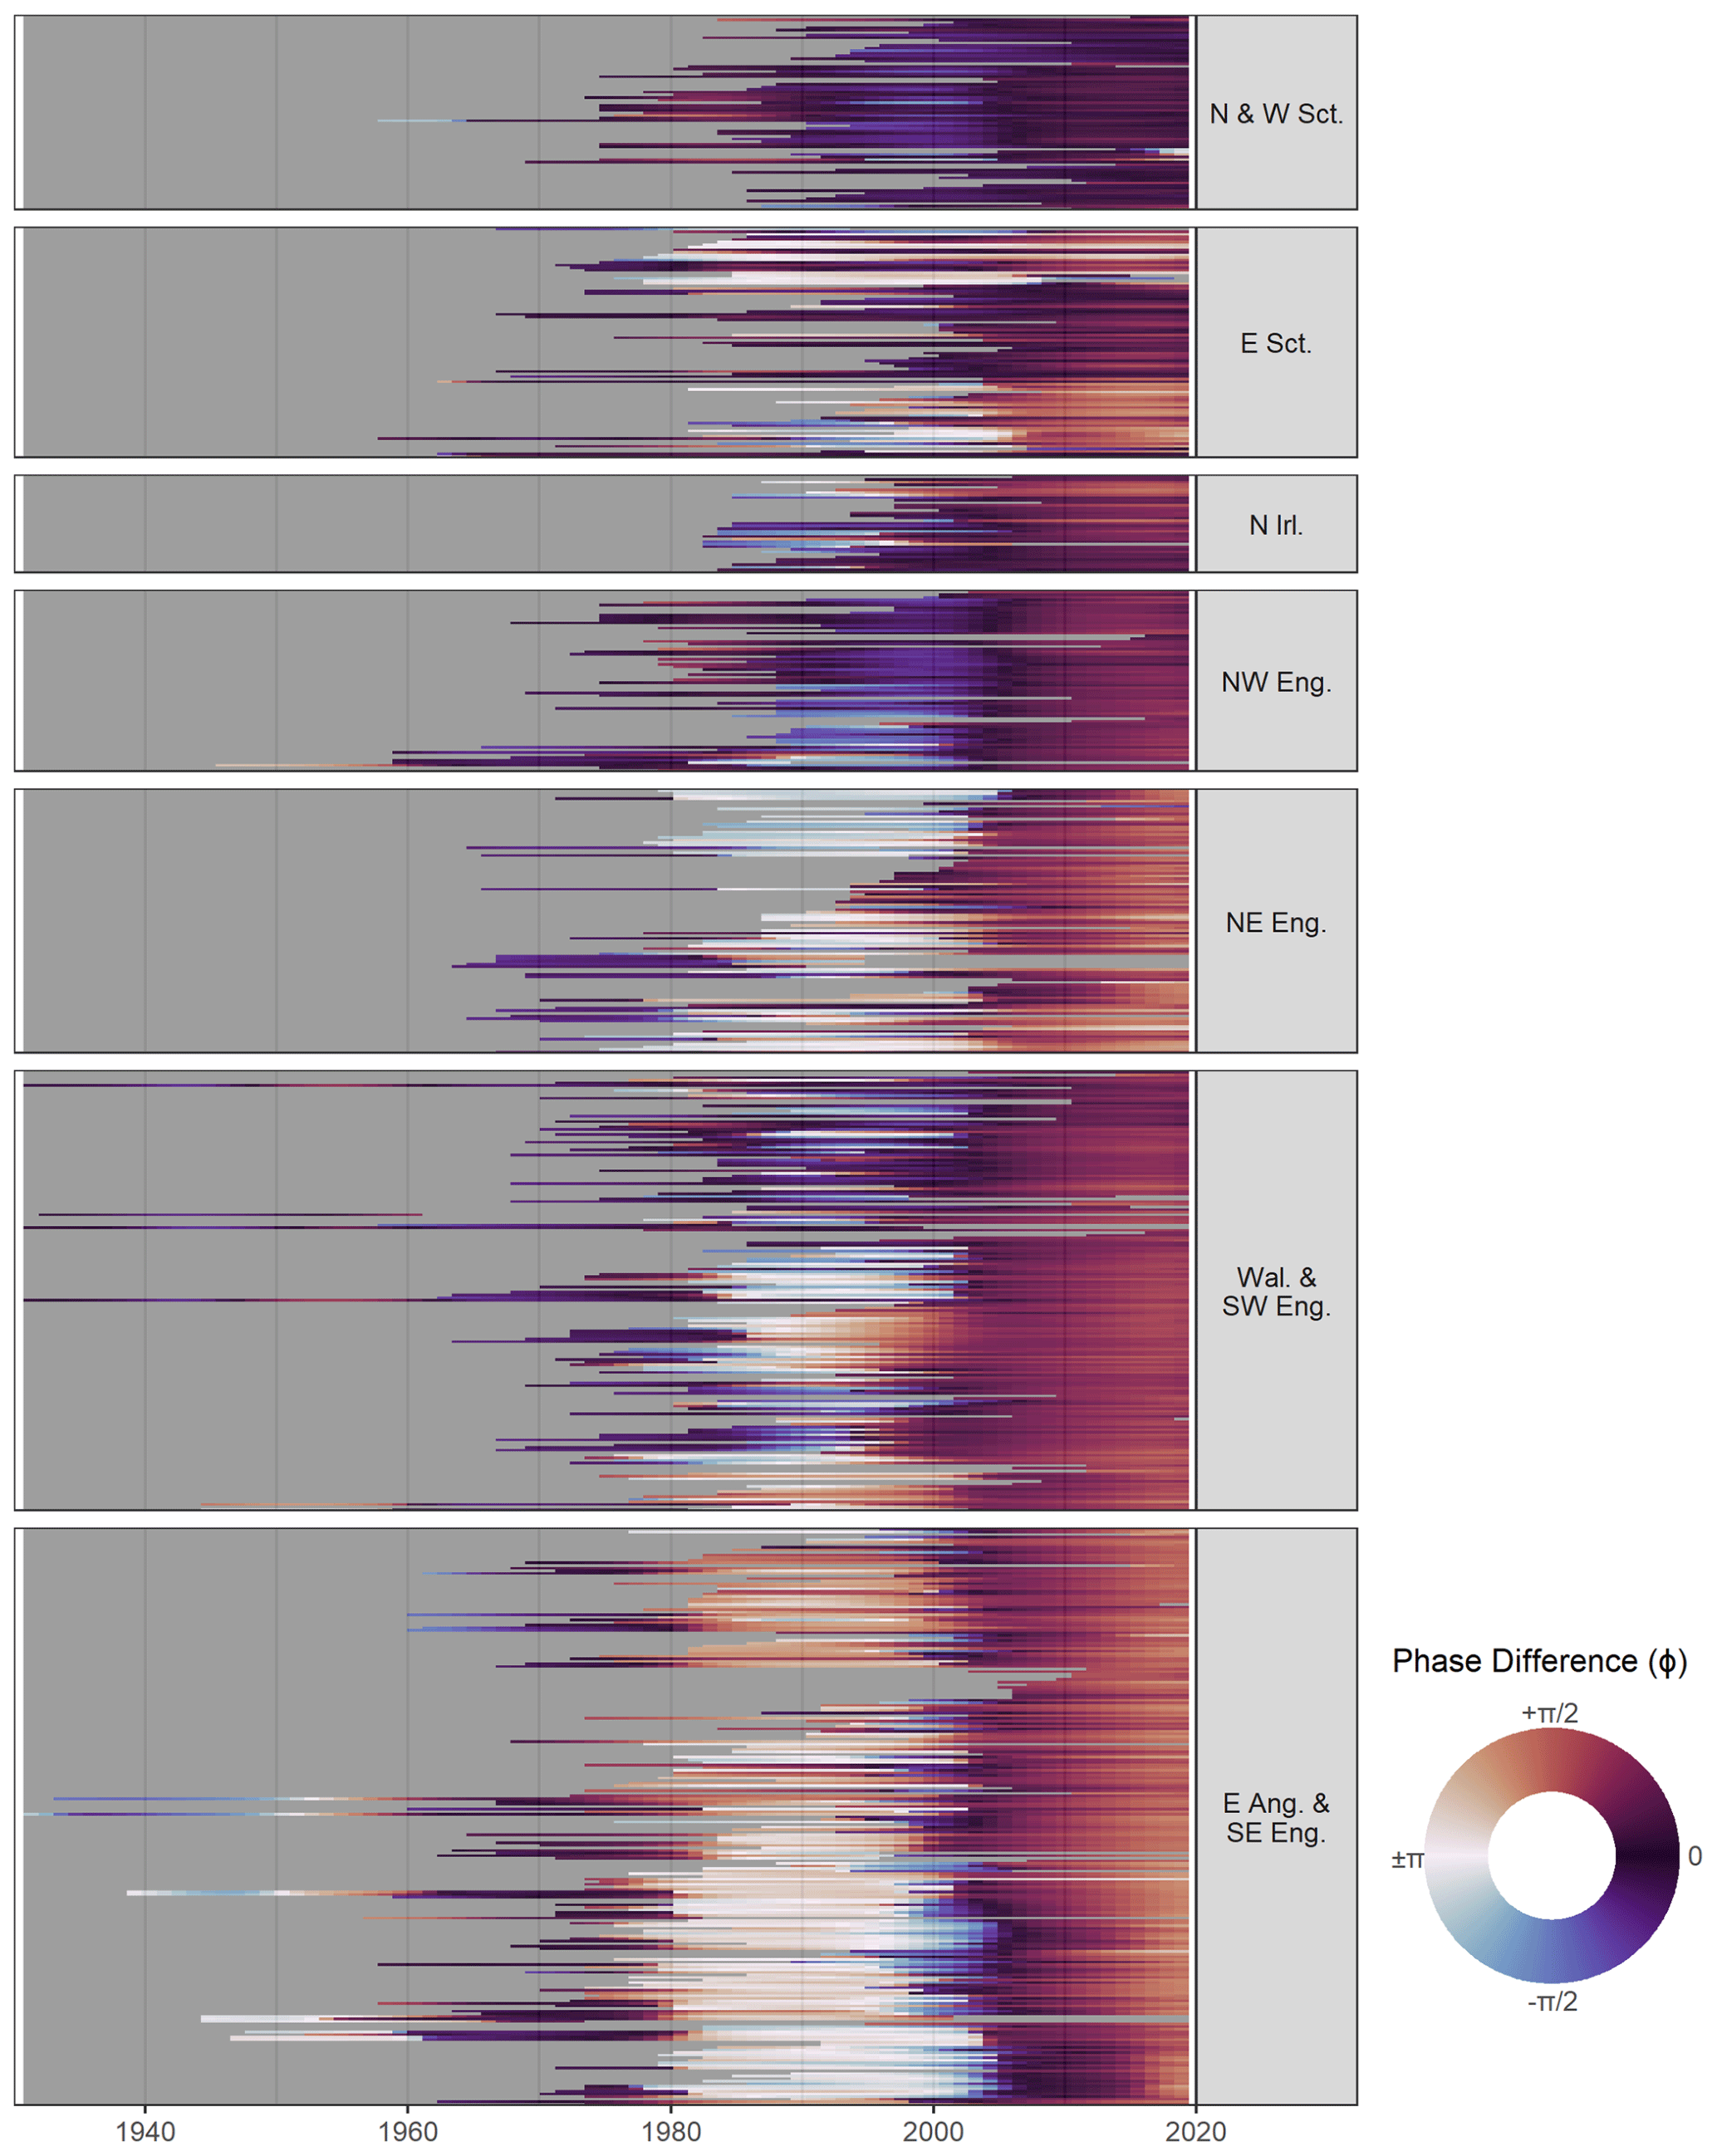
Figure 5Phase difference between the NAOI and each streamflow record for the streamflow record period. Results are grouped by regions. ϕ=0 is equivalent to an in-phase relationship and is equivalent to an anti-phase relationship.
The majority of groundwater level records cover the period 1970 to present, meaning general trends are more clearly presented for this time period. The phase difference of most GWL records can be defined by a sudden shift at approximately 1990 (Fig. 4). Values of ϕ generally range from between and (−0.76–−2.36 rads; generally anti-phase) for the period 1975–1990 to between and (0.76–2.36 rads; generally in-phase) for the period 1990–2019 across all sites. This is with the exception of 17 sites across the South Chalk and Thames and Chiltern Chalk which have shorter approximately anti-phase periods (between approximately 1985 and 1990). Average ϕ values for the period 1970–1990 (1990–2020) for each aquifer region are: −1.26 (1.41) in East Anglian Chalk; −2.25 (1.21) in Lincolnshire Chalk; 0.52 (0.83) in South Chalk; −1.37 (0.83) in Thames and Chiltern Chalk; 1.51 (1.21) in Greensands; −0.78 (0.66) in Limestone; −1.36 (1.09) in Oolite; and −0.70 (1.35) in Sandstone. As such, most aquifer regions experience an average reversal of polarity at 1990. Greensand GWL show no reversal when assessing average ϕ values; however, 1 of the 3 sites in this aquifer group does show this reversal.
Similar to the GWL records, most SF records exhibit a shift in phase difference at approximately 1990, with catchment groups in the north of the UK showing minimal shifts (i.e. north-west Scotland, East Scotland, Northern Ireland and north-west England) (Fig. 5). In the southern catchment groups, values of ϕ generally range from between and ±π (generally anti-phase) for the period 1970–1990 (approximately prior to the shift) to between 0 and (generally in-phase) for the period 1990–2020 (approximately after the shift). Furthermore, catchment groups in the east of the UK (i.e. East Scotland, north-east England, East Anglia and south-east England) during the in-phase period (1990–2020) exhibit a notable transition to increased phase difference (to approximately ) between 2000 and 2010 before decreasing to approximately in 2020. Average ϕ values for the period 1970–1990 (1990–2020) for each catchment region are: −0.21 (0.14) in North and West Scotland; 0.49 (0.86) in East Scotland; −0.43 (0.46) in Northern Ireland; −0.44 (0.47) in north-west England; 2.32 (1.08) in north-east England; 0.77 (0.64) in Wales and south-east England; and 2.53 (0.99) in East Anglia and south-east England.
4.3 Modulation of dry-season water resources
Figure 6 shows two box plots for each aquifer group, representing the distribution of mean (in blue) and maximum (in red) dry-season GWL deviation as a result of the 7.5-year periodicity (over the length of each of the records). Median values from each of these mean and maximum box plots are described below, and are referred to as med.mean and med.max respectively.

Figure 6Distribution of absolute mean and maximum modulation of summer groundwater level as a result of the principal cross-wavelet periodicity between the NAOI and winter groundwater level by aquifer region.
The 7.5-year periodicity accounts for the greatest deviation of dry-season GWL in the Chalk aquifer regions, with the Thames and Chiltern basin GWL showing the greatest modulation of all groups showing a med.mean of 0.94 m and a med.max of 1.38 m. Two other Chalk groups showed similarly strong modulations: the South Chalk basin GWL (med.mean: 0.7 m, med.max: 1.07 m) and the Lincolnshire Chalk GWL (med.mean: 0.56 m, med.max: 0.77 m). The East Anglia GWL show lowest modulation of the Chalk (med.mean: 0.16 m, med.max: 0.34 m), similar to GWL in the Limestone (med.mean: 0.35 m, med.max: 0.51 m) and the Oolite (med.mean: 0.21 m, med.max: 0.33 m). The lowest overall modulations are found in the Sandstone (med.mean: 0.15 m, med.max: 0.25 m) and Greensands aquifers (med.mean: 0.12 m, med.max: 0.17 m).
Figure 7 shows the same as Fig. 6 but for the streamflow case. Streamflow modulations are measured as relative to the standard deviation of each record. Modulation of streamflow for each catchment group are (in descending order of med.mean): Wales and south-west England (med.mean: 0.32, med.max: 0.50); East Anglia and south-east England (med.mean: 0.31, med.max: 0.53); Northern Ireland (med.mean: 0.29, med.max: 0.50); West Scotland (med.mean: 0.27, med.max: 0.46); north-east England (med.mean: 0.27, med.max: 0.47); north-west England (med.mean: 0.26, med.max: 0.46); and East Scotland (med.mean: 0.21, med.max: 0.39).
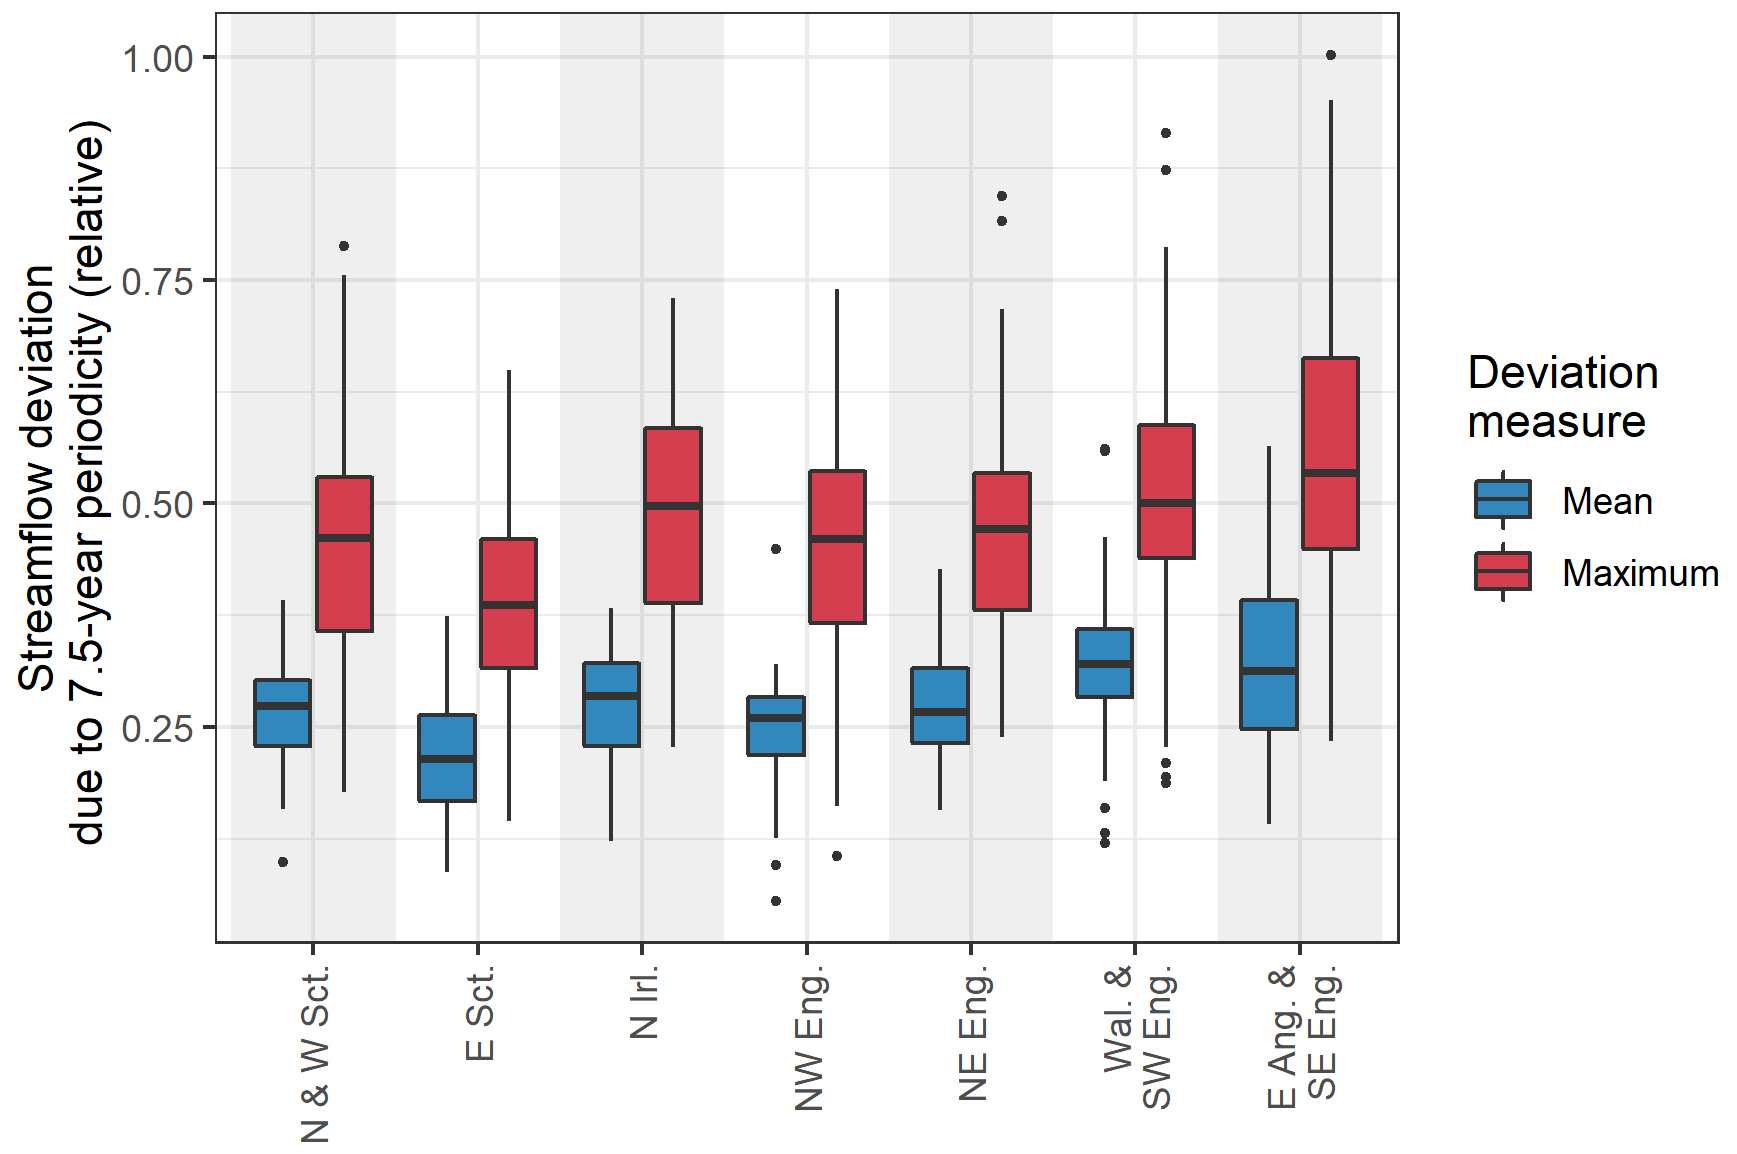
Figure 7Modulation of summer streamflow (relative to record standard deviation) as a result of the principal cross-wavelet periodicity between the NAOI and winter streamflow.
5.1 Historical covariances between the NAOI and water resources at multiannual periodicities
Our results show that the dominant mode of multiannual covariance between the NAOI and UK water resources is at the ∼7.5-year periodicity. This is apparent in the time-averaged covariance significance plots for groundwater (Fig. 2b) and streamflow (Fig. 3b). The same 7.5-year periodicity is also the strongest average mode of periodic behaviour in water resource drought. Periodicities of similar lengths have previously been detected in European GWL records, such as those in the UK (Rust et al., 2018; Holman et al., 2011), Hungary (Garamhegyi et al., 2018), Spain (Luque-Espinar et al., 2008), Italy (De Vita et al., 2012) and Germany (Liesch and Wunsch, 2019), as well as European streamflow records, for example in the UK (Rust et al., 2021a; Burt and Howden, 2013) and Sweden (Uvo et al., 2021). Our results therefore are consistent with principal periodicities detected in wider European water resources and highlight the NAO's wide-scale control on water resource drought.
Despite the prominence of the average 7.5-year periodicity in water resource variables, the wider time–frequency spectra show that the NAO's multiannual control on water resources is subject to considerable transience and non-stationarity across time and frequency. For instance, the percentage of water resource records with a significant covariance with the NAOI at the 7.5-year periodicity remains below 10 % until between 1960 and 1965, with significance becoming abruptly widespread (>30 %) between 1980 and 1985. As such, this suggests that the NAO's control on water resources, at the 7.5-year periodicity, has only been prominent over the past four to five decades. Furthermore, prior to this mode of behaviour, an approximate 16-year periodicity predominated the water resource drought record that did not covary with NAOI. Previous studies have associated a minimum in this 16-year cycle in water resources with the wide-scale 1976 drought (Rust et al., 2019) that affected most UK water resources, particularly in the south of the country (Rodda and Marsh, 2011). These findings are also consistent with Barker et al. (2019) who demonstrate longer duration drought events in the UK for the period 1940–1980 (approximately), and comparatively shorter drought durations for the period 1980 to present. This may be explained by a more prominent low-frequency influence on water resources and drought during this former period (1940–1980), causing longer negative anomalies on drought indices. Finally, Holman et al. (2011) linked a 16-year periodic behaviour in groundwater records with the East Atlantic (EA) pattern, the second-most dominant mode of atmospheric variability in the North Atlantic region. Our results could be interpreted as suggesting an abrupt shift towards increased frequency of water resource drought around 1970–1980 as a result of a transition of periodic control from the EA to the NAO. This interpretation may expand on findings from Neves et al. (2019) who demonstrate that historical droughts in south-west Europe are better explained with a combination of NAO and EA influence. It should be noted that, for periodicities of length 20-years or longer (from which a portion of the increased spectral strength around the 16-year periodicity is comprised), confidence in periodicity strength and detection may start to reduce given the 20-year minimum record length used.
Multiple studies have noted a marked change in European hydrological drought trends since the 1970s, often in the context of the ongoing effects of climate change on water resources (Tanguy et al., 2021; Rodda and Marsh, 2011; Bloomfield et al., 2019). These impacts vary depending on the water resource and region but can include changing drought frequency (Spinoni et al., 2015; Bloomfield et al., 2019; Chiang et al., 2021), severity (Hanel et al., 2018; Bloomfield et al., 2019) and increasing divergence of drought characteristic across Europe (Cammalleri et al., 2020). We show here that a dominant 7.5-year periodicity, driven by the NAO, has occurred coincident to these reported changing trends, and proceeded a secondary periodicity of approximately 16 years. As such, our results suggest that some of the change in drought frequency that has been noted to have occurred since the 1970s may be in-part driven by the NAO's increased periodic control on water resources. Hydroclimate studies often highlight that the interaction between climate change, ocean–atmosphere processes and land–surface processes may be complex, resulting in non-linear hydrological responses to increasing global temperatures (Rial et al., 2004; Wu et al., 2018). As such, the abrupt emergence of a 7.5-year periodicity between the NAO and water resource drought between 1980 and 1985, and its weakening since 2005, may be evidence of this type of non-linear response. While there have been many studies assessing the impact of climate change projections on the NAO (e.g. Rind et al., 2005; Woollings and Blackburn, 2012), there have been few that have investigated potential interactions between climate change and multiannual periodicities in the NAO. As such, the role of climate change in affecting the non-stationary periodicities (detected in this study) is currently unknown.
Yuan et al. (2017) highlight the importance of suitable calibration period selection for the development of drought early warning systems, particularly in climate change scenarios. Many of these systems in Europe (e.g. Hall and Hanna, 2018; Svensson et al., 2015) rely on high-resolution hydrometeorological datasets for calibration of historical relationships, many of which are only available for recent decades (Rust et al., 2021b; Sun et al., 2018). We show here that frequency statistics potentially used as calibration bases for water resource early warning systems can exhibit both multidecadal periods of stability and abrupt sub-decadal non-stationarities, driven by multiannual behaviours in the NAO. Furthermore, we show a weakening of the dominant 7.5-year periodicity since 2005, suggesting that a different frequency structure may predominate water resource drought from the 2020s. This further highlights the need for continuous recalibration of critical forecasting utilities, and the potential benefit of including the NAOI as a covariate when understanding multiannual periodic variability in European water resources.
5.2 Phase difference between NAO and water resource records at 7.5-year periodicity
The quantification of lead times between meteorological processes and water resource response is critical in the development of early warning systems for water resource management. As such, hydroclimate studies have sought to investigate temporal lags between multiannual periodicities in the NAO and water resource variables across Europe (Uvo et al., 2021; Neves et al., 2019; Holman et al., 2011). However, previous research has highlighted that the relationship strength and sign between the NAO and European rainfall is non-stationary at sub-decadal to decadal timescales (Rust et al., 2021b, Vicente-Serrano and López-Moreno, 2008). The extent to which this non-stationarity is projected to multiannual periodicities in water resources was previously unknown. Sign change is synonymous with a phase difference shift of approximately π between periodic components of the NAO and water resources, and as such has the potential to disrupt the projection of lead times into future scenarios. Here we assess the phase difference between the NAO and water resources at a country scale to identify the extent to which this non-stationary is present at multiannual periodicities.
Most water resources records exhibit an abrupt shift in phase difference of approximately −π around 1990. An earlier shift (of approximately +π) is also apparent between 1970 and 1980, however this is less temporally aligned across the fewer records that cover this period. This suggests that, for the period of approximately 1970–1990, the relationship sign between the NAO and water resources was inverted. Furthermore, the timing of this period of inversion generally aligns with reported periods of sign inversion in existing studies between the NAO and UK rainfall (Rust et al., 2021b; Vicente-Serrano and López-Moreno, 2008). It is interesting to note that this period of inversion is notably shorter for some groundwater level records of the Chalk (e.g. those in South Chalk and Thames and Chiltern Chalk). Rust et al. (2021b) showed that the south and south-east of the UK was subject to the increased non-stationarity of the NAO–precipitation relationship when compared with other regions, which may explain these relatively short periods of relationship inversion. A similar spatial pattern is shown in the streamflow records, with minimal phase difference shifts in north-west England, Scotland and Northern Ireland where more stable signs have been found by Rust et al. (2021b).
Localisation of this non-stationarity between the NAO and water resources at multiannual periodicities suggests it is possible to identify a discrete time period of sufficient stationarity from which to calculate lead-in times for early warning systems (for instance, between 1990 and 2020). However, phase differences for this period also show a degree of non-stationarity, varying by up to approximately . Some of this variance may be due to changing storage dynamics within a catchment over time (Rust et al., 2014; Beverly and Hocking, 2012), but also the introduction of red noise from reconstructing from non-significant wavelets. This also explains the increased variance seen in aquifer groups characterised by higher autocorrelation (e.g. Sandstone) (Bloomfield and Marchant, 2013), and the relatively low variance seen in streamflow records which often have lower autocorrelation when compared with groundwater level (Hannaford et al., 2021). While this can be minimised by calculating phase difference from significant wavelets only, we have shown in the previous section that the significance between the NAO and water resources and multiannual periodicities is also subject to notable non-stationarity.
Finally, in order to calculate accurate lead-in times between periodicities in the NAO and water resources in future scenarios, a sufficient systematic understanding of the NAO sign non-stationarity is required. However, there is limited research that has investigated the causes for these modes of multiannual non-stationarity. Vicente-Serrano and López-Moreno (2008) suggest that an eastward shift of the NAO's southern centre of action may account for a portion of this variability, but highlight that further work is required for this to be a sufficient explanation of a changing correlation between the NAO and European rainfall. As such, existing non-stationarities between the NAO and water resources at multiannual periodicities remains a considerable barrier to its application in improving preparedness for future water resource drought.
5.3 NAO multiannual modulations on water resources in future scenarios
Water resource management systems are in place across Europe to improve planning and preparedness for the projected effects of climate change. As such, in order for multiannual NAO modulations of water resources to have sufficient utility for water management systems in future scenarios, they need to exhibit a comparable influence on water resources to the projected effects of climate change. Here, we present historical modulations of summer water resource variables from the principal NAO periodicity alongside expected impacts on water resources from climate change projections in order to discuss their comparative influence.
Jackson et al. (2015) estimated median groundwater level change due to climate change in 24 boreholes across the Chalk, Limestone, Sandstone and Greensand aquifer groups in the UK for the 2050s under a high emission scenario for September (as a typical annual minima of groundwater levels in the UK). Median levels from each site in Jackson et al. (2015) have been regrouped and averaged across the broad aquifer groups used in this study to allow comparison with historical deviations in water resource results as a result of the NAO's 7.5-year periodicity. This comparison is provided in Table 1.
Table 1Synthesis of Table 3 from Jackson et al. (2015). Median results from the absolute teleconnection modulation on groundwater level from Fig. 3 of this paper are also presented for the mean and maximum modulation cases. NAO teleconnection modulations greater than the reported 50th percentile climate change modulation are in bold.
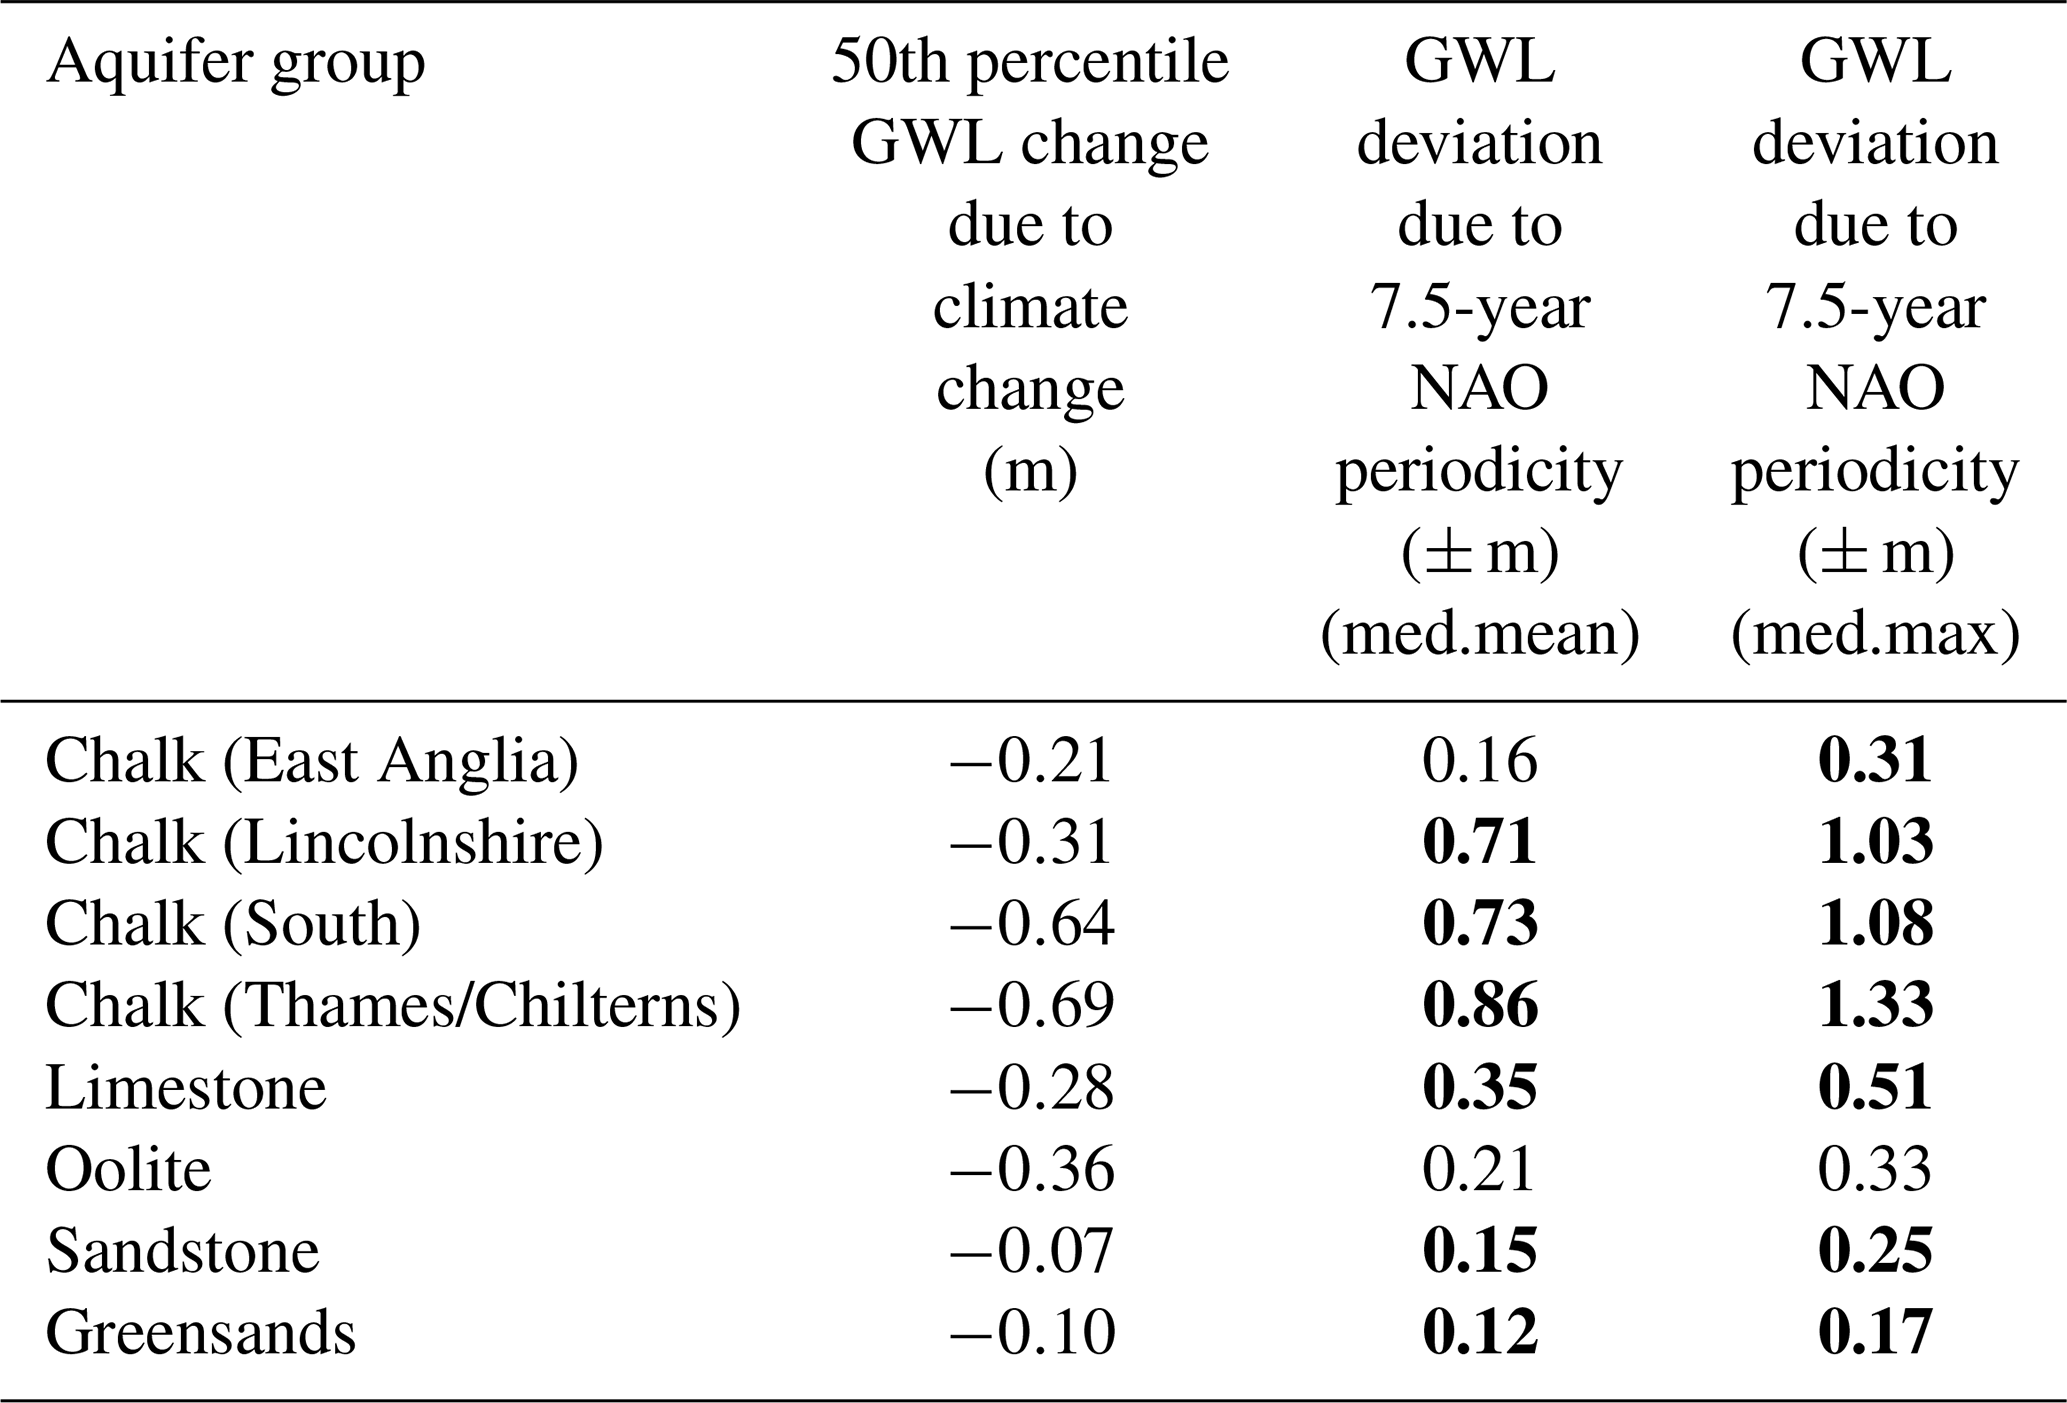
Historical modulations in groundwater level due to multiannual periodicities in the NAO were greater than projected GWL modulation from a high emissions climate change scenario, in all but two aquifer groups for mean NAO modulation (East Anglia Chalk, Oolite), and all but one for maximum NAO modulation (Oolite). Similar degrees of GWL modulation from climate change scenarios have been shown for wider European aquifer systems (e.g. Dams et al., 2012), and our results for NAO modulations of GWL are of a similar degree to those reported by Neves et al. (2019) for aquifers in the Iberian Peninsula. While few studies have looked at multiannual NAO modulations of groundwater level across Europe, our results here suggest a similar response across western Europe, where the NAO has a greater influence on precipitation (Trigo et al., 2002). However, existing studies note uncertainties in the future trends of groundwater level change due to climate change. For instance, Yusoff et al. (2002) demonstrated that it was not possible to predict whether groundwater level would rise or fall between the 2020s and 2050s, Bloomfield et al. (2003) showed that groundwater levels were expected to rise in the 2020s but fall in the 2050s, and Jackson et al. (2015) showed reductions in annual and average summer levels but increases in average winter levels by the 2050s. For streamflow, Kay et al. (2020) give estimated modulations to low flows (Q95) as a result of climate change (2050 horizon). While no Scottish catchments were used in the study, percentage modulations for low flows were found to be mostly between 0 % and −20 % change with some catchments showing up to −40 % change for catchments in the west and south-west of the UK. Schnieder et al. (2013) show similar low flow modulations across Europe as a result of climate change, ranging from +20 % for north-west Europe to −40 % in the Iberian Peninsula. As such, our results for streamflow (Fig. 7) indicate that multiannual NAO modulation of streamflow has been, on average, comparable to the expected change due to climate change scenarios. The NAO modulations in streamflow are notably less than those found in groundwater level, as may be expected given the established sensitivity of groundwater processes to long-term changes in meteorological fluxes (Forootan et al., 2018; Van Loon, 2015; Folland et al., 2015). Given the scale of multiannual NAO influence on water resource compared with the estimated effects of climate change, the NAO may have the potential to impact the projected trend of water resource variability in certain future scenarios more than was previously understood, and therefore effect the required adaptive management response. However, existing research has shown that current global climate models (GCMs) do not fully replicate low frequency behaviours in the NAO that have been historically recorded (Eade et al., 2022). Given the importance of multiannual periodicities in the NAO in defining water resource behaviour, demonstrated here and in other research (e.g. Uvo et al., 2021; Neves et al., 2019), this raises notable uncertainties in the use of GCMs' outputs for projecting European water resource behaviour into future scenarios. Findings reported here suggest that current projections from these GCMs may contain errors that are comparable to the current projected effect of climate change on water resources. This therefore highlights the need for improved low frequency representation in GCMs, and for an understanding of non-stationary atmospheric behaviours which can considerably influence wide-scale water resource behaviour.
It is important to note that, given the large number of sites used from the NRFA in this study, no consideration has been made here for the role of anthropogenic influence on catchment response. We acknowledge here that, depending on the way in which river management regimes are applied, water resources frequencies may be altered or compounded by anthropogenic influences. However, it is expected that, in the majority of cases, these influences (e.g. effluent discharge or managed streamflow regimes) may produce a noise within the frequency spectra of streamflow, but not impart a systematic periodicity. Furthermore, while studies have detected the influence of climate-induced abstraction (Wendt et al., 2020; Gurdak, 2017), these influences have generally been small in comparison with the driving drought anomalies. As such, we expect anthropogenic influences to have a minimal effect on the findings of this study. It is suggested that the role of anthropogenic influences on UK water resources frequency spectra be investigated as part of future research.
Additionally, while this study focuses on UK water resources, 132 of the 136 groundwater boreholes used are located in England with the majority of them situated within the Chalk. While this skew does not affect the findings of this paper, it is important to note that broad-scale multiannual periodicities of groundwater resources in Wales, Northern Ireland or Scotland have not been assessed here.
Rust et al. (2018) set out a conceptual model for how multiannual modulations of water resources due to the NAO may provide a system for improving water resource forecasts and management regimes. This model highlights the need for a systematic understanding of how multiannual periodicities affect water resources over time, including temporal lags and amplitude modulation between the NAO and water resources. We demonstrate that the degree to which the NAO's 7.5-year periodicity has modulated historical water resources is of a similar order of magnitude to the estimated impacts on water resource variables from climate change projections. These results further show the importance of including the influence of multiannual NAO periodicities on water resources in the understanding of future drought, as they have the potential to affect the required management regime for certain resources in climate change scenarios. However, we also show that there are notable non-stationarities in NAO periodicities over time and their relationship with water resource response, for which there is limited systematic understanding in existing hydroclimate literature.
This paper assesses the utility of the relationship between the NAO and water resources, at multiannual periodicities, for improving preparedness of water resource drought in Europe. We review this relationship in the context of non-stationary dynamics within the NAO and its control on UK meteorological variables, as well as its potential impact on water resources in climate change scenarios. We provide new evidence for the time–frequency relationship between the NAO and water resources in western Europe showing that a widespread 7.5-year periodicity, which predominates the multiannual frequency structure of many European water resources, is the result of a non-stationary control from the NAO between approximately 1970 and 2020. Furthermore, we show that known non-stationarities of the relationship sign between the NAOI and European rainfall at the annual scale are present in water resources at multiannual scales. A current lack of systematic understanding of both these forms of non-stationarity, in existing atmospheric or meteorological literature, is a considerable barrier to the application of this multiannual relationship for improving preparedness for future water resource drought. However, we also show that the degree of modulation from multiannual NAO periodicities on water resources can be comparable to modulations from a worst-case climate change scenario. As such, multiannual periodicities offer a valuable explanatory variable for ongoing water resource behaviour that has the potential to heavily impact the required management regimes for individual resources in climate change scenarios. Therefore, we highlight knowledge gaps in atmospheric research (e.g. the ability of climate models to simulate NAO non-stationarities) that need to be addressed in order for multiannual NAO periodicities to be used in improving early warning systems or improving preparedness for water resource drought.
The groundwater level data used in this study are from the WellMaster Database in the National Groundwater Level Archive of the British Geological Survey. The data are available under license from the British Geological Survey at https://www.bgs.ac.uk/products/hydrogeology/wellmaster.html (British Geological Survey, 2021).
The streamflow data as well as the metadata used in this study are freely available from the NRFA website at http://nrfa.ceh.ac.uk/ (National River Flow Archive, 2021).
The data that support the findings of this study are available in Cranfield Online Research Data (CORD) at https://doi.org/10.17862/cranfield.rd.16866868.v1 (Rust et al., 2022). This study was a re-analysis of existing data that are publicly available from NCAR at https://climatedataguide.ucar.edu/climate-data/hurrell-north-atlantic-oscillation-nao-index-pc-based (NCAR, 2021).
WR designed the methodologies and carried them out with supervision from all co-authors. WR prepared the article with contributions from all co-authors.
The contact author has declared that neither they nor their co-authors have any competing interests.
Publisher's note: Copernicus Publications remains neutral with regard to jurisdictional claims in published maps and institutional affiliations.
This work was supported by the Natural Environment Research Council (grant nos. NE/M009009/1 and NE/L010070/1) and the British Geological Survey (Natural Environment Research Council). John P. Bloomfield publishes with the permission of the Executive Director, British Geological Survey (NERC). Mark Cuthbert gratefully acknowledges funding for an Independent Research Fellowship from the UK Natural Environment Research Council (NE/P017819/1). We thank Angi Rosch and Harald Schmidbauer for making their wavelet package “WaveletComp” freely available.
This research has been supported by the Natural Environment Research Council (grant nos. NE/M009009/1 and NE/L010070/1), and Mark Cuthbert has been supported by an Independent Research Fellowship from the UK Natural Environment Research Council (NE/P017819/1).
This paper was edited by Yi He and reviewed by Neil Macdonald and one anonymous referee.
Allen, D. J., Brewerton, L. J., Coleby, L. M., Gibbs, B. R., Lewis, M. A., MacDonald, A. M., Wagstaff, S. J., and Williams, A. T.: The physical properties of major aquifers in England and Wales, BGS Report WD/97/034, British Geological Survey, 333 pp., http://nora.nerc.ac.uk/id/eprint/13137/ (last access: 11 November 2021), 1997.
Allen, M. R. and Smith, L. A.: Monte Carlo SSA: Detecting irregular oscillations in the Presence of Colored Noise, J. Climate, 9, 3373–3404, https://doi.org/10.1175/1520-0442(1996)009<3373:MCSDIO>2.0.CO;2, 1996.
Barker, L. J., Hannaford, J., Parry, S., Smith, K. A., Tanguy, M., and Prudhomme, C.: Historic hydrological droughts 1891–2015: systematic characterisation for a diverse set of catchments across the UK, Hydrol. Earth Syst. Sci., 23, 4583–4602, https://doi.org/10.5194/hess-23-4583-2019, 2019.
Beverly, C. and Hocking, M.: Predicting Groundwater Response Times and Catchment Impacts From Land Use Change, Aust. J. Water Resour., 16, 29–47, https://doi.org/10.7158/W10-847.2012.16.1, 2012.
Bloomfield, J. P.: The role of diagenesis in the hydrogeological stratification of carbonate aquifers: An example from the Chalk at Fair Cross, Berkshire, UK, Hydrol. Earth Syst. Sci., 1, 19–33, https://doi.org/10.5194/hess-1-19-1997, 1997.
Bloomfield, J. P. and Marchant, B. P.: Analysis of groundwater drought building on the standardised precipitation index approach, Hydrol. Earth Syst. Sci., 17, 4769–4787, https://doi.org/10.5194/hess-17-4769-2013, 2013.
Bloomfield, J. P., Gaus, I., and Wade, S. D.: A method for investigating the potential impacts of climate-change scenarios on annual minimum groundwater levels, Water Environ. J., 17, 86–91, https://doi.org/10.1111/j.1747-6593.2003.tb00439.x, 2003.
Bloomfield, J. P., Marchant, B. J., and McKenzie, A. A.: Changes in groundwater drought associated with anthropogenic warming, Hydrol. Earth Syst. Sci., 23, 1393–1408, https://doi.org/10.5194/hess-23-1393-2019, 2019.
Bonaccorso, B., Cancelliere, A., and Rossi, G.: Probabilistic forecasting of drought class transitions in Sicily (Italy) using Standardized Precipitation Index and North Atlantic Oscillation Index, J. Hydrol., 526, 136–150, https://doi.org/10.1016/j.jhydrol.2015.01.070, 2015
Brady, A., Faraway, J., and Prosdocimi, I.: Attribution of long-term changes in peak river flows in Great Britain, Hydrolog. Sci. J., 64, 1159–1170, https://doi.org/10.1080/02626667.2019.1628964, 2019.
British Geological Survey: WellMaster hydrogeological database, Natural Environment Research Council, https://www.bgs.ac.uk/products/hydrogeology/wellmaster.html, last access: 11 November 2021.
Burt, T. P. and Howden, N. J. K.: North Atlantic Oscillation amplifies orographic precipitation and river flow in upland Britain, Water Resour. Res., 49, 3504–3515, https://doi.org/10.1002/wrcr.20297, 2013.
Cammalleri, C., Naumann, G., Mentaschi, L., Bisselink, B., Gelati, E., De Roo, A., and Feyen, L.: Diverging hydrological drought traits over Europe with global warming, Hydrol. Earth Syst. Sci., 24, 5919–5935, https://doi.org/10.5194/hess-24-5919-2020, 2020.
Chiang, F., Mazdiyasni, O., and AghaKouchak, A.: Evidence of anthropogenic impacts on global drought frequency, duration, and intensity, Nat. Commun., 12, 2754, https://doi.org/10.1038/s41467-021-22314-w, 2021.
Coleman, J. S. M. and Budikova, D.: Eastern U.S. summer streamflow during extreme phases of the North Atlantic oscillation, J. Geophys. Res., 118, 4181–4193, https://doi.org/10.1002/jgrd.50326, 2013.
Dams, J., Salvadore, E., Van Daele, T., Ntegeka, V., Willems, P., and Batelaan, O.: Spatio-temporal impact of climate change on the groundwater system, Hydrol. Earth Syst. Sci., 16, 1517–1531, https://doi.org/10.5194/hess-16-1517-2012, 2012.
Deser, C., Hurrell, J. W., and Phillips, A. S.: The role of the North Atlantic Oscillation in European climate projections, Clim. Dynam., 49, 3141–3157, https://doi.org/10.1007/s00382-016-3502-z, 2017.
De Vita, P., Allocca, V., Manna, F., and Fabbrocino, S.: Coupled decadal variability of the North Atlantic Oscillation, regional rainfall and karst spring discharges in the Campania region (southern Italy), Hydrol. Earth Syst. Sci., 16, 1389–1399, https://doi.org/10.5194/hess-16-1389-2012, 2012.
Dixon, H., Hannaford, J., and Fry, M. J. The effective management of national hydrometric data: experiences from the United Kingdom, Hydrolog. Sci. J., 58, 1383–1399, https://doi.org/10.1080/02626667.2013.787486, 2013.
Eade, R., Stephenson, D. B., Scaife, A. A., and Smith, D. M.: Quantifying the rarity of extreme multi-decadal trends: how unusual was the late twentieth century trend in the North Atlantic Oscillation?, Clim. Dynam., 58, 1555–1568, https://doi.org/10.1007/s00382-021-05978-4, 2022.
Feng, P.-N., Lin, H., Derome, J., and Merlis, T. M.: Forecast Skill of the NAO in the Subseasonal-to-Seasonal Prediction Models, J. Climate, 34, 4757–4769, https://doi.org/10.1175/JCLI-D-20-0430.1, 2021.
Folland, C. K., Hannaford, J., Bloomfield, J. P., Kendon, M., Svensson, C., Marchant, B. P., Prior, J., and Wallace, E.: Multi-annual droughts in the English Lowlands: a review of their characteristics and climate drivers in the winter half-year, Hydrol. Earth Syst. Sci., 19, 2353–2375, https://doi.org/10.5194/hess-19-2353-2015, 2015.
Forootan, E., Khaki, M., Schumacher, M., Wulfmeyer, V., Mehrnegar, N., van Dijk, A. I. J. M., Brocca, L., Farzaneh, S., Akinluyi, F., Ramillien, G., Shum, C. K., Awange, J., and Mostafaie, A.: Understanding the global hydrological droughts of 2003–2016 and their relationships with teleconnections, Sci. Total Environ., 650, 2587–2604, https://doi.org/10.1016/J.SCITOTENV.2018.09.231, 2018.
Gao, L., Deng, Y., Yan, X., Li, Q., Zhang, Y., and Gou, X.: The unusual recent streamflow declines in the Bailong River, north-central China, from a multi-century perspective, Quaternary Sci. Rev., 260, 106927, https://doi.org/10.1016/j.quascirev.2021.106927, 2021.
Garamhegyi, T., Kovács, J., Pongrácz, R., Tanos, P., and Hatvani, I. G.: Investigation of the climate-driven periodicity of shallow groundwater level fluctuations in a Central-Eastern European agricultural region, Hydrogeol. J., 26, 677–688, https://doi.org/10.1007/s10040-017-1665-2, 2018.
Gurdak, J. J.: Climate-induced pumping, Nat. Geosci., 10, 71–71, 2017.
Hall, R. J. and Hanna, E.: North Atlantic circulation indices: links with summer and winter UK temperature and precipitation and implications for seasonal forecasting, Int. J. Climatol., 38, e660–e677, https://doi.org/10.1002/joc.5398, 2018.
Hanel, M., Rakovec, O., Markonis, Y., Máca, P., Samaniego, L., Kyselý, J., and Kumar, R.: Revisiting the recent European droughts from a long-term perspective, Sci. Rep., 8, 9499, https://doi.org/10.1038/s41598-018-27464-4, 2018.
Hannaford, J., Mastrantonas, N., Vesuviano, G., and Turner, S.: An updated national-scale assessment of trends in UK peak river flow data: how robust are observed increases in flooding?, Hydrol. Res., 52, 699–718, https://doi.org/10.2166/nh.2021.156, 2021.
Holman, I., Rivas-Casado, M., Bloomfield, J. P., and Gurdak, J. J.: Identifying non-stationary groundwater level response to North Atlantic ocean-atmosphere teleconnection patterns using wavelet coherence, Hydrogeol. J., 19, 1269–1278, https://doi.org/10.1007/s10040-011-0755-9, 2011.
Hurrell, J. W.: Decadal trends in the north atlantic oscillation: regional temperatures and precipitation, Science, 269, 676–679, https://doi.org/10.1126/science.269.5224.676, 1995.
Hurrell, J. W. and Deser, C.: North Atlantic climate variability: The role of the North Atlantic Oscillation, J. Mar. Syst., 79, 231–244, https://doi.org/10.1016/j.jmarsys.2008.11.026, 2010.
Hurrell, J. W. and Van Loon, H.: Decadal variations in climate associated with the North Atlantic Oscillation, Climatic Change, 36, 301–326, https://doi.org/10.1023/A:1005314315270, 1997.
Hurrell, J. W., Kushnir, Y., Ottersen, G., and Visbeck, M.: An Overview of the North Atlantic Oscillation, in: The North Atlantic Oscillation: Climatic Significance and Environmental Impact, American Geophysical Union, 1–35, https://doi.org/10.1029/GM134, 2003.
Jackson, C. R., Bloomfield, J. P., and Mackay, J. D.: Evidence for changes in historic and future groundwater levels in the UK, Prog. Phys. Geogr., 39, 49–67, https://doi.org/10.1177/0309133314550668, 2015.
Kay, A. L., Watts, G., Wells, S. C., and Allen, S.: The impact of climate change on U.K. river flows: A preliminary comparison of two generations of probabilistic climate projections, Hydrol. Process., 34, 1081–1088, https://doi.org/10.1002/hyp.13644, 2020.
Kingston, D. G., McGregor, G. R., Hannah, D. M., and Lawler, D. M.: River flow teleconnections across the northern North Atlantic region, Geophys. Res. Lett., 33, 1–5, https://doi.org/10.1029/2006GL026574, 2006.
Kuss, A. M. and Gurdak, J. J.: Groundwater level response in U.S. principal aquifers to ENSO, NAO, PDO, and AMO, J. Hydrol., 519, 1939–1952, https://doi.org/10.1016/j.jhydrol.2014.09.069, 2014.
Labat, D.: Cross wavelet analyses of annual continental freshwater discharge and selected climate indices, J. Hydrol., 385, 269–278, https://doi.org/10.1016/j.jhydrol.2010.02.029, 2010.
Liesch, T. and Wunsch, A.: Aquifer responses to long-term climatic periodicities, J. Hydrol., 572, 226–242, https://doi.org/10.1016/j.jhydrol.2019.02.060, 2019.
Luque-Espinar, J. A., Chica-Olmo, M., Pardo-Igúzquiza, E., and García-Soldado, M. J.: Influence of climatological cycles on hydraulic heads across a Spanish aquifer, J. Hydrol., 354, 33–52, https://doi.org/10.1016/j.jhydrol.2008.02.014, 2008.
Marchant, B. P. and Bloomfield, J. P.: Spatio-temporal modelling of the status of groundwater droughts, J. Hydrol., 564, 397–413, https://doi.org/10.1016/j.jhydrol.2018.07.009, 2018.
Marsh, T. and Hannaford, J.: UK Hydrometric Register, Hydrological data UK series, Centre for Ecology and Hydrology, https://nrfa.ceh.ac.uk/data/ (last access: 11 November 2021), 2008.
Meinke, H., deVoil, P., Hammer, G. L., Power, S., Allan, R., Stone, R. C., Folland, C., and Potgieter, A.: Rainfall variability of decadal and longer time scales: Signal or noise?, J. Climate, 18, 89–90, https://doi.org/10.1175/JCLI-3263.1, 2005.
National River Flow Archive: Streamflow and precipitation data, metadata, http://nrfa.ceh.ac.uk/, last access: 11 November 2021.
NCAR: PC-Based North Atlantic Oscillation Index, https://climatedataguide.ucar.edu/climate-data/hurrell-north-atlantic-oscillation-nao-index-pc-based, last access: 11 November 2021.
Neves, M. C., Jerez, S., and Trigo, R. M.: The response of piezometric levels in Portugal to NAO, EA, and SCAND climate patterns, J. Hydrol., 568, 1105–1117, https://doi.org/10.1016/j.jhydrol.2018.11.054, 2019.
O'Reilly, C. H., Weisheimer, A., Woollings, T., Gray, L. J., and MacLeod, D.: The importance of stratospheric initial conditions for winter North Atlantic Oscillation predictability and implications for the signal‐to‐noise paradox, Q. J. Roy. Meteorol. Soc., 145, 131–146, https://doi.org/10.1002/qj.3413, 2019.
Peters, E. Propagation of drought through groundwater systems – illustrated in the Pang (UK) and Upper-Guadiana (ES) catchments, PhD thesis, Wageningen University, Wageningen, https://edepot.wur.nl/121490 (last access: 11 November 2021), 2003.
Rial, J. A., Pielke Sr., R. A., Beniston, M., Claussen, M., Canadell, J., Cox, P., Held, H., de Noblet-Ducoudré, N., Prinn, R., Reynolds, J. F., and Salas, J. D.: Nonlinearities, feedbacks and critical thresholds within the earth's climate system, Climatic Change, 65, 11–38, https://doi.org/10.1023/B:CLIM.0000037493.89489.3f, 2004.
Rind, D. Perlwitz, J., P. Lonergan, P.: AO/NAO response to climate change: 1. Respective influences of stratospheric and tropospheric climate changes, J. Geophys. Res., 110, D12107, https://doi.org/10.1029/2004jd005103, 2005.
Rodda, J. and Marsh, T.: The 1975–76 Drought – a contemporary and retrospective review, Centre for Ecology & Hydrology, http://www.ceh.ac.uk/data/nrfa/nhmp/other_reports/CEH_1975-76_Drought_Report_Rodda_and_Marsh.pdf (last access: 11 November 2021), 2011.
Rosch, A. and Schmidbauer, H.: WaveletComp 1.1: a guided tour through the R package, http://www.hs-stat.com/projects/WaveletComp/WaveletComp_guided_tour.pdf (last access: 11 November 2021), 2018.
Rust, W., Corstanje, R., Holman, I. P., and Milne, A. E.: Detecting land use and land management influences on catchment hydrology by modelling and wavelets, J. Hydrol., 517, 378–389, 2014.
Rust, W., Holman, I., Corstanje, R., Bloomfield, J., and Cuthbert, M.: A conceptual model for climatic teleconnection signal control on groundwater variability in Europe, Earth-Sci. Rev., 177, 164–174, https://doi.org/10.1016/j.earscirev.2017.09.017, 2018.
Rust, W., Holman, I., Bloomfield, J., Cuthbert, M., and Corstanje, R.: Understanding the potential of climate teleconnections to project future groundwater drought, Hydrol. Earth Syst. Sci., 23, 3233–3245, https://doi.org/10.5194/hess-23-3233-2019, 2019.
Rust, W., Bloomfield, J. P., Cuthbert, M. O., Corstanje, R., and Holman, I. P.: Non-stationary control of the NAO on European rainfall and its implications for water resource management, Hydrol. Process., 35, e14099, https://doi.org/10.1002/hyp.14099, 2021b.
Rust, W., Holman, I., Bloomfield, J. P., and Cuthbert, M.: Nonstationary NAO periods on water resources, Cranfield Online Research Data (CORD) [data set], https://doi.org/10.17862/cranfield.rd.16866868.v1, 2022.
Rust, W., Cuthbert, M., Bloomfield, J., Corstanje, R., Howden, N., and Holman, I.: Exploring the role of hydrological pathways in modulating multi-annual climate teleconnection periodicities from UK rainfall to streamflow, Hydrol. Earth Syst. Sci., 25, 2223–2237, https://doi.org/10.5194/hess-25-2223-2021, 2021a.
Sang, Y.-F.: A review on the applications of wavelet transform in hydrology time series analysis, Atmos. Res., 122, 8–15, https://doi.org/10.1016/j.atmosres.2012.11.003, 2013.
Schneider, C., Laizé, C. L. R., Acreman, M. C., and Flörke, M.: How will climate change modify river flow regimes in Europe?, Hydrol. Earth Syst. Sci., 17, 325–339, https://doi.org/10.5194/hess-17-325-2013, 2013.
Spinoni, J., Naumann, G., Vogt, J. V., and Barbosa, P.: The biggest drought events in Europe from 1950 to 2012, J. Hydrol.: Reg. Stud., 3, 509–524, https://doi.org/10.1016/j.ejrh.2015.01.001, 2015.
Sun, Q., Miao, C., Duan, Q., Ashouri, H., Sorooshian, S., and Hsu, K.: A review of global precipitation data sets: Data sources, estimation, and intercomparisons, Rev. Geophys., 56, 79–107, https://doi.org/10.1002/2017RG000574, 2018.
Sutanto, S. J., Van Lanen, H. A. J., Wetterhall, F., and Llort, X.: Potential of Pan-European Seasonal Hydrometeorological Drought Forecasts Obtained from a Multihazard Early Warning System, B. Am. Meteorol. Soc., 101, E368–E393, https://doi.org/10.1175/BAMS-D-18-0196.1, 2020.
Svensson, C., Brookshaw, A., Scaife, A. A., Bell, V. A., Mackay, J. D., Jackson, C. R., Hannaford, J., Davies, H. N., Arribas, A., and Stanley, S.: Long-range forecasts of UK winter hydrology, Environ. Res. Lett., 10, 064006, https://doi.org/10.1088/1748-9326/10/6/064006, 2015.
Tanguy, M., Haslinger, K., Svensson, C., Parry, S., Barker, L. J., Hannaford, J., and Prudhomme, C.: Regional Differences in Spatiotemporal Drought Characteristics in Great Britain, Front. Environ. Sci. Eng. China, 9, 639649, https://doi.org/10.3389/fenvs.2021.639649, 2021.
Tremblay, L., Larocque, M., Anctil, F., and Rivard, C.: Teleconnections and interannual variability in Canadian groundwater levels, J. Hydrol., 410, 178–188, https://doi.org/10.1016/j.jhydrol.2011.09.013, 2011.
Trigo, R. M., Osborn, T. J., and Corte-real, J. M.: The North Atlantic Oscillation influence on Europe: climate impacts and associated physical mechanisms, Clim. Res., 20, 9–17, https://doi.org/10.3354/cr020009, 2002.
Uvo, C. B., Foster, K., and Olsson, J.: The spatio-temporal influence of atmospheric teleconnection patterns on hydrology in Sweden, J. Hydrol.: Reg. Stud., 34, 100782, https://doi.org/10.1016/j.ejrh.2021.100782, 2021.
Van Loon, A. F.: On the propagation of drought: How climate and catchment characteristics influence hydrological drought development and recovery, PhD thesis, Wageningen University, Wageningen, https://edepot.wur.nl/249786 (last access: 11 November 2021), 2013.
Van Loon, A. F.: Hydrological drought explained, WIREs Water, 2, 359–392, https://doi.org/10.1002/wat2.1085, 2015.
Velasco, E. M., Gurdak, J. J., Dickinson, J. E., Ferré, T. P. A., and Corona, C. R.: Interannual to multidecadal climate forcings on groundwater resources of the U.S. West Coast, J. Hydrol.: Reg. Stud., 11, 250–265, https://doi.org/10.1016/j.ejrh.2015.11.018, 2015.
Vicente-Serrano, S. M. and López-Moreno, J. I.: Differences in the non-stationary influence of the North Atlantic Oscillation on European precipitation under different scenarios of greenhouse gas concentrations, Geophys. Res. Lett., 35, GL034832, https://doi.org/10.1029/2008gl034832, 2008.
Wendt, D. E., Van Loon, A. F., Bloomfield, J. P., and Hannah, D. M.: Asymmetric impact of groundwater use on groundwater droughts, Hydrol. Earth Syst. Sci., 24, 4853–4868, https://doi.org/10.5194/hess-24-4853-2020, 2020.
West, H., Quinn, N., and Horswell, M.: The Influence of the North Atlantic Oscillation and East Atlantic Pattern on Drought in British Catchments, Front. Environ. Sci. Eng. China, 10, 754597, https://doi.org/10.3389/fenvs.2022.754597, 2022.
Woollings, T. and Blackburn, M.: The North Atlantic Jet Stream under Climate Change and Its Relation to the NAO and EA Patterns, J. Climate, 25, 886–902, https://doi.org/10.1175/JCLI-D-11-00087.1, 2012.
Wrzesiński, D. and Paluszkiewicz, R.: Spatial differences in the impact of the North Atlantic Oscillation on the flow of rivers in Europe, Hydrol. Res., 42, 30–39, https://doi.org/10.2166/nh.2010.077, 2011.
Wu, Y., Zhang, G., Shen, H., and Xu, Y. J.: Nonlinear Response of Streamflow to Climate Change in High-Latitude Regions: A Case Study in Headwaters of Nenjiang River Basin in China's Far Northeast, Water, 10, 294, https://doi.org/10.3390/w10030294, 2018.
Yuan, X., Zhang, M., Wang, L., and Zhou, T.: Understanding and seasonal forecasting of hydrological drought in the Anthropocene, Hydrol. Earth Syst. Sci., 21, 5477–5492, https://doi.org/10.5194/hess-21-5477-2017, 2017.
Zhang, W., Mei, X., Geng, X., Turner, A. G., and Jin, F.-F.: A Nonstationary ENSO–NAO Relationship Due to AMO Modulation, J. Climate, 32, 33–43, https://doi.org/10.1175/JCLI-D-18-0365.1, 2019.
Zhang, X., Jin, L., Chen, C., Guan, D., and Li, M.: Interannual and interdecadal variations in the North Atlantic Oscillation spatial shift, Chin. Sci. Bull., 56, 2621–2627, https://doi.org/10.1007/s11434-011-4607-8, 2011.