the Creative Commons Attribution 4.0 License.
the Creative Commons Attribution 4.0 License.
 | 23 Mar 2022
Continuous monitoring of a soil aquifer treatment system's physico-chemical conditions to optimize operational performance
Tuvia Turkeltaub
Alex Furman
Ron Mannheim
Noam Weisbrod
Soil aquifer treatment (SAT) is a tertiary process for wastewater treatment, where the wastewater infiltrates through a thick vadose zone for purification and storage in the underneath aquifer. SAT infiltration basins are typically flooded intermittently, while maintaining a fixed ratio between the wetting and the drying stages. However, infiltration basins exhibit different physical and chemical properties, limiting the generalization of SAT operation to attain optimal efficiency. Since frequent sampling of the soil pore water to verify the SAT's biodegradation efficiency can be arduous, continuous monitoring of the SAT vadose zone's physico-chemical conditions is required. In this study, redox potential (Eh) was continuously monitored, together with other variables, such as volumetric water content (θ), soil temperature, and gaseous oxygen (O2), at multiple depths of a SAT vadose zone throughout the year and while the system was constrained to different operational modes. Hydrological models were calibrated and validated to water content observations, and they illustrated the seasonal changes in water infiltration. Furthermore, it was shown that, under long wetting stages during winter, there was a reduction in the SAT's drainage capabilities. The Eh observations, under long wetting stages, demonstrated larger variability and very negative values as ambient temperature increased. Assembling the daily Eh observations illustrated that a wetting stage should cease after about 30 h, once suboxic conditions are established. A drying stage's optimal duration should be 36 h, according to the Eh and O2 observations during summer and winter. Ultimately, the study shows that the length of wetting and drying stages should be defined separately, rather than by adhering to the wetting drying ratio.
- Article
(5807 KB) - Full-text XML
-
Supplement
(632 KB) - BibTeX
- EndNote


-
Long wetting stages reduce soil percolation capabilities during winter.
-
Redox and gaseous O2 display intensive dynamics in the top 25 cm of the soil aquifer treatment vadose zone.
-
Optimal wetting and drying stages are defined according to Eh and gaseous O2 observations.
-
The length of wetting and drying stages should be defined separately rather than by adhering to their ratio.
Worldwide water scarcity has motivated the development of alternative water resources such as the reuse of treated wastewater. Soil aquifer treatment (SAT) is commonly implemented to further improve the recovered water's quality and remove the majority of suspended matter, microorganisms, viruses, and organic and inorganic constituents (Dillon, 2005; Goren et al., 2014; Massmann et al., 2006; Schmidt et al., 2011; Tsangaratos et al., 2017). In SAT systems, the treated wastewater is recharged to the underlying aquifer by surface spreading over infiltration basins. The wastewater is purified mainly through the physical and biochemical processes that occur during water passage through the vadose zone (Dillon, 2005; Elkayam et al., 2015). Although SAT systems have been used for decades (Grinshpan et al., 2021; Bouwer, 2002), the ability to estimate and predict a SAT system's performance is still challenging, and the optimal SAT operation is still under investigation (Ben Moshe et al., 2020; Sharma and Kennedy, 2017).
A major uncertainty in SAT systems concerns the vadose zone processes that play a central role in determining the quality of the water that recharges the aquifer (Elkayam et al., 2015). The chemistry of the percolating wastewater changes due to a combination of several biogeochemical processes, such as organic matter biodegradation, nitrification, sorption, cation exchange, etc. (Amy and Drewes, 2007; Díaz-Cruz and Barceló, 2008; Goren et al., 2014; Miller et al., 2006; Tufenkji et al., 2003). Most of the organic matter is removed by biodegradation (i.e. microbial activity) within the upper two metres of the vadose zone (Drewes, 2009). Nevertheless, the microbial activity is greatly affected by the soil water content, which frequently changes in SAT. Generally, a major challenge in SAT systems is to facilitate the intrusion of O2, primarily in the gaseous phase, and to enrich the active subsurface with O2 (Ben Moshe et al., 2020; Massmann et al., 2006).
A consequence of the perturbation in the O2 supply to SAT is expressed in changes in the redox conditions (Mächler et al., 2013; Rezanezhad et al., 2014). Redox potential or oxidation reduction potential is a quantitative measure of electron availability, i.e. the tendency of the system to receive or donate electrons (Hinchey and Schaffner, 2005). Substantial changes in SAT systems' redox conditions might lead to the release of undesirable metals, such as Fe2+ and Mn2+ (Goren et al., 2012), and affect the degradation rates of pesticides and pharmaceutical substances (Massmann et al., 2006). Additionally, previous studies have illustrated the possible degradation of groundwater quality due to the emergence of contaminants that leach from the SAT vadose zone under reducing conditions (Asano and Cotruvo, 2004; Massmann et al., 2006; Oren et al., 2007; Sharma and Kennedy, 2017). Redox processes are associated with the degradation of organic matter by terminal electron acceptors or redox couples, such as O2 H2O, NO3 N2, MnO2 Mn2+, Fe3+ Fe2+, and SO4 H2S, in sequential order from the highest energy yield downwards (Berner, 1981; Froelich et al., 1979; Christensen et al., 2000). The transition between redox conditions is determined by the presence and availability of these electron acceptors/donors. Once the strongest oxidizing species (O2) is depleted, the next strongest oxidizing species is used (NO3), and so on. The alternation between oxic (> 400 mV), suboxic (between 400 and 100 mV), and anoxic (100 mV >) conditions in the vadose zone depends on the availability of the oxidized species (Reddy et al., 1998). In addition, studies have reported on the seasonal (temperature changes) effects on redox conditions, which were attributed to the increase in dissolved oxygen concentrations at low temperatures (Massmann et al., 2006) and the greater microbial activity (i.e. higher O2 consumption) at higher temperatures (Greskowiak et al., 2006; Kirschbaum, 1995).
An important operational aspect of a SAT system is the intermittent application of the effluents (Sattar, 2016; Sallwey et al., 2020). After the infiltration basin is flooded with wastewater, a drying period is implemented to sustain the SAT's infiltration capacity and biochemical capabilities (Sharma and Kennedy, 2017). The wetting and drying stages, which can be expressed by the wet dry ratio parameter, have a critical impact on the removal rates of dissolved organic carbon, total nitrogen, and pathogens (Ben Moshe et al., 2020; Morrison et al., 2020; Sharma and Kennedy, 2017). Although the wet dry ratio can vary depending on location and wastewater quality, it is well accepted that it should be below 1.0 (Sattar, 2016; Sharma and Kennedy, 2017). Nevertheless, infiltration basins behave differently with regard to infiltration rates and clogging. Thus, in many cases, the SAT operational efficiency is limited to the personal experience of the operators and their knowledge of the specific infiltration basin (Sharma and Kennedy, 2017). Note, however, that several studies (e.g. Ben Moshe et al., 2021) suggest that it is not the wet dry ratio that should be considered but specific times for wetting and drying.
The oxidation reduction potential (Eh), together with chemical and physical parameters, such as water content, soil temperature, O2 concentration, etc., can be continuously monitored by installing the relevant sensors. Previous studies have implemented the Eh sensor and successfully described, with high temporal resolution, the subsurface chemical conditions in various environments, such as wetlands, the groundwater (or the capillary fringe), aquifers, etc. (Wallace et al., 2019; McMahon and Chapelle, 2008; Shenker et al., 2005; Silver et al., 2018; Rezanezhad et al., 2014). To improve SAT system performances, the link between the wetting and drying stages and the subsequent redox conditions developed in the subsurface should be established. Thus, in situ monitoring can improve SAT management performance and reduce the subjectivity of the operator. The objective of this study was to examine the temporal variability in redox potential and the way it is affected by changes in volumetric water content, gaseous O2, and climate imposed by different operational modes of wetting and drying stages. Furthermore, calibrated and validated hydrological models were used to explore the behaviour of water fluxes under different operational modes and seasonal temperature changes. Finally, the optimal lengths of a drying stage and a wetting stage were determined, following the in situ observations.
2.1 Study sites
The Dan Region Reclamation Project (Shafdan) reclaims about 125 × 106 m3 of effluent annually from the Tel Aviv metropolitan area in Israel. The treatment of effluents occurs in two stages. The first stage involves mechanical biological treatment, which is based on activated sludge, while, in the second stage, the treated water (a secondary effluent) is delivered to infiltration basins, as part of the SAT system, to further improve water quality. The six infiltration basin sites, covering a total area of 1053 km2, are located in central Israel, overlying the coastal aquifer (Fig. 1). Each basin is divided into several spreading ponds, about 1500 m2 each, which are alternately flooded. The vadose zone that underlies the basins is mostly composed of sand, sandy loam soil, and calcareous sandstone layers. Typically, the ponds are flooded for 1 to 2 d (max hydraulic head of about 50 cm), followed by 2 to 6 d of drainage and soil surface drying. The wetting and drying stages are controlled by the ponds' flooding order, the availability of effluent, and the drying period, which is suggested to be at least 24 h (Icekson-Tal et al., 2003). The basin surface is ploughed on a regular basis to break up the developed biocrust and to prevent clogging (see Negev et al., 2020, for details).
2.2 Study operation
In this research, two in situ measurement stations were installed in an infiltration pond during 2018 (pond 4103 in the Yavne 1 cluster; Fig. 1). Each station was equipped with several sets of sensors at 25, 50, 75, 100, and 150 cm depth, including time domain transmittance (TDT) probes (Acclima Inc., Idaho, USA), copper–constantan thermocouples (Omega Engineering Inc., CT, USA), oxidation reduction potential (ORP) electrodes (ELH016; Van London Co., Houston, TX, USA), and O2 percentage probes (SO-421 sensor; Apogee Instruments, Utah, USA). Data were collected at prescribed intervals and logged on a CR1000 data logger (Campbell Scientific, Inc., Logan, UT, USA). In addition, suction cups were installed at similar depths. In station 1 (Fig. 1), the data consisted of volumetric water content (θ), soil temperature (T), and ORP (Eh) time series, which were continuously measured every 20 min between 28 July 2020 and 10 February 2021 (a total of 14 185 values, over 197 d, for each variable). The data were obtained at 25, 50, and 100 cm depths. In station 2 (Fig. 1), θ, T, gaseous oxygen (O2), and Eh were measured every 20 min between 8 May 2019 and 20 July 2020. There were about 60 d in which data were not collected in station 2 due to technical issues. The data from station 2 contained 27 222 points of θ, 29 394 points of O2, 30 414 points of Eh, and 26 730 points of T measurements. In station 2, the data were collected at 25, 50, 75, and 100 cm depths.
The water quality characteristics of the secondary effluent that flooded the Yavne 1 basin are presented in the Supplement (Fig. S1). Note that the quality parameter concentrations conform to the updated Inbar regulations (Inbar, 2007) and the findings of a previous study that surveyed numerous wastewater storage and treatment reservoirs across the country (Kfir et al., 2012). To determine the soil physical properties, undisturbed soil cores were sampled at different depths. Subsequently, flow experiments were carried out to calculate the saturated hydraulic conductivity (Ks), based on Darcy's law (Fig. S2). Additionally, particle size distribution (PSD) analyses are presented in Fig. S3. The PSD results indicate that the SAT vadose zone is homogeneous.
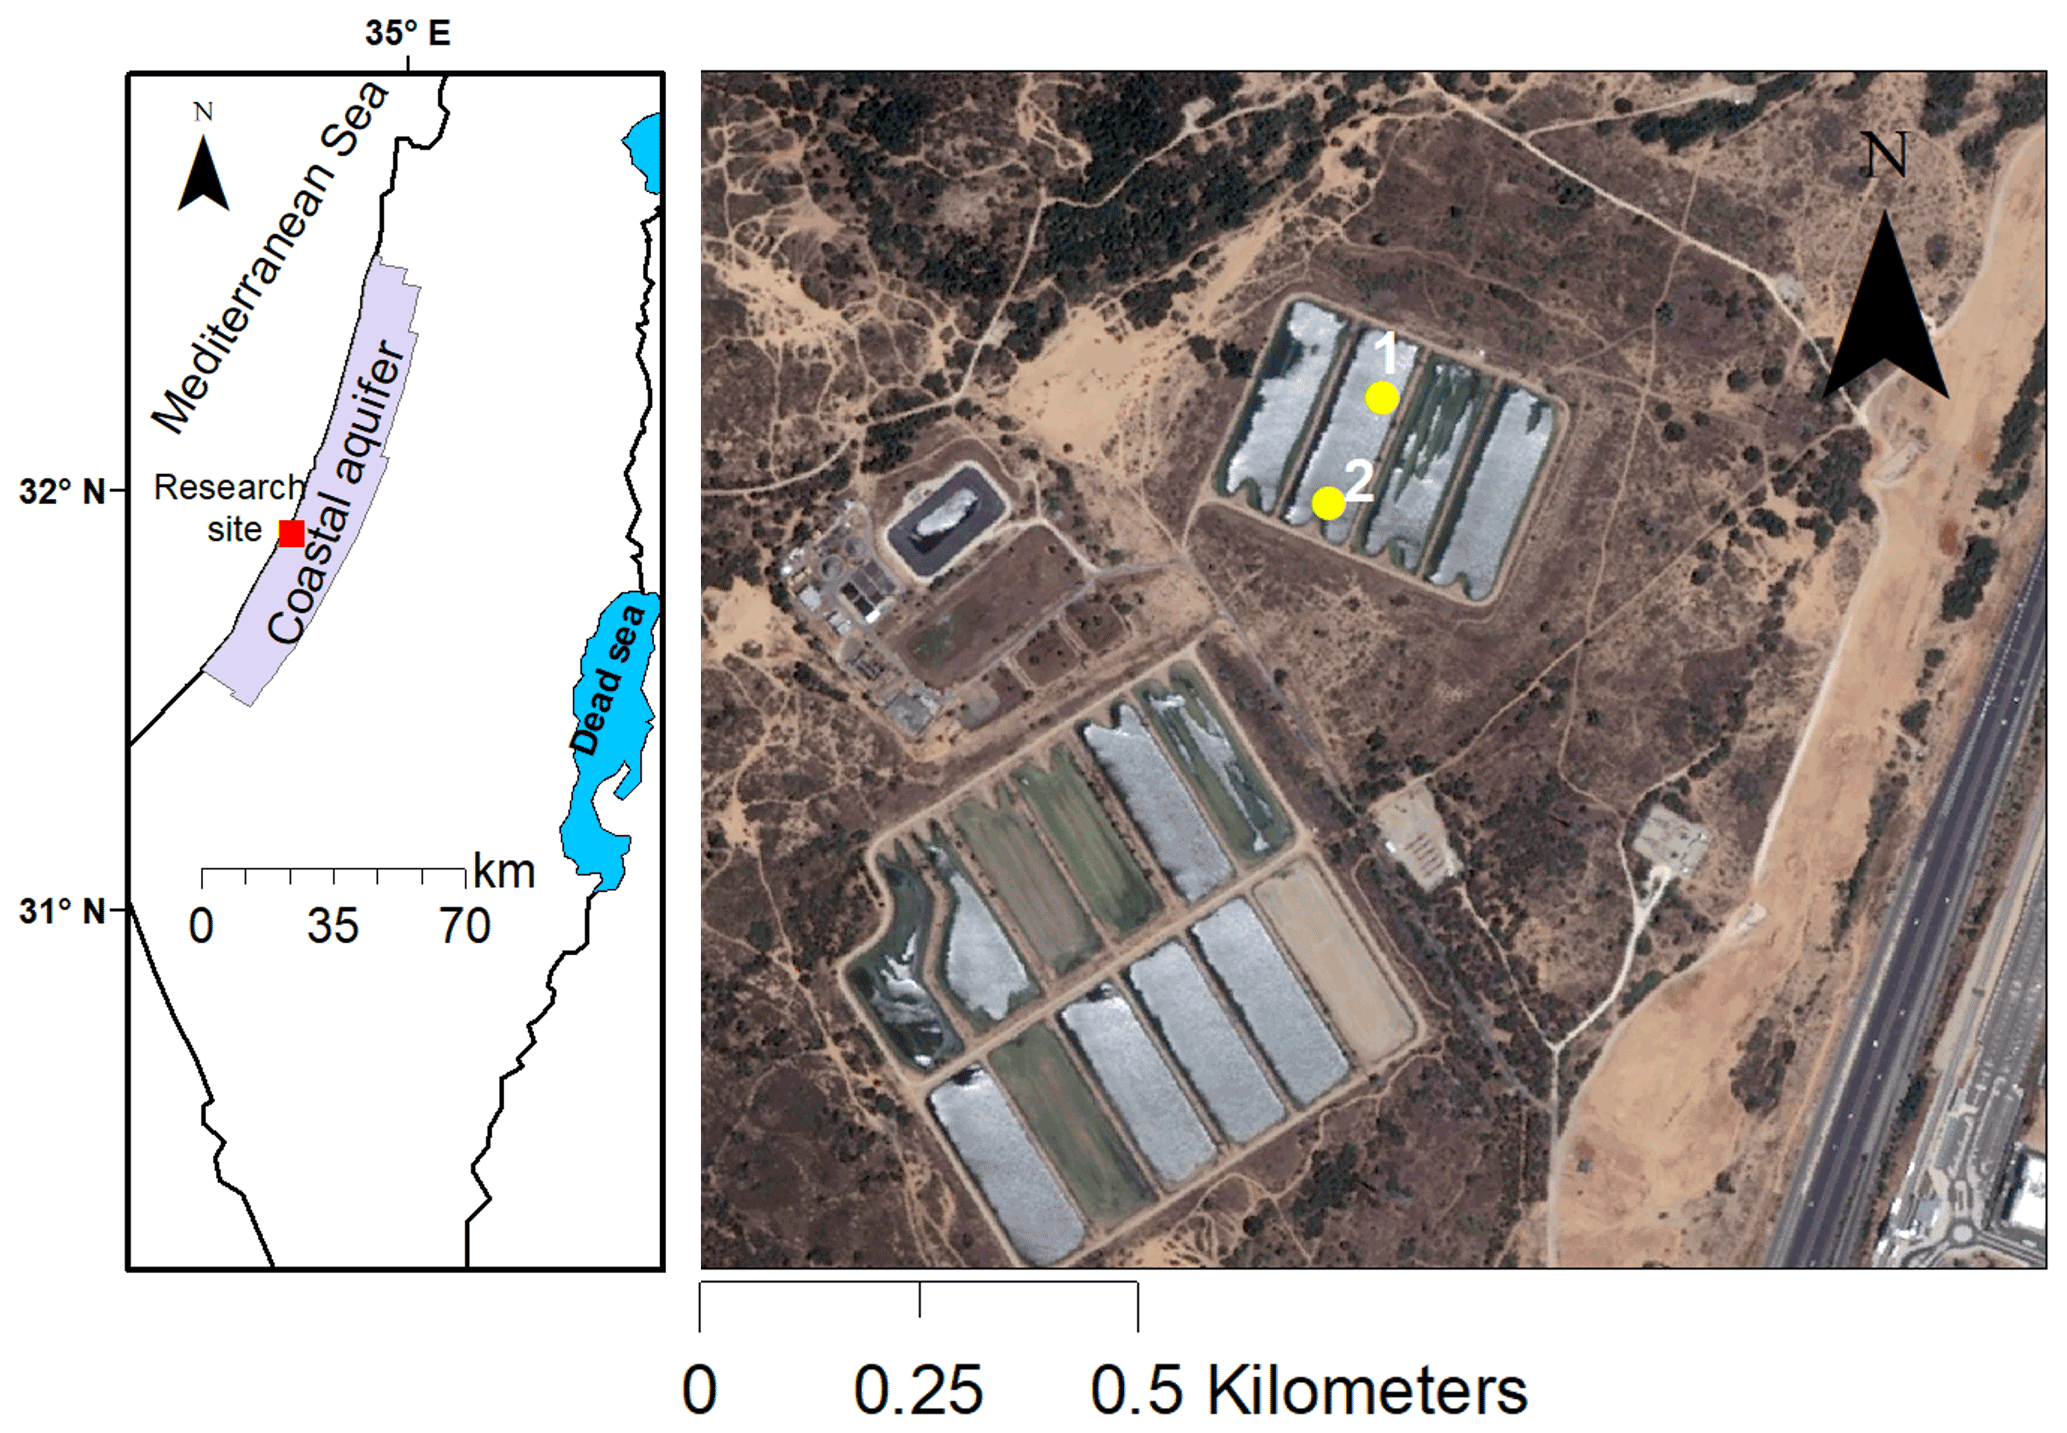
Figure 1The location of the investigated site – the Yavne 1 infiltration basin of the Shafdan. In the magnified view of the investigated pond, the yellow circles represent the locations of the measurement stations (© Google Earth).
2.3 Hydrological model and gaseous oxygen dynamics
The calculations for water and oxygen fluxes in the SAT vadose zone are calculated differently for the ponding stage and for the stage, where there is no ponding (water) on the soil surface. For the ponding stage, Ganot et al. (2017) showed that the infiltration rates in managed aquifer recharge systems can be predicted reasonably well by simple analytical models. In this study, the Green–Ampt equation for infiltration into a flooded soil was implemented to calculate the water flux as follows (Bouwer, 2002):
where q (L T−1) is the water flux, d (L) is the ponding depth, L (L) is the thickness of the saturated vadose zone, and ψ* (L) is the negative pressure head at the wetting front. Note that L is assumed here to be constant, the subsurface is assumed to be homogeneous, and θ is assumed to vary with time only. As the wetting front progresses, the gradient approaches a value of unity, and the infiltration rate becomes equal to the hydraulic conductivity of the wetted zone. Once the water ponding ceases, the water drainage is set equal to the unsaturated hydraulic conductivity, described with an exponential form as follows (Guswa et al., 2002):
where Ks (L T−1) is the saturated hydraulic conductivity, β is a parameter of the soil, θ (L3 L−3) is the volumetric water content, θfc (L3 L−3) is the water content at field capacity, and θs (L3 L−3) is the saturated water content. Furthermore, the effect of temperature changes on the soil hydraulic conductivity is implemented through the change in viscosity as follows (Lin et al., 2003):
where KsT and Ks25 are soil hydraulic conductivity values at temperature T and 25 ∘C, respectively, and μT and μ25 are the dynamic viscosity of water (M L−1 T−1) values at T and 25 ∘C, respectively.
An inverse problem was set to find an optimal combination of Ks and β parameters that minimizes the following objective function:
where N is the number of the θ observations, θ (ti) are the observations at a specific time, and θ(ti,b) are the corresponding models' (Eqs. 1 to 3) predictions for the vector of optimized parameters, b (Ks and β). The inverse problem was solved using the fminsearch function in MATLAB. To evaluate the prediction quality, the root mean squared error (RMSE), the Nash–Sutcliffe efficiency (NSE), and the Pearson correlation (r) were calculated following Ritter and Muñoz-Carpena (2013).
The water level measurements at the soil surface were collected by the Shafdan operators as part of the operational routine. Analysis of the water level data (ponding depth) indicates two operational modes of long and short cycles that were implemented at the investigated pond. The characteristics of the drying and wetting stages, as recorded by the operators, are summarized in Table 1. Note that the wetting stage is defined when water is present at the soil surface and the drying stage is defined when water is absent. Further note that the water level is measured at a single point (close to the pond inlet). Therefore, some variations, at the order of a few centimetres may exist due to microtopography and the distance between the inlet and the far parts of the pond. This may lead to some delays in water arrival or recession from the stations. Throughout the analysis described below, we define the winter period as the months between November and April and the summer period as the months between May and October, corresponding to the Mediterranean climate. Our monitoring systems are operated independently from the Shafdan facilities.
Table 1Technical information of the recorded long and short wetting and drying cycles (these data were provided by the Shafdan operators).

3.1 Hydrological conditions
A representative set of θ time series measured in the SAT's vadose zone is presented to describe the variability in hydrological conditions measured throughout different seasons and operational modes (Fig. 2). The θ measurements were obtained during long (Fig. 2a, b, c) and short (Fig. 2d) cycles at three different depths. Note that the water content measurements presented in Fig. 2a and b were recorded at station 2 (Fig. 1) during summer (Fig. 2a) and winter (Fig. 2b). The water content variations under short cycles were measured at station 1 (Fig. 2c, d). Differences in the absolute values between the water content observations at different depths are mainly related to the vertical texture variability (Fig. S2). Under the long cycles, θ measurements were obtained throughout 19 cycles during summer (May–October) and 14 cycles during winter (November–April). Under short cycles, there were 12 cycles during summer and 25 during winter.
Every recorded wetting event prompted an intensive infiltration that was expressed by a rapid and almost instantaneous increase in water content at all depths and under the two operational modes (Fig. 2). Furthermore, the soil remained at similar level of saturation throughout each wetting stage. Similarly, once the drying process started, it occurred virtually simultaneously at all depths. There were noticeable differences in the drainage rates between summer and winter, where the soil dried faster in summer. To elaborate the drainage process, the drying stages were assembled and averaged at an hourly interval and separated into short (Fig. 3a) and long (Fig. 3b) cycles. Additionally, Eqs. (1), (2), and (3) (the hydrological model) were implemented to describe the water flow in the SAT's vadose zone under long and short cycles. The hydrological models were calibrated and validated against water content observations at 25 cm depth by adjusting the Ks and β parameters (Figs. S4 and S5; Table 2). Throughout the calibration, the Ks and β parameters attained different values for the long cycle periods and the short cycle periods (Table 2). There are differences in soil physical properties between stations 1 and 2, which explains the need for calibrating different parameter sets. In addition, the calibrated Ks values for both models were substantially lower than the measured Ks values (Fig. S2; Table 2). It has been shown that Ks measurements in the field are commonly lower than lab Ks measurements (Nimmo et al., 2009). This is related to a reduction in soil conductivity due to air trapping in the soil pores during the wetting process when water is applied at the land surface (Mizrahi et al., 2016; Nimmo et al., 2009).
Under the short cycles, the soil drainage process occurred mostly within the first 15 h of the drying stage (Fig. 3a). The soil drainage rate was slightly higher in summer than in winter. Under the short cycles, the model successfully followed the observed trends, where the validation period showed similar performances (Figs. S4, 3a). The model results for the short cycles confirm that the differences in drainage between summer and winter are mainly due to temperature changes that affect water viscosity (Lin et al., 2003). During the long cycle application, the drainage rates in summer showed a moderate θ decline compared to the observed θ under short cycles (Fig. 3b). This might be due to the differences in soil physical parameters between stations 1 and 2, as highlighted by the calibrated models' parameters (Table 2).
While the model under long cycles successfully followed the drainage trend during summer, the model showed poor performance during winter under long cycles. This is mainly due to the observable changes in θ measurements, which displayed a shift towards higher values from November 2019 (Figs. S5 and 2b). To explore the changes in the SAT's physical properties, an additional parameter set was calibrated against the winter data only during the long cycles (Fig. 3b; green line). Both the Ks and β parameters attained lower values, and the θs increased (Fig. S6; Table 2). Previous studies related the accumulation of organic matter in SAT to lower rates of organic matter decomposition during winter (Nadav et al., 2012, 2021a, b; Arye et al., 2011). The authors ruled out the occurrence of soil clogging and indicated that the accumulation of organic matter at the topsoil increased the degree of soil water repellency or soil hydrophobicity. This phenomenon often develops in sandy soils (commonly used in SAT) due to the low specific surface area of sand (∼ 0.0077 g m−2) compared to clay (∼ 900 g m−2; Doerr et al., 2000; Wallis and Horne, 1992). Thus, only a small amount of organic matter is required to coat the particles of the sand in order to develop soil water repellency (Wallis and Horne, 1992). Arye et al. (2011) showed that soil hydrophobicity is attributed to the reduction in the liquid surface tension and increase in the contact angle. These changes in soil properties are related to the reduction in the soil permeability (Nadav et al., 2012b). It appears that long wetting and drying cycles in SAT during winter can alter the physical soil properties, which eventually affect the infiltration capabilities.
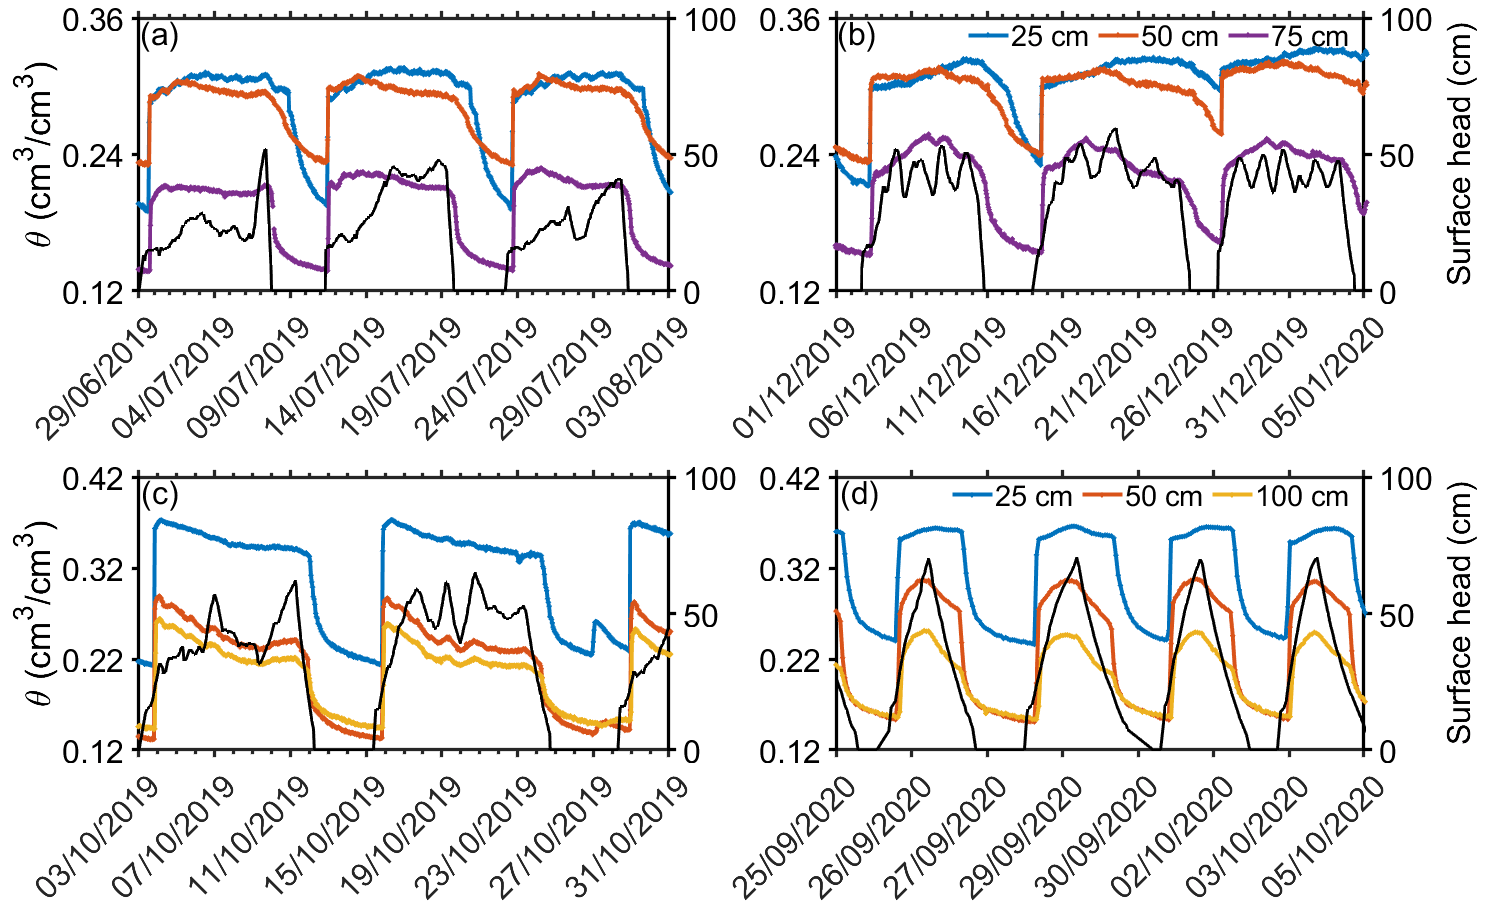
Figure 2Representative time series of θ measurements obtained at station 2 (Fig. 1) during (a) summer and (b) winter under long wetting and drying cycles at three different depths. The black line represents the surface water hydraulic head. The bottom plots display θ measurements obtained at station 1 under (c) long and (d) short wetting and drying cycles during the summer.

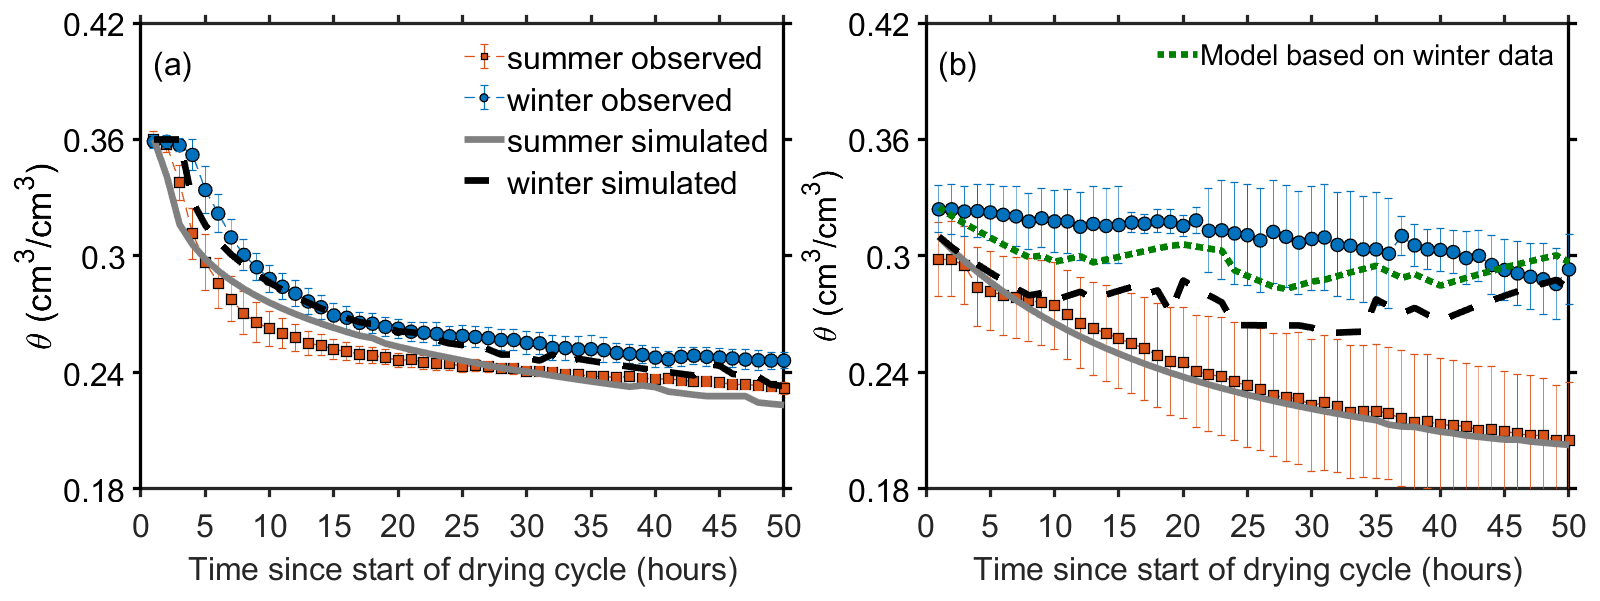
Figure 3The average and standard deviation values of measured θ at 25 cm depth throughout the drying stages at an hourly timescale. (a) Short cycles (station 1) and (b) long cycles (station 2) are shown. The blue and red circles represent the average θ values collected during winter (November–April) and summer (May–October), respectively. The statistics of measured θ under long cycles are based on 19 drying stages during summer and 14 drying stages during winter. For the short cycles, the statistics are based on 12 drying stages during summer and 24 drying stages during winter. The dashed black and solid grey lines represent the average values of simulated θ throughout the drying stage during winter (November–April) and summer (May–October), respectively. Note that, for the long cycle periods, an additional model was established based only on winter data (green line).
3.2 Seasonal differences in SAT redox (Eh) conditions under long wetting cycles
Eh conditions were monitored at four depths (Fig. 4a, b). The behaviour of the Eh dynamic following a wetting event was similar for the summer and the winter periods. At 25, 50, and 75 cm depths, a gradual decline in Eh started only after a time lag from the beginning of a wetting event (Fig. 4a, b). This time lag can be explained by the presence of dissolved oxygen (DO) in the percolating solution. Once the DO is depleted, suboxic and anoxic conditions begin to develop (Dutta et al., 2015; Ben Moshe et al., 2021, 2020). The Eh conditions at 25 cm were the most highly responsive to the wetting events, while the Eh conditions were the most negative at this depth (Fig. 4a, b). At 100 cm depth, only minor changes were observed, and in some cases (during winter), no changes were observed (Fig. 4a, b). According to the gaseous O2 measurements (Fig. 4c, d), there were partially aerated conditions (unsaturated conditions) during some of the flooding events at 75 cm depth, while at 150 cm depth, unsaturated conditions prevailed continuously throughout the period of measurements. Therefore, the small changes in Eh at 100 cm depth could either have been the outcome of only minor biochemical activity or they could have been due to the sufficient oxygen supply. Gorski et al. (2019) suggested that, in coarse-grained soils, due to the high infiltration rates, the DO is delivered rapidly by the percolating water to the base of the saturated zone. Thus, the soil microbes do not have enough time to consume the DO. In the current study, it is reflected by positive Eh values at 100 cm depth (Fig. 4a, b). As the wetting cycle continues, the Eh conditions at 100 cm depth decrease, mainly during summer (Fig. 4a, b). This indicates that eventually the infiltrated water that reaches 100 cm depth contains lower concentrations of DO. Yet, the Eh conditions do not show a further decrease, which can be attributed to limited microbial activity. Previous studies showed that carbon availability at greater depths of the vadose zone is a dominant factor for this limitation (Grau-martínez et al., 2017, 2018; Brettar et al., 2002). Furthermore, the monitored Eh conditions illustrate that most of the activity in SAT systems occurs at the topsoil, as illustrated in previous studies (e.g. Quanrud et al., 1996, 2003; Sopilniak et al., 2017; Grinshpan et al., 2022). Note that the Eh recovery time, i.e. an increase towards positive values, was virtually instantaneous once the drying process initiated (Fig. 4a, b). The increase in Eh conditions occurred concurrently with the observed rapid increase of the gaseous oxygen (O2) in the vadose zone (Fig. 4c, d).
A distinct difference in Eh conditions between winter and summer at 25 cm depth is expressed by a more negative range of values during summer (Fig. 4a, b). Since similar wastewater quality and hydraulic loads were fed to the pond during summer and winter (see the Supplement), the Eh conditions were mainly affected by the SAT's aeration state and seasonal temperature changes. In Fig. 5, the monthly Eh conditions at 25 cm depth are presented in the form of a box plot, together with the monthly average ambient temperature (dashed black line) and monthly average global radiation (grey line). The Eh conditions showed a wider range of values with the increase in temperature (Fig. 5). Between November and March, the Eh conditions mostly remained above zero or were slightly negative (Fig. 5). Once the temperature increased above 24 ∘C between May and October, Eh conditions showed substantial fluctuation between negative and positive values (Fig. 5). Note that the average monthly ambient temperatures during November and May were similar in value, but during November, the Eh conditions mostly remained above zero (Fig. 5). This difference is connected to the daylight duration, as indicated by the global radiation, which is substantially greater in May than in November (Fig. 5; grey line). A typical characteristic of aquatic systems is the large fluctuations in dissolved oxygen (DO) concentrations due to intense photosynthesis and respiration (Stumm and Morgan, 1996). Goren et al. (2014) illustrated that following the effluent spreading in the infiltration ponds, photosynthesis enriches the water with DO. Furthermore, chemical analysis of porewater samples that were obtained at 0.5 m depth in the SAT vadose zone indicated the DO's substantial influence on the biochemical conditions of the percolating water (Goren et al., 2014). Thus, the photosynthesis process enriches the effluent with DO, which encourages further microbial activity (Goren et al., 2014; Hargreaves, 2006; Rodríguez-Escales et al., 2020). However, between July and September, there was a decrease in global radiation that did not affect the Eh variability (Fig. 5). Thus, it appears that, under long wetting stages, the seasonal temperature changes dominate the Eh conditions but show some trade-off with the global radiation.
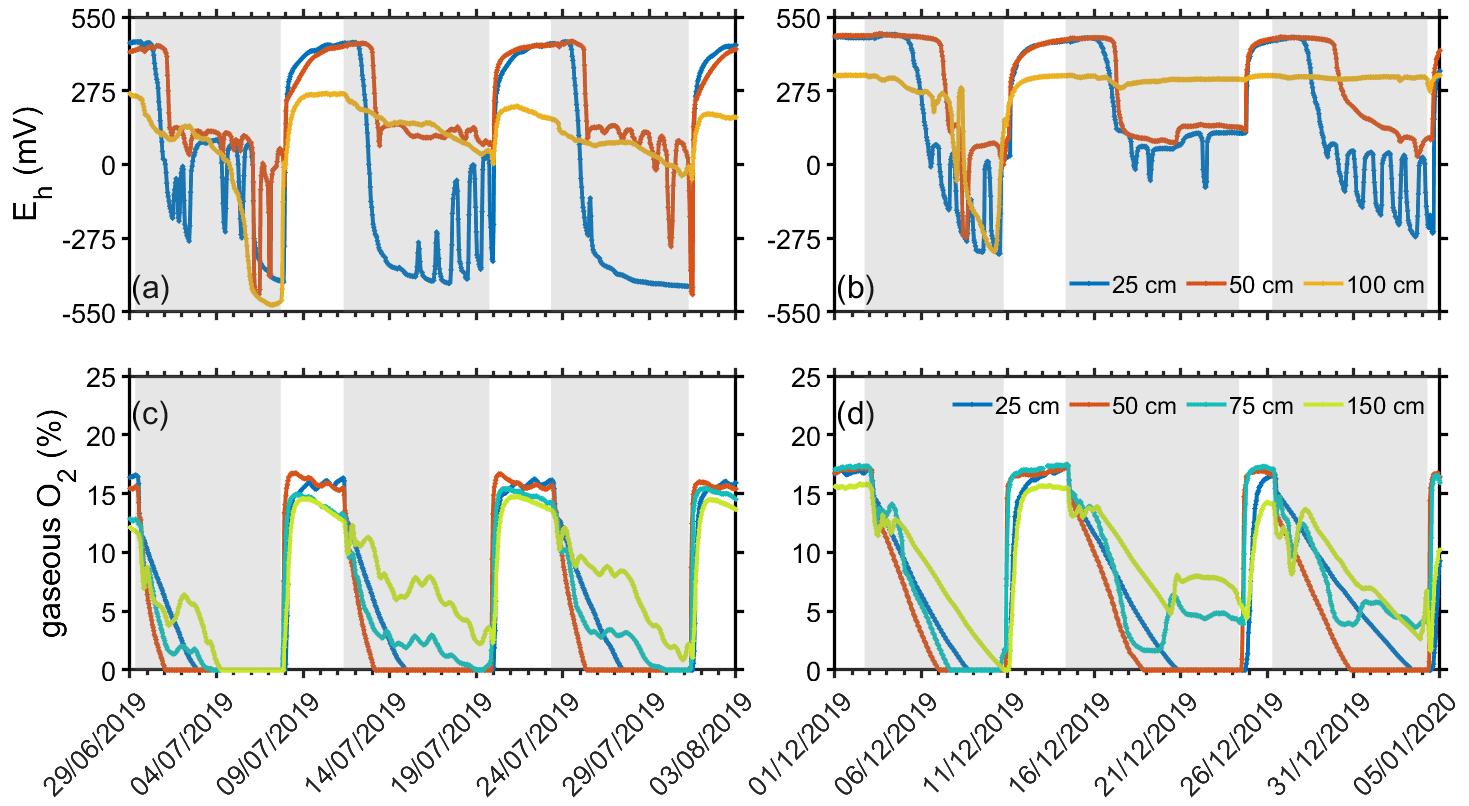
Figure 4Representative time series of redox potential (Eh) and gaseous O2 measurements obtained at station 2 (Fig. 1) at depths of 25, 50, and 100 cm. (a, c) Summer and (b, d) winter results are shown. Note that the grey and white areas indicate wetting and drying periods, respectively.
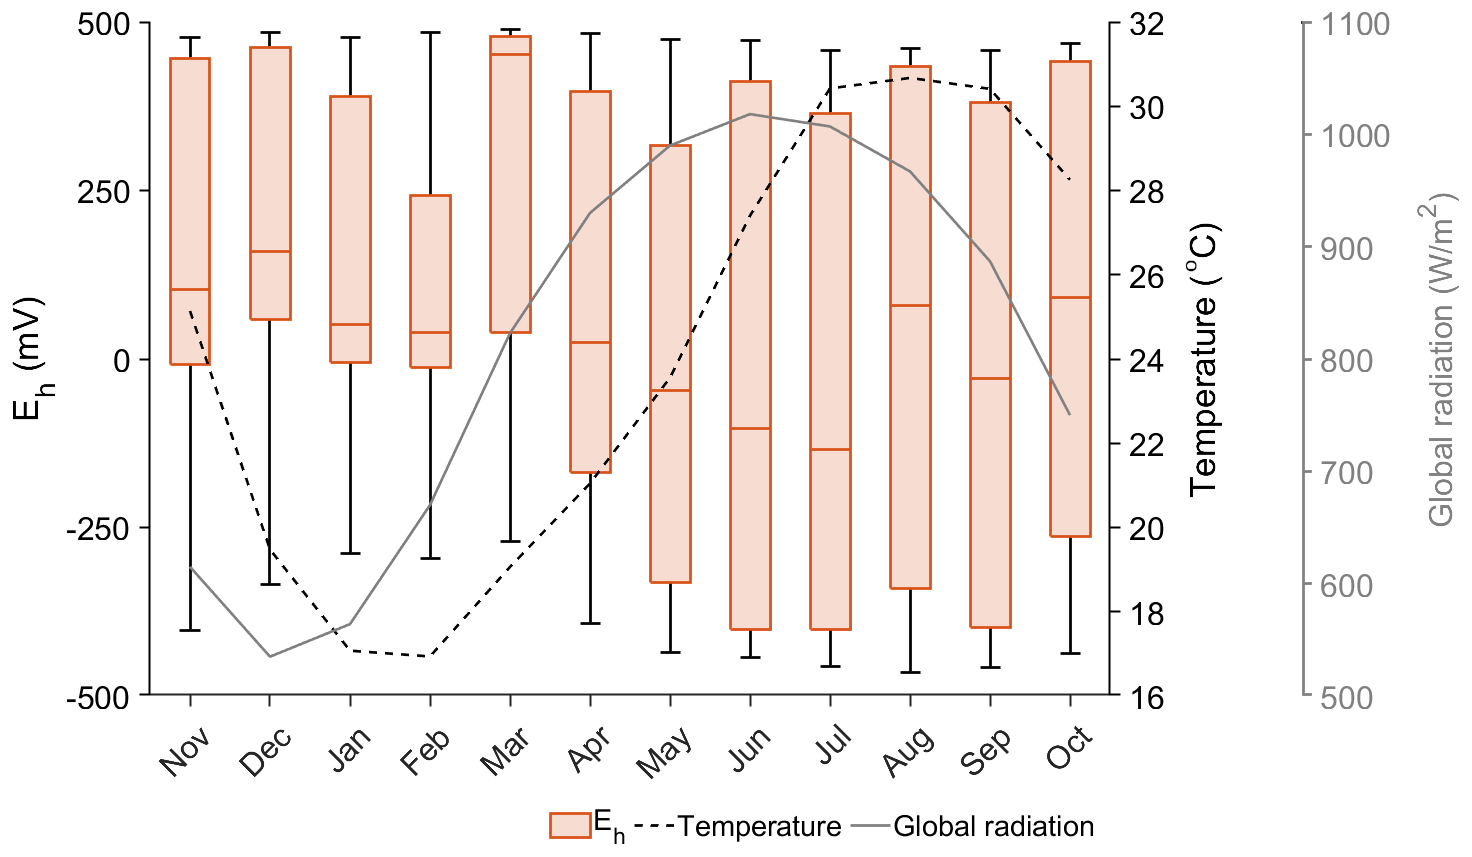
Figure 5Seasonal changes in Eh conditions as observed at 25 cm depth at station 2 under long (7 d) wetting periods. The dashed black line represents the monthly mean ambient temperature, and the solid grey line represents the monthly mean global radiation obtained from the Israeli Meteorological Service (IMS, 2022).
3.3 A comparison between SAT redox (Eh) conditions under long and short cycles
It has been shown that the operational mode affects the aeration conditions of the upper vadose zone, which, consequently, might alter the infiltration rates and the intensity of the biogeochemical processes (Goren et al., 2014). Throughout the measurement period, the intervals of wetting and drying stages were modified (Table 1). The wetting and drying stages were substantially shortened during September 2020, which enabled the examining of the differences in Eh conditions under short and long cycles. The variations in Eh conditions under long cycles during October 2019, December 2019, and January 2020 are presented in Fig. 6a and c. In addition, the changes in Eh conditions under short cycles during September–October 2020, December 2020, and January 2021 are presented in Fig. 6b and d.
As was shown above, under long cycles, the Eh conditions declined towards slightly negative values during winter and attained markedly negative values during the summer months at 25 and 50 cm depths, where only minor variations were observed at 100 cm depth (Fig. 6a, c). The Eh conditions, under short cycles during the summer, showed a decline towards slightly negative values for a brief time, compared to long cycles (Fig. 6a, b). During the winter, only minor variations in Eh conditions were recorded under short cycles (Fig. 6d). Note that, at 100 cm depth, there was almost no change in Eh conditions for either season under short cycles (Fig. 6b, d). As was illustrated previously (Fig. 4a, b), once the drying stage initiated, the recovery of Eh towards positive values (oxic conditions) was almost instant under both short and long cycles. It appears that the re-establishment of oxic conditions occurs independently of the length of the wetting stage.
The observations of Eh and gaseous O2 under long and short cycles indicate a weak relationship between the wetting and the drying stages. These results call into question the advantage of implementing the wet dry ratio for optimizing SAT performance. It appears that the length of a wetting stage and a drying stage should be defined separately (Ben Moshe et al., 2020, 2021). Thus, the necessary further investigation is described below to examine the optimal lengths of the wetting and drying stages.
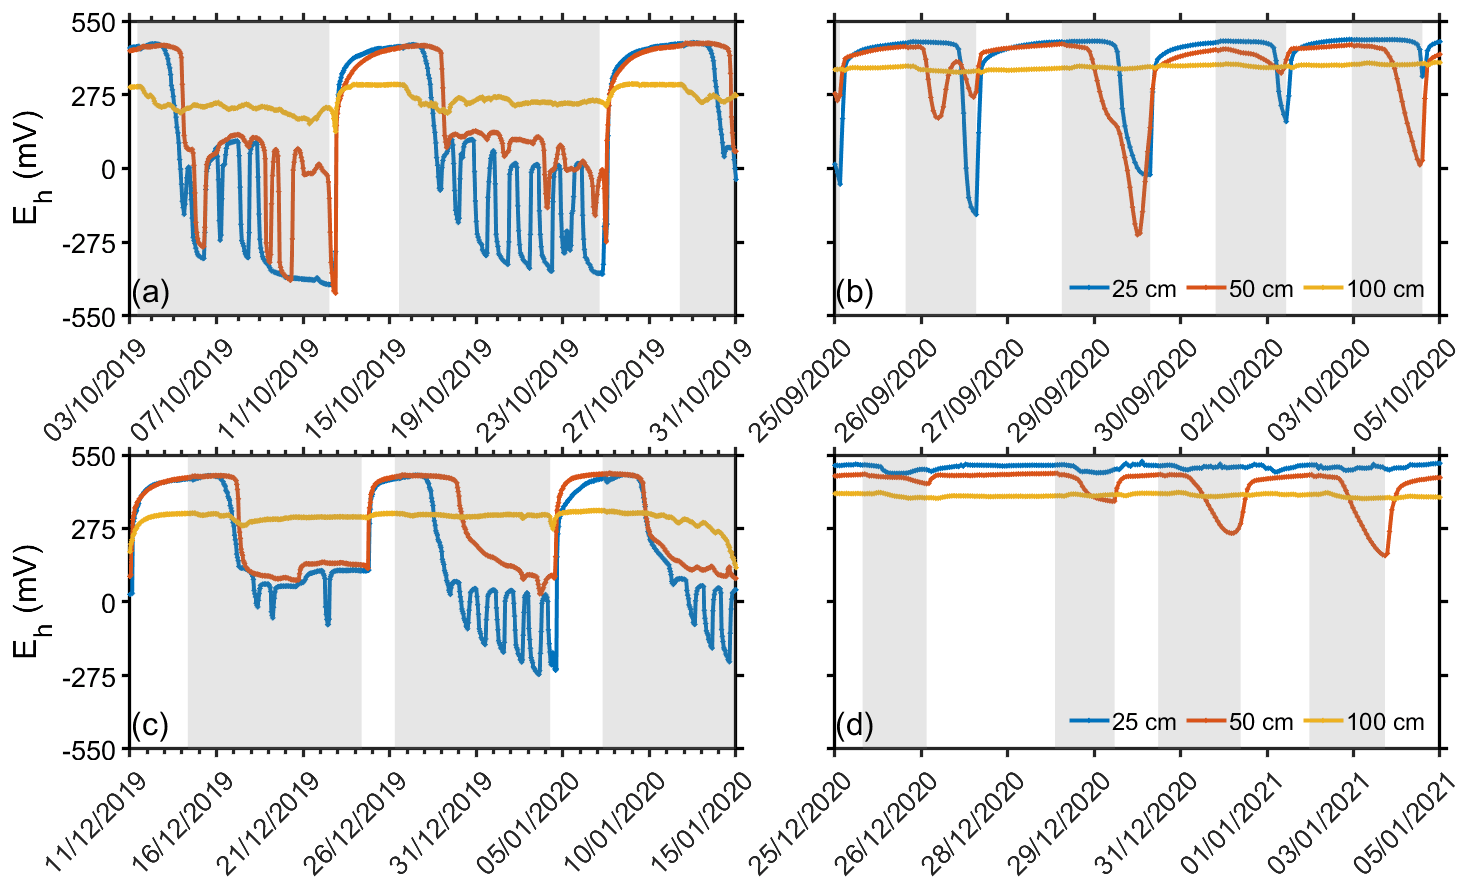
Figure 6Representative time series of redox potential (Eh) measurements at 25, 50, and 100 cm depths at station 1 (Fig. 1). (a, c) Long wetting periods and (b, d) short wetting periods are shown. Note that the grey and white areas indicate wetting and drying periods, respectively.
3.4 The length of the wetting stage according to Eh measurements
During wetting stages, the main limiting factor of the biodegradation process is the availability of dissolved oxygen (Skopp et al., 1990; Cook and Knight, 2003). Once the soil pores are fully saturated, only the dissolved oxygen (DO) of the percolating water is available. However, studies have illustrated that the DO of the percolating water rapidly depletes (Dutta et al., 2015; Ben Moshe et al., 2020, 2021). Thus, the wetting stage should cease when the DO no longer has an effect on the degradation process, i.e. when suboxic and anoxic conditions begin to develop. Eh measurements can provide a good indication for the time when such conditions begin to be established. For this purpose, the hourly measured Eh conditions during the wetting stage of 33 recorded cycles (19 cycles during summer and 14 cycles during winter) were averaged for 25, 50, 75, and 100 cm depth (Fig. 7). The data were separated between winter (November–April) and summer (May–October), according to the trends presented in Fig. 5.
During summer, the decline in Eh conditions was steeper compared to the trends exhibited in winter (Fig. 7). Following 30 h of wetting, the Eh conditions during the summer dropped below 400 mV at 25 cm depth, which indicates the establishment of suboxic conditions (Fig. 7a). After 37 h, the Eh observations at 50 and 75 cm depths showed similar trends (Fig. 7a). Note that, after 45 h the Eh observations at 25 cm depth reach anoxic conditions. The differences between Eh measurements at topsoil and at deeper parts of the vadose zone were previously attributed to carbon availability, which decrease with depth (Brettar et al., 2002; Bohrerova et al., 2004). Furthermore, Brettar et al. (2002) provided a range of threshold Eh values for the denitrifying conditions, depending on the depth of the soil horizon. Similarly, despite the differences between the Eh measurements at 25 cm depth and at deeper depths (Fig. 7), all the Eh measurements potentially indicate similar activity. To prevent anoxic conditions in the SAT vadose zone during summer, the optimal length of a wetting stage, in terms of biodegradation, would be about 30 h (1.25 d). This is in agreement with Dutta et al. (2015), who suggested a relatively wide distribution of de-oxygenation times of between 0.36 and 1.5 d.
In winter, the Eh measurements decrease towards suboxic conditions, that occur after 51, 69, and 84 h of wetting at 25, 50, and 75 cm depths, respectively (Fig. 7b). The delay in Eh drop (compared to summer) is partly explained by the longer presence of gaseous O2 in the SAT vadose zone (Figs. 4c, d and 8). It takes a longer time for the gaseous O2 to deplete during winter (Fig. 8), probably as a result of lower oxygen demand due to slower microbial activity at low temperatures (Kirschbaum, 1995). An additional explanation for the longer presence of gaseous O2 is due to a longer establishment of saturated conditions as a consequence of lower Ks values (see Sect. 3.1). However, once the gaseous O2 is absent from the SAT vadose zone during winter (Fig. 8), no further decrease in Eh conditions occurs (Fig. 7b). Therefore, the trade-off between nutrient transport rates and reaction rates should be considered, where the supply of the percolated effluent's substrate might be faster than the SAT's degradation capability (Greskowiak et al., 2006). Determining the length of a wetting stage during winter, using solely the Eh and gaseous O2 measurements, may be challenging. Nevertheless, the changes in soil physical parameters and the seasonal differences in Eh values imply low biodegradation rates during winter. From a practical perspective, the observed Eh values at 25 cm depth during winter are compared with the Eh measurements during summer. Using a two-sample t test shows that the differences in the first 28 h of a wetting cycle are insignificant. It suggests that the length of a wetting stage during winter should be no more than 30 h, as in the summer period. Nevertheless, given the evidences that are reflected in the measurements of the current study and conclusions from previous studies, the implementation of SAT during winter is questionable. It might be necessary to store the effluents in reservoirs during winter and apply the SAT during summer.
According to the Eh sensor at 100 cm, suboxic conditions prevail for most times during winter and a moderate decrease (compared to the other sensors) in Eh conditions is noticeable during summer (Fig. 7). The gaseous O2 observations at 75 cm indicate depletion of gaseous O2 during summer and a very low O2 concentration (2 %) during winter (Fig. 8c). At 150 cm, the gaseous O2 observations suggest that, for most of the recorded wetting cycles, unsaturated conditions prevailed (Fig. 8d). It is not clear if the Eh conditions at 100 cm are determined by a continuous supply of oxygen, given the unsaturated conditions. This might affect the decision concerning the optimal length of a wetting cycle. However, previous studies (Miller et al., 2006; Fox et al., 2005; Lin et al., 2008; Goren et al., 2014; Sopilniak et al., 2018; Essandoh et al., 2013; Quanrud et al., 1996, 2003) and a recent study by our group (Grinshpan et al., 2022) suggest that most biodegradation activity occurs at topsoil, and there is a steep reduction in removal capabilities with depth. Thus, the potential contribution of the deeper vadose zone to the SAT treatment should be further investigated.
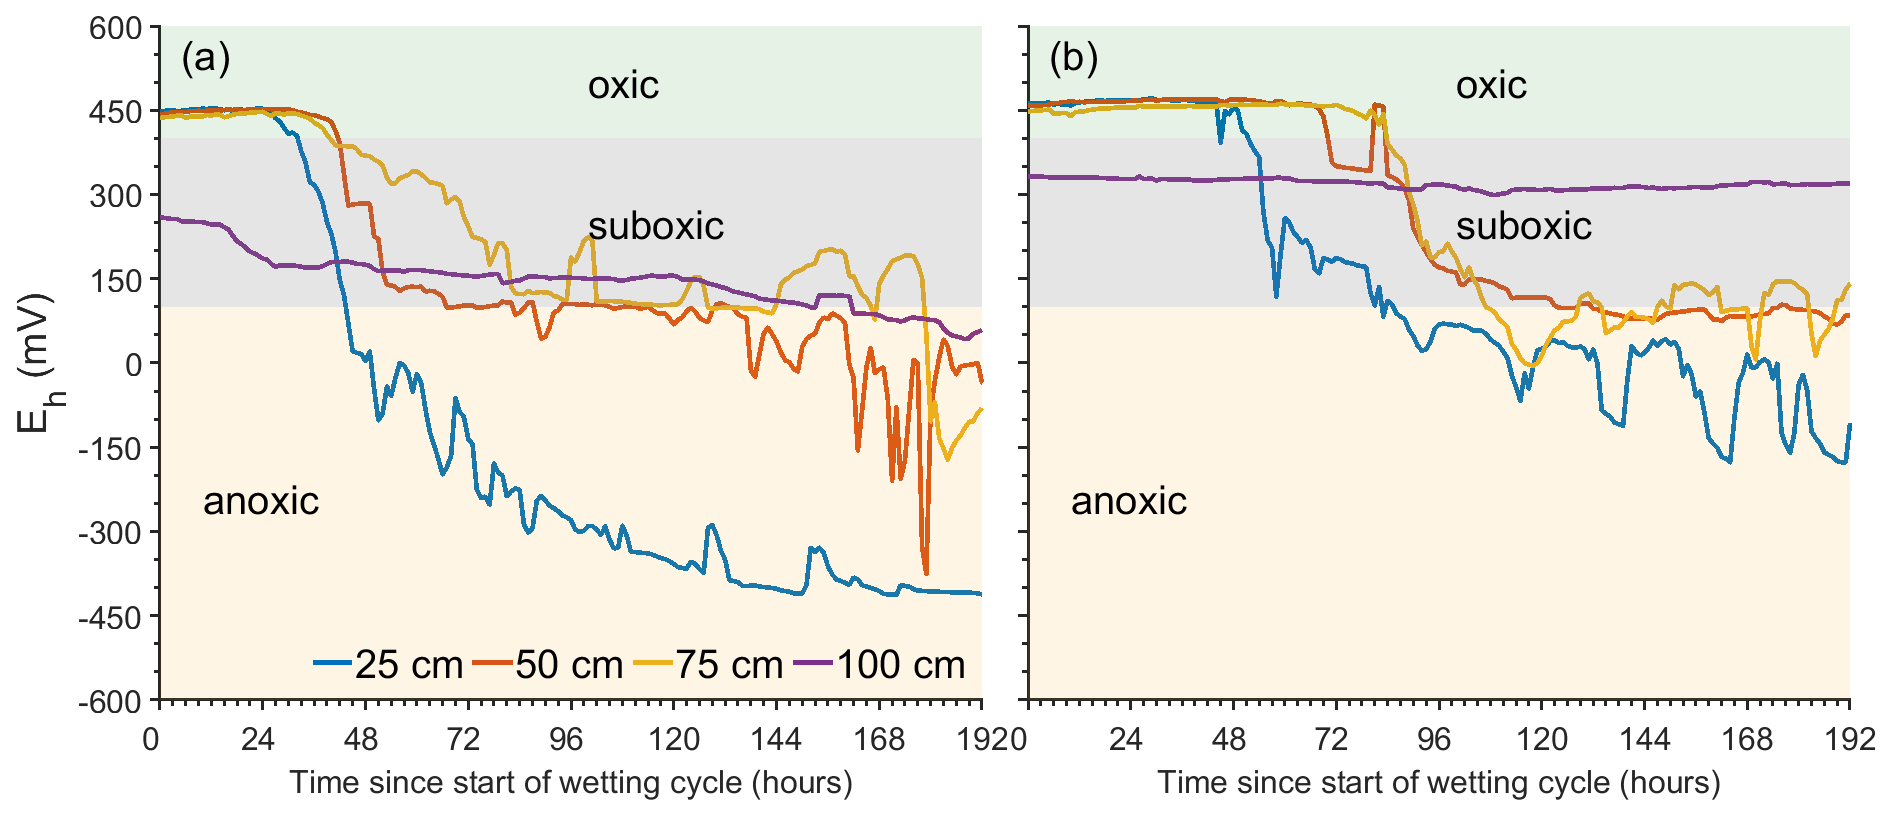
Figure 7Plot of hourly means of Eh measurements obtained at station 2, from the beginning of the wetting stages, at three depths. The statistics are based on 19 cycles during summer (May–October) and 14 cycles during winter (November–April) that were observed in (a) winter and (b) summer. Note that the data are separated between summer and winter according to the trends presented in Fig. 5. The green, grey, and yellow areas represent the oxic (400 mV <), suboxic (400 mV > Eh > 100 mV), and anoxic Eh < 100 mV) conditions, respectively.
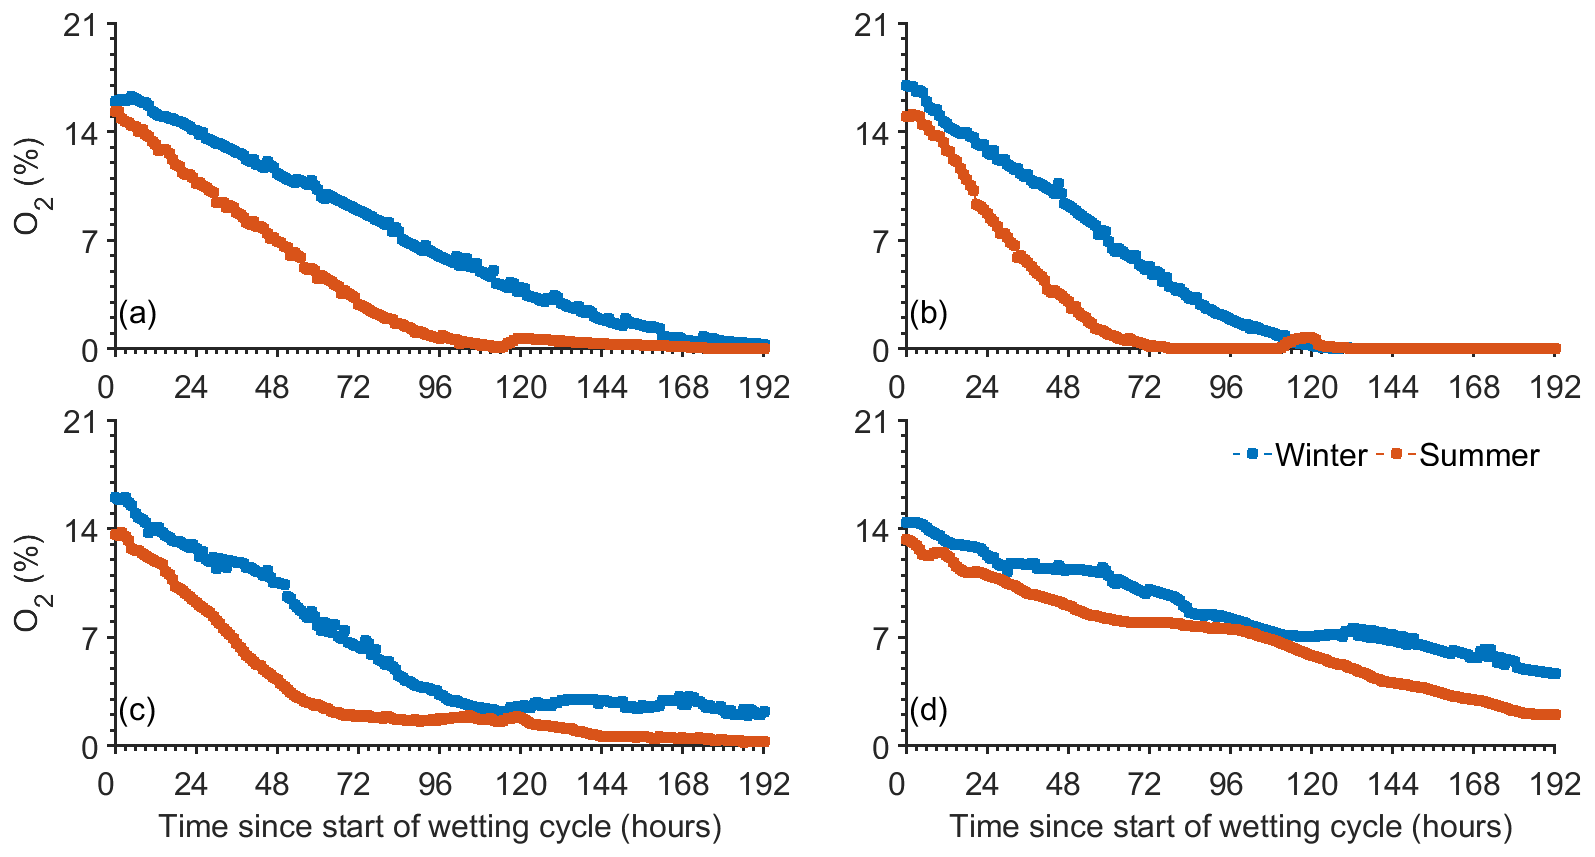
Figure 8Plot of hourly means of gaseous O2 measurements from the beginning of the wetting stages at (a) 25, (b) 50, (c) 75, and (d) 150 cm depths. The statistics are based on 14 cycles during winter (November–April) and 19 cycles during summer (May–October) that were observed at multiple depths in station 2. Note that the data are separated between summer and winter according to the trends presented in Fig. 5.
3.5 The length of the drying stage using Eh and gaseous O2 measurements
The drying stage in SAT systems is implemented to restore the infiltration, biological, and chemical capabilities of the pond, mainly by aerating the soil (Sharma and Kennedy, 2017). A drying stage is defined as the stage in which there is no water at the soil surface, and the observed volumetric water contents begin to decrease (Fig. 2). To determine the optimal time for a drying stage, both the averaged values of the Eh (Fig. 9a, b) and gaseous O2 (Fig. 9c, d) observations during the drying stages are presented. Note that the Eh measurements were conducted at 25, 50, 75, and 100 cm depths, and the O2 observations were obtained at 25, 50, 75, and 150 cm depths (Fig. 9). The Eh and O2 data during the drying stages were separated between winter (November–April) and summer (May–October), according to the trends presented in Fig. 5.
Slower aeration rates and larger variability were observed during winter compared to summer (Fig. 9a, b). Furthermore, the Eh recovery is clearly dominated by the rates of the gaseous O2 intrusion to the soil (Fig. 9c, d). During winter, the aeration rates are different at each depth, but in general, the gaseous O2 concentrations increase moderately with time (Fig. 9a). The recovery of the Eh conditions display comparable trends (Fig. 9c). Although the O2 sensor at 50 cm depth suggest a faster O2 intrusion rate compared to the other sensors (Fig. 9a), it is not expressed in the Eh recovery time (Fig. 9c). During summer all the observed O2 curves show steep recovery that ceases after about 20 h (Fig. 9b). According to the O2 observations, the gaseous O2 intrusion process at 50 and 75 cm depths starts at the very beginning of the drying stage, while at 25 and 100 cm depths there is a 2 h delay (Fig. 9b). Nevertheless, the Eh conditions recovery is comparable at all depths (Fig. 9d).
The Eh observations illustrate that the re-establishment of oxic conditions in the SAT vadose zone is similar during winter and summer (Fig. 9c, d). Once the drying stage started, it required about 36 h for the Eh conditions to reach values in the range of oxic conditions, regardless of the initial value of the Eh conditions (Fig. 9c, d). However, a recent study has indicated that using solely the gaseous O2 concentration to quantify soil aeration status might be inaccurate for some conditions (Ben-Noah et al., 2021). Instead, the authors suggested using the Damköhler number, which is the ratio between characteristic diffusion (i.e. oxygen supply) and soil respiration times. A small Damköhler number would indicate that the O2 consumption rate is lower than the O2 supply. Thus, although during summer the oxygen supply rate is relatively high compared to winter (Fig. 9a, b), the oxygen consumption rate for soil respiration is expected to be substantially higher during summer than during winter (Kirschbaum, 1995), as it is reflected by the Eh observations (Figs. 5 and 7). Therefore, in parallel to proper treatment of aeration time, optimal wetting time should be further treated.
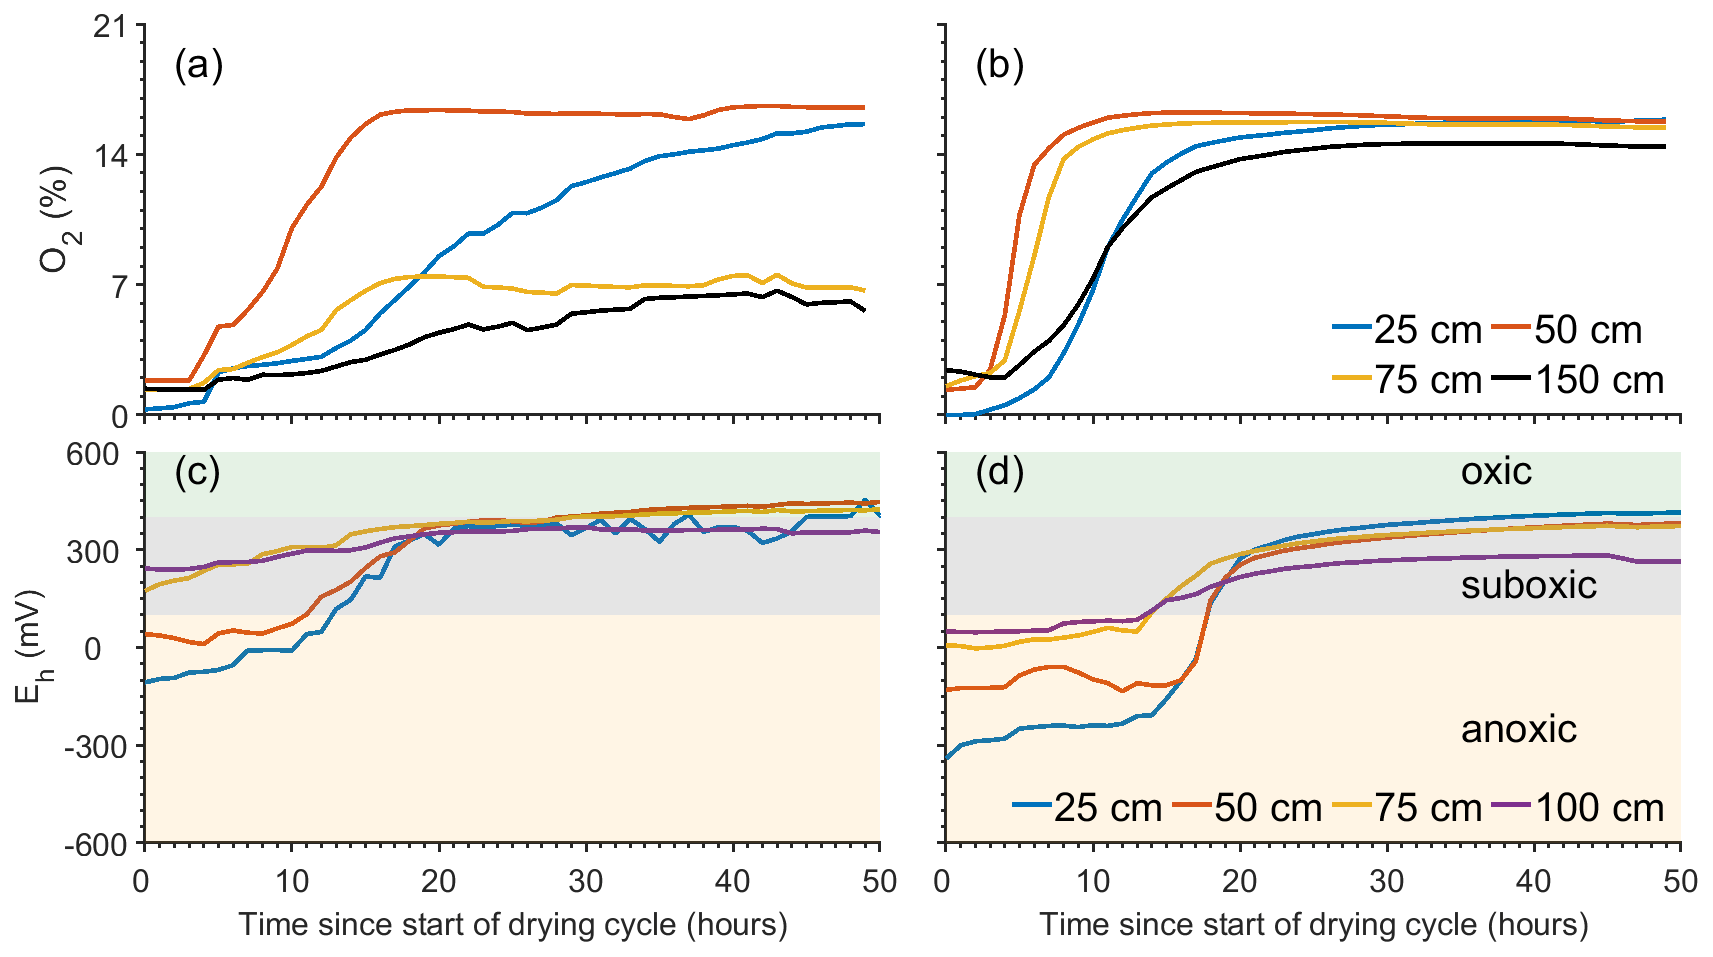
Figure 9Plot of hourly means of Eh and gaseous O2 measurements from the beginning of the drying stages. The statistics are based on (a, c) 14 cycles during winter (November–April) and (b, d) 19 cycles during summer (May–October). Note that the gaseous O2 (a, b) measurements were obtained at 25, 50, 75, and 150 cm depths, and the Eh conditions (c, d) were observed at 25, 50, 75, and 100 cm depths. All observations were conducted in station 2. The data are separated between summer and winter according to the trends presented in Fig. 5. The green, grey, and yellow areas represent the oxic (400 mV <), suboxic (400 mV > Eh > 100 mV), and anoxic Eh < 100 mV) conditions, respectively.
Continuous monitoring of Eh, θ, T, and gaseous O2 in the vadose zones of SAT infiltration ponds was carried out for about 600 d. SAT operation was subjected to long and short wetting and drying cycles and seasonal changes. The datasets enabled the examination of factors that control the hydrological and geochemical conditions in SAT. Calibrated and validated hydrological models were applied to investigate the water flow dynamics in the SAT vadose zone. Eh and gaseous O2 observations were averaged to determine seasonal changes and deduce the optimal length of wetting and drying stages.
The examination of the measured Eh conditions illustrated a noticeable decline to markedly negative values (−450 mV >) during summer and to values between 0 and −50 mV during winter. These Eh conditions were established following 30 h of wetting, and no considerable changes in Eh conditions were noticeable until the wetting stages ceased. A monthly statistic of the Eh measurements illustrated the relationship between the size of the Eh amplitude and the seasonal T changes. Furthermore, it is speculated that the limited decrease in Eh conditions during winter was due to lower microbial activity. An additional support for this claim is the reduction in infiltration capabilities following long wetting and drying cycles during winter, as was indicated by the hydrological models. To define the optimal length of a wetting stage, the Eh data were averaged and separated between the winter and summer periods. During the summer period, the optimal time length of a wetting stage, according to Eh observations, is about 30 h. Determining the optimal length of a wetting stage during winter is challenging. Practically, there are no significant differences between Eh conditions during winter and summer for the first 28 h of wetting. Thus, the length of a wetting stage during winter should be 30 h, as in the summer period.
The length of a drying stage, following the Eh observations, should be about 36 h, regardless of the initial values of the Eh conditions and the season. Note that, during summer, a longer drying time is required for the Eh conditions to attain suboxic conditions. Nevertheless, the gaseous O2 observations indicated faster aeration rates during summer, which compensate for the very negative Eh conditions and allow fast recovery. Following our analysis, we suggest that, under the tested conditions, the length of a drying stage should be 36 h for winter and summer. Shorter drying stages would affect SAT efficiency, while applying longer drying stages would reduce the total hydraulic loads that can be fed to the infiltration basin.
Implementing in situ Eh, θ, T, and gaseous O2 sensors provided continuous high-resolution observations. These datasets revealed the hydrological and biochemical dynamics in SAT as imposed by seasonal and operational changes. Analysis of the Eh and O2 measurements enabled the identification of the optimal time lengths of wetting and drying stages. The results indicated that there is no direct relationship between the length of a wetting stage and a drying stage. Thus, the operational use of a wetting/drying ratio in SAT management should be reconsidered.
The MATLAB scripts and the data that were used for this study are available for public download at https://doi.org/10.6084/m9.figshare.19314032 (Turkeltaub, 2022).
The supplement related to this article is available online at: https://doi.org/10.5194/hess-26-1565-2022-supplement.
RM, AF, and NW designed the experiments. RM provided and analyzed the field data. TT analyzed the data and prepared the paper with contribution of all authors.
The contact author has declared that neither they nor their co-authors have any competing interests.
Publisher's note: Copernicus Publications remains neutral with regard to jurisdictional claims in published maps and institutional affiliations.
This work has been supported within the framework of the German–Israeli Water Technology Cooperation Program (grant no. WT1601/2689), by the German Federal Ministry of Education and Research (BMBF), by the Israel Ministry of Science, Technology and Space (MOST), and by the Goldinger Trust, Jewish Federation of Delaware.
This paper was edited by Gerrit H. de Rooij and reviewed by Ofer Dahan and one anonymous referee.
Amy, G. and Drewes, J.: Soil aquifer treatment (SAT) as a natural and sustainable wastewater reclamation/reuse technology: Fate of wastewater effluent organic Matter (EfoM) and trace organic compounds, Environ. Monit. Assess., 129, 19–26, https://doi.org/10.1007/s10661-006-9421-4, 2007.
Arye, G., Tarchitzky, J., and Chen, Y.: Treated wastewater effects on water repellency and soil hydraulic properties of soil aquifer treatment infiltration basins, J. Hydrol., 397, 136–145, https://doi.org/10.1016/j.jhydrol.2010.11.046, 2011.
Asano, T. and Cotruvo, J. A.: Groundwater recharge with reclaimed municipal wastewater: Health and regulatory considerations, Water Res., 38, 1941–1951, https://doi.org/10.1016/j.watres.2004.01.023, 2004.
Ben Moshe, S., Weisbrod, N., Barquero, F., Sallwey, J., Orgad, O., and Furman, A.: On the role of operational dynamics in biogeochemical efficiency of a soil aquifer treatment system, Hydrol. Earth Syst. Sci., 24, 417–426, https://doi.org/10.5194/hess-24-417-2020, 2020.
Ben Moshe, S., Weisbrod, N., and Furman, A.: Optimization of soil aquifer treatment (SAT) operation using a reactive transport model, Vadose Zone J., 20, 1–13, https://doi.org/10.1002/vzj2.20095, 2021.
Ben-Noah, I., Nitsan, I., Cohen, B., Kaplan, G., and Friedman, S. P.: Soil aeration using air injection in a citrus orchard with shallow groundwater, Agr. Water Manage., 245, 106664, https://doi.org/10.1016/j.agwat.2020.106664, 2021b.
Berner, R. A.: A new geochemical classification of sedimentary environments, J. Sediment. Perol., 51, 359–365, https://doi.org/10.1306/212F7C7F-2B24-11D7-8648000102C1865D, 1981.
Bohrerova, Z., Stralkova, R., Podesvova, J., Bohrer, G., and Pokorny, E.: The relationship between redox potential and nitrification under different sequences of crop rotations, Soil Till. Res., 77, 25–33, https://doi.org/10.1016/j.still.2003.10.006, 2004.
Bouwer, H.: Artificial recharge of groundwater: Hydrogeology and engineering, Hydrogeol. J., 10, 121–142, https://doi.org/10.1007/s10040-001-0182-4, 2002.
Brettar, I., Sanchez-Perez, J. M., and Trémolières, M.: Nitrate elimination by denitrification in hardwood forest soils of the Upper Rhine floodplain – Correlation with redox potential and organic matter, Hydrobiologia, 469, 11–21, https://doi.org/10.1023/A:1015527611350, 2002.
Christensen, T. H., Bjerg, P. L., Banwart, S. A., Jakobsen, R., Heron, G., and Albrechtsen, H. J.: Characterization of redox conditions in groundwater contaminant plumes, J. Contam. Hydrol., 45, 165–241, https://doi.org/10.1016/S0169-7722(00)00109-1, 2000.
Cook, F. J. and Knight, J. H.: Oxygen Transport to Plant Roots, Soil Sci. Soc. Am. J., 67, 20–31, https://doi.org/10.2136/sssaj2003.2000, 2003.
Díaz-Cruz, M. S. and Barceló, D.: Trace organic chemicals contamination in ground water recharge, Chemosphere, 72, 333–342, https://doi.org/10.1016/j.chemosphere.2008.02.031, 2008.
Dillon, P.: Future management of aquifer recharge, Hydrogeol. J., 13, 313–316, https://doi.org/10.1007/s10040-004-0413-6, 2005.
Doerr, S. H., Shakesby, R. A., and Walsh, R. P. D.: Soil water repellency: Its causes, characteristics and hydro-geomorphological significance, Earth Sci. Rev., 51, 33–65, https://doi.org/10.1016/S0012-8252(00)00011-8, 2000.
Drewes, J. E.: Ground water replenishment with recycled water – Water quality improvements during managed aquifer recharge, Ground Water, 47, 502–505, https://doi.org/10.1111/j.1745-6584.2009.00587_5.x, 2009.
Dutta, T., Carles-Brangarí, A., Fernàndez-Garcia, D., Rubol, S., Tirado-Conde, J., and Sanchez-Vila, X.: Vadose zone oxygen (O2) dynamics during drying and wetting cycles: An artificial recharge laboratory experiment, J. Hydrol., 527, 151–159, https://doi.org/10.1016/j.jhydrol.2015.04.048, 2015.
Elkayam, R., Sopliniak, A., Gasser, G., Pankratov, I., and Lev, O.: Oxidizer Demand in the Unsaturated Zone of a Surface-Spreading Soil Aquifer Treatment System, Vadose Zone J., 14, vzj2015.03.0047, https://doi.org/10.2136/vzj2015.03.0047, 2015.
Essandoh, H. M. K., Tizaoui, C., and Mohamed, M. H. A.: Removal of dissolved organic carbon and nitrogen during simulated soil aquifer treatment, Water Res., 47, 3559–3572, https://doi.org/10.1016/j.watres.2013.04.013, 2013.
Fox, P., Aboshanp, W., and Alsamadi, B.: Analysis of soils to demonstrate sustained organic carbon removal during soil aquifer treatment, J. Environ. Qual., 34, 156–163, 2005.
Froelich, P. N., Klinkhammer, G. P., Bender, M. L., Luedtke, N. A., Heath, G. R., Cullen, D., Dauphin, P., Hammond, D., Hartman, B., and Maynard, V.: Early oxidation of organic matter in pelagic sediments of the eastern equatorial Atlantic: suboxic diagenesis, Geochim. Cosmochim. Ac., 43, 1075–1090, https://doi.org/10.1016/0016-7037(79)90095-4, 1979.
Ganot, Y., Holtzman, R., Weisbrod, N., Nitzan, I., Katz, Y., and Kurtzman, D.: Monitoring and modeling infiltration–recharge dynamics of managed aquifer recharge with desalinated seawater, Hydrol. Earth Syst. Sci., 21, 4479–4493, https://doi.org/10.5194/hess-21-4479-2017, 2017.
Goren, O., Lazar, B., Burg, A., and Gavrieli, I.: Mobilization and retardation of reduced manganese in sandy aquifers: Column experiments, modeling and implications, Geochim. Cosmochim. Ac., 96, 259–271, https://doi.org/10.1016/j.gca.2012.06.032, 2012.
Goren, O., Burg, A., Gavrieli, I., Negev, I., Guttman, J., Kraitzer, T., Kloppmann, W., and Lazar, B.: Biogeochemical processes in infiltration basins and their impact on the recharging effluent, the soil aquifer treatment (SAT) system of the Shafdan plant, Israel, Appl. Geochem., 48, 58–69, https://doi.org/10.1016/j.apgeochem.2014.06.017, 2014.
Gorski, G., Fisher, A. T., Beganskas, S., Weir, W. B., Redford, K., Schmidt, C., and Saltikov, C.: Field and Laboratory Studies Linking Hydrologic, Geochemical, and Microbiological Processes and Enhanced Denitrification during Infiltration for Managed Recharge, Environ. Sci. Technol., 53, 9491–9501, https://doi.org/10.1021/acs.est.9b01191, 2019.
Grau-martínez, A., Torrentó, C., Carrey, R., Rodríguez-escales, P., Domènech, C., Ghiglieri, G., Soler, A., and Otero, N.: Feasibility of two low-cost organic substrates for inducing denitrification in artificial recharge ponds: Batch and flow-through experiments, J. Contam. Hydrol., 198, 48–58, https://doi.org/10.1016/j.jconhyd.2017.01.001, 2017.
Grau-martínez, A., Folch, A., Torrentó, C., Valhondo, C., Barba, C., Domènech, C., Soler, A., and Otero, N.: Monitoring induced denitrification during managed aquifer recharge in an infiltration pond, J. Hydrol., 561, 123–135, https://doi.org/10.1016/j.jhydrol.2018.03.044, 2018.
Greskowiak, J., Prommer, H., Massmann, G., and Nützmann, G.: Modeling seasonal redox dynamics and the corresponding fate of the pharmaceutical residue phenazone during artificial recharge of groundwater, Environ. Sci. Technol., 40, 6615–6621, https://doi.org/10.1021/es052506t, 2006.
Grinshpan, M., Furman, A., Dahlke, H. E., Raveh, E., and Weisbrod, N.: From managed aquifer recharge to soil aquifer treatment on agricultural soils: Concepts and challenges, Agr. Water Manage., 255, 106991, https://doi.org/10.1016/j.agwat.2021.106991, 2021.
Grinshpan, M., Turkeltaub, T., Furman, A., Raveh, E., and Weisbrod, N.: On the use of orchards to support soil aquifer treatment systems, Agr. Water Manag., 260, 107315, https://doi.org/10.1016/j.agwat.2021.107315, 2022.
Guswa, A. J., Celia, M. A., and Rodriguez-Iturbe, I.: Models of soil moisture dynamics in ecohydrology: A comparative study, Water Resour. Res., 38, 5-1–5-15, https://doi.org/10.1029/2001wr000826, 2002.
Hargreaves, J. A.: Photosynthetic suspended-growth systems in aquaculture, Aquac. Eng., 34, 344–363, https://doi.org/10.1016/j.aquaeng.2005.08.009, 2006.
Hinchey, E. K. and Schaffner, L. C.: An evaluation of electrode insertion techniques for measurement of redox potential in estuarine sediments, Chemosphere, 59, 703–710, https://doi.org/10.1016/j.chemosphere.2004.10.029, 2005.
Icekson-Tal, N., Avraham, O., Sack, J., and Cikurel, H.: Water reuse in Israel – the Dan region project: evaluation of water quality and reliability of plant's operation, Water Supply, 3, 231–237, 2003.
Inbar, Y.: New standards for treated wastewater reuse in Israel, in: Wastewater reuse–risk assessment, decision-making and environmental security, edited by: Zaidi M., Dordrecht, the Netherlands, Springer, 291–296, https://doi.org/10.1007/978-1-4020-6027-4_28, 2007.
Israel Meterological Service (IMS): Web Israel Meteorological Service: Data base, https://ims.data.gov.il/ims/1, last access: 6 March 2022.
Kfir, O., Tal, A., Gross, A., and Adar, E.: The effect of reservoir operational features on recycled wastewater quality, Resour. Conserv. Recy., 68, 76–87, https://doi.org/10.1016/j.resconrec.2012.08.002, 2012.
Kirschbaum, M. U. F.: The temperature dependence of soil organic matter decomposition, and the effect of global warming on soil organic C storage, Soil Biol. Biochem., 27, 753–760, https://doi.org/10.1016/0038-0717(94)00242-S, 1995.
Lin, C., Greenwald, D., and Banin, A.: Temperature dependence of infiltration rate during large scale water recharge into soils, Soil Sci. Soc. Am. J., 67, 487–493, https://doi.org/10.2136/sssaj2003.4870, 2003.
Lin, C., Eshel, G., Negev, I., and Banin, A.: Long-term accumulation and material balance of organic matter in the soil of an effluent infiltration basin, Geoderma, 148, 35–42, https://doi.org/10.1016/j.geoderma.2008.09.017, 2008.
Mächler, L., Peter, S., Brennwald, M. S., and Kipfer, R.: Excess air formation as a mechanism for delivering oxygen to groundwater, Water Resour. Res., 49, 6847–6856, https://doi.org/10.1002/wrcr.20547, 2013.
Massmann, G., Greskowiak, J., Dünnbier, U., Zuehlke, S., Knappe, A., and Pekdeger, A.: The impact of variable temperatures on the redox conditions and the behaviour of pharmaceutical residues during artificial recharge, J. Hydrol., 328, 141–156, https://doi.org/10.1016/j.jhydrol.2005.12.009, 2006.
McMahon, P. B. and Chapelle, F. H.: Redox processes and water quality of selected principal aquifer systems, Ground Water, 46, 259–271, https://doi.org/10.1111/j.1745-6584.2007.00385.x, 2008.
Miller, J. H., Ela, W. P., Lansey, K. E., Chipello, P. L., and Arnold, R. G.: Nitrogen Transformations during Soil–Aquifer Treatment of Wastewater Effluent–Oxygen Effects in Field Studies, J. Environ. Eng., 132, 1298–1306, https://doi.org/10.1061/(asce)0733-9372(2006)132:10(1298), 2006.
Mizrahi, G., Furman, A., and Weisbrod, N.: Infiltration under Confined Air Conditions: Impact of Inclined Soil Surface, Vadose Zone J., 15, vzj2016.04.0034, https://doi.org/10.2136/vzj2016.04.0034, 2016.
Morrison, C. M., Betancourt, W. Q., Quintanar, D. R., Lopez, G. U., Pepper, I. L., and Gerba, C. P.: Potential indicators of virus transport and removal during soil aquifer treatment of treated wastewater effluent, Water Res., 177, 115812, https://doi.org/10.1016/j.watres.2020.115812, 2020.
Nadav, I., Arye, G., Tarchitzky, J., and Chen, Y.: Enhanced infiltration regime for treated-wastewater purification in soil aquifer treatment (SAT), J. Hydrol., 420–421, 275–283, https://doi.org/10.1016/j.jhydrol.2011.12.013, 2012a.
Nadav, I., Tarchitzky, J., and Chen, Y.: Soil cultivation for enhanced wastewater infiltration in soil aquifer treatment (SAT), J. Hydrol., 470–471, 75–81, https://doi.org/10.1016/j.jhydrol.2012.08.013, 2012b.
Negev, I., Shechter, T., Shtrasler, L., Rozenbach, H., and Livne, A.: The effect of soil tillage equipment on the recharge capacity of infiltration ponds, 12, 1–11, https://doi.org/10.3390/w12020541, 2020.
Nimmo, J. R., Schmidt, K. M., Perkins, K. S., and Stock, J. D.: Rapid Measurement of Field-Saturated Hydraulic Conductivity for Areal Characterization, Vadose Zone J., 8, 142–149, https://doi.org/10.2136/vzj2007.0159, 2009.
Oren, O., Gavrieli, I., Burg, A., Guttman, J., and Lazar, B.: Manganese mobilization and enrichment during soil aquifer treatment (SAT) of effluents, the Dan Region Sewage Reclamation Project (Shafdan), Israel, Environ. Sci. Technol., 41, 766–772, https://doi.org/10.1021/es060576+, 2007.
Quanrud, D. M., Arnold, R. G., Wilson, L. G., Gordon, H. J., Graham, D. W., and Amy, G. L.: Fate of Organics during Column Studies of Soil Aquifer Treatment, J. Environ. Eng., 122, 314–321, https://doi.org/10.1061/(asce)0733-9372(1996)122:4(314), 1996.
Quanrud, D. M., Hafer, J., Karpiscak, M. M., Zhang, J., Lansey, K. E., and Arnold, R. G.: Fate of organics during soil-aquifer treatment: Sustainability of removals in the field, Water Res., 37, 3401–3411, https://doi.org/10.1016/S0043-1354(02)00489-X, 2003.
Reddy, K. R., D’angelo, E. M., and Harris, W. G.: Biogeochemistry of wetlands, in: Handbook of Soil Science, edited by: Summer, M. E., CRC Press, Boca Raton, 89–119, https://doi.org/10.1201/9780203491454, 1998.
Rezanezhad, F., Couture, R. M., Kovac, R., O'Connell, D., and Van Cappellen, P.: Water table fluctuations and soil biogeochemistry: An experimental approach using an automated soil column system, J. Hydrol., 509, 245–256, https://doi.org/10.1016/j.jhydrol.2013.11.036, 2014.
Ritter, A. and Muñoz-Carpena, R.: Performance evaluation of hydrological models: Statistical significance for reducing subjectivity in goodness-of-fit assessments, J. Hydrol., 480, 33–45, https://doi.org/10.1016/j.jhydrol.2012.12.004, 2013.
Rodríguez-Escales, P., Barba, C., Sanchez-Vila, X., Jacques, D., and Folch, A.: Coupling Flow, Heat, and Reactive Transport Modeling to Reproduce in Situ Redox Potential Evolution: Application to an Infiltration Pond, Environ. Sci. Technol., 54, 12092–12101, https://doi.org/10.1021/acs.est.0c03056, 2020.
Sallwey, J., Jurado, A., Barquero, F., and Fahl, J.: Enhanced removal of contaminants of emerging concern through hydraulic adjustments in soil aquifer treatment, Water, 12, 2627, https://doi.org/10.3390/w12092627, 2020.
Sattar, A. M. A.: Prediction of Organic Micropollutant Removal in Soil Aquifer Treatment System Using GEP, J. Hydrol. Eng., 21, 04016027, https://doi.org/10.1061/(asce)he.1943-5584.0001372, 2016.
Schmidt, C. M., Fisher, A. T., Racz, A. J., Lockwood, B. S., and Huertos, M. L.: Linking denitrification and infiltration rates during managed groundwater recharge, Environ. Sci. Technol., 45, 9634–9640, https://doi.org/10.1021/es2023626, 2011.
Sharma, S. K. and Kennedy, M. D.: Soil aquifer treatment for wastewater treatment and reuse, Int. Biodeter. Biodegr., 119, 671–677, https://doi.org/10.1016/j.ibiod.2016.09.013, 2017.
Shenker, M., Seitelbach, S., Brand, S., Haim, A., and Litaor, M. I.: Redox reactions and phosphorus release in re-flooded soils of an altered wetland, Eur. J. Soil Sci., 56, 515–525, https://doi.org/10.1111/j.1365-2389.2004.00692.x, 2005.
Silver, M., Knöller, K., Schlögl, J., Kübeck, C., and Schüth, C.: Nitrogen cycling and origin of ammonium during infiltration of treated wastewater for managed aquifer recharge, Appl. Geochem., 97, 71–80, https://doi.org/10.1016/j.apgeochem.2018.08.003, 2018.
Skopp, J., Jawson, M. D., and Doran, J. W.: Steady-State Aerobic Microbial Activity as a Function of Soil Water Content, Soil Sci. Soc. Am. J., 54, 1619–1625, https://doi.org/10.2136/sssaj1990.03615995005400060018x, 1990.
Sopilniak, A., Elkayam, R., and Lev, O.: Nitrification in a soil-aquifer treatment system: Comparison of potential nitrification and concentration profiles in the vadose zone, Environ. Sci. Process. Impacts, 19, 1571–1582, https://doi.org/10.1039/c7em00402h, 2017.
Sopilniak, A., Elkayam, R., Rossin, A. V., and Lev, O.: Emerging organic pollutants in the vadose zone of a soil aquifer treatment system: Pore water extraction using positive displacement, Chemosphere, 190, 383–392, https://doi.org/10.1016/j.chemosphere.2017.10.010, 2018.
Stumm, W., and Morgan, J. J.: Aquatic chemistry, 3rd ed., Wiley, ISBN 978-0-471-51185-4, 1996.
Tsangaratos, P., Kallioras, A., Pizpikis, T., Vasileiou, E., Ilia, I., and Pliakas, F.: Multi-criteria Decision Support System (DSS) for optimal locations of Soil Aquifer Treatment (SAT) facilities, Sci. Total Environ., 603–604, 472–486, https://doi.org/10.1016/j.scitotenv.2017.05.238, 2017.
Tufenkji, N., Redman, J. A., and Elimelech, M.: Interpreting deposition patterns of microbial particles in laboratory-scale column experiments, Environ. Sci. Technol., 37, 616–623, https://doi.org/10.1021/es025871i, 2003.
Turkeltaub, T.: Paper Hess-2021-455, Figshare [data set], https://doi.org/10.6084/m9.figshare.19314032, 2022.
Wallace, C. D., Sawyer, A. H., and Barnes, R. T.: Spectral analysis of continuous redox data reveals geochemical dynamics near the stream–aquifer interface, Hydrol. Process., 33, 405–413, https://doi.org/10.1002/hyp.13335, 2019.
Wallis, M. G. and Horne, D. J.: Soil water repellency, in: Advances in Soil Science, 265–267, https://doi.org/10.1007/978-1-4612-2930-8_2, 1992.