the Creative Commons Attribution 4.0 License.
the Creative Commons Attribution 4.0 License.
 | 23 Feb 2021
Intensive landscape-scale remediation improves water quality of an alluvial gully located in a Great Barrier Reef catchment
Nicholas J. C. Doriean
William W. Bennett
John R. Spencer
Alexandra Garzon-Garcia
Joanne M. Burton
Peter R. Teasdale
David T. Welsh
Andrew P. Brooks
Gully erosion can be a major disruptor to global fluvial sediment budgets. Gully erosion in the catchments of the Great Barrier Reef is attributed to ∼40 % of fine suspended sediment pollution to the freshwater and marine ecosystems downstream. Mitigating this source of erosion will have a lasting positive impact on the water quality of connected rivers and the receiving marine environment. Here we conduct a preliminary evaluation of the ability of intensive landscape-scale gully remediation to reduce suspended sediment and associated nutrient export from a catchment draining to the Great Barrier Reef. The gully remediation method was a first attempt, in the region, at investing a high level of financial (total cost of remediation AUD ∼90 000) and logistical effort (e.g. intensive earthworks, including the establishment of an on-site quarry) to develop long-lasting erosion mitigation measures (i.e. regraded, compacted, and battered gully walls, rock armouring of banks and channel, and installation of rock check dams). A novel suspended sediment monitoring network, comprised of a suite of new and established automated monitoring methods capable of operating in remote environments, was used to evaluate the water quality of a remediated gully, a control gully, and their respective catchments. The recently developed pumped active suspended sediment (PASS) sampler optimised to sample ephemeral water flows was deployed in gully outlets and catchment runoff flow paths. This study demonstrates how the combination of low- and high-cost water quality monitoring techniques can be deployed in a configuration that ensures sample collection redundancy and complementary data collection between methods. Monitoring was conducted during two consecutive wet seasons and, thus, can only provide preliminary information. Monitoring over longer timescales (i.e. 5–10 years) will need to be carried out in order to validate the findings discussed herein. Samples collected from the remediated gully had significantly lower suspended sediment concentrations compared to the control gully, providing preliminary evidence that the remediation works were successful in stabilising erosion within the gully. Dissolved and particulate nutrient concentrations were also significantly lower in the remediated gully samples, consistent with the decreased suspended sediment concentrations. The novel combination of suspended sediment measurements from both the gully channels and overland flows in the surrounding gully catchments suggests that sediment and nutrients at the remediated site are likely sourced from erosion processes occurring within the catchment of the gully (at relatively low concentrations). In contrast, the primary source of suspended sediment and associated nutrients at the control gully was erosion from within the gully itself. This study demonstrates the potential of landscape-scale remediation as an effective mitigation action for reducing suspended sediment and nutrient export from alluvial gullies. It also provides a useful case study for the monitoring effort required to appropriately assess the effectiveness of this type of erosion control.
- Article
(11857 KB) - Full-text XML
-
Supplement
(5977 KB) - BibTeX
- EndNote


Gully erosion is a significant contributor to the increase in global soil erosion rates and is a major driver of suspended sediment-related impacts on downstream aquatic systems (Poesen, 2011; Bartely et al., 2020). This is particularly relevant for water quality conditions in the Great Barrier Reef (GBR), which are negatively impacted by fluvially sourced pollutants, primarily suspended sediment, dissolved and particulate nutrients, and agrochemicals (Waterhouse et al., 2018; Bartley et al., 2014; Brodie et al., 2012; Fabricius et al., 2005). Land use change, such as mining, agriculture (grazing and cropping), and urbanisation associated with European settlement in the region since the 1860s has increased the output of fine sediment and nutrients from the catchments draining into the GBR (Bartley et al., 2018; Kroon et al., 2016). Catchment-tracing studies have consistently identified sub-surface erosion processes, particularly from stream banks and gullies, as being the dominant source of fine sediment delivered to the GBR (Olley et al., 2013; Wilkinson et al., 2015a). Gully erosion in particular has been identified as the largest single source of suspended sediment, estimated to contribute more than 40 % of all fluvially transported sediment entering the GBR (McCloskey et al., 2017). Recent research suggests that these sediments, particularly from grazing lands, also act as a source of bioavailable nitrogen (Garzon-Garcia et al., 2018a, b).
Gullying occurs when unconsolidated soils and sediments become exposed and eroded by fast-flowing storm runoff (Brooks et al., 2018; Casalí et al., 2009). Gully erosion is a natural process; however, land use changes have increased the rate of gully erosion and the subsequent sediment export (Prosser and Slade, 1994; Shellberg et al., 2016). The tropical climate of the GBR catchment region creates intense rainfall events (often >40 mm h−1) that can rapidly erode tonnes of soil from an actively eroding gully during a single storm (Brooks et al., 2015; BOM, 2020). Of the various types of gullies present in the GBR catchment region (i.e. hillslope, colluvial, ephemeral, and soft-rock badlands), alluvial gullies likely represent the largest source of sediment to the GBR (Brooks et al., 2013, 2020a). Alluvial gullies consist of mostly fine (<63 µm) dispersive and/or slaking sediments and are located on the floodplains or terraces of river systems, thus increasing the chance of sediment transport to major rivers and marine-receiving environments (Brooks et al., 2013, 2016a). These characteristics, coupled with the high connectivity of the gullies to river channel networks, mean that a large proportion of the eroded fine sediment and associated nutrients from alluvial gullies will be exported to coastal waters (Brooks et al., 2009, 2018; Shellberg et al., 2013).
A recent review by Bartely et al. (2020) identified several scientific studies that evaluated the effectiveness of gully remediation on improving water quality in various regions around the world, including the French Alps (Mathys et al., 2003), southern regions of the United States of America (Polyakov et al., 2014; Nichols et al., 2016), Spain (Hevia et al., 2014), China (Rustomji et al., 2008; Wang et al., 2011), and Ethiopia (Ayele et al., 2018; Dagnew et al., 2015). Bartely and co-workers (2020) concluded that remediation efforts generally decrease the sediment yield of eroding gullies and, thus, improve water quality conditions. However, water quality improvements were driven by the extent of remediation (catchment and gully) and the re-establishment of vegetation in the gully post-remediation (Bartely et al., 2020). Until recently, studies of gully remediation effectiveness in GBR catchments have focussed on smaller-scale gullies (i.e. hillslope gullies), with the application of low-intensity erosion controls such as cattle exclusion fencing, revegetation, and the manual installation of tree branch and/or geotextile fabric check dams (Bartley et al., 2017; Wilkinson et al., 2013, 2015b, 2018). These strategies are effective at reducing erosion in smaller gullies; however, they are not well suited for stabilising the much larger alluvial gullies that are present in many GBR catchments.
Recent research suggests alluvial gullies in GBR catchments require the intervention of intensive landscape-scale remedial efforts to stem further erosion and reduce sediment export (Brooks et al., 2016b; Brooks et al., 2018; Carey et al., 2015; Howely et al., 2018). There are several alluvial gully erosion mitigation projects currently underway in major GBR catchments (e.g. the Normanby and Burdekin catchments), which are trialling various remedial works, including large-scale earthworks (i.e. reshaping of active gully head scarps and sidewalls), rock chutes (including the application of geotextile matting), rock capping and mulching of potentially erodible soils, and the installation of bed control and water velocity reducing measures (e.g. check dams). Stock exclusion and revegetation are also important mitigation measures implemented in these gully remediation projects, often in concert with other treatments. The overall aim of these remedial trials is to ascertain the control measures that are capable of permanently reducing alluvial gully erosion and associated sediment and particulate nutrient export (Brooks et al., 2016b, 2018, 2020b; GA, 2019).
We hypothesise that the application of landscape-scale gully erosion control measures (i.e. gully reshaping, soil compaction, rock armouring of channels and banks, and the installation of check dams) will cause a reduction in the suspended sediment and nutrient concentrations at the study site. Here we aim to assess the effectiveness of landscape-scale remediation in improving the water quality of an alluvial gully situated in the tropics of Queensland, Australia, which flows to the Great Barrier Reef. We apply a recently developed gully water quality monitoring approach that facilitates accurate measurements while meeting the financial and operational requirements of monitoring in remote locations. This work, although done on a limited spatial and temporal scale, provides a critical foundation for developing and evaluating landscape-scale remediation of alluvial gullies in the Great Barrier Reef region.
2.1 Study site
The study site is located on a cattle station in the Cape York Peninsula region of Queensland, Australia. There are several gullies that have formed in the alluvial floodplain and terrace of the Laura River (Fig. 1). The tropical climate of the region is characterised by wet (October to April) and dry (May to September) seasons. Approximately 95 % of the annual rainfall (regional mean annual rainfall is 936 mm) occurs during the wet season (Brooks et al., 2014a; BOM, 2020). The study site topography is relatively flat (average slope of the gullies and respective catchments at the site ranges from 8.6 to 9.7 m m−1), with undulating gradients surrounded by sandstone ranges. The alluvial sediments comprising the floodplain/terrace are derived from the Laura River catchment, which is dominated by the Ordovician Hodgkinson Formation meta-sediments, late Jurassic/early Cretaceous Gilbert River sandstones, and Quaternary/Neogene Mclean Basalts (Brooks et al., 2013, 2014b; Fig. 1).

Figure 1Topographic map of the study site, including surface geology and gully locations. Source: Geoscience Australia (2019). PASS – pumped active suspended sediment (PASS) sampler; overland PASS – a PASS sampler used to sample water flowing overland (i.e. runoff); rising stage – single-stage sampler (i.e. rising stage sampler). Note: the overland PASS sampler in sub-catchment 3 of the remediated gully was deployed several metres away from the flow line inferred by surface geology due to the redirection of flow associated with vegetation and termite mounds.
A total of two gullies were used to evaluate the effectiveness of the remediation works. The remediated gully is the larger of the two, which encompasses several gully lobes that drain into a central channel. The gully treatment area is ∼0.6 ha, with a catchment area of 13.7 ha. The catchment of the remediated gully is a conglomerate of three sub-catchments (sub-catchments 1–3; Fig. 1). The active secondary incision of the control gully is ∼0.2 ha, while the gully catchment, which drains directly into the head scarp, has an area of 3.3 ha. Both gullies are situated in highly dispersible and slaking sodic alluvium. Prior to remediation, both gully catchments would have undergone similar erosion processes (i.e. scalding, sheet erosion, riling in the gully catchment and tunnel erosion, head scarp mass failure, and gully sidewall erosion within the incised part of the gully). Erosion rates derived from repeated airborne lidar collected before remediation was conducted (2009 to 2015) indicate that the control gully produced slightly more sediment (61 t ha−1 yr−1) compared to the remediated gully (50 t ha−1 yr−1), based on the gully catchment area (Brooks et al., 2016b). Comparison of the particle size distribution (PSD; Sect. 3.2.3) from readily erodible soil collected from the two gullies, prior to the remediation activities, showed that there was no significant difference between the two gullies. It is likely that these soils would have eroded into suspended sediment in a similar manner; thus, it is assumed that the suspended sediment concentration (SSC) and PSD from the two gullies would have been similar, pending any significant differences in water velocity.
The remediation of the larger gully complex was designed to halt the highly active erosion within the rapidly incising part of the gully and slow the scalding and sheet erosion processes within the broader gully catchment through destocking and the construction of contour berms (Brooks et al., 2018).
2.2 Gully remediation
The large actively eroding alluvial gully complex was remediated using various intensive, landscape-scale gully erosion control earthworks during the 2016 dry season. The entire gully complex was regraded and compacted using heavy machinery. Gypsum was added during this process to reduce soil dispersibility (Liu and She, 2017), and geofabric covering was applied over the former gully head scarp and held in place by a coarse sandstone surface capping. The rest of the gully complex was capped with locally sourced shale rock. Check dams were installed at regular intervals (approximately every 40 m) in the three major channels that replaced the original gully lobes (Sect. S1 in the Supplement). After this, the entire gully complex was seeded with native vegetation and livestock were excluded from the gully and its surrounding catchment. No remedial efforts were applied to the control gully, other than the exclusion of livestock (Sect. S1; Brooks et al., 2018). Time-lapse footage of the remedial works is available online at https://www.youtube.com/watch?v=dCbV1BggnKI (last access: 22 February 2021; CYNRM, 2017).
2.3 Monitoring design
While gullies commonly share similar patterns of formation and erosion, there are many variables that need to be considered before implementing a monitoring plan to evaluate water quality within a gully system. Ideally, it is best to identify the factors that will have the greatest influence on gully water quality and monitor them prior to any remediation in order to establish a baseline of water quality conditions (i.e. a standard before–after–control–impact (BACI) design). Any water quality monitoring assessment of a gully, particularly those being used to evaluate the effectiveness of remediation efforts, should provide a representative measure of the following parameters:
-
Rainfall – the primary driver of continued gully erosion (Castillo and Gómez, 2016).
-
Soil – characterising basic soil physico-chemical parameters will aid in understanding the transformation of soil into suspended sediment and how that may affect water quality (Brooks et al., 2016b, 2018).
-
Water quality – it is recommended that at least two different means of water sample collection/measurement are used to ensure a representative measure of SSC and PSD. Entire flow events should also be monitored, if possible (e.g. a time-integrated sample of an event is most representative). If possible, samples should be collected from water flowing into the point of erosion (i.e. above the head scarp) and within the gully after the point of erosion (i.e. downstream of the head scarp; Doriean et al., 2020).
In this instance, the remediation project was required to implement the treatments and monitor the responses within a 3-year timeframe; thus, a full BACI design was not possible. Instead, a control/impact design was used in which remediation effectiveness was evaluated against a nearby, comparable un-remediated control gully (Sect. S2). A total of three repeat airborne LIDAR surveys were collected over a 6-year period, which enabled the calculation of normalised baseline erosion rates for the two sites, demonstrating the comparability of the treatment and control gullies (Brooks et al., 2016b).
2.4 Monitoring methods
2.4.1 Hydrological and meteorological monitoring
A total of two rainfall gauges (Hydrological Services tipping bucket rain gauges – 0.2 mm per tip – with HOBO data loggers) were placed in the catchments of the remediated and control gullies (Fig. 1). The rain gauges were programmed to provide a near-continuous account of rainfall for the sampling period (2017–2018 and 2018–2019 wet seasons). Water level loggers (in situ Rugged TROLL 100® data loggers) were programmed to measure every 2 min and were secured on the surface of a straight section of channel just downstream of each gully head (Fig. 1). A barometric logger (in situ BaroTROLL® data logger) was placed underneath the remediated gully rainfall gauge and set to record atmospheric pressure every 15 min.
2.4.2 Sample collection and monitoring
The original monitoring plan to evaluate the water quality conditions, focusing on suspended sediment, was limited by funding and available measurement techniques, which resulted in only the outlets of both gullies being monitored for the first wet season (2017–2018). The successful modification of a recently established suspended sediment monitoring method, the pumped active suspended sediment (PASS) sampler, for operation in gullies (Doriean et al., 2020) allowed the monitoring network to expand spatially and, thus, enabled the monitoring of the time-weighted average (TWA) SSC and PSD of sediment entering each gully from their respective catchments during the 2018–2019 wet season.
A total of four different suspended sediment monitoring methods were used to collect water samples in the gullies, namely PASS samplers (Doriean et al., 2019) modified for gully deployments (Doriean et al., 2020), rising stage (RS) samplers (Edwards et al., 1999), autosamplers (Edwards et al., 1999), and turbidity loggers (Rasmussen et al., 2009; Doriean et al., 2020). Several monitoring methods were used in this study to provide multiple lines of evidence to determine the effectiveness of the remediation activities in reducing suspended sediment and nutrient export and provide insight into the performance of the different monitoring methods. Each of the monitoring methods used in the control and remediated gullies were recently described and comprehensively evaluated by Doriean et al. (2020). The turbidity measurements recorded from the two gullies did not provide useful information for comparison of the gullies, and there were few instances where turbidity measurements correlated with physically collected samples. Therefore, turbidity measurement data collected from the gullies are not reported further here (see Doriean et al., 2020). The TWA SSC and PSD of overland flows (i.e. catchment runoff) into the gullies was measured from samples collected using PASS samplers configured to operate in ephemeral waterways (Doriean et al., 2020). The natural slope of the land flowing into the gullies had several depressions or low points that collected water as it flowed over the land; PASS samplers were installed at these locations with the intake and float switch located 0.09 m above the ground (Sect. S2).
2.4.3 Soil sampling and analysis
Soil samples were collected as part of the design phase of the gully remediation project (Brooks et al., 2016b, 2018). Soil samples (1–2 kg) were collected from the face and walls of the gullies (i.e. the areas undergoing erosion) using a hand trowel and auger at depths ranging from the surface to 1 m. A total of 21 and 9 samples were collected from the remediated and control gullies, respectively, prior to the remediation activities. The soil samples were analysed for particle size distribution, using the soil hydrometer method (American Society for Testing and Materials (ASTM) standard method 152H; Brooks et al., 2016b). Soil particle size distribution data were composited and treated as an average for the purpose of comparing gully soil to suspended sediment. This was done as soil up to 1 m deep can be eroded into suspended sediment during a flow event (e.g. gully wall collapse can impact large sections of the head scarp and expose deeper erodible soils; Garzon-Garcia et al., 2016a).
2.5 Sample analysis and statistics
Water samples collected from the remediated and control gullies were analysed for suspended sediment concentration using gravimetry (ASTM standard method D 3977-97) and particle size distribution, using laser diffraction spectroscopy (Mastersizer 3000; Malvern Panalytical). Samples were screened using a 2 mm sieve prior to analysis to remove any large debris or detritus. TWA SSC of PASS samples was determined using Eq. (1) as follows:
where the total mass of suspended sediment collected by the sampler (M; mg) is divided by the volume of water sampled during deployment subtracted from the duration of sampler operation (t; min) and multiplied by the pump flow rate (F; L min−1).
Sediment used for particle size analysis was not chemically treated and was kept in suspension using mechanical dispersion methods (i.e. a baffled container with an impeller stirrer; Doriean et al., 2020). Nutrient analyses were conducted on a select group of samples. The samples were analysed for total and dissolved organic carbon (5310 TOC and DOC 2017), and total and dissolved nitrogen and phosphorus (4500-Norg D and 4500-P B). Dissolved nutrient species (ammonium, oxidised nitrogen, and phosphate) were analysed using the following segmented flow analysis methods: 4500-NH3, 4500-NO3, and 4500-P (APHA 2005; Garzon-Garcia et al., 2015, 2018c). Due to the remoteness of the field sites and the sporadic nature of flow events, it was only possible to retrieve nutrient samples from the autosampler within 48 h of the initial collection on 24 January 2018 and 6 February 2019. Nutrient samples were not retrieved from the other instruments (Manual, RS, or PASS samplers) because the samplers contained samples from previous flow events, or the samples could not be collected and processed within the 48 h time frame. Consequently, the percentage of sand was likely underestimated in the samples, collected by the autosampler, which were analysed for nutrients (Doriean et al., 2020).
GraphPad Prism® was used for statistical analysis of the sample data following an evaluation of the equality of group variances, using the Brown–Forsythe and Bartlett tests before an analysis using paired t tests, to assess the differences between the sample groups (p=0.05). The data were found to be normally distributed. Pearson's correlation analysis was also used to assess the relationship between SSC and nutrient concentrations.
2.6 Data quality and uncertainty
Throughout this study, we attempt to acknowledge the uncertainty associated with the various monitoring techniques. A previous evaluation of the sample collection methods was used during this study to determine the approximate uncertainty associated with each method (Table 1; Doriean et al., 2020). These uncertainties were accounted for when interpreting data from the various methods.
Table 1Uncertainties, of either SSC or PSD measurements, associated with suspended sediment monitoring methods used in alluvial gullies. Source: Doriean et al. (2020).
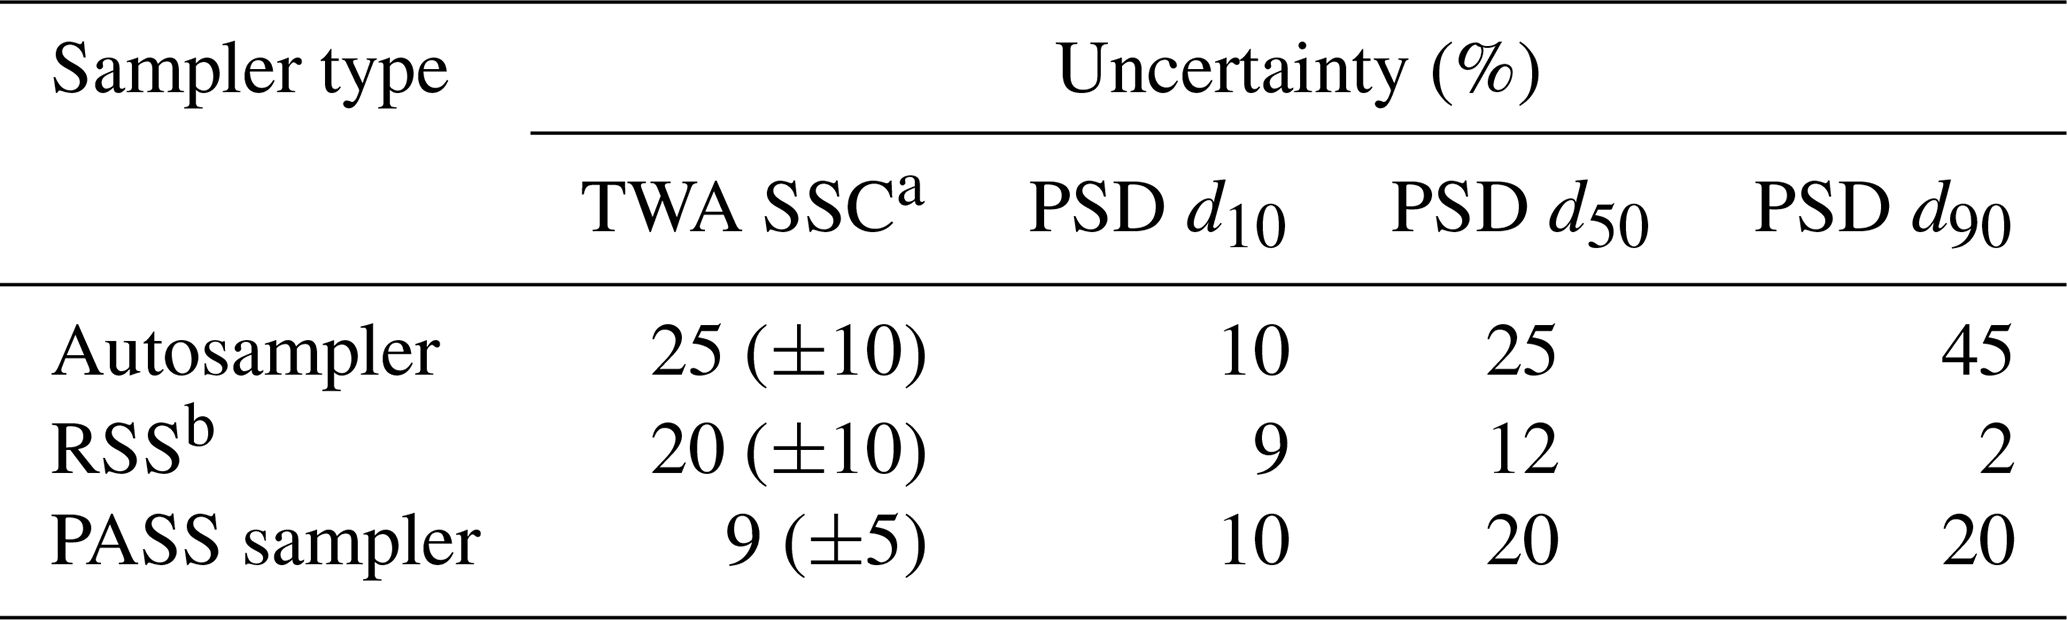
a TWA SSC – time-weighted average SSC; b RSS – rising stage sampler.
Repeat airborne and terrestrial lidar imaging suggest the erosion controls deployed in the remediated gully had no significant failures, and that sediments are being retained behind the check dams (Fig. 2). Samples were collected from approximately half (five to six) of all flow events (>0.2 m peak water level) recorded for the 2017–2018 wet season. Fewer events (3–4) were sampled during the 2018–2019 wet season due to two major backwater flooding events at the study site caused by high water levels in the Laura River (see Sect. S3 for hydrographs of all sampled events). These flood events damaged equipment and contaminated samples with flood water. However, the flood events did not appear to affect the erosion mitigation structures of the remediated gully (Sect. S4). Despite the challenges of monitoring these remote systems, and the unpredictable nature of flow events, sufficient samples were collected from a range of flow event types (i.e. intensity, length, and time of year; Sect. S3) to meet the objectives of the study.

Figure 2Before and after photos (left column) of the remediated gully and repeat lidar images (right column) of the remediated gully for the years 2016 (unremediated), 2017 (post-remediation – 1 year), and 2019 (post-remediation – 4 years). Note the aggradation of sediment in the gully. Green dots show the locations of the photographs. The information in this figure has been modified from Brooks et al. (2020b).
3.1 Rainfall and major hydrological events
Rainfall totals at the study site for the 2017–2018 (920 mm) and 2018–2019 (915 mm) wet seasons were not significantly different from the yearly average (943±283 mm) of the permanent rain gauge operated by the Queensland Department of Natural Resources, Mines, and Energy (DNRME) located at Coal Seam Creek, ∼13 km from the study site. The on-site and DNRME rain gauges were in broad agreement (R2=0.50; Sect. S5), although the variability in the relationship confirms that on-site rainfall gauges should always be deployed to achieve accurate rainfall intensity data. While there were many intense storms that resulted in flow events in the studied gullies, there were two major flood backwatering events that occurred in the 2018–2019 wet season as a result of high-intensity rainfalls in the region surrounding the study site (Sect. S3). A review of historical DNRME stream gauge water level data of the Laura River at Coal Seam Creek showed that these backwatering events typically occurred with a ∼3-year frequency over the 20-year data set (DNRME, 2019).
3.2 Impact of remediation on suspended sediment characteristics
Soil characteristics and erosion estimates for the control and remediated gullies (prior to remediation) based on catchment size, area of readily erodible gully soil, and repeat lidar aerial measurements suggest that the control and remediated gullies likely had similar suspended sediment dynamics (Brooks et al., 2013, 2016b). The following sections describe how PSD, SSC, and most nutrient concentrations of samples collected from the remediated gully were significantly different and lower than the control gully for both wet seasons (2017–2018 and 2018–2019). A time series of all monitored flow events is included as supporting information (Sect. S3).
3.2.1 Suspended sediment concentration
The remote location and challenging monitoring conditions which are typical of alluvial gullies meant that multiple suspended sediment sampling methods were used to ensure that the most representative data were collected throughout both wet seasons (Doriean et al., 2020). Overall, the SSC range of samples collected by each method from the outlet of the remediated gully were significantly lower compared to those collected from the outlet of the actively eroding control gully (Table 2).
Table 2Descriptive statistics of SSC samples collected from the control and remediated gullies during the 2017–2018 and 2018–2019 wet seasons.

AS – autosampler; FPS – flow proportional sampling; RSS – rising stage sampler; PASSS – PASS sampler. *S – PASS samples represent the time-weighted average suspended sediment concentration for the time that the sampler was deployed.
PASS sampler data were used to compare time-weighted average (TWA) SSC and other suspended sediment characteristics (i.e. PSD and SSC by sediment particle size class) of the remediated and control gullies because the method collected samples with the most representative PSD and TWA SSCs (Doriean et al., 2020) and monitored the most flow events during both wet seasons (Sect. S3). The low temporal resolution of PASS sample data, theoretically, allows for the potential underestimation of SSC when very high SSCs are present at high flow rates for only short periods over the duration of a flow event (Doriean et al., 2019). However, comparable SSC data collected by manual flow proportional sampling, autosamplers, and RS sampler methods, which have high temporal resolution, corresponded well with the SSC range of the PASS samples from both gullies (Table 2), indicating that the PASS samples were representative of the measured events.
The median TWA SSC of PASS samples collected from the control gully (7123±2670 mg L−1) was about five-fold higher than the median TWA SSC of samples collected from the remediated gully (1429±411 mg L−1) (Table 3; Sect. 3.2.3). This, and the statistical analysis, suggests there was significantly (p<0.001) more sediment export due to erosion within the control gully than in the remediated gully. The TWA SSC of the catchment water flowing into the remediated (461–3556 mg L−1) and control gullies (485–2709 mg L−1) validate the assumption of similar contributions of suspended sediment from the two gully catchments during the monitoring period (see Table 4; Sect. 3.2.3). Comparison of remediated and control gully TWA SSC by sediment particle size class indicates that the remedial works reduced the concentration of suspended sand (by 96 %), silt (by 76 %), and clay (by 73 %; Fig. 3). Bulk densities of the different sediment size fractions were very similar (∼0.1 g L−1 difference), and thus, an average density was used to determine the different SSCs by size class (Sect. S6). The reduction in SSC across different sediment particle size classes indicates that the remedial works are effectively reducing erosion and sediment export from the remediated gully. However, because this study only includes two wet seasons of data, it should be considered preliminary until it is further validated by continued monitoring of the remediated gully for several additional wet seasons.

Figure 3Median SSC by sediment size class for PASS samples collected from the control (brown) and remediated (blue) gullies during the 2017–2018 and 2018–2019 wet seasons. Error bars represent the sample standard deviation. Autosampler and RS sampler SSC by PSD are included in Sect. S7.
Table 3Time-weighted average suspended sediment concentration and particle size distribution data of samples collected, using PASS samplers, from the remediated and control gullies during the 2017–2018 and 2018–2019 wet seasons. Note that the catchment samples (n=2 per sampling location) were only collected during the 2018–2019 wet season.
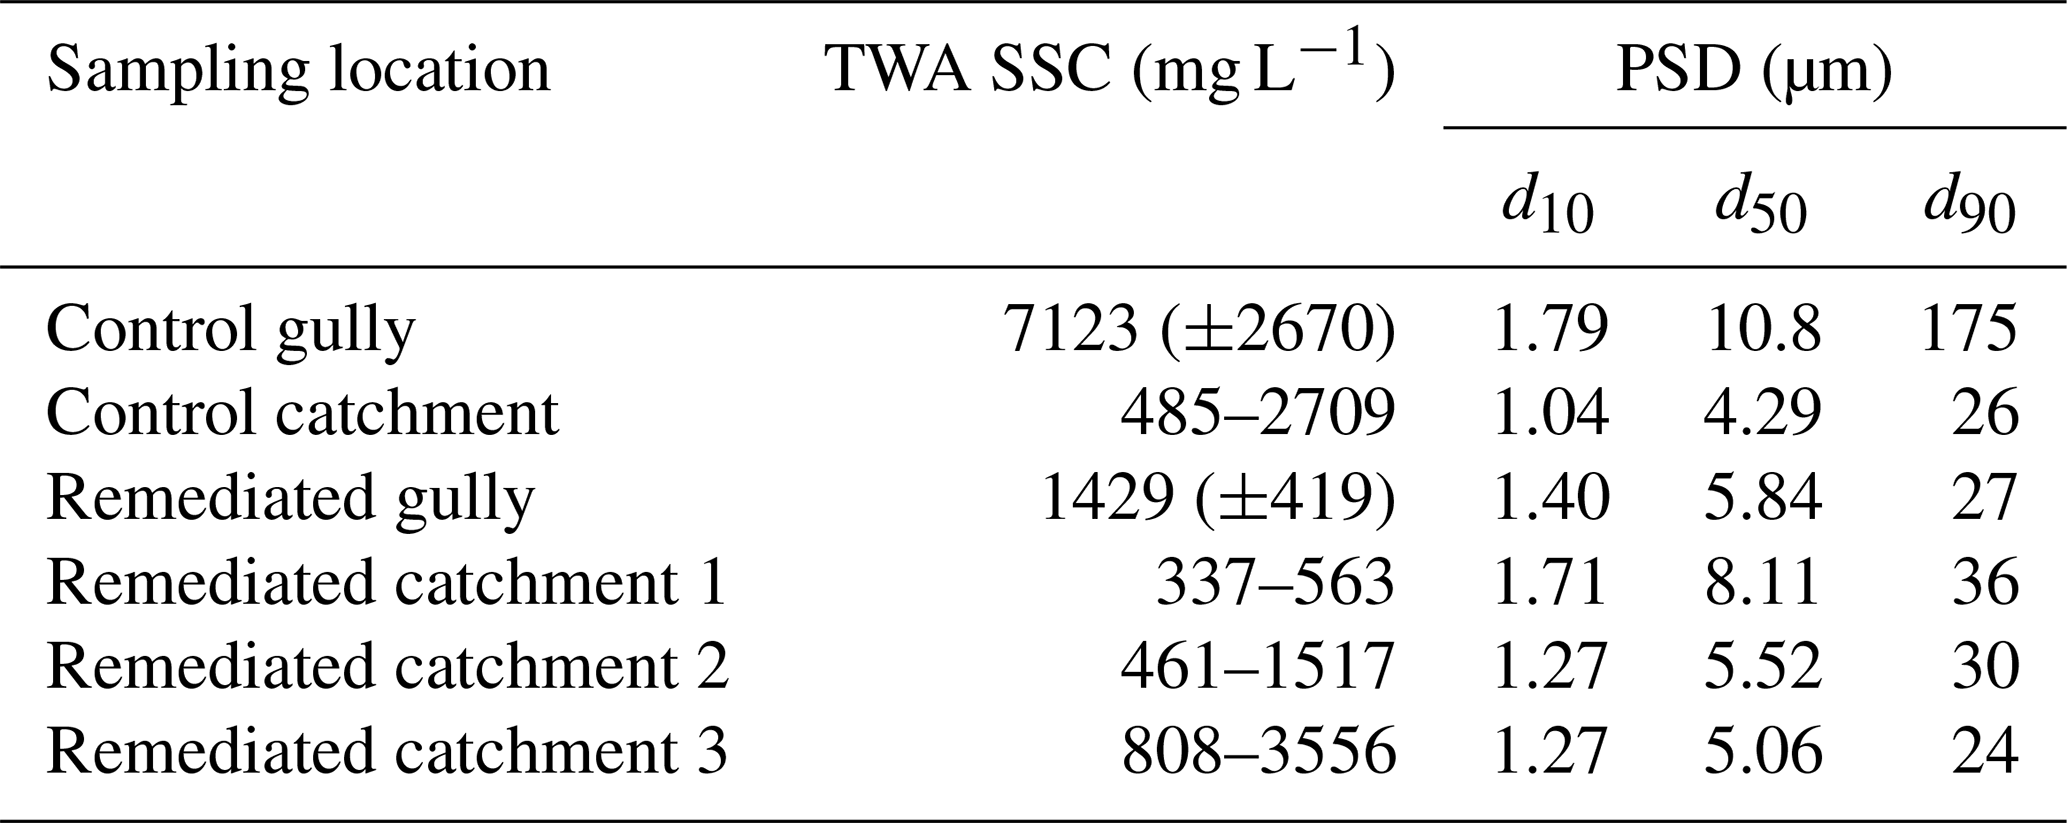
Please note that each catchment PASS sample TWA SSC represents the average SSC of several flow events.

Figure 4Relationship between SSC and stream height for single flow events in the control (a – flow event B) and remediated (b – flow event F) gullies that occurred during the 2018–2019 wet season (Sect. S3). Water level (black line), PASS TWA SSC (green line), and flow proportional (FP) sampling (red circles with black line) are shown.
3.2.2 Relationship between SSC and flow
There is currently insufficient water discharge data to accurately estimate the sediment loads of the two gullies monitored in this study. The unstable nature of gully banks and bed features means the channel cross-section can change dramatically during a single event, thus obtaining an accurate measurement of the gully channel cross section over a wet-season is rarely feasible. As a result, the use of a discharge related rating curve based on a single measure of channel cross-section will have high uncertainty (Malmon et al., 2007). Furthermore, manual measurements of water velocity are dangerous due to the risk of rapid water level rise (e.g. the control and remediated gullies often encounter water level changes of 0.5 m in under 5 min) and the potential for bank collapse in the control gully. Automated methods for determining velocity or discharge (e.g. acoustic doppler velocimeters/acoustic doppler current profilers) offer an alternative to manual measurements, however, these methods are expensive and are limited to waters where SSC is typically less than 15 000 mg L−1, without additional site-specific calibration (Sottolichio et al., 2011). For these reasons it takes considerable time and effort to collect sufficient data to accurately determine gully discharge and, therefore, sediment load. Once an adequate amount of gully water discharge data are collected, sediment load estimates for the remediated and control gullies will be calculated and published.
In the absence of water velocity data, comparison of water levels (and thus shear stress), likely to show similar trends to velocity and SSC, show that there was no obvious relationship for the control gully. However, SSC trends in the remediated gully, particularly in the 2018/19 wet season, may be linked to water level, likely as a function of velocity (Fig. 4; Sect. S3). Additional flow event data, including water velocity measurements are needed to confirm this.
The SSC of samples collected from the control gully, using RS samplers and autosamplers, suggest there is a general decreasing trend in SSC following the initiation of flow (R2=0.61), regardless of changes in flow event length or stage height (Sect. S3; Fig. 5). This trend is likely the result of instream processes, such as the rapid mobilisation of readily erodible soil from the gully and deposited fine sediment from previous flow events. This contributes to a high initial SSC followed by a steady decrease in SSC to an equilibrium between the scouring of erodible gully soil source material and the transport capacity of the water flowing through the gully (Malmon et al., 2007). These processes have been observed in other ephemeral waterways and may be an inherent feature of these systems (Dunkerley and Brown, 1999; Malmon et al., 2002). In contrast, there was no relationship (R2<0.01) between SSC and time after the initiation of flow in the remediated gully (Fig. 5). The SSC trend in the remediated gully is no longer symptomatic of an actively eroding system, rather, it is a relationship similar to that of streams transporting sediment sourced from the catchment (Doriean et al., 2019; Nistor and Church, 2005). This suggests gully erosion is no longer a dominant sediment source and the gully may now be a conduit for suspended sediment sources from erosion processes occurring in the catchments.
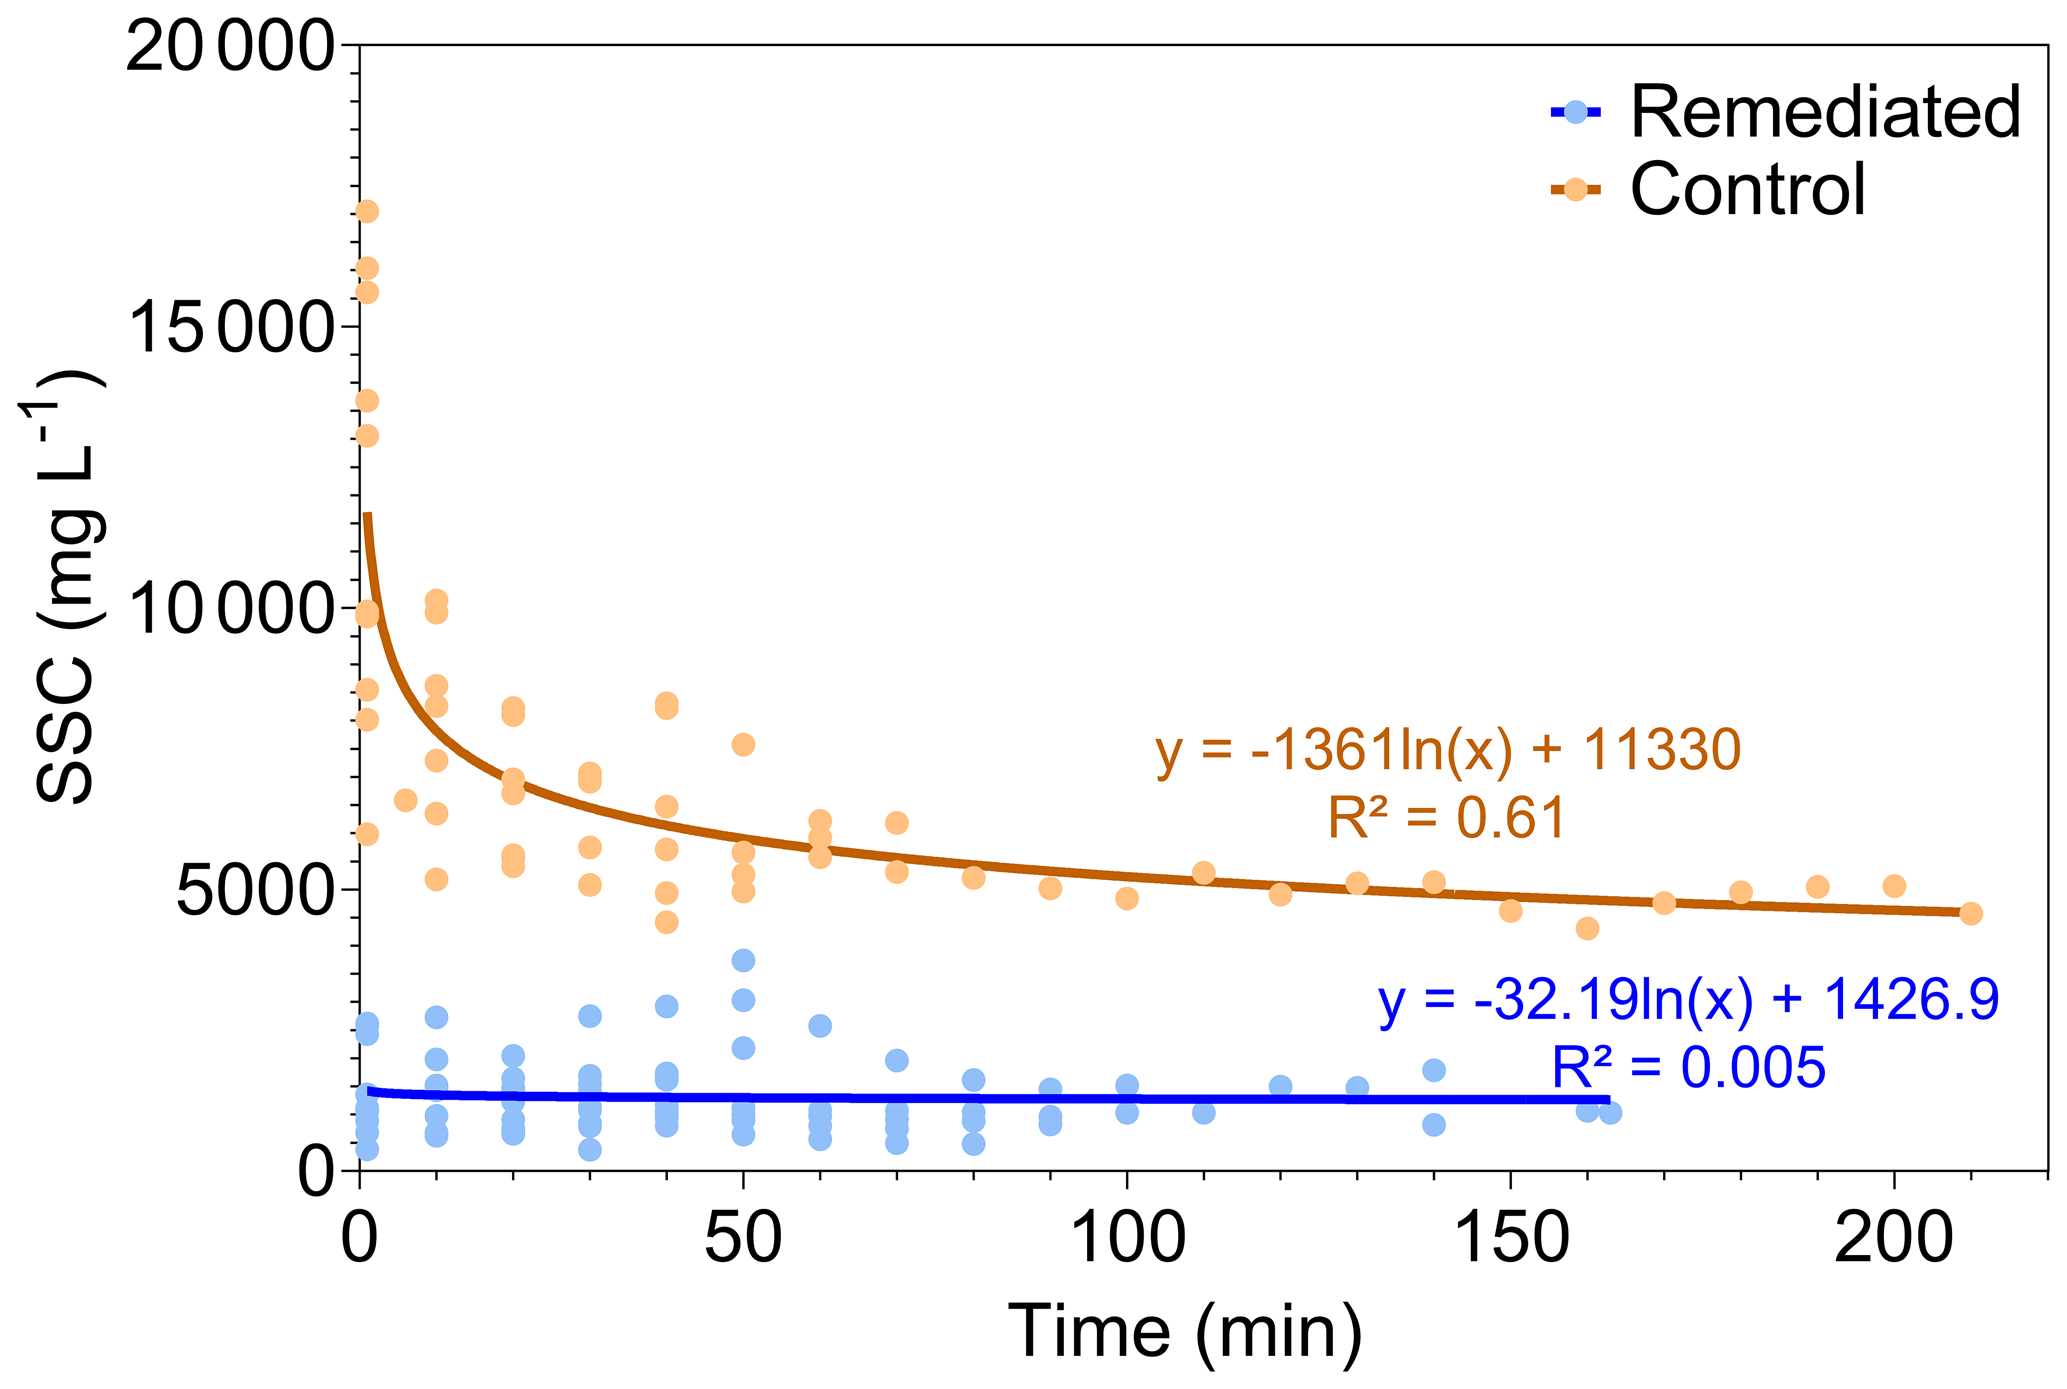
Figure 5Relationship between time after initiation of flow and SSC of samples collected from the control (brown) and remediated (blue) gullies using autosamplers and RS samplers during the 2017–2018 and 2018–2019 wet seasons. Trend lines represent logarithmic regression models.
3.2.3 Particle size distribution (PSD)
The PSD of erodible soil collected from both the control and remediated gullies, prior to remediation, were not significantly different (Sect. S8; Fig. 6). For both gullies, ∼45 % of readily erodible soil from the gully head scarp was comprised of sand, with the remainder being silt (∼35 %) and clay (∼20 %; Fig. 6). The near identical PSD characteristics of the readily erodible soil from both gullies is consistent with their proximity and indicates that the control gully provides an appropriate comparison to evaluate the effectiveness of remedial works at the remediated gully.

Figure 6Average PSDs, by size class, of soil collected from the control (brown; n=4) and remediated (blue; n=14) gullies prior to remedial works. Error bars represent the standard deviation of each class.
Suspended sediment samples from the control gully, collected using a PASS sampler, demonstrate the alteration in PSD of the gully soil when it becomes suspended under flow, mixed with sediment from the catchment and selectively transported downstream (Fig. 7). This change in PSD is expected because the sediment particles will distribute in the water column based on their physical and chemical characteristics, such as shape, size, mass, and affinity to flocculate into composite particles (Vercruysse et al., 2017; Walling and Collins, 2016). Hence, lighter and finer particles (clay and silt) were dominant in the suspended sediment samples. The bulk of the sand in the eroded gully soil is likely transported as bed load, with the proportion in the suspended fraction dependant on periods of high flow-velocity (Horowitz, 2008). The presence of large deposits of sand within the control gully channel bed supports this interpretation (Sect. S9).
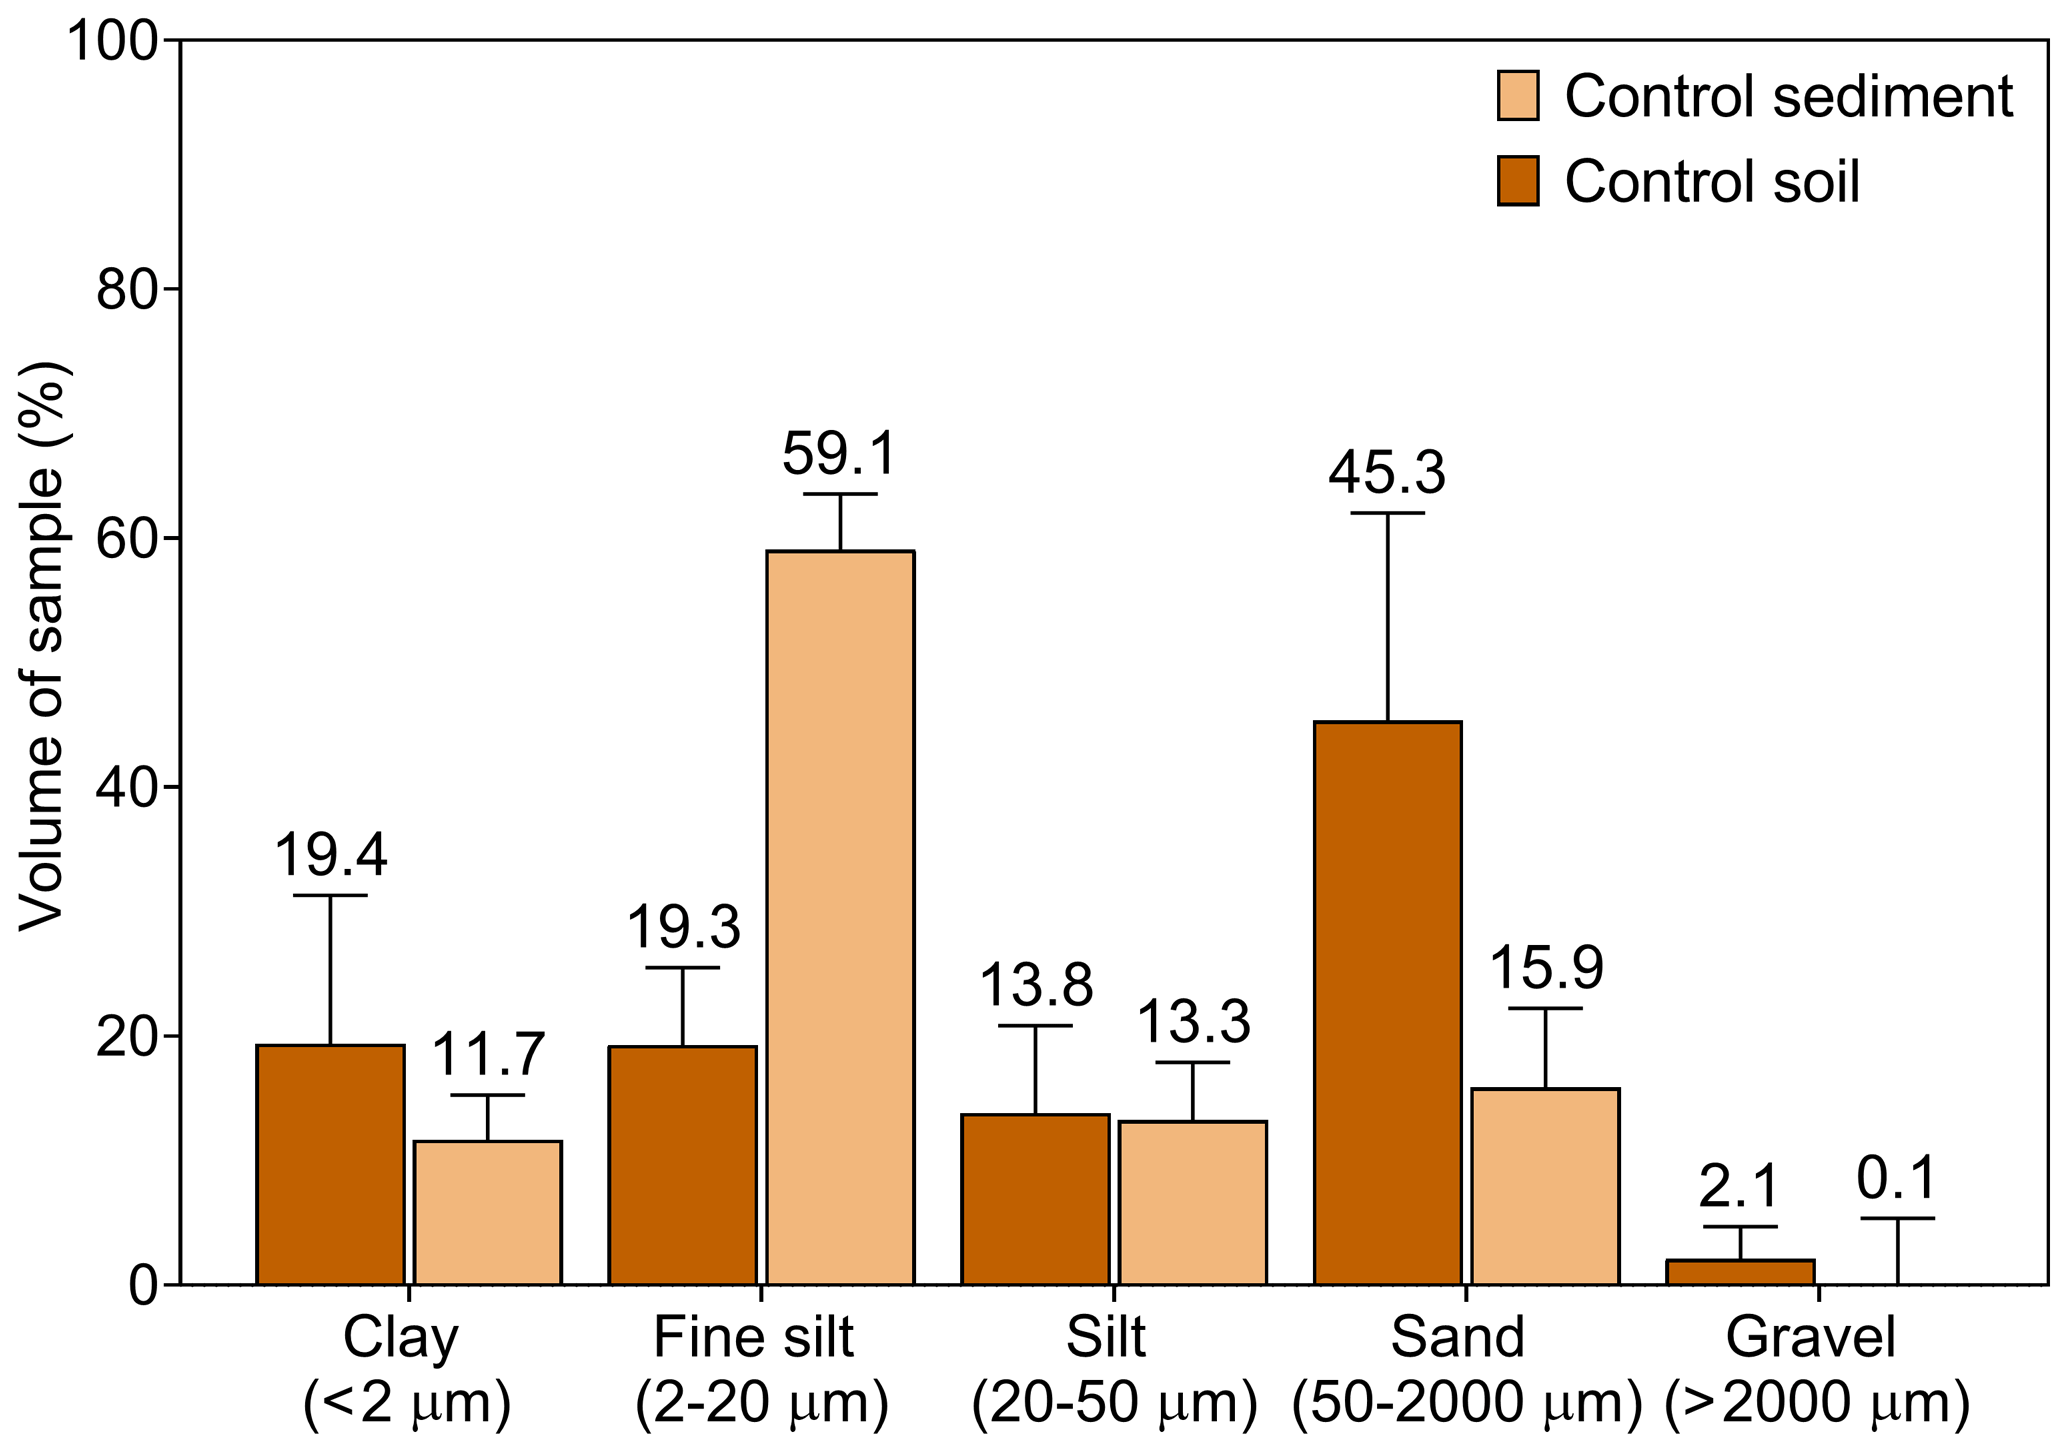
Figure 7Control gully soil (brown; n=4) and control gully suspended sediment (light brown; n=6) PSD by size class. Error bars represent the error as a standard deviation for the soil and sediment PSDs, respectively.
Comparison of the average PSD of suspended sediment samples collected from the remediated and control gullies show that silt and clay were dominant in both, however, sand was almost completely absent (<6 %) in the remediated gully samples (Fig. 8). There was no visual evidence of bedload sediment (i.e. sand) settling in the remediated gully channel, rather, these coarser sediment particles (>63 µm) appeared to be trapped behind flow reduction structures (i.e. check dams; Sect. S9). This is consistent with observations of check dam performance in similar applications (Nyssen et al., 2004; Rustomji et al., 2008; Wei et al., 2017; Bartely et al., 2020). Comparison of suspended sediment PSD characteristics – 10th (d10), 50th (d50), and 90th (d90) percentiles – of PASS samples collected from the control and remediated gullies show that the suspended sediment from the remediated gully (d50 of 5.84 µm) was significantly finer than that of the control gully (d5 of 10.8 µm) (Table 3).
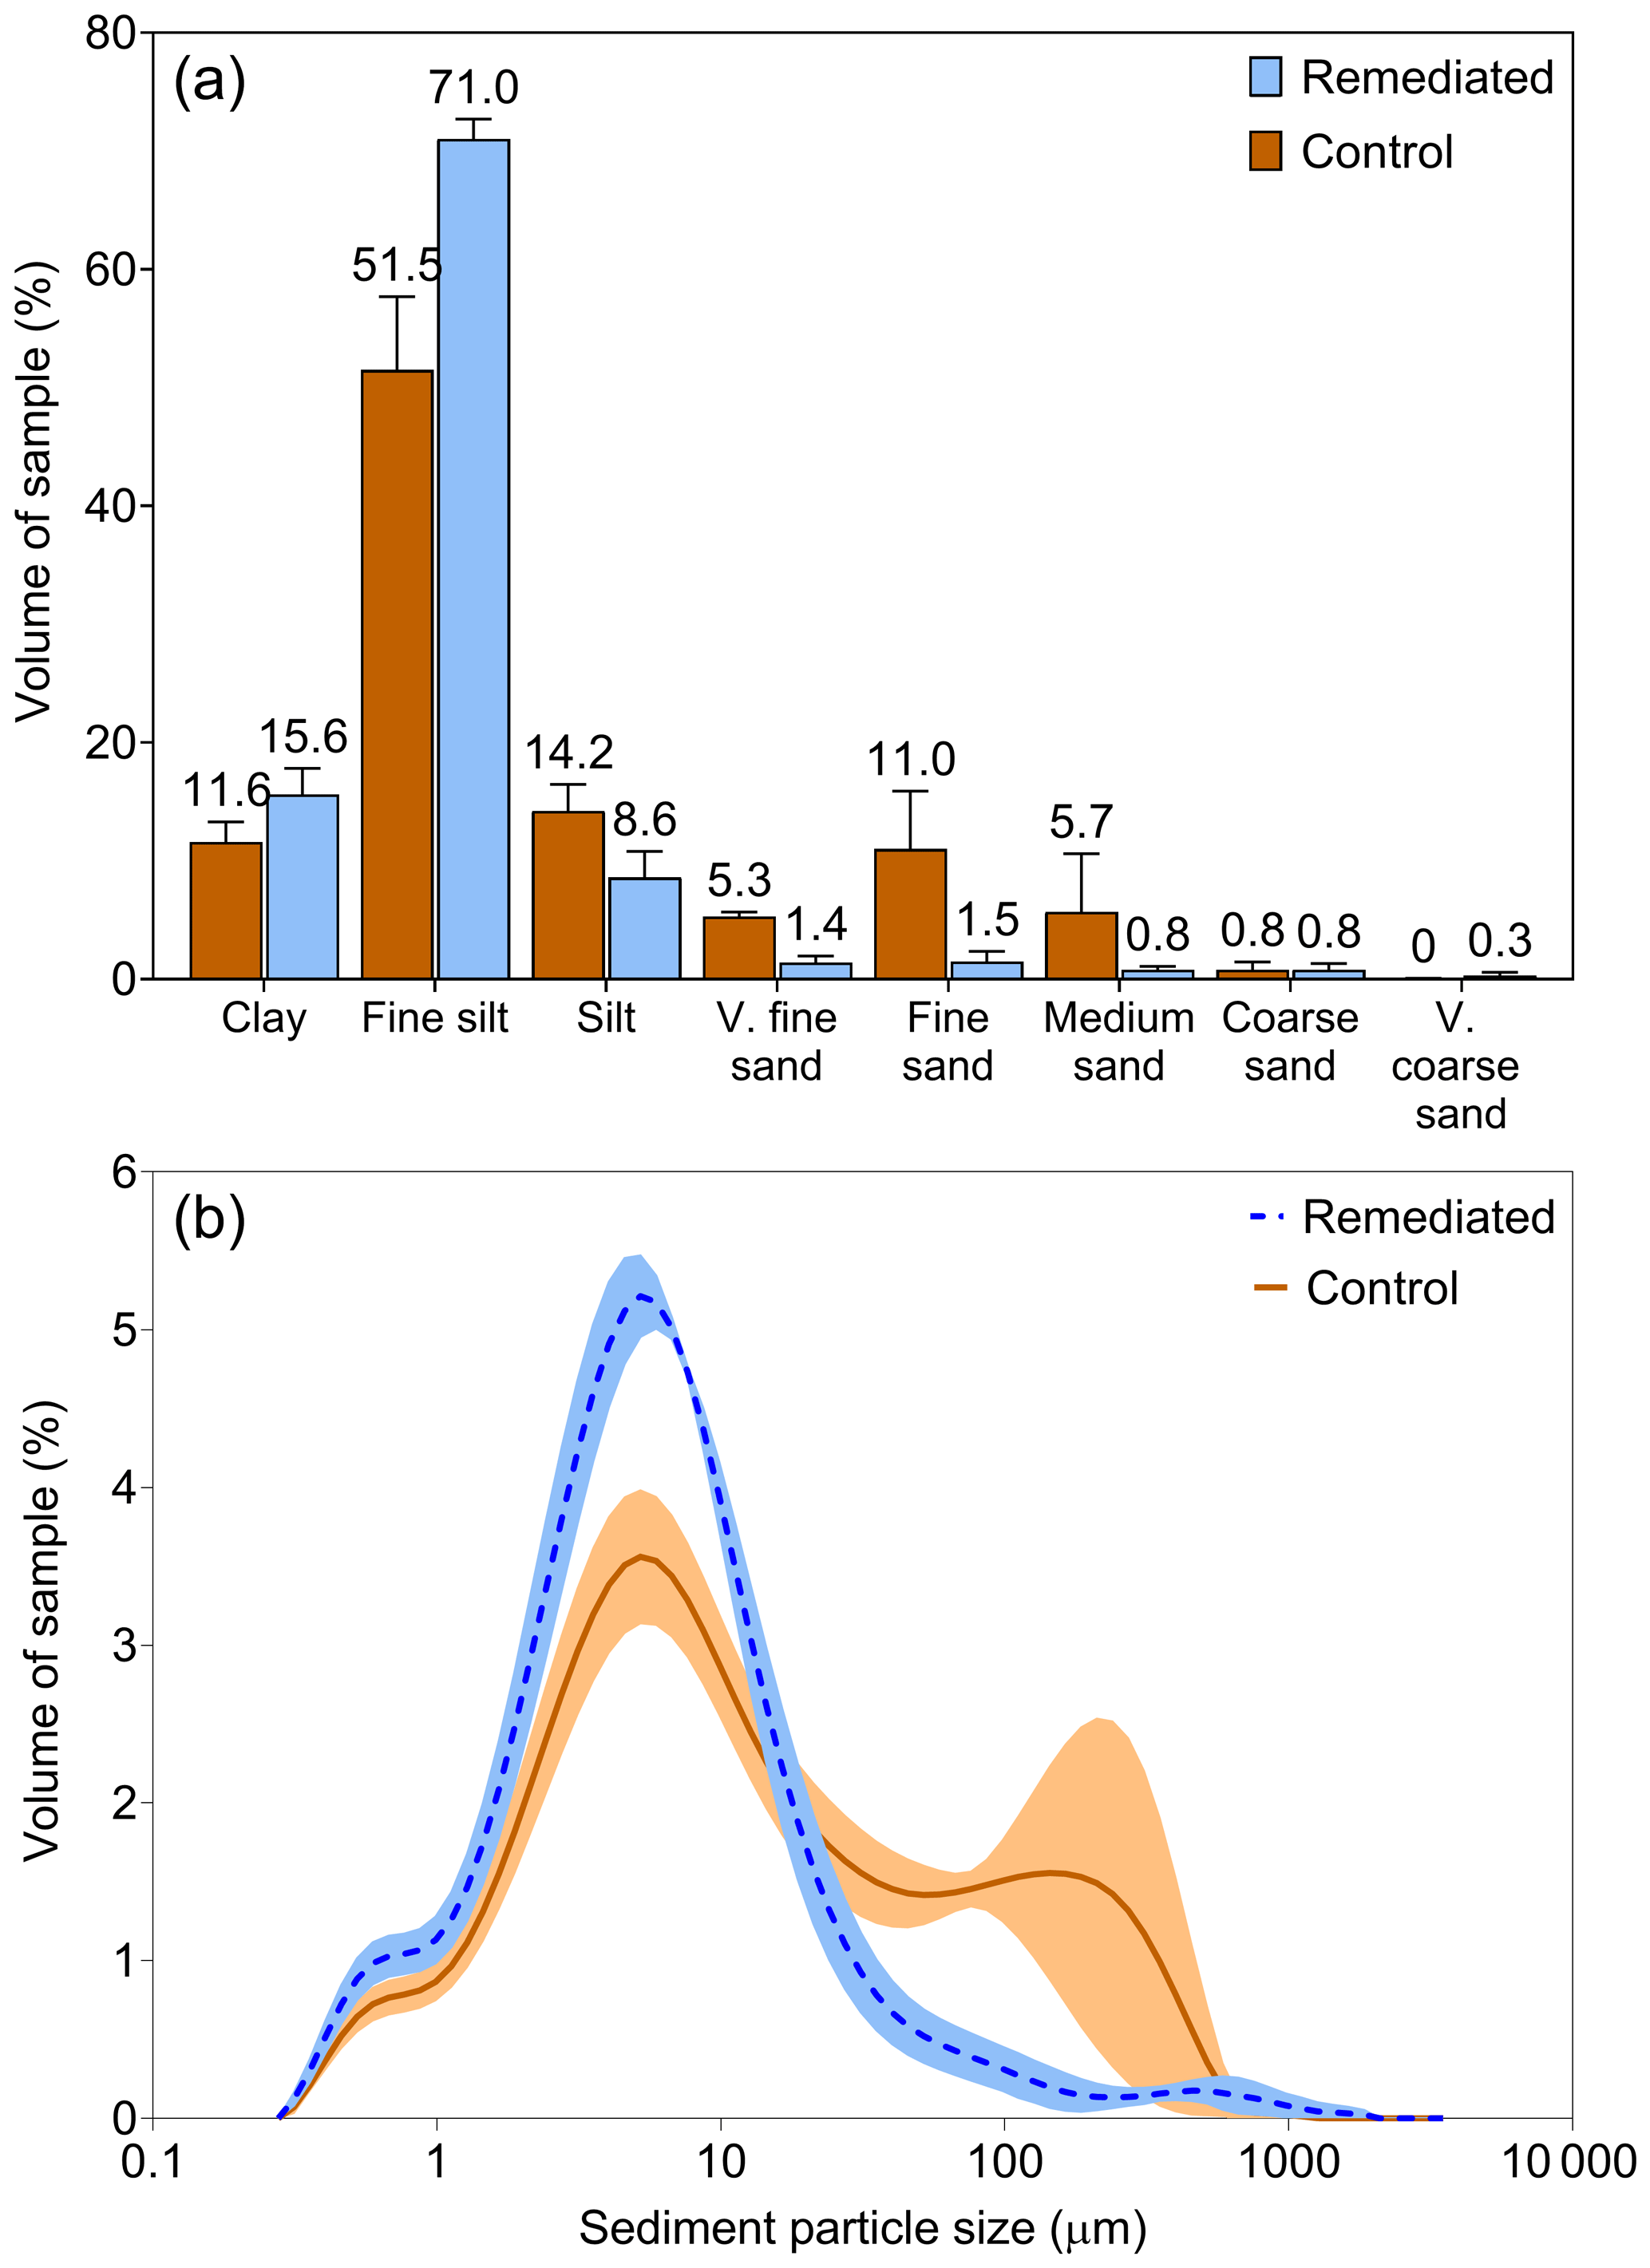
Figure 8Average suspended sediment PSD by sediment size class (a) and plotted by frequency (b) for PASS samples collected from the control (brown) and remediated (blue) gullies during the 2018–2019 and 2018–2019 wet seasons. Error bars (a) and shading (b) indicate the error as a standard deviation. Clay – <2 µm; fine silt – 2–20 µm; silt – 20–63 µm; very fine sand = 63–100 µm; fine sand = 100–250 µm, medium sand – 250–500 µm; coarse sand – 500–1000 µm; very coarse sand – 1000–2000 µm.
The PSD of control gully catchment PASS samples shifted to smaller sizes compared to the gully outlet PASS samples (Table 3), which indicates that the contribution of slightly coarser suspended sediment from gully erosion (d50 of 10.8 µm) is greater than the suspended sediment contribution of the catchment (d50 of 4.29 µm) in the control gully. In contrast, the PSD of suspended sediment samples collected from the outlet of the remediated gully (d50 of 5.84 µm) and samples collected from Catchment 2 (d50 of 5.52 µm) and 3 (d50 of 5.06 µm) of the three catchment areas draining into the gully were very similar, thus suggesting their sediment contributions would be similar, when normalised for differences catchment area size (Table 3; Fig. 9). The lack of similarity in suspended sediment PSD characteristics between the remediated and control gullies outlets, and similarity in the PSD of the remediated gully and its catchments, indicates gully subsoil (i.e. sand and coarse silt) is no longer a significant source of the suspended sediment flowing from the remediated gully. It also indicates that the dominant PSD component of fine suspended sediment (i.e. clay and silt) in the remediated gully is now primarily sourced from the gully catchments. This finding supports the key conclusions of the recent review conducted by Bartely et al. (2020), which found that remediation of both the gully and its catchment(s) will generate a more immediate and effective reduction in sediment yield than remediation of the gully alone.
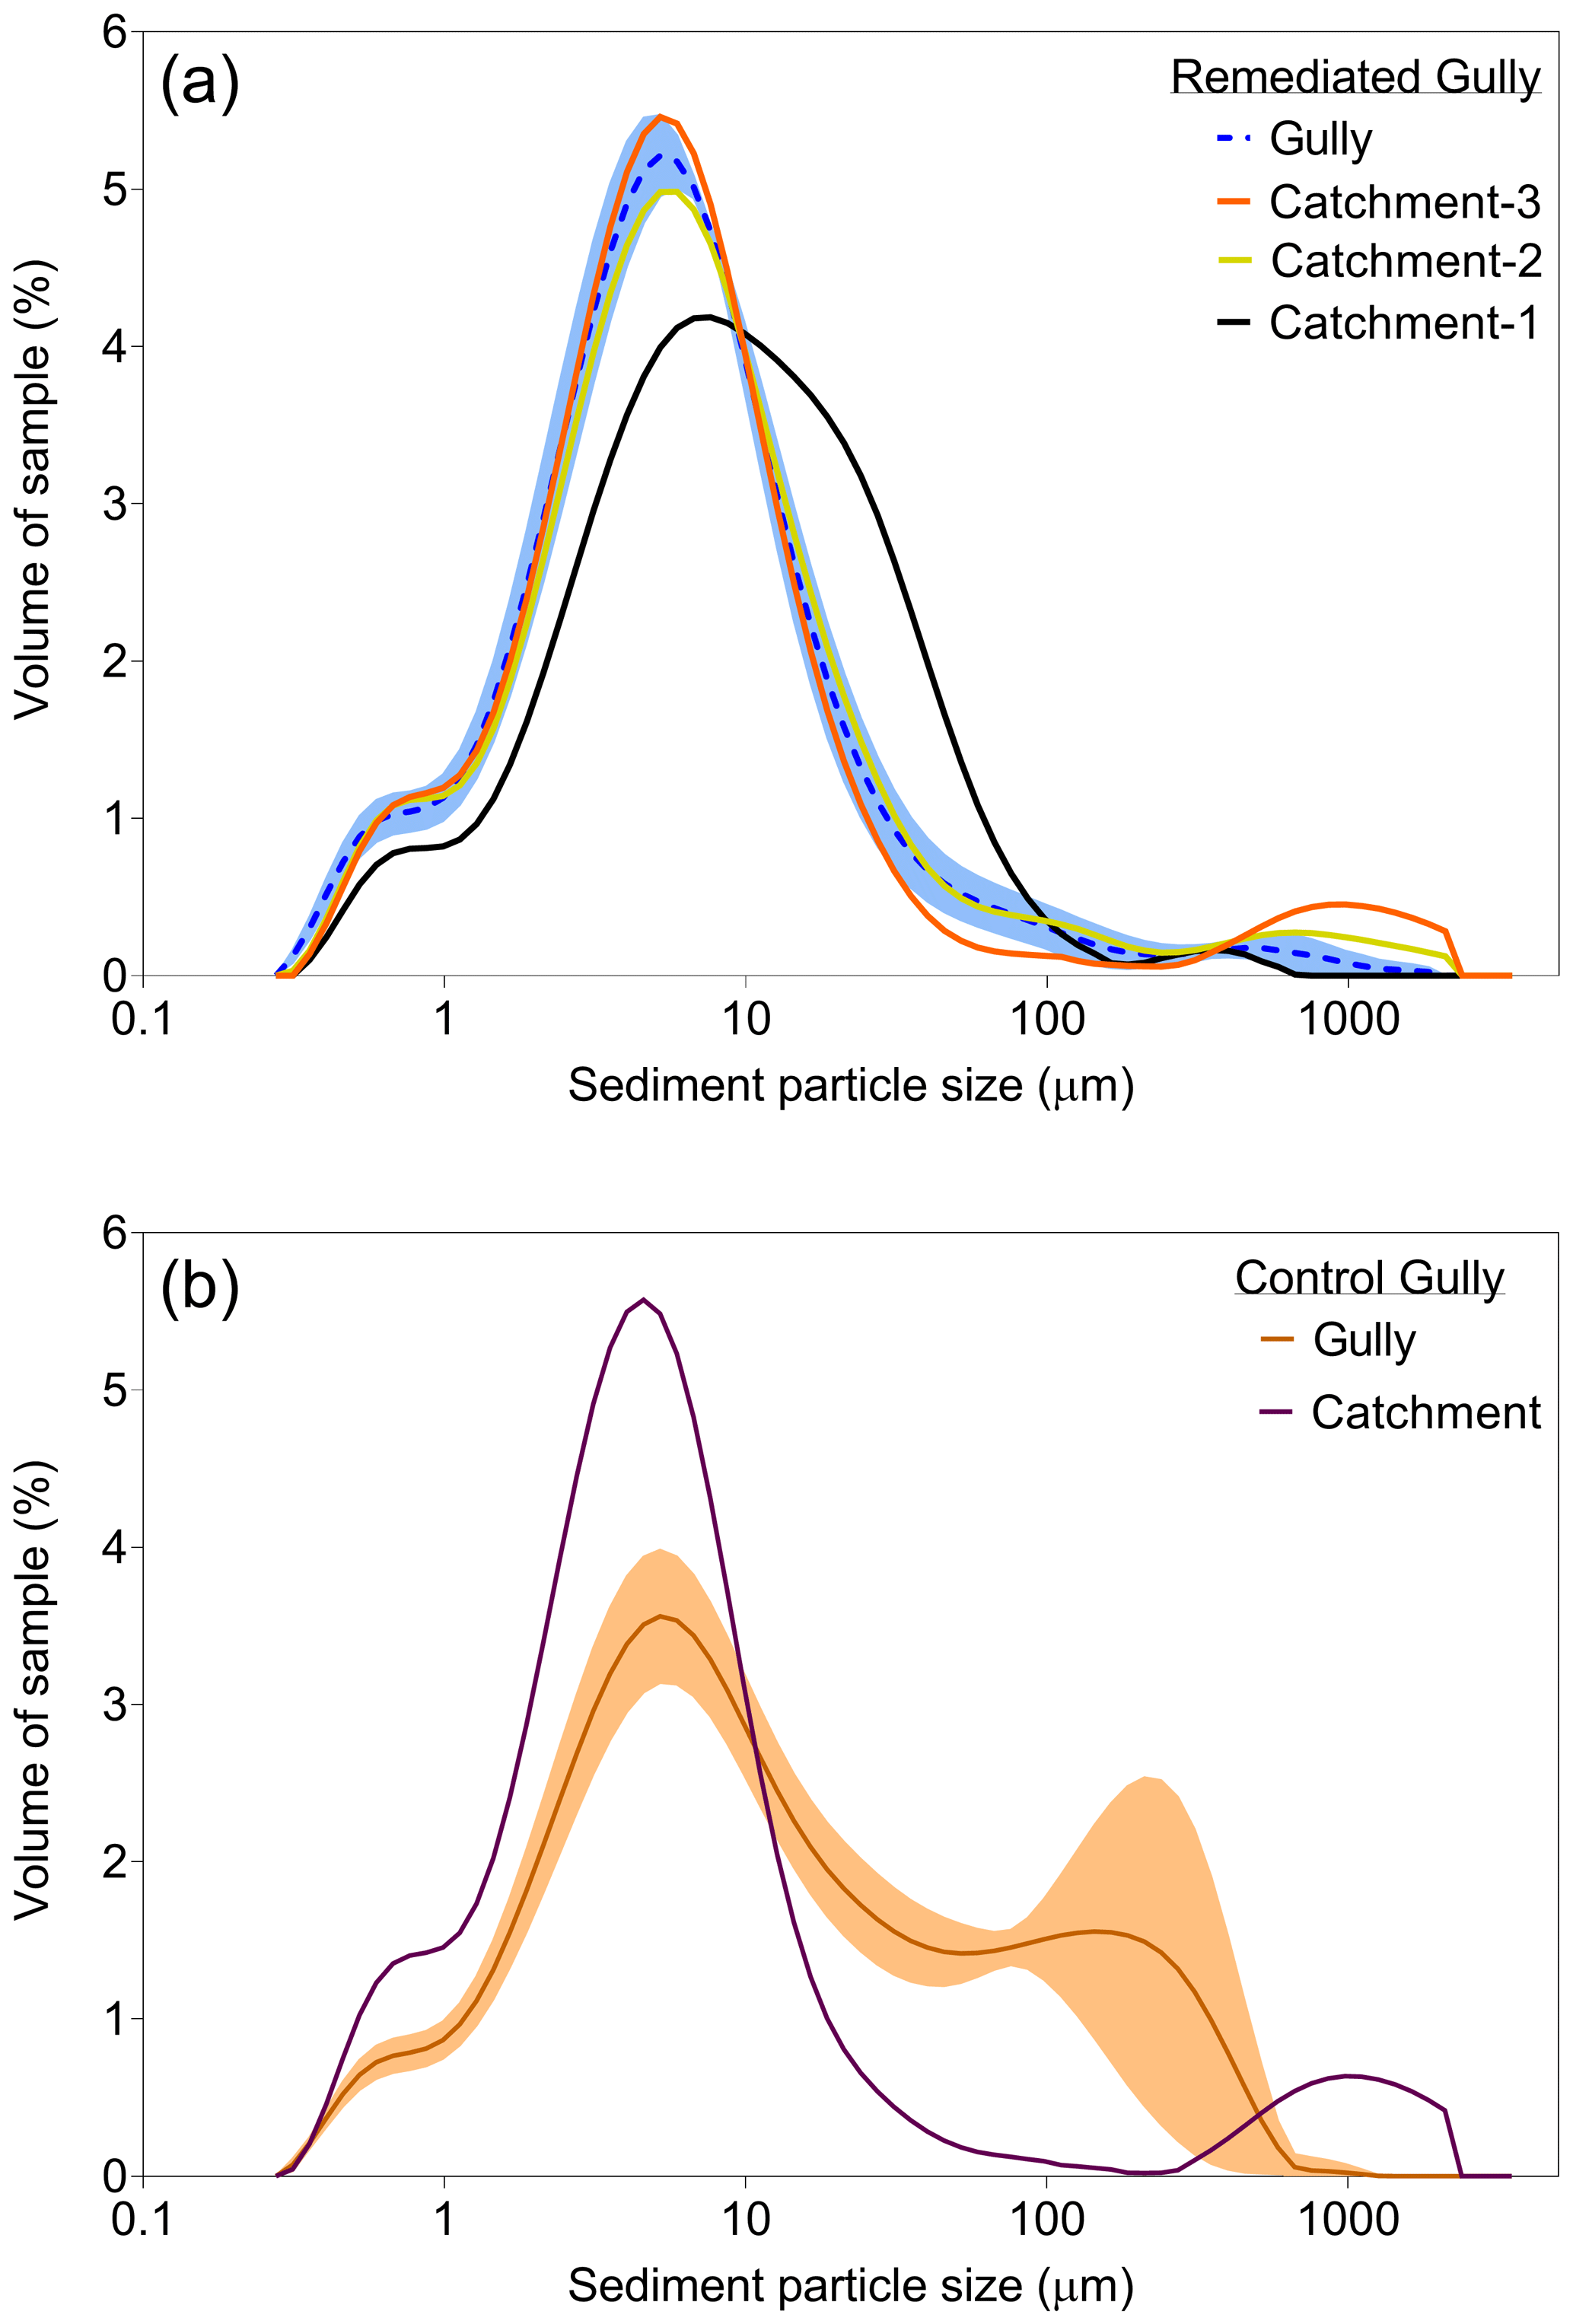
Figure 9Average PSDs of PASS samples collected from the remediated gully (blue) and catchments (orange, yellow, and black) and control gully (brown) and catchment (purple) suspended sediment PSD frequency plots during the 2018–2019 wet season. Shading around gully PSDs represents the error as a standard deviation.
3.3 Particulate and dissolved nutrients
Three opportunities occurred during the study period (24 January 2018, 15 December 2018, and 5 February 2019) where samples were able to be retrieved from the remote sampling site within a time frame that allowed them to be processed (i.e. refrigerated, and samples filtered and frozen within 48 h of collection) and analysed. A total of 40 samples were collected from the remediated (n=14) and control (n=26) gullies for nutrient analysis. The hydrographs and SSC trends of these sampling events indicate they were representative of the other flow events observed in the two gullies (Sect. S3) and provide enough data for a preliminary assessment of nutrient transport trends within the gullies. Note, the SSC of these samples were likely underestimated by ∼15 % because they were analysed using the total suspended solids (TSSs) analysis method rather than the SSC method (Gray et al., 2000).
The bulk of total organic carbon and nutrient (nitrogen and phosphorus) concentrations, for both gullies, consisted of particulate fractions (Fig. 10). Organic carbon and nutrient concentrations of samples collected from the remediated gully were significantly lower than control gully samples for both dissolved and particulate fractions, except for dissolved organic carbon and nitrogen during the 2018/19 wet season (Table S10; Fig. 10).

Figure 10SSC and nutrient concentrations of samples collected during flow events in the 2017–2018 and 2018–2019 wet seasons. Note that the 2017–2018 data represent a single flow event, and the 2018–2019 data represent multiple flow events. Box plots represent the minimum, maximum, 25th and 75th percentiles, median (horizontal line in box), and mean (cross). Brackets above the box and whisker plots represent the results of paired t tests, where p<0.001 (), p<0.01 (), p<0.05 (*), or p>0.05 (ns).
Dissolved nutrients are influenced by numerous biogeochemical processes that occur in the catchment and the gully, with some of these processes occurring rapidly (i.e. instantly or within several minutes) and significantly altering nutrient chemical speciation (Garzon-Garcia et al., 2015, 2016b; Lloyd et al., 2019). We do not currently have sufficient information to investigate the effect these processes have on dissolved nutrient trends occurring in the gullies and their catchments, thus, our interpretation of this data will be limited. However, particulate nutrients and carbon are more stable, taking days or weeks to undergo large changes due to biogeochemical processes once initial leaching of soluble components has occurred (Garzon-Garcia et al., 2018a; Waterhouse et al., 2018). Therefore, we can assume that the particulate nutrients are relatively stable and representative of their source when sampled from the gully outlet.
For the samples collected during flow events on 23 January 2018, the SSC and particulate nutrient concentrations showed a significant correlation in the control gully (r=0.68 to 0.78; p<0.01), whereas there was no significant correlation (r=0.23 to 0.48; p>0.05) between SSC and particulate nutrient concentrations in the remediated gully (Fig. 11; Sect. S10). The strong positive relationship between SSC and nutrient concentrations in the control gully supports the hypothesis that erosion processes within the gully are acting as the dominant source of suspended sediment and particulate nutrients. In contrast, the poor relationship between SSC and nutrient concentrations in the remediated gully is likely due to the much lower rates of gully erosion at this site, which limits the range of SSCs over which the relationship can be evaluated. It may also indicate multiple sources (i.e. sediment and detritus inputs from the catchment) are contributing to particulate nutrient export. The remediated gully suspended sediment had a significantly higher nutrient proportion by mass than that from the control gully (Sect. S11), consistent with the higher proportion of fine suspended sediments observed in the remediated gully, as a result of reduced subsoil erosion effects (Fig. 8; Horowitz, 2008). Reliably differentiating fine suspended sediment and associated nutrients sourced from either the catchment or the gully itself is challenging without dedicated sediment tracing data (e.g. stable or radioisotopes, biomarkers), and/or a distributed network of event samplers within the catchment. Despite this, our PSD data is consistent with a dominant catchment source of suspended sediment and particulate nutrient sources in the remediated gully. In contrast, the significant relationships between SSC and particulate nutrients in the control gully demonstrates that eroding subsoil was likely a major source of particulate nutrients in the control gully. Future work should seek to investigate the specific sources of suspended sediment and associated nutrients at the study sites.
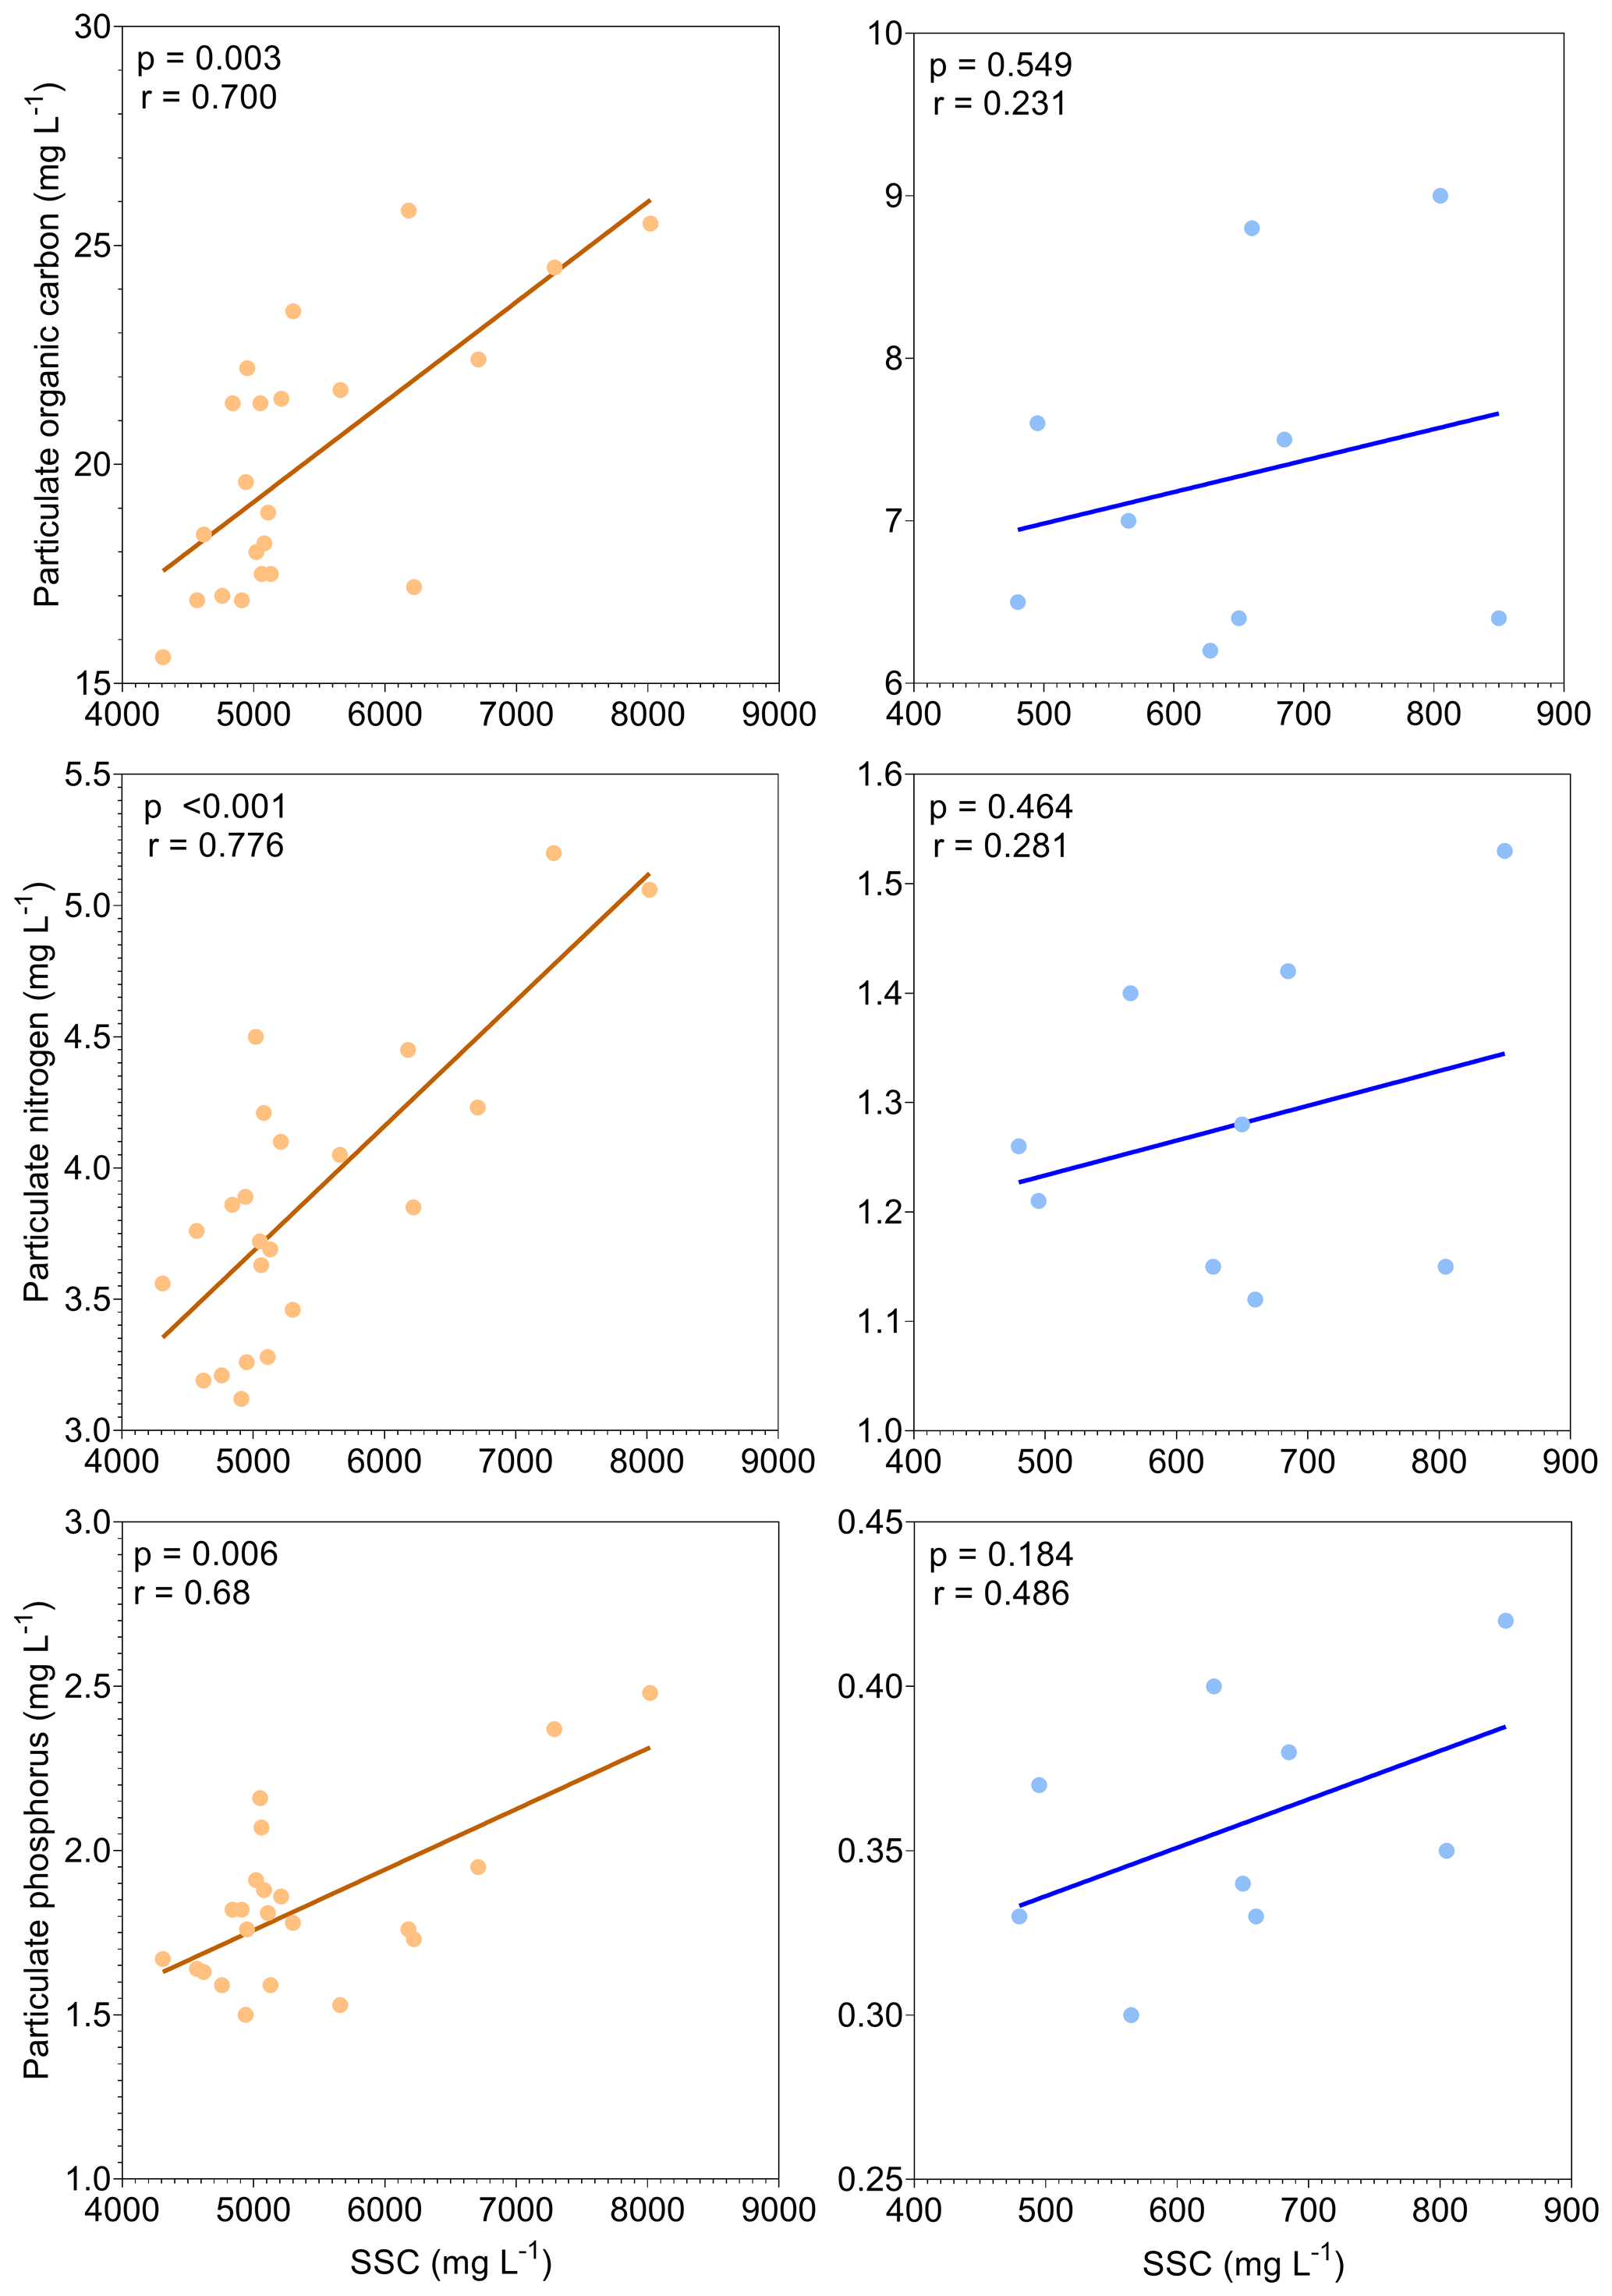
Figure 11Relationships between SSC and particulate organic carbon and nutrient concentrations in the control (brown) and remediated gully (blue) from single flow events on the same day during 2017–2018 wet season.
3.4 Monitoring approach assessment
The large investment in monitoring effort reported in this study was necessary in order to properly assess the effect of landscape-scale remediation on alluvial gully water quality and to test the effectiveness of the different monitoring methods. It is imperative that environmental managers apply robust monitoring plans when conducting gully erosion control measures to ensure that their effectiveness is appropriately evaluated. This study identified the following important factors to consider when implementing a gully water quality monitoring plan:
-
The combination of a small number of high-cost monitoring methods (i.e. autosamplers) complemented by low-cost automated methods (i.e. RS and PASS samplers) allows for both redundancy and more representative data collection at key monitoring locations, such as gully outlets. For example, the PASS sampler collected samples from events that occurred after the RS and autosamplers were at capacity, the RS samplers provided important information on in-stream suspended sediment heterogeneity over the rising stage, and the autosampler provided important discrete sample data used to evaluate suspended sediment dynamics (e.g. SSC and water-level hysteresis).
-
The application of low-cost methods (e.g. the PASS sampler) allows for the establishment of a wider spatial monitoring network. In this study, the PASS sampler was deployed at several monitoring locations, in both gully catchments and outlets, which would commonly not be a feasible approach with the other runoff monitoring methods.
-
A complete conceptual model of potential inputs and outputs of a gully should be established before monitoring begins. Failure to do so could lead to inconclusive results and a poor evaluation of gully remediation effectiveness. For example, the lack of catchment data for the 2017–2018 wet season needed to be addressed for the following wet seasons in order to account for all the potential influences acting on the suspended sediment dynamics occurring in the gullies.
The water quality data collected during this study, using multiple monitoring methods, support the application of intensive landscape-scale remediation to significantly reduce suspended sediment concentrations in actively eroding gullies. This is accompanied by the added benefit of significant reductions in nutrient (nitrogen and phosphorus) and carbon concentrations in gully discharge. The findings from this study, regarding the longevity of the erosion mitigation controls used as part of the gully remediation works, are considered to be preliminary, pending the results of monitoring data collected from the site over longer timescales (i.e. semi-decadal to decadal). Development of gully flow velocity or discharge measurement capabilities should be conducted to address the current limitations of discharge measurements in these, often remote, locations. Future studies should also investigate the speciation of particulate and dissolved nutrients in remediated and active alluvial gully systems to better understand the effects of landscape-scale gully remediation on the reduction of bioavailable nutrient export.
The data that support the findings of this study are available from the corresponding author upon reasonable request.
The data that support the findings of this study are available from the corresponding author upon reasonable request.
The supplement related to this article is available online at: https://doi.org/10.5194/hess-25-867-2021-supplement.
NJCD designed the experiments, carried them out, did the sample and data analysis, investigated the data, and prepared the paper with contributions from all co-authors. WWB provided guidance in the experimental design, method development, and interpretation of results and assisted with the preparation of the paper. JRS provided assistance in the method development, carried out field work, and interpreted the results. AGG and JMB provided sample and data analysis, interpreted the results, and assisted with the preparation of the paper. PRT and DTW provided the interpretation of results and assisted with the preparation of the paper. APB provided supervision, offered guidance in the experimental design, carried out field work, interpreted the results, and assisted with the preparation of the paper.
The authors declare that they have no conflict of interest.
The authors acknowledge the traditional owners of the country in which this study was conducted. We thank the Laura Ranger group for their support throughout the field-monitoring component of this study. We also thank William Higham and Michael Goddard, from Cape York Natural Resource Management, for giving us the opportunity to collaborate with them on-site at Crocodile Station. The authors also acknowledge the Managers of Crocodile Station, Roy and Karlene Shepherd.
Funding for this study was provided by the Australian Government National Environmental Science Programme under Project 3.1.7 – Effectiveness of Alluvial Gully Remediation in Great Barrier Reef Catchments. The Queensland Water Modelling Network also provided funding for the nutrient analysis component of this study.
This paper was edited by Christian Stamm and reviewed by Simon Walker and two anonymous referees.
Ayele, G. K., Addisie, M. B., Langendoen, E. J., Tegegne, N. H., Tilahun, S. A., Moges, M. A., Nicholson, C. F., and Steenhuis, T. S.: Evaluating erosion control practices in an actively gullying watershed in the highlands of Ethiopia, Earth Surf. Proc. Land., 43, 2835–2843, https://doi.org/10.1002/esp.4436, 2018.
Bartley, R., Bainbridge, Z. T., Lewis, S. E., Kroon, F. J., Wilkinson, S. N., Brodie, J. E., and Silburn, D. M.:. Relating sediment impacts on coral reefs to watershed sources, processes and management: a review, Sci. Total Environ., 468, 1138–1153, 2014.
Bartley, R., Hawdon, A., Henderson, A., Wilkinson, S., Goodwin, N., Abbott, B., and Telfer, D.: Quantifying the effectiveness of gully remediation on off-site water quality: preliminary results from demonstration sites in the Burdekin catchment, NESP Project 2, no. 4, Report to the National Environmental Science Programme, Reef and Rainforest Research Centre Limited, Cairns, 76 pp., 2017.
Bartley, R., Thompson, C., Croke, J., Pietsch, T., Baker, B., Hughes, K., and Kinsey-Henderson, A.: Insights into the history and timing of post-European land use disturbance on sedimentation rates in catchments draining to the Great Barrier Reef, Mar. Pol. Bult., 131, 530–546, 2018.
Bartley, R., Poesen, J., Wilkinson, S., and Vanmaercke, M.: A review of the magnitude and response times for sediment yield reductions following the rehabilitation of gullied landscapes. Earth Surf. Proc. Land., 45, 3250–3279, 2020.
BOM: Climate data online, Australian Bureau of Meteorology, available at: http://www.bom.gov.au/climate/data/ (last access: 22 February 2021), 2020.
Brodie, J., Kroon, F., Schaffelke, B., Wolanski, E., Lewis, S., Devlin, M., and Davis, A.: Terrestrial pollutant runoff to the Great Barrier Reef: an update of issues, priorities and management responses, Mar. Pol. Bult., 65, 81–100, 2012.
Brooks, A., Shellberg, J., Knight, J., and Spencer, J.. Alluvial gully erosion: an example from the Mitchell fluvial megafan, Queensland, Australia, Earth Surf. Proc. Land., 34, 1951–1969, 2009.
Brooks, A., Spencer, J., Olley, J., Pietsch, T., Borombovits, D., Curwen, G., and Simon, A.: An empirically-based sediment budget for the Normanby Basin: sediment sources, sinks, and drivers on the Cape York Savannah, Griffith University, 506 pp., available at: https://www.researchgate.net/publication/258337838_An_Empirically-Based_Sediment_Budget_for_the_Normanby_Basin_Sediment_Sources_Sinks_and_Drivers_on_the_Cape_York_Savannah (last access: 22 February 2021), 2013.
Brooks, A., Borombovits, D., Spencer, J., Pietsch, T., and Olley, J.: Measured hillslope erosion rates in the wet-dry tropics of Cape York, northern Australia Part 1: A low cost sediment trap for measuring hillslope erosion in remote areas – Trap design and evaluation, Catena, 122, 42–53, 2014a.
Brooks, A., Spencer, J., Borombovits, D., Pietsch, T., and Olley, J.: Measured hillslope erosion rates in the wet-dry tropics of Cape York, northern Australia: Part 2, RUSLE-based modeling significantly over-predicts hillslope sediment production, Catena, 122, 1–17, 2014b.
Brooks, A., Curwen, G., and Spencer, J.: A framework for prioritising gully management in the Normanby Basin Cape York, Cape York Water Quality, available at: https://capeyorknrm.com.au/node/478 (last access: 22 February 2021), 2015.
Brooks, A., Spencer, J., Curwen, G, Shellberg, J., Garzon-Garcia, A, Burton, J., and Iwashita, F.: Reducing sediment sources to the Reef: Managing alluvial gully erosion. Report to the National Environmental Science Programme, Reef and Rainforest Research Centre Limited, Cairns, 375 pp., 2016a.
Brooks, A., Spencer, J., and Thwaites, R.: Progress Report as part of Cape York NRM Reef Trust 2 Gully Rehabilitation Project, Griffith University, Centre for Coastal Management, available at: https://www.researchgate.net/publication/335988826_Progress_Report_as_part_of_Cape_York_NRM_Reef_Trust_2_Gully_Rehabilitation_Project_Crocodile_Gap_Gully_Rehabilitation_Site_Treatment_Design_Report (last access: 22 February 2021), 2016b.
Brooks, A. P., Doriean, N. J. C., Goddard, M., Hingham, W., Spencer, J., Thwaites, R., and Zund, P.: Gully mitigation field guide, Cape York Natural Resource Management, available at: http://www.capeyorknrm.com.au/node/365 (last access: 22 February 2021), 2018.
Brooks, A. P., Stout, J. C., Daley, J. S., Curwen, G., Spencer, J., Hasan, S., Thwaites, R., Smart, J. C. R., Pietsch, T., Dale, G., and Lucas, R.: Gully Rehabilitation Prioritisation in the Bowen and Bogie Catchments; Summary Report, Precision Erosion & Sediment Management Research Group, Griffith University, Griffith, 2020a.
Brooks, A. P., Spencer, J., Doriean, N. J. C., Thwaites, R., Garzon-Garcia, A., Hasan, S., Daley, J., Burton, J., and Zund, P.: NESP Project 3.1.7 Final Report: Effectiveness of Alluvial Gully Remediation in Great Barrier Reef Catchments. Report to the National Environmental Science Program, Reef and Rainforest Research Centre Limited, Cairns, 205 pp., 2020b.
Carey, B., Stone, B., Shilton, P., and Norman, P.: Chapter 13 Gully erosion and its control, Soil Conservation Guidelines for Queensland, 3rd Edn., Queensland Department of Science, Information Technology and Innovation, available at: https://publications.qld.gov.au/dataset (last access: 22 February 2021), 2015.
Casalí, J., Giménez, R., and Bennett, S.: Gully erosion processes: monitoring and modelling, Earth Surf. Proc. Land., 34, 1839–1840, 2009.
Castillo, C. and Gómez, J.: A century of gully erosion research: Urgency, complexity and study approaches, Earth-Sci. Rev., 160, 300–319, 2016.
CYNRM.: Crocodile Gully Monitoring Site 2.3, Cape York Natrual Resources Management, Atherton, Queensland, Australia, available at: https://www.youtube.com/watch?v=dCbV1BggnKI (last access: 22 February 2021), 2017.
Dagnew, D. C., Guzman, C. D., Zegeye, A. D., Tibebu, T. Y., Getaneh, M., Abate, S., Zemale, F. A., Ayana, E. K., Tilahun, S. A., and Steenhuis, T. S.: Impact of conservation practices on runoff and soil loss in the sub-humid Ethiopian Highlands: the Debre Mawi watershed, J. Hydrol. Hydromech., 63, 210–219, https://doi.org/10.1515/johh-2015-0021, 2015.
DNRME: Queensland Department of Natural Resources, Mines and Energy Water monitoring information Portal, Queensland Government, Australia, available at: https://water-monitoring.information.qld.gov.au/ (last access: 22 February 2021), 2019.
Doriean, N. J., Teasdale, P. R., Welsh, D. T., Brooks, A. P., and Bennett, W. W.: Evaluation of a simple, inexpensive, in situ sampler for measuring time-weighted average concentrations of suspended sediment in rivers and streams, Hydrol. Process., 33, 678–686, 2019.
Doriean, N. J., Teasdale, P. R., Welsh, D. T., Brooks, A. P., and Bennett, W. W.: Suspended sediment monitoring in alluvial gullies: a laboratory and field evaluation of available measurement techniques, Hydrol. Process., https://doi.org/10.1002/hyp.13824, in press, 2020.
Dunkerley, D. and Brown, K.: Flow behaviour, suspended sediment transport and transmission losses in a small (sub-bank-full) flow event in an Australian desert stream, Hydrol. Process., 13, 1577–1588, 1999.
Edwards, T. K., Glysson, G. D., Guy, H. P., and Norman, V. W.: Field methods for measurement of fluvial sediment, US Geological Survey, Denver, CO, 1999.
Fabricius, K., De'ath, G., McCook, L., Turak, E., and Williams, D. M.: Changes in algal, coral and fish assemblages along water quality gradients on the inshore Great Barrier Reef, Mar. Pollut. Bull., 51, 384–398, https://doi.org/10.1016/j.marpolbul.2004.10.0, 2005.
GA: The Innovative Gully Remediation Project: Communique Three, Greening Australia, Queensland, Australia, available at: https://www.greeningaustralia.org.au/projects/rebuilding-eroding-land-2/ (last access: 22 February 2021), 2019.
Garzon-Garcia, A., Olley, J. M., and Bunn, S. E.: Controls on carbon and nitrogen export in an eroding catchment of south-eastern Queensland, Australia, Hydrol. Process., 29, 739–751, 2015.
Garzon-Garcia, A., Laceby, J. P., Olley, J. M., and Bunn, S. E.: Differentiating the sources of fine sediment, organic matter and nitrogen in a subtropical Australian catchment, Sci. Total Environ., 575, 1384–1394, https://doi.org/10.1016/j.scitotenv.2016.09.219, 2016a.
Garzon-Garcia, A., Burton, J., Brooks, A. P.: Bioavailable nutrients and organics in alluvial gully sediment, Queensland Department of Science, Information Technology and Innovation, Queensland, Australia, 2016b.
Garzon-Garcia, A., Burton, J., Ellis, R., Askildsen, M., Finn, L., Moody, P., and DeHayr, R.: Sediment particle size and contribution of eroded soils to dissolved inorganic nitrogen export in Great Barrier Reef catchments, Department of Environment and Science, Queensland Government, Australia, Brisbane, 2018a.
Garzon-Garcia, A., Burton, J., Franklin, H., Moody, P., De Hayr, R. W., and Burford, M.: Indicators of phytoplankton response to particulate nutrient bioavailability in fresh and marine waters of the Great Barrier Reef, Sci. Total Environ., 636, 1416–1427, 2018b.
Garzon-Garcia, A., Bunn, S. E., Olley, J. M., and Oudyn, F.: Labile carbon limits in-stream mineralization in a subtropical headwater catchment affected by gully and channel erosion. J. Soils Sediments, 18, 648–659, 2018c.
Geoscience Australia: Australian Federal Government, available at: http://maps.ga.gov.au/interactive-maps/#/theme/minerals/map/geology (last access: 22 February 2021), 2019.
Gray, J. R., Glysson, G. D., Turcios, L. M., and Schwarz, G. E.: Comparability of suspended-sediment concentration and total suspended solids data, Water-Resources Investigations Report 00-4191, US Geological Survey, Reston, Virginia, USA, 1–14, 2000.
Hevia, J. N., de Araujo, J. C., Manso, J. M.: Assessment of 80 years of ancient-badlands restoration in Saldana, Spain, Earth Surf. Proc. Land., 39, 1563–1575, https://doi.org/10.1002/esp.3541, 2014.
Horowitz, A. J.: Determining annual suspended sediment and sediment-associated trace element and nutrient fluxes, Sci. Total Envrion., 400, 315–343, 2008.
Howley, C., Devlin, M., and Burford, M.: Assessment of water quality from the Normanby River catchment to coastal flood plumes on the northern Great Barrier Reef, Australia, Mar. Freshwater Res., 69, 859–873, 2018.
Kroon, F. J., Thorburn, P., Schaffelke, B., and Whitten, S.: Towards protecting the Great Barrier Reef from land-based pollution, Global Change Biol., 22, 1985–2002, 2016.
Liu, D. and She, D.: Sodicity effects on hydrological processes of sodic soil slopes under simulated rainfall, Hydrol. Process., 31, 981–994, 2017.
Lloyd, C., Johnes, P., Freer, J., Carswell, A., Jones, J., Stirling, M., and Collins, A.: Determining the sources of nutrient flux to water in headwater catchments: Examining the speciation balance to inform the targeting of mitigation measures, Sci. Total Environ., 648, 1179–1200, 2019.
Malmon, D. V., Dunne, T., and Reneau, S. L.: Stochastic theory of particle trajectories through alluvial valley floors, J. Geol., 111, 525–542, 2002.
Malmon, D. V., Reneau, S. L., Katzman, D., Lavine, A., and Lyman, J.: Suspended sediment transport in an ephemeral stream following wildfire, J. Geophys. Res.-Earth, 112, F02006, https://doi.org/10.1029/2005JF000459, 2007.
Mathys, N., Brochot, S., Meunier, M., and Richard, D.: Erosion quantification in the small marly experimental catchments of Draix (Alpes de Haute Provence, France), Calibration of the ETC rainfall–runoff–erosion model, Catena, 50, 527–548, https://doi.org/10.1016/S0341-8162(02)00122-4, 2003.
McCloskey, G. and Waters, D.: Modelling Pollutant Load Changes Due to Improved Management Practices in the Great Barrier Reef Catchments: Updated Methodology and Results, Technical Report for Reef Report Card 2015, Department of Natural Resources and Mines, Queensland, Australia, 2017.
Nichols, M. H., Polyakov, V. O., Nearing, M. A., Hernandez, M.: Semiarid watershed response to low-tech porous rock check dams, Soil Sci., 181, 275–282, https://doi.org/10.1097/ss.0000000000000160, 2016.
Nistor, C. J. and Church, M.: Suspended sediment transport regime in a debris-flow gully on Vancouver Island, British Columbia, Hydrol. Process., 19, 861–885, 2005.
Nyssen, J., Veyret-Picot, M., Poesen, J., Moeyersons, J., Haile, M., Deckers, J., and Govers, G.: The effectiveness of loose rock check dams for gully control in Tigray, northern Ethiopia, Soil Use Manage., 20, 55–64, https://doi.org/10.1111/j.1475-2743.2004.tb00337.x, 2004.
Olley, J., Brooks, A., Spencer, J., Pietsch, T., Borombovits, D.: Subsoil erosion dominates the supply of fine sediment to rivers draining into Princess Charlotte Bay, Australia, J. Environ. Radioact. 124, 121–129, 2013.
Poesen, J.: Challenges in gully erosion research, Landform Anal., 17, 5–9, 2011.
Polyakov, V. O., Nichols, M. H., McClaran, M. P., and Nearing, M. A.: Effect of check dams on runoff, sediment yield, and retention on small semiarid watersheds, J. Soil Water Conserv., 69, 414–421, https://doi.org/10.2489/jswc.69.5.414, 2014.
Prosser, I. P. and Slade, C. J.: Gully formation and the role of valley-floor vegetation, southeastern Australia, Geology, 22, 1127–1130, 1994.
Rasmussen, P. P., Gray, J. R., Glysson, G. D., Ziegler, A. C.: Guidelines and procedures for computing time-series suspended-sediment concentrations and loads from in-stream turbidity-sensor and streamflow data, US geological survey techniques and methods, US geological survey, 2009.
Rustomji, P., Zhang, X. P., Hairsine, P. B., Zhang, L., and Zhao, J.: River sediment load and concentration responses to changes in hydrology and catchment management in the Loess Plateau region of China, Water Resour. Res., 44, W00A04, https://doi.org/10.1029/2007WR006656, 2008.
Shellberg, J., Spencer, J., Brooks, A., and Pietsch, T.: Degradation of the Mitchell River fluvial megafan by alluvial gully erosion increased by post-European land use change, Queensland, Australia, Geomorphology, 266, 105–120, 2016.
Shellberg, J. G., Brooks, A. P., and Rose, C. W.: Sediment production and yield from an alluvial gully in northern Queensland, Australia, Earth Surf. Proc. Land., 38, 1765–1778, 2013.
Sottolichio, A., Hurther, D., Gratiot, N., and Bretel, P.: Acoustic turbulence measurements of near-bed suspended sediment dynamics in highly turbid waters of a macrotidal estuary, Cont. Shelf Res., 31, S36–S49, 2011.
Vercruysse, K., Grabowski, R. C., and Rickson, R.: Suspended sediment transport dynamics in rivers: Multi-scale drivers of temporal variation, Earth-Sci. Rev., 166, 38–52, https://doi.org/10.1016/j.earscirev.2016.12.016, 2017.
Walling, D. E. and Collins, A. L.: Fine sediment transport and management, in: River Science: Research and Management for the 21st Century, Wiley, London, 37–60, 2016.
Wang, Y., Fu, B., Chen, L., Lü, Y., and Gao, Y.: Check dam in the Loess Plateau of China: engineering for environmental services and food security, Environ. Sci. Technol., 45, 10298–10299, https://doi.org/10.1021/es2038992, 2011.
Waterhouse, J., Burton, J., Garzon-Garcia, A., Lewis, S., Brodie, J., Bainbridge, Z., Robson, B., Burford, M., Gruber, R., and Dougall, C.: Synthesis of knowledge and concepts – Bioavailable Nutrients: Sources, delivery and impacts in the Great Barrier Reef, July 2018, Supporting Concept Paper for the Bioavailable Nutrients Workshop, 15 March 2018, Supported by the Office of the Great Barrier Reef's Queensland Reef Water Quality Program, and the Australian Government National Environmental Science Program Tropical Water Quality Hub, Reef and Rainforest Research Centre on behalf of the Australian Government's National Environmental Science Program (NESP) Tropical Water Quality (TWQ) Hub and the State of Queensland, 84 pp., 2018.
Wei, Y., He, Z., Li, Y., Jiao, J., Zhao, G., and Mu, X.: Sediment yield deduction from check–dams deposition in the weathered sandstone watershed on the North Loess Plateau, China, Land Degrad. Dev., 28, 217–231, https://doi.org/10.1002/ldr.2628, 2017.
Wilkinson, S., Olley, J., Furuichi, T., Burton, J., and Kinsey-Henderson, A.: Sediment source tracing with stratified sampling and weightings based on spatial gradients in soil erosion, J. Soils Sediments, 15, 2038–2051, 2015a.
Wilkinson, S., Bartley, R., Hairsine, P., Bui, E., Gregory, L., and Henderson, A.: Managing gully erosion as an efficient approach to improving water quality in the Great Barrier Reef lagoon. Report to the Department of the Environment (Reef Program), Australian Federal Government, CSIRO Publishing, Collingwood, Victoria, Australia, 2015b.
Wilkinson, S. N., Hancock, G. J., Bartley, R., Hawdon, A. A., and Keen, R. J.: Using sediment tracing to assess processes and spatial patterns of erosion in grazed rangelands, Burdekin River basin, Australia, Agr. Ecosyst. Environ., 180, 90–102, 2013.
Wilkinson, S. N., Kinsey-Henderson, A. E., Hawdon, A. A., Hairsine, P. B., Bartley, R., and Baker, B.: Grazing impacts on gully dynamics indicate approaches for gully erosion control in northeast Australia, Earth Surf. Proc. Land., 43, 1711–1725, 2018.