the Creative Commons Attribution 4.0 License.
the Creative Commons Attribution 4.0 License.
 | 02 Dec 2021
Enhanced flood hazard assessment beyond decadal climate cycles based on centennial historical data (Duero basin, Spain)
Olegario Castillo
Juan A. Ballesteros-Cánovas
Maria Machado
Mariano Barriendos
Current climate modelling frameworks present significant uncertainties when it comes to quantifying flood quantiles in the context of climate change, calling for new information and strategies in hazard assessments. Here, state-of-the-art methods on hydraulic and statistical modelling are applied to historical and contemporaneous flood records to evaluate flood hazards beyond natural climate cycles. A comprehensive flood record of the Duero River in Zamora (Spain) was compiled from documentary sources, early water-level readings and continuous gauge records spanning the last 500 years. Documentary evidence of flood events includes minute books (municipal and ecclesiastic), narrative descriptions, epigraphic marks, newspapers and technical reports. We identified 69 flood events over the period 1250 to 1871, of which 15 were classified as catastrophic floods, 16 as extraordinary floods and 38 as ordinary floods. Subsequently, a two-dimensional hydraulic model was implemented to relate flood stages (flood marks and inundated areas) to discharges. The historical flood records show the largest floods over the last 500 years occurred in 1860 (3450 m3 s−1), 1597 (3200 m3 s−1) and 1739 (2700 m3 s−1). Moreover, at least 24 floods exceeded the perception threshold of 1900 m3 s−1 during the period (1500–1871). Annual maximum flood records were completed with gauged water-level readings (pre-instrumental dataset, PRE: 1872–1919) and systematic gauge records (systematic dataset, SYS: 1920–2018). The flood frequency analyses were based on (1) the expected moments algorithm (EMA) and (2) the maximum likelihood estimator (MLE) method, using five datasets with different temporal frameworks (historic dataset, HISTO: 1511–2018; PRE–SYS: 1872–2018; full systematic record, ALLSYS: 1920–2018; SYS1: 1920–1969; and SYS2: 1970–2018). The most consistent results were obtained using the HISTO dataset, even for high quantiles (0.001 % annual exceedance probability, AEP). PRE–SYS was robust for the 1 % AEP flood with increasing uncertainty in the 0.2 % AEP or 500-year flood, and ALLSYS results were uncertain in the 1 % and 0.2 % AEP floods. Since the 1970s, the frequency of extraordinary floods (>1900 m3 s−1) declined, although floods on the range of the historical perception threshold occurred in 2001 (2075 m3 s−1) and 2013 (1654 m3 s−1). Even if the future remains uncertain, this bottom-up approach addresses flood hazards under climate variability, providing real and certain flood discharges. Our results can provide a guide on low-regret adaptation decisions and improve public perception of extreme flooding.
- Article
(34959 KB) - Full-text XML
-
Supplement
(820 KB) - BibTeX
- EndNote


There are major challenges in dealing with flood hazards on a global scale (UNISDR, 2015). Climate warming is part of the problem, but the challenges will continue to be great as a result of population growth and human occupation of flood risk zones (Kundzewicz et al., 2014). Most “top-down” approaches based on downscaling of nested climate models with hydrological approaches (deterministic and statistical) typically produce uncertain results, with a wide range of scenarios which are difficult to implement on a local scale (García et al., 2014; IPCC, 2012). Given the uncertainty in climate model projections, a new focus on other risk variables (demography, land use, urbanisation) has led to supporting decision-making processes (Döll et al., 2015). This “bottom-up” approach is based on reducing exposure and vulnerability but still fails to solve the probability assessment of flood hazards due to the stochastic nature of weather (Kundzewicz et al., 2010). In this regard, the information from past flood events has become an important data source to quantify the links between the occurrence of extreme events and natural climate variability that provide expectations of future climate change.
Over recent decades, palaeoflood and documentary flood archives have been used to quantify flood discharge and frequency over centennial to millennial timescales with applications for engineering design and risk estimation (Aldrete, 2007; Baker, 2008; Wetter et al., 2011; Elleder et al., 2013). A recent pan-European historical archive analysis has identified nine flood-rich periods (30–40-year interval) over the last 500 years, all except the last one (1992–2016) occurring during intervals of colder air temperatures than the interflood period before and after (Blöschl et al., 2020). The existence of flood-rich periods was also demonstrated at millennial timescales for the Mediterranean basin and at a European scale using palaeoflood sedimentary evidence (Benito et al., 2015c). These studies reveal that flood-producing mechanisms, on a local to regional scale, are not necessarily driven by temperature anomalies but are controlled by the behaviour process of ocean and atmospheric circulation (Woollings et al., 2010; Ballesteros-Cánovas et al., 2019). Thus, long-term flood registers, produced by multiple atmosphere–ocean interactions, contain a wide range of weather anomalies to advise on expected flood extremes in a changing climate, and, more importantly, it reveals what flood dimension is actually possible on a local scale (Elleder et al., 2013; Macdonald, 2013).
Historical and palaeoflood hydrology has demonstrated its potential to determine the quantitative information of specific flood events over centennial to millennial time spans (Benito et al., 2015a; Cœur and Lang, 2008; Wetter et al., 2011; Elleder et al., 2013; Wilhelm et al., 2019). Major advances are related to (1) digitalisation of archival sources, facilitating the search and screening tasks; (2) lidar data used for digital terrain models, buildings and urban spaces; (3) application of sophisticated two- or even three-dimensional hydraulic modelling to estimate peak discharges, local flow velocity and depth; and (4) new statistical procedures and software to feed historical and palaeoflood data into quantitative frequency analysis (Macdonald, 2013; Benito et al., 2020). Although in the past the use of historical flood archives was mainly considered in academic research circles, a recent publication by the US federal government guidelines (England et al., 2019) shows a growing interest to harness past flood information to evaluate flood hazards and risks (St. George et al., 2020). In the European Union, several countries have proposed the use of past flood data on the probability of future floods as part of low-regret actions to solve the uncertainty in downscaling climate model results on a local scale (García et al., 2014; European Commission, 2021). Going forward, technical guidance and new protocols on the use of past flood archives are needed to reach engineers and stakeholders so it can become a far-reaching and smart tool to cope with flooding (EXCIMAP, 2007; England et al., 2019).
In this paper, we firstly implement a holistic methodology combining historical flood evidence and a two-dimensional hydraulic model to reconstruct centennial registers of peak discharges and their relationship with natural climate variability and triggers. Secondly, we apply two flood frequency statistical methods to different types and series lengths of flood data sources (historic, pre-instrumental and gauged records) to evaluate the robustness of flood discharges for low-probability events. Thirdly, we consider the historical flood imprint on local communities as a basic tool to improve public risk awareness on urban space, heritage buildings and cultural landscapes. Our results based on this bottom-up approach show a direct guide on flood possibilities beyond decadal climate cycles that can be used to provide a portfolio of low-regret solutions suitable for climate change adaptation.
2.1 Geographical and physical setting
The Duero River drains the northern Spanish Plateau and flows east–west into the Atlantic Ocean at Porto (Portugal) (Fig. 1a). It is one of the longest rivers of the Iberian Peninsula (897 km) and the largest in catchment area (98 073 km2), of which 78 859 km2 is in Spain and 19 214 km2 in Portugal. The flood records studied are located in Zamora, in the lower part of the Spanish Duero basin (Fig. 1b), draining a catchment area of 46 137 km2.
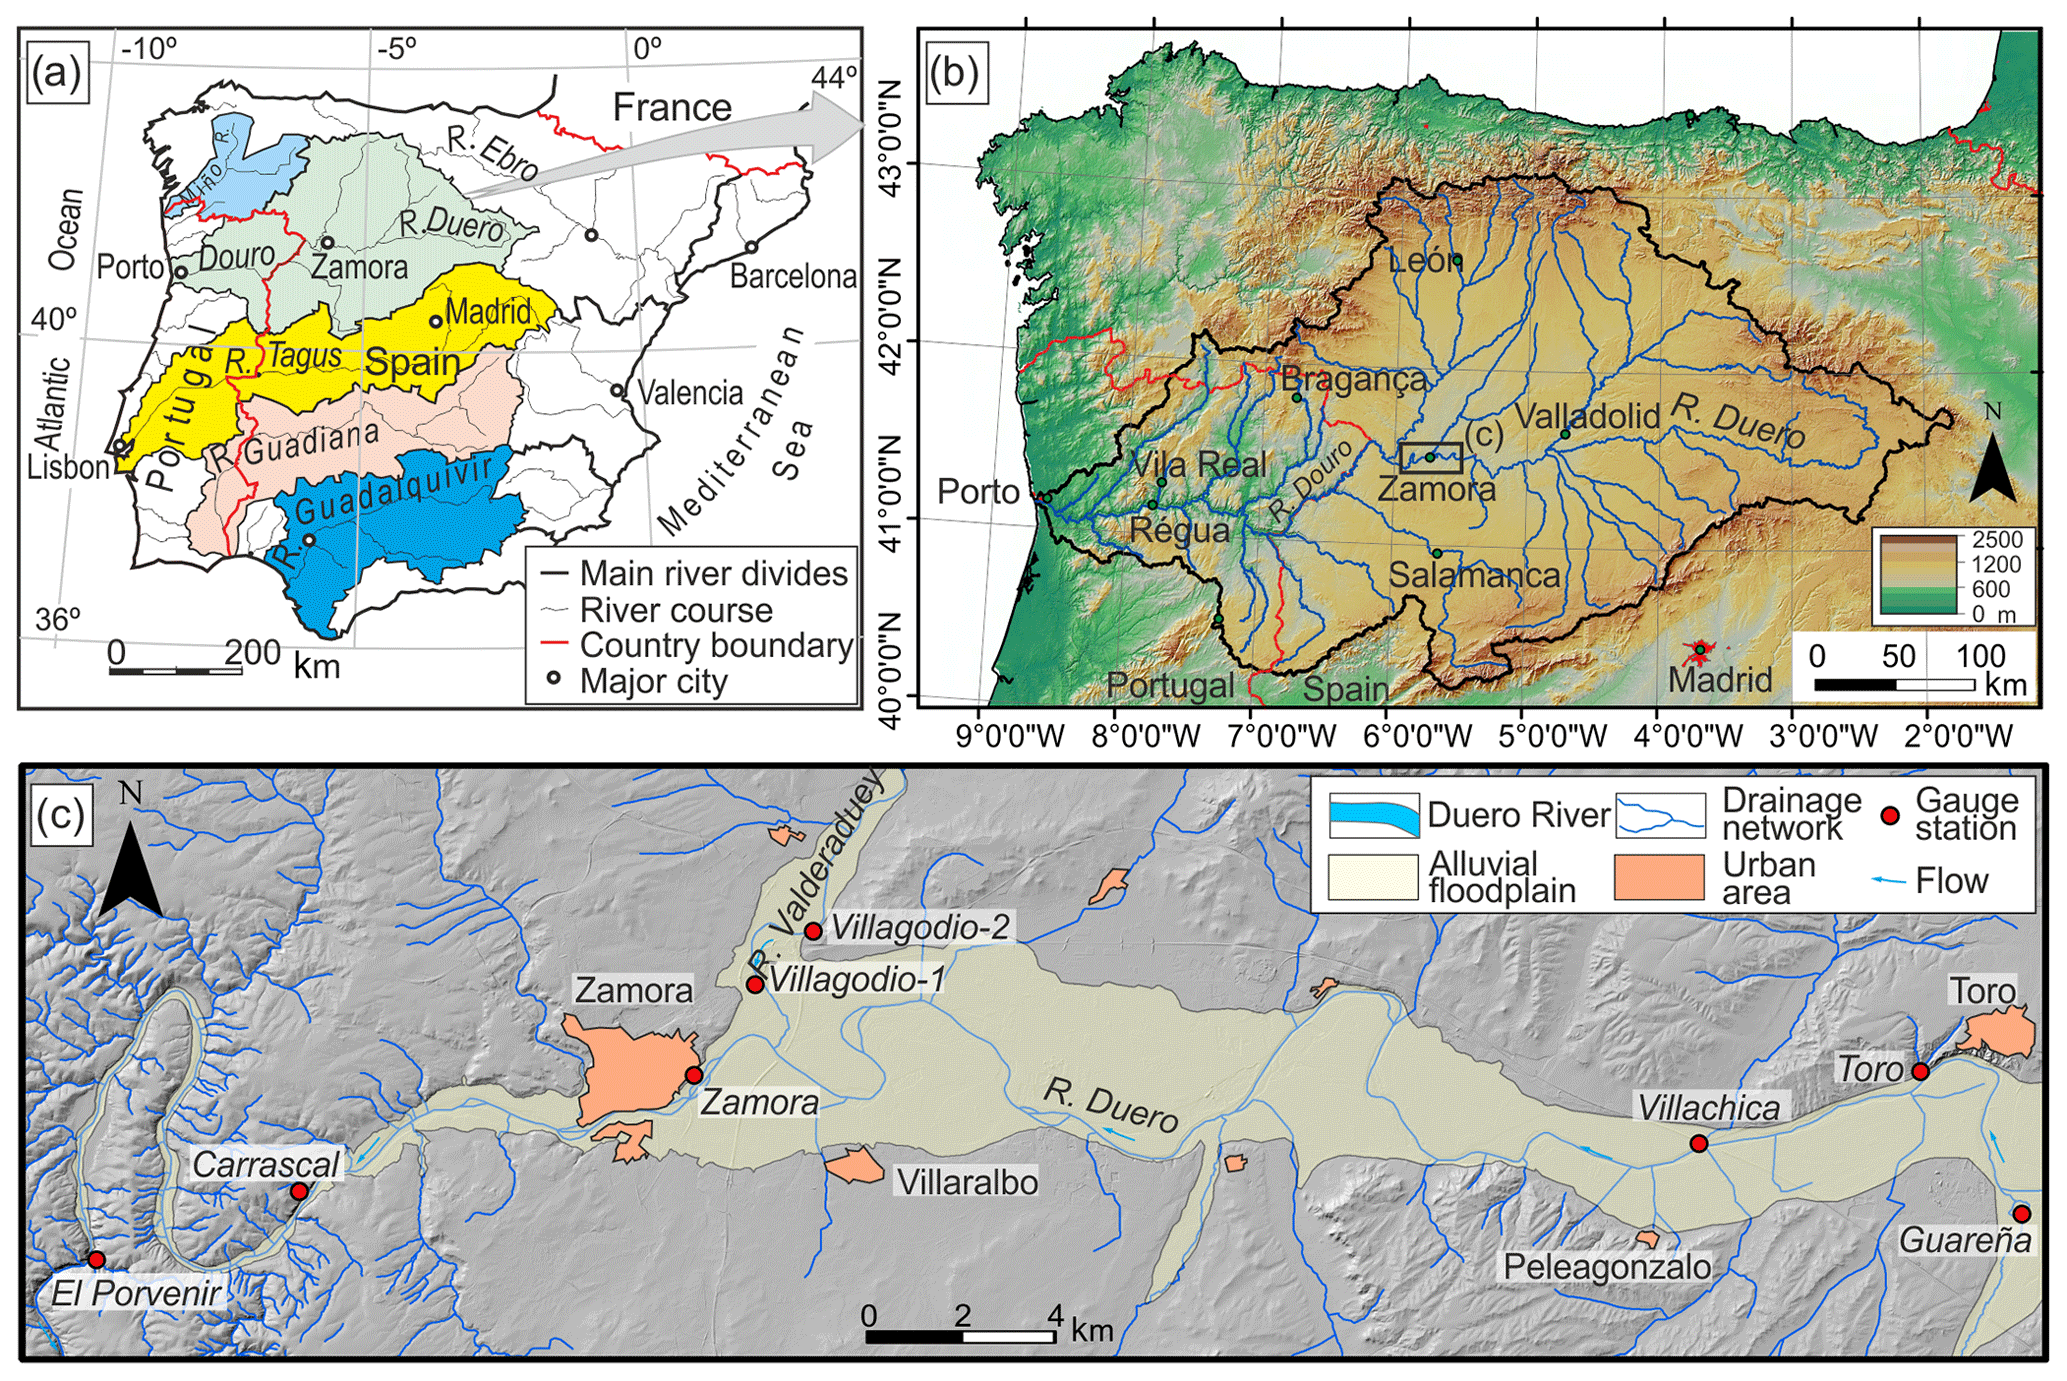
Figure 1(a) The Duero River basin (green) in the Iberian Peninsula together with Miño (light blue), Tagus (yellow), Guadiana (orange) and Guadalquivir (dark blue) catchments draining towards the Atlantic Ocean; (b) relief map of NW Iberia with the Duero catchment boundary, main drainage network and major cities. The rectangle at Zamora shows the location of (c); (c) hillshade map with extension of the floodplain between Toro and Zamora. Map shows location of gauge stations in the Duero and Valderaduey rivers.
The Duero basin is surrounded by the Cantabrian Mountains to the north, the Iberian Range to the east and the Central Range (Gredos and Guadarrama Mountains) to the south. Geologically, the Duero catchment area comprises two major zones: (1) the eastern side covers the Cenozoic endorheic continental basin (∼50 000 km2) composed of detritic, carbonate and evaporitic units (Alonso-Zarza et al., 2002), overlain by Quaternary alluvial fans and fluvial staircase terraces developed by fluvial dissection related to the onset of exoreic basin conditions (Martin Serrano, 1991; Rodríguez-Rodríguez et al., 2020), and (2) the west is composed of Palaeozoic granitic and a metamorphic basement, where the fluvial network is deeply incised, forming confined river valleys.
The Duero River east of Zamora flows along a 2–3 km wide floodplain (Fig. 1c). In Zamora the floodplain is asymmetric with a 300 m wide floodplain at the southern margin, whereas on the northern side the channel is cut on silicified sandstone and conglomerates dating back to Early Cretaceous–Palaeocene (Areniscas de Salamanca; Delgado-Iglesias and Alonso-Gavilán, 2008). West of Zamora, the river is incised in granite and metamorphic rocks of Palaeozoic age, forming a confined bedrock canyon, with punctuated valley expansions. The combination of a narrow and steep valley floor has been optimal for the development of hydroelectric dam facilities along the Arribes del Duero (narrows of the Duero), an impressive 800 m deep bedrock canyon formed by the Duero at the Spanish–Portuguese border.
2.2 Historical urban development and flood documentation
The old city of Zamora, still partially walled, is located on a prominent bedrock hill on the right side of the Duero River and treasures a rich architectural ensemble formed by the 24 Romanesque churches and monasteries (10th–13th centuries). The urban expansion towards the east, parallel to the riverside area, took place mainly in three phases during the 11th, 12th and 14th centuries (Fig. 2a), coinciding with periods of economic and population growth (Gutiérrez González, 1993; Larrén, 1999).

Figure 2Historic flood landmarks and GPS point locations. (a) Historic map of Zamora (1:2900 in scale) published on 11 March 1766 by Juan Martín Cermeño. Old graphic scale of 200 toes (1 toe = 13.5 cm). Black polygons illustrate the timing of urban development through time in the old city (9th–13th centuries) and suburbs (14th century and beyond). The city of Zamora was surrounded by walls that in the old city had defence purposes and in the suburbs protected against flooding. (b) Orthophoto of Zamora (year 2017) showing the same urban expansion areas as (a). Legend: (1) Las Dueñas convent, (2) San Frontis church, (3) Olivares mills, (4) San Claudio de Olivares church, (5) Campo de la Verdad (likely location of old Santa Clara convent), (6) Santiago de los Caballeros church, (7) old San Francisco convent, (8) Stone Bridge, (9) Gate of Pescado dated to the 14th century (a new one was built in 1849; Fig. 4b), (10) Santa Lucia church, (11) Santa Maria de la Horta, (12) Santo Tomé church, (13) San Leonardo, (14) cavalry headquarters, (15) Mengue Avenue, (16) Iron Bridge, (17) Railway Bridge, (18) Cabañales mills, (19) San Jerónimo, (20) survey monument N. P. 1482 (IGN 1925), (21) IGN survey mark 305004, (22) IGN survey mark 305005, (23) IGN survey mark 305003. Source: (a) Biblioteca virtual Ministerio de Defensa (https://bibliotecavirtual.defensa.gob.es/, last access: 24 November 2021), (b) National Geographical Institute.
The five oldest Romanesque churches located on the Duero River were built during the late 11th and 12th centuries (Santo Tomé, Santiago el Viejo, San Claudio de Olivares, San Cebrián and Santa Maria la Nueva; Fig. 2a). Other Romanesque churches bearing marks corresponding to historic flooding were built during the first half of the 13th century (Santa Maria de la Horta, San Frontis, Dueñas de Cabañales, San Leonardo and Santa Lucia). The first known bridge (Puente Viejo), located near the Olivares mill, was destroyed by the 1310 flood event (Marquina, 1949b), though several basal piers remain visible (site 24, Fig. 2b). The medieval Stone Bridge, still in use, was finished during the 13th century, although with a first written reference in 1167 as “Ponten Novum” or New Bridge (Enríquez de Salamanca, 1998; site 8, Fig. 2).
The number of reported floods increases in parallel with the demographic growth during the 14th century that brought the third major urban expansion and new commercial and artisanal activities (Fig. 2a). These activities were carried out in the new suburbs next to the Stone Bridge (Horta neighbourhood) as well as in the areas surrounding the three water mills. The Olivares mill and its neighbourhood sit on the right bank, the activity of which, linked to the wool, cloth and tannery industry, was already referred to at the end of the 11th century (Gutiérrez González, 1993). The water mills of La Pinilla (12th century) and Cabañales (15th–16th centuries) on the left bank, traditionally an area of meadows, were known for their tannery and pottery manufacture. A later economic expansion took place during the 18th century under the protection of the Spanish crown.
The flood references between the 14th and 18th centuries are concentrated in the riverside areas of new commercial and artisanal expansion to the east of the Stone Bridge (in the streets of San Julian, La Plata-Balborraz, Baños, Horta and Cuartel de abajo). The frequent flood references are linked not only to its geomorphological and hydraulic settings but to a greater exposure and vulnerability. On the left river margin, flood reports are related to ecclesiastic buildings (Las Dueñas, San Francisco, San Frontis) and their surrounding orchards.
The urban development that took place from the 19th century onwards is also reflected in the increase and spatial distribution of buildings and infrastructures associated with flood damages. At the beginning of the 19th century, with the French military invasions, large parts of the city walls were demolished (eastern walls in Fig. 2a), which still offered not only military protection (Larrén, 1999) but also protection against flood risk in part of the city of Zamora (south and east of the Horta neighbourhood). However, the greatest change took place in the mid and late 19th century, with the modernisation of the city (Segundo Viloria's project in 1880) as well as in the mid-20th century, with the construction of the Vigo road along the Duero River right margin, from Olivares to the confluence with the Valderaduey River (Fig. 2b, connecting sites 9, 15, 16 and 17). In this urban growth, a significant portion of the remaining city walls were removed or incorporated within new buildings (Gutiérrez González, 1993). This city expansion brought a narrowing of the river section at the floodplain and changes in the location and growth of fluvial bars, mainly next to the bridges and weirs. Furthermore, the limited natural space of the riverside area was highly transformed during the construction of the sewage system and two new bridges: (1) the old railway bridge built in 1895, reformed in 1933 and without traffic since 1986, and (2) the “Iron Bridge” (1892–1900), still in use for road traffic circulation (Fig. 2b, site 16). Other infrastructures are diversion weirs related to water mills historically used for grinding wheat (Fig. 2). The most recent bridge was opened in 2013, connecting the suburbs of San Frontis and Olivares.
2.3 Climate and flood hydrology characteristics
The climate is continental Mediterranean in most of the catchment area, with a strong temperate oceanic influence towards the mouth of the Duero River in the Atlantic Ocean at the city of Porto. The temperature and precipitation regimes are characterised by a marked seasonal and monthly variability. Summers are hot and dry, and winters are typically mild and relatively wet. Rainfall is mainly produced by cold Atlantic frontal systems crossing the Iberian Peninsula from November to April. There is a strong west–east rainfall contrast due to the relief effect, with annual rainfall at the lower Duero in Porto of 1175 mm, whereas at the Spanish Duero basin it is 580 mm, with a wide inter-annual variability ranging from 350 and 800 mm. Similarly, daily maximum rainfall on the Portuguese side may reach 200 mm, whereas for the Spanish Duero it ranges between 60–100 mm.
In Zamora, the Duero River mean annual discharge is 99 m3 s−1 (period 2002–2017), with flow partially regulated by reservoirs. General hydrological characteristics are (i) maximum discharge from December to May, (ii) a peak between February and March, and (iii) minimum discharge from July to September. This seasonal pattern is influenced by a mix of snowmelt and rainwater from tributaries draining the Gredos and Cantabrian mountains. Most of the largest floods are related to persistent winter rainfall (several weeks) associated with successive passage of Atlantic fronts, occasionally combined with snowmelt at mountain ranges surrounding the catchment area. Extreme flood discharges may be 30 times greater than the mean discharge, yielding one of the largest specific peak discharges compared to similar European catchment areas (Pardé, 1953; Benito et al., 2015a). Although the number of hazardous floods has decreased over recent decades, the Duero River Watershed Authority reported for the Zamora Province flood damages of EUR 270 000 per year over the period 2009–2013 (DHD, 2016).
The Portuguese Douro catchment area is more likely to generate catastrophic floods than the Spanish side due to the convergence of significant tributaries with a much larger runoff contribution (Vehlas, 1997). For instance, the largest gauged flood of the Douro River in Régua (91 119 km2 in catchment area; Fig. 1) was 16 700 m3 s−1 in 1909 (Silva and Oliveira, 2002), whereas this event in Zamora recorded 2155 m3 s−1. Among the reasons of this flood discharge disparity are a high instability and advection of humid air masses towards Portugal, high relief that decreases concentration time, and more impervious igneous and metamorphic bedrock. In contrast, the Spanish Duero River flows on wide valleys, detrital bedrock and well-developed floodplains with a lack of flood peak convergence since the headwater flows reach the peaks with a delay with respect to those coming from the middle and lower valley. For example, the 1909 flood peak was recorded in Régua and Porto on the morning of 24 December (from the Portuguese catchment area), whereas on the Spanish side in Valladolid the peak occurred on the afternoon of 25 December, with the flood wave reaching Zamora during the night. As a result, the ranking of the years in which the largest floods occur in Zamora may differ from that observed in Régua and Porto at the lower Douro basin (Silva and Oliveira, 2002).
3.1 Instrumental records
The Duero River hydrological gauge stations next to Zamora (Fig. 1c) comprise (i) Carrascal (Station N.2066, period 1918–2021) located 8 km downstream of Zamora, (ii) Zamora (Station N.2121, 2002–2021), (iii) Villachica (Station N.2096, 1929–1967) and (iv) Toro (Station N.2062, 2011–2021); the latter two are located 25 and 28 km upstream of Zamora, respectively.
The oldest gauged records correspond to water-level readings taken on a daily basis in the El Porvenir gauge station, covering the period 1880 and 1943. The gauged section is located ca. 23 km downstream of Zamora at the San Roman hydroelectric station (operating since 1903). According to Marquina (1949b), the El Porvenir rating curve was well established to a stage of 5 m (1450 m3 s−1) using the Villachica gauge data, whereas for higher discharges extrapolation of the curve may result in errors of ca. ±10 %. The flood record was completed with the Carrascal station (1920–present) managed by the Iberdrola hydropower company, which allows robust estimations of historic floods in Zamora. The Toro and Villachica stations were used to test the gauged data at Carrascal, particularly those corresponding to flood peaks.
3.2 Historical data sources
Our historical flood database was collected from published compilations, unpublished documents, epigraphic marks, historical maps, photos and newspapers (listed in the Supplement). The documentary flood records in Zamora essentially comprise a continuous series from 1545 to 1860 and a non-continuous dataset between 1250 and 1545 collected from ecclesiastic and municipal archives. In the Cathedral of Zamora archives, the Extracts of ecclesiastical agreements comprises two volumes over the period 1601 to 1745, and the Books of ecclesiastic agreements includes 34 volumes over the period 1601 to 1913. The municipal books (Libros de Actas) comprise 259 volumes over the period 1500–1899, although there are some missing documents over the periods 1503–1507, 1521–1530 and 1576–1585. Many references of those books and local chronicles were collected by historiographic collections, namely the historical memoirs of the city of Zamora (four volumes) by Fernández Duro (1882). Extreme climate and hydrological event descriptions with reference to flooding in Zamora were also compiled in local ecclesiastic chronicles, namely by Zataraín-Fernández (1898), and in the geological description of the Zamora Province by Puig y Larraz (1883). Large floods typically affected historic buildings, such as churches, convents, bridges, walls and gates, the traces of which are recorded in architectural catalogues that describe inscriptions and flood marks, repair work to flood damages, or changes in the location of ecclesiastical communities due to the effects of major floods (Gomez-Moreno, 1927; Antón, 1927).
The most outstanding historical flood compilation effort was carried out by Rodríguez Marquina (1941–1949), who analysed all available historical and hydrological reports on flooding for the construction of the dams in the Duero and Esla rivers. Marquina's manuscripts provided a highly detailed description and height survey of epigraphic marks, including some flood marks that later disappeared during restoration works. Marquina also compiled original water-level gauge readings from the Duero and Esla rivers at different locations (e.g. El Porvenir gauge). The temporal evolution of floodplain areas, buildings and riverine structures (weirs, bridges, mills, orchards, etc.) were evaluated using historic maps, drawings and etchings from historic times, namely by Anton van der Wyngaerde in 1570 (Kagan, 2008; Rodríguez-Méndez and García-Gago, 2014), Josep Auguier in 1756 (Museum of Zamora) and Juan Martín Cermeño in 1766 (digital archive of the Ministry of Defence; Fig. 2a). The most detailed historical maps belong to the collection of plans of the municipal architect Segundo Viloria in 1880 (provincial historical archive of Zamora) and Zamora's municipal maps (19th–20th centuries). A final source of flood data, mainly over the last 4 decades, was obtained from local and regional newspapers (Heraldo de Zamora, La Voz de Zamora, La Opinión, Impero, among others) and national press (Ahora, La Correspondencia de España, ABC, La Vanguardia). Regarding more general reference to the Duero River and its tributaries, an outstanding compilation of flood dates from historical data sources was compiled by Fontana Tarrats (1971–1977).
The reported floods were compared with historical series in the lower Douro River in Portugal (Loureiro, 1904; Aires et al., 2000; Amorim et al., 2017; Alcoforado et al., 2021). Flood severity was classified according to Barriendos and Martín-Vide (1998) into three flood categories: (1) ordinary, causing overbank flows of low to moderate intensity and temporary disruption of the human activities; (2) extraordinary, causing overbank flows of moderate intensity, with limited damages to crops, houses and river dykes; and (3) catastrophic, causing extensive overflow with significant damage to agriculture, mills, and/or destruction of houses and infrastructures.
3.3 Two-dimensional hydraulic modelling
Flood water level (stage) related to historical floods includes (i) flood marks and observed water depth measures at sites reached by the flow (e.g. monastery, bridge, chapel, etc.), (ii) description of flooded areas (e.g. floodplain sectors, orchards, mills), (iii) description of non-flooded areas and (iv) comparative flood level of subsequent historical floods (e.g. said flood reached lower levels than previous one). The documented flood evidence can be used to estimate exact or relative (minimum or maximum) flood discharges associated with observed water levels. The conversion of flood level to discharge is obtained by matching a modelled water surface elevation for a given modelled discharge to the surveyed elevation of the known historical flood level (Benito et al., 2020).
Discharge estimation by hydraulic modelling was carried out using a two-dimensional hydraulic model (Iber) which solves the depth-averaged shallow water (2D Saint-Venant) equations using a finite volume method with a second-order roe scheme (Bladé et al., 2014; http://www.iberaula.com, last access: 24 November 2021). This two-dimensional hydraulic model is particularly suitable for flow in alluvial floodplains with secondary currents. The model uses a non-structured mesh consisting of triangles or quadrilateral elements whose spatial resolution was set to 20 m for the channel bed, 10 m for the channel margins and floodplains, 1 m for river bars, and 1 to 5 m in the city streets and at major infrastructures (Fig. S1). The 13 km length modelled reach extends from the Carrascal gauge station to the Duero River junction with the Valderaduey River (at the highway A-11; Fig. S1a). The Carrascal section is situated at a narrow bedrock canyon producing a backwater effect upon the upstream alluvial reach where the city of Zamora is located. The mesh elements were built from a cloud of lidar data with an average distance of 1.4 m (some are below 1 m) supplied by the Spanish National Geographic Institute (IGN; https://www.ign.es, last access: 24 November 2021). The topography of the river channel bottom and banks was obtained from field surveys with an echo-sounder device at cross-sections of 40 to 500 m distance (LINDE project, Ministry for Ecological Transition). The surveyed points from 268 cross-sections were extracted and integrated with the lidar cloud data using the spatial analyst tools in ArcGIS v.10. The bridges were introduced to model historical flood discharges considering their construction date.
Manning's n values were assigned from land use map classes (Corine Land Cover map) following the methodological guide of the National Flood Inundation Hazard Map (MMA, 2011). In our study, the initial set of n values was defined as 0.04 for the main channel and between 0.045 and 0.1 for the floodplains. Model calibration was performed using flow discharge-stage records at two gauge stations, namely the Carrascal one located at the farthest downstream cross-section and Zamora station in the upper sector of the modelled reach. For this calibration, the outflow stage for successive increments of inflow discharges in the upper section in Zamora was compared to the rating curve at the Carrascal gauge station. The difference in stage between the model and the gauge station for a discharge of 1100 m3 s−1 was 2 cm, and for a discharge of 3100 m3 s−1 it was 12 cm. After the model calibration, Manning's n at the channel was set at 0.035.
The flood marks and flooded sites mentioned in documentary flood evidence were surveyed using a Trimble GPS, supported by four geodetic survey monuments of the Spanish National Geographical Institute (numbers 305003, 305004, 601005 and 601006; Table S1). We modelled successive increments of inlet water discharges at the upstream reach to simulate a steady flow. The hydraulic model provided a peak discharge vs. water stage relationship for 30 sites with known historical flood evidence (epigraphic marks, documented heights, description of flooded/non-flooded areas). We used the mean and standard deviation to estimate average peak discharge for each historical flood or used the minimum or maximum flood values according to the mean of the documentary flood evidence.
3.4 Flood frequency analysis
Flood data stationarity for censored samples (historical and systematic flooding) was confirmed using Lang's test (Lang et al., 1999). This test assumes that stationary flood series can be described by a homogeneous or stationary Poisson process. The 95 % tolerance interval of the cumulative number of floods above a threshold or censored level is calculated. Stationary flood series are those that remain within the 95 % tolerance interval (Naulet et al., 2005). The flood frequency analysis was performed with two computer programs: PeakFQ Version 7.2 (Flynn et al., 2006; Veilleux et al., 2014) and AFINS (Botero and Francés, 2006, 2010). The PeakFQ program applies a generalised method-of-moments estimator denoted the expected moments algorithm (EMA; Cohn et al., 1997), whereas AFINS uses the maximum likelihood method (Frances, 2004). Flood frequency analysis was carried out with different combinations of three datasets: (1) documentary floods using minimum flow and/or peak discharge estimated from flood marks and reported flood descriptions (historic dataset, HISTO); (2) water-level readings on a scale gauge transformed into discharge at El Porvenir station (pre-instrumental dataset; PRE); and (3) continuous systematic records at Carracal station (systematic dataset: SYS), which was analysed first over the whole gauged period 1920–2018 (ALLSYS) and, secondly, subdivided on early (1920–1969; SYS1) and late (1970–2018; SYS2) datasets.
The documentary flood information is non-systematic data of censored type since only flows over a particular magnitude (commonly producing damages) are reported in documentary records. The minimum flood stage (perception threshold) is set according to flood magnitude spilling over urban areas, disrupting human activities (communication, manufacture works) and/or producing damage (orchards, bridge, houses and ecclesiastic goods). The flooding of sensitive urban areas, or perception threshold, may change through time according to the progressive human occupation of the riverine areas and the socio-economic context (Benito et al., 2004). In the case of Zamora, the perception threshold did not register significant changes through historical time. The minimum discharge (1900 m3 s−1) is required to flow overbank in the low urban neighbourhoods of Horta, Olivares and Frontis and for cutting the main communication infrastructures next to the Duero River. The reconstructed historical flood discharges were added to the continuous gauged annual maximum flow records at the Porvenir and Carrascal stations.
The PeakFQ software uses the mentioned expected moments algorithm and a generalised version of the Grubbs–Beck test for identifying multiple potential influential low flows (PILFs; Cohn et al., 2013). Low annual discharge values may have excessive influence on the estimated frequency of large floods (Veilleux et al., 2014), and their identification of PILFs improve estimated frequency of large floods. PeakFQ is well designed to treat both historical and systematic data but only allows fitting of a log Pearson type III (LP3) distribution. A Gumbel distribution, commonly used in Spain, was fitted using the AFINS software that applies a maximum likelihood estimation method (MLE). This method has demonstrated a high capacity to incorporate in the estimation process any non-systematical data (Leese, 1973; Stedinger and Cohn, 1986). Visual matching of the plotting positions to the distribution curve and their statistical parameters were used to test the goodness of fit. Confidence intervals of the fitted distribution indicate the range of discharges statistically possible based on the available data.
3.5 Analyses of the atmospheric circulation related to floods
To provide a general context of the climate triggers of the larger floods exceeding the perception threshold of 1900 m3 s−1, we investigated the related atmospheric circulation based on the 20th century reanalysis climate data (Version 3 and 2c, 20CRV3 and 2c) from NOAA/CIRES. These datasets cover the period 1836–2015 at a sub-daily scale (3 h) from around the globe at 2∘ × 2∘ and provides relevant meteorological fields at different pressure levels (Compo et al., 2011). Thus, the climate analysis is restricted to floods occurring during this period. First, we extracted several ensemble mean fields at a daily scale from the surface and troposphere level, such as geopotential height, wind components, divergence and specific moisture up to 250 hPa. This information was used to carry out composite analyses of mean monthly anomalies (with regard to 1980–2010) to describe the general situation during flood events. Then, we investigated the source of moisture triggering floods at a daily scale. To this end, we compute the vertically integrated water vapour transport (IVT) for the region 0–90∘ N, −100–20∘ E, as suggested by Lavers et al. (2012) (Eq. 1), and plot the wind vector.
where g is the gravitational constant (m s−2), q is the specific humidity (kg kg−1), u and v are the zonal and meridional wind components (m s−1), and p is the pressure (hPa). The IVT (kg m−1s−1) is estimated to be between the sea level pressure and 300 hPa. To account for the rainfall–runoff transformation time in the Duero basin, we computed the averaged IVT over the 10 preceding days to the maximum peak discharge. Moreover, we used the Katalog Der Grosswetterlagen Europas (1881–2004) to identify the predominant circulation pattern associated with each flood (Gestengabe and Werner, 2005). Since this catalogue starts in 1881, we assigned a likely circulation type pattern for floods that took place before 1880 based on the geopotential field from 20CRV3 (Table S2, Fig. S3). Finally, we also used the North Atlantic Oscillation (NAO) index to characterise the regional influence of the North Atlantic atmospheric circulation variability (Hurrell, 1995; Brönnimann et al., 2008) on the historical flood events. The NAO index reflects the difference in anomalies of the sea level pressure between Gibraltar (south-western Iberian Peninsula) and Reykjavik (Iceland) stations, as has been used as a surrogate of temperature and precipitation winter pattern in the Iberian Peninsula (López-Moreno et al., 2011).
4.1 Flood variability at decadal and multi-decadal timescales
Documentary flood descriptions of the Duero River in Zamora can be traced back to the 13th century, although continuous records started in the mid-16th century. At that time, the main configuration of Zamora neighbourhoods, weirs, mills and bridges was similar to those of the late 19th century and early 20th century (Fig. 2a, b). This long-standing urban configuration allows a precise analysis of the sites and flooded areas as well as a qualitative reference of flood magnitudes over the last millennia. The morphological changes in river channel and banks are minor and mostly related to fluvial islands and lateral bar stability by vegetation mainly over the last 30 years. For instance, the historical and present orthophotos show stabilisation of a lateral bar next to the Cabañales mills, upstream of the Stone Bridge. The fluvial banks have remained at a similar position according to the historical maps, at least over the last 300 years (Fig. 2a, b).
The documentary flood dataset comprises 69 flood entries over the period 1250–1871 CE. These entries include mainly floods within catastrophic and extraordinary categories as they were registered due to bank overflow and damages in orchards, infrastructures and houses. The same analysis expanded towards the gauged period (since 1920) provides a flow discharge higher than 1900 m3 s−1, leading to similar inundation extent of reported overflows. The moving average analysis of temporal distribution using a 31-year filter identifies flood-rich periods at 1600–1640, 1730–1750, 1770–1790 and 1880–1910 (Fig. 3). Over the 20th century, floods over 1900 m3 s−1 increased their frequency in the period 1935–1966. Later, some large scattered floods occurred in 1978–1979 and 2001.
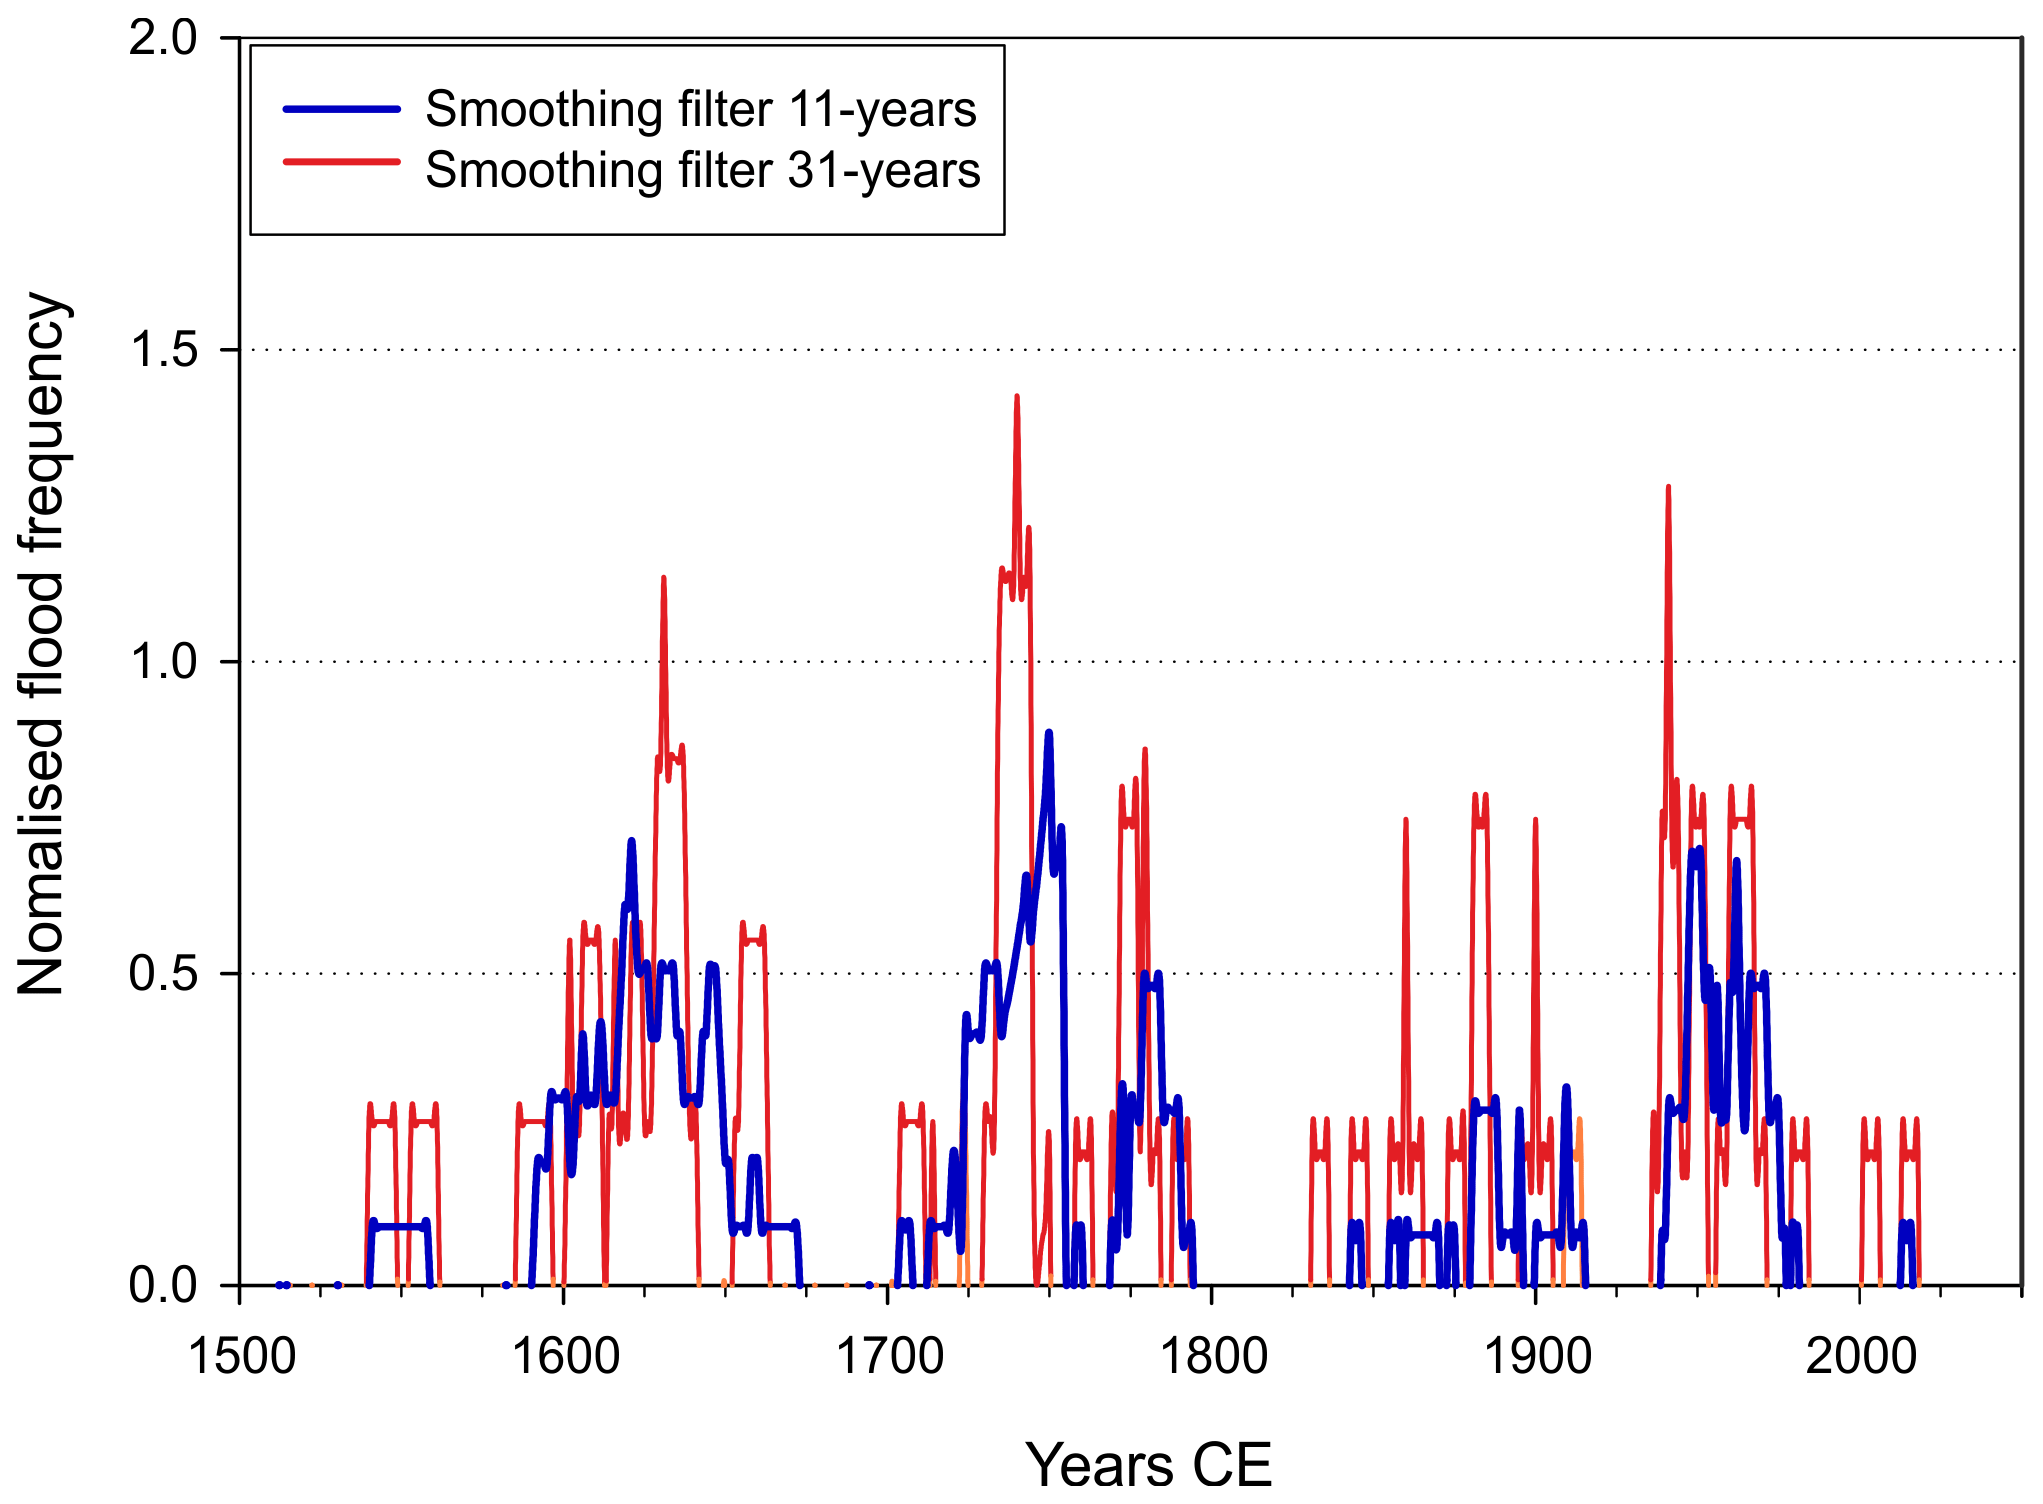
Figure 3Normalised flood frequency distribution of the documented number of floods (only catastrophic + extraordinary categories) of the Duero River in Zamora using moving average, taking 11-year and 31-year data intervals. The anomalies for 1500–1880 CE were estimated from documentary records and after 1980 include gauged floods (staff gauge and continuous gauge) with discharge higher than 1900 m3 s−1.
Large floods were produced mainly during the winter period (DJF; 66 %), followed by spring (MAM; 28 %), autumn (SON; 4 %) and summer (JJA; 2 %). This seasonal distribution was maintained in the different flood-rich periods established, with over 50 % of floods concentrated in winter, except for the period 1770–1790, where the highest number of floods occurred in spring. The highest concentration of severe winter events occurred during the 1630s, 1730s and 1960s, with a lack of reported large floods in the second half of the 17th century and beginning of the 19th century. The analysis of flood causes points to persistent winter rain episodes, occasionally enhanced by snowmelt.
Table 1Reconstructed discharges of the major historical floods in Zamora. CAT: catastrophic flood; EXT: extraordinary flood; ORD: ordinary flood.
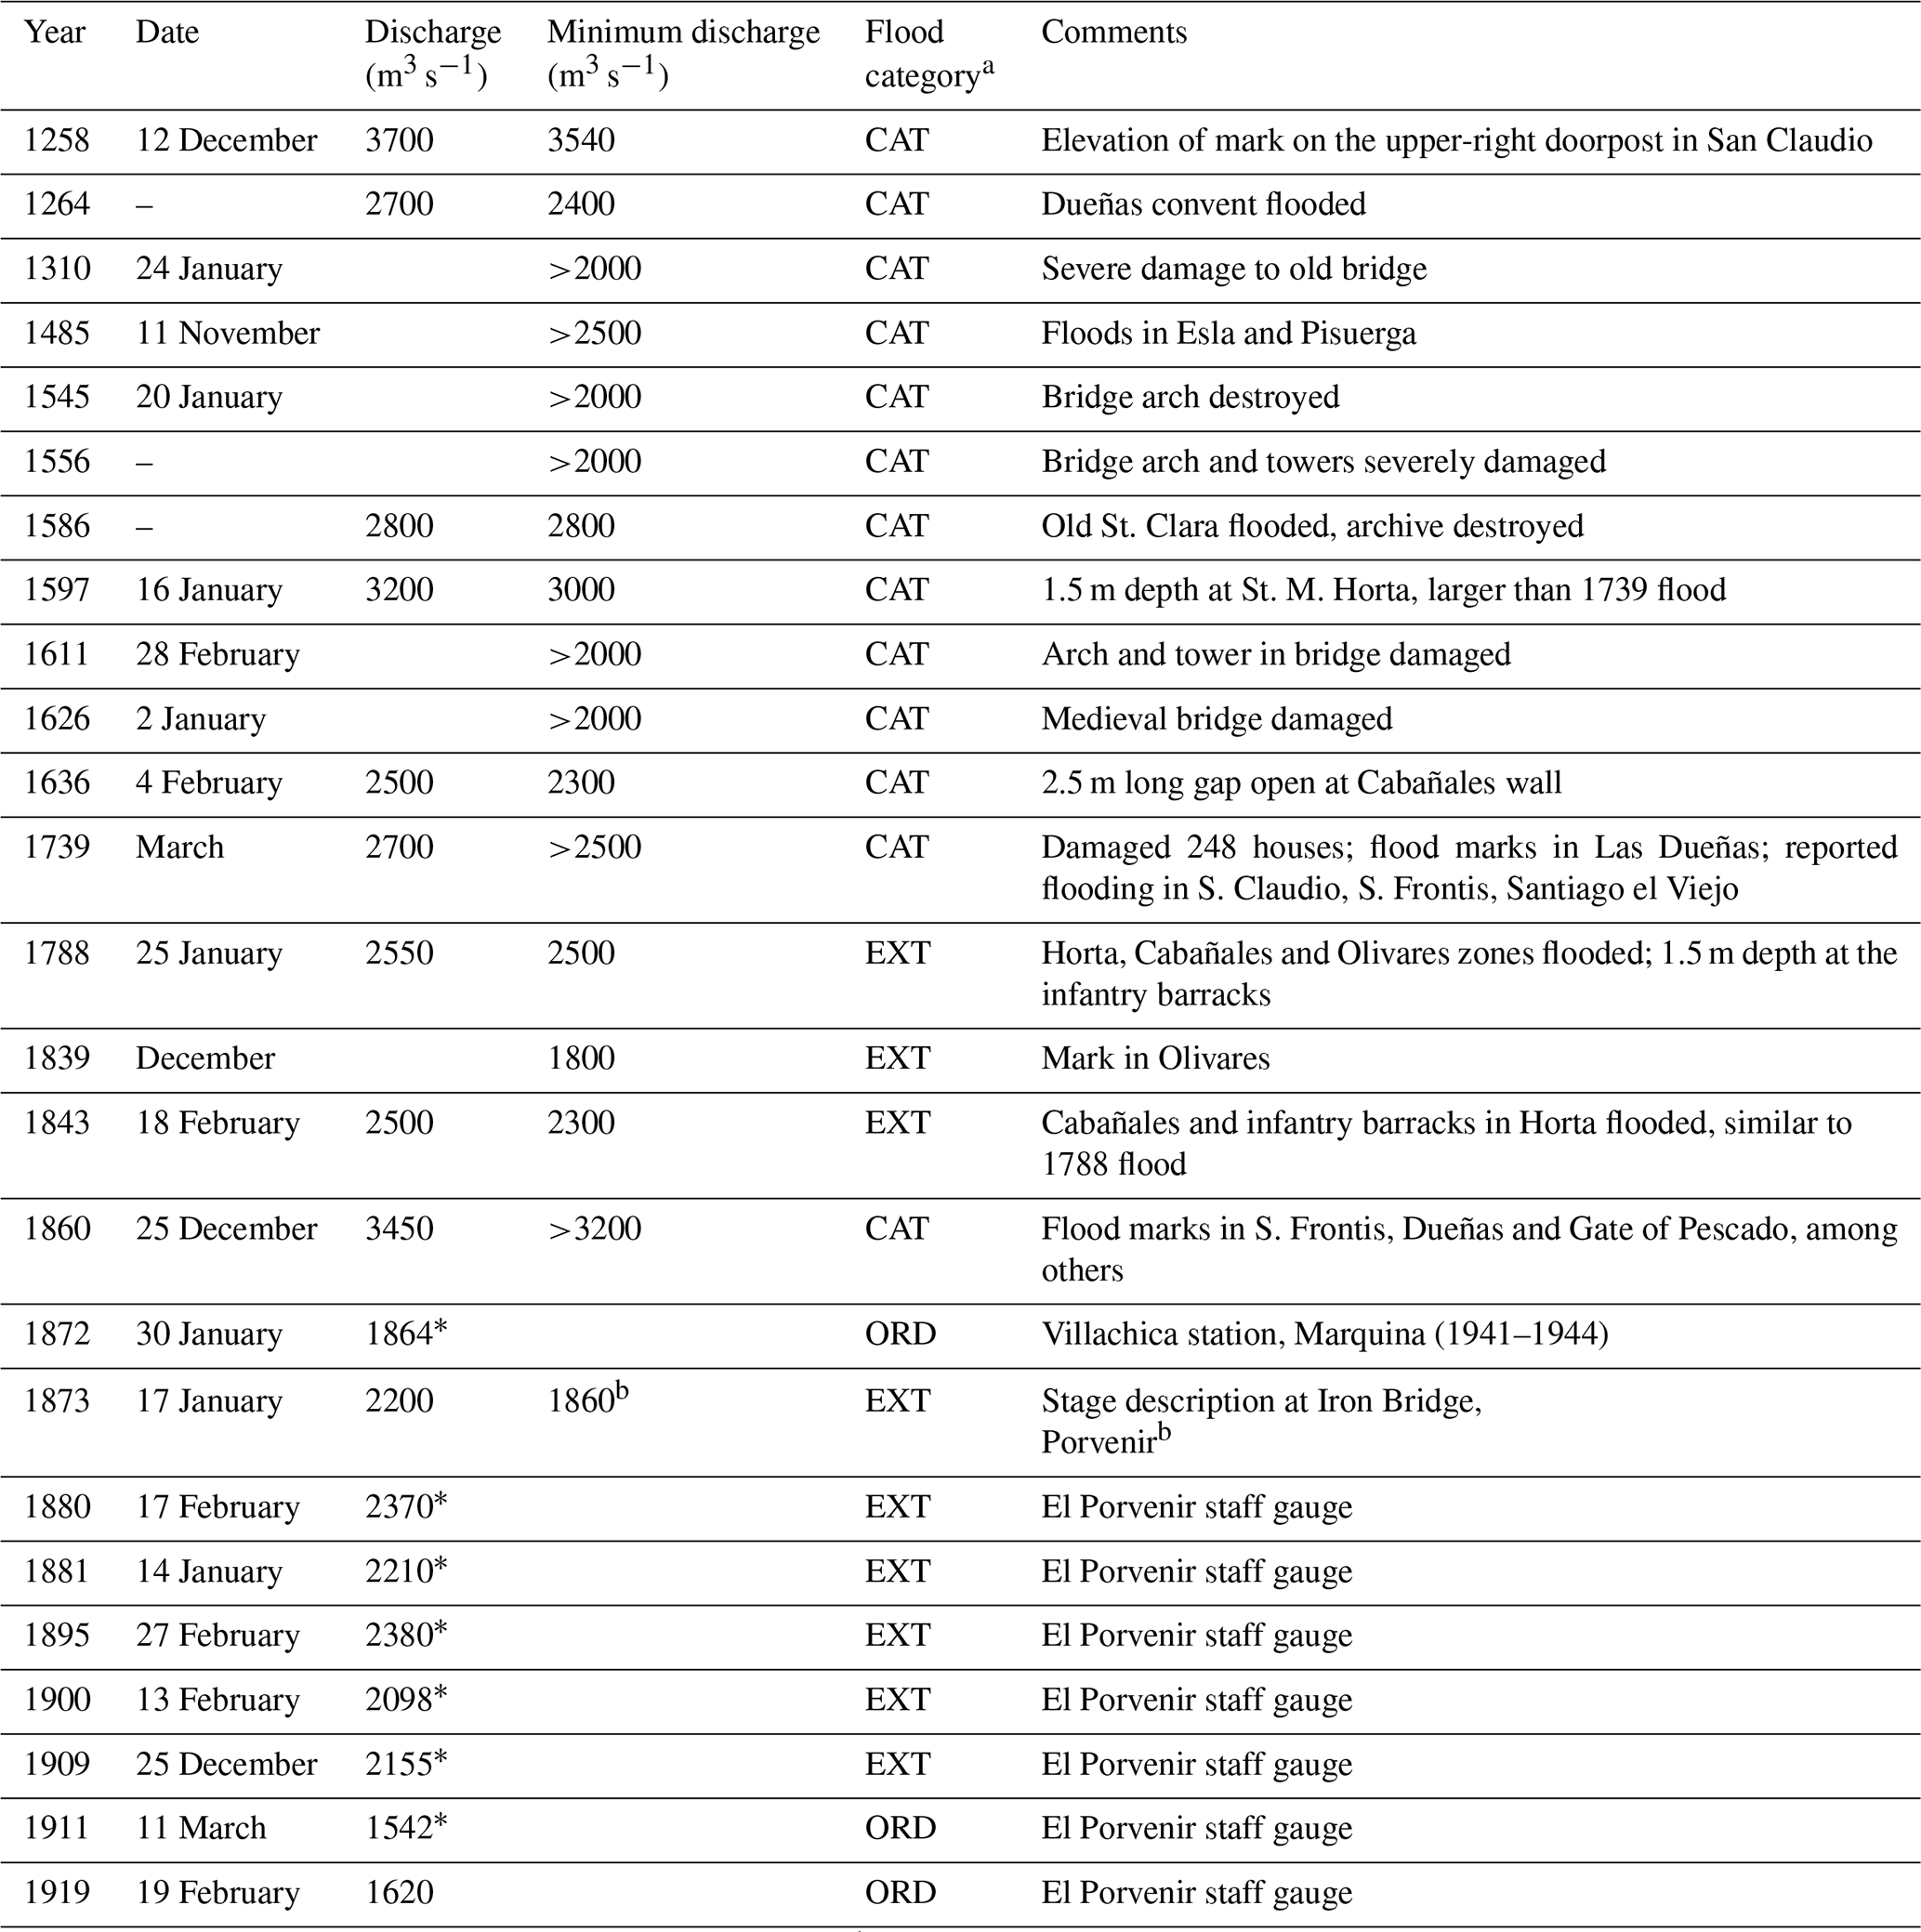
a Flood category according to Barriendos and Martín-Vide (1998) classification. b Discharge calculated from observations at El Porvenir (Marquina, 1941–1944). * Historic discharges estimated at the scale of El Porvenir since 1880.
4.2 Composite series of flood discharges
4.2.1 Historical flood peak levels and discharge determination
Over the last 500 years, the largest historical floods occurred in 1597, 1739 and 1860, exceeding 2800 m3 s−1. Previous large floods producing severe damage occurred in 1258, 1264, 1310, 1485 and 1586 with references to high flood levels and moderate damage. For instance, in San Claudio church an inscription at the arch (Fig. 4f) refers to times of “bad years” during the Kingdom of Alfonso X dated at 1259 CE. Marquina (1941–1944) relates that inscription with a blurred mark located at the base of the arch, on the upper-right doorpost (Fig. 4f), that is attributed to the 30 December 1258 flood (628.7 m a.s.l.) matching a discharge of 3700 m3 s−1. During the 1310 flood the old bridge (early medieval) was destroyed, although no references to flood marks indicating flood stage were found.
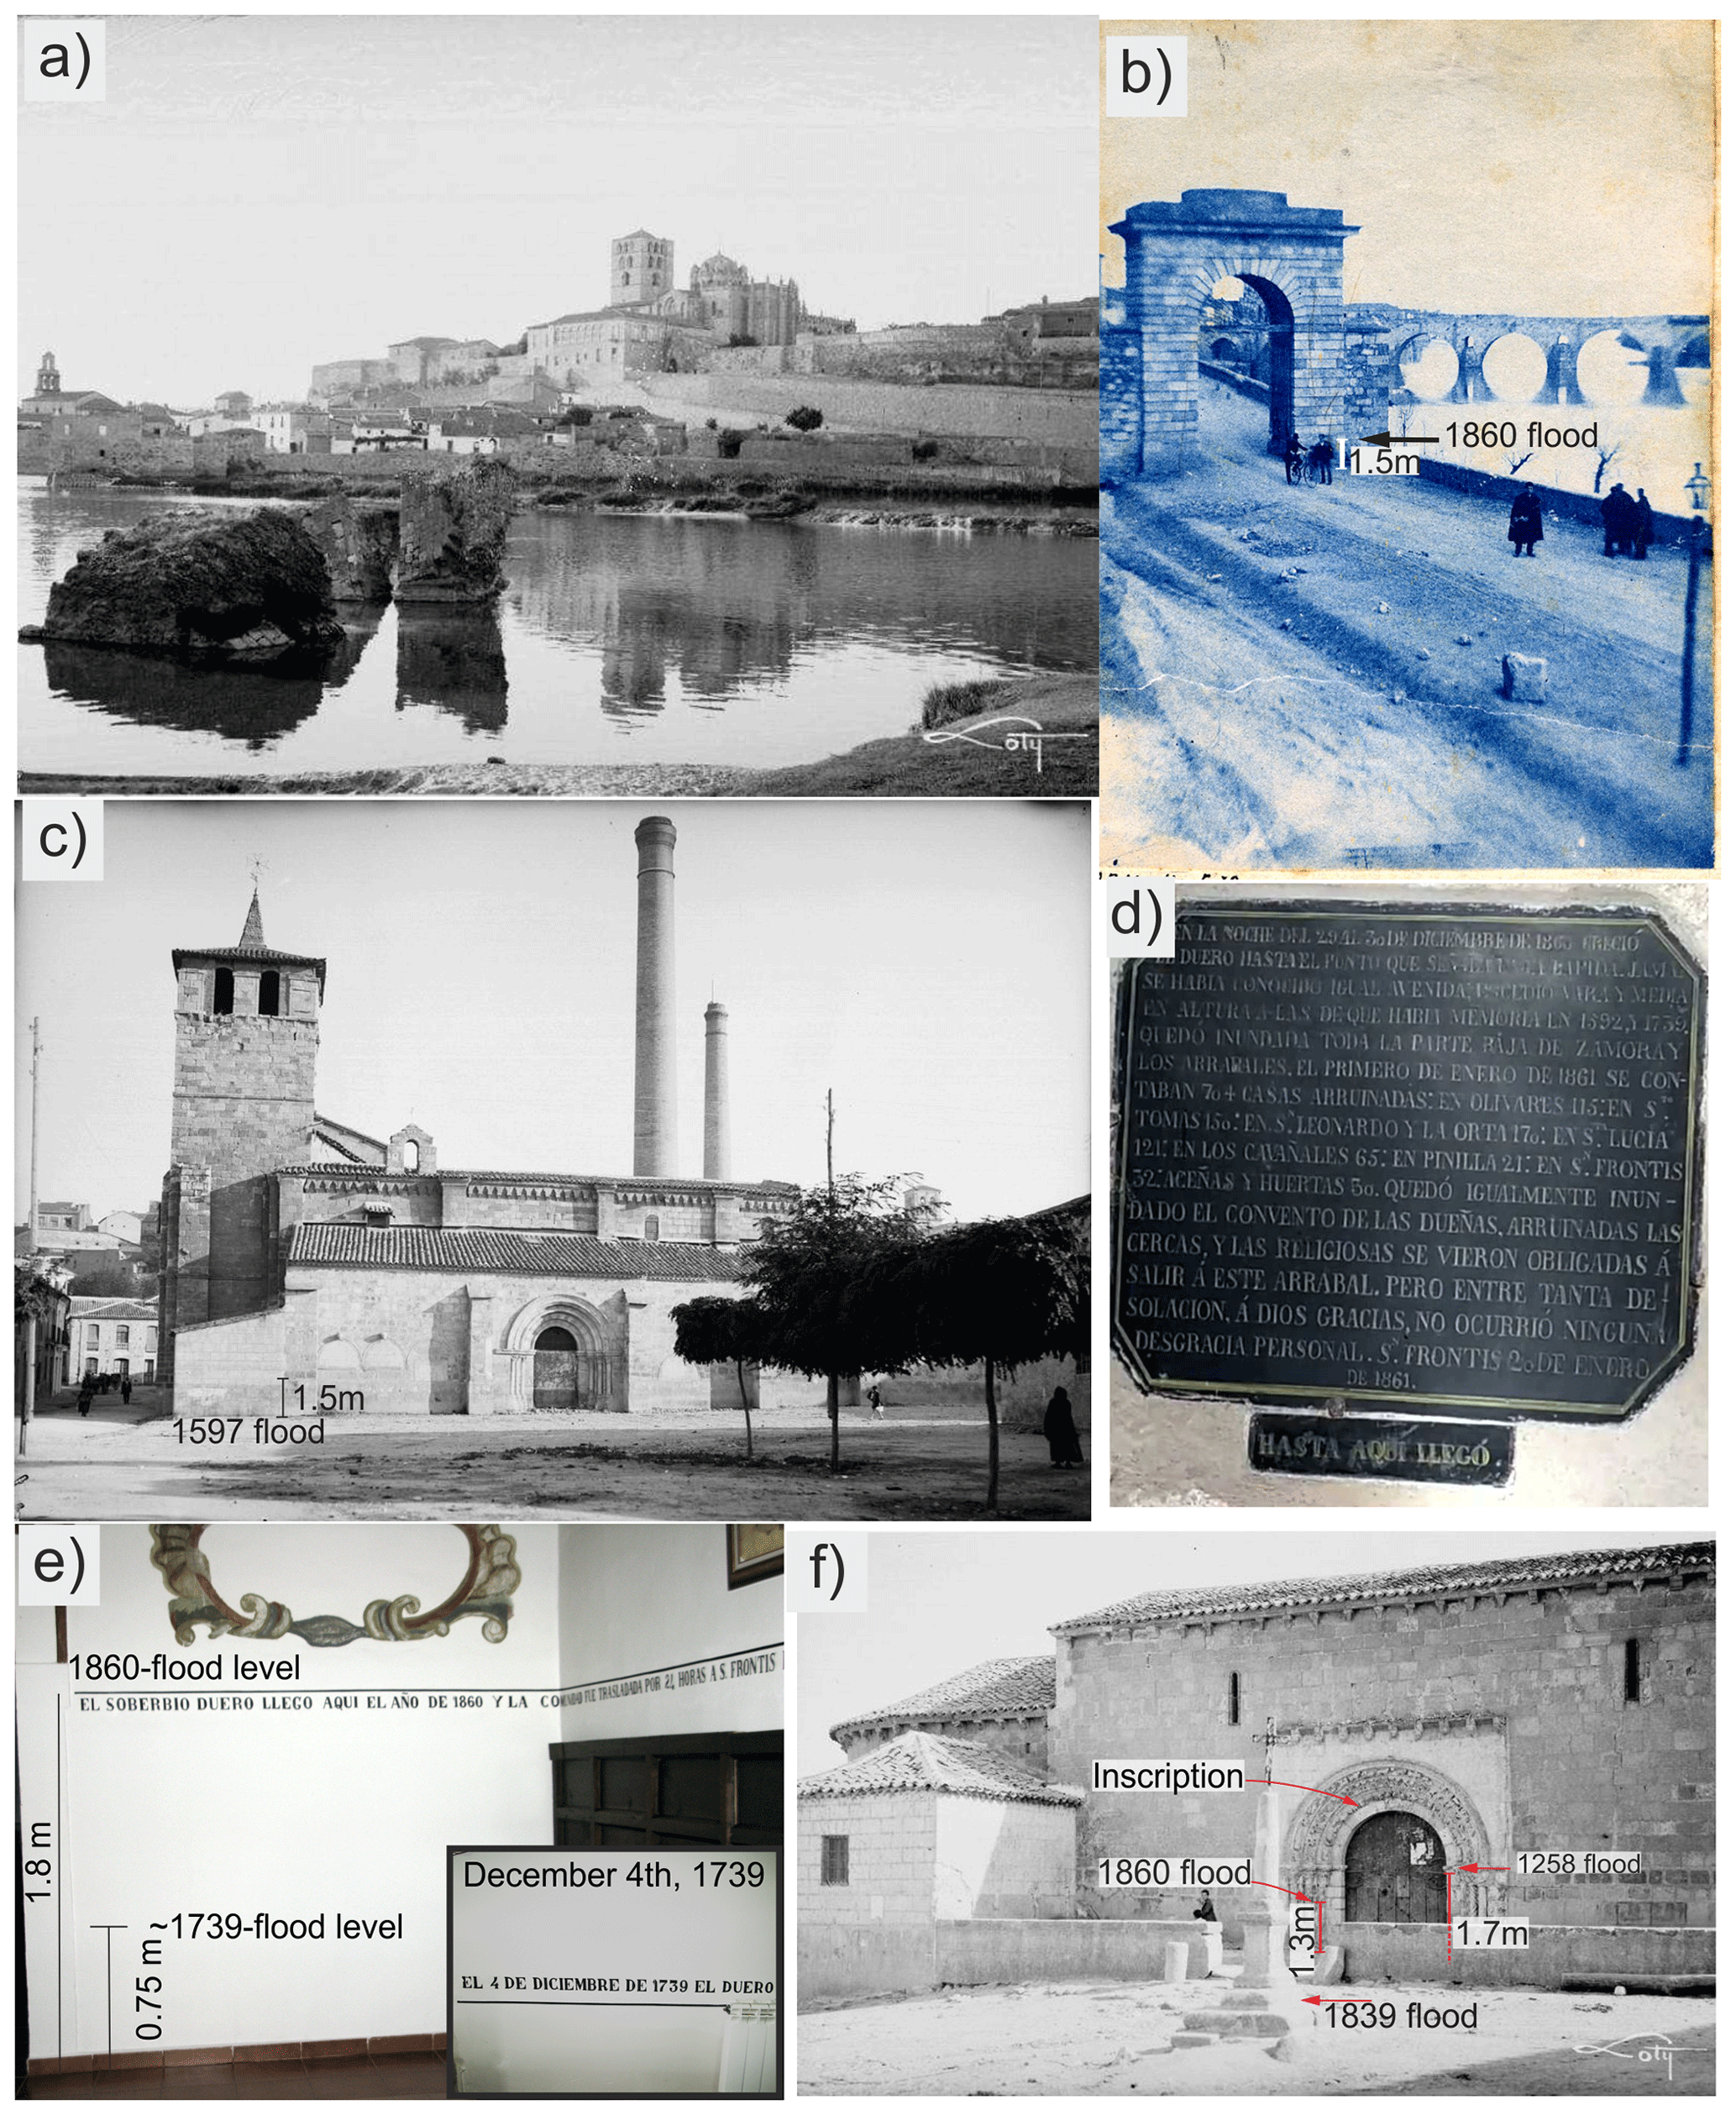
Figure 4Photos illustrating flood epigraphic marks and sites referred to in written flood reports. (a) View towards the cathedral (centre uphill) with remnants of the old bridge destroyed by a flood in 1310. At the left opposite river margin are the Olivares mills and the tower of the San Claudio church (photo by António Passaporte, 1927–1936; source: Loty Archive-02471, historic heritage photo, http://www.mcu.es/fototeca_patrimonio, last access: 24 November 2021). (b) View of the Gate of Pescado, where an epigraphic mark was 1.5 m from the gate base (source: Historical Provincial Archive). (c) View of Santa Maria de la Horta reached by floods at least in 1597 and 1788 (photo by António Passaporte, 1927–1936; source: Loty Archive-02479, historic heritage photo, http://www.mcu.es/fototeca_patrimonio, last access: 24 November 2021). (d) Epigraphic mark of the 1860 flood in San Frontis church. The description states that the 1860 flood was the largest of the last 3 centuries. (e) Epigraphic flood mark of the 1860 flood in Las Dueñas convent at the refectory of the convent: “The magnificent Duero River reached here in 1860, and the community had moved for 24 hours to San Frontis”. Inset: epigraphic mark of the 1739 flood in Las Dueñas convent in the same dining room but ca. 1 m lower than the 1860 mark. (f) View of San Claudio church between 1927 and 1936. The inscription in the arc refers to the “bad years of 1258” contemporaneous with the one at the upper doorpost pointing to a flood (Marquina, 1949a). At the pedestal of the cross was an inscription to the 1839 flood, which disappeared after restoration work (photo by António Passaporte; source: Loty Archive-02464, historic heritage photo http://www.mcu.es/fototeca_patrimonio, last access: 24 November 2021).
The 1860 flood is the largest, at least over the last 500 years, with evidence of flood stage on three epigraphic marks and five precise reports from sites at both sides of the Duero River (Fig. 4b, d, e, f). The flood peak occurred on the night of 29–30 December, damaging 441 buildings in the city and another 263 in the suburbs. Fortunately, telegraphs received in the evening from cities upstream alerted of the flood severity, and people living in risk areas were evacuated. In the village of Peleagonzalo (30 km upstream; Fig. 1c) 154 houses out of 160 were destroyed and later rebuilt in 1862 on a nearby hill. Downstream of Zamora's medieval bridge, the most reliable flood evidence is found in Dueñas Convent, San Claudio, Olivares water mill and Puerta del Pescado, all pointing to a water stage of ca. 628.5 m a.s.l. (Fig. 5a, sites 1, 4, 3 and 9). Upstream of the medieval bridge, flood elevation was 628.9 m a.s.l. at Santa Lucia (site 10) and at Iron Bridge (Zamora-Salamanca road, site 16), reaching San Leonardo and La Plata Street (site 13). The epigraphic flood mark in San Frontis (627.8 m a.s.l.; site 2; Fig. 4d) is slightly below flood elevation reached in the Olivares flood stage references at the opposite river bank. These 1860 flood high water marks fit a water surface elevation generated by the two-dimensional model of 3450 m3 s−1 (±100 m3 s−1).
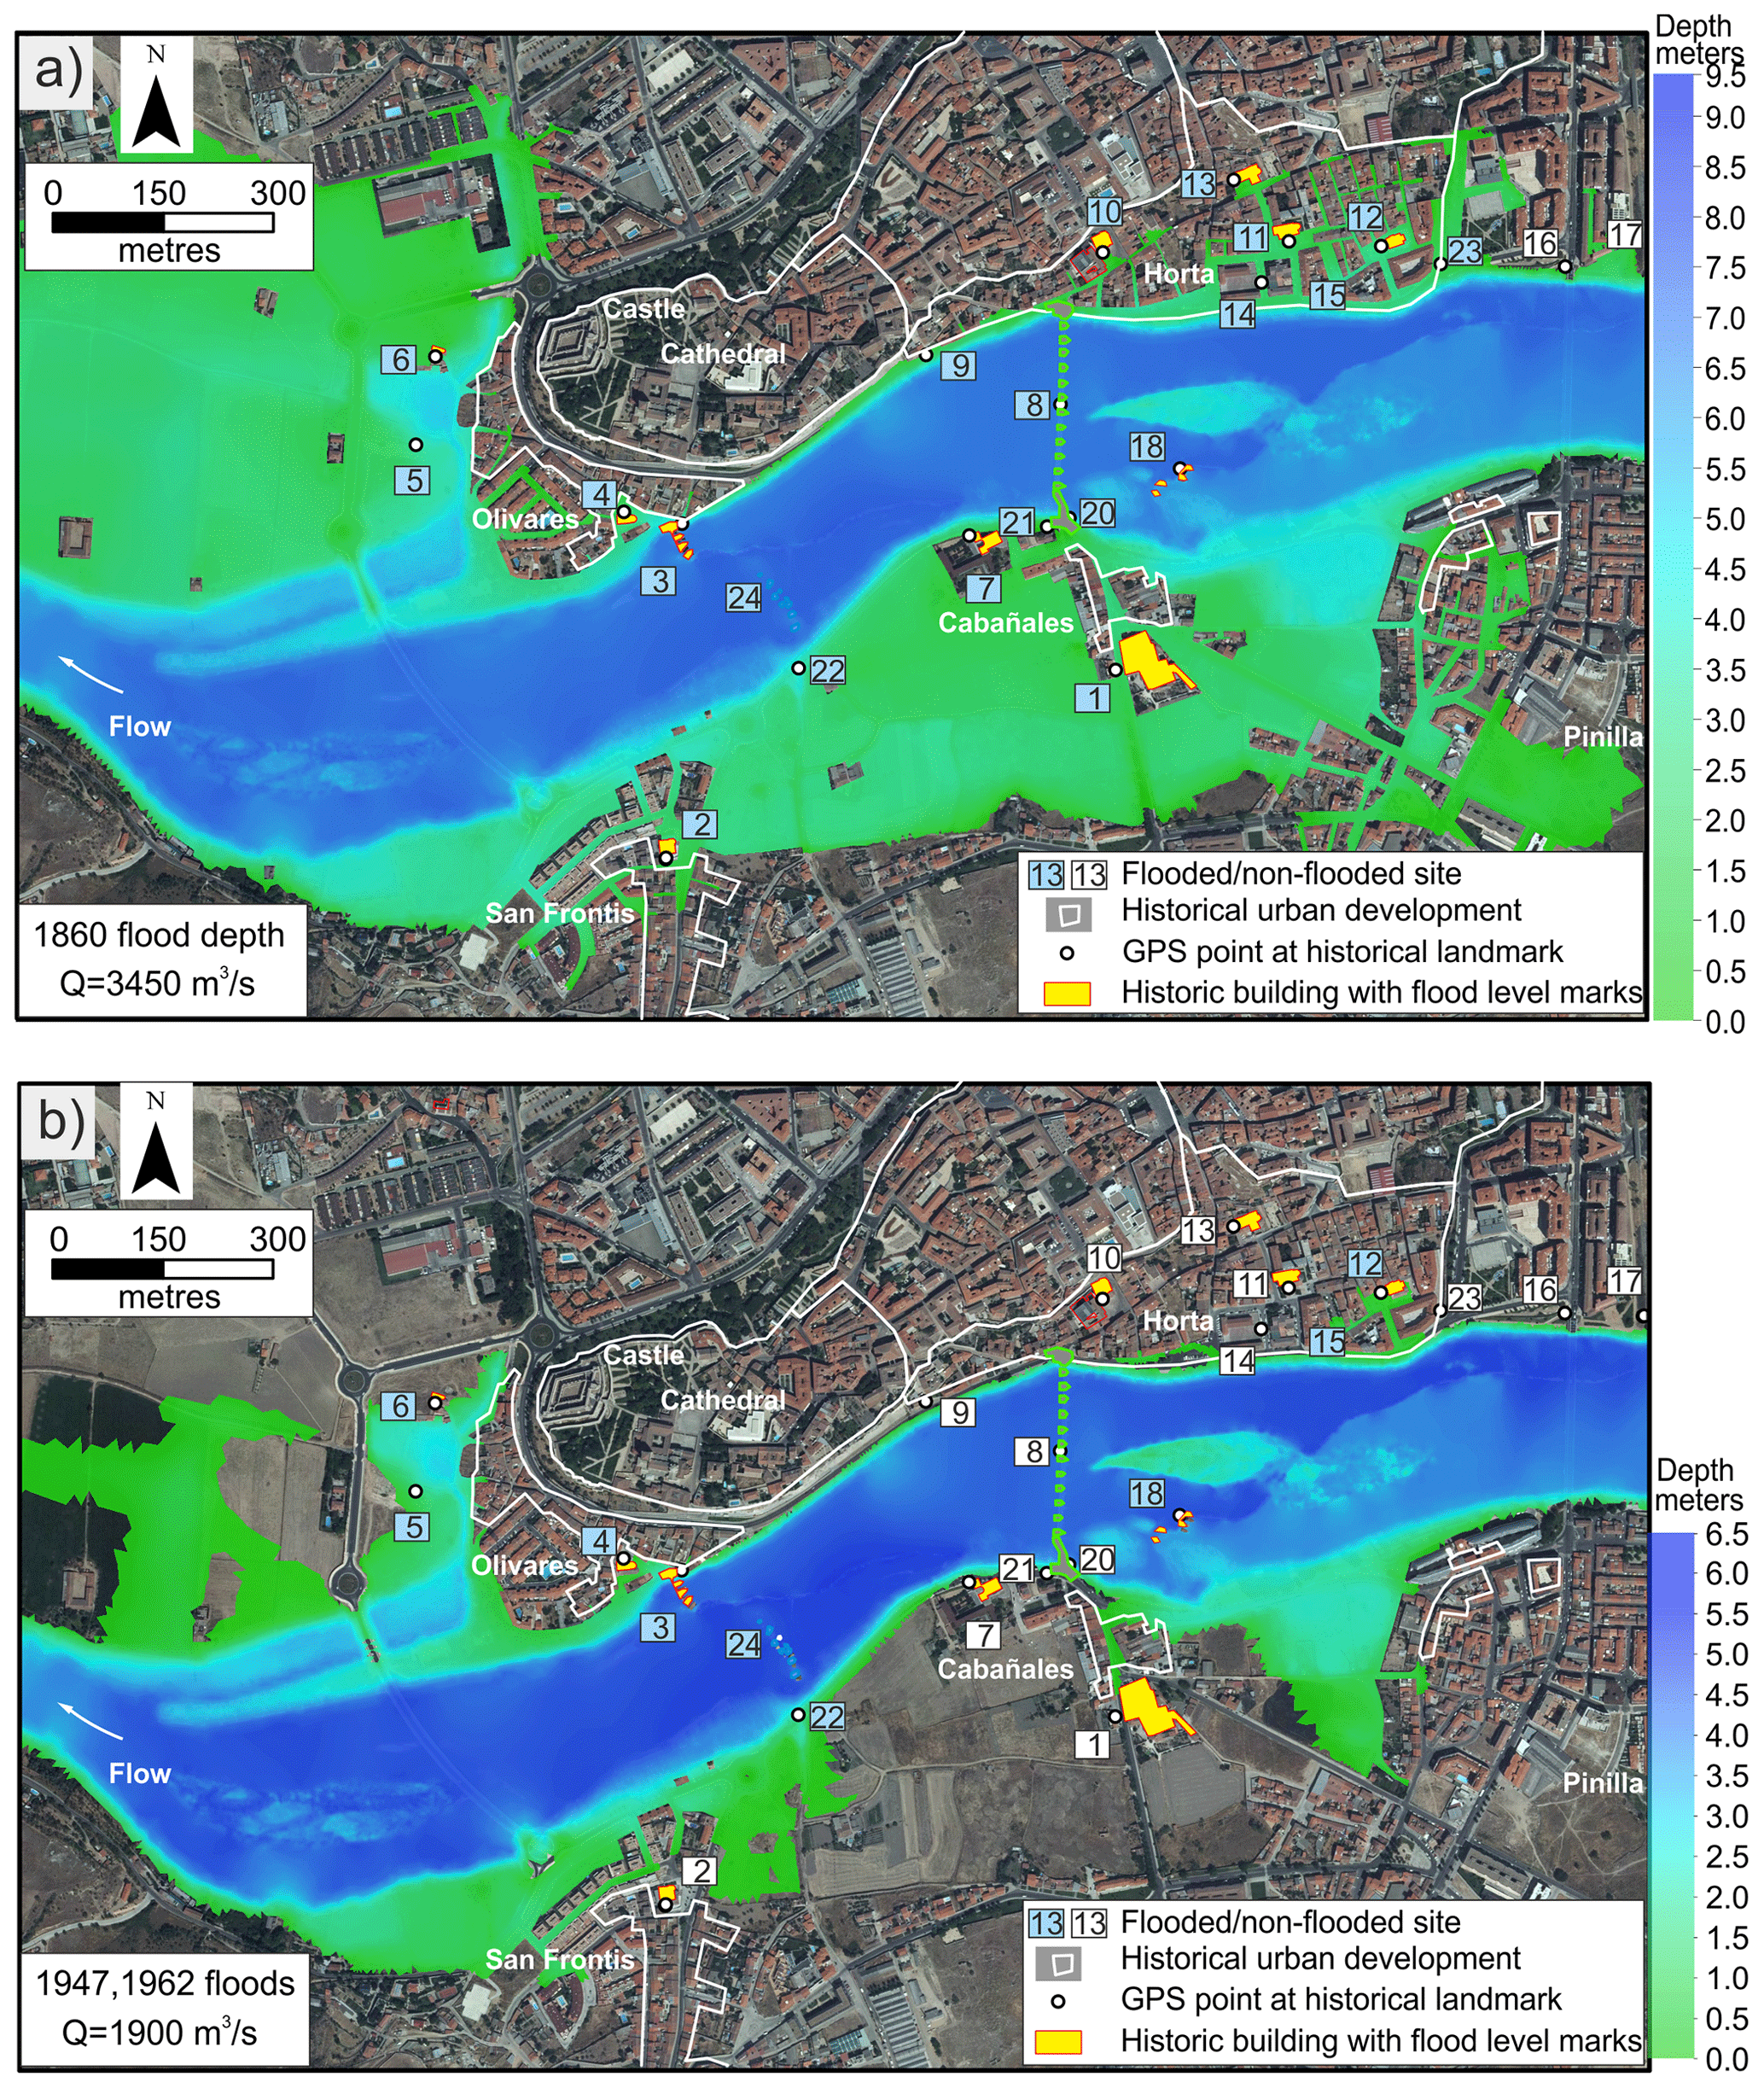
Figure 5Two-dimensional hydraulic model results. (a) Flood extension and depth for 3450 m3 s−1 estimated for the 1860 flood and flood marks and descriptions of flooded sites (number in blue square). (b) Flood extension and depth for a discharge of 1900 m3 s−1. Legend with names of flood marks and flooded sites in Fig. 2. Elevation (metres above sea level) reached by 1860 flood in Table S1. Aerial orthophoto from the Spanish National Geographic Institute, IGN (https://www.ign.es, last access: 24 November 2021).
Several documentary descriptions and epigraphic marks allow comparison of the 1860 flood with previous flooding. For instance, in the Las Dueñas convent the 1860 flood epigraphic mark in the refectory is 1.80 m above floor level, whereas the 1739 flood is 0.75 m, meaning a water stage difference of 1.05 m (Fig. 4e). The San Frontis flood mark also refers to the 1860 flood as the largest compared to the previous 1597 and 1739 floods, although the description at the plate mentions a “1592 flood”, which seems to be a transcription error as noted by Marquina (1941–1944). The 1739 flood marks at Las Dueñas (627.45 m a.s.l.) and two minimum flood stages at Santiago El Viejo (626.6 m a.s.l.) and San Frontis-Cuesta de San Jerónimo (626.5 m a.s.l.) are associated with a discharge of 2700 m3 s−1. These flood stages are lower than the 1597 flood reference reported at St. Maria de la Horta (628.35 m a.s.l.; Fig. 4c) and the minimum flood stages at Los Descalzos (628.2 m a.s.l.) and San Juan de las Monjas (628.3 m a.s.l.). In the medieval bridge the spillway holes were coved by flood waters. The 1597 flood evidence matches a stage associated with a discharge of 3200 m3 s−1, meaning the second-largest over the last 500 years (Fig. 6).
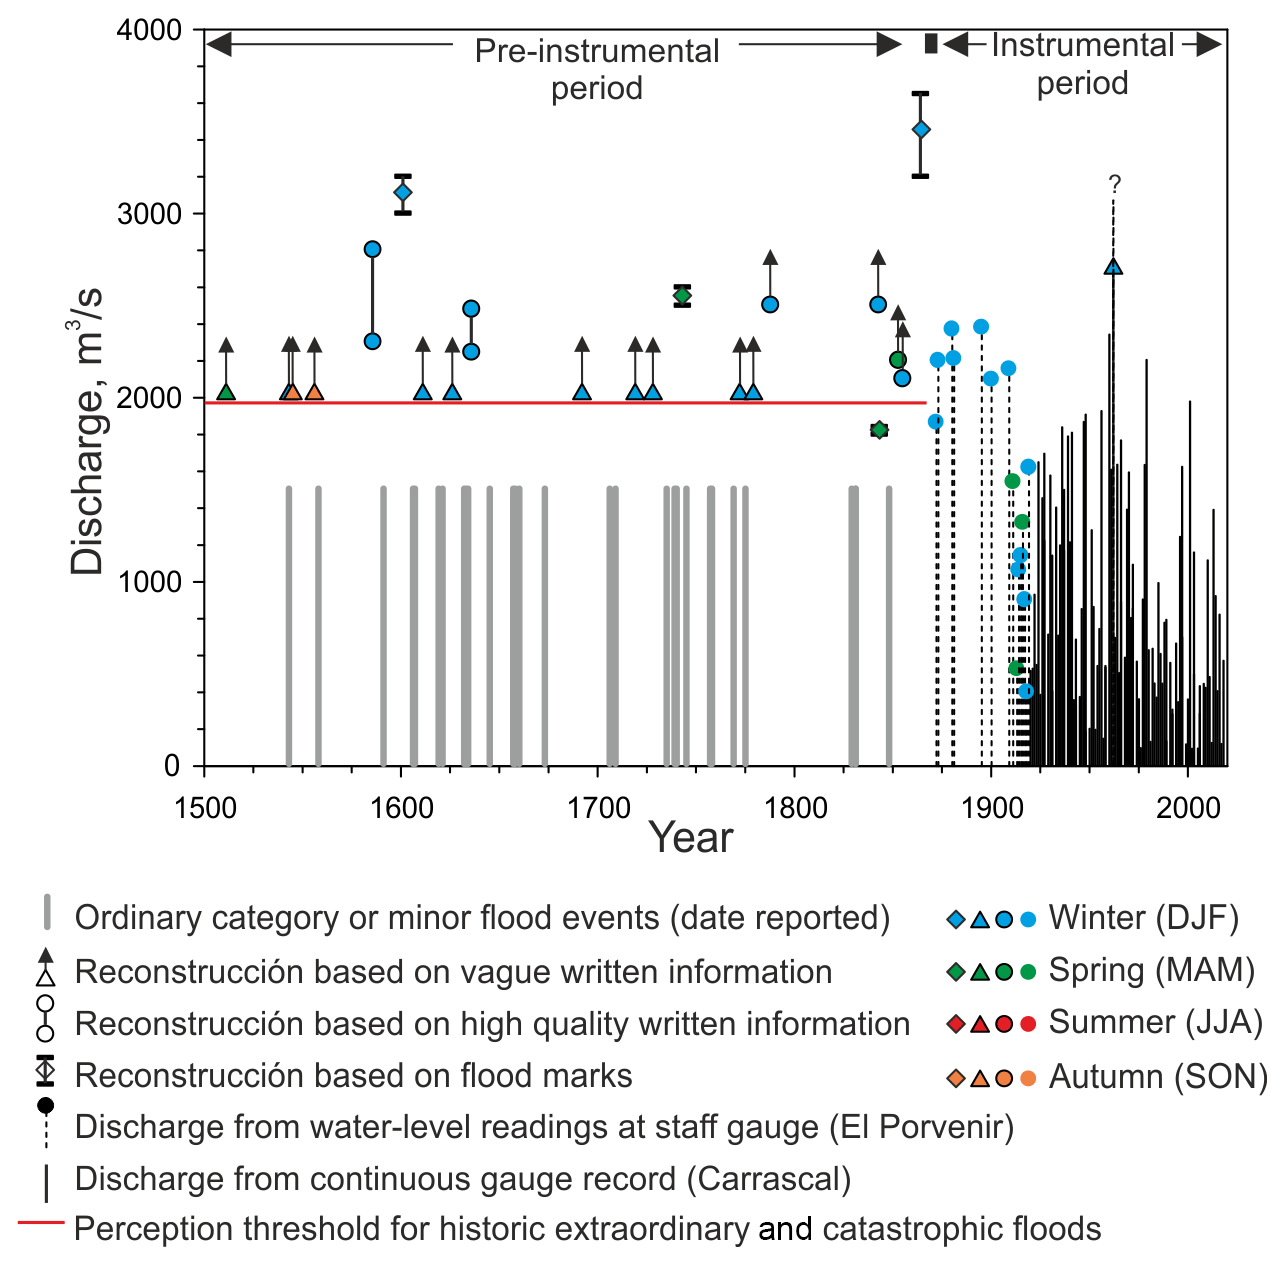
Figure 6The 1500–2018 Duero River flood discharges based on documentary (historic) water-level readings on staff gauges (El Porvenir) and continuous gauging (El Carrascal). Documentary floods with damaging overflows (catastrophic and extraordinary categories) exceeded a threshold discharge of 1900 m3 s−1. Discharge reconstruction was performed based on different description details (from vague to high-quality) and flow depth reported at specific flooded sites and with epigraphic marks (types described in legend). Reported ordinary floods were estimated below the discharge threshold. The flood season is indicated by colours as in the legend.
A second-rank flooding corresponds to peak magnitudes exceeding 2200 m3 s−1 that commonly produced overbank flow and damages in the Horta and Olivares suburbs (Fig. 6). In this second magnitude rank, floods occurred in 1586, 1636, 1788, 1843, 1853, 1880, 1881, 1895 and 1909 (2155 m3 s−1). The 1586 event flooded the old Santa Clara convent (Fig. 5, site 5) and destroyed the archive that, assuming a minimum 0.5–1 m water depth, gives discharges between 2600–3000 m3 s−1. These flood magnitudes have caused damages in piers and towers of the Stone Bridge (e.g. 1636, 1880). The 1880 flood caused such major damages to the bridge that it was reformed in the early 20th century, reducing the number of arches from 22 to 15 and enlarging the lightening arches or spillways (Rodríguez-Méndez et al., 2012). As a reference, these floods cover the bridge piers and spilled water through the lightening arches. In this magnitude rank, the flood cluster occurring during the late 19th century recorded at the Porvenir gauge (Fig. 6) is worthy of mention.
A third set of documented floods was reported to produce flooding in low city neighbourhoods and orchards surrounding convents and monasteries but without any description allowing any sort of discharge estimation. Modern flood analogues producing occasional inundation of low city areas (Cabañales and Olivares) and minor disruption of traffic activity are associated with discharges exceeding 1900 m3 s−1 (Figs. 5b, 7).
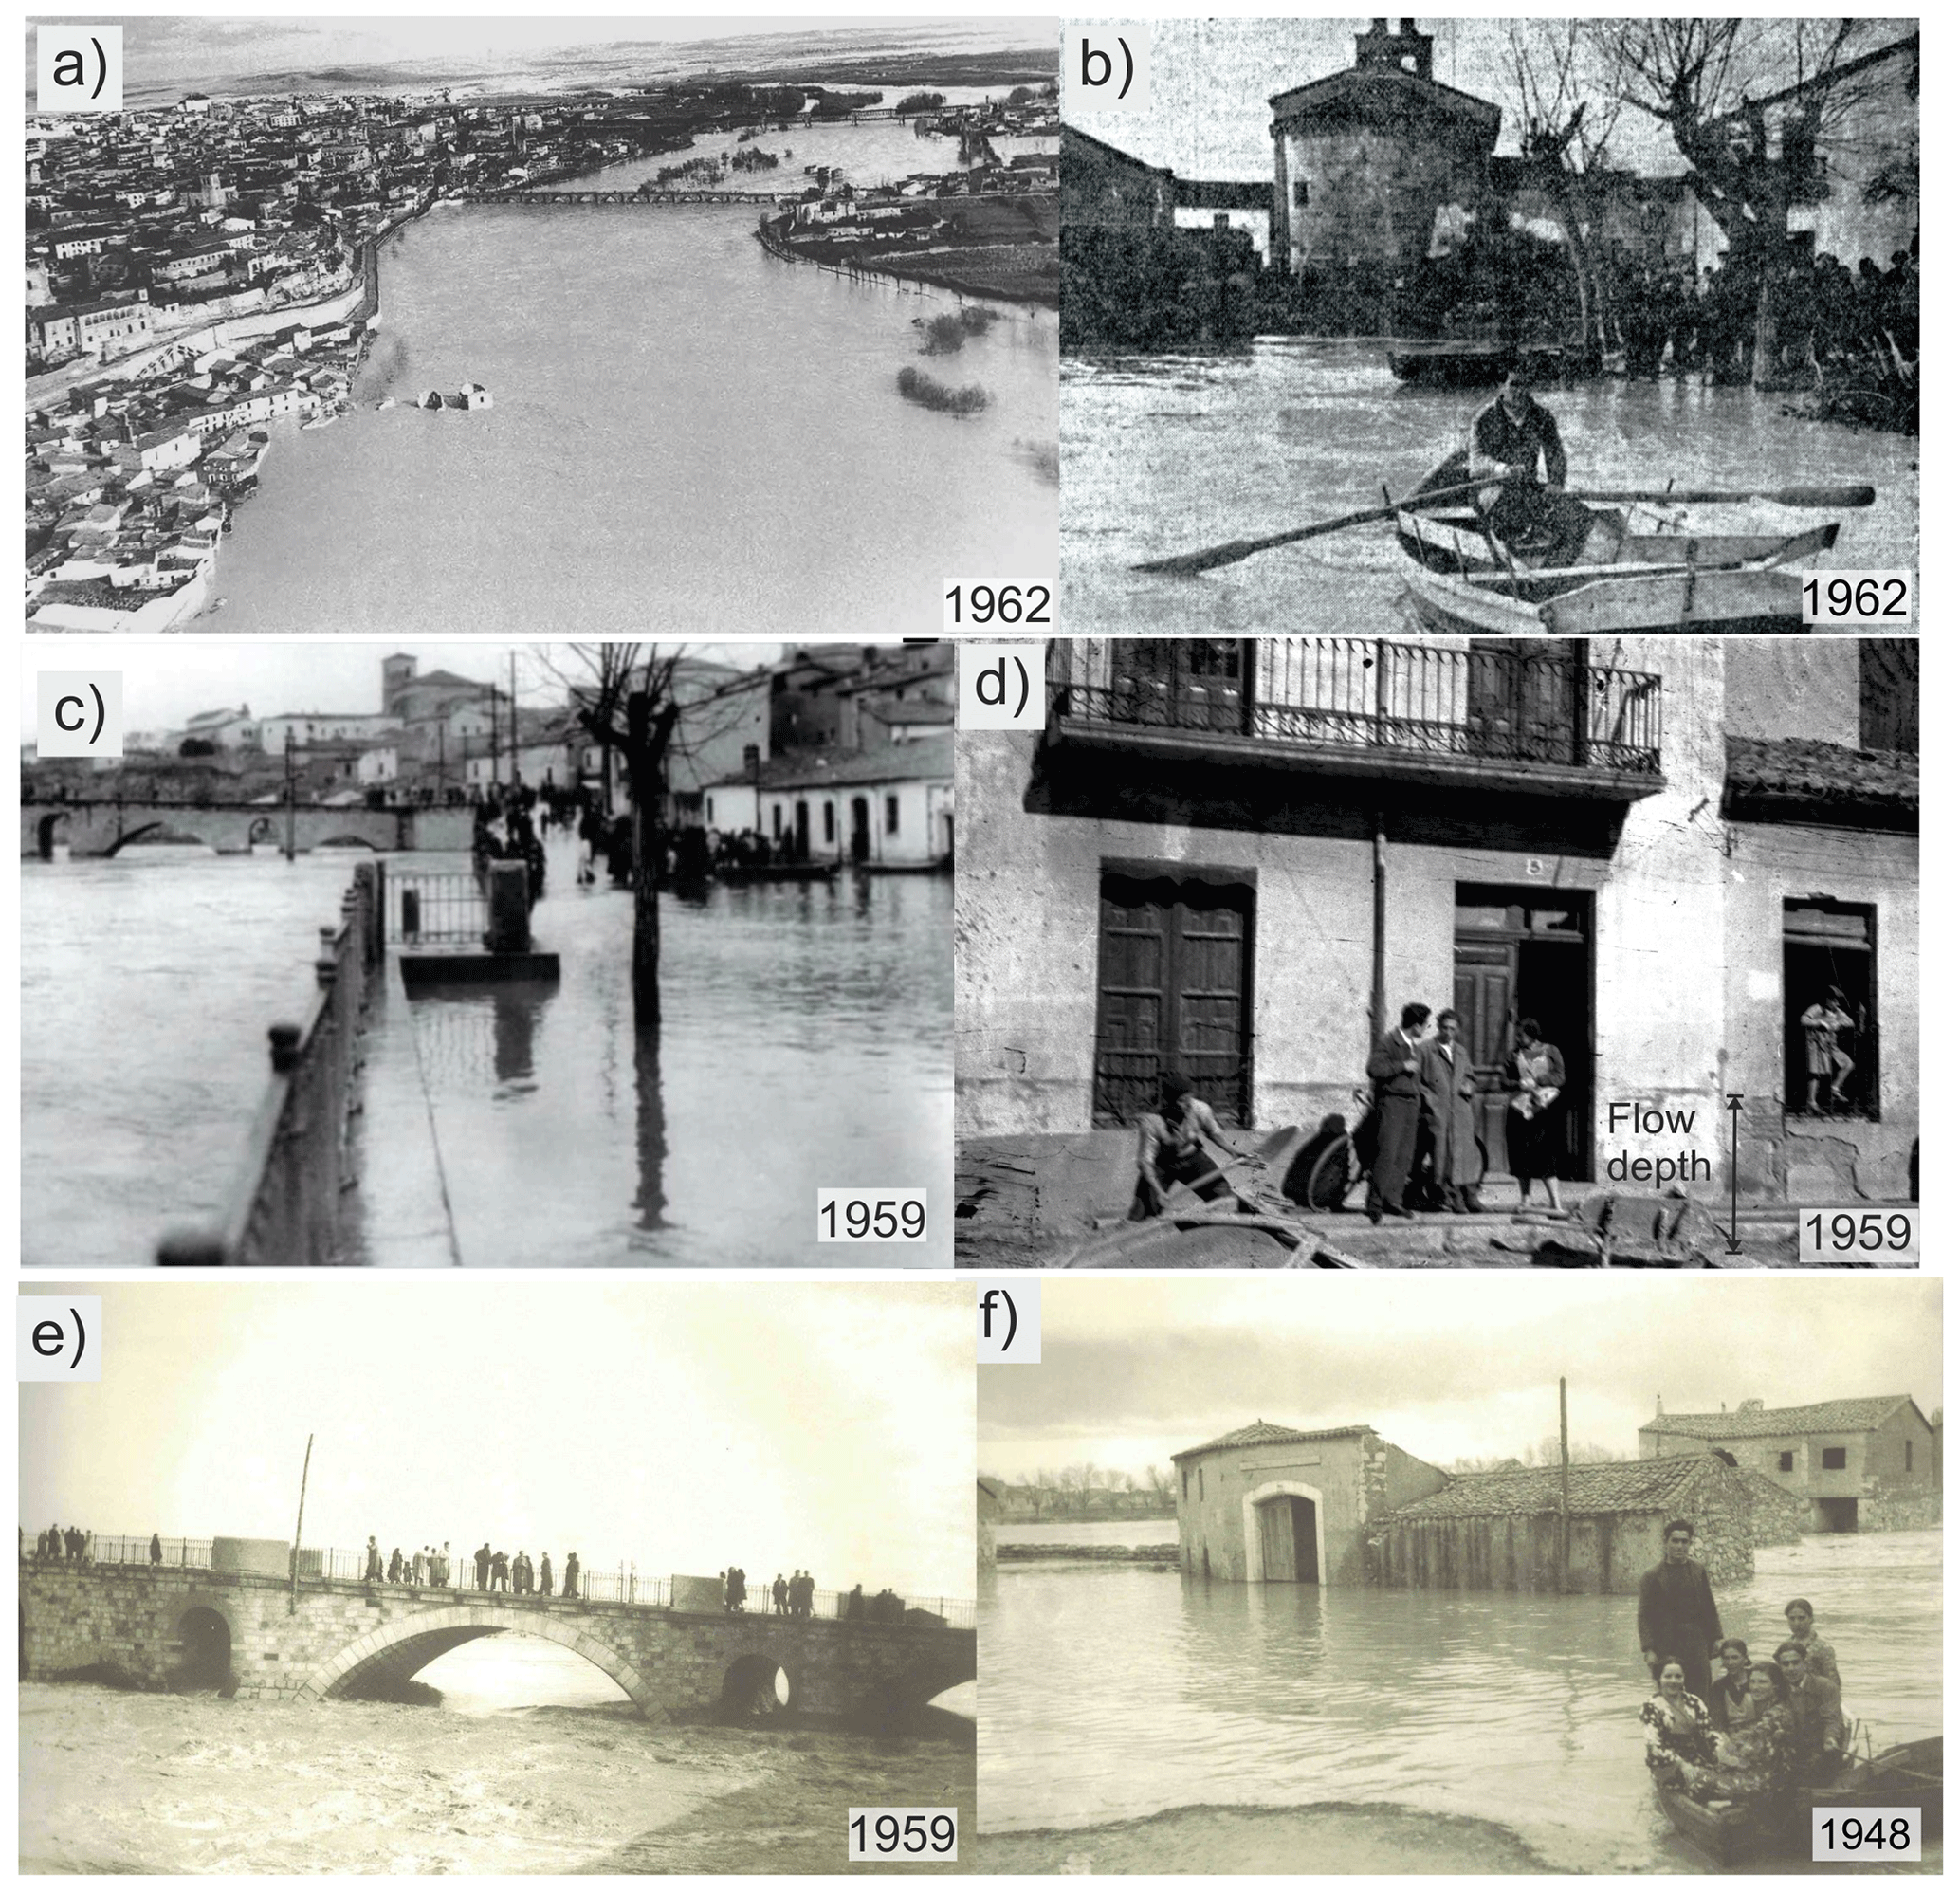
Figure 7The city of Zamora during flood episodes. (a) Upstream view of the Duero river during the 1962 flood. On the left, the submerged buildings are the Olivares mill and the San Claudio church (source: Archivo Gerardo Pastor Olmedo, vol. III, La Historia Contemporánea). (b) A detailed view of the 1962 flood at San Claudio (background) published by the newspaper Imperio (5 January 1962) (available at https://prensahistorica.mcu.es, last access: 24 November 2021). (c) Horta suburb (Mengue Avenue) and Stone Bridge (background) during the 1959 flood (source: Memoria gráfica de Zamora). (d) Flood level reached by the 1959 flood at La Horta (source: Memoria gráfica de Zamora). (e) The Stone Bridge during the 1959 flood with the water flowing through the bridge spillways (source: Memoria gráfica de Zamora). (f) The Olivares suburb during the 1948 flood (source: Memoria gráfica de Zamora; La Opinión-El Correo de Zamora, 2000)
4.2.2 Modern flood records
In the Carrascal station daily flows exceeding 2200 m3 s−1 occurred in 1959–1960, 1961–1962, 1979 and 2001 (2140 m3 s−1) (Table S3). Intriguingly, the January 1962 flood recorded a daily discharge of 3071 m3 s−1 that, transformed to peak discharge, results in 3200–3300 m3 s−1. Published photographs and descriptions in newspapers (Fig. 7a, b) show ca. 1.5 m water depths in the Horta neighbourhood (Mengue Avenue), ca. 1.7 m from the Cabañales mill and in the lower Cabañales neighbourhood (Table S1). The documented flood stages agree with a discharge of ca. 1900–2000 m3 s−1 that suggests operative problems of the gauge station during this flood. The seasonal hydrograph shows the January 1962 flood as the second peak of a sequence of five maxima that occurred from December 1961 to April 1962 (Fig. 8d). At the Villachica and Toro gauge stations (30 km upstream) this flood recorded daily discharges of 1729 (4 January, 1 d earlier) and 1531 m3 s−1 (5 January), respectively. A linear regression was fitted to daily discharges recorded at the Carrascal and Villachica stations over the period December 1959–May 1960 (the largest peak in Carrascal of 2343 m3 s−1) and for the Carrascal and the Toro stations for the 1959–1960 and 1978–1979 periods. The calculated daily discharge for the 1962 flood at the Carrascal station varied between 2100 and 1940 m3 s−1, which agrees with the estimated peak based on the photographic flow stage evidence.
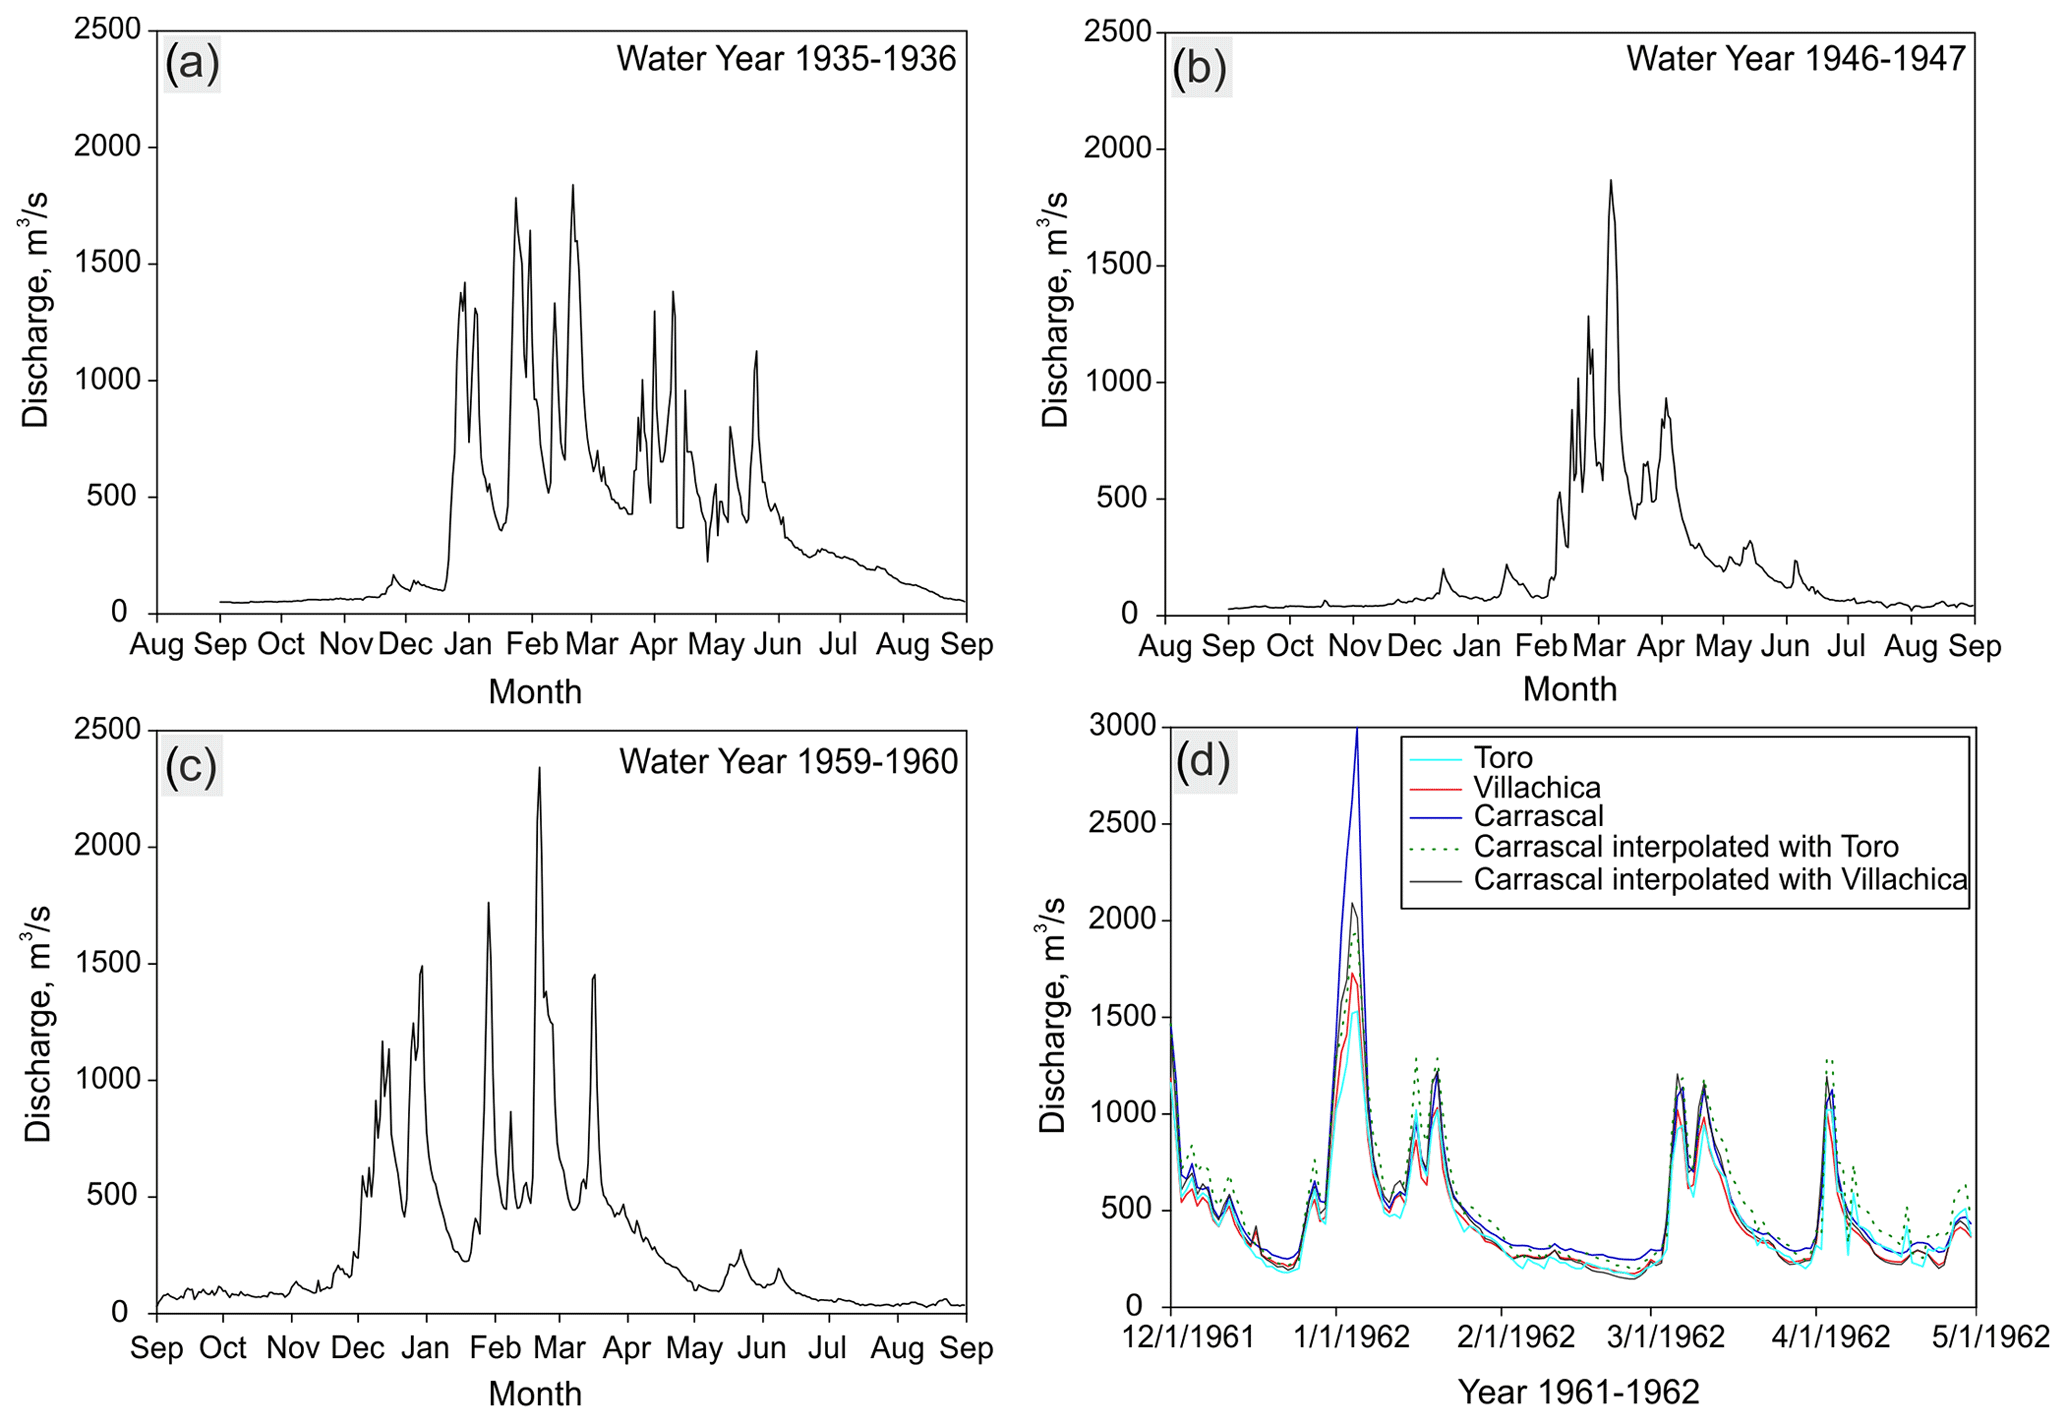
Figure 8Daily discharges showing multiple peaks during selected water years: (a) 1935–1936, (b) 1946–1947, (c) 1959–1960. (c) Daily discharge recorded at the Villachica, Toro and Carrascal stations (see location in Fig. 1c). The recorded peak on 5 January 1962 in Carrascal was anomalously higher compared to Villachica and Toro records, and the peak was corrected using a linear regression.
Recent large floods are commonly produced during anomalously wet winters whose atmospheric conditions may persist for weeks or even months, producing hydrographs with multiple flow peaks (Fig. 8a, c). One of the most severe winters occurred in 1935–1936, with rains starting in late December and extending unit April, giving rise to 12 peaks and a high-flow stage over the whole season. Other flood season types (e.g. 1946–1947) show shorter frontal rain passage during the late winter and early spring (Fig. 8b). In this case, flow peaks are enhanced by rain on snow and snowmelt processes. In general, the largest flow peaks are produced by the passage of the second or third of those cold fronts, once the soils are saturated after previous rains.
4.3 Synoptic analysis and moisture transport
The meteorological predisposition and atmospheric circulation pattern analyses are focused on the major historical flood events since the early 19th century. The cyclonic western and south-western circulations are the main patterns related to intense floods, accounting for ∼71 % of the cases (Table S2). South-meridional-type circulation seems to be less linked to floods (∼17 %), while through- (∼5 %) or high-similarity patterns (∼5 %) are marginal. Figure 9 shows the composite monthly geopotential at mid-levels (500 hPa) as well as the composite seasonal precipitation rate, wind vector and vorticity, displaying negative and positive values (surface level and 250 hPa, respectively). Major flood events in the Duero basin are linked to an intense cyclonic anomaly over the north-west of the Iberian Peninsula which extends to the mid-Atlantic Ocean (Fig. 9a). This pattern is well represented at surface level (Fig. S2), allowing the arrival of a frontal system moving inland from easterly and warmer Atlantic positions. The result is the advection of relative warm moisture mass, favoured by stronger zonal winds that produce persistent rainfall events. This situation is characteristic of negative NAO-like phases found during flood events, with a mean 10 d composite NAO index of −0.9 ± 1.9. Looking at the specific moisture fields from the 10 d before the peak discharge in Zamora city allows us to identify the source of the moisture responsible for each event. In combination with the wind fields, the responsible moisture is transported from low to mid altitude, along long and narrow bands from subtropical latitudes to the Duero basin. The shape and the intensity of the integrated water vapour transported therefore suggest the existence of atmospheric rivers (ARs; IVT >250 kg m−1 s−1; wind velocity >12.5 m s−1). This has been the case of 82 % of the floods >1900 m3 s−1 since the largest flood occurred in 1860. Thus, except for the flood which took place in 1962, an AR-like structure has been detected over the Duero basin (Fig. S3). The example with the largest, the lowest (above 1900 m3 s−1 threshold) and more recent flood events is shown in Fig. 10, with maximum 10 d composite IVT >550, 475 and 700 kg m−1 s−1. Although landfall produced by the arrival of ARs is primordially related to orographic conditions, rainfall seems to be enhanced by divergence in altitude (250 hPa) over Portugal and convergences at surface level over the Duero basin (Fig. 9b). Thus, according to the 20th-century reanalysis records, the mean precipitation rate anomaly during flood months in the Duero basin was +2.78 ± 1.3 (Fig. 9b; values presented in Table S2). This precipitation mostly occurred during slightly-warmer-than-normal months, as suggested by the mean temperature anomaly of +0.12 ± 1.0 (Fig. S2 and Table S2), which is consistent with the advection of moisture from tropical latitudes.
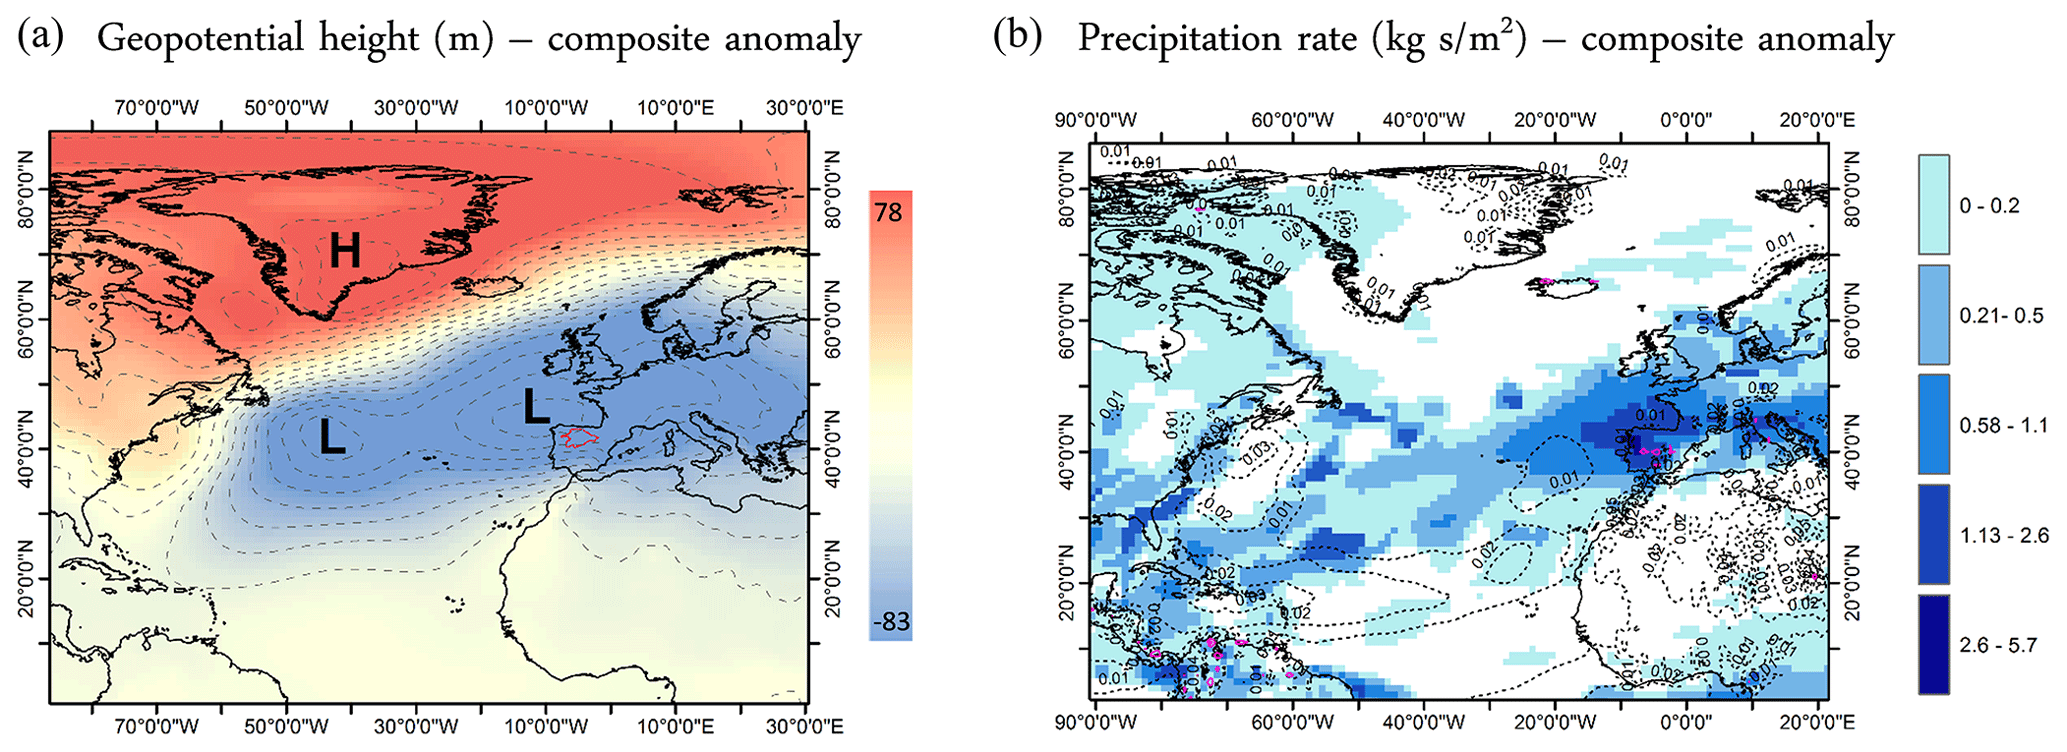
Figure 9(a) Composite monthly anomaly of the geopotential at 500 hPa. (b) Composite seasonal precipitation rate retrieved from 20CRV3 (blue-coloured) and composite divergence for the 10 d prior to the peak of each flood at 250 hPa (dotted) and convergence at sea level (purple line). L: low pressure; HL: high pressure.
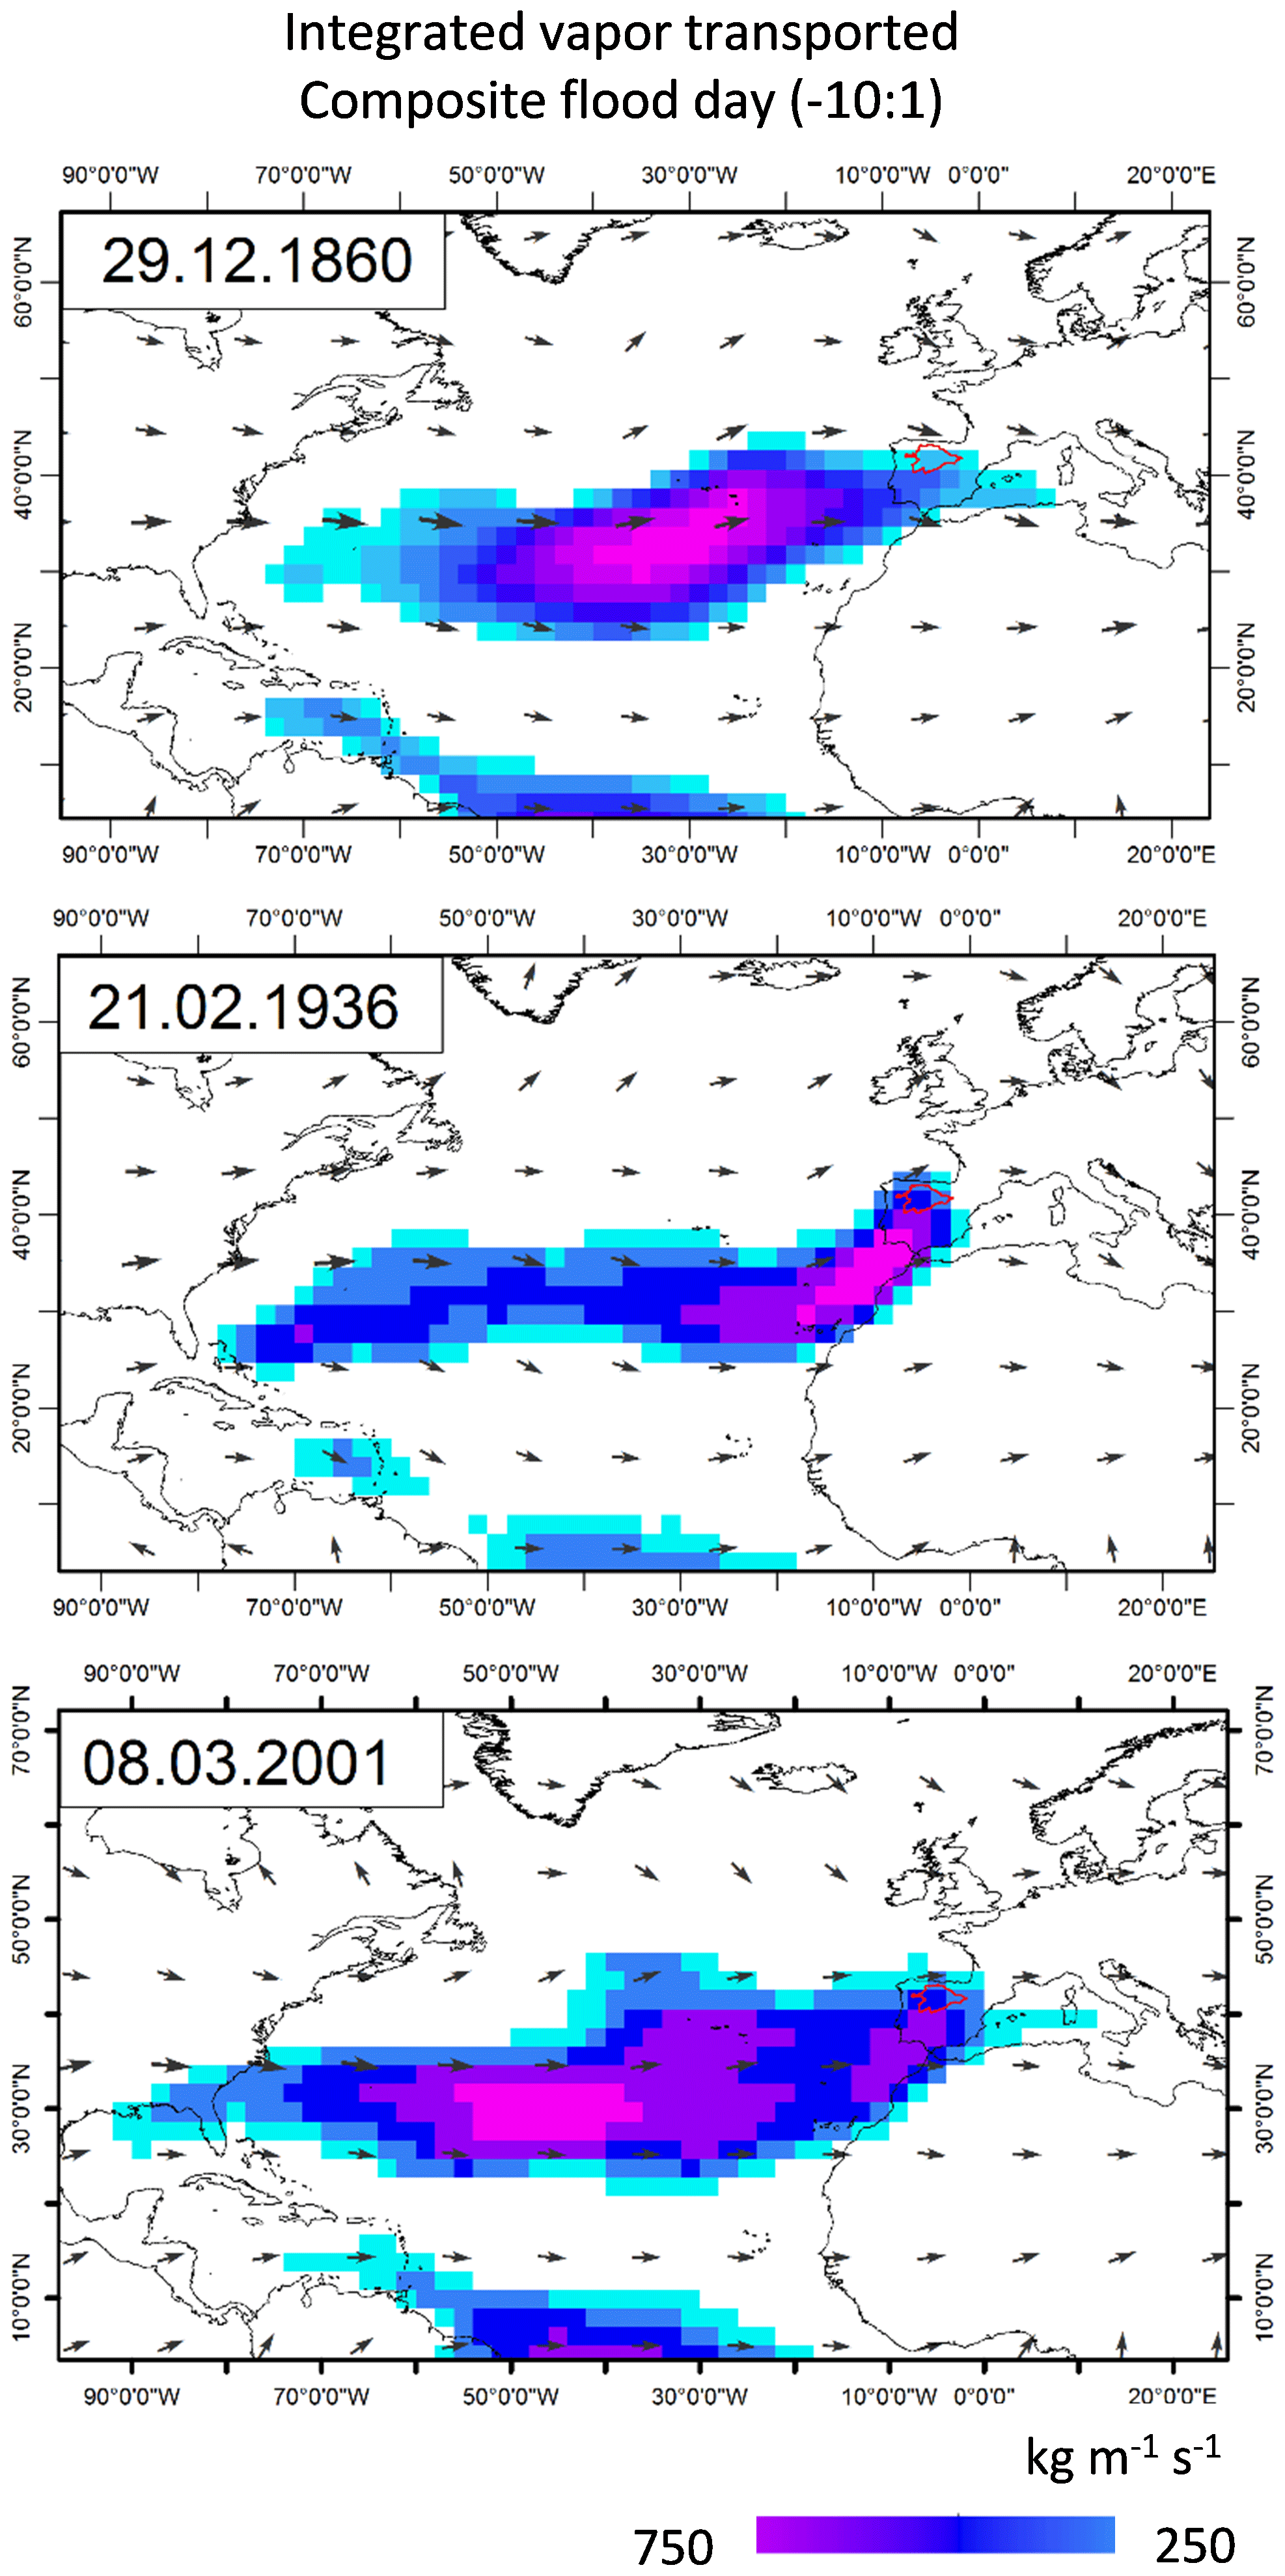
Figure 10Integrated water vapour transported averaged on the 10 d prior. Examples for historical floods took place in 1860 and 1936, and the recent flood took place in 2001.
4.4 Flood frequency analysis
The stationarity tests (Lang et al., 1999) of the combined documentary and instrumental (natural regime) flood series with discharge equal to or above 1900 m3 s−1 show stationarity conditions over the period 1511–2018 (Fig. S2). The number of floods decreased the frequency in the mid-18th century, overlapping the lower tolerance interval, but the overall period is stationary for the perception threshold that includes extraordinary and catastrophic flood categories.
The flood frequency analysis (FFA) was carried out with two independent methods, EMA and MLE, combining non-systematic flood data (historic and pre-instrumental) and systematic continuous flood records (gauge station records). The Gumbel (two parameters) and log Pearson type III distribution (three parameters) functions were applied to different datasets. Discharges calculated for different return periods (T) are shown in Table 2. Figure 11 shows the plotting positions and the frequency curve fitted with LP3 distribution for different datasets showing good visual matching and within the confidence intervals. The confidence intervals in the upper tail of the distribution are narrower for the HISTO and ALLSYST datasets; moreover, in the PRE–SYS analysis, the 5 % (lower) confidence interval is well constrained by the cluster of observed floods (Fig. 11a) plotted within the 1 %–5 % annual exceedance probability (AEP) (Fig. 11c). The subdivided systematic datasets (SYS1 and SYS2) show a poor performance at the upper tail of the distribution with a wide range of discharges for the confidence intervals, particularly the upper 95 %.
Table 2Flood quantiles for different exceedance annual probabilities of the Duero River in Zamora calculated for different datasets applying the expected moments algorithm to fit a log Pearson type III distribution and the maximum likelihood estimator methods to fit a Gumbel distribution. DD represents the difference in years of the calculated discharge obtained for each quantile by the aforementioned distributions. T: average recurrence interval (in years).
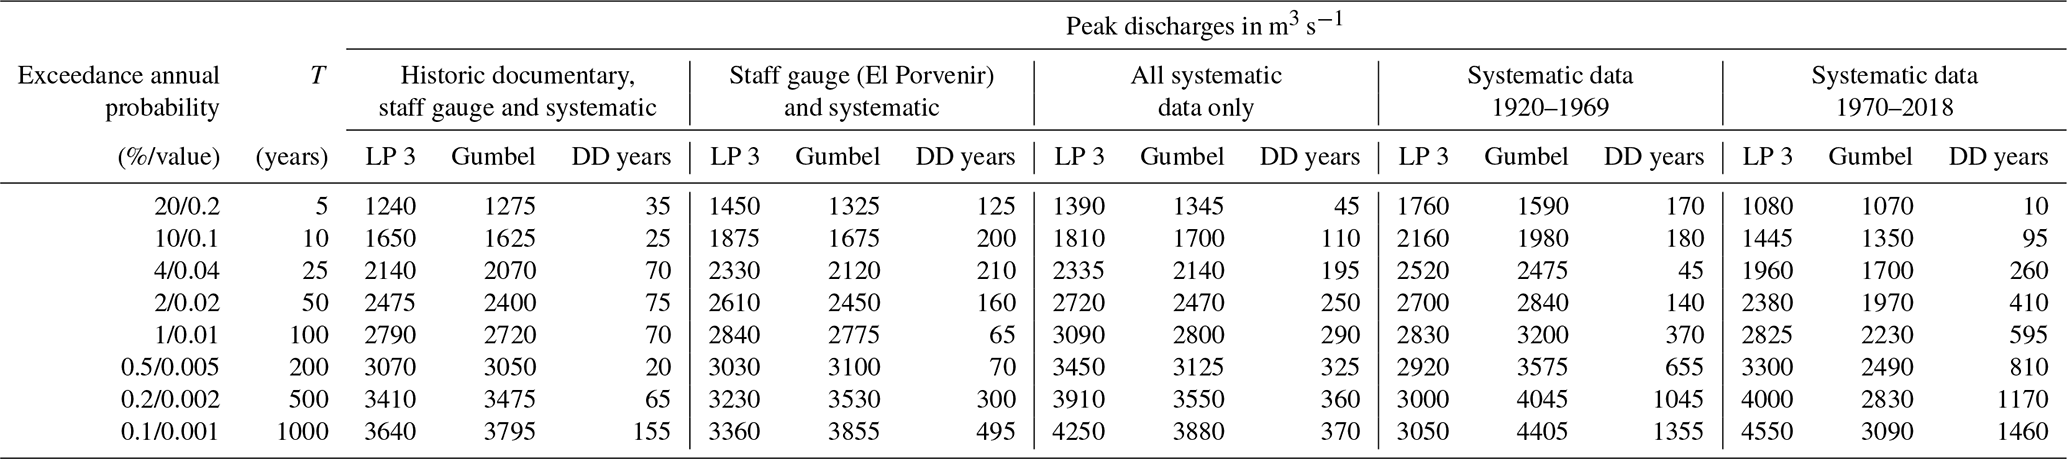
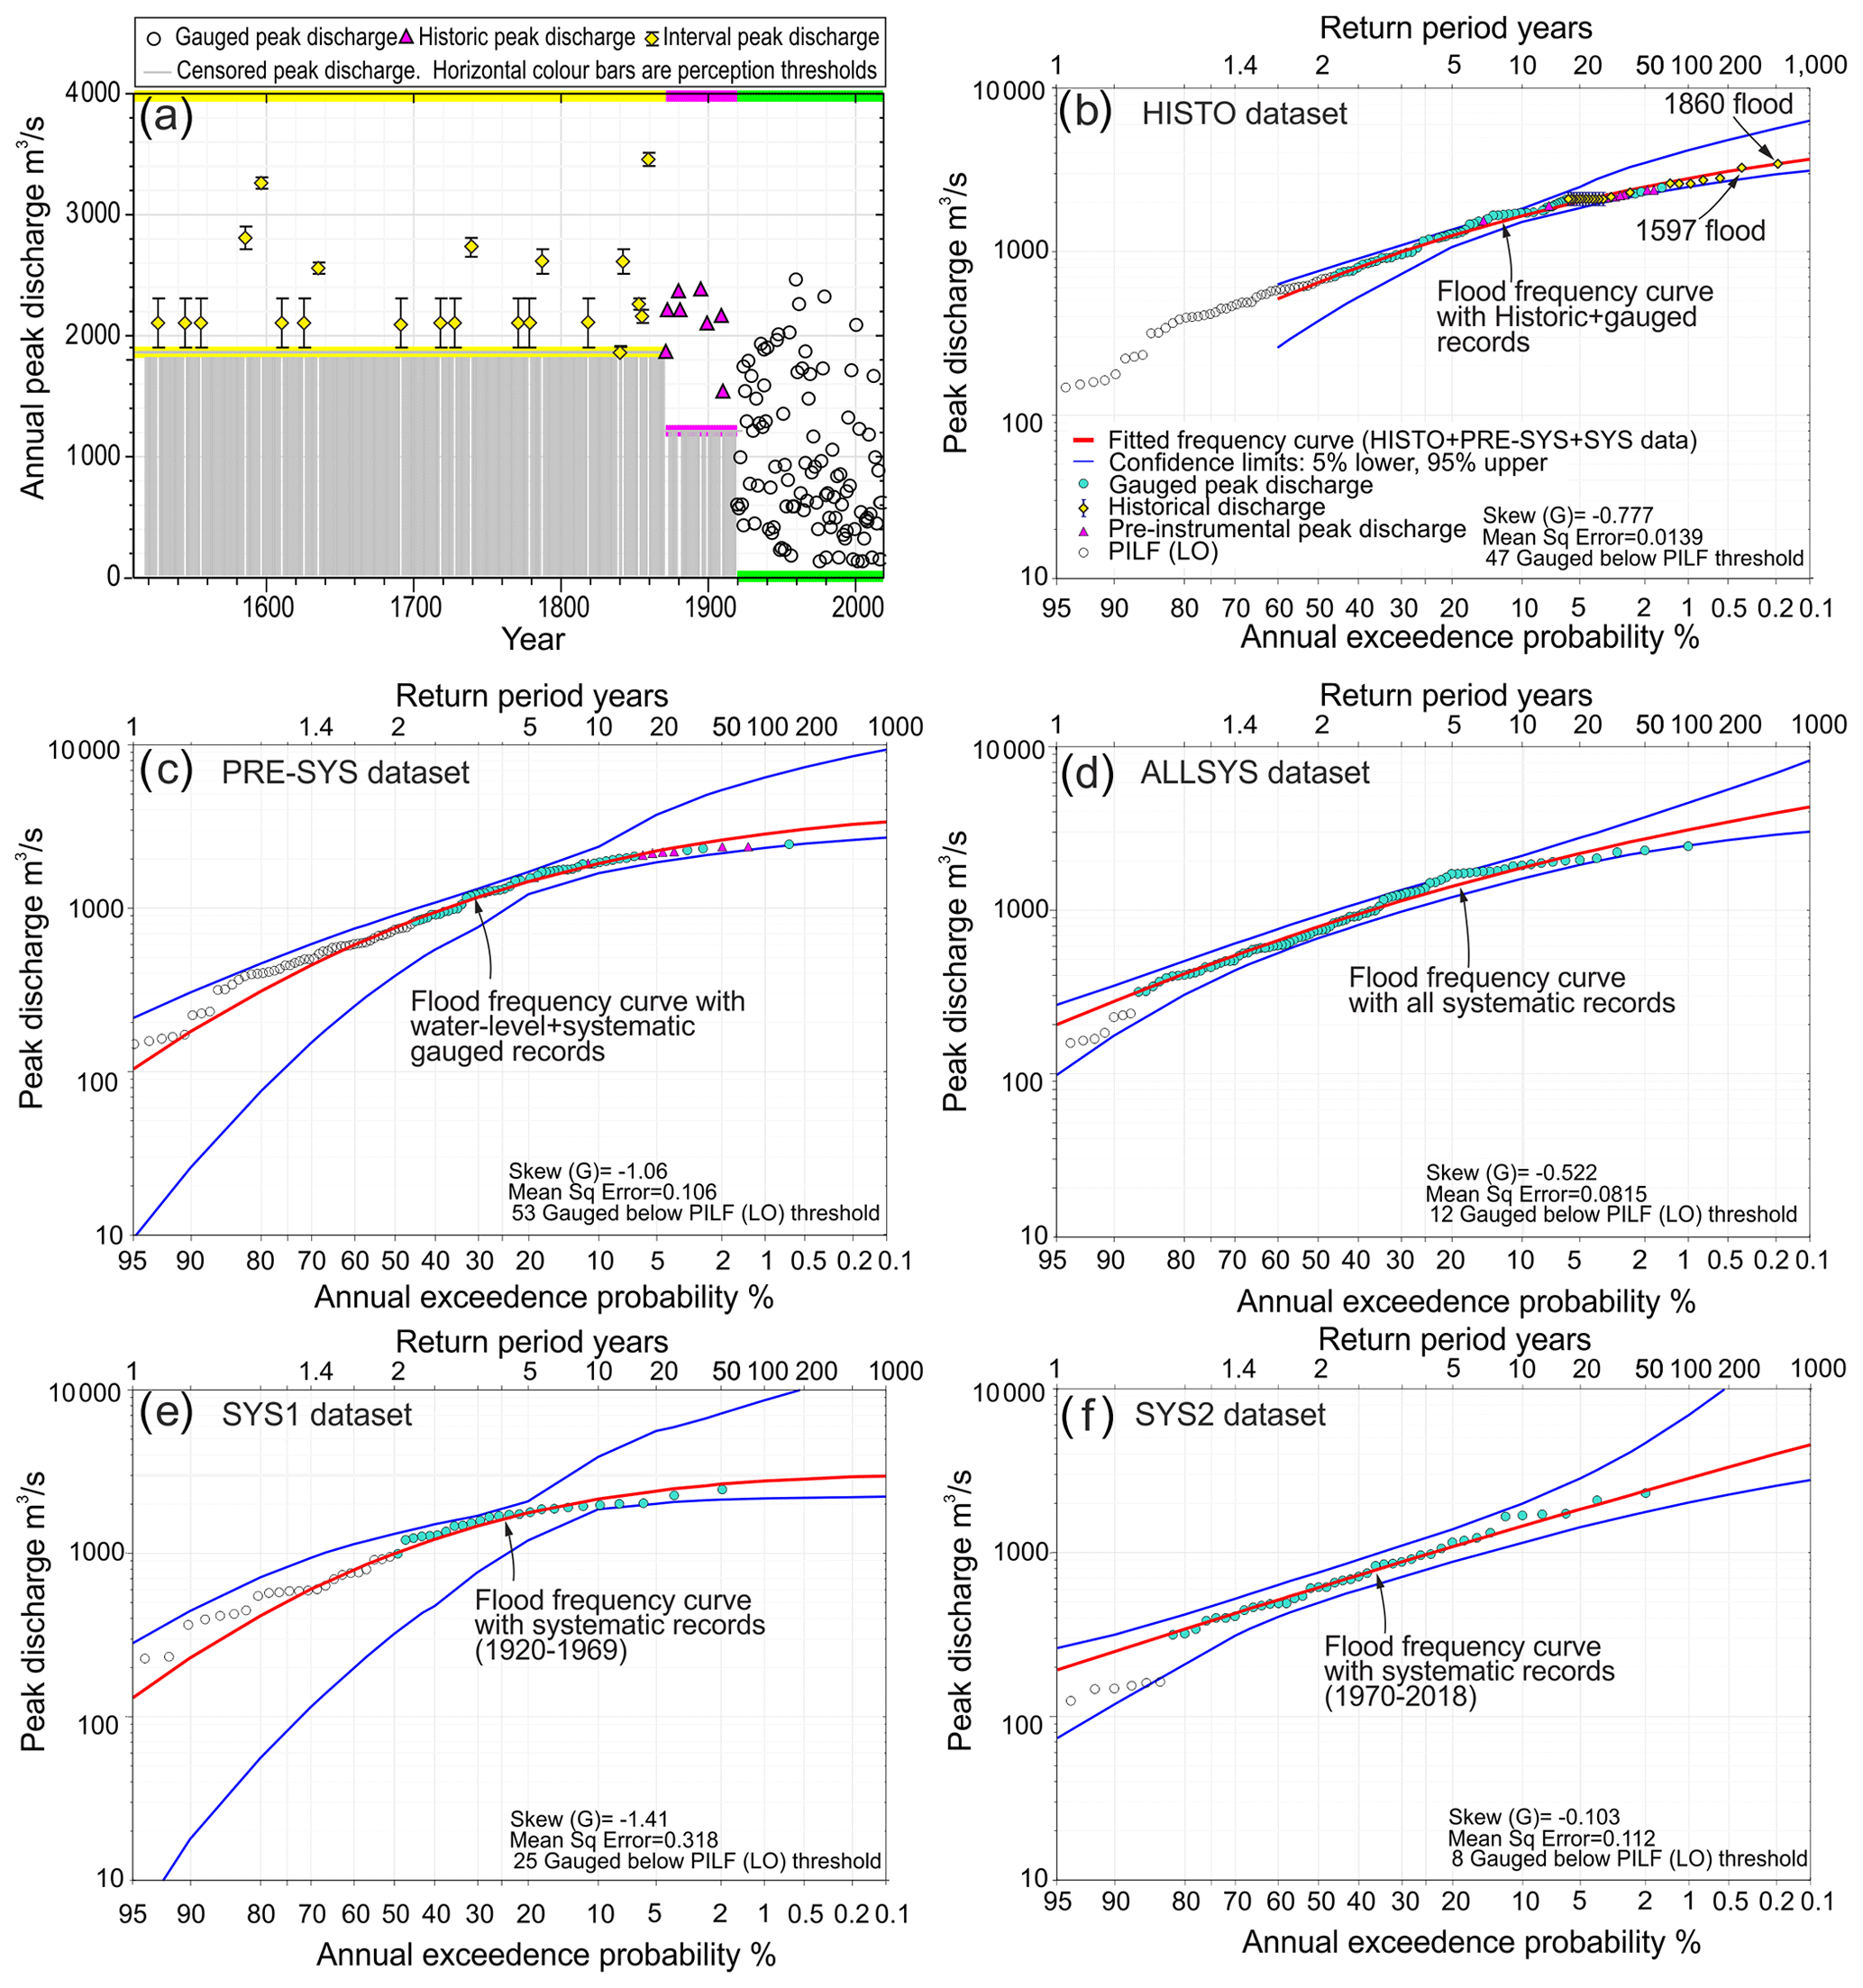
Figure 11(a) Temporal representation of documentary and gauged floods. Grey shaded areas indicate censored flood records during the pre-instrumental period. The coloured horizontal lines are perception thresholds over different time periods; i.e. only floods exceeding the perception threshold discharge were recorded. The yellow diamond dots show discharges for documentary floods including a range of discharge uncertainty (vertical lines). The pink triangles are reported discharge from staff gauge observations at El Porvenir. The white dots are annual flows from the Carrascal gauge station. (b) Log Pearson type III distribution fitted with historic flood events and gauged discharge (staff and continuous gauged). (c) Idem fitted with staff and continuous gauge records. (d) Idem with all continuous gauge records. (e) Idem with gauged records over the period 1920–1969. (f) Idem with gauged discharges over the period 1970–2018.
The HISTO dataset fitted with LP3 distribution also provided the more realistic quantile values compared to other datasets. For instance, the largest flood during the 508-year record length, namely the 1860 event (3450 m3 s−1), is associated with a 500-year recurrence interval (T) in the HISTO analysis and with T>1000 years and ∼200 years in the PRE–SYS and ALLSYS frequency curves.
The incorporation of historical and pre-instrumental data into the FFA results in a slight decrease in the magnitude of the flood quantiles when compared with those calculated with the systematic record. In general terms, the systematic data provide realistic quantile values for return intervals lower than the 1 % AEP, with unreasonable discharge values for the higher quantiles. The 2 % AEP quantile (T=50 years) of the early systematic dataset (1920–1969) gave a higher flood magnitude than the one from the latter systematic set (1970–2018), suggesting a decrease in the annual flood discharges towards the late 20th century.
The FFA analysis performed with the Gumbel distribution using the MLE method gives different discharge values to those obtained by the LP3 distribution, as expected. The differential performance can be evaluated in terms of discharge difference (DD in m3 s−1) obtained by the two distributions for a given quantile among different datasets. The most consistent results are obtained for the HISTO dataset with differences of 20–75 m3 s−1 for quantiles less than 0.2 % AEP, reaching 155 m3 s−1 in the 0.001 % AEP flood. In the PRE–SYS dataset, the discharge calculated with Gumbel and LP3 distribution is similar for 1 % and 0.5 % AEP floods (T∼70 years), but differences are wider towards frequent floods (e.g. 210 m3 s−1 for the 25-year flood) and in the upper quantiles, with 300 m3 s−1 in the 500-year flood. In the ALLSYS dataset, the discharge range (DD) is wide over all quantiles and slightly increasing towards the 500-year flood. The divergence on discharge calculated by the Gumbel and LP3 distributions is higher when applied to the subdivided systematic datasets within differences between 370–810 m3 s−1 in the 100-year and 500-year flood, typically used for flood hazard mapping. In summary, the FFA analysis using the historical dataset provided the most consistent results in discharges calculated for all flood quantiles using two different distribution functions (LP3 and Gumbel) and two independent fitting methods (EMA and MLE). The PRE–SYS dataset showed good agreement in middle-term quantiles (T=100 years and 200 years), whereas the SYS data analysis results in 10 %–20 % discharge differences that increased to 40 %–50 % in the systematic sub-datasets (SYS1 and SYS2) for the higher quantiles (T=500 years).
5.1 Multi-decadal flood patterns and climate variability
Documentary flood records in Zamora are scarce during the early medieval period, coincident with the late Climatic Medieval Anomaly that is characterised by warm temperatures and high hydrological variability. The limited flood data suggest, however, the occurrence of exceptional floods such as the 1258 and 1264 events, the former with a magnitude similar to or exceeding the 1860 flood as it is interpreted from inscription at the doorpost in St. Claudio church. The 1258 flood was exceptional in terms of peak flow but also in extension affecting other Iberian Atlantic basins, at least the Tagus and Guadalquivir rivers (Benito et al., 2003). The lack of information of catastrophic flooding between 1270 and 1500 is common to other Iberian rivers, although it is likely related to the discontinuity of written reports and preservation of documentary archives prior to the 14th century (Barriendos and Rodrigo, 2006).
The temporal distribution of floods over the past 500 years shows at least six flood-rich periods of 20–40-year duration, commonly separated by ∼60-year periods with scarce numbers of large floods. Climatically, this period corresponds to the Little Ice Age (1500–1850) that in Iberia is characterised by cold conditions with alternating wet–dry phases (Oliva et al., 2018). Flood-rich periods were identified between 1600 and 1640, 1730 and 1750, 1770 and 1790, 1850 and 1880, 1924 and 1948, and 1960 and 1980 (Fig. 3), coinciding with flood episodes in Atlantic Iberian rivers (Benito et al., 1996, 2003; Barriendos and Rodrigo, 2006) and overlapping in time with flood periods described in western European regions (Blöschl et al., 2020). The temporal pattern of these flood clusters suggests a multi-decadal natural variability in the atmospheric circulation, affecting both flood frequency and magnitude (Nobre et al., 2017). In western Iberia, excess of winter precipitation is related to a southern position of Atlantic storm tracks occurring during the negative mode of NAO (Trigo et al., 2014).
A detailed hydroclimatic analysis driving these flood-rich periods reveals complexities and dissimilarities among them. The first two periods (1600–1640, 1730–1750) were also identified as decades with frequent dry years in spring (needed for agriculture) according to reported prayers and novenas in churches and processions for rain usually undertaken in March and early April (Álvarez-Vázquez, 1986). The second two periods (1770–1790, 1850–1880) were dominated by overall wet winter years, although the total of rainy years was never more than a quarter of the drought years (Álvarez-Vázquez, 1986). In the Douro River in Porto these two periods were also identified by their anomalous frequency and severity of floods (Alcoforado et al., 2021; Amorim et al., 2017) that include the largest flood on record (4–6 December 1739), which reached a stage of 12 m in a bedrock section at the right margin just upstream of the Dom Luiz I Bridge (Loureiro, 1904; Taborda, 2006). In Régua the 1739 flood peak was estimated at 18 000 m3 s−1, and in Porto (∼105 km downstream) it likely reached 20 000 m3 s−1 (Silva and Oliveira, 2002).
In western Iberia, the relationship between temperature and precipitation tends to be negative as cyclonic conditions are related to moist and relatively warm air masses from the Atlantic. Indeed, there is a total absence of large floods during the Maunder minimum period (1645–1715), a period with lower air temperatures, that intriguingly reveal a link between low solar activity and decreased flood frequency in the Iberian Peninsula (Vaquero, 2004). In contrast, periods with more frequent floods in the western Iberian region coincide with transitions to cool and wet conditions associated with a southward migration of westerlies (Benito et al., 2015b).
In terms of flood magnitude, the Duero data suggest that the largest floods occurred at the onset and final stages of the Little Ice Age (LIA). In both instances, these floods are related to persistent rainfalls occurring during winter months. Interestingly, during the 16th and early 17th centuries, catastrophic floods occurred mainly in January and extraordinary floods in early spring (March), whereas at the final stage of the LIA the largest floods tend to occur between February and March (with the exception of the 1860 flood).
The flood magnitudes over the 20th century may be biased by the environmental changes (agricultural transformation in the early part of the century) and reservoir construction (since 1950s). The 1924–1948 flood-rich period took place during the early-20th-century warming (ETCW; 1910s–1940s), a period of strong internal variability in the climate system, which featured an anomalous warming of the Arctic region impacting climate in northern Europe (Brönnimann, 2009). Two periods (1924–1927, 1935–1941) of extraordinary winter floods (Q>1250 m3 s−1) that took place during the ETCW could arguably make this event relevant also for future analogous warming phases (Ballesteros-Cánovas et al., 2019). Over the late 20th century, the frequency of extraordinary flooding has decreased and mostly occurred in late winter–early spring, which confirms the delay of flood peaks under a warming climate in Europe (Blöschl et al., 2019).
5.2 Atmosphere–ocean interaction leading to catastrophic flooding
During the 18th century the largest flood occurred on 5 December 1739, with an estimated peak of 2700 m3 s−1. In this winter, a previous peak flow was already reported on 1 November, with a likely discharge of 2000 m3 s−1 and at least another peak documented in April 1740 with lower magnitude (∼1800 m3 s−1). The reconstructed monthly NAO index (Luterbacher et al., 1999) shows negative values in the month previous to peaks, namely −1.27 (October), −1.47 (November), and −0.38 and −0.55 (March and April), that, together with −2.38 and −1.14 during January and February, show persistent meridional atmospheric zonal flow during that exceptional winter. Other years with severe flood peaks associated with high negative NAO index were January and March 1931 (−2.08 and −1.16 NAO) and January and May 1881 (−3.6 and −1.42). The 29 December 1860 flood was preceded by a negative NAO index in November (−3.44) and December (−2.14) and continued into January 1861 (−0.56). In the Tagus River, similarly large floods have been associated with a very high frequency of negative NAO mode during the initial 20–25 d before the flood peak (Salgueiro et al., 2013).
The negative NAO-like phases allow the arrival to the Iberian Peninsula of a frontal system bringing warmer and enriched moisture air masses. Our analyses highlighted that the source of this moisture is the Caribbean Sea, and that is the so-called atmospheric river structures (Ralph et al., 2017; Dacre et al., 2015; Waliser and Guan, 2017). Thus, most of the major floods recorded in Zamora (88 %) were linked to the occurrence of these phenomena. A similar mechanism for moisture input has been associated with intense floods in Portugal (Trigo et al., 2014) and to other large European rivers draining to the Atlantic Ocean (Lavers and Villarini, 2015; Ballesteros-Cánovas et al., 2019). Rainfall events linked to the arrival of the ARs are generally related to the uplift forced by orography (Ralph et al., 2006), which is consistent with the mountain reliefs surrounding the Duero basin. Although the frequency, position and magnitude of ARs depends on planetary-scale phenomena (Ralph et al., 2011), the moisture transport capacity may be enhanced under climate change conditions as a consequence of an increase in the water-holding capacity of the atmosphere (Lavers et al., 2013), which could have consequences on climate predisposition for floods in the Duero basin.
Our analyses also pointed out that floods were linked to warmer-than-normal air temperatures, as identified in the composite analyses in the Duero basin (Fig. S2). This is consistent with the cyclonic circulation and the advection of template air mass, especially with a south-west orientation (Trigo et al., 2014). Thus, our results suggest that at least 70 % of the major floods recorded were related to either western or southern cyclonic circulation patterns and at least in 14 % of the cases were related to southern and western meridional circulation patterns. This implies that snowmelt and/or rain on snow from the surrounding mountains could have contributed to additional runoff (Stewart, 2009). Therefore, these mechanisms were related to main triggering mechanisms of torrential floods in mountain streams in the Duero basin (Ballesteros-Cánovas et al., 2015; Morán-Tejeda et al., 2019). Moreover, during wet winters, characteristic of negative NAO-like phases (López-Moreno et al., 2007), a high soil moisture content prevalence in a large portion of the basin could have enabled a recharge of the groundwater system and therefore favoured the direct rainfall–runoff transformation (Berghuijs et al., 2019; Benito et al., 2010, 2011).
5.3 The significance of past floods in flood hazard analysis
The historic city of Zamora is highly sensitive to flood hazards and weather extremes as both have direct impacts on architectural and patrimonial assets and cultural landscapes. Reported evidence of flood incidence provides a rich event catalogue with descriptions of more than 88 historical floods over a period of 760 years as well as 17 pre-instrumental observations on a gauged water-level scale and 99 years of gauged continuous records.
The basic hypothesis in flood frequency analysis (FFA) incorporating historical information (non-systematic) is that a certain perception threshold of water level exists, and all the exceedances of this level over a specific time interval have been recorded (Benito et al., 2015a). Perception thresholds are typically related to river morphological elements (e.g. river banks, dikes) above which overflow produces damages reported in municipal and ecclesiastic act books (Stedinger and Cohn, 1986; Frances et al., 1994; Macdonald, 2013). For instance, in the Duero's documented floods, the perception threshold is the flood discharge overflowing riverbanks at Olivares, Horta, Frontis and Cabañales neighbourhoods that is ∼1900 m3 s−1. Each year, therefore, the Duero River was characterised as having a peak discharge either exceeding or not exceeding that perception threshold. In the qualitative historical classification without any further damage descriptions, such events correspond to extraordinary floods (Barriendos and Martín-Vide, 1998). Catastrophic floods involve higher damages that are typically recorded in epigraphic marks and/or reports of impacts on historic buildings. The scarce urban development of Zamora until the second half of the 19th century allows a temporal stability (from 1511 to 1872) of this perception threshold, which was confirmed for modern flood analogues of historical extraordinary and even catastrophic floods. Over the 408 years prior to the continuous gauged record (1511–1919) there is evidence of 30 floods exceeding the perception threshold (1900 m3 s−1), whereas 8 floods exceeded that discharge over the gauged period (1920–2018).
More important are the consequences of possible climate-related non-stationarity for estimating flood quantiles (Milly et al., 2008). The alternation of flood-rich and flood-poor periods identified during the last 500 years implies differences in the statistic values over time. However, the problem affects both historic and modern gauge records with the advantage that the former includes a longer-term flood dataset (rich and poor flood periods), whereas there may be a bias in gauged data for specific flood patterns. For instance, seven catastrophic floods were recorded over the period 1920–1969, whereas only two occurred over 1970–2018, which results in strong differences in the 25-year flood, with 2500 m3 s−1 and 1650 m3 s−1, respectively. The gauged registers indicate a trend to decrease the magnitude of extreme floods since the 1970s; however, flood events such as those in 2001 (2075 m3 s−1) and 2013 (1654 m3 s−1) illustrate the occurrence of extreme flooding despite the peak discharge attenuation by reservoirs. The overall gauge record (1920–2018) estimates the 25-year flood to be at an intermediate value of 2105–2300 m3 s−1. In the case of long-term historical records, multiple flood-rich and flood-poor periods are combined, giving averaged estimates for the flood quantile discharges (e.g. T 25 years: 2140–2070 m3 s−1).
Due to the extensive historical records of the area, flood hazard assessment can be performed by integrating different flood sources, datasets and timescales. Moreover, the implementation of two independent methods (EMA and MLE) for fitting regression models to censored data together with two distribution functions (LP3 and Gumbel) allows the robustness of results to be tested for low-probability quantiles. In the case of the 1 % AEP flood (T=100 years), both the HISTO dataset (511 years) and the PRE–SYST (147 years) result in a similar discharge (2800 m3 s−1), whereas the SYS dataset (99 years) provides a range of 2800–3100 m3 s−1. In the upper tail of the distribution, the 0.2 % AEP flood (T=500 years) based on HISTO data is well constrained to 3410–3475 m3 s−1, whereas a wide discharge range is obtained with PRE–SYST (3230–3530 m3 s−1), and it is even wider with the SYST dataset (3550–3910 m3 s−1). The historical flood record indicates that, at least over the last 511 years, only one flood reached a discharge of 3450 m3 s−1 (1860 flood), which is within the range of the 0.2 % AEP flood, whereas the SYST dataset overestimates the quantile discharge (3910 m3 s−1). In even rarer floods, the 0.1 % AEP based on the HISTO dataset was estimated in the range of 3640–3795 m3 s−1, which fits the 3700 m3 s−1 estimated for the 1258 flood, although that historical flood was not included in the frequency analysis.
Previous studies of FFA under the non-stationary framework have been applied to documentary flood datasets using climatic (e.g. NAO) and environmental indices (reservoir index) as external covariates (Machado et al., 2015). In such a non-stationary approach, historical flood frequency analysis over the last 300 years shows fluctuations in the estimated flood quantiles at a decadal scale responding to a combination of multi-decadal cold–warm cycles and interannual ocean–atmosphere interactions. However, such analysis is not easy to implement (e.g. López and Francés, 2013), and it is beyond the aim of the present study. Alternative options using climate models and scenarios may generate even higher uncertainties on flood hazard and risk planning studies (Serinaldi and Kilsby, 2015). Lins and Cohn (2011) suggested that it is preferable to continue with simple (stationary) statistical models with well-understood limitations than use sophisticated models whose correspondence to reality is uncertain. In this debate, historical hydrology informs about timing and persistence of flood clusters and identifies the relationships of the largest floods with low-frequency atmospheric circulation and other environmental drivers, providing robust data of real floods that occurred at a centennial scale. In summary, a long-term FFA framework under stationary models provides good average values supported by flood extremes beyond century-scale climate cycles.
5.4 Public perception and risk culture
Flooding of the Duero River has been a recurrent problem for the city of Zamora, with most reported incidents related to the medieval bridge, water mill facilities, ecclesiastic buildings, farms and houses. Despite the abundant flood documentation, details on the relative importance of each historic flood are not always available, and only for the most catastrophic events are there precise references to flood levels on epigraphic marks. The best-preserved epigraphic marks are located inside San Frontis Church and Dueñas Convent, which became a cloistered convent with difficult access for the public. Epigraphic marks are important elements for public perception in central Europe (Brázdil et al., 2005; Herget and Meurs, 2010; Wetter et al., 2011; Elleder et al., 2013; Glaser et al., 2010) and in Mediterranean regions (Aldrete et al., 2007; Cœur and Lang, 2008; Barriendos et al., 2019), which are maintained as part of the historical asset. In Zamora flood marks are not well known to the public, and, in the modern urban expansion, some flood marks were removed during restoration works of architectural assets. For instance, the 1860 flood mark disappeared from the old city gate (Puerta del Pescado) when, due to traffic problems, the old monument was moved to a new location in 1909. Curiously, in a municipal council meeting (29 January 1908), a city councillor (Eusebio Calonge Sansó, cited in Heraldo de Zamora, 30 January 1908) proposed to preserve the 1860 flood mark at its place for the public memory of that extreme flood. In that time, five floods over 2000 m3 s−1 were recorded in a 30-year period (1880 to 1909) that kept alive the public perception of flood risk and its socio-economic consequences. It also corroborates a well-established observation that occurrence of a damaging flood improves awareness and social learning and enhances adaptation (Di Baldassarre et al., 2015). Conversely, over the last 40 years, only the 2001 flood exceeded 2000 m3 s−1, and since the 1980s there is strong socio-economic pressure to expand urban occupation in the San Frontis, Olivares and Cabañales suburbs. Fortunately, the remarkable work on historical flood data collection done by Marquina (1949a, b) preserved the details on the location and position of epigraphic marks no longer at their original sites.
Within the framework of the European Flood Directive (2007/60/EC), EU member states are requested to map flood hazards (typically 100-year and 500-year floods) as well as consider the effects of climate change on flood risks. The climate effect on flood hazards is complex and not ubiquitous within a world that increases population, exposure and vulnerability (Kundzewicz et al., 2019). Recent developments on climate change science and adaptation actions focus on win–win strategies for sustainable climate action. The study of past flooding, either historic or palaeofloods, can be a direct guide to flood possibilities for adaptation actions to extreme flooding under climate change as it reveals what is actually possible under conditions of centennial climate variability (Brázdil et al., 2012; Macdonald, 2013). The flood magnitudes result neither from complex climate models nor from probabilistic language, difficult to understand for the general public. Common sense holds that what has really happened can happen again (Baker, 2008). This approach based on past flood occurrences also serves to increase public confidence in any proposed solution that ultimately involves a large economic or social expense for hazard mitigation.
Climate change effect on local flood magnitudes is becoming a major problem in flood hazard mapping due to model uncertainty and multiple possible scenarios. There is a need for better identification and guidance for tools for a robust adaptation to future flood risk. In this work, we demonstrate that the reconstruction of flood histories under climate variability beyond the temporal length of observations provides realistic insight into future floods under worst-case scenarios.
In Zamora (Spain), a long-term flood record of the Duero River was collated from documentary archives (1256–1871), early water-level observations (1872–1919) and gauged data (1920–2018). Early flood records were discontinuously reported, but since ca. 1500, flood events have been well documented. Documentary flood information includes narrative descriptions (annals, chronicles and memory books), epigraphic marks, newspapers and technical reports. The urban configuration at the riverside area has been stable since the 14th century, which implies continuous, homogeneous and comparable data over the last 500 years. Our key findings are as follows.
-
There is documentary evidence of 69 flood registers during the period 1511–1871, with 15 catastrophic floods, 16 extraordinary floods and 38 ordinary floods. Catastrophic and extraordinary floods typically produced overflow of urban areas, typically exceeding a discharge of 1900 m3 s−1, based on a two-dimensional hydraulic model calibrated with gauge records.
-
The largest floods over the last 500 years occurred in 1860 (3450 m3 s−1), 1597 (3200 m3 s−1) and 1739 (2700 m3 s−1). Historic flood magnitudes were greater than the ones recorded in the early water readings (largest in 1895 with 2380 m3 s−1) and in the gauging station (largest in 1960 with 2360 m3 s−1).
-
Over the historical time, flood-rich periods were identified in the periods 1600–1640, 1730–1750, 1770–1790 and 1880–1910, the first two in decades of frequent drought and the latter in overall wet winter years. In the 20th century flood frequency increased between 1935 and 1960, overlapping the early-20th-century warm period. Later, the flooding occurred punctuated on time, namely in 1978–1979 and 2001.
-
Floods in the Duero basin mostly occur during negative-like NAO phases that force frontal systems to travel in meridional latitudes, bringing moisture and warmer air masses from the tropical latitudes in the so-called atmospheric river structures.
-
We demonstrate that the temporal extent of the flood dataset is a critical factor in the quality of the flood frequency results. The most consistent results, independently of fitting methods and distribution functions, correspond to the historical dataset (also including pre-instrumental and systematic records), showing calculated discharges within a narrow range even for high quantiles (1000-year flood). Combined pre-instrumental (water-level readings) and systematic gauge data provided robust results for the 100-year flood, with increasing uncertainty in the 500-year flood. In the systematic dataset results were uncertain in the 100-year and 500-year floods, despite the almost 100-year-long datasets.
-
Since 1970s the frequency of extraordinary floods (>1900 m3 s−1) declined, although floods above the historical perception threshold occurred in 2001 and 2013. The decreasing frequency of extraordinary floods, relatively common at the end of the 19th century and first half of the 20th century, may be responsible for a lower flood risk perception. The fact that some extraordinary floods occurred at the beginning of the 21st century and that historical analogues of extreme flooding occurred during drought-dominated periods demands a higher degree of flood education and spatial planning according to consolidated flood hazard analysis.
-
Although the likelihood of future floods is uncertain with conventional downscaling climate models, the extending of flood records beyond cycles of past climate variability provides further understanding of possible flood sizes and calculated magnitudes of flood quantiles to guide low-regret adaptation decisions and to improve public perception of extreme flooding.
The data used in this article can be obtained by contacting the corresponding author.
The supplement related to this article is available online at: https://doi.org/10.5194/hess-25-6107-2021-supplement.
GB and MM designed the research and applied for funding acquisition. OC carried out the two-dimensional hydraulic modelling. JABC performed the analysis of the atmospheric circulation in relation to historical floods and its hydrometeorological interpretation. MB and MM collected and analysed the documentary flood database. MM collected and analysed the urban history and its relation to flood perception through time. All authors interpreted results. GB, JABC and MM wrote the first draft, and all authors contributed to reviewing and editing the paper.
The contact author has declared that neither they nor their co-authors have any competing interests.
Publisher’s note: Copernicus Publications remains neutral with regard to jurisdictional claims in published maps and institutional affiliations.
We acknowledge the hydrological data and documentary support provided by Jose Angel Martinez Pérez, head of operation and management service at Iberdrola (hydropower company) in Carbajosa de la Sagrada (Salamanca), and by Yolanda Diego Martín, director of documentation management of the Iberdrola historical archive in Ricobayo (Zamora). Mikel Calle Navarro provided field assistance for the GPS survey and processing of historical flood marks. Reviews and discussions with Inês Amorim (University of Porto) and Libor Elleder (Czech Hydrometeorological Institute) have improved this paper.
This research has been supported by the Ministerio de Ciencia, Innovación y Universidades (grant no. EPHIMED, CGL2017-86839-C3-1-R) and the Fundación Biodiversidad (grant no. PRCV00446).
The CSIC Open Access Publication Support Initiative has provided financial support for the publication fee through its Unit of Information Resources for Research (URICI).
This paper was edited by Alberto Guadagnini and reviewed by Libor Elleder and Inês Amorim.
Aires, C., Pereira, D. I., and Azevedo, T. M.: Inundações do rio Douro: dados históricos e hidrológicos, I Jornadas do Quarternário da APEQ, Porto, available at: http://web.letras.up.pt/asaraujo/APEQ/p11.html (last access: 26 November 2021), 2000.
Alcoforado, M. J., Silva, L. P., Amorim, I., Fragoso, M., and Garcia, J. C.: Historical floods of the Douro River in Porto, Portugal (1727–1799), Climatic Change, 165, 17, https://doi.org/10.1007/s10584-021-03039-7, 2021.
Aldrete, G. S.: Floods of the Tiber in ancient Rome, Johns Hopkins University Press, Baltimore, 338 pp., 2007.
Alonso-Zarza, A. M., Armenteros, I., Braga, J. C., Muñoz, A., Pujalte, V., Ramos, E., Aguirre, J., Alonso-Gavilán, G., Arenas, C., Ignacio Baceta, J., Carballeira, J., Calvo, J. P., Corrochano, A., Fornós, J. J., González, A., Luzón, A., Martín, J. M., Pardo, G., Payros, A., Pérez, A., Pomar, L., Rodriguez, J. M., and Villena, J.: Tertiary, in: The Geology of Spain, edited by: Gibbons, W. and Moreno, T., Geological Society of London, London, UK, 632 pp., https://doi.org/10.1144/gospp.13, 2002.
Álvarez-Vázquez, J. A.: Drought and rainy periods in the province of Zamora in the 17th, 18th, and 19th centuries, in: Quaternary climate in Western Mediterranean, edited by: Lopez-Vera, F., Universidad Autónoma de Madrid, Madrid, Spain, 221–235, 1986.
Amorim, I., Garcia, J. C., and Silva, L. P.: As cheias do rio Douro no Porto (Portugal) do século XVIII, SÉMATA, 29, 185–217, 2017.
Antón, F.: El Arte Románico Zamorano. Monumentos primitivos, Biblioteca de Heraldo de Zamora, Zamora, Spain, available at: https://bibliotecadigital.jcyl.es/es/consulta/registro.do?id=3773 (last access: 24 November 2021), 1927.
Baker, V. R.: Paleoflood hydrology: Origin, progress, prospects, Geomorphology, 101, 1–13, https://doi.org/10.1016/j.geomorph.2008.05.016, 2008.
Ballesteros-Cánovas, J. A., Rodriguez-Morata, C., Garofano-Gomez, V., Rubiales, J. M., Sanchez-Salguero, R., and Stoffel, M.: Unravelling past flash flood activity in a forested mountain catchment of the Spanish Central System, J. Hydrol., 529, 468–479, 2015.
Ballesteros-Cánovas, J. A., Stoffel, M., Benito, G., Rohrer, M., Barriopedro, D., García-Herrera, R., Beniston, M., and Brönnimann, S.: On the extraordinary winter flood episode over the North Atlantic Basin in 1936, Ann. N.Y. Acad. Sci., 1436, 206–216, https://doi.org/10.1111/nyas.13911, 2019.
Barriendos, M. and Martín-Vide, J.: Secular Climatic Oscillations as Indicated by Catastrophic Floods in the Spanish Mediterranean Coastal Area (14th–19th Centuries), Climatic Change, 38, 473–491, https://doi.org/10.1023/a:1005343828552, 1998.
Barriendos, M. and Rodrigo, F. S.: Study of historical flood events on Spanish rivers using documentary data, Hydrol. Sci. J., 51, 765–783, https://doi.org/10.1623/hysj.51.5.765, 2006.
Barriendos, M., Gil-Guirado, S., Pino, D., Tuset, J., Pérez-Morales, A., Alberola, A., Costa, J., Balasch, J. C., Castelltort, X., Mazón, J., and Ruiz-Bellet, J. L.: Climatic and social factors behind the Spanish Mediterranean flood event chronologies from documentary sources (14th–20th centuries), Global Planet. Change, 182, 102997, https://doi.org/10.1016/j.gloplacha.2019.102997, 2019.
Benito, G., Machado, M. J., and Pérez-González, A.: Climate change and flood sensitivity in Spain, Geological Society, London, Special Publications, 115, 85–98, https://doi.org/10.1144/gsl.sp.1996.115.01.08, 1996.
Benito, G., Díez-Herrero, A., and Fernández De Villalta, M.: Magnitude and frequency of flooding in the Tagus basin (Central Spain) over the last millennium, Climatic Change, 58, 171–192, https://doi.org/10.1023/A:1023417102053, 2003.
Benito, G., Lang, M., Barriendos, M., Llasat, M. C., Francés, F., Ouarda, T., Thorndycraft, V., Enzel, Y., Bardossy, A., Coeur, D., and Bobée, B.: Use of Systematic, Palaeoflood and Historical Data for the Improvement of Flood Risk Estimation. Review of Scientific Methods, Nat. Hazards, 31, 623–643, https://doi.org/10.1023/B:NHAZ.0000024895.48463.eb, 2004.
Benito, G., Rohde, R., Seely, M., Külls, C., Dahan, O., Enzel, Y., Todd, S., Botero, B., Morin, E., Grodek, T., and Roberts, C.: Management of Alluvial Aquifers in Two Southern African Ephemeral Rivers: Implications for IWRM, Water Resour. Manage., 24, 641–667, https://doi.org/10.1007/s11269-009-9463-9, 2010.
Benito, G., Botero, B. A., Thorndycraft, V. R., Rico, M., Sánchez-Moya, Y., Sopeña, A., Machado, M. J., and Dahan, O.: Rainfall-runoff modelling and palaeoflood hydrology applied to reconstruct centennial scale records of flooding and aquifer recharge in ungauged ephemeral rivers, Hydrol. Earth Syst. Sci., 15, 1185–1196, https://doi.org/10.5194/hess-15-1185-2011, 2011.
Benito, G., Brázdil, R., Herget, J., and Machado, M. J.: Quantitative historical hydrology in Europe, Hydrol. Earth Syst. Sci., 19, 3517–3539, https://doi.org/10.5194/hess-19-3517-2015, 2015a.
Benito, G., Macklin, M. G., Zielhofer, C., Jones, A. F., and Machado, M. J.: Holocene flooding and climate Change in the Mediterranean, Catena, 130, 13–33, https://doi.org/10.1016/j.catena.2014.11.014, 2015b.
Benito, G., Macklin, M. G., Panin, A., Rossato, S., Fontana, A., Jones, A. F., Machado, M. J., Matlakhova, E., Mozzi, P., and Zielhofer, C.: Recurring flood distribution patterns related to short-term Holocene climatic variability, Scientific Reports, 5, 16398, https://doi.org/10.1038/srep16398, 2015c.
Benito, G., Harden, T. M., and O'Connor, J. E.: Quantitative Paleoflood Hydrology, in: Reference Module in Earth Systems and Environmental Sciences, 2nd edn., edited by: Wohl, E., Elsevier, the Netherlands, 22 pp., https://doi.org/10.1016/B978-0-12-409548-9.12495-9, 2020.
Berghuijs, W. R., Harrigan, S., Molnar, P., Slater, L. J., and Kirchner, J. W.: The Relative Importance of Different Flood-Generating Mechanisms Across Europe, Water Resour. Res., 55, 4582–4593, https://doi.org/10.1029/2019WR024841, 2019.
Bladé, E., Cea, L., Corestein, G., Escolano, E., Puertas, J., Vázquez-Cendón, E., Dolz, J., and Coll, A.: Iber: herramienta de simulación numérica del flujo en ríos, Revista Internacional de Métodos Numéricos para Cálculo y Diseño en Ingeniería, 30, 1–10, https://doi.org/10.1016/j.rimni.2012.07.004, 2014.
Blöschl, G., Hall, J., Viglione, A., Perdigão, R. A. P., Parajka, J., Merz, B., Lun, D., Arheimer, B., Aronica, G. T., Bilibashi, A., Boháč, M., Bonacci, O., Borga, M., Čanjevac, I., Castellarin, A., Chirico, G. B., Claps, P., Frolova, N., Ganora, D., Gorbachova, L., Gül, A., Hannaford, J., Harrigan, S., Kireeva, M., Kiss, A., Kjeldsen, T. R., Kohnová, S., Koskela, J. J., Ledvinka, O., Macdonald, N., Mavrova-Guirguinova, M., Mediero, L., Merz, R., Molnar, P., Montanari, A., Murphy, C., Osuch, M., Ovcharuk, V., Radevski, I., Salinas, J. L., Sauquet, E., Šraj, M., Szolgay, J., Volpi, E., Wilson, D., Zaimi, K., and Živković, N.: Changing climate both increases and decreases European river floods, Nature, 573, 108–111, https://doi.org/10.1038/s41586-019-1495-6, 2019.
Blöschl, G., Kiss, A., Viglione, A., Barriendos, M., Böhm, O., Brázdil, R., Coeur, D., Demarée, G., Llasat, M. C., Macdonald, N., Retsö, D., Roald, L., Schmocker-Fackel, P., Amorim, I., Belinová, M., Benito, G., Bertolin, C., Camuffo, D., Cornel, D., Doctor, R., Elleder, L., Enzi, S., Garcia, J. C., Glaser, R., Hall, J., Haslinger, K., Hofstätter, M., Komma, J., Limanówka, D., Lun, D., Panin, A., Parajka, J., Petric, H., Rodrigo, F. S., Rohr, C., Schönbein, J., Schulte, L., Silva, L. P., Toonen, W., Valent, P., Waser, J., and Wetter, O.: Current flood-rich period is exceptional compared to the past 500 years in Europe, Nature, 583, 560–566, https://doi.org/10.1038/s41586-020-2478-3, 2020.
Botero, B. A. and Francés, F.: AFINS Version 2.0-Análisis de Frecuencia de Extremos con Información Sistemática y No Sistemática, Research Group on Hydraulic and Hydrology, Department of Hydraulic Engineering and Environment, Politechnical University of Valencia, Valencia, Spain, 2006.
Botero, B. A. and Francés, F.: Estimation of high return period flood quantiles using additional non-systematic information with upper bounded statistical models, Hydrol. Earth Syst. Sci., 14, 2617–2628, https://doi.org/10.5194/hess-14-2617-2010, 2010.
Brázdil, R., Dobrovolný, P., Elleder, L., Kakos, V., Kotyza, O., Květoň, V., Macková, J., Müller, M., Štekl, J., Tolasz, R., and Valášek, H.: Historical and Recent Floods in the Czech Republic, Masaryk University, Czech Hydrometeorological Institute, Brno, Prague, 2005.
Brázdil, R., Kundzewicz, Z. W., Benito, G., Demarée, G., MacDonald, N., and Roald, L. A. (Eds.): Historical floods in Europe in the past Millennium, Changes in Flood Risk in Europe, IAHS Press, Wallingford, UK, 121–166, 2012.
Brönnimann, S.: Early twentieth-century warming, Nat. Geosci., 2, 735–736, https://doi.org/10.1038/ngeo670, 2009.
Brönnimann, S., Ewen, T., Luterbacher, J., Diaz, H. F., Stolarski, R. S., and Neu, U.: A focus on climate during the past 100 years, in: Climate variability and extremes during the past 100 years, Springer, Dordrecht, 1–25, https://doi.org/10.1007/978-1-4020-6766-2_1, 2008.
Cohn, T. A., Lane, W. L., and Baier, W. G.: An algorithm for computing moments-based flood quantile estimates when historical flood information is available, Water Resour. Res., 33, 2089–2096, https://doi.org/10.1029/97WR01640, 1997.
Cohn, T. A., England, J. F., Berenbrock, C. E., Mason, R. R., Stedinger, J. R., and Lamontagne, J. R.: A generalized Grubbs-Beck test statistic for detecting multiple potentially influential low outliers in flood series, Water Resour. Res., 49, 5047–5058, https://doi.org/10.1002/wrcr.20392, 2013.
Compo, G. P., Whitaker, J. S., Sardeshmukh, P. D., Matsui, N., Allan, R. J., Yin, X., Gleason, B. E., Vose, R. S., Rutledge, G., Bessemoulin, P., Brönnimann, S., Brunet, M., Crouthamel, R. I., Grant, A. N., Groisman, P. Y., Jones, P. D., Kruk, M. C., Kruger, A. C., Marshall, G. J., Maugeri, M., Mok, H. Y., Nordli, Ø., Ross, T. F., Trigo, R. M., Wang, X. L., Woodruff, S. D., and Worley, S. J.: The Twentieth Century Reanalysis Project, Q. J. Roy. Meteor. Soc., 137, 1–28, https://doi.org/10.1002/qj.776, 2011.
Cœur, D. and Lang, M.: Use of documentary sources on past flood events for flood risk management and land planning, C. R. Geosci., 340, 644–650, https://doi.org/10.1016/j.crte.2008.03.001, 2008.
Dacre, H., Clark, P., Lavers, D., Martínez-Alvarado, O., and Stringer, M.: How Do Atmospheric Rivers Form?, B. Am. Meteorol. Soc., 96, 1243–1255, https://doi.org/10.1175/BAMS-D-14-00031.1, 2015.
Delgado-Iglesias, J. and Alonso-Gavilán, G.: Aportaciones a la interpretación de los sedimentos del tránsito Cretacico superior-Paleoceno en la ciudad de Zamora, Boletin Geologico y Minero, 119, 181–200, 2008.
Demarcación Hidrográfica del Duero (DHD): Plan de Gestión del Riesgo de Inundación, Ministerio de Agricultura Alimentación y Mediambiente, Madrid, Spain, 135 pp., available at: https://www.chduero.es/pgri-plan-de-gestion-del-riesgo-de-inundacion (last access: 26 November 2021), 2016.
Di Baldassarre, G., Viglione, A., Carr, G., Kuil, L., Yan, K., Brandimarte, L., and Blöschl, G.: Debates – Perspectives on socio-hydrology: Capturing feedbacks between physical and social processes, Water Resour. Res., 51, 4770–4781, https://doi.org/10.1002/2014WR016416, 2015.
Döll, P., Jiménez-Cisneros, B., Oki, T., Arnell, N. W., Benito, G., Cogley, J. G., Jiang, T., Kundzewicz, Z. W., Mwakalila, S., and Nishijima, A.: Integrating risks of climate change into water management, Hydrol. Sci. J., 60, 4–13, https://doi.org/10.1080/02626667.2014.967250, 2015.
Elleder, L., Herget, J., Roggenkamp, T., and Nießen, A.: Historic floods in the city of Prague – a reconstruction of peak discharges for 1481–1825 based on documentary sources, Hydrol. Res., 44, 202–214, https://doi.org/10.2166/nh.2012.161, 2013.
England Jr., J. F., Cohn, T. A., Faber, B. A., Stedinger, J. R., Thomas Jr., W. O., Veilleux, A. G., Kiang, J. E., and Mason Jr., R. R.: Guidelines for determining flood flow frequency – Bulletin 17C, Reston, VA, Report 4-B5, 168, https://doi.org/10.3133/tm4B5, 2019.
Enríquez de Salamanca, C.: Rutas del románico en la provincia de Zamora, Castilla Ediciones, Valladolid, Spain, 152 pp., 1998.
European Commission: Impact of climate change on floods: Survey findings and possible next steps to close the knowledge and implementation gap, Version 1, EC Working Group on Floods, 28th meeting, 26 April 2021, DG Environment, Brussels, 26, internal document available at: https://circabc.europa.eu (last access: 26 November 2021), 2021.
EXCIMAP: Handbook on good practices for flood mapping in Europe, European Commission, 57 pp., available at: https://ec.europa.eu/environment/water/flood_risk/flood_atlas/pdf/handbook_goodpractice.pdf (last access: 24 November 2021), 2007.
Fernández Duro, C.: Memorias históricas de la ciudad de Zamora, su provincia y obispado, 4 volumes, Establecimiento Tipográfico de los Sucesores de Rivadeneyra, Madrid, available at: https://bibliotecadigital.jcyl.es/es/consulta/registro.cmd?id=1190, (last access: 23 November 2021), 1882.
Flynn, K. M., Kirby, W. H., and Hummel, P. R.: User's manual for program PeakFQ annual flood-frequency analysis using Bulletin 17B guidelines, U.S. Geological Survey, Techniques and Methods Book 4, Chapter B4, 42 pp., available at: https://pubs.usgs.gov/tm/2006/tm4b4/tm4b4.pdf (last access: 24 November 2021), 2006.
Fontana Tarrats, J. M.: Entre el cardo y la rosa. Historia del clima de las Mesetas, typescript report, Madrid, 269, 1971–1977.
Frances, F.: Flood frequency analysis using systematic and non-systematic information, in: SPHERE Gudelines, edited by: Benito, G. and Thorndycraft, V. R., CSIC, Madrid, 55–70, 2004.
Frances, F., Salas, J. D., and Boes, D. C.: Flood frequency-analysis with systematic and historical or paleoflood data-based on the 2-parameter General Extreme-Value models, Water Resour. Res., 30, 1653–1664, https://doi.org/10.1029/94wr00154, 1994.
García, L. E., Matthews, J. H., Rodriguez, D. J., Wijnen, M., DiFrancesco, K. N., and Ray, P.: Beyond Downscaling: A Bottom-Up Approach to Climate Adaptation for Water Resources Management, World Bank Group, Washington, DC, 62, 2014.
Gestengabe, R. W. and Werner, P. C.: Katalog der Grosswetterlagen Europas (1881–2004) Nach Paul Hess Und Helmut Brezowsky, Potsdam Institut Für Klimafolgenforschung, Postdam, Germany, 2005.
Glaser, R., Riemann, D., Schönbein, J., Barriendos, M., Brázdil, R., Bertolin, C., Camuffo, D., Deutsch, M., Dobrovolný, P., van Engelen, A., Enzi, S., Halíčková, M., Koenig, S. J., Kotyza, O., Limanówka, D., Macková, J., Sghedoni, M., Martin, B., and Himmelsbach, I.: The variability of European floods since AD 1500, Climatic Change, 101, 235–256, 2010.
Gomez-Moreno, M.: Catálogo Monumental de España. Provincia de Zamora, Ministerio de Instrucción Pública y Bellas Artes, Madrid, 1927.
Gutiérrez González, J. A.: Orígenes y evolución urbana de Zamora, in: Civitas, MC Aniversario de la Ciudad de Zamora, Junta de Castilla y León, Imprenta Jambrina, Zamora, Spain, 20–33, 1993.
Herget, J. and Meurs, H.: Reconstructing peak discharges for historic flood levels in the city of Cologne, Germany, Global Planet. Change, 70, 108–116, https://doi.org/10.1016/j.gloplacha.2009.11.011, 2010.
Hurrell, J. W.: Decadal Trends in the North Atlantic Oscillation: Regional Temperatures and Precipitation, Science, 269, 676–679, https://doi.org/10.1126/science.269.5224.676, 1995.
IPCC: Special Report on Managing the Risks of Extreme Events and Disasters to Advance Climate Change Adaptation, Cambridge Univ. Press, New York, NY, USA, 582 pp., 2012.
Kagan, R. L.: Ciudades del Siglo de Oro. Las vistas españolas de Anton van der Wyngaede, Ediciones El Viso, Madrid, Spain, 432 pp., 2008.
Kundzewicz, Z. W., Lugeri, N., Dankers, R., Hirabayashi, Y., Döll, P., Pińskwar, I., Dysarz, T., Hochrainer, S., and Matczak, P.: Assessing river flood risk and adaptation in Europe – review of projections for the future, Mitig. Adapt. Strat. Gl., 15, 641–656, https://doi.org/10.1007/s11027-010-9213-6, 2010.
Kundzewicz, Z. W., Kanae, S., Seneviratne, S. I., Handmer, J., Nicholls, N., Peduzzi, P., Mechler, R., Bouwer, L. M., Arnell, N., Mach, K., Muir-Wood, R., Brakenridge, G. R., Kron, W., Benito, G., Honda, Y., Takahashi, K., and Sherstyukov, B.: Flood risk and climate change: global and regional perspectives, Hydrol. Sci. J., 59, 1–28, https://doi.org/10.1080/02626667.2013.857411, 2014.
Kundzewicz, Z. W., Su, B., Wang, Y., Wang, G., Wang, G., Huang, J., and Jiang, T.: Flood risk in a range of spatial perspectives – from global to local scales, Nat. Hazards Earth Syst. Sci., 19, 1319–1328, https://doi.org/10.5194/nhess-19-1319-2019, 2019.
La Opinión – El Correo de Zamora: Memoria Gráfica de Zamora, La Opinión – El Correo de Zamora, Junta de Castilla y León and Caja España, Zamora, Spain, 396 pp., 2000.
Lang, M., Ouarda, T. B. M. J., and Bobée, B.: Towards operational guidelines for over-threshold modelling, J. Hydrol., 225, 103–117, 1999.
Larrén, H.: La evolución urbana de la ciudad de Zamora a través de los vestigios arqueológicos, Codex aquilarensis: cuadernos de investigación del Monasterio de Santa María la Real,, 15, 91–118, 1999.
Lavers, D. A. and Villarini, G.: The contribution of atmospheric rivers to precipitation in Europe and the United States, J. Hydrol., 522, 382–390, https://doi.org/10.1016/j.jhydrol.2014.12.010, 2015.
Lavers, D. A., Villarini, G., Allan, R. P., Wood, E. F., and Wade, A. J.: The detection of atmospheric rivers in atmospheric reanalyses and their links to British winter floods and the large-scale climatic circulation, J. Geophys. Res.-Atmos., 117, D20106, https://doi.org/10.1029/2012JD018027, 2012.
Lavers, D. A., Allan, R. P., Villarini, G., Lloyd-Hughes, B., Brayshaw, D. J., and Wade, A. J.: Future changes in atmospheric rivers and their implications for winter flooding in Britain, Environ. Res. Lett., 8, 034010, https://doi.org/10.1088/1748-9326/8/3/034010, 2013.
Leese, M. N.: Use of censored data in the estimation of Gumbel distribution parameters for annual maximum flood series, Water Resour. Res., 9, 1534–1542, https://doi.org/10.1029/WR009i006p01534, 1973.
Lins, H. F. and Cohn, T. A.: Stationarity: Wanted dead or alive?, J. Am. Water Resour. As., 47, 475–480, https://doi.org/10.1111/j.1752-1688.2011.00542.x, 2011.
López, J. and Francés, F.: Non-stationary flood frequency analysis in continental Spanish rivers, using climate and reservoir indices as external covariates, Hydrol. Earth Syst. Sci., 17, 3189–3203, https://doi.org/10.5194/hess-17-3189-2013, 2013.
López-Moreno, J. I., Beguería, S., Vicente-Serrano, S. M., and García-Ruiz, J. M.: Influence of the North Atlantic Oscillation on water resources in central Iberia: Precipitation, streamflow anomalies, and reservoir management strategies, Water Resour. Res., 43, W09411, https://doi.org/10.1029/2007WR005864, 2007.
López-Moreno, J. I., Vicente-Serrano, S. M., Morán-Tejeda, E., Lorenzo-Lacruz, J., Kenawy, A., and Beniston, M.: Effects of the North Atlantic Oscillation (NAO) on combined temperature and precipitation winter modes in the Mediterranean mountains: Observed relationships and projections for the 21st century, Global Planet. Change, 77, 62–76, https://doi.org/10.1016/j.gloplacha.2011.03.003, 2011.
Loureiro, A.: Portos marítimos de Portugal e Ilhas Adjacentes, Imprensa Nacional, Lisboa, Portugal, 520 pp., 1904.
Luterbacher, J., Schmutz, C., Gyalistras, D., Xoplaki, E., and Wanner, H.: Reconstruction of monthly NAO and EU indices back to AD 1675, Geophys. Res. Lett., 26, 2745–2748, https://doi.org/10.1029/1999GL900576, 1999.
Macdonald, N.: Reassessing flood frequency for the River Trent through the inclusion of historical flood information since AD 1320, Hydrol. Res., 44, 215–233, https://doi.org/10.2166/nh.2012.188, 2013.
Machado, M. J., Botero, B. A., López, J., Francés, F., Díez-Herrero, A., and Benito, G.: Flood frequency analysis of historical flood data under stationary and non-stationary modelling, Hydrol. Earth Syst. Sci., 19, 2561–2576, https://doi.org/10.5194/hess-19-2561-2015, 2015.
Marquina, R. J.: Proyecto del Salto de Villalcampo en el Río Duero (Zamora), Anexo 3, Determinación de la máxima avenida probable, Saltos del Duero S. A., Zamora, 82 pp., 1941–1944.
Marquina, R. J.: Crecidas extraordinarias del río Duero. Parte 1: Datos Históricos, Revista de Obras Públicas, 97, Madrid, Spain, 202–213, 1949a.
Marquina, R. J.: Crecidas extraordinarias del río Duero. Parte 2: Determinación de Caudales, Revista de Obras Públicas, 97, Madrid, Spain, 370–377, 1949b.
Martin Serrano, A.: La definicion y el encajamiento de la red fluvial actual sobre el macizo Hesperico en el marco de su geodinamica alpina, Revista de la Sociedad Geologica de España, 4, 337–351, 1991.
Milly, P. C. D., Betancourt, J., Falkenmark, M., Hirsch, R. M., Kundzewicz, Z. W., Lettenmaier, D. P., and Stouffer, R. J.: Climate change – Stationarity is dead: Whither water management?, Science, 319, 573–574, https://doi.org/10.1126/science.1151915, 2008.
Ministerio de Medio Ambiente (MMA): Guía Metodológica para el desarrollo del Sistema Nacional de Cartografía de Zonas Inundables, Ministerio de Medio Ambiente y Medio Rural y Marino Madrid, Spain, 349 pp., available at: https://www.miteco.gob.es/es/agua/publicaciones/guia_metodologica_ZI.aspx (last access: 26 November 2021), 2011.
Morán-Tejeda, E., Fassnacht, S. R., Lorenzo-Lacruz, J., López-Moreno, J. I., García, C., Alonso-González, E., and Collados-Lara, A.-J.: Hydro-Meteorological Characterization of Major Floods in Spanish Mountain Rivers, Water, 11, 2641, https://doi.org/10.3390/w11122641, 2019.
Naulet, R., Lang, M., Ouarda, T., Coeur, D., Bobee, B., Recking, A., and Moussay, D.: Flood frequency analysis on the Ardeche river using French documentary sources from the last two centuries, J. Hydrol., 313, 58–78, https://doi.org/10.1016/j.jhydrol.2005.02.011, 2005.
Nobre, G. G., Jongman, B., Aerts, J., and Ward, P. J.: The role of climate variability in extreme floods in Europe, Environ. Res. Lett., 12, 084012, https://doi.org/10.1088/1748-9326/aa7c22, 2017.
Oliva, M., Ruiz-Fernández, J., Barriendos, M., Benito, G., Cuadrat, J. M., Domínguez-Castro, F., García-Ruiz, J. M., Giralt, S., Gómez-Ortiz, A., Hernández, A., López-Costas, O., López-Moreno, J. I., López-Sáez, J. A., Martínez-Cortizas, A., Moreno, A., Prohom, M., Saz, M. A., Serrano, E., Tejedor, E., Trigo, R., Valero-Garcés, B., and Vicente-Serrano, S. M.: The Little Ice Age in Iberian mountains, Earth-Sci. Rev., 177, 175–208, https://doi.org/10.1016/j.earscirev.2017.11.010, 2018.
Pardé, M.: Sur la génèse et les caractères de plusieurs grandes inondations récentes, Ann. Geog., 62, 18–36, 1953.
Puig y Larraz, G.: Descripción física y geológica de la provincia de Zamora, Comisión del Mapa Geológico de España, Imprenta y Fundición de Manuel Tello, Madrid, Spain, 488 pp., 1883.
Ralph, F. M., Neiman, P. J., Wick, G. A., Gutman, S. I., Dettinger, M. D., Cayan, D. R., and White, A. B.: Flooding on California's Russian River: Role of atmospheric rivers, Geophys. Res. Lett., 33, L13801, https://doi.org/10.1029/2006GL026689, 2006.
Ralph, F. M., Neiman, P. J., Kiladis, G. N., Weickmann, K., and Reynolds, D. W.: A Multiscale Observational Case Study of a Pacific Atmospheric River Exhibiting Tropical–Extratropical Connections and a Mesoscale Frontal Wave, Mon. Weather Rev., 139, 1169–1189, https://doi.org/10.1175/2010mwr3596.1, 2011.
Ralph, F. M., Dettinger, M. D., Lavers, D. A., Gorodetskaya, I., Martin, A., Viale, M., White, A., Oakley, N. S., Rutz, J. J., Spackman, J. R., Wernli, H., and Cordeira, J. M.: Atmospheric rivers emerge as a global science and applications focus, B. Am. Meteorol. Soc., 98, 1969–1973, https://doi.org/10.1175/BAMS-D-16-0262.1, 2017.
Rodríguez-Méndez, F. J. and García-Gago, J. M.: Wyngaerde en Zamora, EGE Revista de Expresión Gráfica en la Edificación, 8, 67–75, https://doi.org/10.4995/ege.2014.12486, 2014.
Rodríguez-Méndez, F. J., Andrés-Rodrigo, H., Rubio-Cavero, M. P., and García-Gago, J. M.: El puente medieval de Zamora a comienzos del siglo XX. Un estudio del alcance de la intervención del ingeniero Luis de Justo, Anuario 2009 Instituto de Estudios Zamoranos Florián de Ocampo, Zamora, 26, 227–268, 2012.
Rodríguez-Rodríguez, L., Antón, L., Rodés, Á., Pallàs, R., García-Castellanos, D., Jiménez-Munt, I., Struth, L., Leanni, L., Aumaître, G., Bourlès, D., and Keddadouche, K.: Dates and rates of endo-exorheic drainage development: Insights from fluvial terraces (Duero River, Iberian Peninsula), Global Planet. Change, 193, 103271, https://doi.org/10.1016/j.gloplacha.2020.103271, 2020.
Salgueiro, A. R., Machado, M. J., Barriendos, M., Pereira, H. G., and Benito, G.: Flood magnitudes in the Tagus River (Iberian Peninsula) and its stochastic relationship with daily North Atlantic Oscillation since mid-19th Century, J. Hydrol., 502, 191–201, https://doi.org/10.1016/j.jhydrol.2013.08.008, 2013.
Serinaldi, F. and Kilsby, C. G.: Stationarity is undead: Uncertainty dominates the distribution of extremes, Adv. Water Resour., 77, 17–36, https://doi.org/10.1016/j.advwatres.2014.12.013, 2015.
Silva, J. and Oliveira, M.: As cheias na parte portuguesa da bacia hidrográfica do rio Douro, III Congreso Ibérico sobre gestión y planificación del agua: “La Directiva Marco del Agua: realidades y futuros”, Fundación Nueva Cultura del Agua, University of Seville, Sevilla, Spain, 13–17 November 2002, 16 pp., 2002.
Stedinger, J. R. and Cohn, T. A.: Flood Frequency Analysis With Historical and Paleoflood Information, Water Resour. Res., 22, 785–793, https://doi.org/10.1029/WR022i005p00785, 1986.
Stewart, I. T.: Changes in snowpack and snowmelt runoff for key mountain regions, Hydrol. Process., 23, 78–94, https://doi.org/10.1002/hyp.7128, 2009.
St. George, S., Hefner, A. M., and Avila, J.: Paleofloods stage a comeback, Nat. Geosci., 13, 766–768, https://doi.org/10.1038/s41561-020-00664-2, 2020.
Taborda, J. P.: O Temporal de 3 a 6 de Dezembro de 1739 em Portugal. Reconstituição a partir de fontes documentais descritivas, Finisterra, 41, 73–86, https://doi.org/10.18055/Finis1450, 2006.
Trigo, R., Varino, F., Ramos, A., Valente, M., Zêzere, J., Vaquero, J., Gouveia, C., and Russo, A.: The record precipitation and flood event in Iberia in December 1876: description and synoptic analysis, Frontiers in Earth Science, 2, feart.2014.00003, https://doi.org/10.3389/feart.2014.00003, 2014.
United Nations Office for Disaster Risk Reduction (UNISDR): Sendai Framework for Disaster Risk Reduction 2015–2030, UNISDR, Geneva, Switzerland, 37 pp., 2015.
Vaquero, J. M.: Solar Signal in the Number of Floods Recorded for the Tagus River Basin over the Last Millennium, Climatic Change, 66, 23–26, https://doi.org/10.1023/B:CLIM.0000043146.37662.de, 2004.
Velhas E.: As cheias na área urbana do Porto: risco, percepção e ajustamentos, Territorium, 4, 49–62, 1997.
Veilleux, A. G., Cohn, T. A., Flynn, K. M., Mason Jr., R. R., and Hummel, P. R.: Estimating magnitude and frequency of floods using the PeakFQ 7.0 program, Reston, VA, Report 2013-3108, https://doi.org/10.3133/fs20133108, 2014.
Waliser, D. and Guan, B.: Extreme winds and precipitation during landfall of atmospheric rivers, Nat. Geosci., 10, 179–183, https://doi.org/10.1038/ngeo2894, 2017.
Wetter, O., Pfister, C., Weingartner, R., Reist, T., Trösch, J., and Luterbacher, J.: The largest floods in the high Rhine Basin since 1268 assessed from documentary and instrumental evidence, Hydrol. Sci. J., 56, 733–758, https://doi.org/10.1080/02626667.2011.583613, 2011.
Wilhelm, B., Ballesteros Cánovas, J. A., Macdonald, N., Toonen, W. H. J., Baker, V., Barriendos, M., Benito, G., Brauer, A., Corella, J. P., Denniston, R., Glaser, R., Ionita, M., Kahle, M., Liu, T., Luetscher, M., Macklin, M., Mudelsee, M., Munoz, S., Schulte, L., St. George, S., Stoffel, M., and Wetter, O.: Interpreting historical, botanical, and geological evidence to aid preparations for future floods, Wiley Interdisciplinary Reviews: Water, 6, e1318, https://doi.org/10.1002/wat2.1318, 2019.
Woollings, T., Hannachi, A., and Hoskins, B.: Variability of the North Atlantic eddy-driven jet stream, Q. J. Roy. Meteor. Soc., 136, 856–868, https://doi.org/10.1002/qj.625, 2010.
Zataraín-Fernández, M.: Apuntes y noticias curiosas para formalizar la historia eclesiástica de Zamora y su Diócesis, Ed. San José, Zamora, 355 pp., available at: https://bibliotecadigital.jcyl.es/es/consulta/registro.cmd?id=3769 (last access: 24 November 2021), 1898.