the Creative Commons Attribution 4.0 License.
the Creative Commons Attribution 4.0 License.
 | 11 Dec 2020
From skill to value: isolating the influence of end user behavior on seasonal forecast assessment
Matteo Giuliani
Louise Crochemore
Ilias Pechlivanidis
Andrea Castelletti
Recent improvements in initialization procedures and representation of large-scale hydrometeorological processes have contributed to advancing the accuracy of hydroclimatic forecasts, which are progressively more skillful over seasonal and longer timescales. These forecasts are potentially valuable for informing strategic multisector decisions, including irrigated agriculture, for which they can improve crop choices and irrigation scheduling. In this operational context, the accuracy associated with the forecast system setup does not necessarily yield proportional marginal benefit, as this is also affected by how forecasts are employed by end users. This paper aims at quantifying the value of hydroclimatic forecasts in terms of potential economic benefit to the end users, which allows for the inference of a relation between gains in forecast skill and gains in end user profit. We also explore the sensitivity of this benefit to both forecast system setup and end user behavioral factors. These analyses are supported by an evaluation framework demonstrated on the Lake Como system (Italy), a regulated lake operated for flood protection and irrigation supply. Our framework relies on an integrated modeling chain composed of three building blocks: bias-adjusted seasonal meteorological forecasts are used as input to the continentally calibrated E-HYPE hydrological model; predicted lake inflows are used for conditioning the daily lake operations; and the resulting lake releases feed an agricultural model to estimate the net profit of the farmers in a downstream irrigation district. Results suggest that despite the gain in average conditions being negligible, informing the operations of Lake Como based on seasonal hydrological forecasts during intense drought episodes allows about 15 % of the farmers' profit to be gained with respect to a baseline solution not informed by any forecast. Moreover, our analysis suggests that behavioral factors capturing different perceptions of risk and uncertainty significantly impact the quantification of the benefit to the end users, whereby the estimated forecast value is potentially undermined by different levels of end user risk aversion. Lastly, our results show an intricate skill-to-value relation modulated by the underlying hydrologic conditions, which is well aligned over an exponential function in dry years, while the gains in profit are almost insensitive to the improvements in forecast skill in wet years.
- Article
(3754 KB) - Full-text XML
- BibTeX
- EndNote


Recent advances in initialization procedures (e.g., Ceglar et al., 2018) and representation of large-scale hydrometeorological processes (e.g., Krysanova et al., 2017) have contributed to greatly advancing the accuracy of hydroclimatic services. State-of-the-art meteorological and hydrological forecast products are increasingly skillful over seasonal and longer timescales and thus are becoming valuable assets for informing strategic decisions contributing to flood protection (e.g., Coughlan de Perez et al., 2017; Neumann et al., 2018), drought management (e.g., Crochemore et al., 2017; Turco et al., 2017), or hydropower production (e.g., Block, 2011; Boucher and Ramos, 2018). Irrigated agriculture is one of the sectors expected to benefit the most from hydroclimatic services to better inform crop choices and irrigation scheduling decisions (e.g., Li et al., 2017; Guimarães Nobre et al., 2019), which strongly depend on the expected hydrometeorological conditions.
In such operational contexts, it is key to communicate forecast accuracy along with hydroclimatic services (Contreras et al., 2020). Accuracy depends on the forecast system setup, which introduces uncertainties that depend on initial hydroclimatic conditions on the forecast date, scenarios of predicted meteorological conditions (e.g., climate model outputs), and sometimes the adopted impact model (Pechlivanidis et al., 2020). At seasonal timescales, probabilistic forecasts are often used to convey these uncertainties, potentially adding value for decision-making (see Georgakakos and Graham, 2008; Cloke and Pappenberger, 2009, and references therein).
The idea of moving from forecast accuracy to value has been explored in a few recent studies that quantify the value generated by informing water system operations with perfect or synthetic forecasts (e.g., Turner et al., 2017; Denaro et al., 2017) or a prespecified real forecast product (e.g., Anghileri et al., 2016; Nayak et al., 2018), in terms of increased system reliability. Only a few studies (e.g., Li et al., 2017; Delorit and Block, 2019) assess the economic value of existing hydroclimatic services in informing the solution of planning problems, which require single decisions to be made (e.g., selection of crop to cultivate) without considering how they influence analogous decisions in the future.
Building on these studies, in this paper we quantify the value of hydroclimatic services by extending traditional forecast quality assessment methods with estimates of the potential economic benefit of the forecasts in informing operational decisions. The approach is demonstrated on the Lake Como system (Italy), a regulated lake primarily operated for flood control and irrigation supply. Here, we use an evaluation framework to support the inference of a relation between gains in forecast skill and in end user (farmers) profit over a range of diverse hydroclimatic conditions, including extreme drought episodes. The proposed framework relies on an integrated modeling chain composed of three building blocks: (1) bias-adjusted seasonal meteorological forecasts are used as input to a European-wide hydrological model; (2) predicted lake inflows are then used for conditioning the daily lake operations; and (3) the resulting lake releases finally feed a crop growth model to estimate the forecast value in terms of gain in net profit for the farmers in the downstream irrigation district. This combination of a state-of-the-art hydroclimatic service with a detailed model of the Lake Como basin makes our findings particularly valuable for the selected case study area, which is located in the region with the highest share of irrigated areas in Europe (Eurostat, 2019).
In this context, we used our framework to isolate the component of the hydrological modeling chain mostly contributing to the estimated forecast value, as well as to assess the sensitivity of the results to different end user interpretations of the probabilistic forecast information. Forecast value is filtered by the way end users make use of the provided information, and there is growing evidence that higher forecast accuracy does not necessarily imply better decisions because of the challenges associated with the human interpretation of forecasts as well as with the communication of probabilistic information (Ramos et al., 2010, 2013; Crochemore et al., 2016). The personal interpretation of uncertainty is indeed a subjective process affected by multiple factors, including the way outcomes are framed, the severity of the event being forecasted, and the personal behavioral attitude of the end users (Gigerenzer et al., 2005; Joslyn et al., 2009). Individual behaviors and risk perceptions therefore play a key role in influencing the end user assessment of probabilistic seasonal forecast value (Kirchhoff et al., 2013). However, this point has been so far investigated mostly via serious games, interviews, or direct interactions with decision makers, while our work aims at providing a quantitative analysis of this challenge by simulating how different behavioral attitudes (modeled by specific forecast quantiles capturing increasing levels of drought risk aversion) influence the interpretation of the forecast ensemble and ultimately impact operational decisions and resulting performance.
The paper is organized as follows: in the next section we introduce the Lake Como study site, while Sect. 3 describes the adopted evaluation framework. Results and discussion are reported in Sect. 4, while conclusions and final remarks are presented in the last section.
Located in the Italian Alps, the Lake Como basin (Fig. 1) is a highly controlled water system, including a large regulated lake (active capacity 247 Mm3) serving a wide irrigation-fed cultivated area (1320 km2), where maize is the most widely grown and productive crop (52 % of the area and 1.5 Mt yr−1). The hydrometeorological regime is typical of subalpine regions, characterized by dry periods in winter and summer and peaks in late spring and autumn fed by snowmelt and rainfall, respectively. Snowmelt during May–July is the most important contribution to the accumulation of the seasonal storage, which is then used for irrigation supply in the summer during the peak demand period. The latter often exceeds the natural water availability and makes the role of the lake operation paramount in the system.
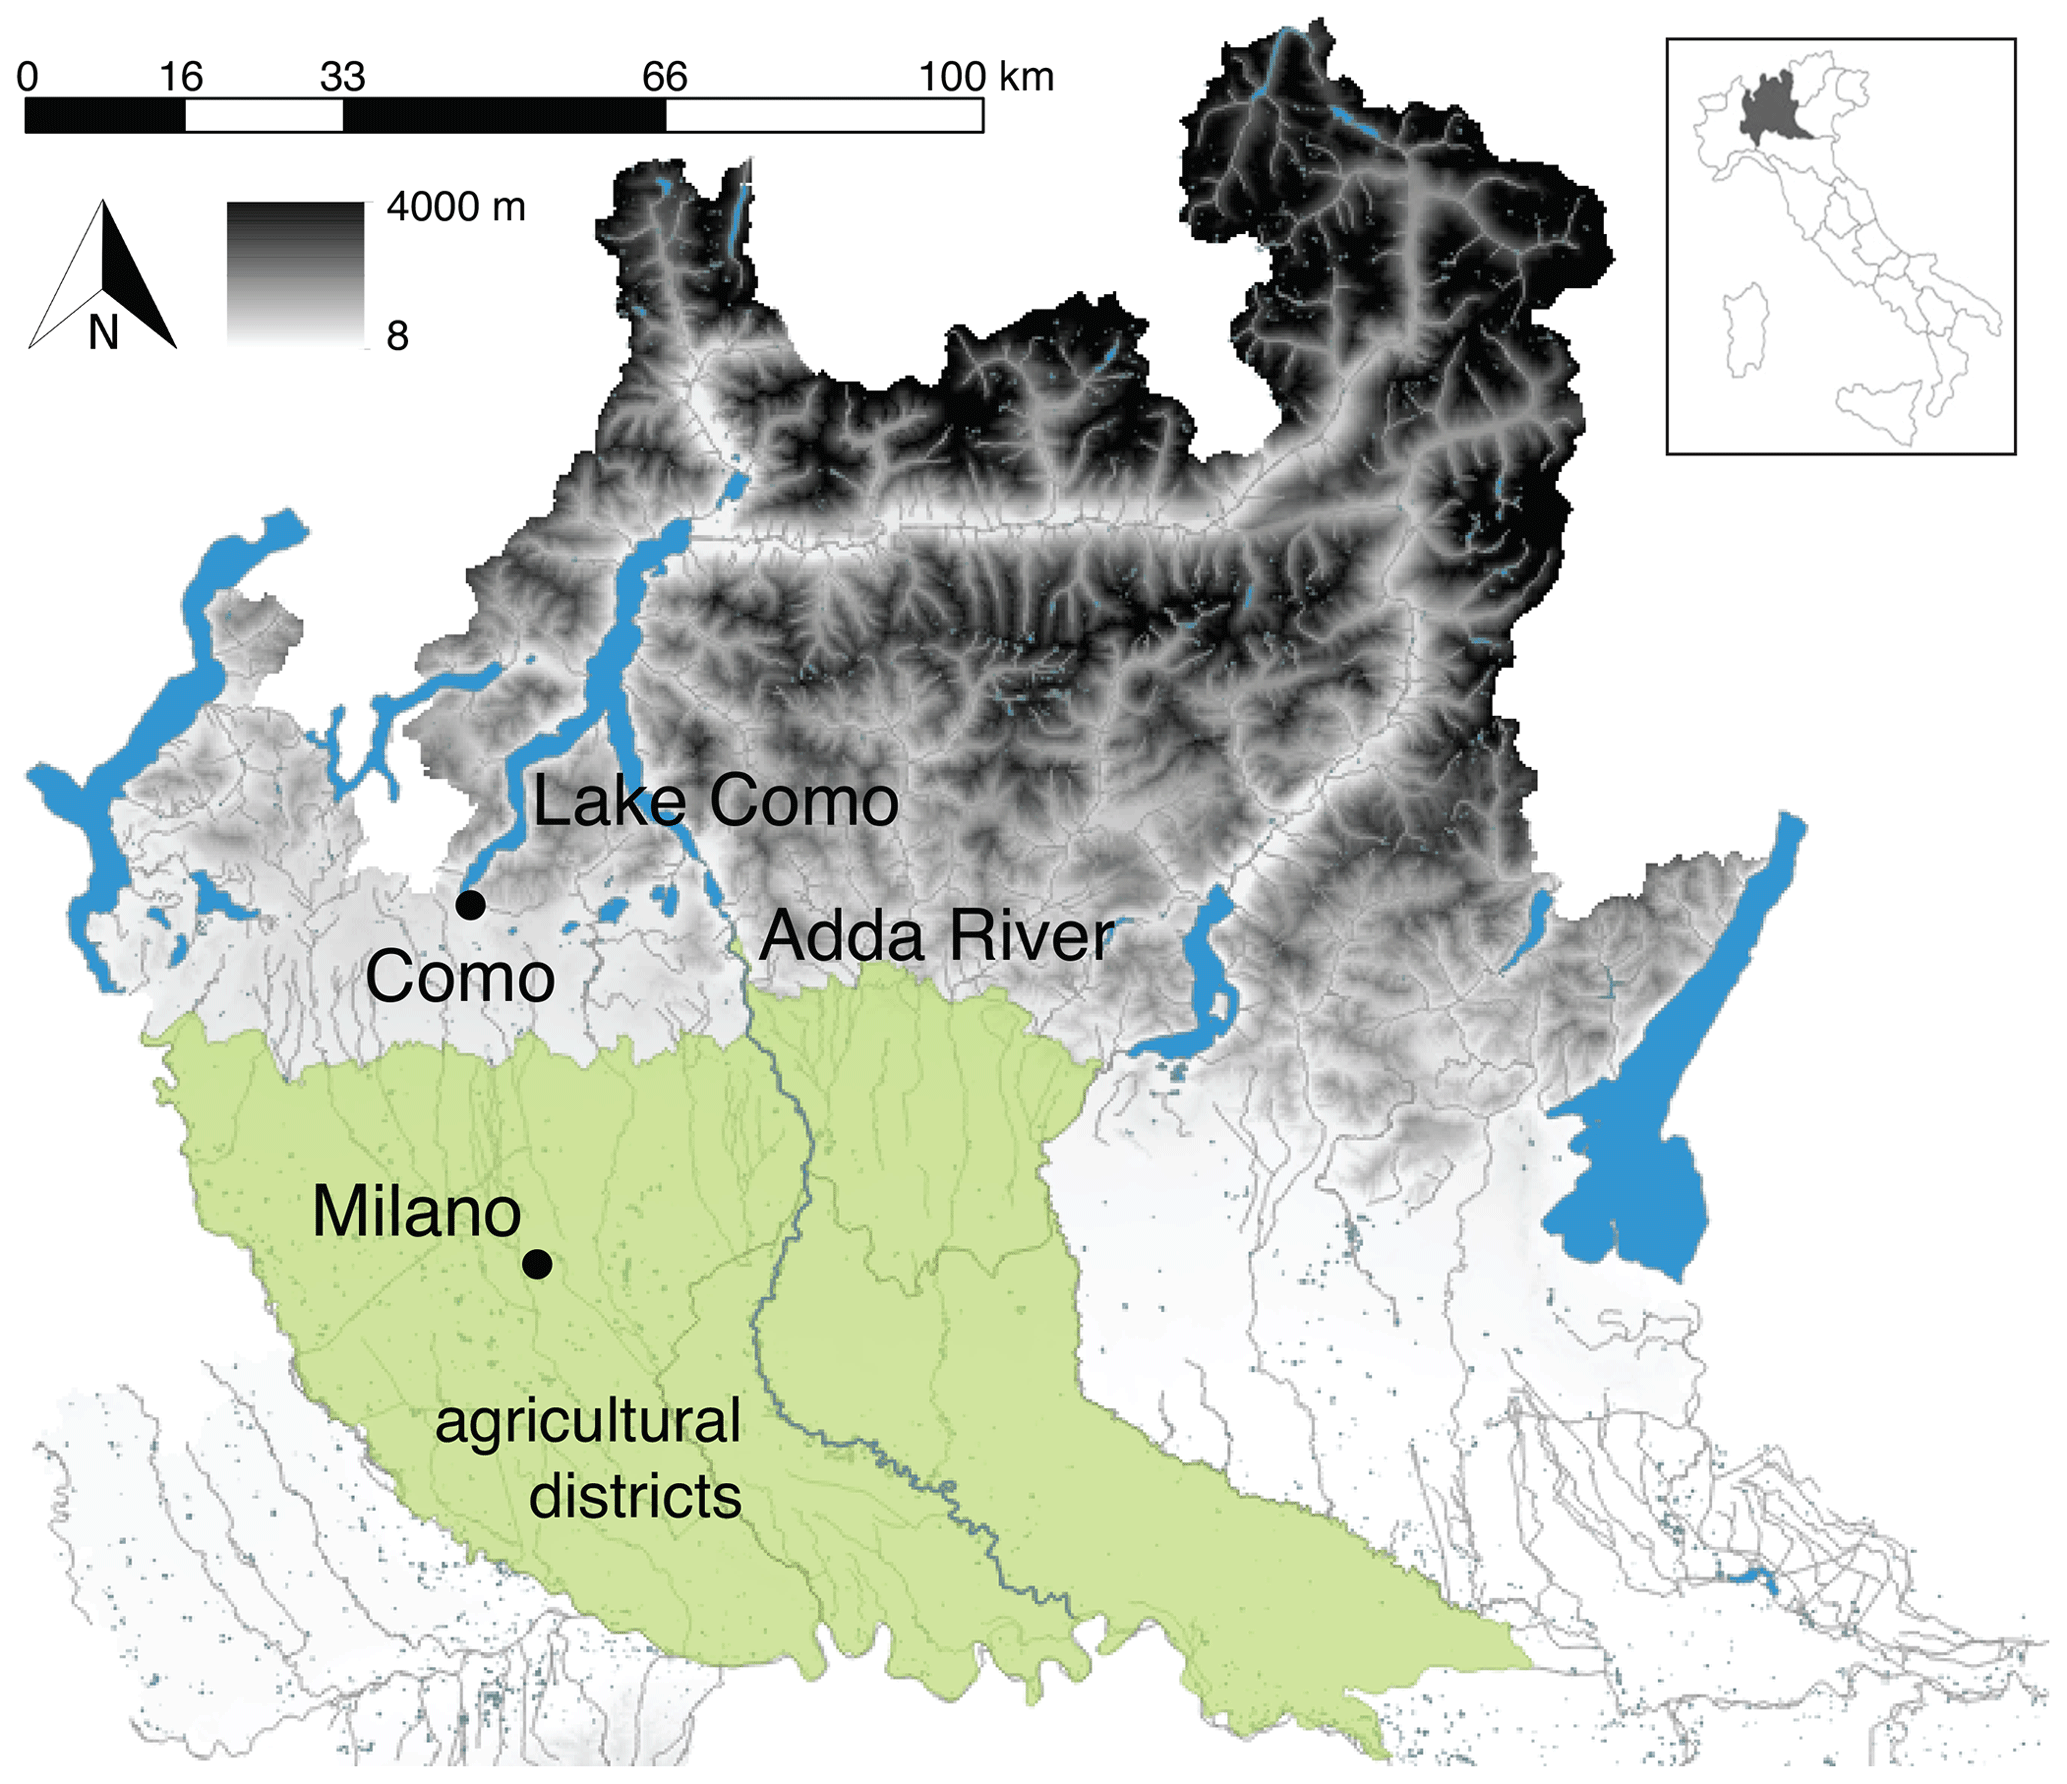
Figure 1Map of the Lake Como basin. The map was generated via Q-GIS using layers from the Geoportal of Regione Lombardia (http://www.geoportale.regione.lombardia.it/, last access: July 2016).
The regulation of the lake has been actively studied since the 1980s (e.g., Guariso et al., 1984, 1986) and is driven by two primary competing objectives: water supply, mainly for irrigation, and flood control in the city of Como, which sits at the lowest elevation on the lake shoreline and hence is exposed to flood risk. The agricultural districts downstream prefer to store snowmelt in the lake to satisfy the peak summer water demands, when the natural inflow is insufficient to meet irrigation requirements. Yet, storing such water increases the lake level and, consequently, the flood risk. Additional interests are related to navigation, fishing, tourism, and ecosystems, which further challenge the existing water management strategies and motivate the search for more efficient solutions relying on hydroclimatic services. On the basis of previous works (e.g., Castelletti et al., 2010; Giuliani and Castelletti, 2016; Giuliani et al., 2016a; Denaro et al., 2017), the two primary objectives (both to be minimized) can be formulated as follows:
-
Flood control (JF) is the average annual number of flooding days in the simulation horizon, defined as days when the lake level is higher than the flooding threshold of 1.24 m.
-
Water supply deficit (JD) is the daily average quadratic water deficit between the lake release and the daily water demand of the downstream system, subject to the minimum environmental flow constraint to ensure adequate environmental conditions in the Adda River. The water demand is given by the sum of the water rights of different users and does not vary across years. This quadratic formulation (Hashimoto et al., 1982) generates hedging strategies that minimize large deficits that would generate crop failures while accepting small, distributed deficits that can be tolerated by most cultivated crops. Notably, the computation of the water supply deficit includes a time-varying parameter that penalizes the deficit experienced after germination to the beginning of phenological maturity more, with these crop stages determined by the agricultural district model.
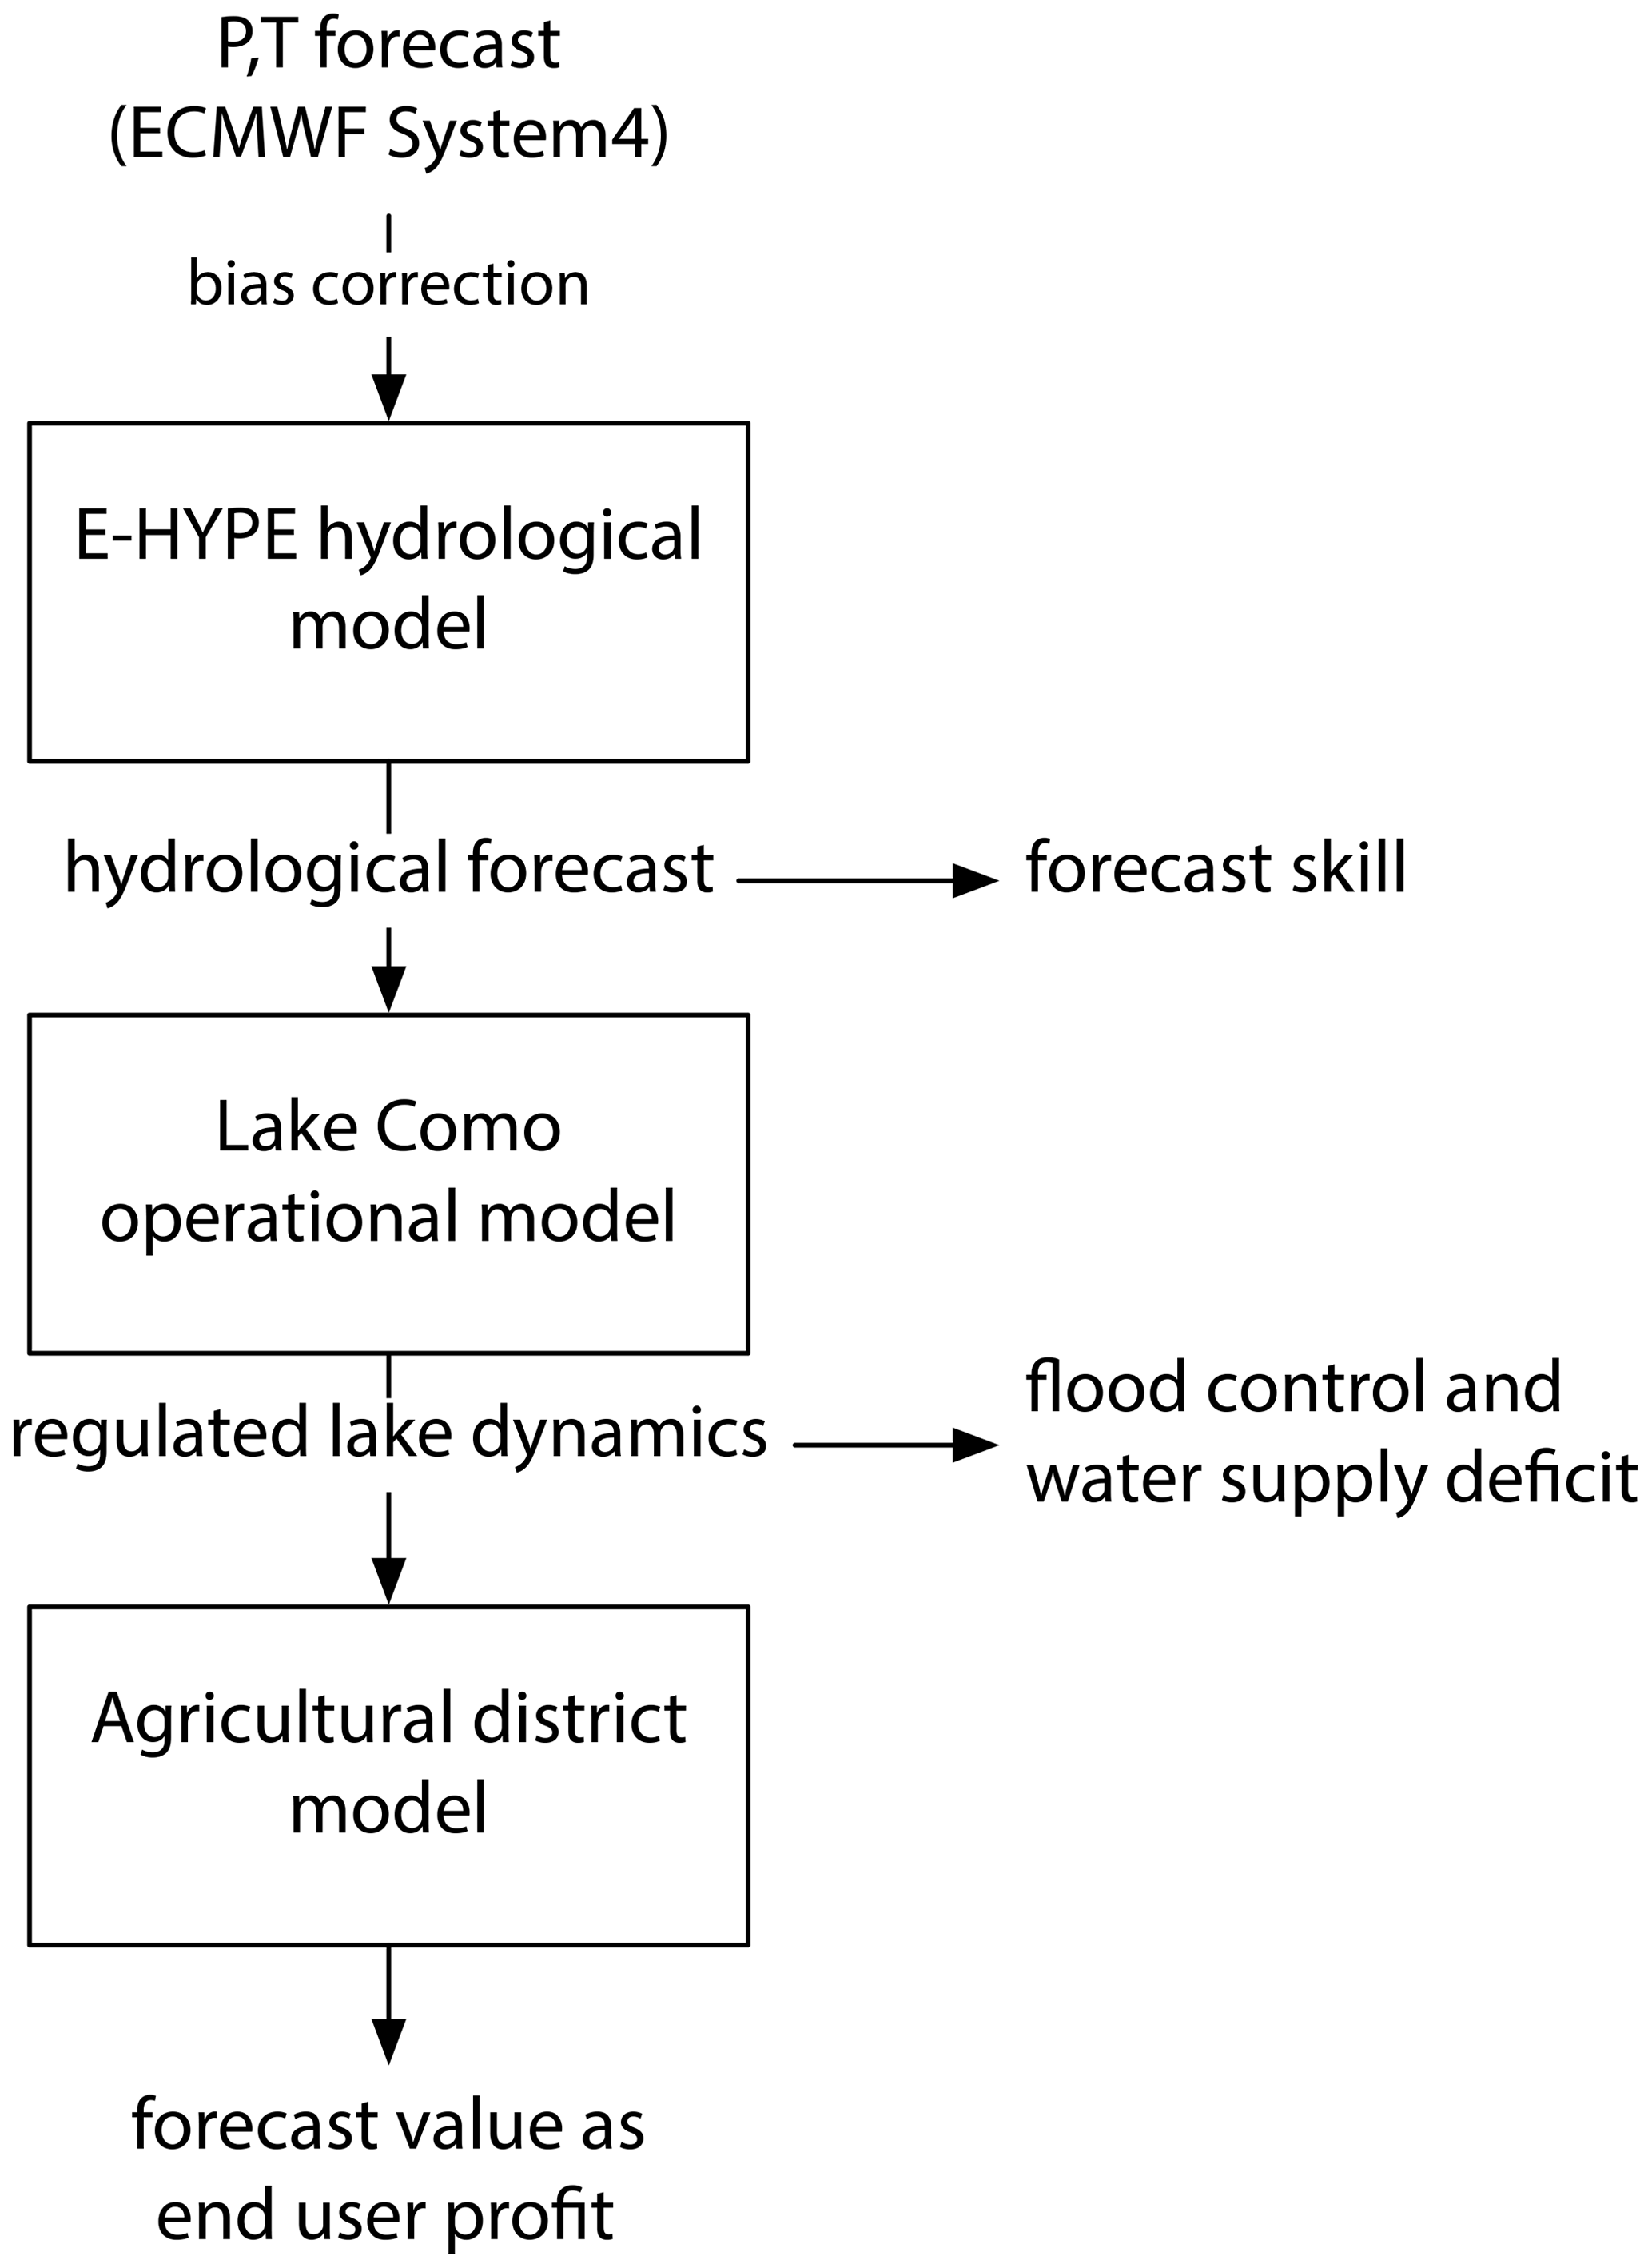
The overall workflow of our evaluation framework relies on an integrated modeling chain composed of the three building blocks illustrated in Fig. 2: (i) the E-HYPE hydrological model produces seasonal forecasts of the Lake Como inflows driven by ECMWF System 4; (ii) the Lake Como operational model designs the optimal lake regulation including the inflow forecasts as additional input in the operating policy that determines the water released by the dam; and (iii) the agricultural district model estimates the profit of the farmers in the Muzza district, which is the largest among the irrigation districts served solely by the Adda River (about 700 km2) as well as the one with the largest water concession (2370 Mm3 yr−1). A detailed description of each component of the evaluation framework is provided in the next subsections.
3.1 E-HYPE hydrological model
The European setup of the HYPE hydrological model (E-HYPE; Hundecha et al., 2016) was used to generate dynamical seasonal streamflow forecasts (Pechlivanidis et al., 2020). E-HYPE is a process-based model that reproduces streamflow and water balance over the entire European continent. Its parameters were calibrated based on a set of 115 catchments representing the diversity of land-use and soil characteristics, as well as human impacts, and over the 1980–1999 period. The model was validated in about 550 catchments for which streamflow observations are available (see details in Hundecha et al., 2016). Here, precipitation and temperature data from the WFDEI (WATCH Forcing Data methodology applied to ERA-Interim data) reanalysis (Weedon et al., 2014) were used as reference, and streamflow simulations were generated by forcing the E-HYPE model with WFDEI meteorological inputs. In the Lake Como basin, E-HYPE exhibits good overall performance in simulating yearly streamflow, though a distinct bias can be seen (Fig. 3a). E-HYPE achieves an average yearly root mean squared error (RMSE) of 748 Mm3 yr−1 in the Lake Como basin. This yearly performance hides an underestimation of winter flows and an overestimation of summer flows at the monthly time step (Fig. 3b), which is potentially due to an inaccurate representation of snowmelt dynamics in E-HYPE along with the alterations of the natural hydrologic processes introduced by the operations of the Alpine hydropower reservoirs in the upstream part of the basin. Despite these biases, Crochemore et al. (2020) showed that E-HYPE seasonal forecasts can yield skillful information as a local model when looking at anomalies relative to model long-term means as done in this work, whereby the Lake Como operations are optimized using E-HYPE seasonal forecast anomalies.
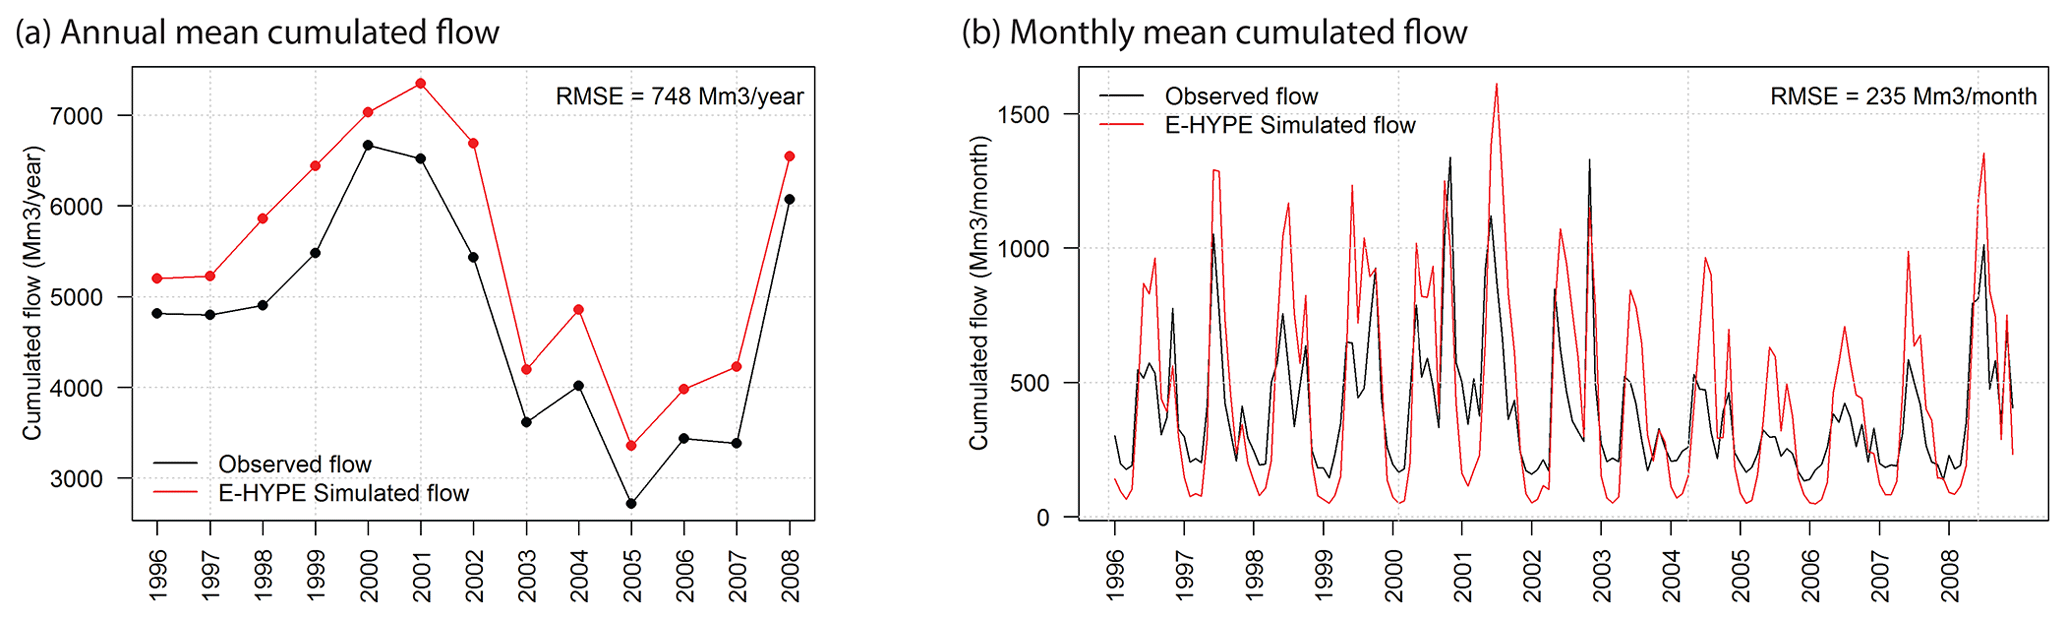
Figure 3Annual mean accumulated flow (a) and monthly mean accumulated flow from observations and E-HYPE simulations from 1996 to 2008 (b).
3.2 Operational model of the lake
As mentioned in the previous section, Lake Como is primarily operated looking at two competing objectives, namely water supply and flood control in the city of Como. The operational model of the lake is focused on reproducing the controlled dynamics of the lake, which is described by a mass balance equation assuming a modeling and decision-making time step of 24 h; i.e.,
where st is the lake storage (m3), and qt+1 and rt+1 are the net inflow (i.e., inflow minus evaporation losses) and the outflow volumes in the time interval , respectively. The release volume rt+1 is determined by a nonlinear, stochastic function that depends on the release decision ut (Soncini-Sessa et al., 2007). This function allows the effect of the uncertain inflows between the time t (at which the decision is taken) and the time t+1 (at which the release is completed) to be represented. The actual release might not be equal to the decision due to existing legal and physical constraints on the reservoir level and release, including spills when the reservoir level exceeds the maximum capacity.
The lake operation is determined by a closed-loop operating policy p that computes the release decision ut at each time step t as a function of the day of the year dt, the lake level ht, and the inflow forecast over the lead time τ. The Pareto-optimal operating policies are computed by solving a multi-objective optimal control problem (Castelletti et al., 2008), formulated as follows:
Note that the resolution of this problem does not yield a unique optimal solution but a set of optimal solutions exploring different trade-offs between flood control and irrigation supply. A solution is defined as being Pareto-optimal (or nondominated) if no other solution gives a better value for one objective without degrading the performance in at least one other objective. The image in the objective space of the Pareto-optimal solutions is the Pareto front. To evaluate the quality of the Pareto front we used the hypervolume indicator (HV), which allows for set-to-set evaluations by measuring both the convergence of the Pareto front under examination ℱ to the optimal one ℱ∗ and the representation of the full extent of trade-offs in the objective space (Zitzler et al., 2003). Specifically, this metric measures the volume of objective space dominated by the considered set of solutions as the hypervolume ratio between ℱ and ℱ∗.
3.3 Agricultural district model
The agricultural district model simulates the dynamic processes in the Muzza irrigation district. The model is composed of three distinct modules devoted to specific tasks: (i) a distributed-parameter water balance module that simulates water sources, conveyance, distribution, and soil–crop water balance (Facchi et al., 2004); (ii) a heat unit module that computes the sequence of growth stages as a function of the temperature (Neitsch et al., 2011); and (iii) a crop yield module that estimates the optimal and actual yields, accounting for the effects of stresses due to insufficient water supply that may have occurred during the agricultural season (Steduto et al., 2009). The water balance module partitions the irrigation district with a regular mesh of cells with a side length of 250 m, which allows for the representation of the space variability of crops, soil types, meteorological inputs, and irrigation distribution. Further details about the different model components are provided in Giuliani et al. (2016c) and Li et al. (2017). In this work we are however not exploring any farmers' decisions, and the agricultural district model is therefore not informed by the seasonal forecasts, while the value of weather and climate services in informing cropping pattern decisions is investigated in Li et al. (2017).
3.4 Data and experimental settings
The assessment of the forecast operational value is performed over the time period from 1 January 1996 to 31 December 2008. This period was selected because it shows good variability in the local hydrological conditions, including some intense droughts events that negatively impacted the agricultural production of the system.
For the purpose of this study, we consider two ensemble streamflow forecasts produced by E-HYPE. The first one is named ESP (ensemble streamflow prediction; Day, 1985) and is generated by forcing E-HYPE with WFDEI historical scenarios of precipitation and temperature that correspond to the time period of the forecast. The second one is named SYS4 and uses dynamical precipitation and temperature forecasts from the European Centre for Medium-Range Weather Forecasts (Molteni et al., 2011) as input to the E-HYPE model. These forecast inputs are bias-adjusted against the WFDEI reference with the Distribution-Based Scaling method (Yang et al., 2010) prior to running the hydrological model. Both ESP and SYS4 forecasts are delivered once a month in the form of a 15-member ensemble with a 7-month lead time. The ensemble means of both ESP and SYS4 are then accumulated over a lead time of 51 d. This time frame was demonstrated by Denaro et al. (2017) to be the most valuable among different lead times from 1 week to 2 months for improving Lake Como operations. In addition to considering the ensemble means, we investigate the sensitivity of the overall assessment framework with respect to end user behavioral factors. Specifically, we replace the ensemble mean with the 25th and 10th percentiles as well as with the ensemble minimum, which capture increasing levels of drought risk aversion. Lastly, the operational value of these forecast systems is benchmarked against a set of baseline solutions that rely on the local observed climatology and two sets of upper bound solutions using perfect forecasts corresponding to either E-HYPE simulations forced with meteorological observations or the observed lake inflows.
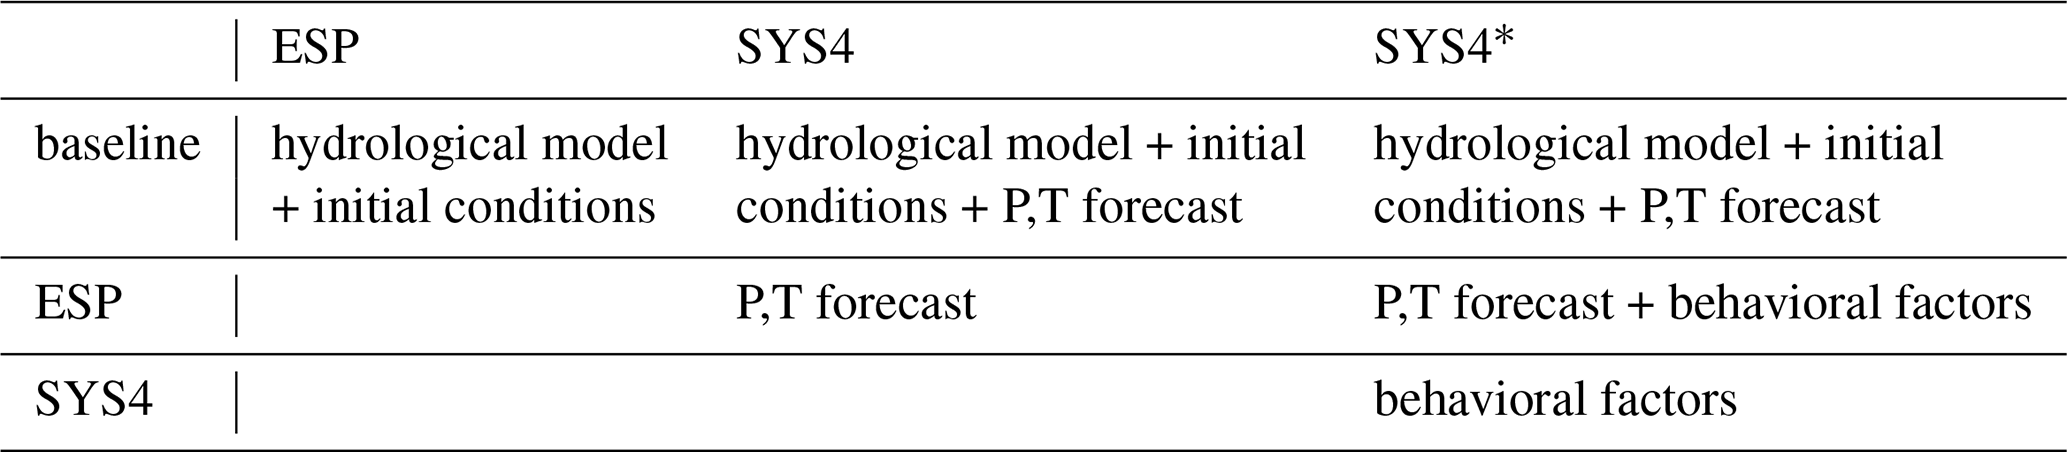
The comparative analysis of results obtained using different forecast products allows the sources of forecast value to be isolated, as illustrated in Table 1. The sources of forecast value include the initial hydrologic conditions, the hydrologic model, the predictions of precipitation and temperature, and the behavioral factors (i.e., the different percentiles of the forecast ensemble considered). In this matrix, each cell identifies the specific forecasting component that is responsible for the differences in farmers' profit using the forecast system indicated in the columns with respect to the benchmark indicated in the rows.
Table 1Benchmarking matrix to isolate the sources of forecast value: baseline is the observed climatology; ESP is the ensemble streamflow prediction of E-HYPE; SYS4 is the prediction generated by using dynamical precipitation and temperature forecasts as input for E-HYPE; and SYS4* replaces the ensemble mean used in SYS4, with different statistics capturing increasing levels of drought risk aversion.
To optimize the operating policy (see Eq. 2), we used the evolutionary multi-objective direct policy search (EMODPS) method (Giuliani et al., 2016b), a reinforcement learning approach that combines direct policy search, nonlinear approximating networks, and multi-objective evolutionary algorithms. The policies are defined as Gaussian radial basis functions (Busoniu et al., 2011), and the policy parameters are optimized using the self-adaptive Borg Multiobjective Evolutionary Algorithm (Hadka and Reed, 2013), a combination that has been demonstrated to be effective in solving these types of multi-objective policy design problems featuring the possibility of enlarging the information used for conditioning operational decisions (Giuliani et al., 2015; Zatarain-Salazar et al., 2016; Giuliani et al., 2018). Each optimization was run for 2 million function evaluations over the simulation horizon 1996–2008. To improve solution diversity and avoid dependence on randomness, the solution set from each formulation is the result of 20 random optimization trials. The final set of Pareto-optimal policies for each experiment is defined as the set of nondominated solutions from the results of all the optimization trials. In total, the analysis comprises 320 million simulations that required approximately 42 670 computing hours on an Intel Xeon E5-2660 2.20 GHz with 32 processing cores and 96 GB RAM. These high computational requirements explain the use of the water supply deficit as objective in the policy design rather than the farmers' profit, as the latter would require including the simulation of the agricultural model within the EMODPS optimization, substantially increasing the overall computation cost.
4.1 Forecast value for irrigated agriculture
Following the proposed evaluation framework (Fig. 2), the operational value of alternative forecast systems can firstly be assessed in terms of improvement in the overall set of Pareto-optimal solutions produced by the use of forecast information using the hypervolume indicator. Then, the simulation of the agricultural district model will provide a more tangible measure of the forecast operational value by converting the water supply deficit JD into monetary values of farmers' profit.
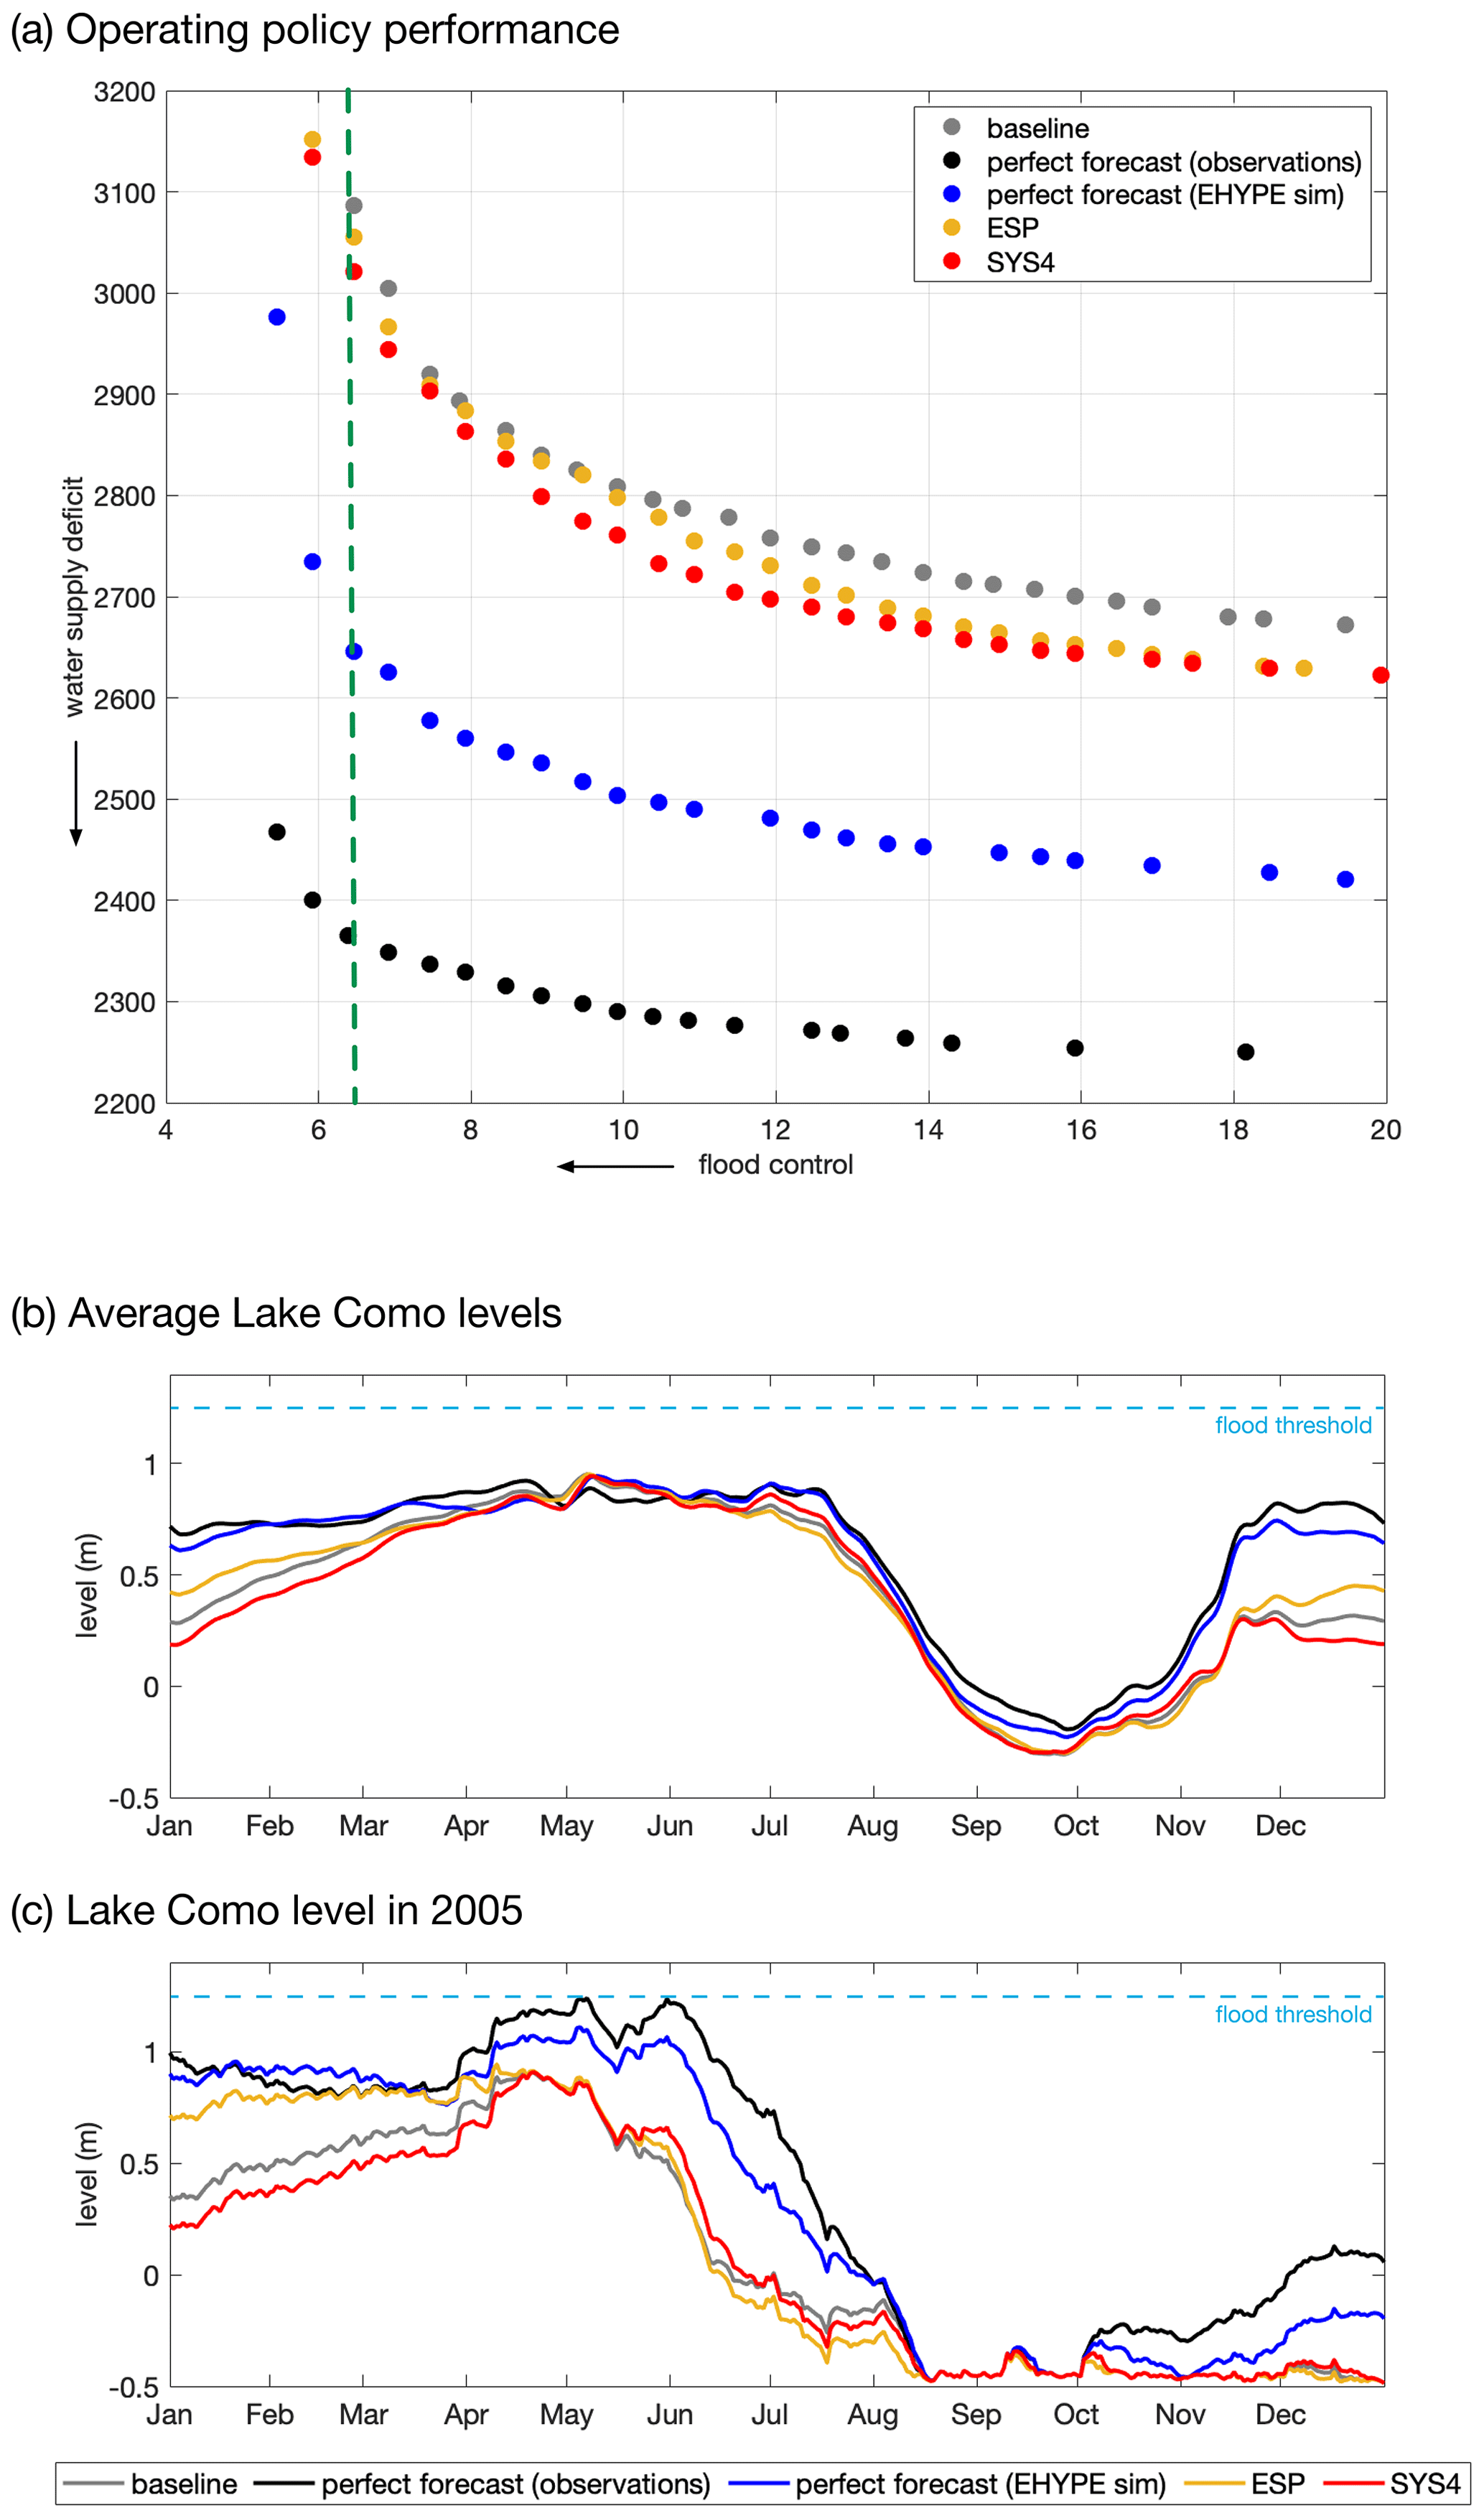
Figure 4Performance obtained by different Lake Como operating policies (a) informed with ESP and SYS4 forecasts, along with the upper bound of the system performance (perfect inflow forecasts from observations or E-HYPE simulation) and the baseline operating policies based on observed climatology. The dashed green line marks the performance of the historical lake regulation in terms of flood control. Analysis of average Lake Como levels (measured with respect to the Malgrate reference level at 197.37 m a.s.l.) under different operating policies (b) and during the extreme drought recorded in 2005 (c).
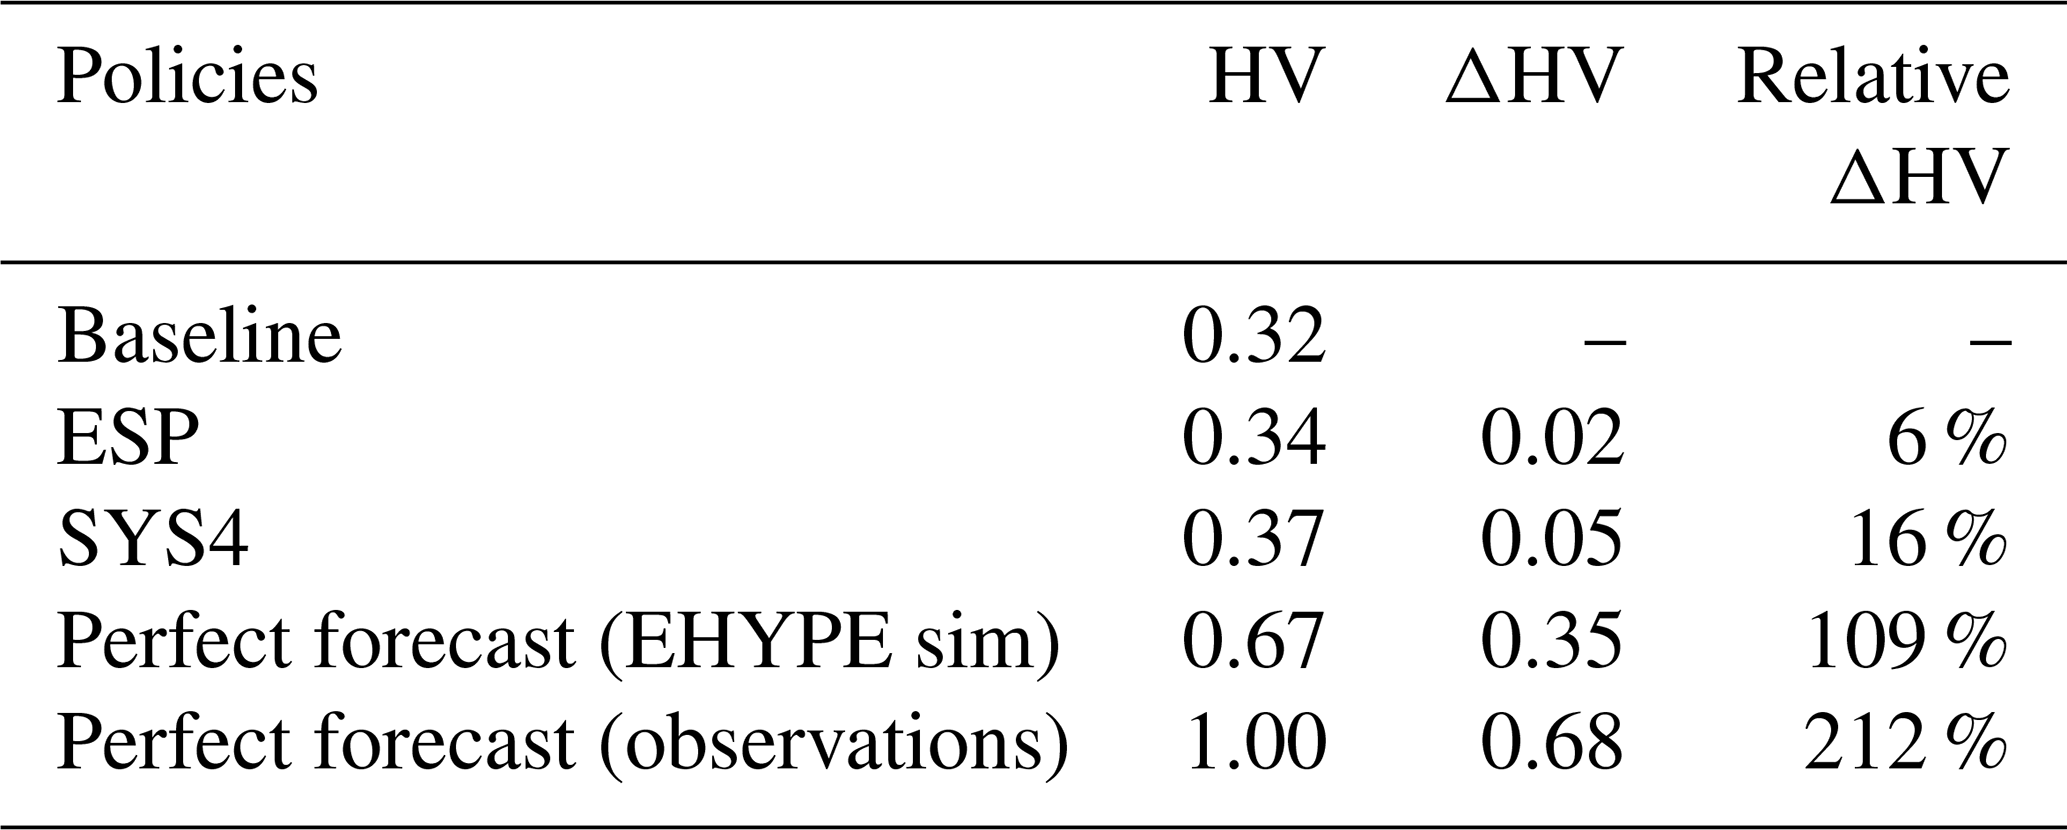
The performance of different sets of solutions obtained by solving the problem in Eq. (2) is shown in Fig. 4a, where each circle represents a different operating policy of Lake Como. The two axes of the figure represent the two operating objectives (to be minimized), and the arrows indicate the direction of increasing preference, with the best solution located in the bottom-left corner of the figure. The comparison of the different Pareto-optimal sets shows large differences in performance that determine a clear ranking of the generated solutions. Not surprisingly, the use of perfect forecasts, either in the form of local observations (black circles) or of E-HYPE simulation (blue circles), allows for the design of (ideal) policies that largely outperform the other solutions. The policies using ESP and SYS4 forecasts are also superior to the baseline solutions, particularly in terms of water supply deficit values. The 51 d lead time considered is indeed too long to provide valuable information to control the fast flood dynamics, which is on the order of a few days and would therefore require much shorter lead times. However, the downward shift of the Pareto fronts indirectly influences the performance in flood control as the new sets of operating policies using forecast information allow better compromise alternatives to be identified. The numerical quantification of the improvements in terms of both objectives is provided by the values of hypervolume indicator reported in Table 2, which estimate the ESP and SYS4 forecast values to be equal to 6 % and 16 % of the system performance, respectively.
Table 2Value of ESP, SYS4, and perfect forecasts in terms of hypervolume indicator (HV).
To better understand the contribution of the different forecast information to the Lake Como operations, we analyze the dynamic behavior of the system under operating policies that use distinct information. This analysis focuses on the solutions located along the dashed green line in Fig. 4a, which marks the performance of the historical lake regulation in terms of flood control. The rationale of this choice is to look at solutions that reduce the water supply deficit JD without degrading the performance in JF. The historical regulation cannot be used as a reference since it also includes additional objectives not accounted for in our model (e.g., navigation, fishing, tourism, ecosystem). All the simulated trajectories of the Lake Como level under each considered policy show a clear annual pattern, with the highest levels observed in late spring due to the snowmelt contribution (Fig. 4b). In this period, maximizing the storage while avoiding floods is crucial to support the summer drawdown cycle driven by high irrigation demands. The policies conditioned on perfect forecasts (black and blue lines) are able to maintain the highest level and to delay the drawdown. Conversely, the baseline solution (gray line), which has no information about future inflows, reaches the highest level at the beginning of May, and, subsequently, the level is maintained about 10 cm below the perfect forecast trajectory to allow space for buffering potential floods. A similar trajectory is followed by the policy informed by ESP and SYS4 forecasts (orange and red lines, respectively), which are on average almost overlapped until the third week of June, while they look more separated during the drawdown period with the SYS4 that is able to keep a high level also in July. In addition to the average levels, it is interesting to investigate the lake dynamics simulated under different solutions during the extreme drought recorded in 2005 (Fig. 4c). The low inflows experienced during this drought event produced an early drawdown of the lake level starting at the beginning of June, when the downstream water demand is at its maximum, with the levels reaching the lower limit of −0.50 m around middle August. This extreme event confirms and emphasizes the differences observed in the average lake levels; the policies conditioned on perfect forecasts maintain the highest level from April to mid-August, thus delaying the drawdown. ESP and SYS4 forecasts, although less efficient than the perfect forecast solutions, are able to keep higher lake levels than the baseline solution from mid-May to the beginning of July, thus reducing the water supply deficit. ESP and SYS4 solutions then reach lower levels than the baseline in the second half of the 2005 summer. This strategy can be considered an extreme drought mitigation measure triggered by the extreme drought conditions predicted for August in order to support a more reliable irrigation supply than under the baseline operations by sacrificing a few extra centimeters of lake level.
This analysis can be translated into economic terms via simulation of the agricultural district model, which estimates the crop production and the associated net profit (i.e., gross revenue minus production costs, also accounting for the EU Common Agricultural Policy subsidies; Gandolfi et al., 2014) for the farmers in the Muzza irrigation district served by the Lake Como releases under different operating policies. Figure 5 shows the same ranking of solutions obtained in the space of the operating objective (Fig. 4a), with the use of forecast information that allows, on average, from 1 % (ESP forecast) to 3.8 % (perfect forecasts from observations) of annual farmers' profit (i.e., from EUR 300 000 yr−1 to EUR 900 000 yr−1) to be gained in comparison to the EUR 24.07 million yr−1 attained by the baseline solution. Interestingly, these values are much larger when evaluated over the 2005 drought, when the baseline annual profit is only 20 % of the 1996–2008 average value. In this case, the perfect forecasts generate a profit that is 134 % (observations) and 92 % (E-HYPE simulation) higher than the baseline; the value of ESP and SYS4 also grows, producing a 5 % and 16 % increase in farmers' profit, respectively. These results suggest the large potential for using E-HYPE forecasts in the management of extreme droughts.

Figure 5Comparison of gains in farmers' profit with respect to the baseline solution under different Lake Como operating policies informed with ESP and SYS4 forecasts, along with the upper bound of the system performance (perfect inflow forecasts from observations or the E-HYPE simulation).
4.2 Impact of forecast system setup and behavioral factors on forecast value
Following the benchmarking analysis in Table 1, we investigate the isolated sources of forecast value by assessing the sensitivity of the farmers' profit to both the forecast system setup and end user behavioral factors. For the former aspect, we compare our baseline solution against the operating policies informed by ESP and SYS4 forecasts (using the ensemble means). For the latter, we explore increasing levels of risk aversion in the use of SYS4 forecasts by informing the operating policy with the 25th and 10th percentiles as well as the minimum of the forecast ensemble.
The results are reported in the comparative matrix in Table 3, which shows again the superiority of ESP and SYS4 over the baseline. Interestingly, the role of predicted precipitation and temperature in drought conditions differs from the average conditions. The use of SYS4 instead of ESP in 2005 generates a 11 % gain in farmers' profit, while this difference drops to 0.2 % in average conditions. Over the full period, the most important components of the forecast system are the hydrological model and the initial conditions, which together produce more than a 1 % increase in farmers' profit. Hydrological initial conditions provide the most similar gains between the entire period and the 2005 dry conditions, suggesting that this component is the least sensitive to hydrological conditions. The analysis of the behavioral factors shows that the potential operational value of SYS4 depends on the level of risk aversion used in interpreting the information provided by the forecast ensemble. The average 1.2 % increase in farmers' profit with respect to the baseline using the ensemble average grows to 1.35 % when the policy is informed by the ensemble minimum, probably because E-HYPE generally overestimates observed inflows (Fig. 3a), and predictions of winter low flows are more interesting for managing drought risk. However, results do not demonstrate a linear relationship between forecast value and risk aversion, with the average gain over the baseline being 1.16 % when using the 10th percentile of the ensemble (which is equal to the gain produced by the ensemble mean) and 0.9 % when using the 25th percentile of the ensemble.
In addition, our results show that the average contribution to the forecast value of predicted precipitation and temperature (+0.12 %) is comparable to the one of the isolated behavioral factors. A solution that uses the ensemble minimum produces a profit 0.14 % higher than using the ensemble mean (+0.31 % with respect to ESP), whereas the 25th percentile of the ensemble generates a 0.31 % reduction (−0.14 % with respect to ESP). This means that the added value of SYS4 meteorological forecasts can be potentially undermined if end users are not able to properly extract the most valuable information from the forecast ensemble. However, it should be noted that our results also show that there is not a single best statistic that consistently provides the most valuable information for improving the Lake Como operations. In average conditions, using the ensemble minimum marginally improves the farmers' profit with respect to all the other solutions informed by SYS4 forecasts; conversely, during the 2005 drought, using the 10th percentile is more valuable than the minimum. The use of risk-averse statistics in interpreting the forecast ensemble is therefore recommended for water supply operations exposed to drought risk, but more extensive investigations over multiple extreme events and, possibly, across different case studies are necessary to provide general recommendations.
Table 3Results of benchmarking analysis to isolate the sources of forecast value. The matrix reports the percentage change in farmers' profit for the forecast systems in the columns with respect to the benchmarks in the rows, estimated as average over the 1996–2008 period and for the 2005 drought (in parenthesis).

4.3 From forecast skills to end user value
Lastly, we aim to identify a relation between the increase in forecast skill and the resulting gain in farmer profit from the isolated forecast system components. Here, skill is computed as , where 𝒮 is the considered forecast system selected from the columns of Table 3, and ℬ is the benchmark used to isolate the sources of forecast skill/value selected from the rows of the table. The general assumption is that a gain in forecast skill should result in a gain in profits; however, the scatterplots in Fig. 6 show that this relation is more complex and is strongly dependent on the hydrologic conditions (i.e., annual inflow) of the considered year. The overall skill–profit relation in Fig. 6a suggests the existence of an exponential function in dry years (brown circles), while in wet years (green circles) the gain in profit does not seem to be sensitive to the gain in skill. This dependence is confirmed by Fig. 6b, where the dry years follow an exponential relationship quite well (i.e., the fitted function attains a R2=0.87), according to which a 10 % improvement in forecast skill obtained by initializing the hydrological model is associated with a 1 % gain in farmers' profit. Conversely, the blue circles are almost horizontally distributed, with the gain in profit almost insensitive to the improvements in forecast skill.
Interestingly, results significantly change when we compare the SYS4 mean against ESP to isolate the gain from dynamical precipitation and temperature forecasts (Fig. 6c). The forecasts are characterized by small losses and gains in both skill and profit that are not systematic and hardly interpretable. Moreover, in dry years the gains in skill using SYS4 forecasts do not necessarily translate into a gain in profit. Similar results appear in panels d, e, and f of the figure, which explore the gain in skill and profit generated by risk-averse behaviors against the SYS4 mean benchmark. However, in these three scatterplots we can still notice an exponential skill–profit relation for the driest years (dark brown circles). If we focus on the 2005 drought, which is the darkest circle in the top-right corner of Fig. 6d, e, and f, we observe an average 45 % increase in skill that is associated with an average 14 % gain in farmer profit. In these cases, the skill to profit relation becomes 3 to 1, confirming that improving the skill of seasonal forecasts is expected to be particularly valuable to inform the management of extreme drought events.
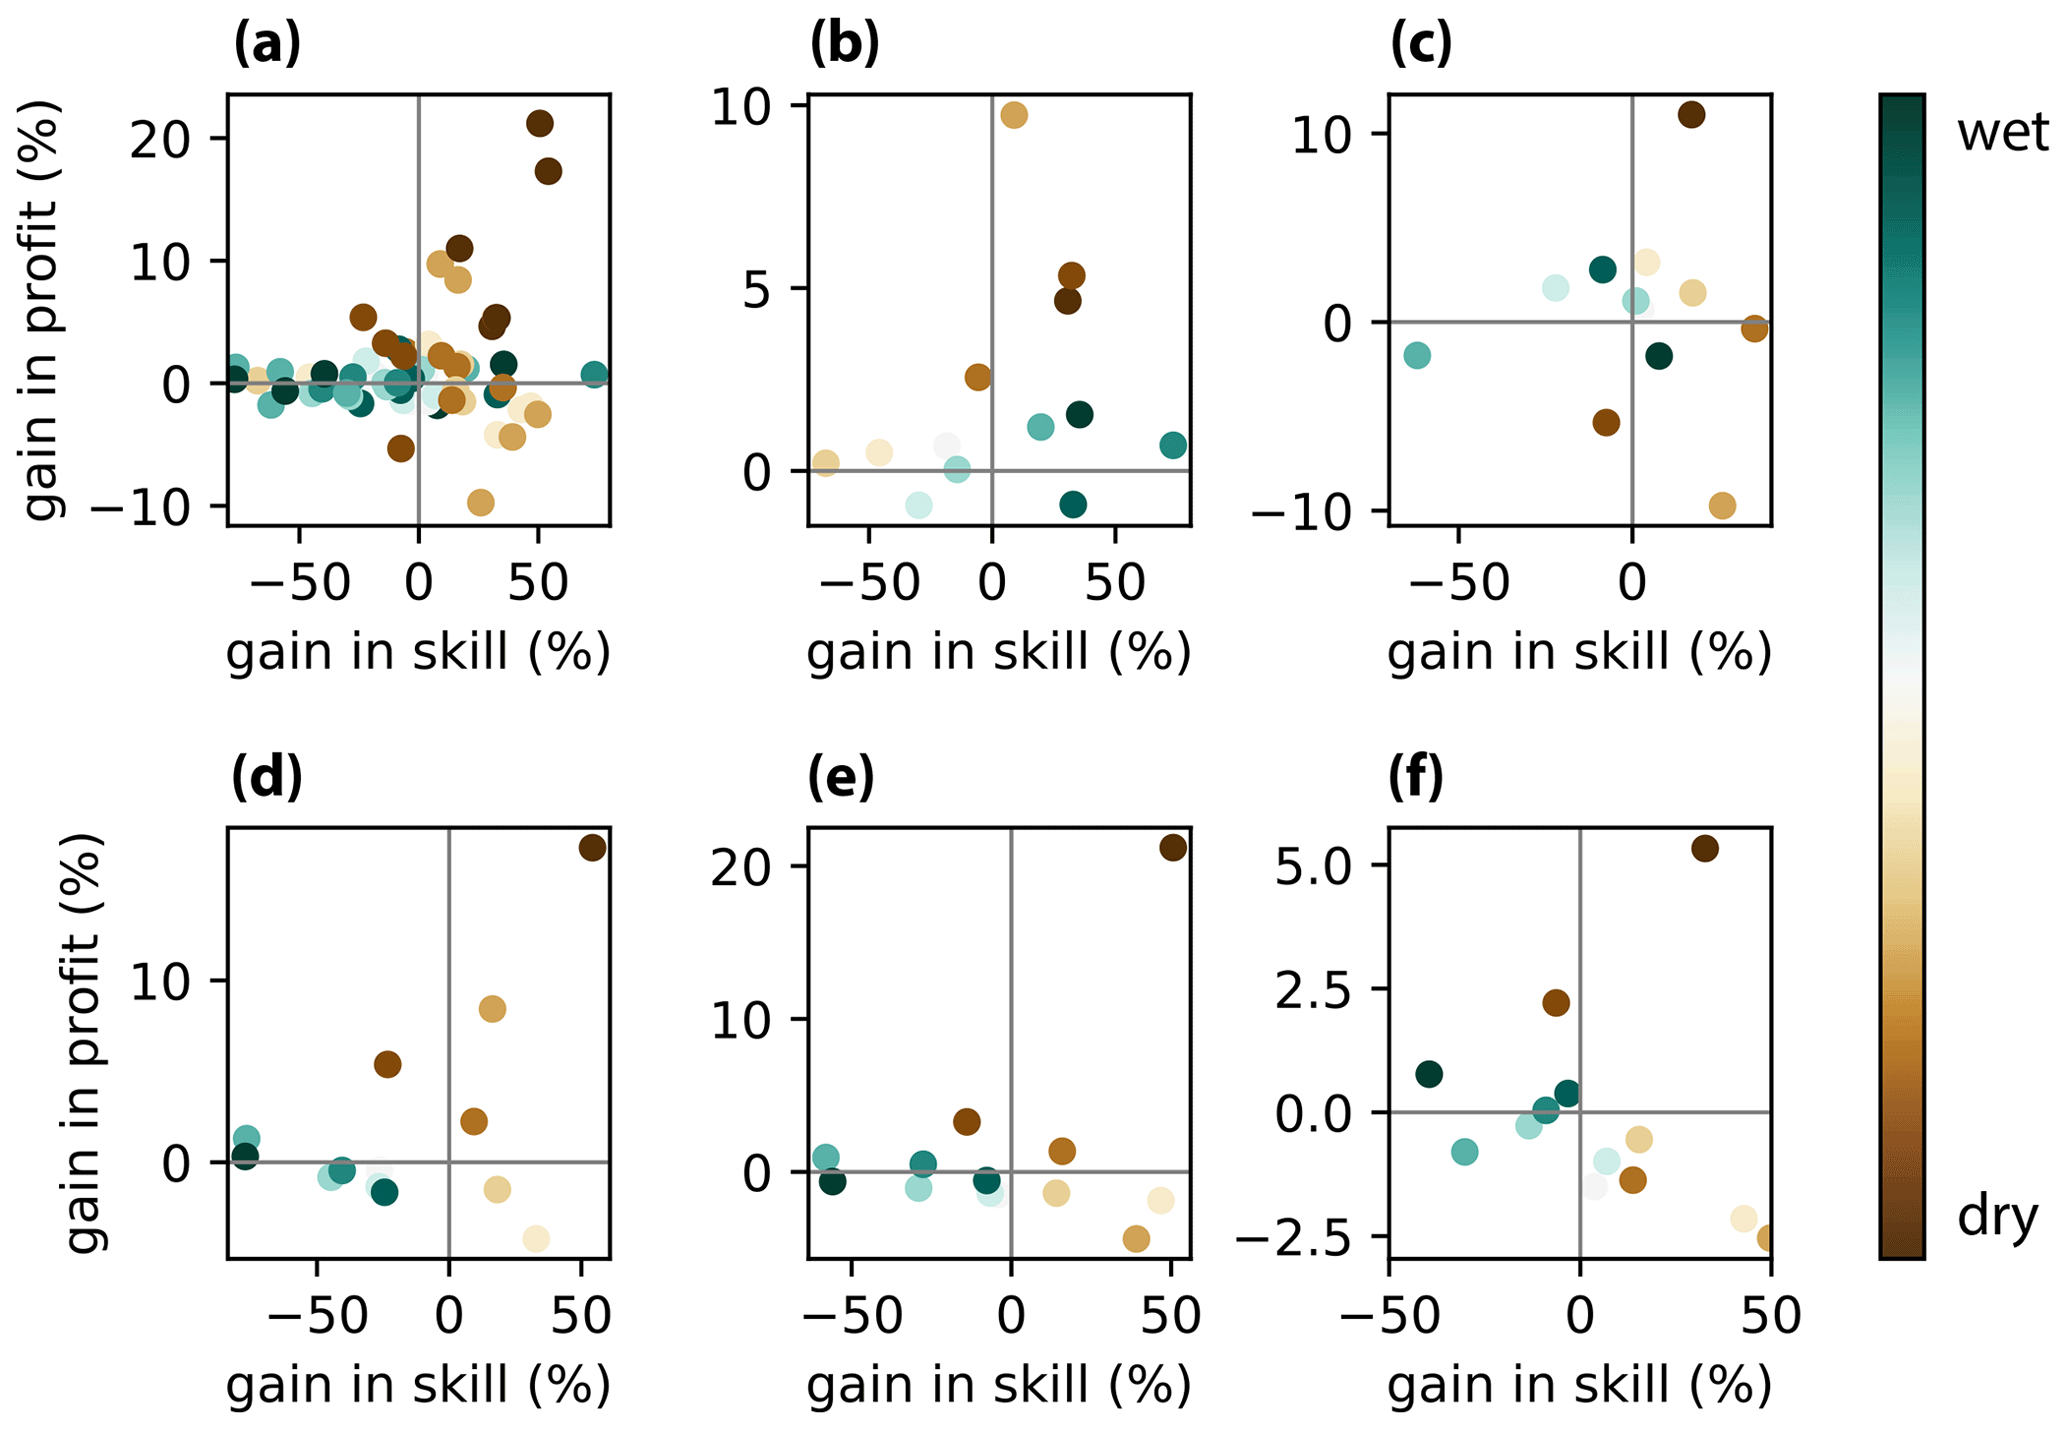
Figure 6Scatterplot between forecast skill and value. The color of the circles represents the hydrologic conditions (i.e., annual inflow to the lake) of the different years. Markers represent either an isolated component of the forecast system or a behavioral factor for each year over the 1996–2008 time period: all components (a), ESP vs. baseline (b), SYS4 – mean vs. ESP (c), SYS4 – min vs. SYS4 – mean (d), SYS4 – p10 vs. SYS4 – mean (e), and SYS4 – p25 vs. SYS4 – mean (f).
4.4 Limitations and future research
A limitation in the presented results is the relatively small number of points used to fit the forecast skill–value relationship. While it would certainly be interesting to repeat the analysis across multiple drought events as well as across different case studies characterized by diverse hydroclimatic regimes, in the context of this work we preferred to perform the analysis using highly detailed models whose associated computational requirements limit the possibility of easily increasing the sample size.
Moreover, it could be interesting to verify if the conclusions drawn by Crochemore et al. (2020) hold for the Lake Como basin by comparing the skill and value of E-HYPE forecasts against the ones generated by a fine-tuned local hydrologic model. Extending the economic analysis to other irrigated agricultural systems as well as other sectors (e.g., hydropower, flood protection) is also warranted. Finally, it would be interesting to assess the value of hydroclimatic services under a projected future climate characterized by more frequent and intense extreme events, which could make forecast information more valuable than under the historical climate.
In this paper, we quantify the value of hydroclimatic services in terms of added economic benefit of the forecasts in informing end user decisions. Moreover, we analyze the isolated sources of forecast value in terms of both forecast system setup and end user behavioral factors, and we also infer a relation between gains in forecast skill and gains in end user value. The evaluation framework is applied to the operations of Lake Como in the Italian lake district.
Numerical results demonstrate the potential of the E-HYPE hydrological forecast to inform the operations of Lake Como, generating an average EUR 290 000 yr−1 gain in the net profit of the farmers served by the lake releases (about 1 % of the average profit obtained by a baseline solution without forecast information). This gain rises up to 16 % (i.e., EUR 800 000 against a baseline profit equal to EUR 4.9 million) during the extreme drought experienced in 2005.
The analysis of the isolated sources of the estimated forecast value attributes the largest share of value to the initialization of the hydrological forecasts with conditions relevant to the forecast issue date. For the extreme drought of 2005, the forecast value is instead mostly attributable to the use of precipitation and temperature predictions and to risk-averse decisions focused on the lowest part of the forecast ensemble. In addition, our results show the need of transitioning from forecast skill assessment to integrated frameworks that include decision models and account for end user behavioral factors capturing different perceptions of risk and uncertainty. Investing in advanced training for decision makers and reservoir operators is expected to be crucial for maximizing the uptake of forecast information and its operational value (Crochemore et al., 2016). Conversely, the added value of hydroclimatic services might be undermined if end users are not able to adequately interpret the uncertainty associated with the forecast ensemble. Lastly, our results suggest a complex skill-to-value relation modulated by the underlying hydrologic conditions. While the gains in profit are almost insensitive to the improvements in forecast skill in wet years, our results show an exponential skill-to-value relation in dry conditions, where large gains in forecast skills are necessary to generate moderate gains in end user profit. This ratio becomes less demanding during extreme drought events.
The seasonal forecasts obtained through E-HYPE are publicly available on the HYPE web portal (https://hypeweb.smhi.se/explore-water/forecasts/seasonal-forecasts-europe/, SMHI, 2017). Local observations of lake inflows along with the other meteorological variables used by the agricultural district model were provided by Consorzio dell'Adda (http://www.addaconsorzio.it, Consorzio dell'Adda, 2016) and by Agenzia Regionale per la Protezione dell'Ambiente (https://www.arpalombardia.it/Pages/Meteorologia/Osservazioni-e-Dati/Dati-in-tempo-reale.aspx, ARPA Lombardia, 2015). The source code for the Lake Como simulation and EMODPS implementation is available on GitHub (https://github.com/mxgiuliani00/LakeComo, Giuliani and Environmental Intellingence Lab, 2019).
MG, LC, IP, and AC designed the research. MG and LC conducted the numerical experiments and led the data analysis, including the production of the figures in the paper. IP and AC contributed to the analysis of results. All authors were involved in the writing of the paper.
The authors declare that they have no conflict of interest.
The work has been partially funded by the European Commission under the IMPREX project belonging to the Horizon 2020 framework programme (grant no. 641811). Funding was also received from the EU Horizon 2020 project S2S4E (Sub-seasonal to seasonal forecasting for the energy sector) under grant no. 776787.
This paper was edited by Dimitri Solomatine and reviewed by two anonymous referees.
Anghileri, D., Voisin, N., Castelletti, A., Pianosi, F., Nijssen, B., and Lettenmaier, D.: Value of long-term streamflow forecasts to reservoir operations for water supply in snow-dominated river catchments, Water Resour. Res., 52, 4209–4225, 2016. a
ARPA Lombardia: Temperature massime e minime, Precipitazione, Umidità, Vento, Radiazione Solare, available at: https://www.arpalombardia.it/Pages/Meteorologia/Osservazioni-e-Dati/Dati-in-tempo-reale.aspx, last access: June 2015. a
Block, P.: Tailoring seasonal climate forecasts for hydropower operations, Hydrol. Earth Syst. Sci., 15, 1355–1368, https://doi.org/10.5194/hess-15-1355-2011, 2011. a
Boucher, M. and Ramos, M.: Ensemble Streamflow Forecasts for Hydropower Systems, Handbook of Hydrometeorological Ensemble Forecasting, pp. 1–19, 2018. a
Busoniu, L., Ernst, D., De Schutter, B., and Babuska, R.: Cross–Entropy Optimization of Control Policies With Adaptive Basis Functions, IEEE Transactions on systems, man and cybernetics – Part B: cybernetics, 41, 196–209, https://doi.org/10.1109/TSMCB.2010.2050586, 2011. a
Castelletti, A., Pianosi, F., and Soncini-Sessa, R.: Water reservoir control under economic, social and environmental constraints, Automatica, 44, 1595–1607, 2008. a
Castelletti, A., Galelli, S., Restelli, M., and Soncini-Sessa, R.: Tree-based reinforcement learning for optimal water reservoir operation, Water Resour. Res., 46, W09507, https://doi.org/10.1029/2009WR008898, 2010. a
Ceglar, A., Toreti, A., Prodhomme, C., Zampieri, M., Turco, M., and Doblas-Reyes, F.: Land-surface initialisation improves seasonal climate prediction skill for maize yield forecast, Sci. Rep., 8, 1322, https://doi.org/10.1038/s41598-018-19586-6, 2018. a
Cloke, H. and Pappenberger, F.: Ensemble flood forecasting: a review, J. Hydrol., 375, 613–626, 2009. a
Consorzio dell'Adda: Afflusso, available at: http://www.addaconsorzio.it, last access: August 2016. a
Contreras, E., Herrero, J., Crochemore, L., Pechlivanidis, I., Photiadou, C., Aguilar, C., and Polo, M. J.: Advances in the Definition of Needs and Specifications for a Climate Service Tool Aimed at Small Hydropower Plants' Operation and Management, Energies, 13, 1827, https://doi.org/10.3390/en13071827, 2020. a
Coughlan de Perez, E., Stephens, E., Bischiniotis, K., van Aalst, M., van den Hurk, B., Mason, S., Nissan, H., and Pappenberger, F.: Should seasonal rainfall forecasts be used for flood preparedness?, Hydrol. Earth Syst. Sci., 21, 4517–4524, https://doi.org/10.5194/hess-21-4517-2017, 2017. a
Crochemore, L., Ramos, M., Pappenberger, F., van Andel, S., and Wood, A.: An experiment on risk-based decision-making in water management using monthly probabilistic forecasts, B. Am. Meteorol. Soc., 97, 541–551, 2016. a, b
Crochemore, L., Ramos, M.-H., Pappenberger, F., and Perrin, C.: Seasonal streamflow forecasting by conditioning climatology with precipitation indices, Hydrol. Earth Syst. Sci., 21, 1573–1591, https://doi.org/10.5194/hess-21-1573-2017, 2017. a
Crochemore, L., Ramos, M., and Pechlivanidis, I.: Can Continental Models Convey Useful Seasonal Hydrologic Information at the Catchment Scale?, Water Resour. Res., 56, e2019WR025700. https://doi.org/10.1029/2019WR025700, 2020. a, b
Day, G.: Extended streamflow forecasting using NWSRFS, Journal of Water Resources Planning and Management, 111, 157–170, 1985. a
Delorit, J. and Block, P.: Using Seasonal Forecasts to Inform Water Market-Scale Option Contracts, Journal of Water Resources Planning and Management, 145, 04019018, https://doi.org/10.1061/(ASCE)WR.1943-5452.0001068, 2019. a
Denaro, S., Anghileri, D., Giuliani, M., and Castelletti, A.: Informing the operations of water reservoirs over multiple temporal scales by direct use of hydro-meteorological data, Adv. Water Resour., 103, 51–63, https://doi.org/10.1016/j.advwatres.2017.02.012, 2017. a, b, c
Eurostat: Agri-environmental indicator – irrigation, available at: https://ec.europa.eu/eurostat/statistics-explained/index.php/Agri-environmental_indicator_-_irrigation#Analysis_at_regional_level (last access: May 2020), 2019. a
Facchi, A., Ortuani, B., Maggi, D., and Gandolfi, C.: Coupled SVAT–groundwater model for water resources simulation in irrigated alluvial plains, Environ. Model. Softw., 19, 1053–1063, 2004. a
Gandolfi, C., Sali, G., Facchi, A., Tediosi, A., Bulgheroni, C., Rienzner, M., and Weber, E.: Integrated modelling for agricultural policies and water resources planning coordination, Biosyst. Eng., 128, 100–112, 2014. a
Georgakakos, K. and Graham, N.: Potential benefits of seasonal inflow prediction uncertainty for reservoir release decisions, J. Appl. Meteorol. Climatol., 47, 1297–1321, 2008. a
Gigerenzer, G., Hertwig, R., Van Den Broek, E., Fasolo, B., and Katsikopoulos, K.: “A 30 % chance of rain tomorrow”: How does the public understand probabilistic weather forecasts?, Risk Analysis, 25, 623–629, 2005. a
Giuliani, M. and Castelletti, A.: Is robustness really robust? How different definitions of robustness impact decision-making under climate change, Climatic Change, 135, 409–424, 2016. a
Giuliani, M. and Environmental Intellingence Lab: LakeComo, available at: https://github.com/mxgiuliani00/LakeComo, last access: April 2019. a
Giuliani, M., Pianosi, F., and Castelletti, A.: Making the most of data: an information selection and assessment framework to improve water systems operations, Water Resour. Res., 51, 9073–9093, https://doi.org/10.1002/2015WR017044, 2015. a
Giuliani, M., Castelletti, A., Fedorov, R., and Fraternali, P.: Using crowdsourced web content for informing water systems operations in snow-dominated catchments, Hydrol. Earth Syst. Sci., 20, 5049–5062, https://doi.org/10.5194/hess-20-5049-2016, 2016a. a
Giuliani, M., Castelletti, A., Pianosi, F., Mason, E., and Reed, P.: Curses, tradeoffs, and scalable management: advancing evolutionary multi-objective direct policy search to improve water reservoir operations, Journal of Water Resour. Plan. Manag., 142, 04015050, https://doi.org/10.1061/(ASCE)WR.1943-5452.0000570, 2016b. a
Giuliani, M., Li, Y., Castelletti, A., and Gandolfi, C.: A coupled human-natural systems analysis of irrigated agriculture under changing climate, Water Resour. Res., 52, 6928–6947, 2016c. a
Giuliani, M., Quinn, J. D., Herman, J. D., Castelletti, A., and Reed, P. M.: Scalable Multiobjective Control for Large-Scale Water Resources Systems Under Uncertainty, IEEE Transactions on Control Systems Technology, 26, 1492–1499, https://doi.org/10.1109/TCST.2017.2705162, 2018. a
Guariso, G., Orlovski, S., Rinaldi, S., and Soncini-Sessa, R.: An application of the risk-averse approach to the management of Lake Como, J. Appl. Syst. Anal. 5, 54–64, 1984. a
Guariso, G., Rinaldi, S., and Soncini-Sessa, R.: The Management of Lake Como: A Multiobjective Analysis, Water Resour. Res., 22, 109–120, https://doi.org/10.1029/WR022i002p00109, 1986. a
Guimarães Nobre, G., Hunink, J. E., Baruth, B., Aerts, J. C., and Ward, P. J.: Translating large-scale climate variability into crop production forecast in Europe, Sci. Rep., 9, 1277, https://doi.org/10.1038/s41598-018-38091-4, 2019. a
Hadka, D. and Reed, P.: Borg: An Auto–Adaptive Many–Objective Evolutionary Computing Framework, Evol. Comput., 21, 231–259, 2013. a
Hashimoto, T., Stedinger, J., and Loucks, D.: Reliability, resilience, and vulnerability criteria for water resource system performance evaluation, Water Resour. Res., 18, 14–20, 1982. a
Hundecha, Y., Arheimer, B., Donnelly, C., and Pechlivanidis, I.: A regional parameter estimation scheme for a pan-European multi-basin model, J. Hydrol. Reg. Stud., 6, 90–111, 2016. a, b
Joslyn, S., Nadav-Greenberg, L., Taing, M., and Nichols, R.: The effects of wording on the understanding and use of uncertainty information in a threshold forecasting decision, Applied Cognitive Psychology: The Official Journal of the Society for Applied Research in Memory and Cognition, 23, 55–72, 2009. a
Kirchhoff, C., Lemos, M., and Engle, N.: What influences climate information use in water management? The role of boundary organizations and governance regimes in Brazil and the US, Environ. Sci. Policy, 26, 6–18, 2013. a
Krysanova, V., Vetter, T., Eisner, S., Huang, S., Pechlivanidis, I., Strauch, M., Gelfan, A., Kumar, R., Aich, V., Arheimer, B., Chamorro, A., van Griensven, A., Kundu, D., Lobanova, A., Mishra, V., Plotner, S., Reinhardt, J., Seidou, O., Wang, X., Wortmann, M., Zeng, X., and Hattermann, F.: Intercomparison of regional-scale hydrological models and climate change impacts projected for 12 large river basins worldwide – a synthesis, Environ. Res. Lett., 12, 105002, https://doi.org/10.1088/1748-9326/aa8359, 2017. a
Li, Y., Giuliani, M., and Castelletti, A.: A coupled human–natural system to assess the operational value of weather and climate services for agriculture, Hydrol. Earth Syst. Sci., 21, 4693–4709, https://doi.org/10.5194/hess-21-4693-2017, 2017. a, b, c, d
Molteni, F., Stockdale, T., Balmaseda, M., Balsamo, G., Buizza, R., Ferranti, L., Magnusson, L., Mogensen, K., Palmer, T., and Vitart, F.: The new ECMWF seasonal forecast system (System 4), vol. 49, European Centre for Medium-Range Weather Forecasts Reading, UK, 2011. a
Nayak, M., Herman, J., and Steinschneider, S.: Balancing Flood Risk and Water Supply in California: Policy Search Integrating Short-Term Forecast Ensembles With Conjunctive Use, Water Resour. Res., 54, 7557–7576, https://doi.org/10.1029/2018WR023177, 2018. a
Neitsch, S., Arnold, J., Kiniry, J., and Williams, J.: Soil and Water Assessment Tool Theoretical Documentation Version 2009, Tech. Rep. 406, Grassland, Soil and Water Research Laboratory–Agricultural Research Service Blackland Research Center–Texas AgriLife Research, College Station, Texas, 2011. a
Neumann, J., Arnal, L., Magnusson, L., and Cloke, H.: The 2013/14 Thames Basin Floods: Do Improved Meteorological Forecasts Lead to More Skillful Hydrological Forecasts at Seasonal Time Scales?, J. Hydrometeorol., 19, 1059–1075, 2018. a
Pechlivanidis, I., Crochemore, L., Rosberg, J., and Bosshard, T.: What are the key drivers controlling the quality of seasonal streamflow forecasts?, Water Resour. Res., 56, e2019WR026987, https://doi.org/10.1029/2019WR026987, 2020. a, b
Ramos, M., Mathevet, T., Thielen, J., and Pappenberger, F.: Communicating uncertainty in hydro-meteorological forecasts: mission impossible?, Meteorol. Appl., 17, 223–235, 2010. a
Ramos, M. H., van Andel, S. J., and Pappenberger, F.: Do probabilistic forecasts lead to better decisions?, Hydrol. Earth Syst. Sci., 17, 2219–2232, https://doi.org/10.5194/hess-17-2219-2013, 2013. a
Soncini-Sessa, R., Castelletti, A., and Weber, E.: Integrated and participatory water resources management: Theory, Elsevier, Amsterdam, NL, 2007. a
SMHI: Seasonal Forecasts Europe, available at: https://hypeweb.smhi.se/explore-water/forecasts/seasonal-forecasts-europe/, last access: July 2017. a
Steduto, P., Hsiao, T., Raes, D., and Fereres, E.: AquaCrop –The FAO Crop Model to Simulate Yield Response to Water: I. Concepts and Underlying Principles, Agronomy Journal, 101, 426–437, 2009. a
Turco, M., Ceglar, A., Prodhomme, C., Soret, A., Toreti, A., and Doblas-Reyes, F.: Summer drought predictability over Europe: empirical versus dynamical forecasts, Environ. Res. Lett., 12, 084006, https://doi.org/10.1088/1748-9326/aa7859, 2017. a
Turner, S. W. D., Bennett, J. C., Robertson, D. E., and Galelli, S.: Complex relationship between seasonal streamflow forecast skill and value in reservoir operations, Hydrol. Earth Syst. Sci., 21, 4841–4859, https://doi.org/10.5194/hess-21-4841-2017, 2017. a
Weedon, G., Balsamo, G., Bellouin, N., Gomes, S., Best, M., and Viterbo, P.: The WFDEI meteorological forcing data set: WATCH Forcing Data methodology applied to ERA-Interim reanalysis data, Water Resour. Res., 50, 7505–7514, 2014. a
Yang, W., Andréasson, J., Phil Graham, L., Olsson, J., Rosberg, J., and Wetterhall, F.: Distribution-based scaling to improve usability of regional climate model projections for hydrological climate change impacts studies, Hydrol. Res., 41, 211–229, 2010. a
Zatarain-Salazar, J., Reed, P., Herman, J., Giuliani, M., and Castelletti, A.: A diagnostic assessment of evolutionary algorithms for multi-objective surface water reservoir control, Adv. Water Res., 92, 172–185, https://doi.org/10.1016/j.advwatres.2016.04.006, 2016. a
Zitzler, E., Thiele, L., Laumanns, M., Fonseca, C., and da Fonseca, V.: Performance assessment of multiobjective optimizers: an analysis and review, IEEE Transactions on Evolutionary Computation, 7, 117–132, 2003. a