
the Creative Commons Attribution 4.0 License.
the Creative Commons Attribution 4.0 License.
 | 12 Aug 2026
A process-informed framework linking temperature-rainfall projections and urban flood modeling
Daniel B. Wright
Jovan Blagojevic
Peter Molnar
Mohammad A. Hussain
Yongkun Li
Guangheng Ni
Nadav Peleg
Predicting changes in urban pluvial flood hazards under climate warming is crucial for risk mitigation and disaster management. A key challenge in simulating future urban flood hazards is the scarcity of high-resolution rainfall projections, particularly at the sub-daily and kilometer scales required for hydrodynamic modeling. We present a cascading process-informed framework that requires minimal observed climatic data, enabling scenario analysis even in data-scarce cities. This framework consists of a distribution‐based spatial quantile mapping (DSQM) method to morph observed rainfall fields conditioned on temperature changes, a stochastic storm transposition (SST) method to account for the spatial variability of urban rainfall, and a rain‐on‐grid hydrodynamic model (AUTOSHED) for efficient simulation of urban pluvial floods at high spatio-temporal resolution. The framework allows the generation of stochastic rainfall fields under different rainfall return levels and regional warming levels. It supports the quantification of changes in future urban flood statistics with detailed hazard maps of inundation depth, duration, and flow velocity. We select the metropolitan area of Beijing (300 km2) as a case study area and utilize gridded hourly and 1 km rainfall data to simulate flood evolution at 5 min and 5 m resolution under regional warming levels of 1, 3, and 5 °C relative to the period 1998–2019. Our results show that with rising temperatures, regional storms tend to become more intense but smaller in spatial extent, which may in turn drive increased local flood depth, accelerated flow velocity, and deeper inundation, collectively elevating pluvial flood risk. Specifically, mean rainfall intensity increases by 6 %, 11 %, and 20 % (respectively with the warming levels), peak flood depth exhibits a nonlinear increase of 4 %, 7 %, and 8 %, due to the complex interactions of reduced storm area, increased storm intensities, and rainfall spatial variability. The proposed DSQM-SST-AUTOSHED framework offers a data-driven, physically grounded, and efficient approach to assess urban flood risk under regional warming. It only requires observed rainfall fields and temperature datasets, which are readily accessible from public sources, making the approach easily extendable to other cities.
- Article
(14898 KB) - Full-text XML
-
Supplement
(8745 KB) - BibTeX
- EndNote


Urban pluvial floods are among the most severe climate- and water-related hazards, causing fatalities and severe economic losses worldwide (Duan et al., 2016; Rözer et al., 2021; Lehmkuhl et al., 2022; Polo-Martín, 2025). Cities can experience unusual amounts of rainfall, such as daily rainfall approaching or even exceeding their typical annual total. For example, in the urban flood that occurred in 2024 in Valencia, Spain, daily rainfall accumulated up to its annual average value (500 mm), resulting in floods that led to 200 fatalities and economic losses of approximately EUR 480 million (Polo-Martín, 2025). Severe urban flooding has also been documented in China (Fu et al., 2025), Europe (Lehmkuhl et al., 2022), the United States (Saharia et al., 2017), and elsewhere.
Urban pluvial floods occur when intense rainfall over a short period generates volumes of water that exceed the capacity of the urban drainage system (Rözer et al., 2021). Under the synergistic effect of climate change and rapid urbanization, the frequency and intensity of short-duration heavy rainfall events are predicted to increase significantly, amplifying future pluvial flood risk (Wasko and Sharma, 2014; Wright et al., 2019; Fowler et al., 2021b; Peleg et al., 2025). This underscores the urgent need for robust projections of extreme rainfall and corresponding pluvial flood dynamics to inform targeted adaptation strategies and mitigate associated economic losses and societal impact. However, such projection faces several key challenges, including (i) the scarce availability of long-term high-resolution (i.e., at sub-daily and km scales) future rainfall fields (Zou et al., 2025), due to the high computational demands in convection-permitting models for simulating long-term and multiple climate scenarios; (ii) the inadequate estimation of rainfall extremes across spatial and temporal scales (Wright et al., 2020), with nonstationary change under climate warming; and (iii) the lack of efficient pluvial flood simulators that can compute flow depth, velocity, and inundation duration at very high, meter-scale, resolution (Guo et al., 2021; Cache et al., 2024).
Considering the first challenge, global circulation models and regional climate models can provide long-term climate projections; however, their coarse spatial resolution (101–102 km) and absence of physically-based convective schemes limit their ability to accurately represent sub-daily rainfall extremes (Westra et al., 2014; Prein et al., 2015; Wang et al., 2024). Conversely, convection-permitting models can adequately simulate rainfall fields at <101 km spatial resolution and sub-hourly temporal resolution (Prein et al., 2015), but their high computational cost hampers their global application, particularly for long-term simulations, large ensemble sizes, and multiple climate-emission scenarios. A computationally efficient alternative is to adjust gridded rainfall observations derived from remote sensing (such as satellites or, preferably, higher-resolution weather radars) to have rainfall characteristics matching future climate conditions. This approach remains largely underexplored; one example is the distribution-based spatial quantile mapping method (Zou et al., 2025), which projects future changes in spatiotemporal structure of rainfall fields by morphing their marginal spatial intensity distributions according to rainfall-temperature scaling relationships.
Regarding the second challenge, extreme value analysis (Katz et al., 2002) is typically used to estimate the probability that a given rainfall intensity will be exceeded within a specified return period. The corresponding results are often summarized as rainfall intensity-duration-frequency (IDF) curves (Koutsoyiannis et al., 1998), which serve as fundamental inputs for urban drainage design and flood risk management (Martel et al., 2021). However, it is widely recognized that spatial variability in rainfall significantly influences the dynamics of urban pluvial floods, particularly for floods under short-duration convective storms (Fowler et al., 2021b; Peleg et al., 2022). Conventional IDF curves rely on point-scale (station-based) rainfall observations (Zou et al., 2021) and, in most cases, inadequately represent the inherent spatial variability (Wright et al., 2014a; Meng et al., 2025), even when multiple stations are considered (Peleg et al., 2018b). One possible solution is utilizing stochastic storm transposition (SST) methods (Wright et al., 2017, 2020), which enable estimating rainfall extreme frequencies over arbitrary spatial scales by randomly resampling and geographically translating historical rainfall fields within a defined domain, enlarging rainfall records by incorporating nearby storms passing the region of interest (Wright et al., 2013). By introducing modified rainfall fields, consistent with climate model projections, into the SST approach, it is possible to estimate the non-stationary changes in future spatial-scale IDF curves (Zou et al., 2025).
The last challenge concerns the ability to perform efficient flood simulations while providing critical flood hazard indicators, such as inundation depth and flow velocity, at refined scales across the urban area (Rosenzweig et al., 2021). Such simulations can be physically performed using simple elevation-based models, 1D/2D dual drainage models, or full hydrodynamic models (Cea et al., 2025). The latter model type, also known as rain-on-grid models, can simulate flood dynamics by solving two-dimensional shallow water equations with spatially variable source terms that account for rainfall-runoff and sewer drainage interactions (Perrini et al., 2024a; Ming et al., 2025). These models can feature coupled hydrological and hydrodynamic processes, integrate high-resolution elevation and meteorological forcings. Yet, they involve significant trade-offs: their simulations often demand extensive computational time due to the use of highly discretized meshes required for a refined representation of heterogeneous urban surfaces. This, in turn, necessitates the development of parallel schemes based on high-performance computing techniques, such as graphical processing units (GPUs) (Costabile et al., 2023; Li et al., 2023b; Sanders et al., 2025).
Here, we propose a computationally efficient process-informed framework for projecting warming-induced urban pluvial floods by integrating recently developed methods that address the three aforementioned challenges. Our framework provides a robust, efficient, and replicable method for assessing future changes in regional storm and flood statistics, particularly in cities where high-resolution data from climate models is lacking. We first present the framework and then apply it to a medium‐sized urban area of 300 km2 in Beijing, China, as a case study. We demonstrate how observed rainfall data can be “morphed” according to projected temperature, how this affects IDF curves, and the resulting implications for urban flooding.
Instead of relying on future rainfall projections from climate models, we propose a framework to project future rainfall extremes and urban flooding using only observed rainfall fields and temperature, at a resolution sufficiently high to enable urban flood simulations, as illustrated in Fig. 1.
The proposed framework is applicable under three conditions: (i) it primarily represents the thermodynamic processes, i.e., the response of short-duration extreme rainfall to increasing temperatures (Trenberth et al., 2003). The dynamic factors resulting from changes in atmospheric circulation are not explicitly taken into account. (ii) the framework is tailored for convective rainfall events, which are the predominant cause of urban pluvial flooding in many regions (Huang et al., 2022; Torelló-Sentelles et al., 2024). While the framework may also be extendable to other types of rainfall, its application to these has not yet been systematically evaluated; and (iii) the framework reproduces rainfall spatial structures by modifying observed properties such as storm area, peak intensity, and spatial distribution. Consequently, it cannot extrapolate to generate or account for unobserved features of extreme rainfall fields (i.e., plausible extreme events that are yet unseen). Nevertheless, the stochastic space-time transposition of the storms applied in the framework is known to largely compensate for the under-representation of such unique events in the record (Wright et al., 2020).
The framework is composed of three sequential components (Fig. 1):
-
First, gridded rainfall fields over a sufficiently long period with high spatio-temporal resolution (preferably 20 years with 1 km and hourly or finer resolution) need to be collected. Such data can be derived from weather radar or other remote sensing products and, if necessary, downscaled to the required resolution. Temperature data, required by rainfall-temperature scaling, may be used at coarser spatial and temporal resolutions, since only the average regional temperature over the domain at the hour of rainfall, or up to 1 d before rainfall initiation, is required. The Distribution-based Spatial Quantile Mapping (DSQM) is then applied to morph observed rainfall fields according to different future warming levels within the study region. Details on the rainfall-temperature scaling and DSQM methods are provided in Sect. 2.1.
-
Second, the observed and morphed rainfall fields are used as input to an SST model (Sect. 2.2). By creating an archive of extreme rainfall fields and randomly transposing them over the domain, extreme rainfall statistics can be derived for a grid cell or arbitrary area such as a watershed or neighborhood. This allows for the construction of storm return levels for both present and future regional warming levels, while accounting for natural climate variability.
-
Finally, extreme storms sampled from SST for a given rainfall return period are used as input into a rain-on-grid flood model. We use a coupled hydrological-hydrodynamic model, the AUTOSHED model (Sect. 2.3), to compute flood hazard maps representing the spatial distribution of inundation depths and flow velocities, which can be compared between present and future rainfall extremes, under different return periods and regional warming levels.

Figure 1Schematic illustration of the process-based framework linking temperature-rainfall projections and urban flood modelling.
2.1 Distribution-based spatial quantile mapping (DSQM)
The DSQM method, which morphs both the intensity and spatial structure of observed rainfall fields driven by temperature changes, is described in detail by Zou et al. (2025); only a summary of the method is provided here. At its core, DSQM modifies four key properties of rainfall fields at each time step: the mean rainfall over the entire domain, the rainfall-affected area (i.e., the rainfall spatial extent), the magnitude of the spatial variation of rainfall within the domain (i.e., the rainfall spatial coefficient of variation), and the most intense portion of rainfall (e.g., the 99th percentile) in the domain. The following steps are taken:
-
The scaling relationship between rainfall and temperature is estimated using the quantile regression method (Wasko and Sharma, 2014). The scaling is first derived for the domain-averaged rainfall intensity and then extended to other rainfall properties, conditioned on rainfall magnitude.
-
The rainfall-affected area is modified. If the scaling of the rainfall area with temperature is positive, “dry” grid cells near the “wet” grid cells will be converted into “wet” grids, until the desired wet area is met. If the scaling is negative, the grids with the lowest rainfall intensities will be classified as “dry” until the quantity of the desired wet area is satisfied.
-
The rainfall intensities of the new rainfall fields are transformed into quantile fields using a selected marginal distribution, such as Gamma, Weibull, or Lognormal, depending on the rainfall type and climate region.
-
Finally, the quantile fields are back-transformed into new rainfall fields, basing them on the projected values of the other rainfall properties under the imposed temperature level.
An example of the method is presented in Fig. 2, where an hourly rainfall field recorded over Beijing is morphed to represent a 2 °C regional warming level, assuming a hypothetical 7 % °C−1 increase in mean areal rainfall intensity and a 8 % °C−1 decrease in the rainfall-affected area, demonstrating that the regional storm becomes more intense and localized with temperature warming.

Figure 2(a) An example of an observed rainfall field (1 h and 1 km resolution). (b) Future projected rainfall field for a 7 % °C −1 increase in mean areal rainfall intensity and 8 % °C −1 decrease in rainfall-affected area under 2 °C regional warming.
2.2 Stochastic Storm Transposition (SST)
SST is a rainfall frequency analysis method that estimates spatially distributed rainfall extremes by resampling and transposing observed rainfall fields within a defined domain (Foufoula-Georgiou, 1989; Wilson and Foufoula-Georgiou, 1990). It enables computation of IDF curves for a given location or region while explicitly considering the rainfall spatial structure, without manipulating or interpolating observed data obtained from point sources (e.g., from multiple rain gauges; Wright et al., 2013). Furthermore, SST can produce robust rainfall frequency analysis even with relatively limited rainfall data (i.e., less than the recommended 30 years, Wright et al., 2013, 2014b), making it suitable for applications where only a few years of high-resolution gridded rainfall data from weather radar are available. The resampling and transposition of storms within the domain effectively mimic the natural spatial variability of heavy rainfall, ensuring its adequate representation in the resulting IDF curves (Wright et al., 2013). An overview of the development and applications of the SST method is provided by Wright et al. (2020).
In our framework, we have implemented the SST method through the RainyDay model (Wright et al., 2017), which follows a four-step procedure:
-
First, define the area of interest (e.g., city) where rainfall IDFs are to be estimated. In addition, define a transposition domain, which is a larger geographic region surrounding the area of interest and is characterized by climatology and topography similar to the area of interest, such that extreme rainfall properties are approximately homogeneous.
-
Next, create a regional storm catalog from gridded rainfall observations for a given duration of interest t, by including the m storms with the largest t-duration accumulation rainfall within the area of interest.
-
Storms from the catalog are then resampled and transposed to produce multiple trajectories of extreme storms. This involves generating a random number of annual storm arrivals using the Poisson distribution or other count distribution. The transposition between projected storm event from the observed storm, can be either uniform or non-uniform moving distance along east-west and north-south direction. The maximum rainfall over the area of interest is extracted from each simulated year and recorded.
-
In the last step, the model assigns recurrence intervals non-parametrically by ranking the simulated annual maxima. The natural variability is derived by repeating the previous step multiple times.
The observed and DSQM-morphed storms are both used as input to the SST model. Figure 3 illustrates how the SST generates stochastic storm trajectories by assigning random starting position while keeping velocity unchanged. The figure shows an observed storm from the archive corresponding to a specific rainfall return level, and for the same storm after morphing it with the DSQM (now heavier, with enhanced spatial heterogeneity).

Figure 3SST transposition domain (grey dashed box) around an interested city area (red polygon). Observed storm trajectory for a single historical storm (blue), sampled here at three-hourly intervals for clarity, and DSQM-based projected future trajectory of the same storm (purple) after randomized transposition via SST. The transposed future storm exhibits higher mean areal rainfall intensity and spatial heterogeneity.
2.3 The AUTOSHED urban pluvial flood model
Our framework employs the coupled hydrological-hydrodynamic AUTOSHED model for simulating pluvial floods (Li et al., 2023b). AUTOSHED has been applied to various real flood events (Li et al., 2025, 2026) and thus is suitable for transforming warming-conditioned rainfall forcings to surface inundation fields. Regarding to its physical mechanism, AUTOSHED implements the rain-on-grid approach (Hall, 2015; Perrini et al., 2024b) where surface runoff generation and routing processes are sequentially simulated on triangular-shaped meshes under spatially distributed rainfall forcings. To achieve a detailed representation of surface micro-topography, road and river boundaries are incorporated as break-lines during mesh generation (Pizzileo et al., 2024), enabling mesh edges to align adaptively with these features and accurately capture their elevation profiles. At each time step, AUTOSHED first performs distributed rainfall-runoff simulations on each triangular unit. Each unit is divided into impervious and pervious parts according to the empirical impervious ratio, and AUTOSHED calculates the total surface runoff as the area-weighted sum of each component. The rainfall-runoff simulation includes typical urban hydrological processes such as building interception, vegetation interception, and soil infiltration, where related parameterization details can be found in Ni et al. (2008) and Järvi et al. (2011) and in Sect. S1 in the Supplement.
After obtaining surface runoff, AUTOSHED solves the full two-dimensional shallow water equations to simulate the flood routing process, where all boundaries are specified as open boundaries (Li et al., 2021; Luan et al., 2024). The equations are solved by the Godunov-type finite volume method (further details are discussed by Song et al., 2011). The time integration is solved by the explicit first-order scheme and an appropriate time step is dynamically adjusted by a Courant-Friedrichs-Lewy (CFL) value of 0.5 (Courant et al., 1928) to maintain numerical stability. For computational efficiency, AUTOSHED uses a multi-core parallel architecture of GPUs (Lacasta et al., 2014).
3.1 Case city: Beijing Municipal Administrative Center
Beijing Municipal Administrative Center (BMC, Fig. 4b) is located within the large metropolitan area of Beijing (Fig. 4a). It serves as the eastern gateway to China's national capital, where numerous local government departments have been relocated since 2015 to reduce excessive congestion in the central city. BMC's area is approximately 300 km2 and is relatively flat with an average slope of 1.5 %. It exhibits a humid continental climate, with an average annual rainfall of 536 mm and an average annual temperature of 13 °C. As one of the world's largest megacities, Beijing is particularly susceptible to pluvial flooding from extreme storms; this vulnerability is underscored by observed increases in sub-daily precipitation extremes across North China, where Wang et al. (2024) reported positive and accelerated trends in six extreme sub-daily precipitation indexes during 1971–2022, especially after 2001. Studies have shown that thermodynamical factors, such as high temperatures and the urban heat island effect, have played a dominant role in the intensification of local extreme rainfall events (Zheng et al., 2021; Yang et al., 2025). At the same time, dynamic factors, such as monsoon circulation and topography influences, may also affect summer extreme rainfall in the Beijing region (Cui et al., 2025; Zhong et al., 2014). However, the dynamic contributions are not explicitly accounted for in the present study. Furthermore, storms are projected to become smaller and more concentrated with higher intensity in the future (Fu et al., 2018; Zou et al., 2025), increasing the probability of the occurrence of severe flood disasters. Two notable unprecedented storms were recorded in the last decade: the first one on 21 July 2012 (areal rainfall of 215 mm in 20 h), and the second one hitting Beijing on 31 July 2023 (331 mm in 83 h), resulted in heavy floods and 79 and 33 deaths, with economic losses of 1.4 billion and EUR 60 million, respectively (Liu et al., 2019; Li et al., 2024). These events underscore the urgent need to evaluate the future evolution of rainfall fields with the corresponding response of flood hazards to better inform disaster risk management.

Figure 4(a) Location map, showing Beijing Municipality area (black polygons), Beijing Municipal Administrative Center (BMC, red polygon), and the SST transposition domain (purple box). (b) Land use and historical flood-prone points within BMC. (c) Zoom in to a 0.5 m digital elevation model (DEM) in the BMC center. (d) Zoom in on a LiDAR point cloud data at a local underpass used for DEM generation.
Considering data, we used gridded hourly rainfall fields at 1 × 1 km resolution, downscaled from the 8 × 8 km CMORPH product for the period from 1998 to 2019 (Zou et al., 2024). Hourly and 25 × 25 km near-surface air temperature data for the same period were obtained from the ERA5 climate reanalysis (Hersbach et al., 2020). These datasets were used to derive the rainfall-temperature scalings and prepare the present and future rainfall archives for the SST. In addition, we collected multi-source geographical data to set up the urban pluvial flood model, including: a 0.5 m digital elevation model (Fig. 4c) that was generated from an airborne Light Detection and Ranging (LiDAR) with a sampling density of 100 points per m2 and a mean absolute height error of 0.05 m (Fig. 4d); a 10 m land use map from the WorldCover 2021 product (Zanaga et al., 2022) (Fig. 4b), a 250 m soil hydraulic properties from the HiHydroSoil v2.0 database (Simons et al., 2020), a 250 m leaf area index data from the MODIS MOD15A2H product (Nishihama et al., 1997), and building footprint and road network layers from the Baidu map service.
Furthermore, we collected observational data related to a recent torrential rainfall event that occurred in August 2024 to evaluate the model's performance. Radar-based quantitative precipitation estimations (QPE), covering the period between 21:00, 8 August, and 09:00, 10 August (local time), were acquired from a local agency with a spatiotemporal resolution of 500 m and 5 min (see Fig. S1). In addition, the maximum inundation depth records at six underpasses as a result of the storm were obtained from the local agency as well.
3.2 Setting up the models
3.2.1 DSQM
To compute the rainfall-temperature scaling, we divided the hourly rainfall fields into 20 bins based on their average magnitude over the domain (to distinguish between light and heavy rain) and calculated the hourly regional average temperature across the domain for each rainfall field. We found that the scaling of the rainfall-temperature magnitude increases with the average intensity of the rainfall fields, reaching a scaling of 3.6 % °C−1 as rainfall becomes heavier (see Table S2 and Zou et al., 2025).
We then scaled the other rainfall properties (e.g., area and coefficient of variation) with temperature. Since these properties are conditioned on the mean rainfall over the domain, their scaling relationships were analyzed separately for each bin. We found that changes in the area of the storm as a function of temperature have an opposite signal to the storm magnitude, meaning that storms become smaller in extent (down to −2.4 % °C−1) as the rainfall magnitude increases. The spatial coefficient of variation was also found to increase with both temperature and rainfall magnitude (see Table S2), indicating that future extreme rainfall events will likely feature higher regional and local intensities concentrated over smaller areas.
We then applied the rainfall-temperature scaling relationships to morph the observed rainfall fields to regional warming levels of 1, 3, and 5 °C, which were subsequently used as inputs to the RainyDay model.
3.2.2 RainyDay
The transposition domain around the BMC is outlined by the purple box in Fig. 4a. It is defined based on a qualitative assessment of terrain similarity and the spatial distribution of extreme rainfall, as presented by Zou et al. (2025), to approximate homogeneous storm-occurrence across the domain.
The storm catalog for the RainyDay model was created by selecting m= 300 storms with a duration t of 72 h that passed through the BMC region. We opted to use the Poisson resampling distribution and non-uniform transposition to shift storms within the domain stochastically; the Poisson distribution had a rate parameter of ≈ 13.6 storms per year stemming from 300 storms selected from a 22-year rainfall record. Using synthetic rainfall generated by RainyDay, it first trims storms into 24 h durations and then estimates their return levels over BMC based on 500 years of annual rainfall maxima. We ran 100 realizations (i.e., each realization contains 500 annual maxima) to provide the stochastic uncertainty corresponding to the 10- to 500-year storm return levels. The RainyDay return levels have been validated against 45 observed stations in the Beijing area, with bias less than 6 % for 2- to 100-year rainfall return levels (Table S3).
For pluvial flood projection under storm realizations of a certain return level, we select the 50 most extreme 24 h storm events from each return level as input into AUTOSHED for pluvial flood simulation.
3.2.3 AUTOSHED
In AUTOSHED, the BMC simulation domain is discretized into 4 055 787 triangular meshes, with a median area of 72 m2. After mesh discretization, parameters related to rainfall-runoff generation, friction effect, and drainage capacity (Ming et al., 2025) were estimated. For rainfall-runoff simulation, we specify the empirical impervious ratio (Sect. 2.3) according to the land-use-based empirical values (suggested by local guidelines, BMCPNR, 2022) and assign the remaining parameters, such as soil hydraulic properties, based on geographical datasets (Sect. 3.1). Friction-related parameters, such as the Manning coefficients, were set to follow the aforementioned land-use-based empirical values (see Sect. S1). In the absence of a detailed sewer network in the BMC region, we parameterize drainage capacity using the road-drainage method (Li et al., 2023a), subtracting a uniform drainage rate of 36 mm h−1 from the net rainfall rate in the roadway zone only, as suggested by the Beijing Municipal Institute of City Planning and Design (Liu et al., 2022). This simplified drainage representation does not resolve the hydraulic behavior of the sewer network. In particular, it cannot represent spatially variable inlet capacity, sewer surcharge, backwater effects, or reverse flow from pressurized manholes and inlets back onto the surface. As a result, it may underestimate local inundation in areas where the drainage system becomes capacity-limited or fails during extreme rainfall. Nevertheless, because the same simplified drainage treatment is applied consistently across all warming levels, the simulations remain useful for comparing relative changes in surface flood response, while absolute local depths should be interpreted with caution.

Figure 5(a) Simulated maximum inundation depth for the August 2024 storm. (b)–(g) Simulated inundation depth compared with observed maximum inundation depth. ΔHmax is defined as the simulated maximum depth minus the observed one. Basemaps are derived from ESRI World Imagery (Credit: Esri, TomTom, Garmin, FAO, NOAA, USGS, © OpenStreetMap contributors, and the GIS User Community).
Based on the estimated parameters, we validate AUTOSHED using the 500 m and 5 min QPE product (Fig. S1) and extract the simulated inundation hydrograph at six underpasses available with maximum inundation depth records (Fig. 5). This event-based evaluation is intended to assess whether AUTOSHED can reasonably reproduce observed pluvial flooding in the study area and, therefore, can serve as a reliable flood simulator of the proposed workflow. According to the comparison results, AUTOSHED achieves simulated absolute depth differences smaller than 5 cm at most sites, except for one underpass, for which an underestimation of 41.4 cm is observed. But this can probably be attributed to the overestimated sewer drainage in the corresponding road zones. Thus, the present validation demonstrates the credible skill of AUTOSHED in translating rainfall fields to local inundation responses.
We acknowledge, however, that additional uncertainty may arise when the validated AUTOSHED model is forced with the coarser SST-DSQM-based rainfall inputs used for other applications such as flood-frequency analysis. Aggregating rainfall from 500 m and 5 min to 1 km and hourly resolution can smooth local rainfall peaks and modify short-term rainfall intermittency, potentially affecting the simulated inundation depth, flow velocity, and inundation duration. Nevertheless, the proposed framework is resolution-independent and can be directly applied with finer rainfall products when such data become available.
After the model validation, we configured AUTOSHED to run the 24 h storms generated by the SST, using a server with an Nvidia Tesla V100 GPU (32 GB) and Intel(R) Xeon(R) Gold 6226R CPU @ 2.90 GHz, for which the results are reported below. On the adopted GPU-enabled hardware, AUTOSHED can finish one 24 h distributed-storm-driven flood simulation within 1 h.
This enables high-resolution ensemble simulations that would be prohibitively expensive on CPU-only implementations, although the overall computational burden remains considerable when large rainfall ensembles are propagated through the full workflow. We discuss this limitation and possible solutions further in Sect. 4.3.
3.3 Future changes in regional rainfall extremes
In the following, we analyzed changes in rainfall extremes as a result of regional 1, 3, and 5 °C warming in comparison with the 1998–2019 period. Projected changes in return levels of averaged rainfall over the BMC, based on 24 h storm events, are shown in Fig. 6a. The average increase in extreme rainfall intensity for different return levels is 3 %, 11 %, and 18 % under the 1, 3, and 5 °C regional warming levels, respectively. To highlight the mean shifts in average extreme rainfall over BMC, we further computed the natural climate variability in the present climate obtained from 100 storm realizations and represent it with the green shaded area in Fig. 6a. While the mean return levels for the 1 and 3 °C warming still fall within the natural variability of the present return levels, 5 °C warming is falling beyond the variability. To exemplify the high variability of the extreme rainfall both in space and time, we further illustrated three 24 h storm events randomly selected from the simulated pool (Fig. 6b).

Figure 6(a) Return levels of averaged rainfall over the BMC for 24 h storm event and their natural variability computed from 100 realizations of storm events, (b) examples of three 24 h storm realizations, illustrating their spatial (left column) and temporal (right column) distributions.
3.4 Future changes in urban floods
The projected changes in urban pluvial floods can be estimated from the ensemble of AUTOSHED simulations driven by multiple storm realizations associated with specified return levels and regional warming levels. Using storm events at the 100-year return level as an example, results of the current-climate simulations demonstrate that the median inundation depth, calculated as the pixel-wise medians from the maximum inundation depth maps under 50 storms, is reaching up to 2 m depths within the BMC (Fig. 7a), with pronounced flooding beneath underpasses and within riparian parks in the city center (Fig. 7b). Under warming levels of 1, 3, and 5 °C, median maximum flood depth increases by 4 %, 7 %, and 8 %, respectively, while the maximum increase reaches 28 % under +5 °C (Fig. 7c). Figure 7d–f illustrate the spatial distribution of median differences in inundation depths, revealing that inundation depths increase by 5 %–25 % in both major roads and residential areas, with the most extensive impacts under +5 °C extending across almost the entire urban area.

Figure 7(a) The maximum flood depth for 100-year rainfall return level under the current climate, (b) zoom-in part in the BMC centre, (c) future changes of maximum flood depth under different regional warming levels, and its spatial distribution of those changes within BMC region under 1 (d), 3 (e), 5 °C (f) warming levels. Basemaps are derived from ESRI World Imagery (Credit: Esri, TomTom, Garmin, FAO, NOAA, USGS, © OpenStreetMap contributors, and the GIS User Community).
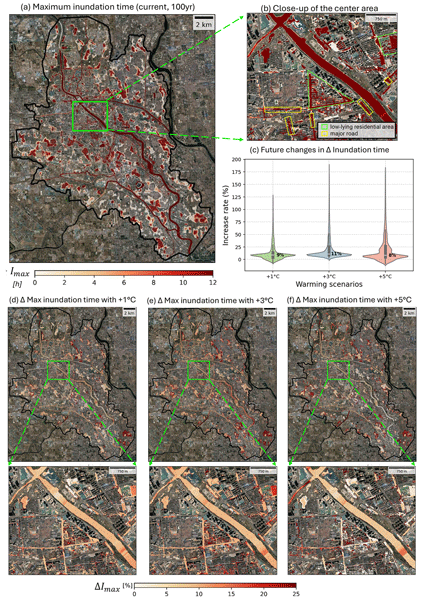
The flood inundation duration of the current climate, defined as the time during which water depth exceeds 0.4 m for the 100-year rainfall return period, is shown in Fig. 8a. The close-up to the center area (Fig. 8b) highlights the persistent water accumulation up to 12 h along major roads and in low-lying residential areas. In contrast to the distribution of the inundation depth, the distribution of the current inundation duration exhibits a more pronounced long-tail behavior, with the increase rate in maximum duration reaching 125 % (Fig. 8c) for 1 °C warming. This indicates that some regions currently flooded for a short duration will face prolonged inundation under increasing temperatures. As presented in the maps in Fig. 8d–f, substantial relative changes in inundation duration can be observed at the fringes of the inundated regions. When evaluating the overall tendency, the median inundation duration increases by approximately 9 %, 11 %, and 8 % under warming levels of 1, 3, and 5 °C, respectively, indicating that further warming beyond 3 °C will not necessarily result in further increases of overall inundation duration. This can be attributed to the spatiotemporal changes in extreme rainfall structures: while higher temperature raises the mean areal rainfall, it also leads to a reduction in storm area. Such localized rainfall intensification with fast movement can contribute to higher instantaneous inundation depth; however, its influence on inundation duration may be minimal or even negative due to counteracting effects between accelerated surface flow accumulation (as presented next).

Figure 8(a) The inundation duration for 100-year rainfall return level under the current climate, (b) zoom-in part in the BMC centre, (c) future changes of inundation duration under different regional warming levels, and its spatial distribution of those changes within BMC region under 1 (d), 3 (e), 5 °C (f) warming levels. Basemaps are derived from ESRI World Imagery (Credit: Esri, TomTom, Garmin, FAO, NOAA, USGS, © OpenStreetMap contributors, and the GIS User Community).
We further investigated how surface flow velocities change with increasing warming. In the current climate, peak flow velocity for a 100-year return period storm generally remains below 0.5 and increases up to 1 m s−1 along major roads and underpasses (Fig. 9a, b). Under 1, 3, and 5 °C warming, the distributions of the peak flow velocities are positively skewed with medians increasing by 3 % (the upper tail reaches 17 %), 6 % (22 %), and 8 % (28 %), respectively (Fig. 9c). Detailed views of the center area (Fig. 9d–f) reveal considerable velocity increases (> 10 %) that are initially located along major roads and gradually expand into low-lying residential areas through narrow streets. Such increased velocity indicates strengthened momentum transfer and further leads to possibly faster recession and shorter inundation duration.
In summary, for major areas in the BMC, climate warming tends to increase both inundation depth and surface flow velocity, whereas its influence on inundation duration remains unclear due to counterbalancing hydrodynamic mechanisms between higher runoff volumes that are accumulating faster and subsequently leading to faster recession time.

Figure 9(a) The maximum velocity for 100-year rainfall return level under the current climate, (b) zoom-in to the BMC center, (c) future changes of maximum velocity under different regional future warming levels, and its spatial distribution of those changes within BMC region under 1 (d), 3 (e), 5 °C (f) warming level. Basemaps are derived from ESRI World Imagery (Credit: Esri, TomTom, Garmin, FAO, NOAA, USGS, © OpenStreetMap contributors, and the GIS User Community).
3.5 Future changes in flood hazards
We last evaluated the impact of the changes in 100-year storms on pluvial flood hazards. Flood hazards are categorized by maximum inundation depths (following local government standards, BWA, 2025): low hazard (0.15–0.27 m), moderate hazard (0.27–0.4 m), moderate-high hazard (0.4–0.6 m), and high-hazard (> 0.6 m) (Fig. 10a, b). Under current climatic conditions, moderate-high and high hazard areas are predominantly confined to riparian parks and major roads, especially at low-lying underpasses with insufficient drainage capacities (Fig. 10b).
Analysis of the associated inundation duration (Fig. S2) reveals that these areas can also experience long-lasting inundation for more than 12 h, severely disrupting local transportation networks and leading to substantial economic losses and potential fatalities due to the prolonged blocking of evacuation routes (Pregnolato et al., 2017). Furthermore, it should be highlighted that moderate-high and high hazard zones increase by 15 %–20 % compared to current conditions, while low and moderate hazard areas expand by up to 5 %–10 % (Fig. 10c). These results demonstrate the higher sensitivity of high hazard zones to climate change, with already severely inundated areas, projected to experience more significant increases, emphasizing the urgent need for targeted adaptation measures in flood-prone locations.

Figure 10(a) Flood hazard for 100-year rainfall return level under the current climate, (b) close-up of the BMC centre, and (c) changes in flood hazards assessments within BMC under different regional warming levels. Basemaps are derived from ESRI World Imagery (Credit: Esri, TomTom, Garmin, FAO, NOAA, USGS, © OpenStreetMap contributors, and the GIS User Community).
4.1 Changes in rainfall properties and future urban floods
One of the key strengths of the proposed framework over most existing approaches lies in its capacity to assess changes in both spatial variability and areal intensity of rainfall fields with increasing temperatures, and to evaluate their implications on urban pluvial flooding. In the BMC, for example, we examine the spatio-temporal characteristics of 50 simulated 24 h storms representing the 100-year return level under three regional warming levels. We find that while the mean rainfall over the domain is projected to increase by 0.73 mm h−1 °C−1 (black lines in Fig. 11), the maximum rainfall over the domain from each 24 h storm (blue line) and the heaviest part of each storm events (i.e., the 99th percentile when analyzing the grid scale, red line) increase sharply with rates of 1.89 and 2.48 mm h−1 °C−1, respectively. In contrast, the rainfall area exhibits a slight decline of −1 % °C−1 under regional warming levels (green dashed line in Fig. 11).
These results indicate that future storms in the BMC are likely to become more intense yet more spatially concentrated under warming. For urban environments, this can still trigger more severe surface inundation when intense rainfall is concentrated over impervious and hydraulically connected parts of the city, such as major roads, underpasses, and low-lying residential areas. Under these conditions, runoff is generated and routed more rapidly, leading to higher inundation depths (Fig. 8) and stronger flow velocities (Fig. 9). By contrast, the reduced storm footprint may partly limit the duration or spatial spread of flooding, which is consistent with the weaker and less monotonic changes found here for inundation duration (Fig. 9).
Overall, the combination of higher intensities and reduced spatial coverage is likely to exacerbate urban pluvial flood risks (Peleg et al., 2022; Padulano et al., 2021; Ghanghas et al., 2023). While in the BMC, the change in storm size under climate warming is relatively minor and does not offset the stronger increase in rainfall intensity. However, larger negative trends have been documented elsewhere, such as the tropics (Ghanghas et al., 2023) and parts of the United States (Chang et al., 2016), which could, in some cases, reduce flood impacts as smaller storms may have a lower probability of city-wide inundation due to constrained trajectories (Chang et al., 2016). To conclude, the proposed framework provides an ideal tool to investigate flood responses to such changes in rainfall characteristics.

Figure 11Future changes in mean areal rainfall (MAR, black line), maximum mean areal rainfall (MaxMAR, blue line), 99th percentile of extreme rainfall at the grid-scale (MaxR99, red line), and area of the storm (WAR,green dash) for the 100-year storms in BMC.
While rainfall was simulated at a 1 km spatial resolution, a substantially finer resolution of 5 m is adopted for the pluvial flood simulations. This raises the question of whether such refinement is warranted, given the additional computational time and resources required, as well as the effort involved in obtaining a finer DEM. Hence, we further explored how sensitive the surface inundation response is to the spatial resolution of the model. We did so by selecting 22 locations that are frequently affected by flooding (see Fig. S3) and re-running the model using the fine resolution of 5 m, and a coarser resolution of 30 and 90 m that can be obtained from multiple freely available sources (e.g., the SRTM product Werner, 2001). Across those locations, warming-driven increases in flood depth, inundation time, and velocity are markedly larger at finer grid resolutions: at 5 m resolution, increase of 1 °C yields roughly 1.4 cm higher depth, 0.22 h longer inundation, and a 0.017 m s−1 rise in peak velocity, whereas at 30 m (90 m) these sensitivities fall to 0.4 cm (0.3 cm), 0.12 h (0.17 h), and 0.005 m s−1 (0.003 m s−1). The reduced sensitivity at coarser spatial resolutions underscores the importance of high-resolution hydrodynamic simulations for robust assessments of urban pluvial flood risks under climate change (Xing et al., 2022; Ming et al., 2025).
Although rainfall is applied at 1 km and hourly resolutions in our case study (reflecting data availability constraints), using finer resolutions, on the order of 100 m and 5 min, is recommended for pluvial flood applications (Cristiano et al., 2017). This recommendation is due to the high spatial variability of extreme rainfall in urban environments (Maier et al., 2020; Torelló-Sentelles et al., 2024, 2025) and the rapid hydrological response characteristic of urban catchments (Cristiano et al., 2019). Such high-resolution datasets, unfortunately, remain scarce. However, the proposed framework is flexible with respect to the spatial and temporal resolution of the rainfall fields. Therefore, if rainfall inputs with finer spatial and temporal resolution are available, they can be used directly within the framework, without requiring further methodological modifications.
4.2 Framework parameterization
Additional potential parameterizations of the framework, beyond those presented in the case study, warrant discussion. First, there is an ongoing debate regarding the appropriate approach to estimate rainfall-temperature scaling, specifically whether to use near-surface air temperature or dewpoint temperature, as the latter explicitly accounts for humidity (Lenderink et al., 2017; Ali et al., 2022). Additionally, there is discussion on whether hourly or daily temperatures better represent the atmospheric processes leading to rainfall events (Zou et al., 2024; Peleg et al., 2018a; Marra et al., 2024). While hourly near-surface air temperature is used in our case study, the framework is flexible and the scalings can be implemented with either temperature variable and at different temporal resolutions.
Defining an appropriate transposition domain for the SST is critical as it influences the composition of the storm catalog and sampling of rainfall extremes. Here, we define the homogeneous transposition domain based on the similarity of the topography and rainfall extremes with the BMC area, yet different criteria, such as using the mean rainfall depth, cloud-to-ground lightning, and storm counts (Wright et al., 2013) can be applied. Further work on systematic delineation of transposition domains is underway (Benjamin et al., 2025). More importantly, instead of using a “uniform” transposition process (Wright et al., 2014b), we have used a “non-uniform” one in our case study, which is based on historical frequency and location of regional storms. This can be particularly relevant in urban and mountainous areas, where storm trajectories may have preferred routes (Lin et al., 2021; Medina and Houze, 2003).
4.3 Advantages and limitations of the framework
There are several advantages associated with the proposed framework, beyond the clear benefit of enabling application in cities lacking high-resolution rainfall data from climate models: (i) changes in rainfall properties are derived directly from the well-established thermodynamic relationship between rainfall and temperature (Trenberth et al., 2003), particularly relevant for short-duration extreme (convective) events (Lenderink et al., 2017); (ii) the framework modifies not only rainfall intensity but also the spatial coverage of storms, which can play a more significant role in urban flooding dynamics (Peleg et al., 2022); (iii) future changes are projected according to prescribed levels of regional warming (e.g., Corre et al., 2025), rather than through specific emission scenarios. This approach reduces some of the uncertainties associated with IDF projections stemming from both climate model and emission scenario discrepancies (Yu et al., 2020; Yan et al., 2021); (iv) the space-time stochasticity of extreme rainfall (also referred to as natural variability or chaotic storm evolution), which constitutes the dominant source of uncertainty in rainfall intensity-frequency relationships (Wright et al., 2020), is explicitly represented within the framework; and (v) the AUTOSHED rain-on-grid model uses GPU-accelerated ensemble hydrodynamic simulations to efficiently convert high-resolution rainfall fields into detailed flood hazard maps, including inundation and flow velocities needed for targeted disaster management (Najafi et al., 2024).
Notably, the framework primarily considers thermodynamic effects on extreme rainfall (Marra et al., 2024), but dynamic factors such as atmospheric circulation and urban areas that can affect storm frequency and intensity (Yan et al., 2021; Zhuang et al., 2024) are not explicitly taken into account. Conducting the analysis for specific rainfall types and explicitly considering their potential future frequency changes, or applying the framework to different large-scale atmospheric modes (e.g., El Niño, La Niña) and embedding their projected shifts based on information from climate models, can partially account for changes in the dynamic component. However, fully implementing the dynamic factor affecting rainfall into the framework remains a subject for future development.
Although the proposed framework is developed for short-duration convective rainfall extremes and urban pluvial flooding, its rainfall-generation component could be used more broadly. The rainfall–temperature scaling is most appropriate at sub-daily durations (Marra et al., 2024), whereas the SST module can also generate rainfall extremes at longer durations (Zou et al., 2025). This opens the possibility of using the generated rainfall fields as input to catchment-scale flood models. For fluvial applications, however, the rainfall module would need to be coupled with a hydrological–hydrodynamic model that properly represents soil water storage, groundwater dynamics, and their interactions with channel routing. Such processes are particularly important in large semi-humid catchments like Beijing, where complex runoff generation mechanisms strongly condition flood response (Cui et al., 2024; Cui and Tian, 2025). In addition, the present framework modifies rainfall spatial structure but does not explicitly account for warming-induced changes in storm temporal structure, which may also affect flood regimes (Hettiarachchi et al., 2018; Nathan, 2025).
Furthermore, a substantially larger number of hydroclimatic scenarios would be needed for a more comprehensive stochastic flood-frequency analysis, and GPU parallelization of numerical simulations may not be sufficient to support such computational demands. A promising avenue for future work is therefore to integrate the present workflow with emerging physics-informed surrogate models, such as super-resolution models that use deep neural networks to transform computationally efficient coarser-resolution inundation fields into practically useful fine-scale flood maps (Fraehr et al., 2023; He et al., 2023; Herath et al., 2025). Such hybrid approaches may offer a practical way to expand the ensemble size while preserving the spatial detail needed for urban flood-hazard mapping.
In summary, our proposed framework, based on open-source code and leveraging GPU-based high-performance computation techniques, offers an efficient and accessible approach to investigate how warming-conditioned changes in rainfall intensity, spatial extent, and spatial variability can alter future urban pluvial flood hazards. It introduces an efficient method for projecting short-duration rainfall under climate change, which is simple to implement and relies exclusively on observed rainfall and reanalysis temperature data, thus removing the dependency on high-resolution climate model simulations. Applied here to the BMC region, the framework demonstrates its potential to address flood risks associated with summer convective rainfall extremes. It can be readily implemented in other urban areas where similar rainfall types contribute to pluvial flooding and should be further evaluated for its applicability to other types of extreme rainfall, although no fundamental limitations are expected.
We propose a process-informed framework to assess changes in future urban pluvial floods by using observed gridded rainfall and temperature data, without the need for climate model projections. The framework consists of three steps: (i) morphing observed rainfall fields using the DSQM method, based on observed rainfall-temperature scaling and chosen marginal distribution, to project rainfall spatiotemporal properties changes considering different regional warming levels; (ii) using the RainyDay SST approach, to obtain future changes in storms' trajectories and return levels with temperature warming; and (iii) running the AUTOSHED rain-on-grid hydrodynamic model to assess the future changes in urban pluvial flood characteristics.
As a case study, we use the framework to assess changes in pluvial floods in the Beijing Municipal Administration Center (BMC), projecting changes in urban flood depth, inundation duration, and flow velocity for different regional warming levels. We find that with rising temperatures, regional storms tend to become more intense but smaller in spatial extent. This led to an expansion of the inundated area, accelerated flow velocity, and increased flood depths, collectively contributing to a heightened risk of pluvial flooding. Specifically, within the BMC area, mean extreme rainfall rises by 6 %, 11 %, and 20 % under warming levels of 1, 3, and 5 °C, respectively, inducing corresponding increases of 4 %, 7 %, and 8 % in peak flood depth.
The cascading process-based DSQM-SST-AUTOSHED framework provides a flexible, physically grounded, and replicable tool for assessing changes in urban pluvial floods considering temperature increase, with potential implications for urban planning and flood-risk adaptation. The codes for the DSQM, the RainyDay, and the AUTOSHED models are openly available and are easy to implement in other cities and climates.
The code of the distributed-based spatial quantile mapping (DSQM) method, along with the 1 × 1 km hourly rainfall data used in the Beijing case study, is openly accessible on Zenodo at https://doi.org/10.5281/zenodo.13646191 (Zou and Peleg, 2024). The 25 × 25 km hourly 2 m near-surface temperatures used for the rainfall-temperature scaling were from the ERA5 climate reanalysis data and downloaded from https://doi.org/10.24381/cds.adbb2d47 (Hersbach et al., 2023). The RainyDay model (Wright et al., 2017), which was used to estimate rainfall extremes via the stochastic storm transposition (SST) method, is openly available and can be downloaded via https://github.com/HydroclimateExtremesGroup/RainyDay (last access: 23 December 2024). The AUTOSHED model prepared for one sample simulation of pluvial flood in BMC can be downloaded via https://doi.org/10.5281/zenodo.15869025 (Li and Zou, 2025) (last access: 9 August 2025). The WorldCover 2021 product for land use can be accessed from here: https://worldcover2021.esa.int/download (last access: 9 August 2025). The HiHydroSoil v2.0 product for soil hydraulic properties can be obtained from: https://www.futurewater.eu/projects/hihydrosoil/ (last access: 9 August 2025). The MODIS MOD15A2H product for leaf area index can be found in the following link: https://doi.org/10.5067/MODIS/MOD15A2H.006 (Myneni et al., 2015). Building footprint and road network data can be downloaded from: https://map.baidu.com (last access: 9 August 2025). A global land cover map for 2021 at 10 m resolution based on Sentinel-1 and Sentinel-2 data is available at https://doi.org/10.5281/zenodo.7254221 (Zanaga et al., 2022). The BMC's high-resolution LiDAR-based DEM is not publicly available.
The supplement related to this article is available online at https://doi.org/10.5194/hess-30-5097-2026-supplement.
WYZ: Conceptualization, Funding acquisition, Data curation, Formal analysis, Methodology, Software, Writing – original draft, Writing – review & editing; RDL: Conceptualization, Funding acquisition, Formal analysis, Methodology, Software, Writing – original draft, Writing – review & editing; DBW: Conceptualization, Methodology, Software; PM: Conceptualization, Writing – review & editing; JB: Writing – review & editing; AMH: Writing – review & editing; YZH: Writing – review & editing; YKL: Data acquisition; GHN: Writing – review & editing; NP: Conceptualization, Funding acquisition, Methodology, Resources, Supervision, Writing – review & editing
At least one of the (co-)authors is a member of the editorial board of Hydrology and Earth System Sciences. The peer-review process was guided by an independent editor, and the authors also have no other competing interests to declare.
Publisher's note: Copernicus Publications remains neutral with regard to jurisdictional claims made in the text, published maps, institutional affiliations, or any other geographical representation in this paper. The authors bear the ultimate responsibility for providing appropriate place names. Views expressed in the text are those of the authors and do not necessarily reflect the views of the publisher.
This research has been supported by the National Key Research and Development Program of China (grant no. 2022YFC3090604), the Swiss National Science Foundation (SNSF Grant number: 194649, “Rainfall and floods in future cities”), the China Scholarship Council (CSC Grant number: 202106040028) and the Agassiz Foundation at the University of Lausanne, as well as the U.S. National Science Foundation Division of Civil, Mechanical, and Manufacturing Innovation (grant no. 2053358).
This paper was edited by Yue-Ping Xu and reviewed by two anonymous referees.
Ali, H., Fowler, H. J., Pritchard, D., Lenderink, G., Blenkinsop, S., and Lewis, E.: Towards quantifying the uncertainty in estimating observed scaling rates, Geophys. Res. Lett., 49, https://doi.org/10.1029/2022GL099138, 2022. a
Benjamin, F., Daniel, W., Lei, Y., Alyssa, H. D., and Antonia, S.: An L-Moments-Based Hypothesis Test to Identify Homogeneous Storm Transposition Regions, Social Science Research Network, https://doi.org/10.2139/ssrn.5292988, 2025. a
BMCPNR: the Technical Specification for Construction and Application of Mathematical Model of Urban Flooding Prevention and Control System, DB11/T 2074-2022, Beijing Municipal Commission of Planning and Natural Resources, Beijing, China, https://bzh.scjgj.beijing.gov.cn/bzh/apifile/file/2022/20221230/b9c34c28-9c27-4f24-aa6d-f3e8b452f429.pdf (last access: 27 July 2026), 2022 (in Chinese). a
BWA: Guidelines for the compilation of urban flood risk maps, DB11/T 2449-2025, Beijing Water Authority, Beijing, China, https://bzh.scjgj.beijing.gov.cn/bzh/apifile/file/2025/20250805/7ea39e72-f88d-4da3-bfba-1f703957dfb5.pdf (last access: 27 July 2026), 2025 (in Chinese). a
Cache, T., Gomez, M. S., Beucler, T., Blagojevic, J., Leitao, J. P., and Peleg, N.: Enhancing generalizability of data-driven urban flood models by incorporating contextual information, Hydrol. Earth Syst. Sci., 28, 5443–5458, https://doi.org/10.5194/hess-28-5443-2024, 2024. a
Cea, L., Sañudo, E., Montalvo, C., Farfán, J., Puertas, J., and Tamagnone, P.: Recent advances and future challenges in urban pluvial flood modelling, Urban Water J., 22, 149–173, https://doi.org/10.1080/1573062X.2024.2446528, 2025. a
Chang, W., Stein, M. L., Wang, J., Kotamarthi, V. R., and Moyer, E. J.: Changes in spatiotemporal precipitation patterns in changing climate conditions, J. Climate, 29, 8355–8376, https://doi.org/10.1175/JCLI-D-15-0844.1, 2016. a, b
Corre, L., Ribes, A., Bernus, S., Drouin, A., Morin, S., and Soubeyroux, J.-M.: Using regional warming levels to describe future climate change for services and adaptation: Application to the French reference trajectory for adaptation, Climate Services, 38, 100553, https://doi.org/10.1016/j.cliser.2025.100553, 2025. a
Costabile, P., Costanzo, C., Kalogiros, J., and Bellos, V.: Toward Street-Level Nowcasting of Flash Floods Impacts Based on HPC Hydrodynamic Modeling at the Watershed Scale and High-Resolution Weather Radar Data, Water Resour. Res., 59, https://doi.org/10.1029/2023WR034599, 2023. a
Courant, R., Friedrichs, K., and Lewy, H.: Über die partiellen Differenzengleichungen der mathematischen Physik, Math. Ann., 100, 32–74, 1928. a
Cristiano, E., ten Veldhuis, M.-C., and van de Giesen, N.: Spatial and temporal variability of rainfall and their effects on hydrological response in urban areas – a review, Hydrol. Earth Syst. Sci., 21, 3859–3878, https://doi.org/10.5194/hess-21-3859-2017, 2017. a
Cristiano, E., ten Veldhuis, M.-c., Wright, D. B., Smith, J. A., and van de Giesen, N.: The Influence of Rainfall and Catchment Critical Scales on Urban Hydrological Response Sensitivity, Water Resour. Res., 55, 3375–3390, https://doi.org/10.1029/2018WR024143, 2019. a
Cui, H., Yu, H., Zuo, X., and Wu, G.: Impacts of orography and urbanization on extreme precipitation event in Beijing during 2023, Weather Clim. Dynam., 7, 743–765, https://doi.org/10.5194/wcd-7-743-2026, 2026. a
Cui, Z. and Tian, F.: Delayed stormflow generation in a semi-humid forested watershed controlled by soil water storage and groundwater dynamics, Hydrol. Earth Syst. Sci., 29, 2275–2291, https://doi.org/10.5194/hess-29-2275-2025, 2025. a
Cui, Z., Tian, F., Zhao, Z., Xu, Z., Duan, Y., Wen, J., and Khan, M. Y. A.: Bimodal hydrographs in a semi-humid forested watershed: characteristics and occurrence conditions, Hydrol. Earth Syst. Sci., 28, 3613–3632, https://doi.org/10.5194/hess-28-3613-2024, 2024. a
Duan, W., He, B., Nover, D., Fan, J., Yang, G., Chen, W., Meng, H., and Liu, C.: Floods and associated socioeconomic damages in China over the last century, Nat. Hazards, 82, 401–413, https://doi.org/10.1007/s11069-016-2207-2, 2016. a
Foufoula-Georgiou, E.: A probabilistic storm transposition approach for estimating exceedance probabilities of extreme precipitation depths, Water Resour. Res., 25, 799–815, https://doi.org/10.1029/WR025i005p00799, 1989. a
Fowler, H. J., Wasko, C., and Prein, A. F.: Intensification of short-duration rainfall extremes and implications for flood risk: Current state of the art and future directions, Philos. T. Roy. Soc. A, 379, https://doi.org/10.1098/rsta.2019.0541, 2021. a, b
Fraehr, N., Wang, Q. J., Wu, W., and Nathan, R.: Supercharging hydrodynamic inundation models for instant flood insight, Nature Water, 1, 835–843, https://doi.org/10.1038/s44221-023-00132-2, 2023. a
Fu, C.-C., Liu, J.-H., Wang, H., Xiang, C.-Y., Fu, X.-R., and Luan, Q.-H.: Urban storm flooding: Characteristics and management in Beijing, in: MATEC Web of Conferences, vol. 246, 01042, EDP Sciences, https://doi.org/10.1051/matecconf/201824601042, 2018. a
Fu, S., Schultz, D. M., Lyu, H., Zheng, Z., and Zhang, C.: Creating a national urban flood dataset for China from news texts (2000–2022) at the county level, Hydrol. Earth Syst. Sci., 29, 767–783, https://doi.org/10.5194/hess-29-767-2025, 2025. a
Ghanghas, A., Sharma, A., Dey, S., and Merwade, V.: How is spatial homogeneity in precipitation extremes changing globally?, Geophys. Res. Lett., 50, https://doi.org/10.1029/2023GL103233, 2023. a, b
Guo, K., Guan, M., and Yu, D.: Urban surface water flood modelling – a comprehensive review of current models and future challenges, Hydrol. Earth Syst. Sci., 25, 2843–2860, https://doi.org/10.5194/hess-25-2843-2021, 2021. a
Hall, J.: Direct Rainfall Flood Modelling: The Good, the Bad and the Ugly, Australasian Journal of Water Resources, 19, 74–85, https://www.tandfonline.com/doi/citedby/10.7158/13241583.2015.11465458 (last access: 27 July 2026), 2015. a
He, J., Zhang, L., Xiao, T., Wang, H., and Luo, H.: Deep learning enables super-resolution hydrodynamic flooding process modeling under spatiotemporally varying rainstorms, Water Res., 239, 120057, https://doi.org/10.1016/j.watres.2023.120057, 2023. a
Herath, H. M. V. V., Marshall, L., Saha, A., Rasnayaka, S., and Seneviratne, S.: Subgrid informed neural networks for high-resolution flood mapping, J. Hydrol., 660, 133329, https://doi.org/10.1016/j.jhydrol.2025.133329, 2025. a
Hersbach, H., Bell, B., Berrisford, P., Hirahara, S., Horányi, A., Muñoz-Sabater, J., Nicolas, J., Peubey, C., Radu, R., Schepers, D., Simmons, A., Soci, C., Abdalla, S., Abellan, X., Balsamo, G., Bechtold, P., Biavati, G., Bidlot, J., Bonavita, M., De Chiara, G., Dahlgren, P., Dee, D., Diamantakis, M., Dragani, R., Flemming, J., Forbes, R., Fuentes, M., Geer, A., Haimberger, L., Healy, S., Hogan, R. J., Hólm, E., Janisková, M., Keeley, S., Laloyaux, P., Lopez, P., Lupu, C., Radnoti, G., de Rosnay, P., Rozum, I., Vamborg, F., Villaume, S., and Thépaut, J.-N.: The ERA5 global reanalysis, Q. J. Roy. Meteor. Soc., 146, 1999–2049, https://doi.org/10.1002/qj.3803, 2020. a
Hersbach, H., Bell, B., Berrisford, P., Biavati, G., Horányi, A., Muñoz Sabater, J., Nicolas, J., Peubey, C., Radu, R., Rozum, I., Schepers, D., Simmons, A., Soci, C., Dee, D., and Thépaut, J.-N.: ERA5 hourly data on single levels from 1940 to present, Copernicus Climate Change Service (C3S) Climate Data Store (CDS) [data set], https://doi.org/10.24381/cds.adbb2d47, 2023. a
Hettiarachchi, S., Wasko, C., and Sharma, A.: Increase in flood risk resulting from climate change in a developed urban watershed – the role of storm temporal patterns, Hydrol. Earth Syst. Sci., 22, 2041–2056, https://doi.org/10.5194/hess-22-2041-2018, 2018. a
Huang, J., Fatichi, S., Mascaro, G., Manoli, G., and Peleg, N.: Intensification of sub-daily rainfall extremes in a low-rise urban area, Urban Climate, 42, 101–124, https://doi.org/10.1016/j.uclim.2022.101124, 2022. a
Järvi, L., Grimmond, C., and Christen, A.: The Surface Urban Energy and Water Balance Scheme (SUEWS): Evaluation in Los Angeles and Vancouver, J. Hydrol., 411, 219–237, https://doi.org/10.1016/j.jhydrol.2011.10.001, 2011. a
Katz, R. W., Parlange, M. B., and Naveau, P.: Statistics of extremes in hydrology, Adv. Water Resour., 25, 1287–1304, https://doi.org/10.1016/S0309-1708(02)00056-8, 2002. a
Koutsoyiannis, D., Kozonis, D., and Manetas, A.: A mathematical framework for studying rainfall intensity-duration-frequency relationships, J. Hydrol., 206, 118–135, https://doi.org/10.1016/S0022-1694(98)00097-3, 1998. a
Lacasta, A., Morales-Hernández, M., Murillo, J., and García-Navarro, P.: An optimized GPU implementation of a 2D free surface simulation model on unstructured meshes, Adv. Eng. Softw., 78, 1–15, https://doi.org/10.1016/j.advengsoft.2014.08.007, 2014. a
Lehmkuhl, F., Schüttrumpf, H., Schwarzbauer, J., Brüll, C., Dietze, M., Letmathe, P., Völker, C., and Hollert, H.: Assessment of the 2021 summer flood in Central Europe, https://doi.org/10.1186/s12302-022-00685-1, 2022. a, b
Lenderink, G., Barbero, R., Loriaux, J., and Fowler, H.: Super-Clausius–Clapeyron scaling of extreme hourly convective precipitation and its relation to large-scale atmospheric conditions, J. Climate, 30, 6037–6052, https://doi.org/10.1175/JCLI-D-16-0808.1, 2017. a, b
Li, B., Hou, J., Li, D., Yang, D., Han, H., Bi, X., Wang, X., Hinkelmann, R., and Xia, J.: Application of LiDAR UAV for High-Resolution Flood Modelling, Water Resour. Manag., 35, 1433–1447, https://doi.org/10.1007/s11269-021-02783-w, 2021. a
Li, D., Hou, J., Shen, R., Li, B., Tong, Y., and Wang, T.: Approximation method for the sewer drainage effect for urban flood modeling in areas without drainage-pipe data, Frontiers in Environmental Science, 11, https://doi.org/10.3389/fenvs.2023.1134985, 2023a. a
Li, R. and Zou, W.: AUTOSHED-Beijing Municipal Administrative Center, Zenodo [code], https://doi.org/10.5281/zenodo.15869025, 2025. a
Li, R., Sun, T., Tian, F., and Ni, G.: AUTO-SHEDS: Automated UnsTructured urban flood Simulator using High-rEsolution DEM, in: XXVIII General Assembly of the International Union of Geodesy and Geophysics (IUGG), GFZ German Research Centre for Geosciences, https://doi.org/10.57757/IUGG23-3440, 2023b. a, b
Li, R., Liu, J., Sun, T., Shao, J., Tian, F., and Ni, G.: Enhancing urban pluvial flood modeling through graph reconstruction of incomplete sewer networks, Hydrol. Earth Syst. Sci., 29, 5677–5694, https://doi.org/10.5194/hess-29-5677-2025, 2025. a
Li, X., Zhao, S., and Wang, D.: Roles of synoptic characteristics and microphysics processes on the heavy rain event over Beijing region during 29 July to 2 August 2023, Frontiers in Earth Science, 12, https://doi.org/10.3389/feart.2024.1394342, 2024. a
Li, Z., Li, R., Zhang, Z., and Tian, F.: Flood mapping in SAR images via threshold segmentation with hydrological-hydrodynamic modeling, J. Hydrol., 667, 134825, https://doi.org/10.1016/j.jhydrol.2025.134825, 2026. a
Lin, Y., Fan, J., Jeong, J.-H., Zhang, Y., Homeyer, C. R., and Wang, J.: Urbanization-induced land and aerosol impacts on storm propagation and hail characteristics, J. Atmos. Sci., 78, 925–947, https://doi.org/10.1175/JAS-D-20-0106.1, 2021. a
Liu, J., Fu, C., Xiang, C., Wang, H., and Mei, C.: Urban Storm Flooding Management in Beijing, Urban Planning and Water-related Disaster Management, 23–42, https://doi.org/10.1007/978-3-319-90173-2_3, 2019. a
Liu, L., Sun, J., and Lin, B.: A large-scale waterlogging investigation in a megacity, Nat. Hazards, 114, 1505–1524, https://doi.org/10.1007/s11069-022-05435-3, 2022. a
Luan, G., Hou, J., Wang, T., Zhou, Q., Xu, L., Sun, J., and Wang, C.: Method for analyzing urban waterlogging mechanisms based on a 1D-2D water environment dynamic bidirectional coupling model, J. Environ. Manage., 360, 121024, https://doi.org/10.1016/j.jenvman.2024.121024, 2024. a
Maier, R., Krebs, G., Pichler, M., Muschalla, D., and Gruber, G.: Spatial Rainfall Variability in Urban Environments—High-Density Precipitation Measurements on a City-Scale, Water, 12, https://doi.org/10.3390/w12041157, 2020. a
Marra, F., Koukoula, M., Canale, A., and Peleg, N.: Predicting extreme sub-hourly precipitation intensification based on temperature shifts, Hydrol. Earth Syst. Sci., 28, 375–389, https://doi.org/10.5194/hess-28-375-2024, 2024. a, b, c
Martel, J.-L., Brissette, F. P., Lucas-Picher, P., Troin, M., and Arsenault, R.: Climate change and rainfall intensity–duration–frequency curves: Overview of science and guidelines for adaptation, J. Hydrol. Eng., 26, https://doi.org/10.1061/(ASCE)HE.1943-5584.0002122, 2021. a
Medina, S. and Houze, R. A.: Air motions and precipitation growth in Alpine storms, Q. J. Roy. Meteor. Soc., 129, 345–371, https://doi.org/10.1256/qj.02.13, 2003. a
Meng, D., Liao, Y., Deng, Z., Chen, Y., Lai, C., Chen, X., and Wang, Z.: Spatially moving non-uniform rainstorms may exacerbate urban flooding disasters, J. Hydrol., 660, https://doi.org/10.1016/j.jhydrol.2025.133374, 2025. a
Ming, X., Liang, Q., and Jiang, J.: Large-scale high-resolution hydrodynamic modelling of urban floods: Some practical considerations, J. Hydro-Environ. Res., 59, https://doi.org/10.1016/j.jher.2025.100655, 2025. a, b, c
Myneni, R., Knyazikhin, Y., and Park, T.: MOD15A2H MODIS/Terra Leaf Area Index/FPAR 8-Day L4 Global 500m SIN Grid V006, NASA Land Processes Distributed Active Archive Center [data set], https://doi.org/10.5067/MODIS/MOD15A2H.006, 2015. a
Najafi, H., Shrestha, P. K., Rakovec, O., Apel, H., Vorogushyn, S., Kumar, R., Thober, S., Merz, B., and Samaniego, L.: High-resolution impact-based early warning system for riverine flooding, Nature Commun., 15, 3726, https://doi.org/10.1038/s41467-024-48065-y, 2024. a
Nathan, R.: Improving event-based methods for modelling flood risk in a variable and non-stationary climate, Philos. T. R. Soc. A., 383, https://doi.org/10.1098/rsta.2024.0292, 2025. a
Ni, G.-H., Liu, Z.-Y., Lei, Z.-D., Yang, D.-W., and Wang, L.: Continuous Simulation of Water and Soil Erosion in a Small Watershed of the Loess Plateau with a Distributed Model, J. Hydrol. Eng., 13, 392–399, https://doi.org/10.1061/(ASCE)1084-0699(2008)13:5(392), 2008. a
Nishihama, M., Wolfe, R., Solomon, D., Patt, F., Blanchette, J., Fleig, A., and Masuoka, E.: MODIS Level 1A Earth Location: Algorithm Theoretical Basis Document Version 3.0, https://modis.gsfc.nasa.gov/data/atbd/atbd_mod28_v3.pdf (last access: 27 July 2026), 1997. a
Padulano, R., Rianna, G., Costabile, P., Costanzo, C., Del Giudice, G., and Mercogliano, P.: Propagation of variability in climate projections within urban flood modelling: A multi-purpose impact analysis, J. Hydrol., 602, https://doi.org/10.1016/j.jhydrol.2021.126756, 2021. a
Peleg, N., Marra, F., Fatichi, S., Molnar, P., Morin, E., Sharma, A., and Burlando, P.: Intensification of convective rain cells at warmer temperatures observed from high-resolution weather radar data, J. Hydrometeorol., 19, 715–726, https://doi.org/10.1029/2022GL099138, 2018a. a
Peleg, N., Marra, F., Fatichi, S., Paschalis, A., Molnar, P., and Burlando, P.: Spatial variability of extreme rainfall at radar subpixel scale, J. Hydrol., 556, 922–933, https://doi.org/10.1016/j.jhydrol.2016.05.033, 2018b. a
Peleg, N., Ban, N., Gibson, M. J., Chen, A. S., Paschalis, A., Burlando, P., and Leitão, J. P.: Mapping storm spatial profiles for flood impact assessments, Adv. Water Resour., 166, https://doi.org/10.1016/j.advwatres.2022.104258, 2022. a, b, c
Peleg, N., Koukoula, M., and Marra, F.: A 2°C warming can double the frequency of extreme summer downpours in the Alps, npj Climate and Atmospheric Science, 8, 216, https://doi.org/10.1038/s41612-025-01081-1, 2025. a
Perrini, P., Cea, L., Chiaravalloti, F., Gabriele, S., Manfreda, S., Fiorentino, M., Gioia, A., and Iacobellis, V.: A Runoff-On-Grid Approach to Embed Hydrological Processes in Shallow Water Models, Water Resour. Res., 60, https://doi.org/10.1029/2023WR036421, 2024a. a
Perrini, P., Cea, L., Chiaravalloti, F., Gabriele, S., Manfreda, S., Fiorentino, M., Gioia, A., and Iacobellis, V.: A Runoff-On-Grid Approach to Embed Hydrological Processes in Shallow Water Models, Water Resour. Res., 60, https://doi.org/10.1029/2023WR036421, 2024b. a
Pizzileo, S., Moretti, G., and Orlandini, S.: Flood plain inundation modeling with explicit description of land surface macrostructures, Adv. Water Resour., 188, https://doi.org/10.1016/j.advwatres.2024.104713, 2024. a
Polo-Martín, B.: Valencia’s battle against floods: A cartographic review to assess water management strategies, Cartography, 8, https://doi.org/10.24294/jgc10129, 2025. a, b
Pregnolato, M., Ford, A., Wilkinson, S. M., and Dawson, R. J.: The impact of flooding on road transport: A depth-disruption function, Transport Res. D-Tr. E., 55, 67–81, https://doi.org/10.1016/j.trd.2017.06.020, 2017. a
Prein, A. F., Langhans, W., Fosser, G., Ferrone, A., Ban, N., Goergen, K., Keller, M., Tölle, M., Gutjahr, O., Feser, F., Brisson, E., Kollet, S., Schmidli, J., van Lipzig, N. P. M., and Leung, R. L.: A review on regional convection-permitting climate modeling: Demonstrations, prospects, and challenges, Rev. Geophys., 53, 323–361, https://doi.org/10.1002/2014RG000475, 2015. a, b
Rözer, V., Peche, A., Berkhahn, S., Feng, Y., Fuchs, L., Graf, T., Haberlandt, U., Kreibich, H., Sämann, R., Sester, M., Shehu, B., Wahl, J., and Neuweiler, I.: Impact-Based Forecasting for Pluvial Floods, Earth's Future, 9, https://doi.org/10.1029/2020EF001851, 2021. a, b
Rosenzweig, B. R., Herreros Cantis, P., Kim, Y., Cohn, A., Grove, K., Brock, J., Yesuf, J., Mistry, P., Welty, C., McPhearson, T., Sauer, J., and Chang, H.: The Value of Urban Flood Modeling, Earth's Future, 9, https://doi.org/10.1029/2020EF001739, 2021. a
Saharia, M., Kirstetter, P.-E., Vergara, H., Gourley, J. J., Hong, Y., and Giroud, M.: Mapping flash flood severity in the United States, J. Hydrometeorol., 18, 397–411, https://doi.org/10.1175/JHM-D-16-0082.1, 2017. a
Sanders, B. F., Schubert, J. E., Martin, E.-M. H., Wang, S., Sukop, M. C., and Mach, K. J.: A fast flood inundation model with groundwater interactions and hydraulic structures, Adv. Water Resour., 105057, https://doi.org/10.1029/2024WR038847, 2025. a
Simons, G., Koster, R., and Droogers, P.: Hihydrosoil v2. 0-high resolution soil maps of global hydraulic properties, FutureWater Report, https://www.futurewater.eu/projects/hihydrosoil (last access: 27 July 2026), 2020. a
Song, L., Zhou, J., Li, Q., Yang, X., and Zhang, Y.: An unstructured finite volume model for dam-break floods with wet/dry fronts over complex topography, Int. J. Numer. Meth. Fl., 67, 960–980, https://doi.org/10.1002/fld.2397, 2011. a
Torelló-Sentelles, H., Marra, F., Koukoula, M., Villarini, G., and Peleg, N.: Intensification and Changing Spatial Extent of Heavy Rainfall in Urban Areas, Earth's Future, 12, https://doi.org/10.1029/2024EF004505, 2024. a, b
Torelló-Sentelles, H., Villarini, G., Koukoula, M., and Peleg, N.: Impacts of urban dynamics and thermodynamics on convective rainfall across different urban forms, Urban Climate, 62, https://doi.org/10.1016/j.uclim.2025.102499, 2025. a
Trenberth, K. E., Dai, A., Rasmussen, R. M., and Parsons, D. B.: The changing character of precipitation, B. Am. Meteorol. Soc., 84, 1205–1218, https://doi.org/10.1175/BAMS-84-9-1205, 2003. a, b
Wang, Y., Song, L., Shen, P., and Yang, Y.: Substantial Increase in Sub–Daily Precipitation Extremes of Flooding Season Over China, Geophys. Res. Lett., 51, https://doi.org/10.1029/2024GL112182, 2024. a, b
Wasko, C. and Sharma, A.: Quantile regression for investigating scaling of extreme precipitation with temperature, Water Resour. Res., 50, 3608–3614, https://doi.org/10.1002/2013WR015194, 2014. a, b
Werner, M.: Shuttle radar topography mission (SRTM) mission overview, Frequenz, 55, 75–79, https://doi.org/10.1515/FREQ.2001.55.3-4.75, 2001. a
Westra, S., Fowler, H. J., Evans, J. P., Alexander, L. V., Berg, P., Johnson, F., Kendon, E. J., Lenderink, G., and Roberts, N.: Future changes to the intensity and frequency of short-duration extreme rainfall, Rev. Geophys., 52, 522–555, https://doi.org/10.1002/2014RG000464, 2014. a
Wilson, L. L. and Foufoula-Georgiou, E.: Regional rainfall frequency analysis via stochastic storm transposition, J. Hydraul. Eng., 116, 859–880, https://doi.org/10.1061/(ASCE)0733-9429(1990)116:7(859), 1990. a
Wright, D. B., Smith, J. A., Villarini, G., and Baeck, M. L.: Estimating the frequency of extreme rainfall using weather radar and stochastic storm transposition, J. Hydrol., 488, 150–165, https://doi.org/10.1016/j.jhydrol.2013.03.003, 2013. a, b, c, d, e
Wright, D. B., Smith, J. A., and Baeck, M. L.: Critical examination of area reduction factors, J. Hydrol. Eng., 19, 769–776, https://doi.org/10.1061/(ASCE)HE.1943-5584.0000855, 2014a. a
Wright, D. B., Smith, J. A., and Baeck, M. L.: Flood frequency analysis using radar rainfall fields and stochastic storm transposition, Water Resour. Res., 50, 1592–1615, https://doi.org/10.1002/2013WR014224, 2014b. a, b
Wright, D. B., Mantilla, R., and Peters-Lidard, C. D.: A remote sensing-based tool for assessing rainfall-driven hazards, Environ. Modell. Softw., 90, 34–54, https://doi.org/10.1016/j.envsoft.2016.12.006, 2017. a, b, c
Wright, D. B., Bosma, C. D., and Lopez-Cantu, T.: US hydrologic design standards insufficient due to large increases in frequency of rainfall extremes, Geophys. Res. Lett., 46, 8144–8153, https://doi.org/10.1029/2019GL083235, 2019. a
Wright, D. B., Yu, G., and England, J. F.: Six decades of rainfall and flood frequency analysis using stochastic storm transposition: Review, progress, and prospects, J. Hydrol., 585, https://doi.org/10.1002/2013WR014224, 2020. a, b, c, d, e
Xing, Y., Chen, H., Liang, Q., and Ma, X.: Improving the performance of city-scale hydrodynamic flood modelling through a GIS-based DEM correction method, Nat. Hazards, 112, 2313–2335, https://doi.org/10.1007/s11069-022-05267-1, 2022. a
Yan, L., Xiong, L., Jiang, C., Zhang, M., Wang, D., and Xu, C.-Y.: Updating intensity–duration–frequency curves for urban infrastructure design under a changing environment, Wiley Interdisciplinary Reviews: Water, 8, https://doi.org/10.1002/wat2.1519, 2021. a, b
Yang, K., Guan, X., Zuo, X., Gao, Z., and Jin, S.: Impact of Localized High Temperatures on Extreme Rainfall: Insights From the July 2023 Heavy Rainfall Event in the Beijing–Tianjin–Hebei Region Over the Taihang Mountains, Geophys. Res. Lett., 52, https://doi.org/10.1029/2025GL117163, 2025. a
Yu, G., Wright, D. B., and Li, Z.: The upper tail of precipitation in convection-permitting regional climate models and their utility in nonstationary rainfall and flood frequency analysis, Earth's Future, 8, https://doi.org/10.1029/2020EF001613, 2020. a
Zanaga, D., Van De Kerchove, Ruben andDaems, D., De Keersmaecker, W., Brockmann, C., Kirches, G., Wevers, J., Cartus, O., Santoro, M., Fritz, S., Lesiv, M., Herold, M., Tsendbazar, N.-E., Xu, P., Ramoino, F., and Arino, O.: ESA WorldCover 10 m 2021 v200, Zenodo [data set], https://doi.org/10.5281/zenodo.7254221, 2022. a, b
Zheng, Z., Xu, G., and Gao, H.: Characteristics of Summer Hourly Extreme Precipitation Events and Its Local Environmental Influencing Factors in Beijing under Urbanization Background, Atmosphere, 12, 632, https://doi.org/10.3390/atmos12050632, 2021. a
Zhong, L., Mu, R., Zhang, D., Zhao, P., Zhang, Z., and Wang, N.: An observational analysis of warm‐sector rainfall characteristics associated with the 21 July 2012 Beijing extreme rainfall event, Atmospheres, 120, https://doi.org/10.1002/2014JD022686, 2014. a
Zhuang, Q., Koukoula, M., Liu, S., Zhou, Z., Gao, L., and Peleg, N.: Contradictory influences of urbanization on intense convective rainfall in a subtropical city, Environ. Res. Lett., 19, https://doi.org/10.1088/1748-9326/ad7277, 2024. a
Zou, W. and Peleg, N.: Gamma-based Spatial Quantile Mapping (GSQM) of heavy rainfall field – an example of a heavy storm in Beijing (Version MATLAB) [Figure], Zenodo [code], https://doi.org/10.5281/zenodo.13646191, 2024b. a
Zou, W., Hu, G., Wiersma, P., Yin, S., Xiao, Y., Mariethoz, G., and Peleg, N.: Multiple-point geostatistics-based spatial downscaling of heavy rainfall fields, J. Hydrol., 632, https://doi.org/10.1016/j.jhydrol.2024.130899, 2024. a, b
Zou, W., Wright, D. B., and Peleg, N.: Morphing sub-daily rainfall fields based on temperature shifts to project future changes in rainfall extremes, Water Resour. Res., 61, https://doi.org/10.1029/2024WR038847, 2025. a, b, c, d, e, f, g, h
Zou, W.-Y., Yin, S.-Q., and Wang, W.-T.: Spatial interpolation of the extreme hourly precipitation at different return levels in the Haihe River basin, J. Hydrol., 598, https://doi.org/10.1016/j.jhydrol.2021.126273, 2021. a