the Creative Commons Attribution 4.0 License.
the Creative Commons Attribution 4.0 License.
 | 16 Apr 2026
Hydroeconomic optimization of water management in the Yellow River Basin: dealing with scarcity
Yuhan Yan
Ximing Cai
Zhenxing Zhang
Yunlu Ma
Jay R. Lund
Water scarcity is a key limiting factor for sustainable socioeconomic development especially in arid and semi-arid basins, and managing water effectively there often requires coherent and holistic policies and regulations at the basin scale. This study develops an integrated basin-scale hydroeconomic optimization model. The model reasonably details the representation of the hydrologic, infrastructural, water demand and regulatory components, with an objective to maximize overall economic benefits of irrigated crop production, water supply and hydropower generation, subject to resource, infrastructural, operational and policy constraints. A baseline calibration enhances the model's reliability and empirical validity for analysing interconnected physical processes and decision-making, based on the interdependence of hydrologic and economic components. The model is applied to the Yellow River Basin (YRB), where water has been fully allocated and intense competition exists among different water users across the basin. Results show that water availability decreases by approximately 75 % from upstream to downstream, with the corresponding marginal values rising from CNY 0 to 9.14 m−3 along the river in a severe dry year, implying greater challenges for downstream water security (especially the critical ecological requirements) and a larger requirement for water saving in upstream areas. Basin-wide management strategies highlighted in this study include: reallocating water to economically high-value production sectors; coordinating the operation of cascade reservoirs and taking advantage of reservoirs with inter-year operation capacity; monitoring and balancing water availability between upstream and downstream areas. The stabilization of water supply heavily relies on coordinated operation of aquifers and reservoirs with inter-year storage capacity, which mitigates hydrologic variability and improves downstream water availability. Water valuation analysis based on marginal value underscores the potential benefits of water trading and inter-regional transfers. The results offer insights for basin-scale water management, showing potential of reallocation strategies for improving management flexibility and increasing water productivity. Insights from the YRB are meaningful as guides for managing basins worldwide that face similar challenges.
- Article
(4221 KB) - Full-text XML
-
Supplement
(590 KB) - BibTeX
- EndNote


Water scarcity is a growing challenge in many river basins around the world, where the demand for water, driven by population expansion, socioeconomic development, and evolving consumption habits, outstrips water supply (Hejazi et al., 2014; Kahil et al., 2018; Liu et al., 2017; Tian et al., 2021; United Nations, 2023). In many of those basins, water has already been overallocated, leading to river basin closure, pervasive water scarcity, groundwater overdraft, and ecosystem degradation (Hanasaki et al., 2013; Molle et al., 2010; Scanlon et al., 2023; Zhou et al., 2020). Particularly, as nations strive to sustain growing populations and economies under changing climatic conditions, pressures from water overuse, ecological degradation, and challenges in cross-regional cooperation in large arid and semi-arid river basins are expected to intensify (Kahil et al., 2018). For instance, the Colorado River and Rio Grande basins face overexploitation dilemmas from historical agreements that overcommitted actual water availability (Ward et al., 2006). Similarly, the Murray-Darling Basin in Australia (Ejaz Qureshi et al., 2013; Thevs et al., 2015) and the Ebro River Basin in Spain (Baccour et al., 2021) struggle to reconcile water quality deterioration with economic development objectives. The Syr Darya in Central Asia (Cai et al., 2003) and the Nile (Basheer et al., 2023) are significantly impacted by challenges in transboundary water allocation coordination. These challenges highlight the need for a systematic framework to analyse spatial and temporal trade-offs across interconnected water-related systems in large river basins.
Hydroeconomic models (HEMs) have emerged as pivotal tools for guiding basin-scale water resources planning, incorporating both economic and hydrologic representations of water supply and demand (Pulido-Velazquez and Tilmant, 2022). Such models comprehensively characterize the infrastructure, management scheme and the economic value of water within the system (Harou et al., 2009; Ward, 2021), based on the mathematical framework that links biophysical, technological, and economic processes (Cai, 2008a; Kahil et al., 2018; Pulido-Velazquez and Tilmant, 2022). Earlier applications include the basin-scale economic-engineering model of California's major water supply system to coordinate surface and groundwater operations, and to optimize statewide economic benefits from rural and urban water use (Draper et al., 2003). Considering conjunctive water use of surface and groundwater, Zhu et al. (2015) derived numerical solutions and analytical conditions for optimizing land and water use for crops, short-term and long-term urban water conservation alternatives, and water transfers. Kahil et al. (2016) strengthened the linkage between physically-based representations of water sources and uses through an integrated HEM to assess the impacts of climate change and policy options in the Jucar basin in Spain. To explore economic and environmental consequences of various policy scenarios, Cai et al. (2003) described interrelationships among hydrologic, agronomic, and ecological components in the Syr Darya River basin, where irrigation-induced salinity is a major challenge. Together, these studies highlight HEMs to inform basin-scale water management under multiple and competing objectives.
In this context, the Yellow River Basin (YRB) in northern China offers a compelling case for examining basin development against severe water scarcity (Cai, 2008b; Peng et al., 2017; Shang et al., 2020). On the supply side, water availability in the YRB is constrained by decreasing streamflow from reduced precipitation, rising temperature and landscape evapotranspiration (Yin et al., 2021). On the demand side, with the total drainage area of 7.52 × 10⁵ km2, the YRB supports 12 % of China's population and 15 % of its farmland with only 2.5 % of the country's total water resources (Wu et al., 2004; Zhang et al., 2017). Although infrastructure including reservoirs and dams has been constructed to regulate streamflow, and policies such as the “87 Water Allocation Scheme” (General Office of the State Council of the People's Republic of China, 1987) have been implemented for rational water allocation and conservation (Wang et al., 2020, 2018), competition among water-use sectors has continued to intensify. Addressing the dual challenges of meeting development needs while ensuring reliable and sustainable water use is therefore of considerable concern for the YRB.
Previous studies on water management in the YRB have focused predominantly on supply-side issues (Xia and Pahl-Wostl, 2012; Yin et al., 2017), including the simulation of natural hydrologic responses to climate change (Bao et al., 2019; Chen et al., 2014; Zheng et al., 2009) and human interventions (Li et al., 2017; Wang et al., 2019b; Yin et al., 2021), projections with hydrologic models (Cuo et al., 2013; Xu et al., 2011; Yuan et al., 2016; Zhang et al., 2017), and the optimization of reservoir operations (Bai et al., 2019, 2015; Chang et al., 2014; Meng et al., 2019; Peng et al., 2020). Nevertheless, a significant research gap remains in studies that integrate physical water availability on the supply-side and decision-making behaviours on the demand-side, and basin-wide water management regulations within a unified quantitative framework.
To reveal demand-side behaviours, HEMs have been applied to the YRB at individual or sub-basin scales. For example, Yang et al. (2012) used a decentralized, multiple-agent optimization method to explore water allocation management at the agent scale. Cao et al. (2023) developed an integrated hydro-agro-economic optimization model for the Hetao Irrigation District within the YRB, analysing economically optimal land and water allocation, and environmental sustainability under water scarcity and soil salinization. Martinsen et al. (2021) formulated a linear programming-based HEM to assess the implications of perfect foresight of agro-hydrologic events for the South-to-North Water Transfer Project, addressing joint quantity and quality management. However, basin-wide models that holistically and quantitatively represent multiple water sources, diverse water-use sectors, coordinated reservoir operations, spatially coupled variations in water availability and value, and the supply-demand interactions under realistic regulatory and institutional settings remain largely absent. As a result, existing models remain misaligned with the practical needs of the Yellow River Conservancy Commission (YRCC), which urgently requires an integrated basin-wide framework to guide evidence-based water allocation decisions and long-term water governance.
This study develops a basin-wide hydroeconomic optimization model for the YRB, which represents hydrologic, infrastructure, and water demand components using a node-arc network in a spatially explicit manner. The model follows the top-down hierarchical water management institutional setting in the YRB and integrates surface water, groundwater, and multi-reservoir operations with spatially distributed economic activities across the entire YRB, aiming to maximize the economic benefits at the basin scale, including hydropower generation, agricultural production and urban water uses. This unified modelling framework allows a quantitative assessment of basin-wide water allocation and trade-offs among various water users. Specifically, this paper: (1) characterizes the relationships between water supply and demand under different hydrologic conditions; (2) investigates synergies and trade-offs in economic benefits among water-use sectors; (3) assesses the marginal values of water and the degrees of water scarcity and provides insights for improving the current water governance in the basin. Notably, most previous optimization models for basin management are formulated as purely normative tools to explore ideally optimal solutions. To better reflect real-world management, we adopt a “positive” optimization model, of which irrigation water use, the major water user in the YRB and many other basins, is calibrated to the observed conditions using the Positive Mathematical Programming (PMP) approach (Howitt, 1995). The outputs of such a positive model show the adjustments from current practices, demonstrating that the proposed basin-wide optimization framework can be a useful scientific and practical tool to evaluate existing water allocation regulatory programs and policies and search for new alternatives in the YRB.
2.1 Study Area
As the second longest river in China and the fifth longest in the world, the Yellow River (Fig. 1) originates from the Tibetan Plateau, flows across nine provinces, and finally discharges into the Bohai Gulf (Zheng et al., 2014). The mean annual runoff of the Yellow River is 53.48 billion m3, which has been decreasing in the past 30 years, exacerbating water scarcity in the basin (Shang et al., 2020). Runoff is unevenly distributed (Fig. S1 in the Supplement) due to strong spatiotemporal variation in precipitation (Fig. S2). The average annual precipitation across the basin during the period from 1981 to 2010 varies spatially from 60 to 900 mm, increasing from the northwest to the southeast (Yin et al., 2017). Precipitation in the basin is highly seasonal, with approximately 60 % of the annual precipitation occurring during the wet season (July–October), while only 10 %–20 % in the dry season (March–June). Under a continental monsoon climate, most of the YRB is in arid and semi-arid regions, with average annual potential evapotranspiration of 1199.7 mm (Peng et al., 2017). To mitigate adverse impacts of floods and droughts, numerous dams and reservoirs have been constructed to regulate streamflow. By 2020, 224 large and medium-sized reservoirs have been built (YRCC, 2020). Large reservoirs, such as Longyangxia, Liujiaxia and Xiaolangdi, serve as both water storage and hydropower generation facilities.
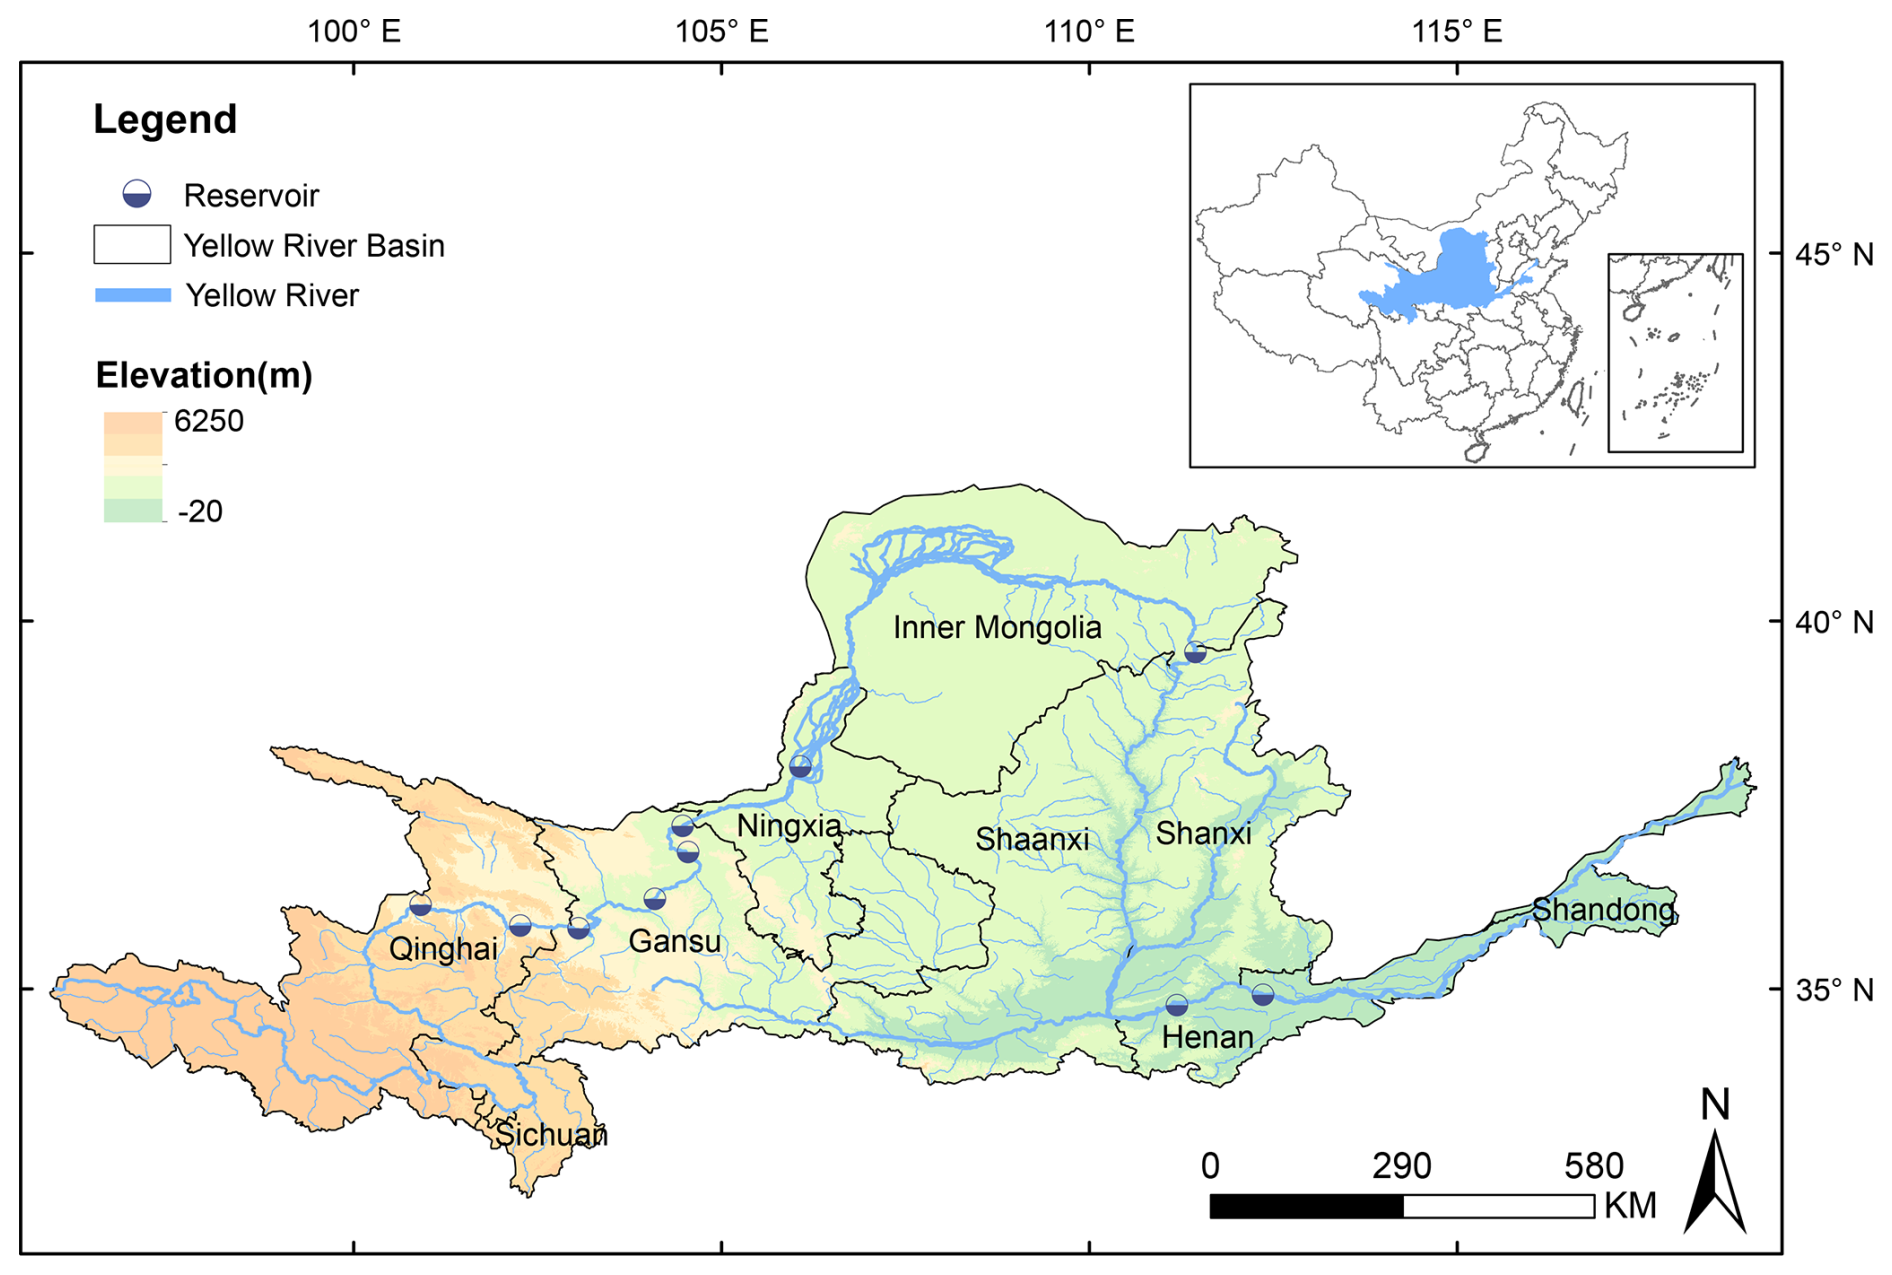
Figure 1The YRB in China: general topography, mainstream and tributaries, provinces and key reservoirs.
The Yellow River is a major source of water supply for northern China, supporting irrigation, industries, domestic water uses and ecological flow requirements. With the development of the national economy, total water use in the basin, sourced from both surface water and groundwater, increased from 44.63 billion m3 in 1980 to 53.48 billion m3 in 2015 (Peng et al., 2017). Frequent drying up of the Yellow River's main channel occurred between 1972 and 2000 (Liu and Cheng, 2000), highlighting severe spatial and temporal mismatches between water supply and demand. To address this issue, the Chinese government introduced the “87 Water Allocation Scheme” in 1987 (General Office of the State Council of the People's Republic of China, 1987), using the average annual natural runoff of 58 billion m3 from 1919 to 1975 as a water availability baseline. After reserving 21 billion m3 for environmental flow requirements, the remaining 37 billion m3 of water resources were allocated among the nine provinces and autonomous regions within the basin as well as Hebei Province and Tianjin City. However, significant discrepancies between actual runoff and this baseline water availability gradually emerged. Meanwhile, due to insufficient regulatory enforcement, the scheme was not effectively implemented, leading to frequent water overuse in provinces such as Inner Mongolia and Shandong. In response, the scheme was revised in 1998, alongside the implementation of the “Yellow River Water Allocation and Management Regulations”, which centralized water resources management under the YRCC (Wang et al., 2019a; Wang and Lou, 2022). Based on the original scheme, the regulations adhered to the principle of “increasing allocations in wet years and reducing them in dry years”, and water overuse by provinces was deducted from subsequent allocations to ensure compliance. Nevertheless, the contradiction between reduced water availability and growing water demand is growing and needs to be solved urgently (Wang et al., 2018, 2020).
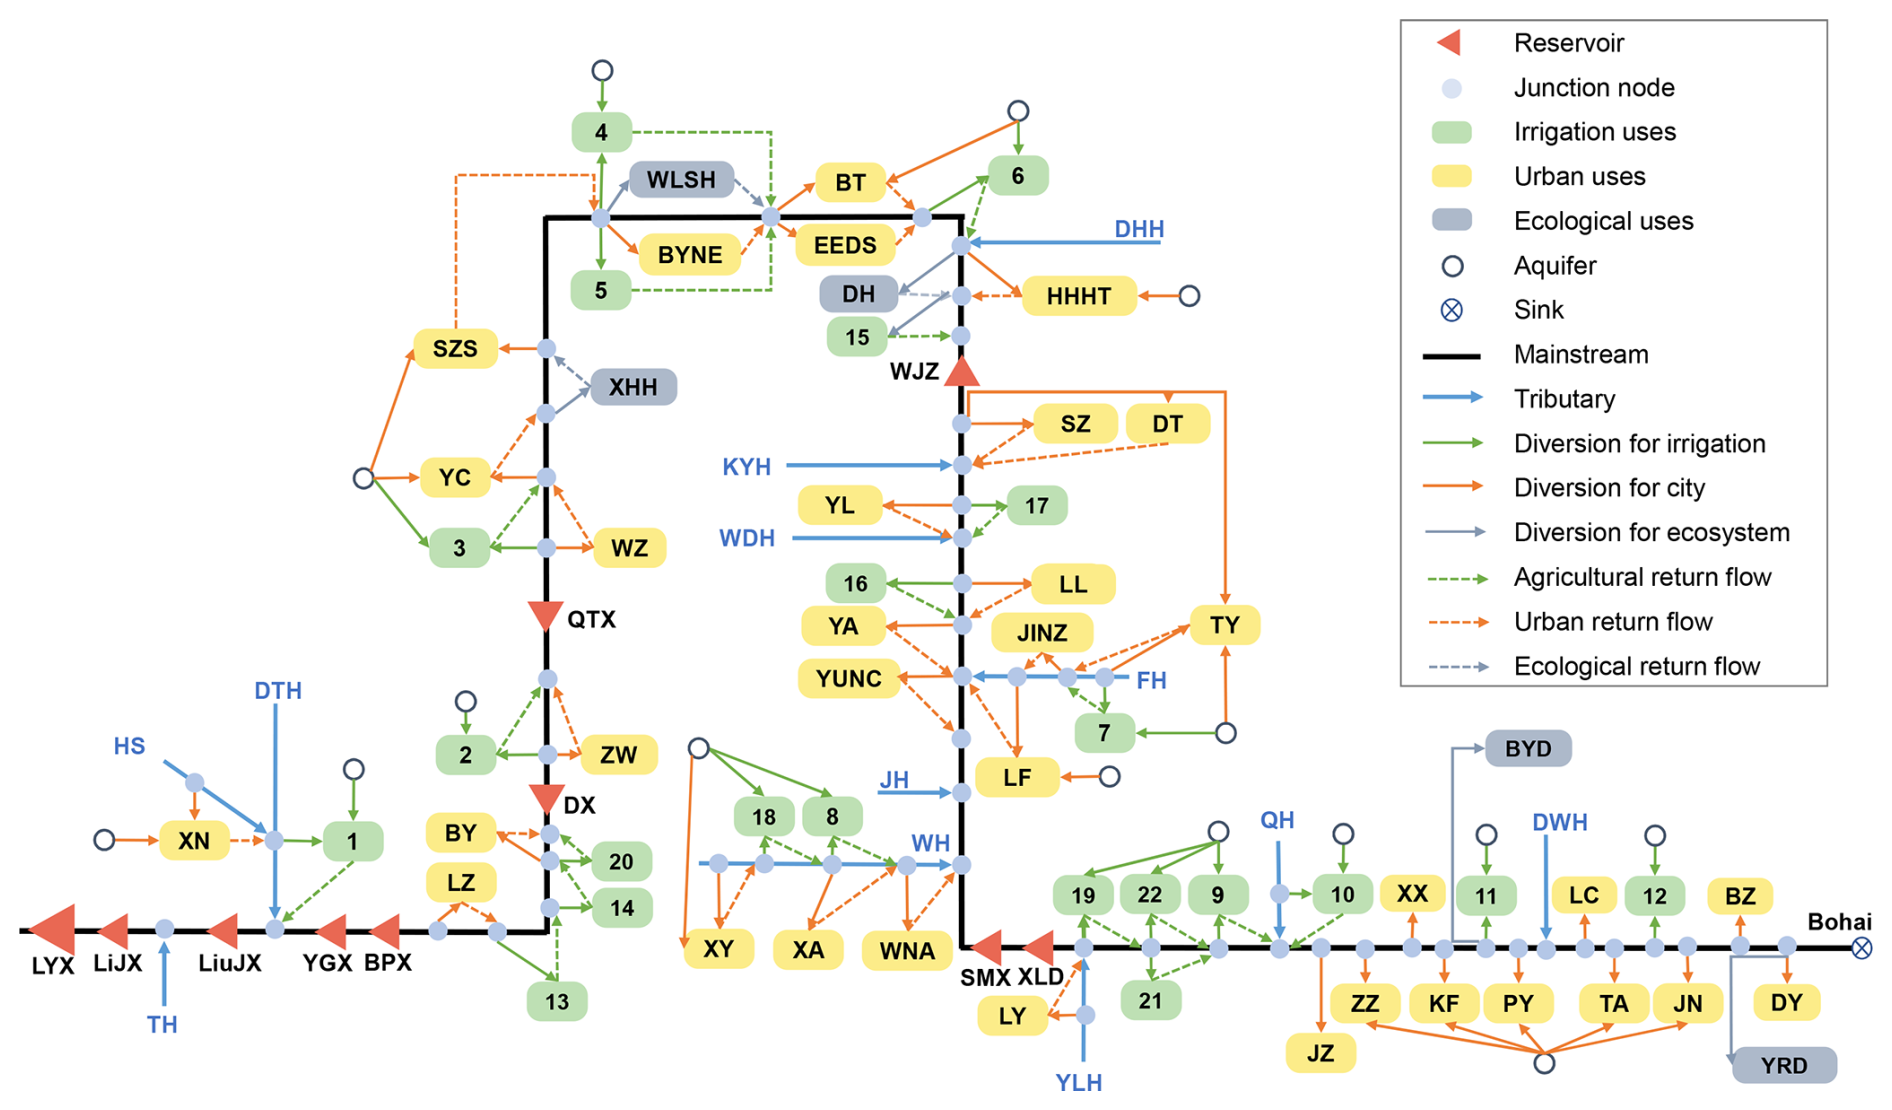
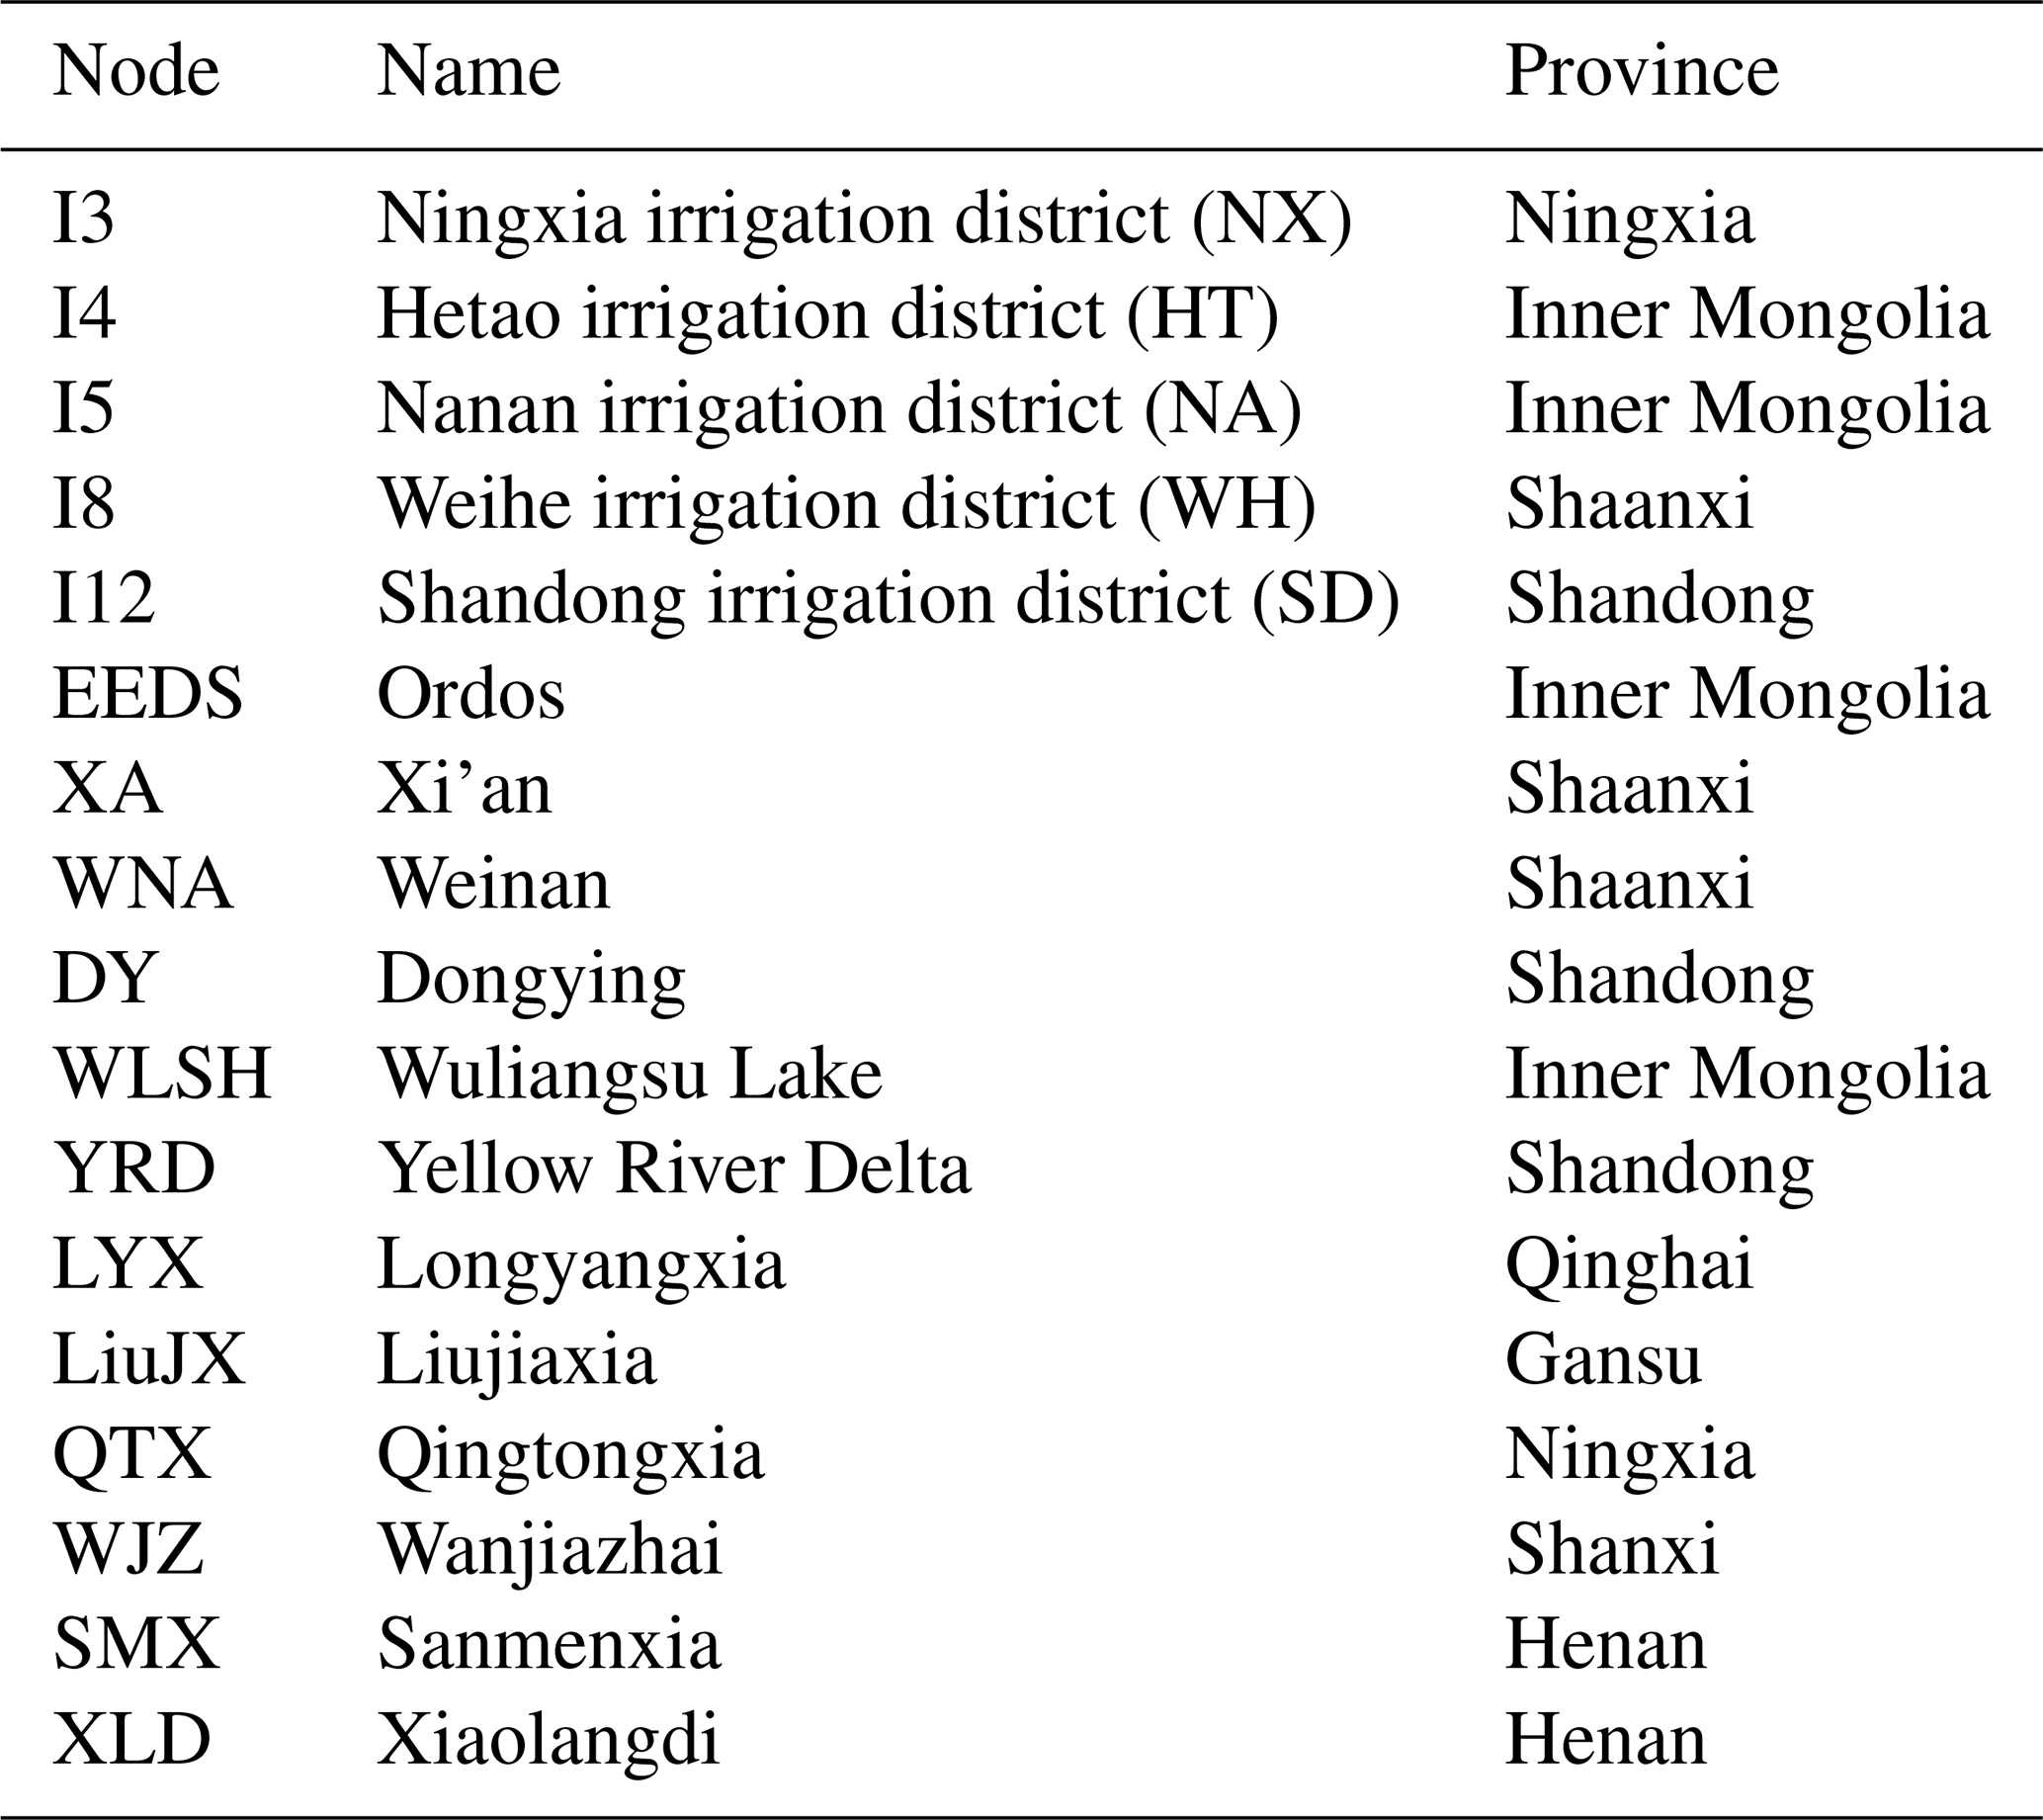
Figure 2 depicts the basin network of water allocation among water sources (rivers, groundwater aquifers and reservoirs) and water users (hydropower stations, agricultural, industrial, municipal and ecological demand sites), detailed node-link information is listed in Table 1 and the Supplement (Tables S2-1 to S2-6).
Table 1Abbreviations and full names of nodes mentioned in the main text and associated provinces. Detailed node information is provided in the Supplement (Tables S2-1 to S2-6).
2.2 Data
The HEM for the YRB requires extensive data to set up, calibrate, and run. These include monthly meteorological and hydrologic time series, aquifer attributes, characteristics of storage, conveyance and pumping facilities, factors that determine water demands of domestic, industrial, agricultural and environmental sectors, and regulations and rules of water system management and operations. The data were acquired from various sources, such as governmental statistics, river basin agencies, research institutions, global databases, and expert consultations. Table 2 lists the categories, specific parameters, attributes and sources of the datasets used in the model.
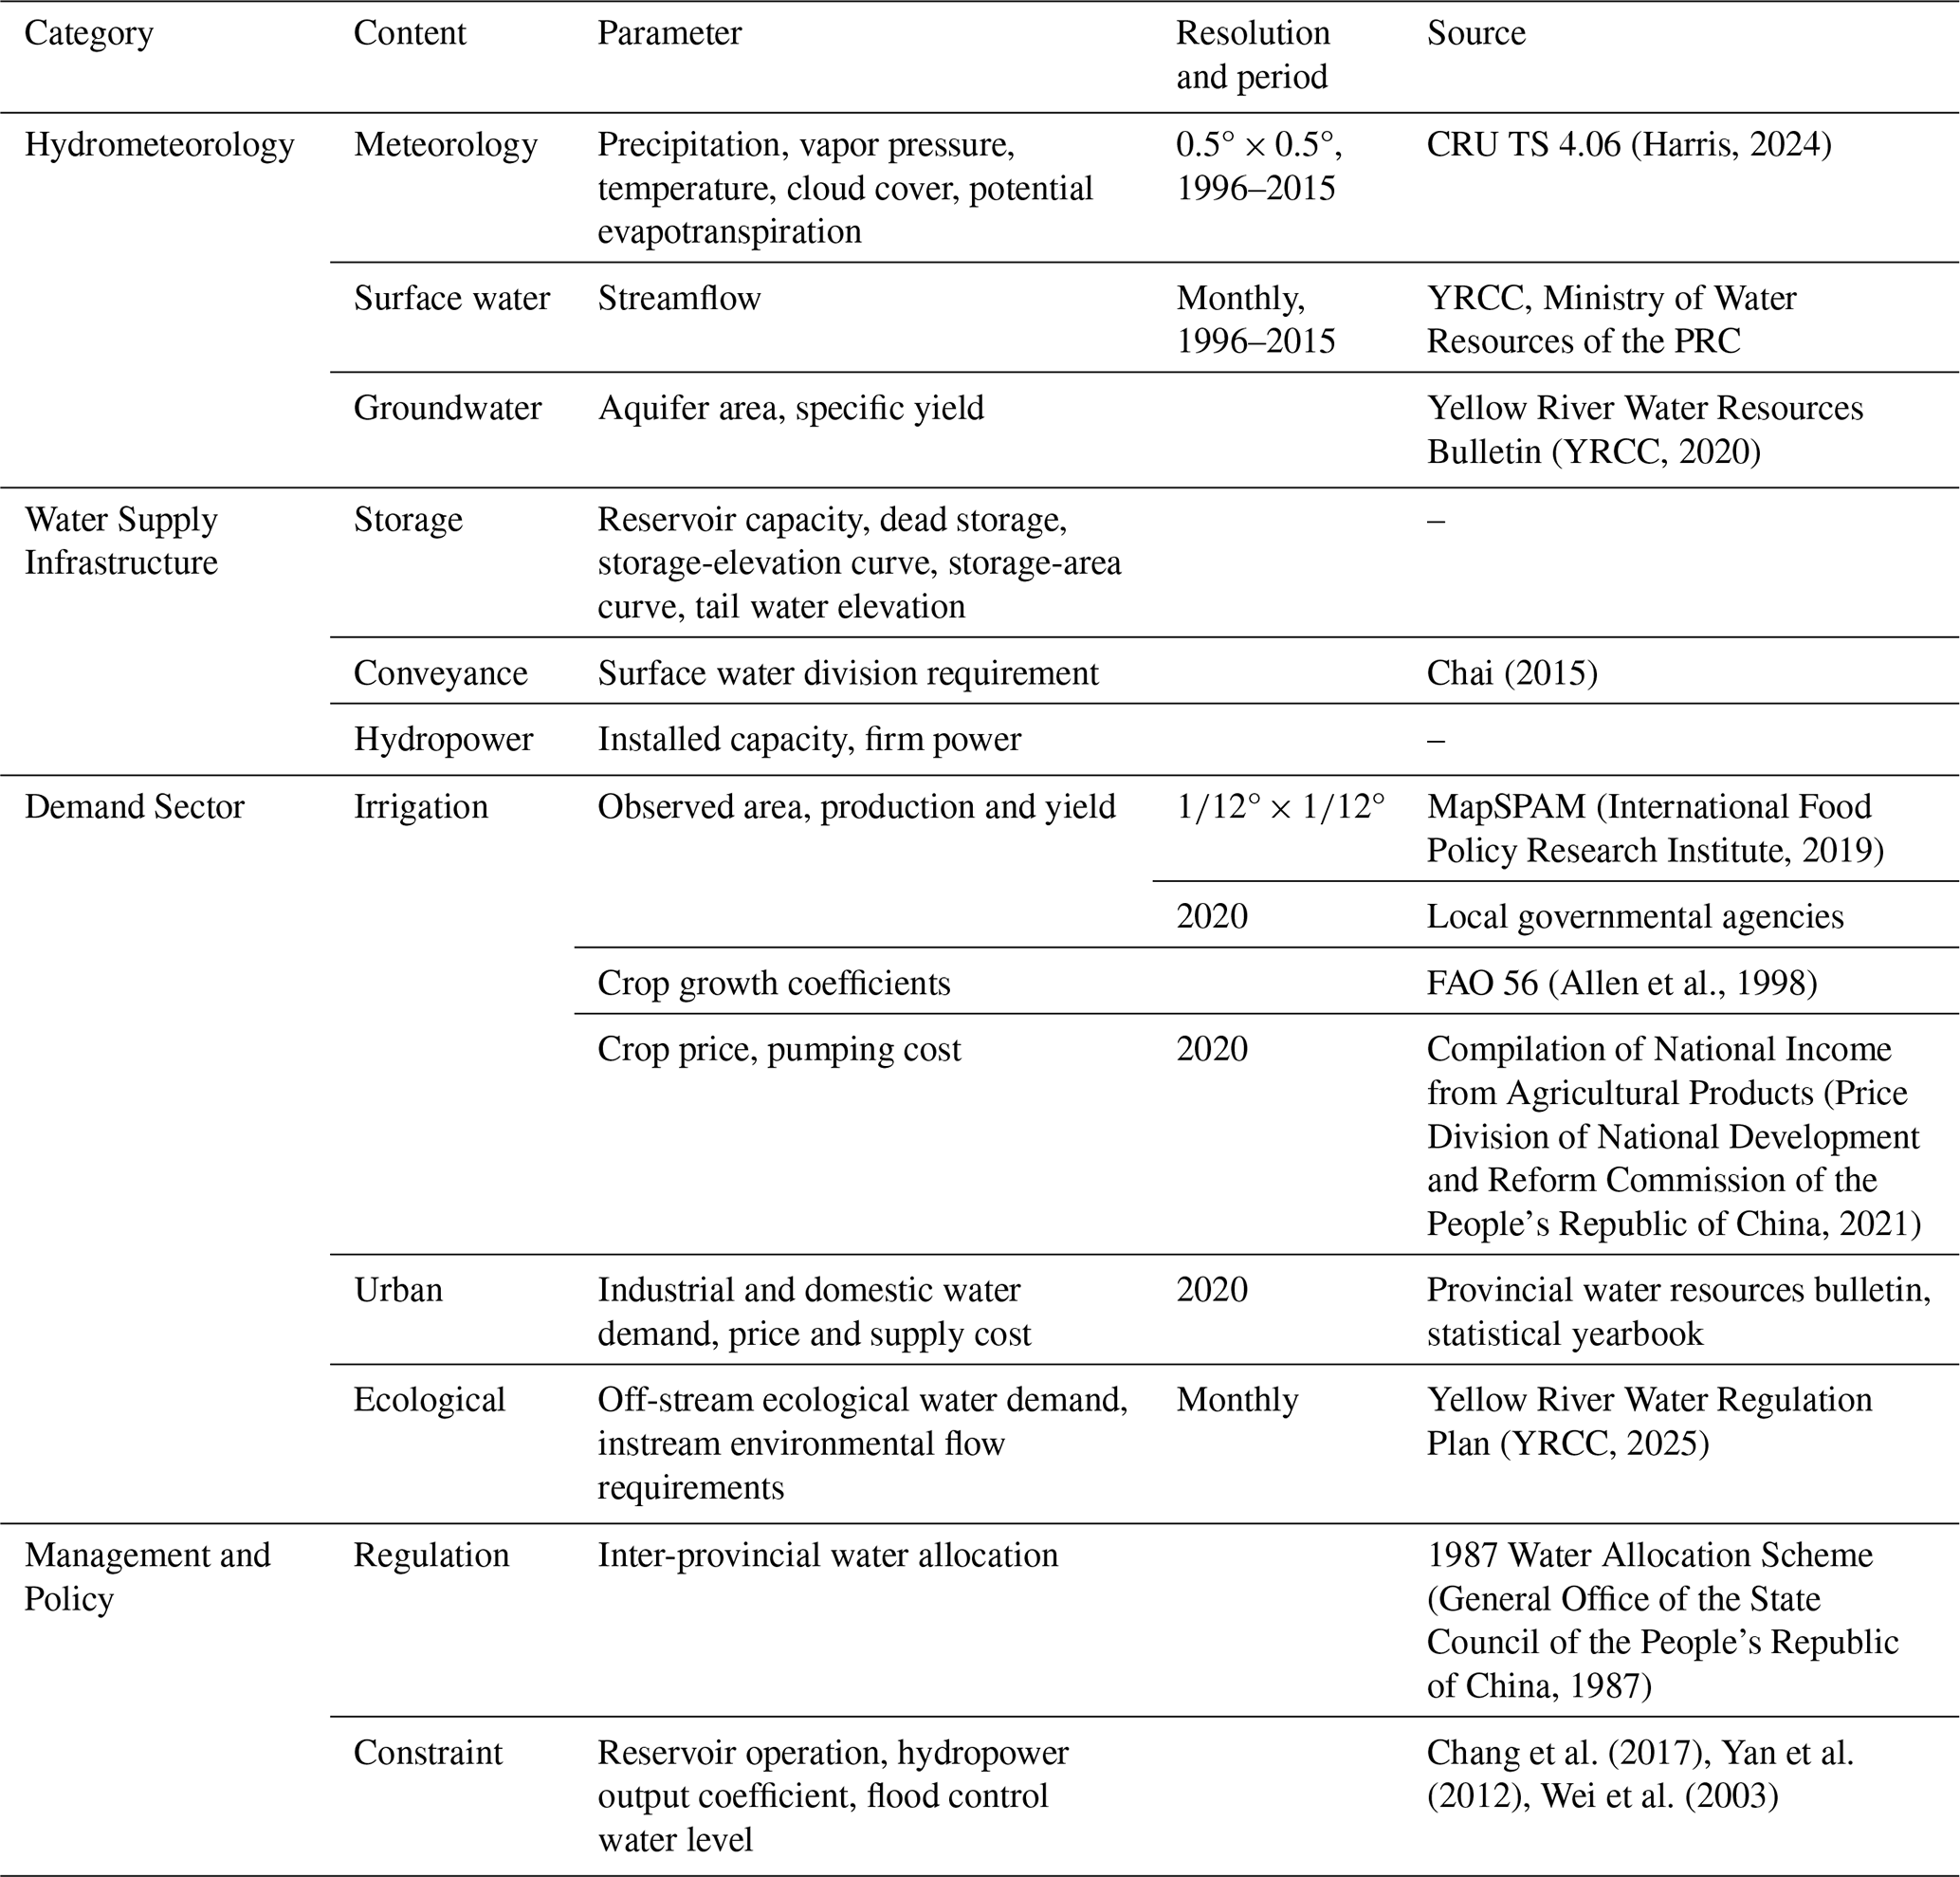
Integrating diverse data types and scales to develop a unified model remains challenging. Water source data are evaluated based on hydrologic records reflecting natural conditions before human interventions, while water use data are gathered from governmental or institutional statistics. Both supply and demand-side data are subsequently aggregated to the source and demand “nodes” (Fig. 2) defined in this study. Specifically, gridded meteorological data are processed using geographic information systems (GIS) with the basin's spatial configuration, and values for each spatial unit are extracted, aggregated and averaged at the node scale. For irrigation, primary data sourced from the MapSPAM database (International Food Policy Research Institute, 2019) are also processed using ArcGIS and cross-validated against observations from local agencies to ensure accuracy and reliability.
Parameters are either estimated from empirically-observed data or derived from existing publications, and are further refined through contextual adjustments. Parameter estimation for crop growth involves geographic distribution, growth period, and hydrothermal conditions, complemented by data from field observations and experiments. For reservoirs, key parameters of storage-elevation and storage-area curves are derived from real operation and fitted to a quadratic function assumption. Economic items such as price elasticity coefficients for industrial and domestic water use, are primarily obtained from literature at provincial or local levels.
Parameters with inherent uncertainties are initially estimated through preliminary assessments and refined during model calibration. Sensitivity analyses of such parameters have been conducted in HEMs applied to some major regions located in the YRB (Cao et al., 2023). The current study adopts the prior results. Moreover, the crop prices used in this study fall within the range of prices observed historically. Because these prices place the values of agricultural use well below the economic values of water for industrial and domestic sectors, it is unlikely to see that realistic changes in agricultural prices dramatically alter operation of this model within constraints of water availability as well as capacity and policy constraints. In addition, we have strived to select reasonable and empirically-observed parameter values of other important economic parameters including electricity tariff (General Office of the State Council of the People's Republic of China, 2024) and demand elasticities (Qin et al., 2022; Zhang and Cheng, 2022). Nevertheless, it will be ideal to assess the sensitivity of such important economic parameters. However, this will require extensive sectoral survey data and econometric modelling, which is beyond the scope of the present study and will be addressed in future studies. To enhance model stability, parameter and coefficient values are adjusted to comparable magnitudes, ensuring consistent numerical scales across variables. This reduces the risk of non-convergence caused by excessively large numerical ranges, thereby preventing infeasible solutions in a large-scale nonlinear optimization model (Cai, 2008a).
As an optimization model, the HEM's objective is to maximize basin-wide economic benefits of water use to support economically efficient water allocation. The model assumes an idealized framework in which the YRCC achieves seamless information sharing across water sources and water-use sectors, and has complete control over basin-wide allocation decisions. To a certain extent, this setting aligns with real-world governance in the YRB, where the YRCC serves as a centralized authority with cross-provincial and cross-sectoral mandates for planning, water allocation, regulation, and emergency response, a top-down structure differing from decentralized and collaborative institutional frameworks (Giakoumis and Voulvoulis, 2018; Lawless et al., 2024; Rivera-Torres and Gerlak, 2021; Yang et al., 2013).
The HEM runs as a multi-year model with a monthly time step, using continuous monthly hydrologic data during the period of 1996–2015, while fixing socioeconomic and infrastructure conditions at the 2020 level. The monthly time step is adopted to capture seasonal hydrologic variability with computational feasibility, and matches the frequency of management reporting from provincial governments to the basin authority, the YRCC. The selected unimpaired 1996–2015 monthly hydrologic series represents the most recent continuous and reliable hydrologic record, captures hydrological stochasticity, and enables the HEM's realistic representation of inter-year reservoir regulation. This model formulation follows established modelling approaches for large-scale water resources planning (e.g., CALVIN; Draper et al., 2003; Harou et al., 2009), as well as YRCC's planning and practice (YRCC, 2015).
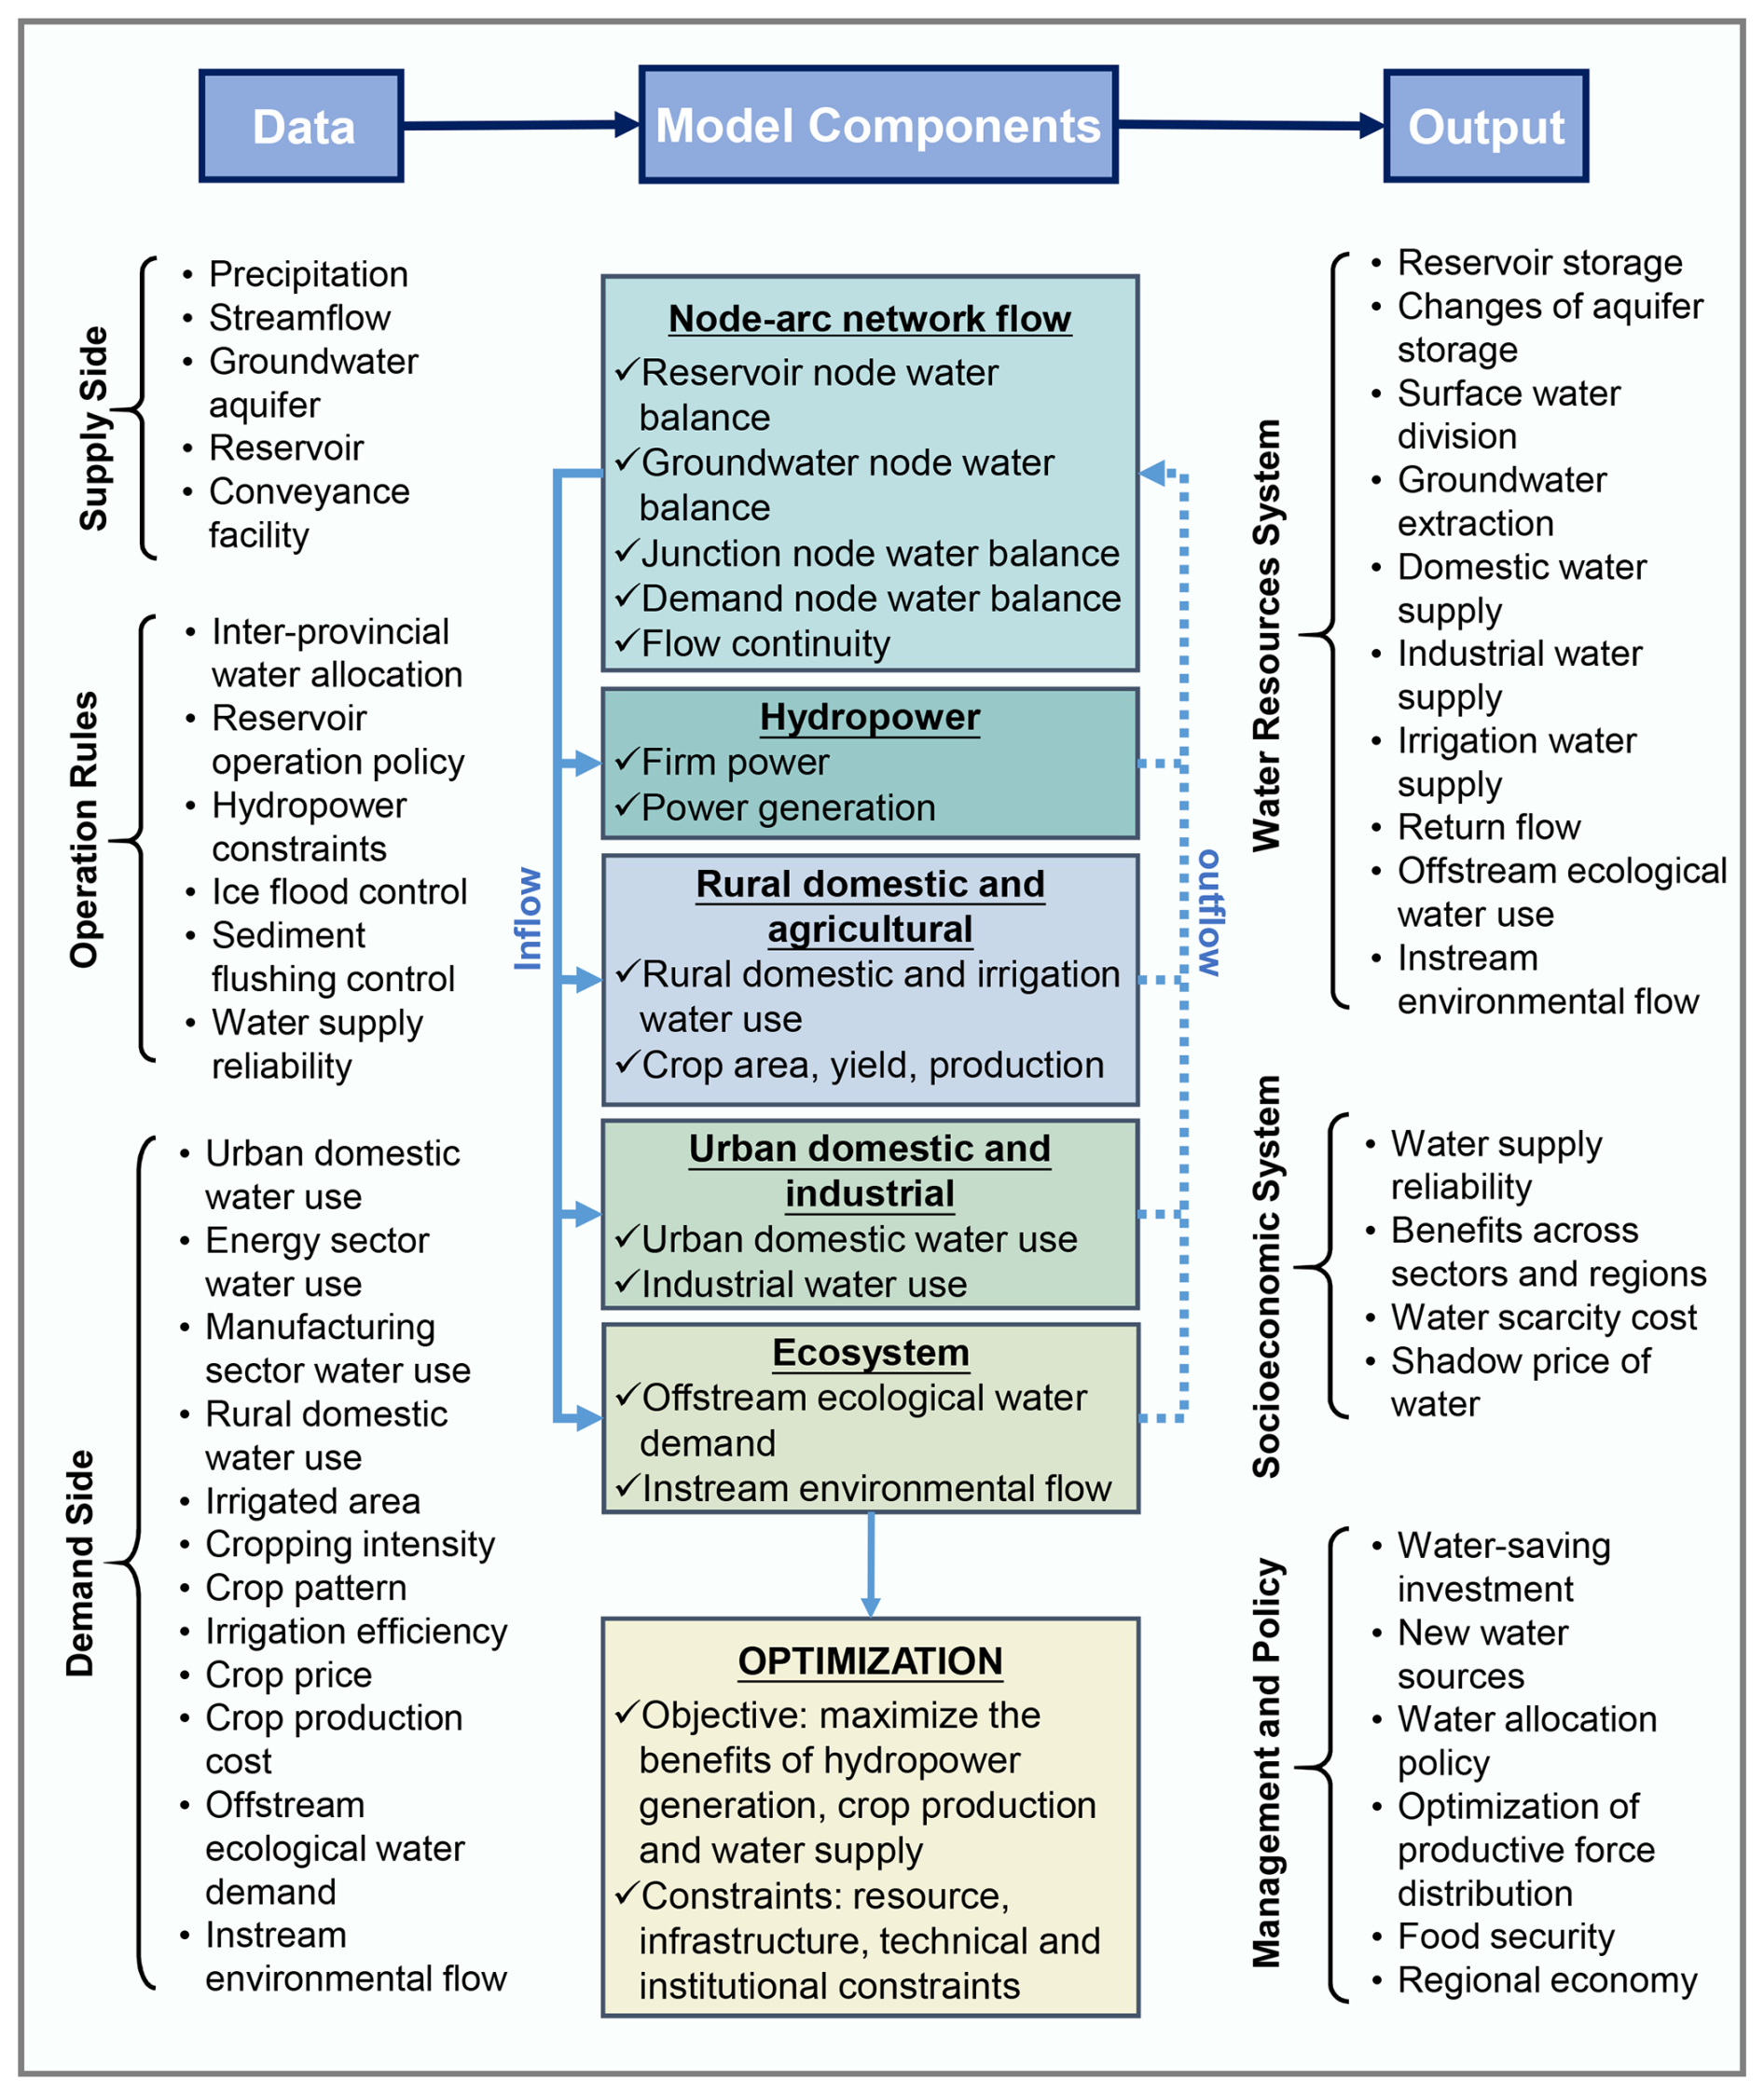
Figure 3 shows an overview of the model framework. Input data are categorized into data on the supply side and the demand side, and data specifying various operational, management and institutional rules. Structured in this way, the model includes benefit and cost computation of each modelled water-use sector to quantify the economic value of water, while imposing constraints on the node-arc network to represent mass balance, infrastructure capacity limits, and policy requirements. Outputs include water allocation, economic performance, and management and policy results. The model is written in the General Algebraic Modelling System (GAMS) language and solved with CONOPT (GAMS, 2026). Detailed descriptions and units of variables and parameters are in the Supplement (Table S1).
3.1 Objective Function
The objective of the model is to maximize the total net benefit of water-use sectors in the basin, including hydropower generation, irrigated agricultural production, and urban domestic and industrial water uses. The objective function is formulated as:
where the objective variable (Z) represents basin-wide net economic benefit over the entire multi-year period (1996–2015). The right-hand side of Eq. (1) denotes gross revenue of hydropower HPr,t from reservoir r, irrigation AGi,y in irrigated area i, and industrial and municipal activities URc,y in city c, subtracted by the sum of cost terms including pumping cost Cost from groundwater aquifer g, water resources fees Cost at every water demand node d (including agricultural, industrial, domestic uses), and total agricultural production cost Cost. The Positive Mathematical Programming (PMP) is used in this study to estimate parameter values in agricultural production cost functions, which enables replication of the observed land and water use patterns in the base year while adjusting smoothly to economic changes (Howitt, 1995; Zhu et al., 2015). Time value of year index can be determined using the value of the index for month sequence (Table S1).
Energy production and benefit: The revenue from hydropower generation is calculated by flow rate through the turbine, net hydraulic head that drives the turbine, generation efficiency and average monthly electricity price:
where Kr is the product of generation efficiency of the hydropower plant, density of water, and gravitational acceleration, QT is solved monthly average flow through hydropower turbine, is solved hydraulic head, Tr is tail water elevation, and pHP,r is the price of electricity.
Energy consumption for groundwater extraction depends on the pumping rate, depth of groundwater table, and the efficiency of pumping set. The pumping cost is:
where ρ is water density, G is gravitational acceleration, η is pumping efficiency, is pumping depth at groundwater aquifer g, is groundwater withdrawal, and pGW is electricity energy price for pumping.
Agricultural production, cost and benefit: To reflect growing stage-specific crop sensitivity to water deficit over the growing period, the Jensen's crop water production function (Kipkorir and Raes, 2002; Sun et al., 2012) is applied to estimating crop relative yield. The gross benefit of crop production in an irrigated area is determined by crop yields, harvested areas and prices.
In Eqs. (4) and (5), is solved relative yield for crop cp in irrigation district i, Ymax is maximum crop yield without water stress, is harvested area, pAG,cp is crop price, is actual crop evapotranspiration, is potential crop evapotranspiration, and is the sensitivity factor in growing stage m for crop cp (Table S3). The growing stage m represents the order of months within the growing period in year y.
A quadratic production cost function is estimated using the PMP approach for each crop in each irrigation district:
where and are the intercept and slope in the PMP production cost function for crop cp in irrigation district i. In model calibration, the slope of the marginal crop is estimated by observed harvested area, land supply elasticity and gross margin. For other crops, cost functions are calculated based on the dual value of economic calibration using the PMP calibration constraint (Zhu et al., 2015).
Urban water-using benefit: Economic gains from water use in urban industrial and domestic activities are determined based on urban water prices and costs (Cai et al., 2006; Gohar et al., 2019):
where is consumer surplus for city c and industrial or domestic water use activity k, is urban water tariff, is the cost from suppliers providing water to users, and is industrial or urban domestic water use in year y. It is important that URc,y only represents the economic benefits that water, as a factor of production, contributes to industrial and/or domestic activities.
A demand function of water price with respect to water demand is specified as the following linear form:
where and are the intercept and slope of the demand function, respectively, estimated based on observed prices and price elasticity of demand adopted from the literature.
Consumer surplus is derived from the integral of demand function as:
Water resources fees: Charges for water delivered to demand node d from both surface water and groundwater are calculated as:
where and are surface water and groundwater resources fees, respectively; is surface water used from upstream inflow node nu to demand node d, and is groundwater used from aquifer g to demand node d.
3.2 Water Balance and Capacity Constraints
3.2.1 Flow balance
Mass balance requires that storage change at a node equals the total incoming flow minus the total outgoing flow during the period:
where is storage of node n in period t, is inflow from upstream node nu to node n, and is outflow from node n to downstream node nd. Equation (11) applies to node n types including surface reservoir, groundwater aquifer, river reach, artificial conveyance facility such as canals and pipelines, and junction node. River reaches, conveyance facilities, and junction nodes have negligible storage capacity, so the left-hand side of the equation becomes zero, forcing total incoming flow to equal total outgoing flow in any time period. Incoming flows to node n include flows from upstream river reaches, local streams, reservoirs, groundwater aquifers, and return flows from irrigated area or urban nodes. Outgoing flow node types include reservoir, river reach, groundwater aquifer, reservoir evaporation as a sink, river basin outlet as a sink, and demand site. Specifically, for a reservoir node r with hydropower plant, total release to the downstream equals:
where QT is flow through turbine, QS is reservoir spill.
3.2.2 Water delivery
Total water delivery to demand node d in time period t equals the sum of surface water and groundwater deliveries:
where is total water delivery, is surface water from upstream node nu to node d, is groundwater from aquifer g to node d.
Irrigation only occurs when crop evapotranspiration requirement exceeds effective precipitation. Water delivered to an irrigated area equals total delivery multiplied by irrigation efficiency:
where ei is irrigation efficiency in irrigation district i, and is net irrigation water requirement determined by the difference between monthly effective precipitation and crop-specific monthly evapotranspiration when the latter is larger.
3.2.3 Capacity constraints
A set of constraints is applied to set the upper and lower bounds of decision variables, including reservoir storage capacity and dead storage, installed hydropower generation capacity and firm power, conveyance capacity, river flow regime for aquatic ecosystem protection or minimum instream flow requirement, range of planted areas of certain crops and guaranteed urban water supply.
Particularly, to avoid storage depletion by pursuing high net revenue and meeting high water demand, a constraint for major large reservoirs with inter-year storage capacity is added to reserve water for future use at the end of a water year:
where te is the last month of a water year and is targeted carryover reservoir storage value.
3.3 Baseline Calibration
Due to incomplete representation of numerous implicit and qualitative factors in real-world physical processes and decision-making, the HEM is limited in reliably representing the actual water supply-demand dynamics with sufficient details, before being calibrated for adequate model fidelity. Thus, a baseline approach is adopted for this study, i.e., using a starting point to compare and evaluate results against observations. Obtaining a baseline of observed inputs and outputs is a crucial procedure to improve the model's applicability and reliability for policy analysis (Cai and Wang, 2006; Draper et al., 2003).
Calibration is usually used to develop a baseline for a computer-based model. The complexity of HEM calibration is to calibrate the connected hydrologic and economic components (Cai and Wang, 2006). Given the interdependence among these parameters, calibration simultaneously helps to reflect how hydrologic variability propagates to economic outcomes, and how economic behaviours conversely alter hydrologic regimes.
Hydrologic calibration is to adjust model parameters to ensure that system states closely match observed mass balance conditions (Baccour et al., 2022). This process involves maintaining water balance across the entire basin and at each individual node, balancing water supplies, uses, consumptions, and changes of surface reservoir and groundwater storages. For reservoirs, water storage-release relationships are governed by physical characteristics and operational rules with embedded economic drivers from demand sites (Cai and Wang, 2006). During the ice-flood control periods, strict constraints are imposed on water releases from major reservoirs to critical river reaches (Chang et al., 2014; Hu et al., 2023a, b; Yan et al., 2012). Additionally, the operations of specific reservoirs during the flood season undertake sediment-flushing tasks, which align with basin-wide water regulation objectives (Gao et al., 2023; Zhai, 2004).
Economic calibration uses the PMP method (Howitt, 1995) to calibrate agricultural activities in the base year, replicating observed land and water use patterns while effectively addressing the issue of over-specialization inherent in traditional linear models. By incorporating nonlinearity into the objective function using the marginal values of the calibration constraints (Sect. 3.1), PMP replicates base-year activity levels and resource allocation without introducing artificial constraints, allowing smooth adjustments to economic changes (Mérel and Howitt, 2014). This approach minimizes reliance on detailed information and facilitates realistic representations of economic behaviours with limited data. The quadratic form of the cost function captures diminishing marginal returns on additional inputs, accounts for substitutability of different input factors, focuses on the impacts of water and land on crop yields, and reflects farmers' decision-making behaviours (Howitt, 1995; Medellín-Azuara et al., 2012, 2010). For industrial and domestic water demands, economic parameters such as price elasticities are adjusted, and water withdrawals are calibrated to baseline observations through a value-demand search process (Cai et al., 2006).
A model performance evaluation is conducted to assess the consistency of the calibrated HEM with observed system behaviour. Model outputs for major hydrological gauge stations, end-of-year reservoir storage, and agricultural water use are compared against observations using Percent Bias (PBIAS) and Normalized Root Mean Square Error (NRMSE). The performance check (Table S4) indicates that the modelled values fall within acceptable ranges relative to the observations, supporting the calibrated model for subsequent analysis.
In this paper, the HEM is solved as an optimization model that uses monthly hydrologic and meteorological data from 1996 to 2015, while socioeconomic and water management conditions are fixed at the base-year (2020) level. Hydrological year types are determined by the frequency analysis of the unimpaired annual flow at the basin outlet, with the 5th (2002), 50th (1998), and 95th (2012) percentiles selected from the 1996–2015 period to represent dry, normal, and wet years, respectively.
4.1 Dynamics of Water Supplies and Uses
Figure 4 shows the supply of surface water and groundwater under different hydrologic conditions. Total water withdrawal (TOT) is higher in dry years than in wet years, primarily due to higher irrigation requirements under water scarcity. Surface water is the dominant source in the basin. However, due to hydrologic and climatic variability, natural surface runoff (SWR) fluctuates sharply with annual inflow differences exceeding 20 billion m3 between dry and wet years for the whole basin. The available surface water inflow is insufficient to meet actual surface water withdrawal (SW) during dry years, and the unmet demand is compensated through reservoir releases and water transfer projects. In contrast, groundwater supply (GW) is relatively stable across hydrologic conditions, compensating for reduced surface water supplies in dry years. This highlights the important role of groundwater as a buffer resource to enhance the resilience of the basin's overall water supply system under unfavourable hydrologic conditions.
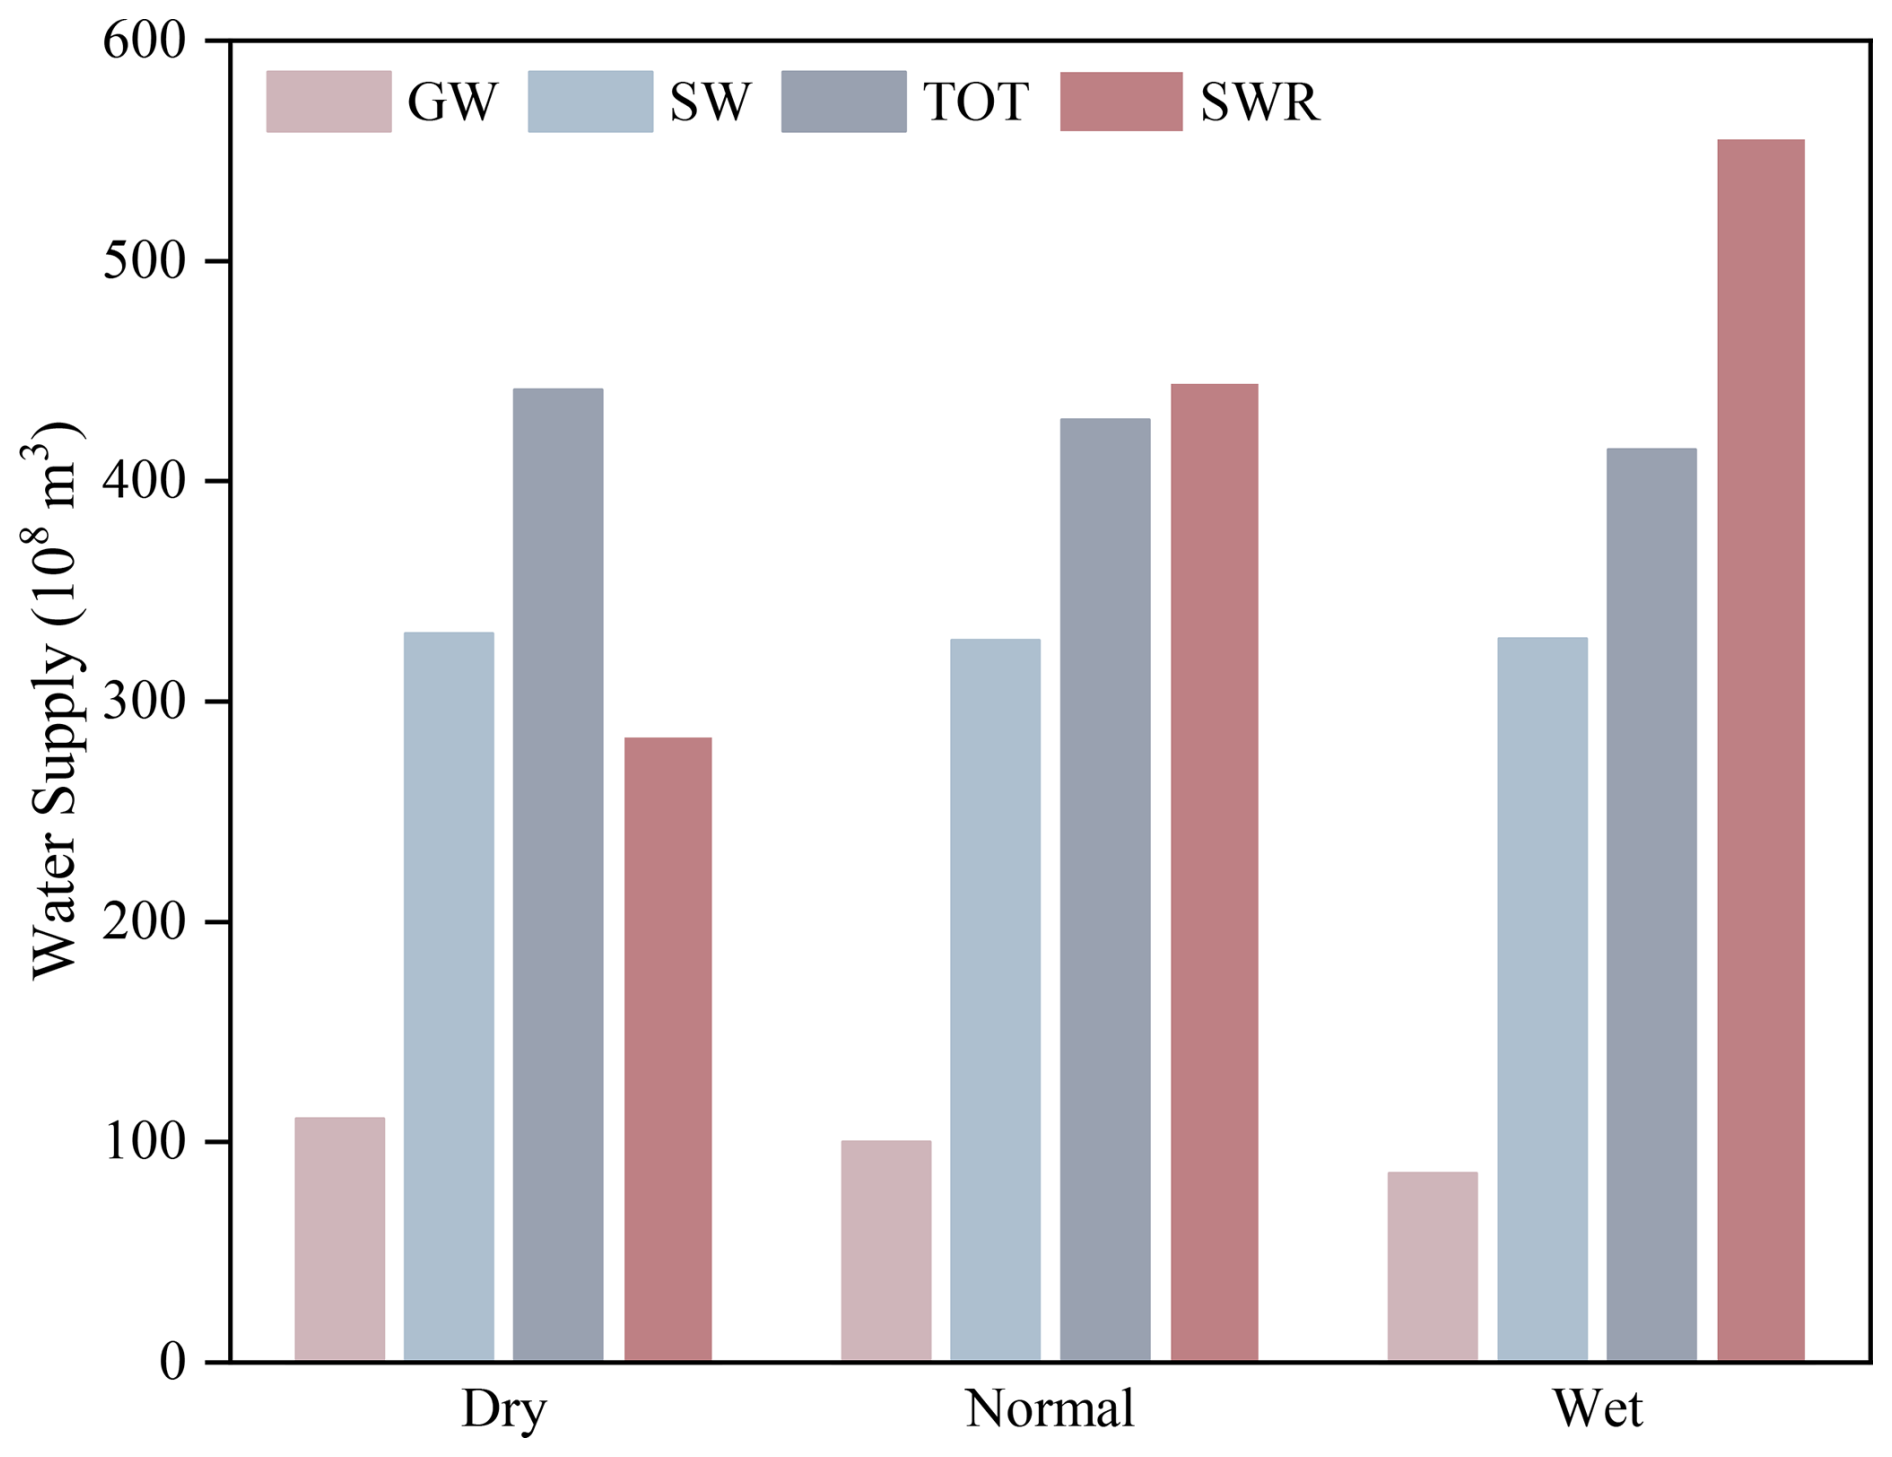
Figure 4Water supply by hydrological year type in the entire YRB (108 m3). GW = groundwater withdrawal; SW = surface water withdrawal; TOT = GW + SW; SWR = natural surface runoff.
Figure 5 shows annual water withdrawals, aggregated by various water uses for each sub-basin and for the entire basin. Irrigation uses the largest amount of water among all sectors, accounting for more than 70 % of total water withdrawals in the basin. The high demand is from the extension of irrigated area, the diversity of crops, and the inconsistency between the peak of water requirements for crop growth and rainfall seasonality. Agricultural water withdrawal decreases from upstream to downstream, in contrast to the increase in irrigated areas, suggesting more irrigation water use per unit planting area in the upstream regions. Because upstream regions have a more arid climate, only a relatively small portion of crop water requirements are met by effective precipitation, therefore increasing reliance on irrigation. Meanwhile, downstream irrigation districts, with more advanced irrigation technologies, have higher water use efficiency in reducing agricultural water withdrawals.
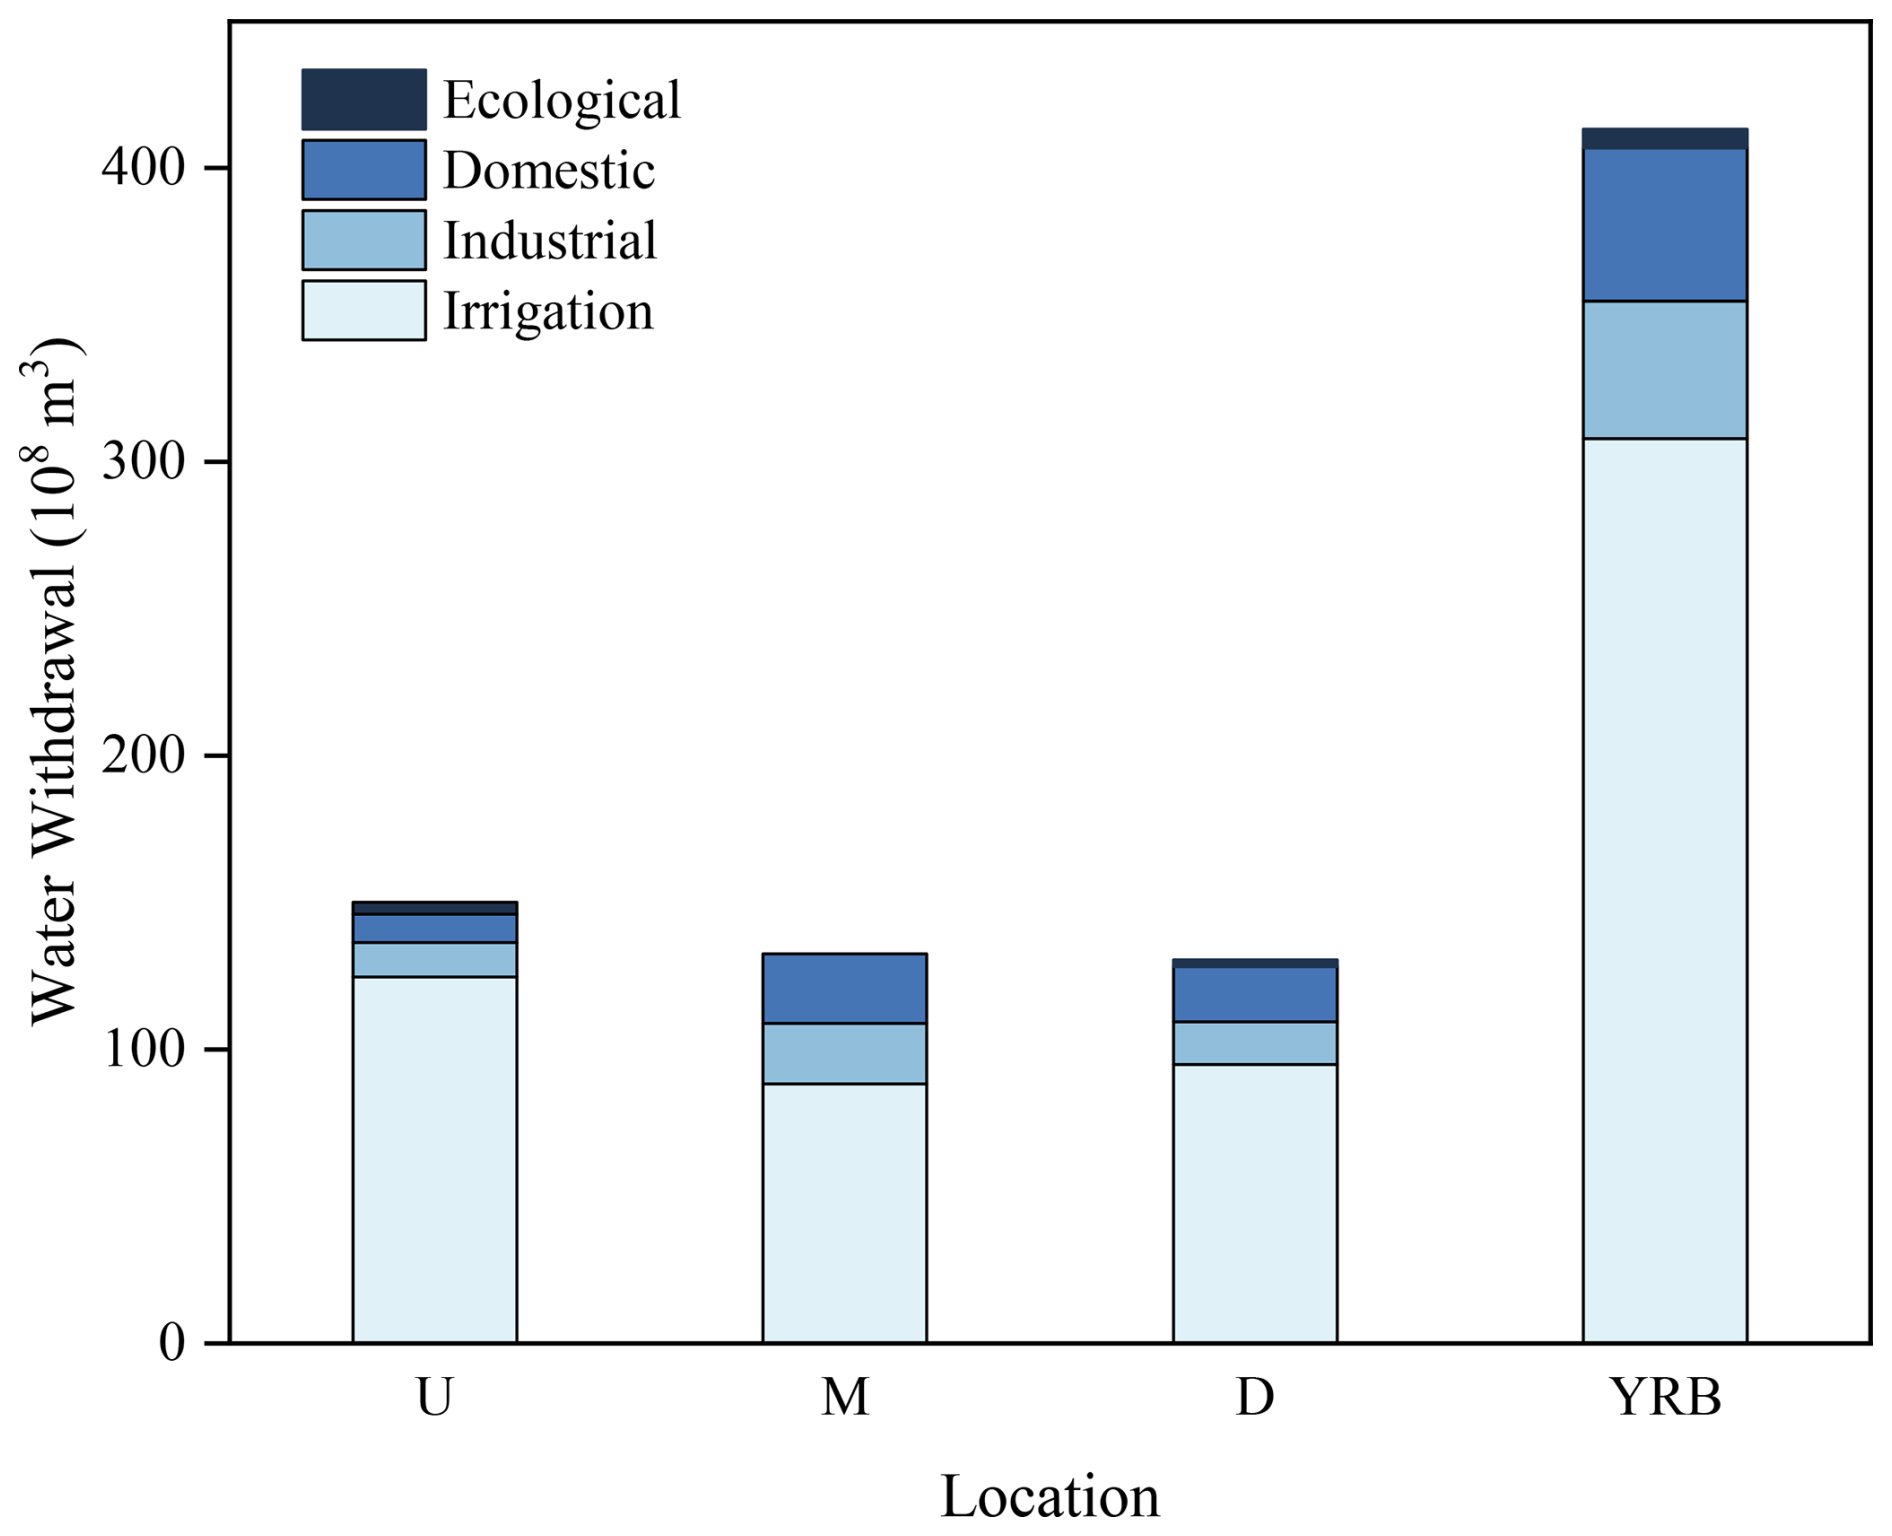
Figure 5Water withdrawal by water demand sectors and locations (108 m3). U = upstream region; M = middle-stream region; D = downstream region; YRB = the Yellow River Basin.
Industrial and domestic water demands are highest in the middle reaches of the YRB. Shanxi and Shaanxi provinces in the midstream region, have water-intensive heavy industries such as energy production, steel manufacturing, and metallurgy (Wang, 2023), resulting in substantial industrial water use. Additionally, 14 prefecture-level cities considered in these two provinces have large resident populations, leading to high domestic water demand. Henan and Shandong in lower reaches receive water from the Hai River and the Huai River in addition to the Yellow River. Consequently, their dependence on water withdrawals from the Yellow River is less than that of upstream provinces.
As this study only considers five major off-stream ecological replenishment areas, ecological water withdrawal represents the smallest component of total water demand (1.6 %). The primary objective of ecological water replenishment is to maintain the health of wetland environments rather than to achieve maximum economic benefit, therefore environmental water use is enforced artificially through laws or regulations (Zhu and Sun, 2025).
4.2 Demand Sector Behaviours
4.2.1 Irrigation and crop cultivation
For different hydrologic scenarios, the harvested area expands with improved water availability (Fig. 6), underscoring a positive correlation between water availability and land use. In wet years, grain crops have the largest expansion (330 000 ha), while oil crops, vegetables, and cash crops have comparatively smaller increases, reflecting constraints on total arable land and agricultural infrastructure associated with crop patterns. However, the optimal cropping pattern of area shares across the entire basin shows relatively small variations (Fig. S3). Grain crops consistently occupy the largest share of the total planting area, maintaining a highly stable proportion regardless of hydrologic conditions, which reflects their cultivation prioritization in ensuring the security and resilience of food supply system. The shares of other crops increase in water-scarce conditions, suggesting farmers' willingness to cultivate drought-resistant or high-value crops with limited water. However, their overall share of non-grain crops remains small, exerting negligible impacts on the basin-wide cropping structure.
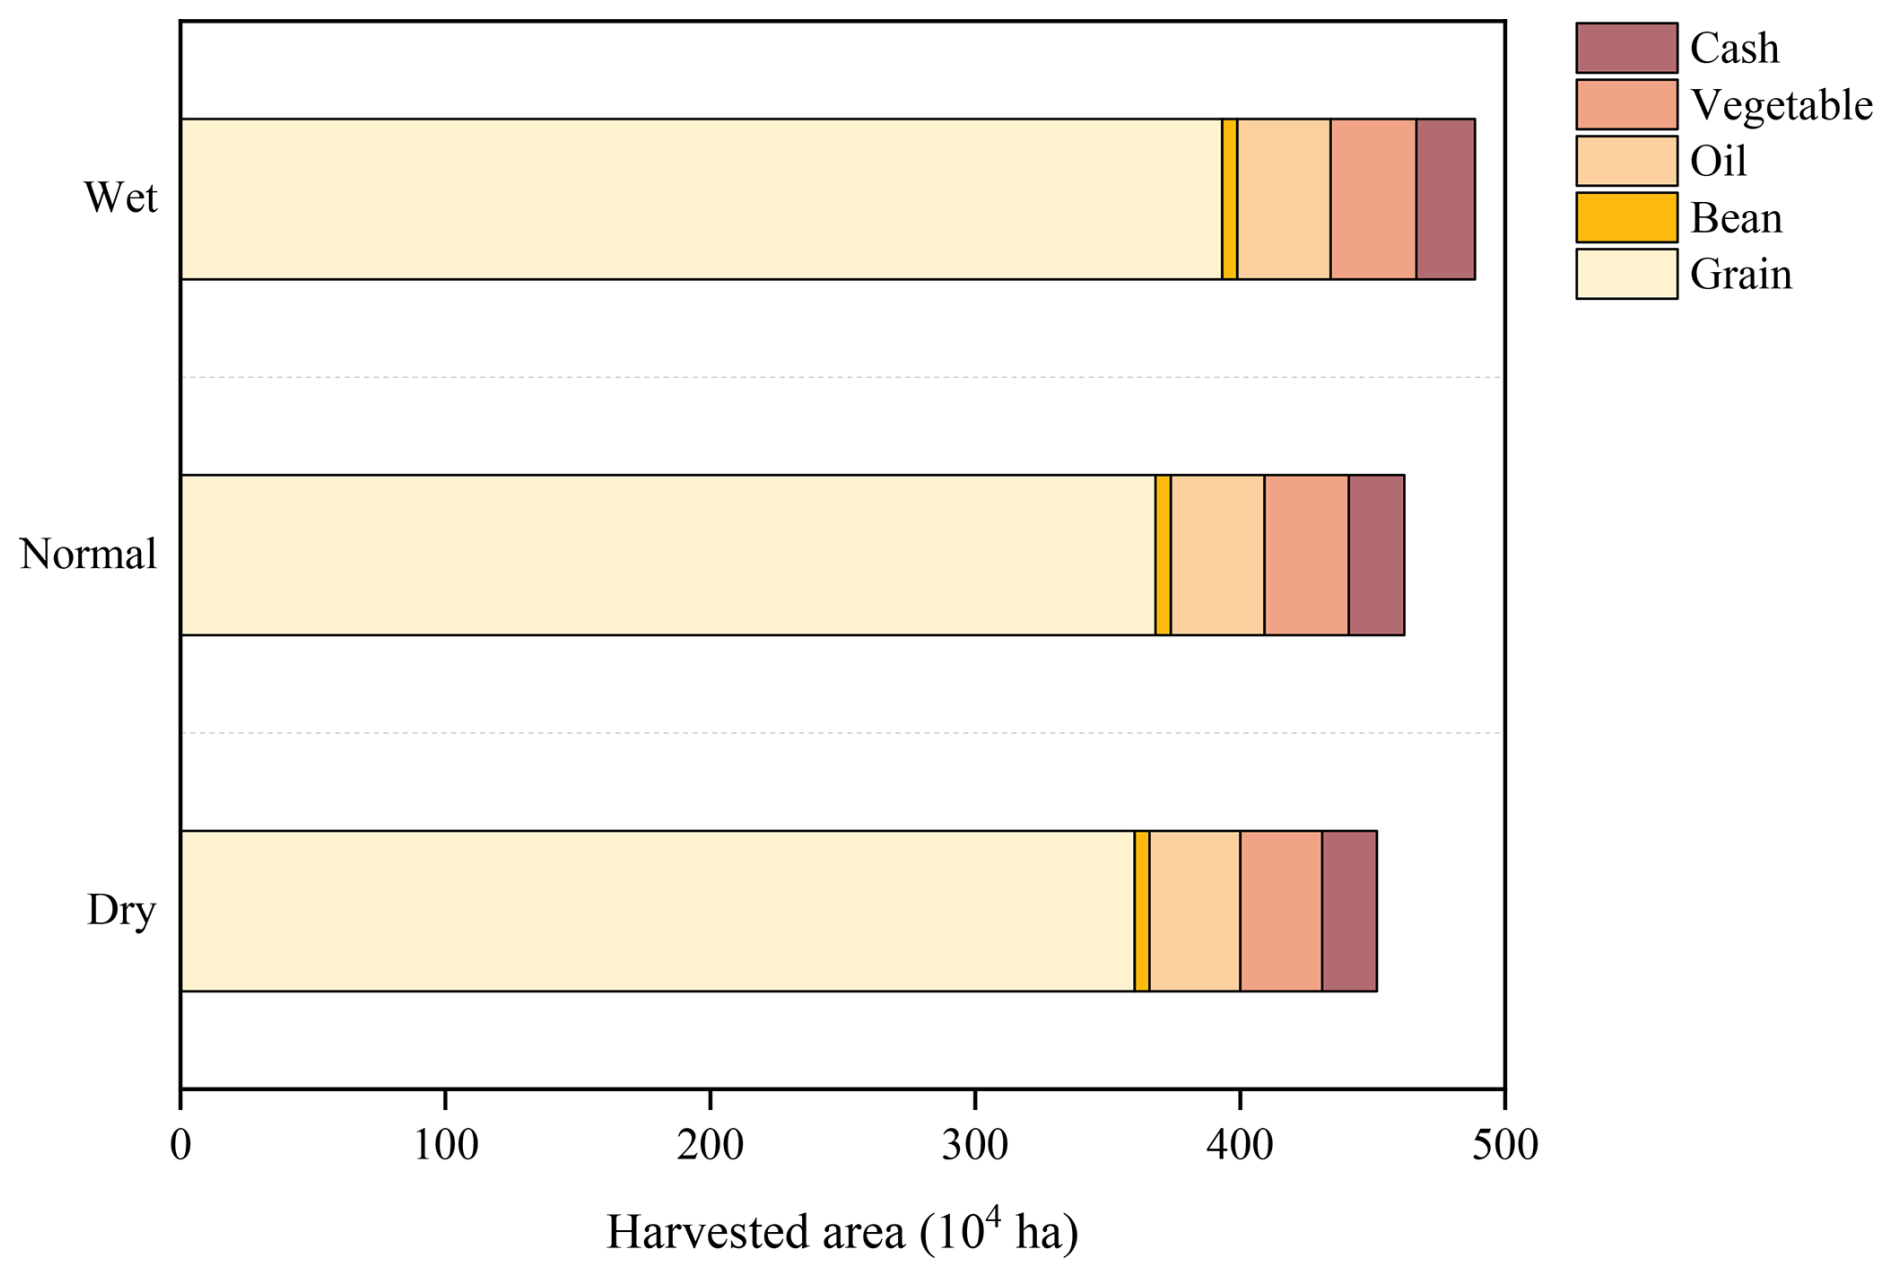
Table 3 shows the water productivity (WP, defined as crop production per unit of water) of major crops by different locations and hydrological year types in the YRB. The WP values differ significantly across crops. Vegetables have substantially higher WP than other crops, primarily from their efficient water use for biomass accumulation and higher crop prices. In contrast, cotton and rice have lower WP, reflecting their higher water requirements. Particularly, under drought conditions, the WP of rice is only 1.5 % that of vegetables.
Table 3Crop water productivity by location and hydrological year type (kg m−3).
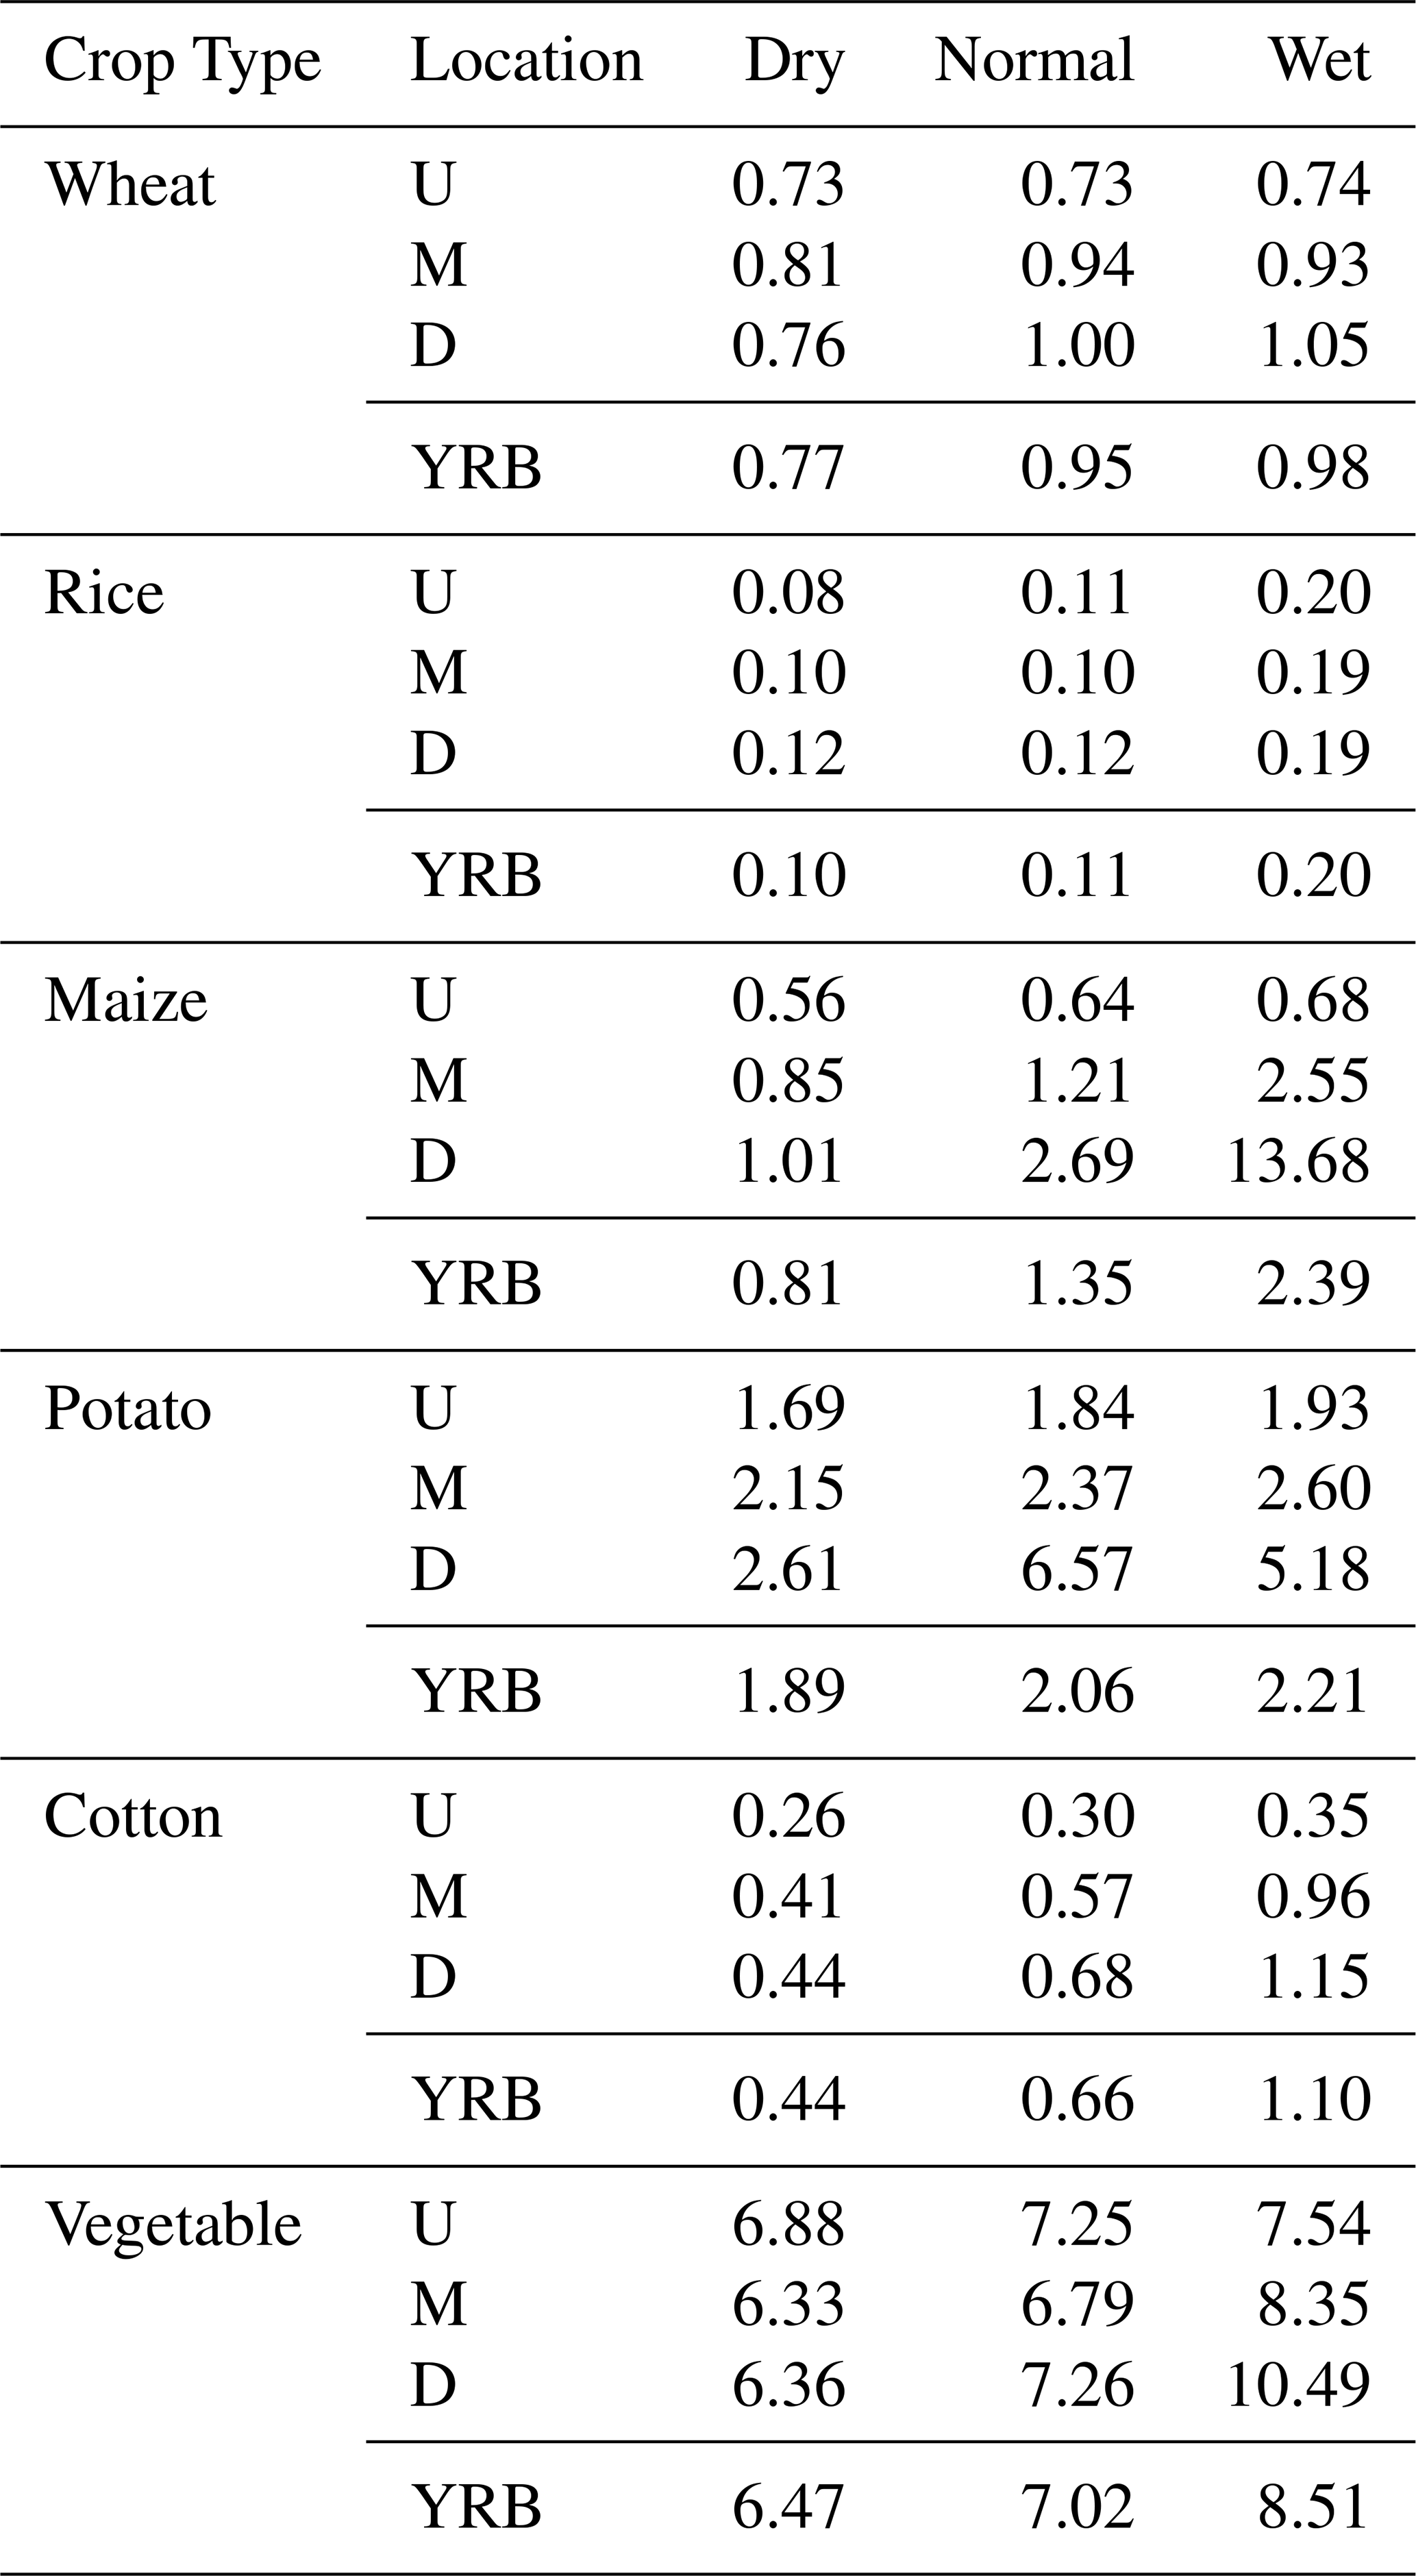
WP increases with improved water availability for most crops, indicating that sufficient water supply enhances crop growth and thereby increases crop yields. Notably, rice as a water-intensive crop, exhibits minimal WP variation between dry and normal years, whereas its WP doubles in wet years. This response is associated with rice's high sensitivity of stomatal conductance to water stress, as its photosynthetic rate increases by more than 40 % when soil moisture exceeds 70 % of field capacity (Bouman et al., 2007).
WP of each crop varies spatially under different hydrologic conditions. For instance, cotton's WP in downstream regions increases by 158 % in wet years compared to dry years, whereas the corresponding increase in upstream regions is only 32 %. This difference stems from the synergistic effects of the North China Plain's favourable soil and hydrothermal conditions, along with the implementation of water-saving irrigation systems in that region. Additionally, this spatial sensitivity is driven by the dual dependence of downstream irrigation on both local precipitation and water availability from upstream regions, making downstream WP more sensitive to hydrologic variability.
4.2.2 Water use structure
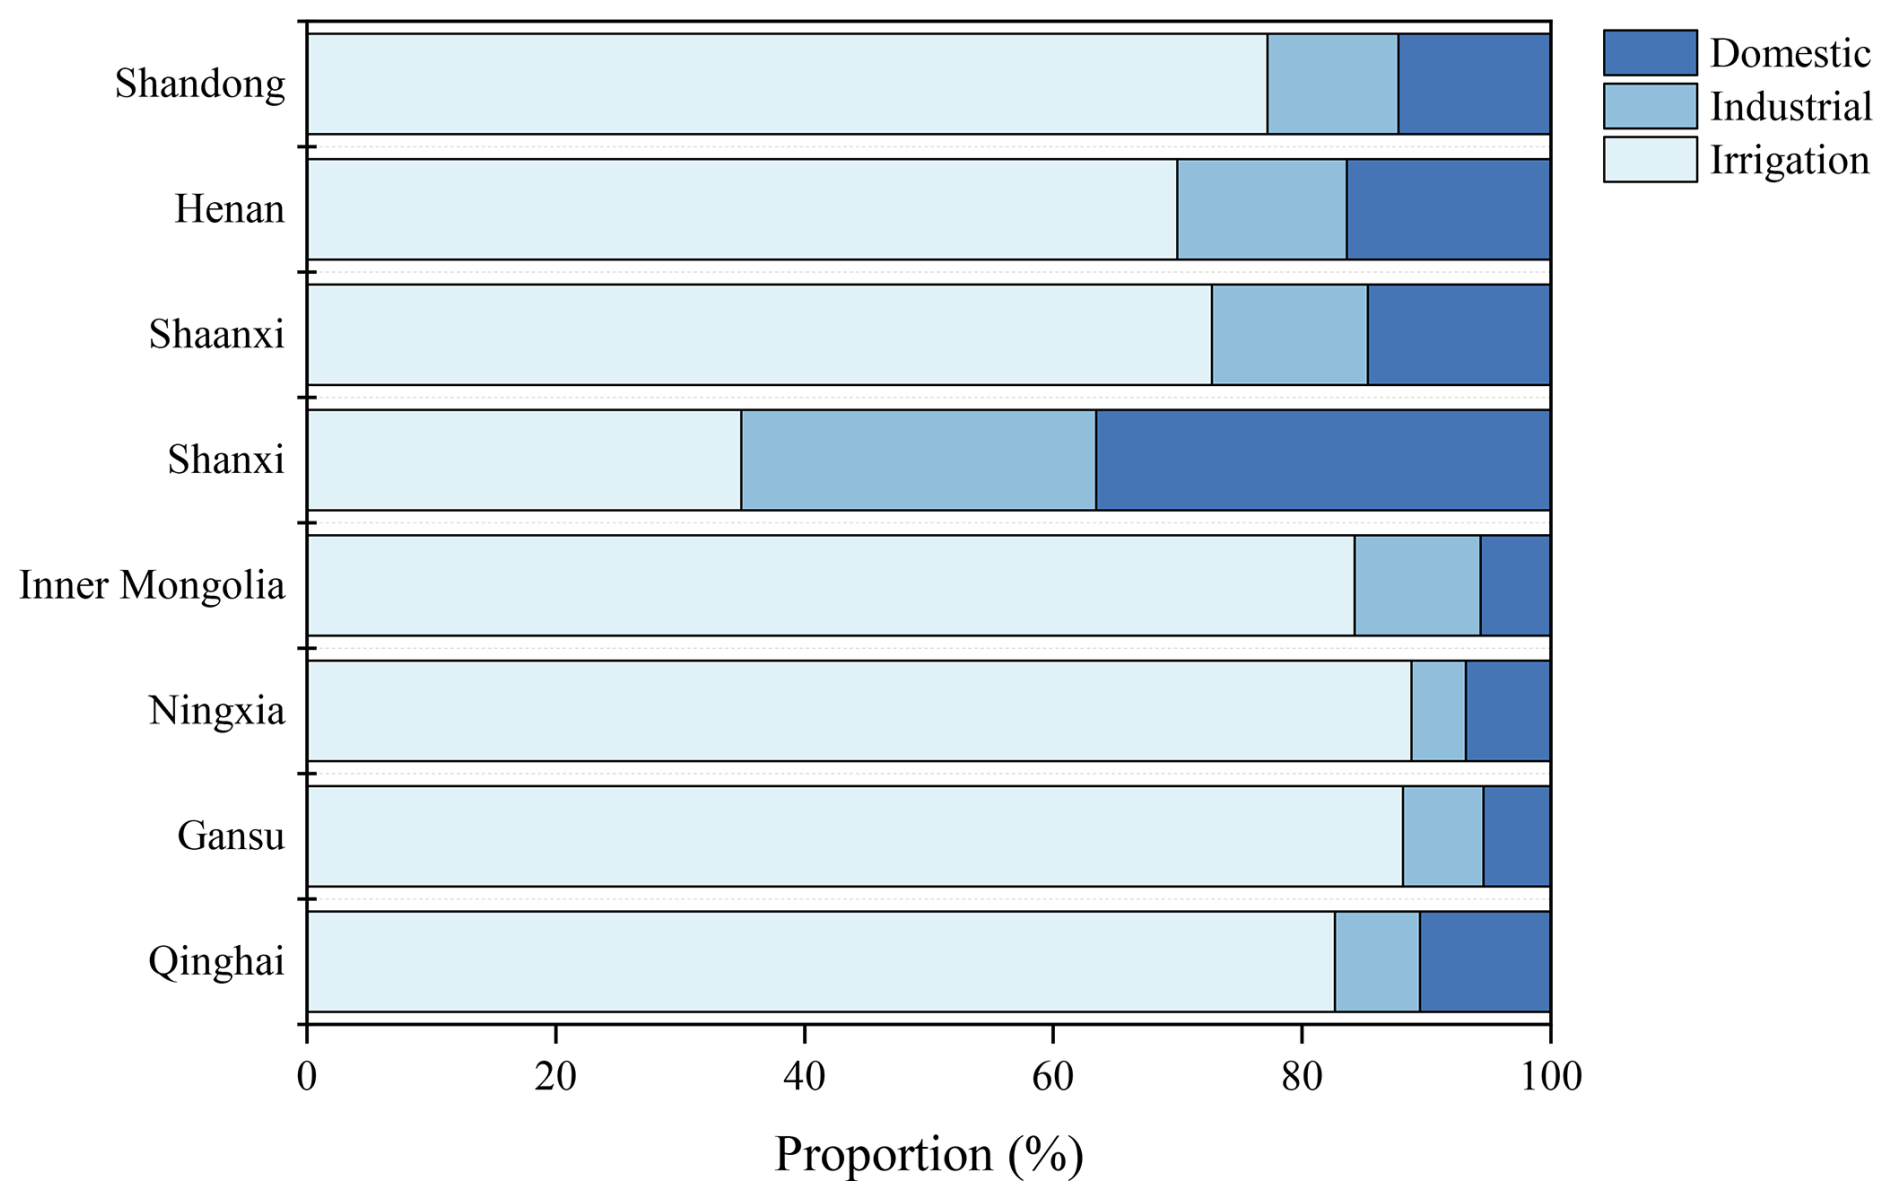
Figure 7 shows provincial variations in sectoral water use structure within the basin. Provinces in the middle and lower reaches display higher proportions of industrial and domestic water uses than those in the upper reaches. Particularly, Shanxi has a distinct water use pattern, with a relatively low irrigation share (35 %) and significantly higher industrial (28 %) and domestic (37 %) uses compared with other provinces. This structure is largely driven by the dominance of water-intensive industries such as coal mining and metallurgy (Wang, 2023), which account for a substantial portion of industrial water demand in Shanxi. Shandong and Henan, with advanced industrial systems, prioritize urban and industrial water allocation through stringent policies that constrain agricultural water quotas (Lyu et al., 2022; Yin and Yi, 2016; Yu, 2023). Concurrently, higher urbanization rate and population density in the middle and lower reaches result in higher domestic water demand, contrasting sharply with the sparsely populated upstream areas (Fig. S4). In upstream regions (Qinghai, Gansu, Ningxia, and Inner Mongolia), agricultural sector plays a more important role in provincial economic development, and irrigation requirement is high due to semi-arid and arid climate there.
Compared to irrigation, urban water use varies less in response to climatic and hydrologic fluctuations. Under water scarcity, water is allocated based on the respective economic values of competing water uses, provided all constraints regarding water allocation in the model are met. As a result, agricultural sector faces greater pressure to adapt when water availability declines. Thus, as hydroclimatic changes intensify, diminishing water supplies will exacerbate competition for water among sectors and regions.
4.2.3 Reservoir operation
Figure 8 compares the Longyangxia Reservoir (LYX) annual storage change with its inflow from 1996 to 2015. A proportional relationship between reservoir inflow and storage shows that the reservoir releases water in dry years with low inflow and stores water in wet years with high inflow. As the only reservoir on the Yellow River with multi-year regulation capability, LYX is critical for inter- and intra-annual regulation, thereby improving water security, protecting ecological health within and outside the river channel, and meeting water demands for basin-wide economic and social development. Given the substantial inter-annual variability in streamflow and the frequent occurrence of consecutive dry years (e.g., 2000–2002), additional multi-year regulation reservoirs would benefit the YRB. However, constructing such reservoirs in the middle and lower reaches of the Yellow River is highly challenging due to the lack of suitable dam sites and the high sediment concentration.
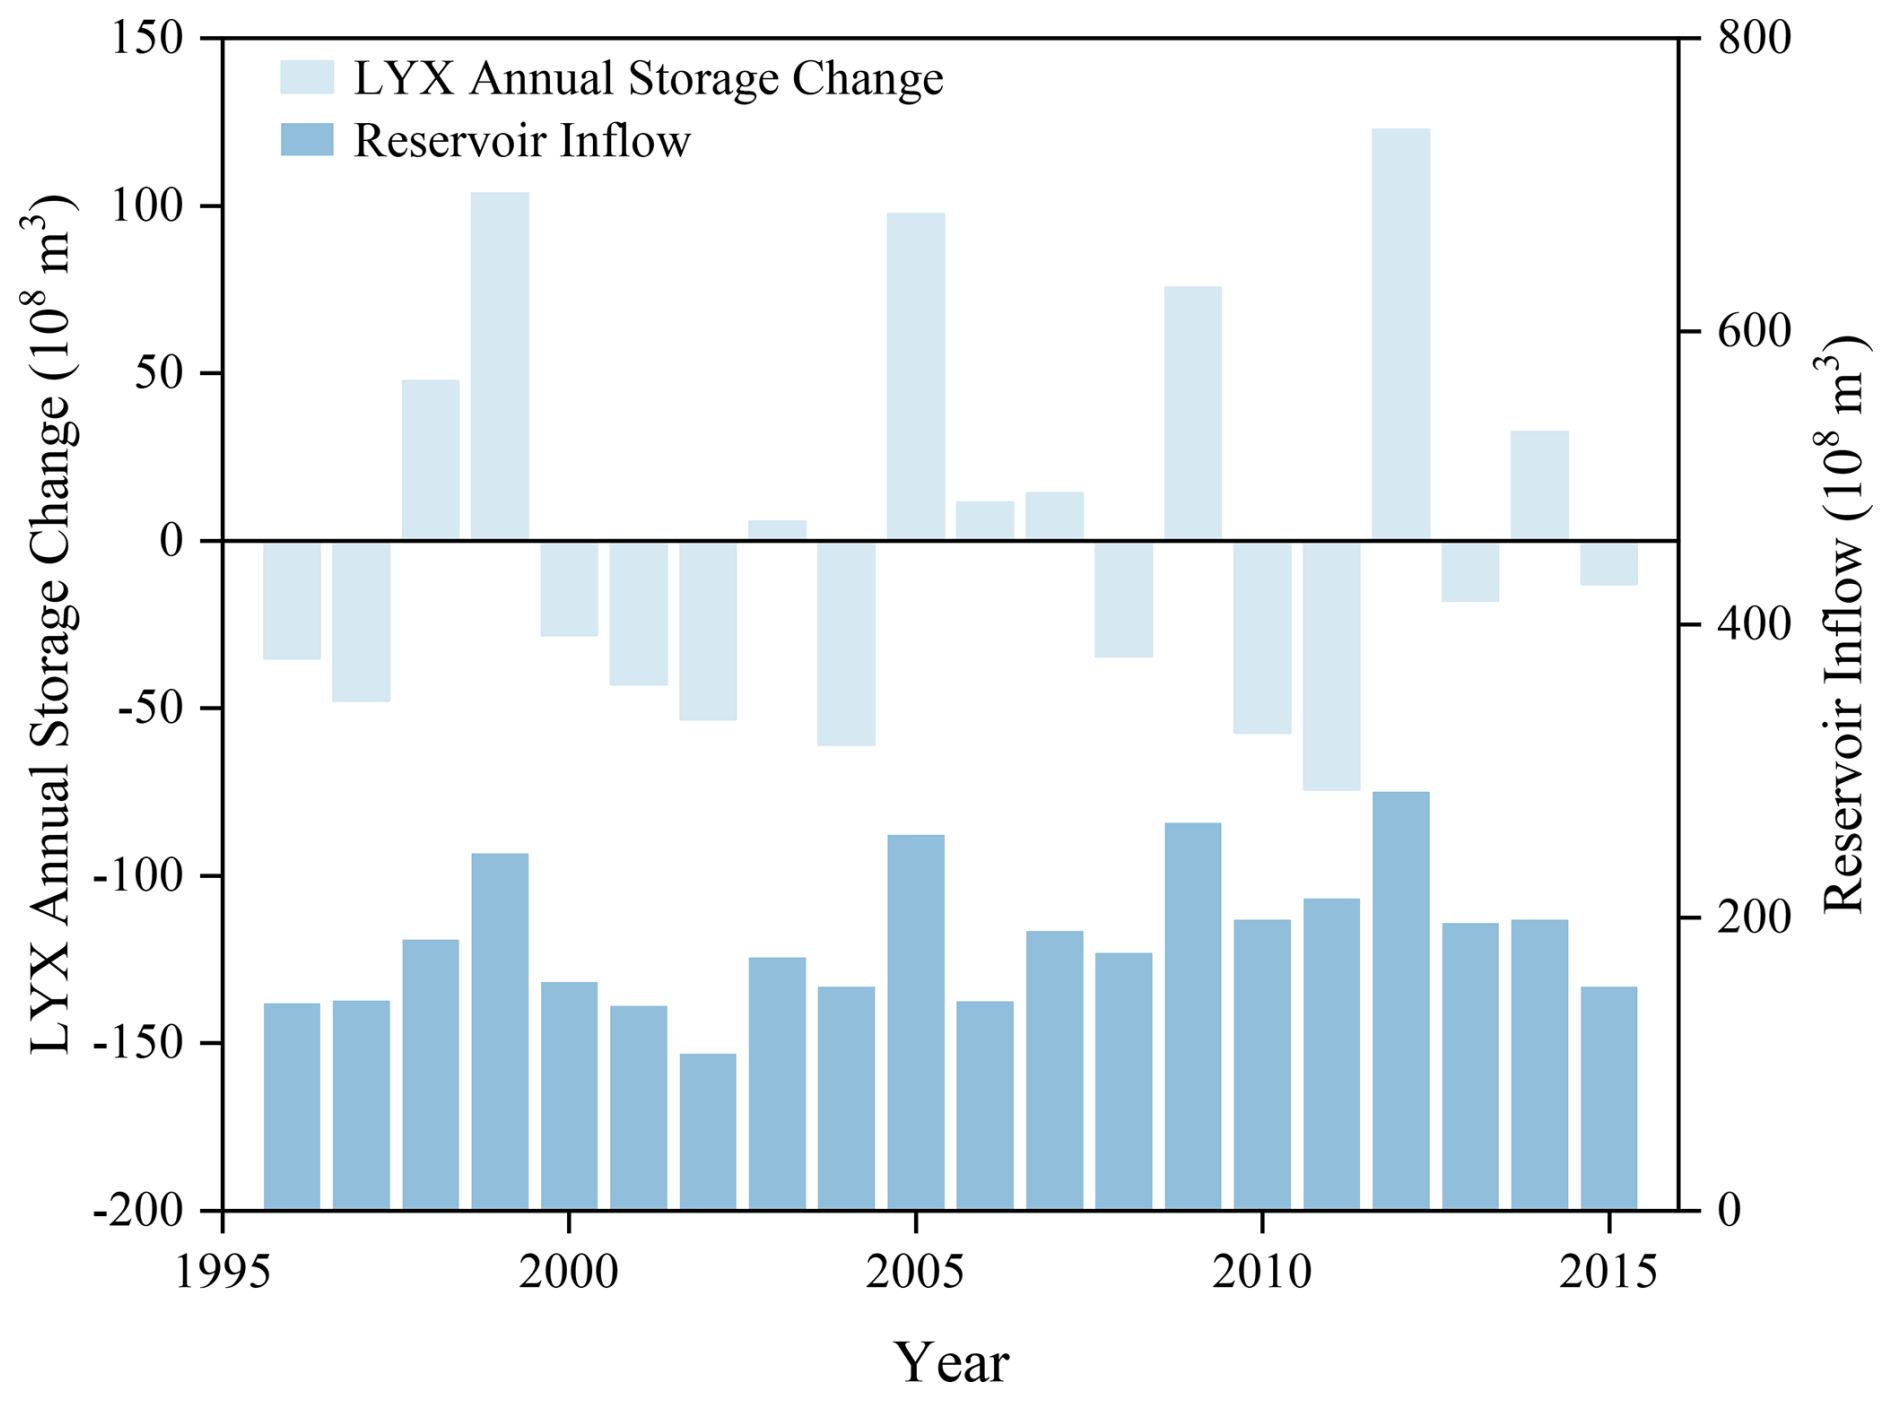
Figure 8Longyangxia reservoir (LYX) annual storage change and inflow from 1996 to 2015 (108 m3).
Table 4 summarizes the frequencies of full/empty storage (i.e., the upper/lower bound of active storage) for the major cascade reservoirs during 1996–2015. LYX, with a total storage capacity of 24.7 billion m3, is designed for prolonged drought mitigation, and therefore rarely reaches full or empty storage levels except in exceptionally wet or dry years. LiuJX, with about 23 % of LYX's storage capacity, serves as a primary peak-shaving power station in the northwestern power grid of China and is full several times every year in the study period, which is likely driven by electric power generation requirements. WJZ shows high frequencies of being completely empty or full, due to its limited regulating storage capacity (896 million m3), which is only 3.6 % of LYX's capacity, and its role in regulating water diversion from the Yellow River to Shanxi Province. SMX and XLD never reach full capacity, because their key functions of flood control and sediment flushing require strict water-level management to preserve adequate flood regulation space and to flush sediment via generated “artificial floods” downstream (Wu et al., 2021). To mitigate flood risks in the lower reaches, SMX is often preemptively drawn down during the flood season to accommodate potential flood peaks.
Table 4The frequency of full (◦) and empty (⊠) storage in the cascade reservoirs from 1996 to 2015. The numbers in parentheses indicate the monthly occurrences of reservoir emptying or filling in the given year.
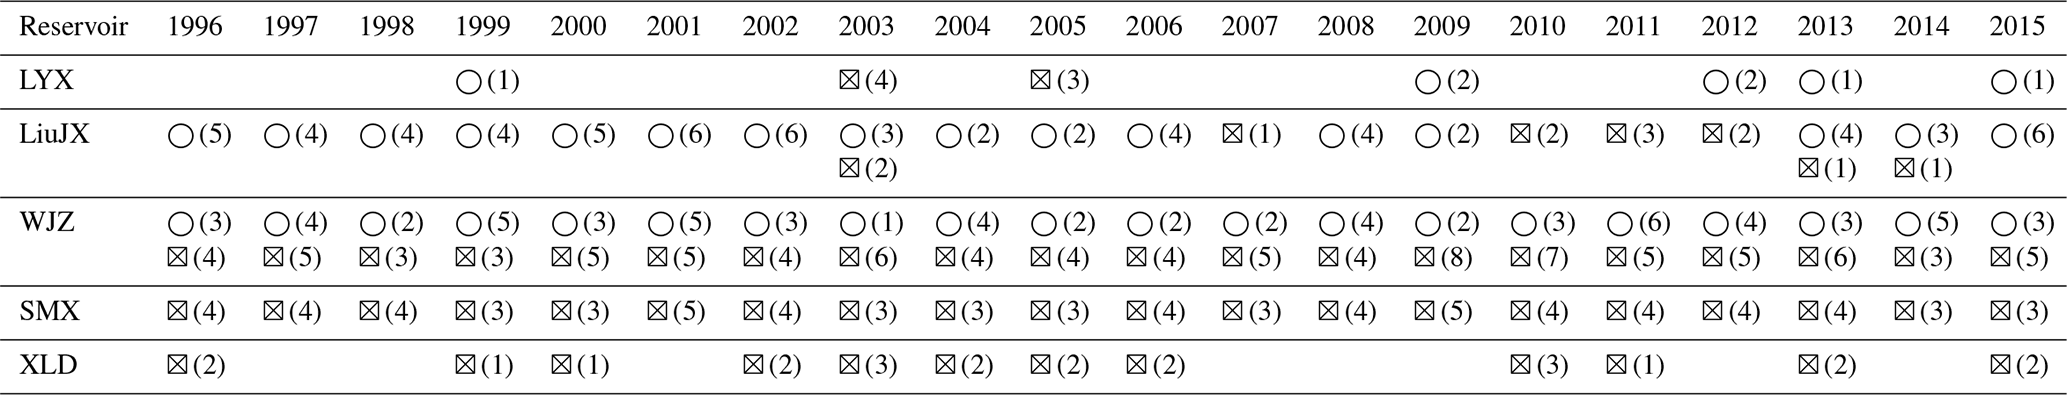
During 2000–2005, all five reservoirs experience varying degrees of empty storage, as consecutive dry years reduce basin-wide water availability. These full-empty storage occurrences are closely associated with inter-annual inflow variability, multi-objective operational requirements (flood control, water supply, sediment transport, and ecological protection), and the joint operation of cascade reservoirs, highlighting the need for dynamic reservoir scheduling to balance water use and flood risk mitigation.
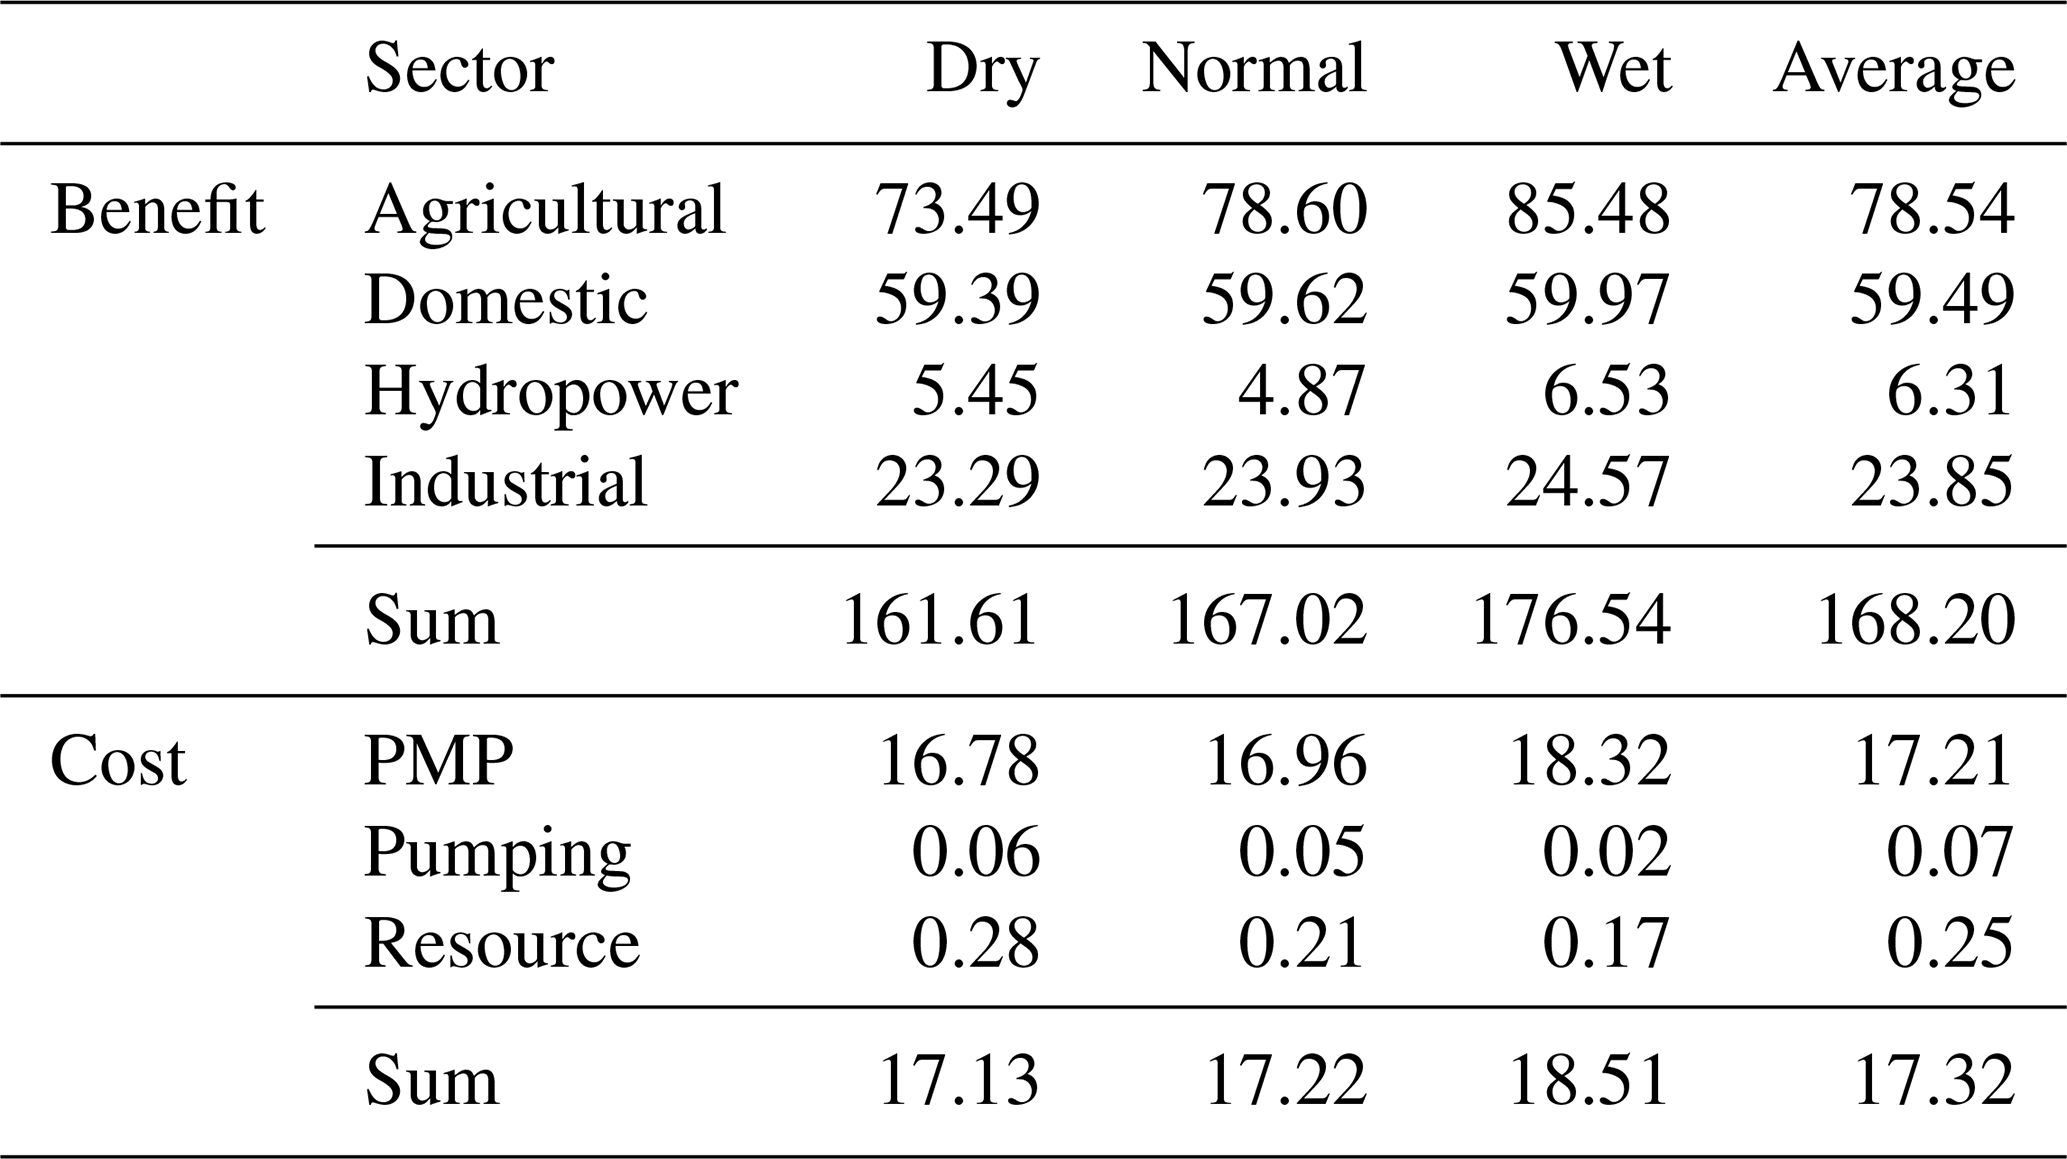
4.3 Economic Welfare
Table 5 presents the economic benefits and costs by water-use sectors under various hydrologic conditions. The majority of the economic benefits are from agricultural production, with an average value of CNY 78.54 billion, consistent with its dominant role in basin water use. Benefits from domestic water use remain relatively stable across different climatic and hydrologic conditions due to low price elasticity and stable water demand. Industrial benefits, however, are more sensitive to reductions in water availability due to higher price elasticity. Hydropower benefits depend directly on natural runoff, and consequently vary more with water variability.
Table 5Economic benefits and costs by water demand sectors under different hydrological year types (CNY billion).
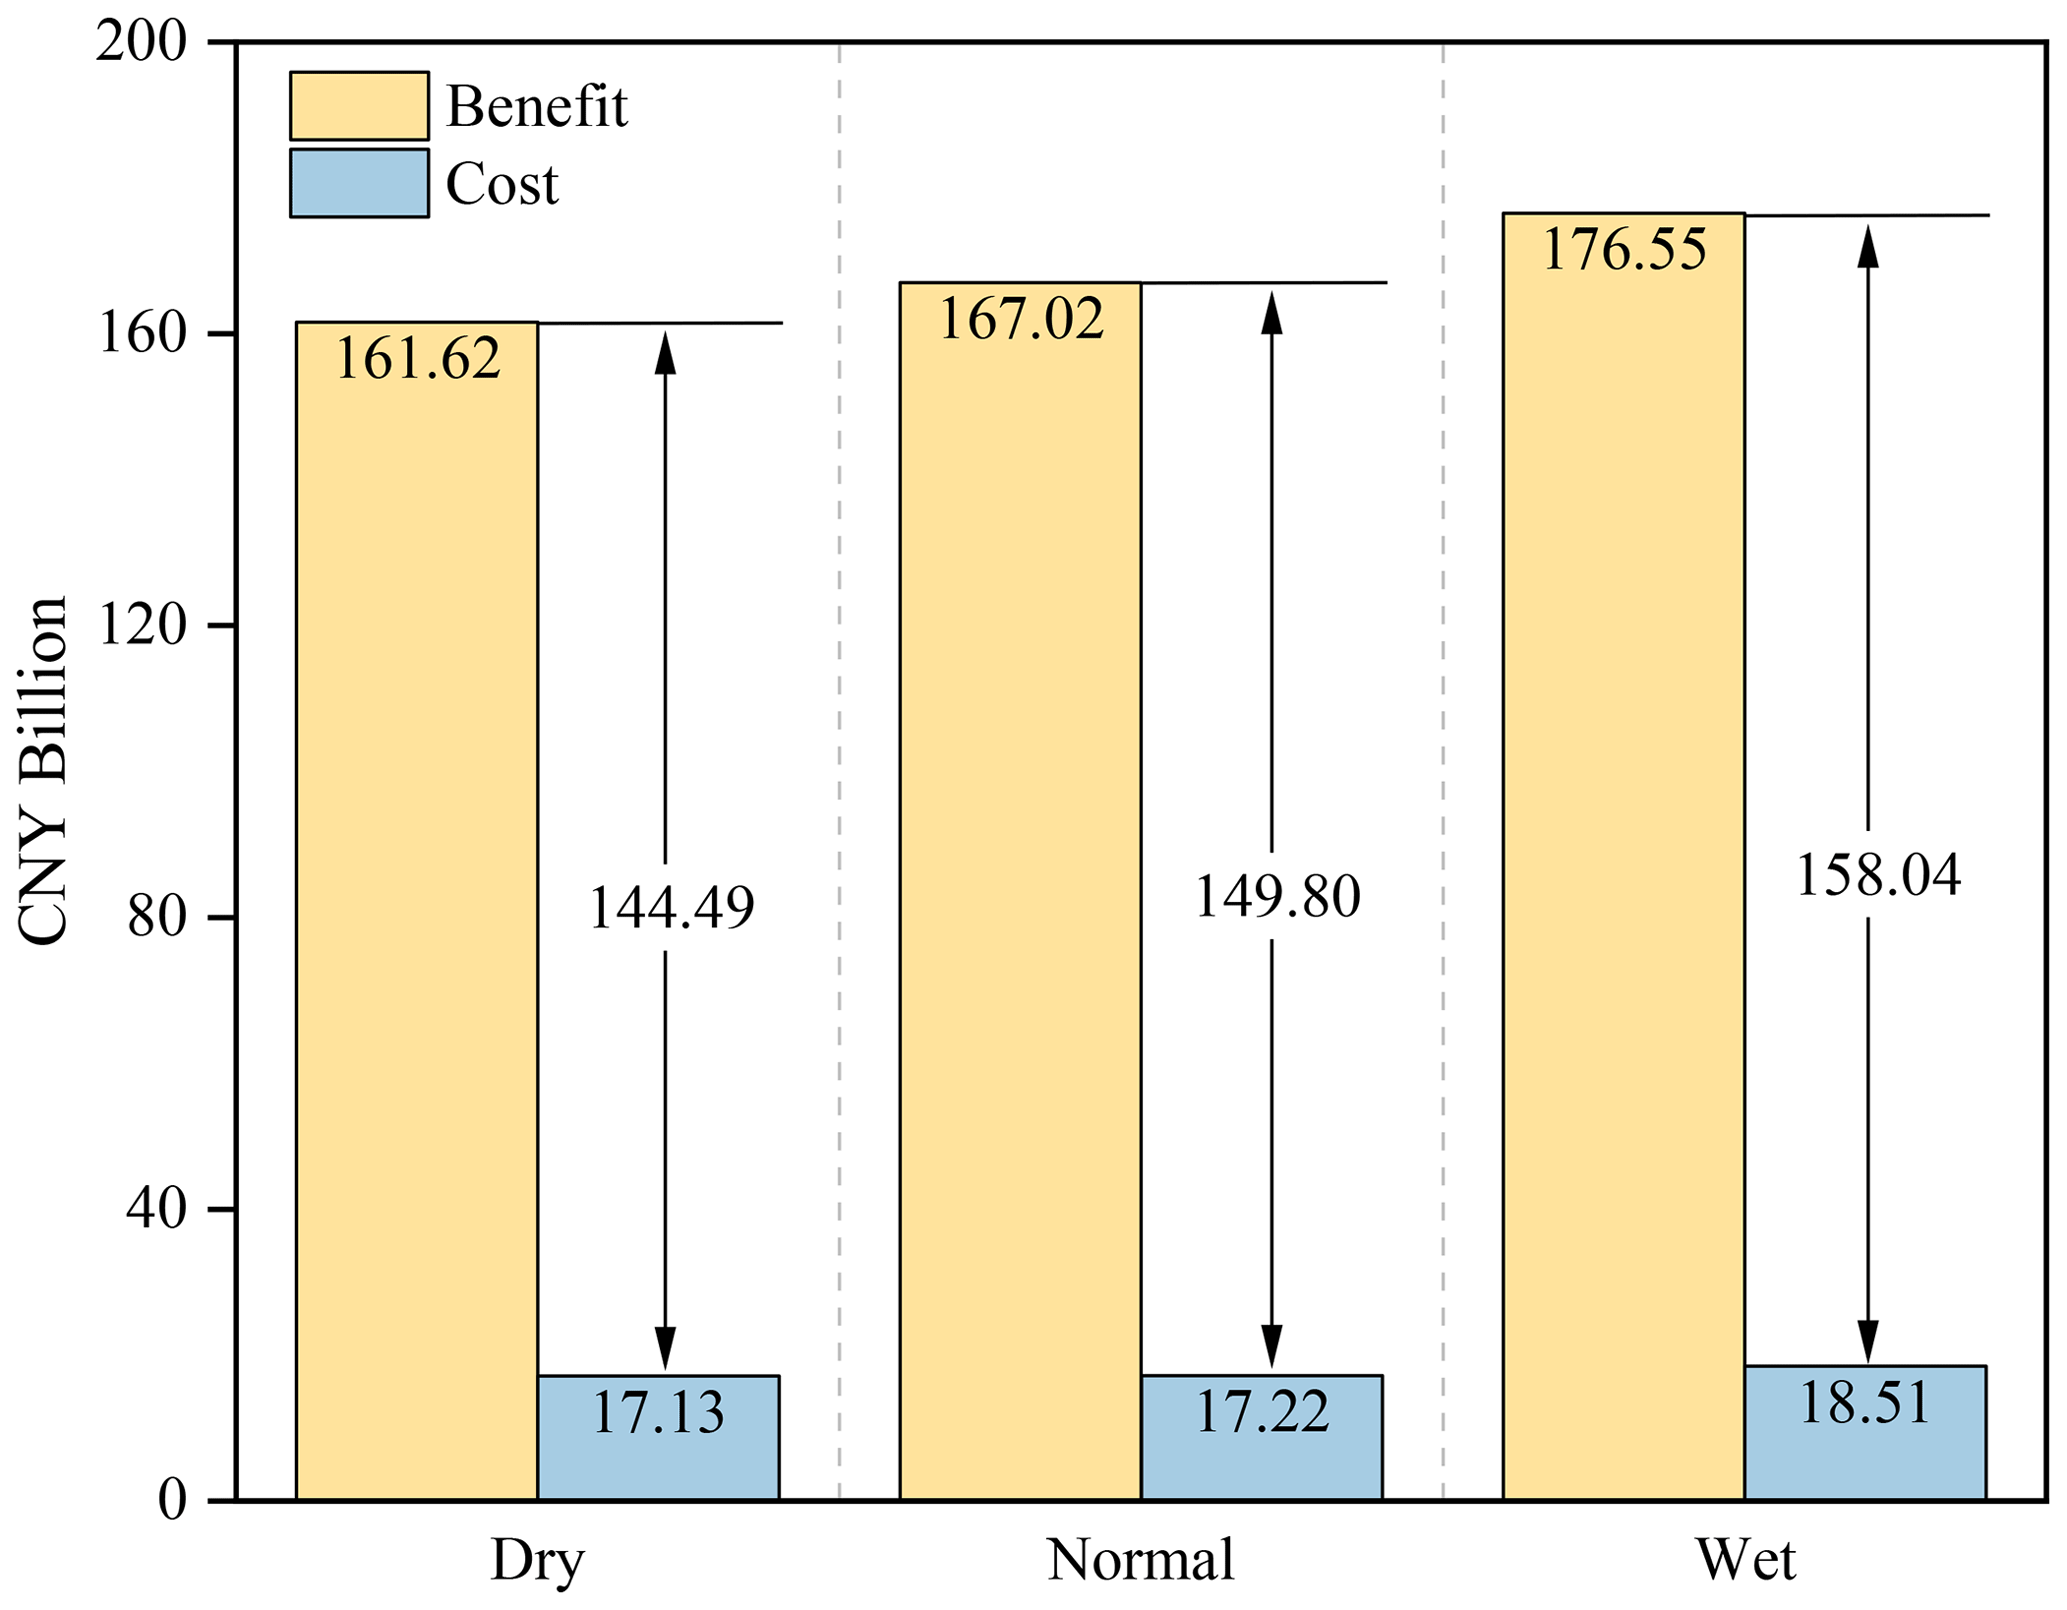
Net benefit is calculated as the difference between total benefits and costs (Fig. 9). For a wetter hydrology case, total benefit (CNY 176.54 billion), cost (CNY 18.51 billion), and net benefit (CNY 158.04 billion) are higher than those in dry years, reflecting higher water availability and larger water withdrawals in the basin. Nevertheless, the relatively small difference in net benefits across hydrologic years is attributed to several synergistic mechanisms: (1) As the dominant component of total benefits, agricultural revenue is stabilized through a minimum cultivated area constraint in the optimization model, which prevents excessive land fallowing while maintaining regional cropping patterns. Although grain crop areas expand preferentially in wet years, their limited contribution to total agricultural revenue persists due to low commodity prices. (2) Due to the prioritization of guaranteed water use for domestic and industrial sectors, urban water use varies little across water years, resulting in stable benefits from these sectors even under water scarcity. (3) Although hydropower benefit fluctuates significantly with water availability (Fig. S5), its small share of total benefits minimizes its overall impact. (4) The cascade reservoir system along the mainstream, particularly the LYX with its multi-year regulation capacity, enables inter-annual water reallocation. Surplus water is stored during wet years and released during droughts, effectively decoupling water availability from sectoral demands. Overall, the HEM optimization framework demonstrates robust stabilization of economic benefits, limiting total net benefit fluctuations across all hydrologic scenarios.
4.4 Marginal Values
Marginal values (also known as shadow prices) offer essential insights to decision-makers and water stakeholders by quantifying the value of additional water and reflecting the degree of water scarcity. Figure 10 presents shadow prices for various demand sectors under different hydrologic conditions. For a given hydrological year type, the marginal value represents the economic gain (or cost reduction) for one additional unit of water available in that month for irrigation, urban use, and ecological replenishment, and annually for reservoirs. When water scarcity intensifies, shadow prices are higher. In this study, marginal values of water are determined based on total water withdrawals at the demand sites.
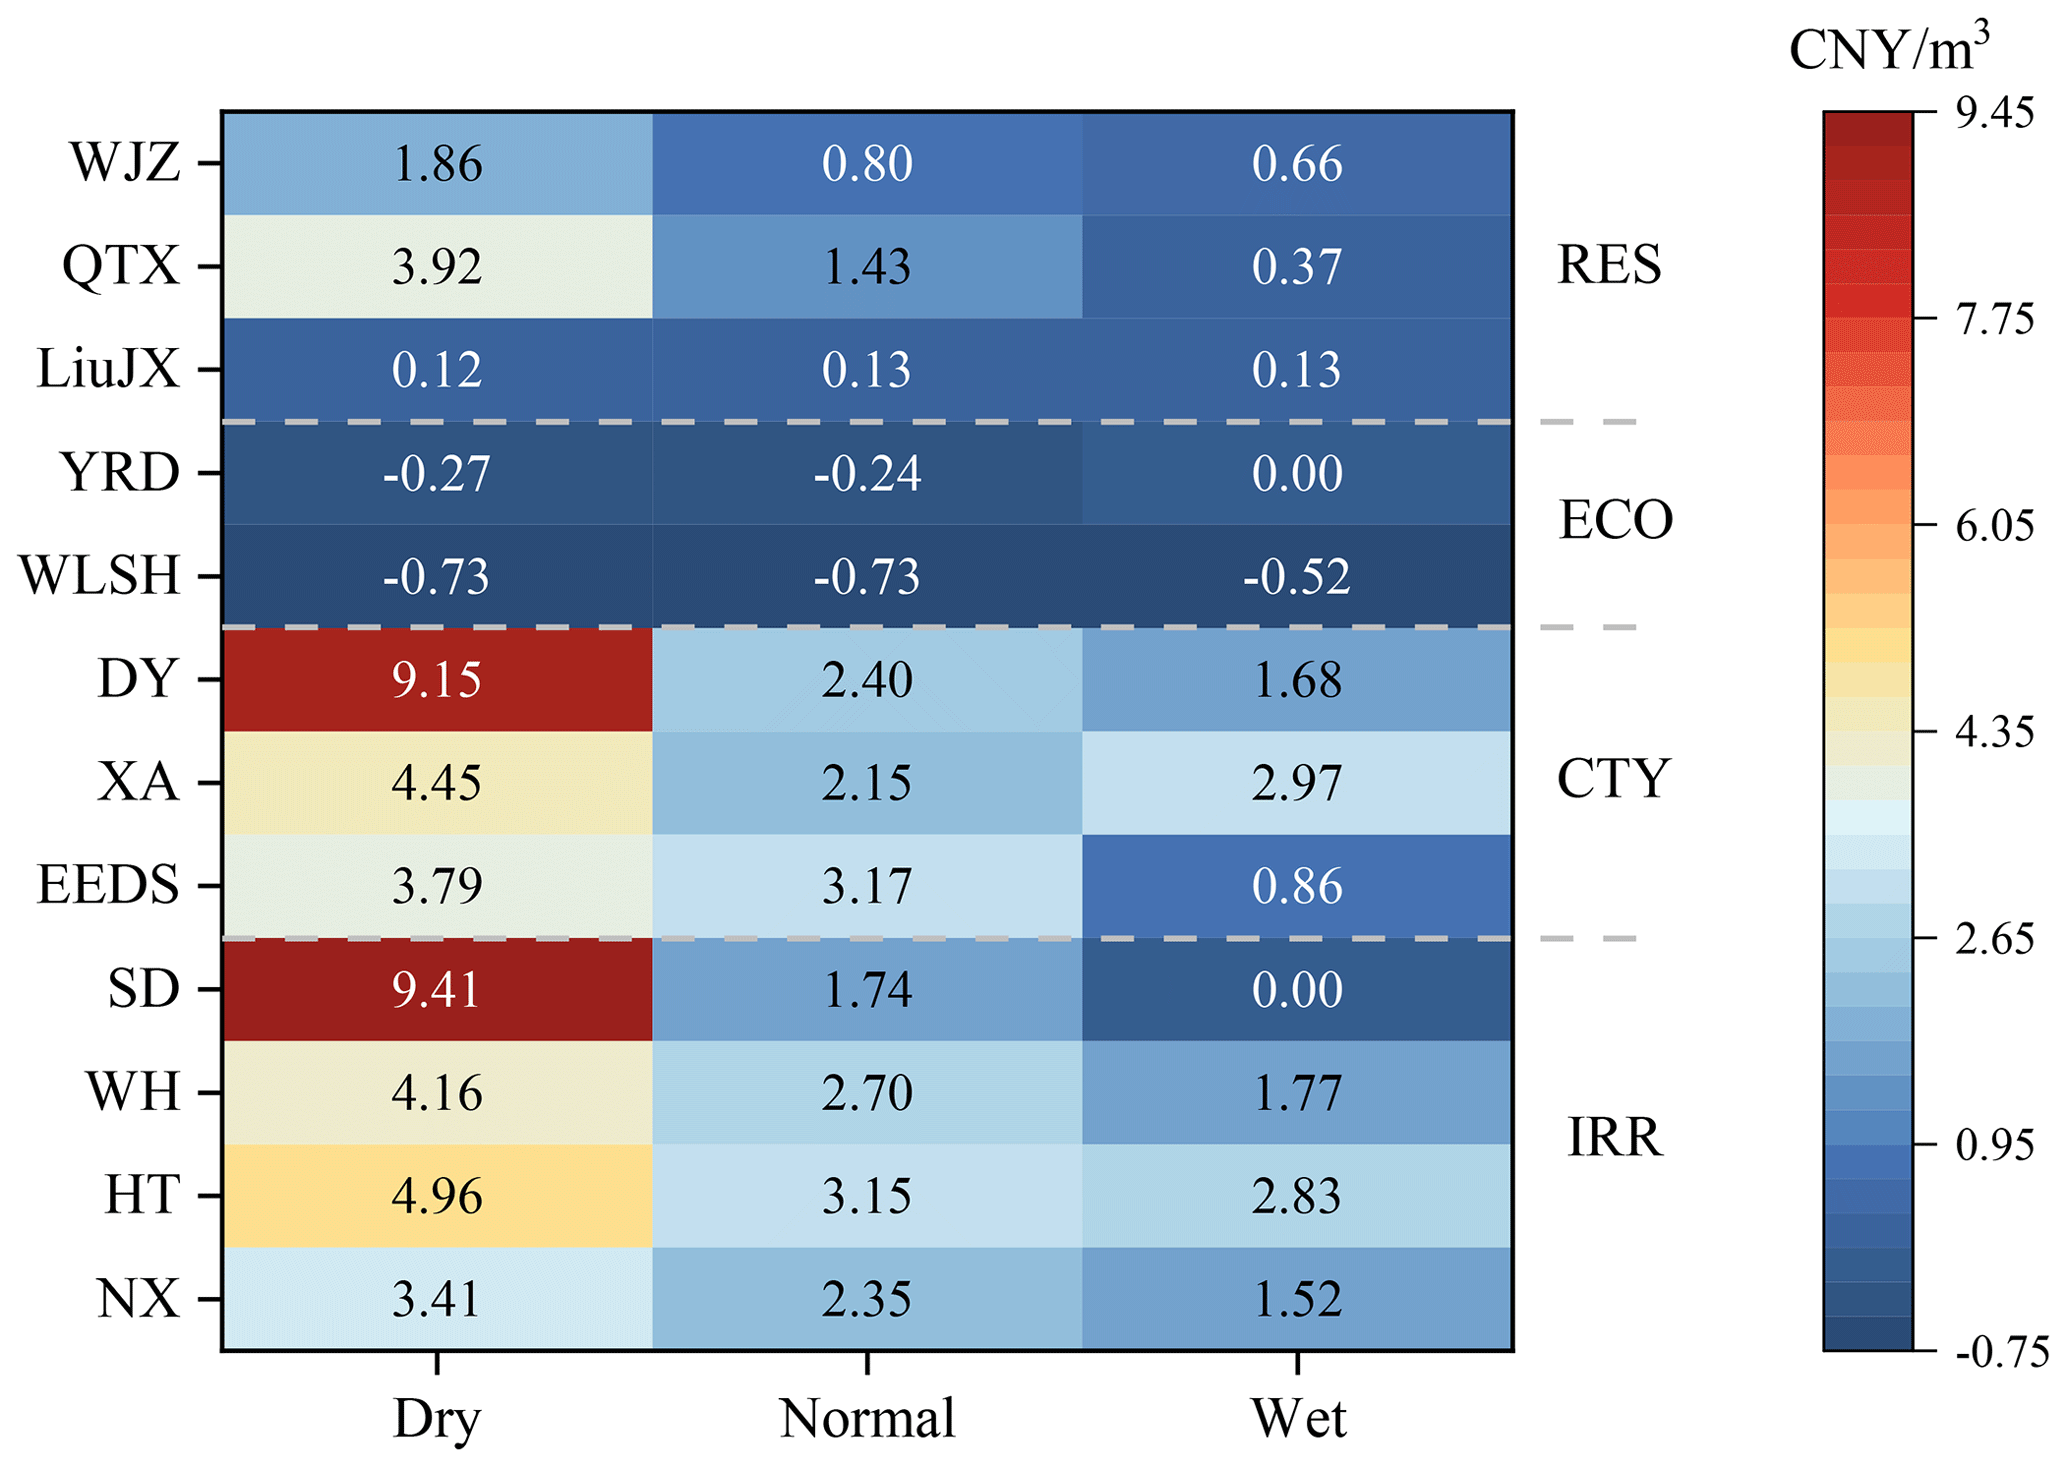
Figure 10Marginal values of water by water demand sectors under dry, normal and wet hydrologic conditions (CNY m−3) in different parts of the YRB. IRR = irrigation district; CTY = city; ECO = off-stream ecological replenishment area; RES = reservoir. See Table 1 for detailed node interpretation.
Irrigation: Marginal values appear only in months when irrigation demand exists in the corresponding irrigation district. NX and HT upstream, WH in the middle reaches, and SD downstream are selected as representatives. Compared to wet years, shadow prices in these major irrigation districts rise sharply in dry years, suggesting that reduced Yellow River water supply exacerbates shortages of irrigation water and reduces agricultural revenues. In the downstream region, the shadow price of SD remains zero under wet conditions, indicating farmers' unwillingness to pay for additional delivered water since additional water supply does not generate additional returns.
Urban use: Marginal values of urban water use in three representative cities, EEDS (upper region), XA (middle region), and DY (lower region), reflect their varying dependence on the Yellow River as a primary water source. Higher marginal values under water scarcity indicate greater stress on urban water supply. From dry to wet years, shadow prices decrease by 77.3 % in EEDS and 33.3 % in XA, while DY shows a larger decline of 81.6 %, highlighting its greater sensitivity to hydrologic variability. In dry years, an additional unit of water supply provides substantially higher benefits to urban activities in DY, consistent with its industrial-dominated economic structure.
Ecological replenishment: WLSH and YRD, as main off-stream ecological replenishment areas, are excluded from directly achieving economic value objectives. However, water replenished to these areas indirectly affects available water supply and related economic benefits for other water-use sectors. The negative sign means that using an additional unit of water for environmental protection reduces total (urban, agriculture, and hydropower) economic benefits. The absolute values of these shadow prices are high in dry years due to prioritization of high-value economic sectors, but they decline in wet years as increased water availability allows more water to be allocated to less economically productive uses.
Reservoirs: Marginal values of reservoirs refer to the benefits of increasing one additional unit of maximum reservoir storage capacity, related to both generating hydropower and meeting downstream water requirements. LiuJX, a large-capacity reservoir and major hydropower station on the main stem, shows lower marginal values than smaller reservoirs such as QTX and WJZ, reflecting both the limited contribution of additional storage to power generation and the satisfaction of local water demands. QTX primarily supports irrigation in surrounding districts, while WJZ diverts water from the Yellow River to Shanxi Province through the water transfer project. Both reservoirs alleviate water shortages, as demonstrated by their high marginal values. Higher values for the smaller reservoirs may be associated with more frequent refilling and greater hydropower head per unit of additional storage (Table 4). These marginal values should ultimately be compared with the costs of expanding reservoir capacities, as construction costs and economies of scale differ across sites.
Figure 11 illustrates the spatial variations in streamflow (Fig. 11a), cumulative withdrawals (Fig. 11b), and marginal values of water (Fig. 11c) along the main stem of the Yellow River during a representative dry year. The co-occurrence of decreasing flow, increasing withdrawals, and rising marginal values highlights the intensification of water scarcity from upstream to downstream. Upstream regions, where flow remains relatively high, have low marginal values due to adequate water supply. However, cumulative withdrawals substantially reduce available water along the mainstem, increasing the economic value of water. The most pronounced marginal value peaks occur in regions with limited alternative water sources and/or highly intensive production activities, such as NA relying solely on the Yellow River for irrigation, WNA depending on the Wei River for industrial and domestic use but facing competition from its upstream users, and SD with extensive irrigated areas but very limited water availability near the estuary.
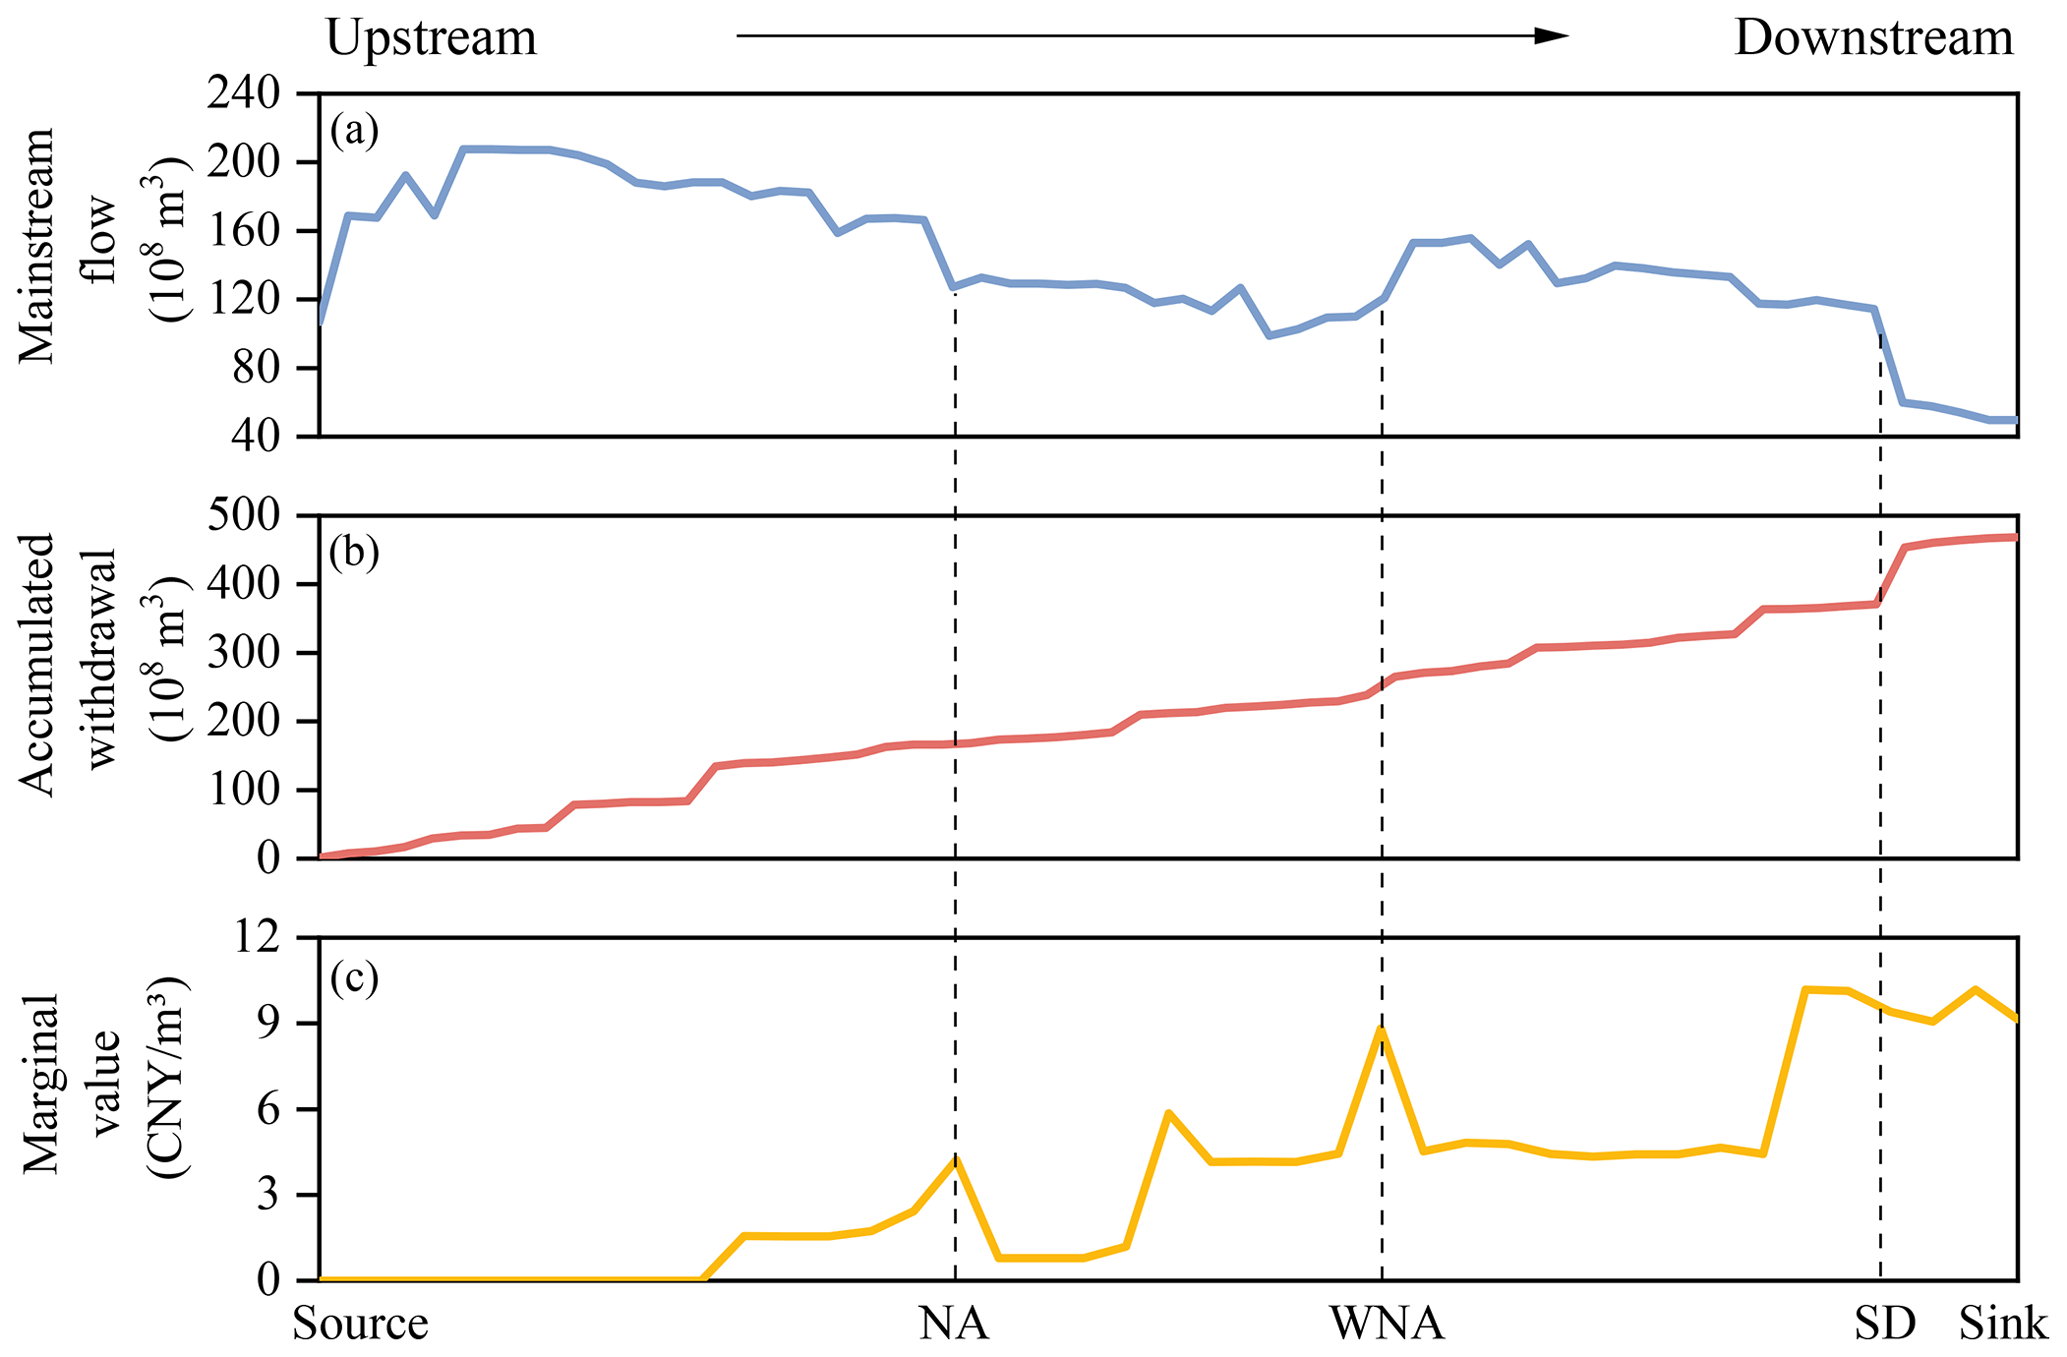
Figure 11Spatial dynamics of (a) mainstream flow (108 m3), (b) cumulative withdrawals (108 m3), and (c) marginal values of water (CNY m−3) along the Yellow River in a typical dry year.
Several factors affect the spatial dynamics of marginal value. First, intensive agricultural withdrawals reduce local water availability, increasing the value of additional water for sustaining crop yields. Second, growing industrial and urban water demands intensify water use competition, particularly in downstream cities with expanding populations and economic activities. Finally, institutional water allocation constraints, including inter-basin transfer regulations and environmental flow requirements, further restrict access to water, amplifying marginal values.
The strong correlation between withdrawal amounts and marginal value underscores the need for targeted conservation and allocation strategies. Improving irrigation efficiency, optimizing industrial water use, and refining allocation mechanisms can mitigate excessive withdrawals and alleviate pressure on downstream users. Furthermore, market-based approaches such as water pricing and trading could facilitate more efficient allocation, supporting sustainable water management in water-scarce areas (Ringler et al., 2010; Trail and Ward, 2024; Zhao et al., 2023).
5.1 Implications
Our results have some key implications for improving water management flexibility and water use efficiency.
Spatiotemporal water supply variations (Fig. 5) across the basin highlight opportunities for more adaptive water management that can serve as a reference for planners to make better decisions to meet demand requirements. As irrigation water use occupies 74 % of total basin water use, improving irrigation water-use efficiency is critical. Furthermore, to mitigate the impacts of water shortages that may lead to fallow land or shifts in cropping patterns, comprehensive reforms in agricultural water pricing and reward mechanisms for water conservation are essential. Additionally, most crops experience yield reductions under water-deficient conditions, while drought-resistant crops maintain relatively high productivity levels (Table 3). Expanding the cultivation of low-water-consuming and drought-resistant crops, together with improvements in crop varieties through genetic enhancement, can help stabilize agricultural production under increasing water stress.
For industrial activities, water withdrawal in midstream and downstream cities accounts for 74.9 % of total industrial water use across the basin (Fig. S4), with heavy industries dominating in these regions. Efforts should focus on maximizing the potential for water-saving by accelerating the adoption of advanced water-saving technologies and equipment. Priority should be given to water-saving measures in high water-consuming industries such as energy, chemical manufacturing, and construction materials production, as well as to improving urban wastewater reuse technologies.
Addressing the risk of severe water scarcity under consecutive dry-year conditions requires careful consideration of adaptive reservoir management strategies. In particular, appropriate hedging rules for multi-year reservoir operations are essential to improve the reliability of long-term water supply planning. While optimization models often assume perfect hydrologic foresight for computational convenience, such assumptions do not align with real-world conditions. Reservoirs may operate based on “foreseen” future conditions that do not exist, leading to suboptimal storage and release decisions. Consequently, analysis on carryover storage of multi-year regulating reservoirs, such as the LYX, is important to provide a physical buffer against hydrologic and demand uncertainties and reduce reliance on unrealistic modelling assumptions.
Based on the spatial and temporal variability in the marginal values of water across hydrologic conditions, sectors and locations (Figs. 10 and 11), economically-oriented water transfers and water rights trading can enhance reallocation of water resources. During dry years, downstream sectors show higher marginal values of water, indicating that transferring surplus water from upper to lower reaches via water markets or other negotiated agreements could generate greater economic benefits, foster inter-regional win-win outcomes, and mitigate water stress. Multi-purpose reservoirs play a key role in this process. Their high marginal values underscore the significant economic and social benefits generated by each unit of water in meeting diverse objectives, including hydropower generation, flood control, and water supply. However, current storage capacities and regulation capabilities are insufficient to fully meet growing demands. Targeted investments in additional storage infrastructure or inter-basin water transfer projects could therefore enhance system resilience and improve overall water resource utilization.
5.2 Limitations and Future Development
The HEM developed in this study involves several simplifying assumptions. First, water allocation is driven exclusively by the basin-wide economic objective subject to system constraints. However, in real-world applications, water management is guided by broader criteria, including water supply reliability, environmental performance (Kahil et al., 2018), and political considerations. Second, representing basin components using a node-arc network, despite its convenience for modelling, assumes a representative water user at each demand node, thus ignoring heterogeneities in scales, technologies, productivity and user preferences across different users within each demand area. At the node level, the model simulates the exchange and allocation of flows between nodes but does not capture detailed local dynamic feedbacks, such as interactions between groundwater aquifers and surface water systems. For the time scale, the monthly time step adopted in the model run limits the representation of short-term hydrological extremes, such as flood peaks, reflecting the HEM's focus on basin-scale water allocation rather than event-scale dynamics. Besides, the model broadly classifies water use into four sectors: irrigation, urban (industrial and domestic) use, hydropower, and ecology. Livestock and forestry within agriculture, light industry, individual household water use behaviour, or the functions of local ecological protection and aquaculture associated with reservoirs are omitted. Including these water users can improve the assessment of water competition among sectors and guide efficient allocation on a broader sectoral scale. Lastly, the model assumes that the river basin management authority has full control over all water-use sectors, possesses comprehensive access to and management of information from both supply and demand sides, and can respond promptly to any changes or adjustments within the system. Accordingly, the management authority is conceptualized as an efficient decision-making entity capable of integrating information, optimizing resource allocation, and dynamically regulating operations. Consistent with this basin-level perspective, the model emphasizes coordinated allocation at the basin scale and therefore does not fully represent decentralized decision-making mechanisms operating at the provincial level. Thus, the model provides an idealized solution (rather than a directly implementable solution) including precise policy evaluation and strategy optimization that the basin authority can achieve if the flow of information and feedback within a complex water resources system can be followed. Nevertheless, idealized solutions provide insights and directions for policy and management improvements, they are not suitable for real-time scheduling and daily operational management, and face significant limitations at micro-level applications such as individual water users.
Another limitation of this study is the lack of comprehensive information and data. Due to the lack of reliable biophysical and economic data, important local processes, impacts on water quality, interaction between surface water and groundwater, and changes in the cost of water supply over time, etc., are not fully represented. Especially, data acquisition presents significant challenges, such as limited data sharing among institutions and concerns over confidentiality, which restrict access to comprehensive datasets and affect the validation of the basin-wide model. Moreover, discrepancies in temporal and spatial resolution across data sources complicate data integration. Even after extensive processing, variability in numerical scales across datasets, combined with uncertainties from natural variability and measurement errors, poses difficulties in assessing the reliability of model outputs (Cai, 2008a).
Climatic water stress, population growth, and increasing concerns over regional water sharing and equity within many arid and semi-arid basins highlight the significance of designing models that can adapt to both natural change and socio-economic development. Future research should prioritize sustainable water use under long-term climate change and increasing extreme events, with greater emphasis on incorporating stochastic optimization or scenario-based analysis to evaluate future climate and socioeconomic pathways. It is also vital to consider large-scale infrastructure projects under construction or planning, including the western route of the South-North Water Transfer Project, to support evaluation of investment feasibility and future economic benefits. Finally, future model development should more explicitly represent conjunctive use of surface water, groundwater and other unconventional sources, especially given the unreliability of relying on a single source and the derivative risks from groundwater over-exploitation.
This study develops a hydroeconomic optimization model that integrates surface and groundwater hydrology, water infrastructure, and sector-specific water demands into a coherent analytical framework to assess spatiotemporal variations in water availability and water value in a large basin. The model adopts a PMP calibration method to suggest an optimal water allocation plan in which the optimized baseline conditions are consistent with data observed in irrigated areas, reservoir storage levels, and city water supplies, allowing identification of impacts from any new changes in policies and operational rules on water allocation and benefits at the basin scale. The framework captures trade-offs among competing water uses including agricultural production, industrial and domestic activities, and ecological requirements, and offers quantitative support for basin-wide water management decisions.
The HEM is applied to the YRB in China, a large basin with pressing water security issues and a centralized basin authority (YRCC) to coordinate basin-wide management activities. By investigating supply-demand dynamics under different hydrologic conditions, the results indicate that:
-
Meeting the water demands of the various sectors with reliability, without major economic losses or compromising critical ecological requirements, depends heavily on coordinated reservoir operations and groundwater extraction, particularly during dry seasons or severe droughts.
-
Agricultural water use has significant spatial and climatic vulnerabilities. Arid regions face heightened water stress and therefore need technological advances to enhance irrigation efficiency. Differences in crop-specific water productivity identified by the model reveal opportunities to prioritize drought-resilient and high-value crops. Such adjustments could reduce irrigation demand without compromising yield stability, offering a path to decouple agricultural production from water-intensive practices.
-
Multi-year regulating reservoirs are pivotal in mitigating interannual hydrologic variability, by reallocating water surpluses from wet to dry years and buffering against consecutive drought years. Analysis of storage cycles of the LYX shows its relatively low frequency of full or empty storage, implying that its capacity is sufficiently large to regulate extremely high and low flows, provided that active inter-year regulation capacity is maintained.
-
Marginal value analysis highlights heterogeneity in water scarcity across sectors and regions. During periods of water scarcity, allocation priorities favouring industrial and domestic use, as their higher water economic values often lead to ecological flow deficits and unstable agricultural systems, thereby increasing long-term sustainability risks. These trade-offs necessitate adaptive allocation mechanisms that balance efficiency with equity, such as tiered pricing for high-value uses and compensatory schemes for environmental and subsistence needs.
Beyond the YRB, this study offers transferable modelling methods and insights for governance of other large river basins confronting scarcity and competition. The combination of the node-link representation, PMP calibration, and an integrated hydroeconomic model formulation provides a structured basis for evaluating basin-wide allocation strategies under diverse policy and hydrologic conditions. However, accomplishing such analyses in practice depends on specific institutional settings. In the YRB, a strong centralized basin authority facilitates water governance. In more decentralized or collaborative settings, comparable outcomes may require stronger coordination mechanisms, legal alignment, stakeholder negotiation, or market institutions. Thus, while the modelling framework is broadly applicable, its operational deployment must be adapted to local governance contexts.
While the model shows its usefulness as a planning tool for large basin authorities, it is formulated with the water demand of aggregated sectors without considering intra-sectoral heterogeneity. Given its focus on large-scale dynamics, the model lacks precision in capturing technical variations or behavioural preferences of individual users. Additionally, its emphasis on long-term planning and strategic analysis limits its applicability for real-time scheduling. Nevertheless, by adopting a macroscopic perspective, the model effectively identifies system-level bottlenecks and supports the development of sustainable strategies for managing complex water allocation challenges.
Future research should focus on incorporating additional dimensions such as climate change impacts, water markets and exchanges, conjunctive use of surface water and groundwater, and inclusion of unconventional water sources in the water supply portfolio. Additionally, improving data availability and integrating socio-political factors can enhance the robustness of decision-making frameworks, providing more actionable insights for sustainable water resources management in the YRB and similar arid basins worldwide.
The model was implemented in the General Algebraic Modelling System (GAMS), which is available under a license (https://www.gams.com/, last access: 15 January 2026). Code and data used in this study are not publicly available but can be obtained from the corresponding author upon reasonable request.
The supplement related to this article is available online at https://doi.org/10.5194/hess-30-2161-2026-supplement.
Yuhan Yan contributed to investigation, data curation, formal analysis, methodology, visualization and prepared the paper with contributions from all the co-authors, along with conducting review and editing. Tingju Zhu contributed to conceptualization, funding acquisition, project administration, supervision, validation, and review and editing. Ximing Cai contributed to visualization, validation and review and editing. Zhenxing Zhang, Yunlu Ma and Jay R. Lund contributed to review and editing.
The contact author has declared that none of the authors has any competing interests.
Publisher's note: Copernicus Publications remains neutral with regard to jurisdictional claims made in the text, published maps, institutional affiliations, or any other geographical representation in this paper. The authors bear the ultimate responsibility for providing appropriate place names. Views expressed in the text are those of the authors and do not necessarily reflect the views of the publisher.
The authors are grateful to two anonymous reviewers and the editor for their constructive suggestions, which helped improve the manuscript.
This research has been supported by the National Key Research and Development Program of China (grant nos. 2022YFC3202305 and 2020YFA0608603).
This paper was edited by Yongping Wei and reviewed by two anonymous referees.
Allen, R. G., Pereira, L. S., Raes, D., and Smith, M.: FAO Irrigation and Drainage Paper No. 56 - Crop Evapotranspiration, ISBN 92-5-104219-5, 1998.
Baccour, S., Albiac, J., Kahil, T., Esteban, E., Crespo, D., and Dinar, A.: Hydroeconomic modeling for assessing water scarcity and agricultural pollution abatement policies in the Ebro River Basin, Spain, J. Clean. Prod., 327, 1–13, https://doi.org/10.1016/j.jclepro.2021.129459, 2021.
Baccour, S., Ward, F. A., and Albiac, J.: Climate adaptation guidance: New roles for hydroeconomic analysis, Sci. Total Environ., 835, https://doi.org/10.1016/j.scitotenv.2022.155518, 2022.
Bai, T., Chang, J., Chang, F. J., Huang, Q., Wang, Y., and Chen, G.: Synergistic gains from the multi-objective optimal operation of cascade reservoirs in the Upper Yellow River basin, J. Hydrol., 523, 758–767, https://doi.org/10.1016/j.jhydrol.2015.02.007, 2015.
Bai, T., Wei, J., Chang, F. J., Yang, W., and Huang, Q.: Optimize multi-objective transformation rules of water-sediment regulation for cascade reservoirs in the Upper Yellow River of China, J. Hydrol., 577, https://doi.org/10.1016/j.jhydrol.2019.123987, 2019.
Bao, Z., Zhang, J., Wang, G., Chen, Q., Guan, T., Yan, X., Liu, C., Liu, J., and Wang, J.: The impact of climate variability and land use/cover change on the water balance in the Middle Yellow River Basin, China, J. Hydrol., 577, https://doi.org/10.1016/j.jhydrol.2019.123942, 2019.
Basheer, M., Nechifor, V., Calzadilla, A., Gebrechorkos, S., Pritchard, D., Forsythe, N., Gonzalez, J. M., Sheffield, J., Fowler, H. J., and Harou, J. J.: Cooperative adaptive management of the Nile River with climate and socio-economic uncertainties, Nat. Clim. Chang., 13, 48–57, https://doi.org/10.1038/s41558-022-01556-6, 2023.
Bouman, B. A. M., Lampayan, R. M., and Tuong, T. P.: Water Management in Irrigated Rice: Coping with Water Scarcity, 54 pp., ISBN 978-971-22-0219-3, 2007.
Cai, X.: Implementation of holistic water resources-economic optimization models for river basin management – Reflective experiences, Environ. Model. Softw., 23, 2–18, https://doi.org/10.1016/j.envsoft.2007.03.005, 2008a.
Cai, X.: Water stress, water transfer and social equity in Northern China-Implications for policy reforms, J. Environ. Manage., 87, 14–25, https://doi.org/10.1016/j.jenvman.2006.12.046, 2008b.
Cai, X. and Wang, D.: Calibrating Holistic Water Resources–Economic Models, J. Water Resour. Plan. Manag., 132, 414–423, https://doi.org/10.1061/(asce)0733-9496(2006)132:6(414), 2006.
Cai, X., McKinney, D. C., and Lasdon, L. S.: Integrated Hydrologic-Agronomic-Economic Model for River Basin Management, J. Water Resour. Plan. Manag., 129, 4–17, https://doi.org/10.1061/(asce)0733-9496(2003)129:1(4), 2003.
Cai, X., Ringler, C., and Rosegrant, W. M.: Modeling Water Resources Management at the Basin Level: Methodology and Application to the Maipo River Basin, 170 pp., ISBN 0-89629-152-9, 2006.
Cao, Z., Zhu, T., and Cai, X.: Hydro-agro-economic optimization for irrigated farming in an arid region: The Hetao Irrigation District, Inner Mongolia, Agric. Water Manag., 277, https://doi.org/10.1016/j.agwat.2022.108095, 2023.
Chai, J.: Practical Experience of Operation and Dispatching for Shanxi Wanjiazhai Yellow River Diversion Project, in: Proceedings of the 2015 Academic Annual Conference of the Chinese Society for Water Resources, Chinese Hydraulic Engineering Society, 658–662, 2015.
Chang, J., Meng, X., Wang, Z. Z., Wang, X., and Huang, Q.: Optimized cascade reservoir operation considering ice flood control and power generation, J. Hydrol., 519, 1042–1051, https://doi.org/10.1016/j.jhydrol.2014.08.036, 2014.
Chang, J., Li, Y., Yuan, M., and Wang, Y.: Efficiency evaluation of hydropower station operation: A case study of Longyangxia station in the Yellow River, China, Energy, 135, 23–31, https://doi.org/10.1016/j.energy.2017.06.049, 2017.
Chen, J., Xia, J., Zhao, C., Zhang, S., Fu, G., and Ning, L.: The mechanism and scenarios of how mean annual runoff varies with climate change in Asian monsoon areas, J. Hydrol., 517, 595–606, https://doi.org/10.1016/j.jhydrol.2014.05.075, 2014.
Cuo, L., Zhang, Y., Gao, Y., Hao, Z., and Cairang, L.: The impacts of climate change and land cover/use transition on the hydrology in the upper Yellow River Basin, China, J. Hydrol., 502, 37–52, https://doi.org/10.1016/j.jhydrol.2013.08.003, 2013.
Draper, A. J., Jenkins, M. W., Kirby, K. W., Lund, J. R., and Howitt, R. E.: Economic-Engineering Optimization for California Water Management, J. Water Resour. Plan. Manag., 129, 155–164, https://doi.org/10.1061/(asce)0733-9496(2003)129:3(155), 2003.
Ejaz Qureshi, M., Whitten, S. M., Mainuddin, M., Marvanek, S., and Elmahdi, A.: A biophysical and economic model of agriculture and water in the Murray-Darling Basin, Australia, Environ. Model. Softw., 41, 98–106, https://doi.org/10.1016/j.envsoft.2012.11.007, 2013.
GAMS: GAMS System Overview, https://www.gams.com/products/gams/gams-language/, last access: 15 January 2026.
Gao, X., Zhu, C., Chen, C., Lu, J., and Zhao, X.: Study on the Optimization of Water and Sediment Regulation of the Xiaolangdi Reservoir Considering the Change of Wet-Dry Water and Sediment in the Yellow River, Yellow River, 45, 19–24, https://doi.org/10.3969/j.issn.1000-1379.2023.10.004, 2023.
General Office of the State Council of the People's Republic of China: 1987 Water Allocation Scheme, https://www.gov.cn/xxgk/pub/govpublic/mrlm/201103/t20110330_63799.html (last access: 23 September 2025), 1987.
General Office of the State Council of the People's Republic of China: Guideline on Improving the Price Governance Mechanism, https://www.gov.cn/zhengce/202504/content_7016955.htm (last access: 6 February 2026), 2024.
Giakoumis, T. and Voulvoulis, N.: The Transition of EU Water Policy Towards the Water Framework Directive's Integrated River Basin Management Paradigm, Environ. Manage., 62, 819–831, https://doi.org/10.1007/s00267-018-1080-z, 2018.
Gohar, A. A., Cashman, A., and Ward, F. A.: Managing food and water security in Small Island States: New evidence from economic modelling of climate stressed groundwater resources, J. Hydrol., 569, 239–251, https://doi.org/10.1016/j.jhydrol.2018.12.008, 2019.
Hanasaki, N., Fujimori, S., Yamamoto, T., Yoshikawa, S., Masaki, Y., Hijioka, Y., Kainuma, M., Kanamori, Y., Masui, T., Takahashi, K., and Kanae, S.: A global water scarcity assessment under Shared Socio-economic Pathways – Part 2: Water availability and scarcity, Hydrol. Earth Syst. Sci., 17, 2393–2413, https://doi.org/10.5194/hess-17-2393-2013, 2013.
Harou, J. J., Pulido-Velazquez, M., Rosenberg, D. E., Medellín-Azuara, J., Lund, J. R., and Howitt, R. E.: Hydro-economic models: Concepts, design, applications, and future prospects, J. Hydrol., 375, 627–643, https://doi.org/10.1016/j.jhydrol.2009.06.037, 2009.
Harris, I.: CRU TS Version 4.06, Centre for Environmental Data Analysis (CEDA) [data set], https://crudata.uea.ac.uk/cru/data/hrg/cru_ts_4.06/ (last access: 15 January 2026), 2024.
Hejazi, M., Edmonds, J., Clarke, L., Kyle, P., Davies, E., Chaturvedi, V., Wise, M., Patel, P., Eom, J., Calvin, K., Moss, R., and Kim, S.: Long-term global water projections using six socioeconomic scenarios in an integrated assessment modeling framework, Technol. Forecast. Soc. Change, 81, 205–226, https://doi.org/10.1016/j.techfore.2013.05.006, 2014.
Howitt, R. E.: Positive Mathematical Programming, Am. J. Agric. Econ., 77, 329–342, https://doi.org/10.2307/1243543, 1995.
Hu, Y., Guo, W., Zhang, Y., Shen, Y., and Han, Z.: Analysis of the Evolution of Ice Regime in Ningxia-Inner Mongolia Reach of Yellow River from 2011 to 2020, Yellow River, 45, https://doi.org/10.3969/j.issn.1000-1379.2023.07.010, 2023a.
Hu, Y., Liu, J., Zhang, Y., Kang, Y., and Chen, D.: Study on Optimal Operation of Longyangxia and Liujiaxia Reservoirs in the Yellow River During Ice Flood Season, Yellow River, 45, https://doi.org/10.3969/j.issn.1000-1379.2023.08.016, 2023b.
International Food Policy Research Institute: Global Spatially-Disaggregated Crop Production Statistics Data for 2010 Version 2.0, Harvard Dataverse [data set], https://doi.org/10.7910/DVN/PRFF8V, 2019.
Kahil, M. T., Ward, F. A., Albiac, J., Eggleston, J., and Sanz, D.: Hydro-economic modeling with aquifer-river interactions to guide sustainable basin management, J. Hydrol., 539, 510–524, https://doi.org/10.1016/j.jhydrol.2016.05.057, 2016.
Kahil, T., Parkinson, S., Satoh, Y., Greve, P., Burek, P., Veldkamp, T. I. E., Burtscher, R., Byers, E., Djilali, N., Fischer, G., Krey, V., Langan, S., Riahi, K., Tramberend, S., and Wada, Y.: A Continental-Scale Hydroeconomic Model for Integrating Water-Energy-Land Nexus Solutions, Water Resour. Res., 54, 7511–7533, https://doi.org/10.1029/2017WR022478, 2018.
Kipkorir, E. C. and Raes, D.: Transformation of yield response factor into Jensen's sensitivity index, Irrigation and Drainage Systems, 16, 47–52, https://doi.org/10.1023/A:1015578829064, 2002.
Lawless, K. L., Garcia, M., and White, D. D.: Institutional Analysis of Water Governance in the Colorado River Basin, 1922–2022, Frontiers in Water, 6, https://doi.org/10.3389/frwa.2024.1451854, 2024.
Li, H., Zhang, Q., Singh, V. P., Shi, P., and Sun, P.: Hydrological effects of cropland and climatic changes in arid and semi-arid river basins: A case study from the Yellow River basin, China, J. Hydrol., 549, 547–557, https://doi.org/10.1016/j.jhydrol.2017.04.024, 2017.
Liu, C. and Cheng, L.: Analysis on Runoff Series with Special Reference to Drying up Courses of Lower Huanghe River, Acta Geographica Sinica, 55, 257–265, 2000.
Liu, J., Yang, H., Cudennec, C., Gain, A. K., Hoff, H., Lawford, R., Qi, J., de Strasser, L., Yillia, P. T., and Zheng, C.: Challenges in operationalizing the water–energy–food nexus, Hydrolog. Sci. J., 62, 1714–1720, https://doi.org/10.1080/02626667.2017.1353695, 2017.
Lyu, J., Zhao, M., Li, A., and Cheng, R.: Study on the current situation of urban water use and water demand forecasting in the Huang-Huai-Hai River Basin, Water & Wastewater Engineering, 48, 615–620, https://doi.org/10.13789/j.cnki.wwe1964.2022.02.24.0005, 2022.
Martinsen, G., Liu, S., Mo, X., Davidsen, C., Payet-Burin, R., and Bauer-Gottwein, P.: The Impact of Assuming Perfect Foresight in Hydroeconomic Analysis of Yellow River Diversions to the Hai River Basin, China: A Framework Combining Linear Programming and Model Predictive Control, Frontiers in Water, 3, 1–17, https://doi.org/10.3389/frwa.2021.648934, 2021.
Medellín-Azuara, J., Harou, J. J., and Howitt, R. E.: Estimating economic value of agricultural water under changing conditions and the effects of spatial aggregation, Sci. Total Environ., 408, 5639–5648, https://doi.org/10.1016/j.scitotenv.2009.08.013, 2010.
Medellín-Azuara, J., Howitt, R. E., and Harou, J. J.: Predicting farmer responses to water pricing, rationing and subsidies assuming profit maximizing investment in irrigation technology, Agric. Water Manag., 108, 73–82, https://doi.org/10.1016/j.agwat.2011.12.017, 2012.
Meng, X., Chang, J., Wang, X., Wang, Y., and Wang, Z.: Flood control operation coupled with risk assessment for cascade reservoirs, J. Hydrol., 572, 543–555, https://doi.org/10.1016/j.jhydrol.2019.03.055, 2019.
Mérel, P. and Howitt, R.: Theory and application of positive mathematical programming in agriculture and the environment, Annu. Rev. Resour. Economics, 6, 451–470, https://doi.org/10.1146/annurev-resource-100913-012447, 2014.
Molle, F., Wester, P., and Hirsch, P.: River basin closure: Processes, implications and responses, Agric. Water Manag., 97, 569–577, https://doi.org/10.1016/j.agwat.2009.01.004, 2010.
Peng, S., Zheng, X., Wang, Y., and Jiang, G.: Study on Water-energy-food Collaborative Optimization for Yellow River Basin, Advances in Water Science, 28, 681–689, https://doi.org/10.14042/j.cnki.32.1309.2017.05.005, 2017.
Peng, S., Wang, Y., Shang, W., Zheng, X., and Li, K.: Response of Synergetic Optimal Operation of Cascade Reservoirs to Drought in the Main Stream of the Yellow River, Advances in Water Science, 31, 172–183, https://doi.org/10.14042/j.cnki.32.1309.2020.02.003, 2020.
Price Division of National Development and Reform Commission of the People’s Republic of China: Compilation of National Income from Agricultural Products (2020), China Statistics Press, ISBN 9787509220283, 2021.
Pulido-Velazquez, M. and Tilmant, A.: Hydroeconomics, Oxford Research Encyclopedia of Environmental Science, Oxford University Press, 1–29, https://doi.org/10.1093/acrefore/9780199389414.013.686, 2022.
Qin, C., Qu, J., Sun, H., Li, H., and Jiang, S.: Construction and Application of Function Model for Urban Residents' Water Demand, South-to-North Water Transfers and Water Science & Technology, 20, https://doi.org/10.13476/j.cnki.nsbdqk.2022.0023, 2022.
Ringler, C., Cai, X., Wang, J., Ahmed, A., Xue, Y., Xu, Z., Yang, E., Zhao, J., Zhu, T., Cheng, L., Fu, Y., Fu, X., Gu, X., and You, L.: Yellow river basin: Living with scarcity, Water Int., 35, 681–701, https://doi.org/10.1080/02508060.2010.509857, 2010.
Rivera-Torres, M. and Gerlak, A. K.: Evolving together: transboundary water governance in the Colorado River Basin, Int. Environ. Agreem., 21, 553–574, https://doi.org/10.1007/s10784-021-09538-3, 2021.
Scanlon, B. R., Fakhreddine, S., Rateb, A., de Graaf, I., Famiglietti, J., Gleeson, T., Grafton, R. Q., Jobbagy, E., Kebede, S., Kolusu, S. R., Konikow, L. F., Long, D., Mekonnen, M., Schmied, H. M., Mukherjee, A., MacDonald, A., Reedy, R. C., Shamsudduha, M., Simmons, C. T., Sun, A., Taylor, R. G., Villholth, K. G., Vörösmarty, C. J., and Zheng, C.: Global water resources and the role of groundwater in a resilient water future, Nature Reviews Earth & Environment 2023, 4, 1–15, https://doi.org/10.1038/s43017-022-00378-6, 2023.
Shang, W., Peng, S., Wang, Y., Fang, W., Wu, J., and Xu, M.: Competition and Cooperation Relationship of Water Utilization in Water Shortage Basins: A Case Study of Yellow River Basin, Advances in Water Science, 31, 897–907, https://doi.org/10.31857/s0320930x20040088, 2020.
Sun, A., Zhu, S., Guo, Y., and Zhang, Z.: Jensen model and modified Morgan model for rice water-fertilizer production function, Procedia Eng., 28, 264–269, https://doi.org/10.1016/j.proeng.2012.01.717, 2012.
Thevs, N., Peng, H., Rozi, A., Zerbe, S., and Abdusalih, N.: Water allocation and water consumption of irrigated agriculture and natural vegetation in the Aksu-Tarim river basin, Xinjiang, China, J. Arid Environ., 112, 87–97, https://doi.org/10.1016/j.jaridenv.2014.05.028, 2015.
Tian, J., Guo, S., Deng, L., Yin, J., Pan, Z., He, S., and Li, Q.: Adaptive optimal allocation of water resources response to future water availability and water demand in the Han River basin, China, Sci. Rep., 11, 1–18, https://doi.org/10.1038/s41598-021-86961-1, 2021.
Trail, S. M. and Ward, F. A.: Uniting agricultural water management, economics, and policy for climate adaptation through a new assessment of water markets for arid regions, Agric. Water Manag., 305, https://doi.org/10.1016/j.agwat.2024.109101, 2024.
United Nations: The United Nations World Water Development Report 2023: partnerships and cooperation for water, 210 pp., ISBN 978-92-3-100576-3, 2023.
Wang, X.: Regional Differences and Efficiency Evaluation of Urban Residential Water Use in the Middle Reaches of the Yellow River, Water Res. Devel. Man., 8, 60–71, https://doi.org/10.16616/j.cnki.10-1326/TV.2023.08.11, 2023 (in Chinese).
Wang, Y., Peng, S., and Zheng, X.: Key Scientific Issues of Water Allocation Plan Optimization and Comprehensive Operation for Yellow River Basin, Advances in Water Science, 29, 614–624, https://doi.org/10.14042/j.cnki.32.1309.2018.05.002, 2018.
Wang, Y., Peng, S., Wu, J., Ming, G., Jiang, G., Fang, H., and Chen, C.: Review of the Implementation of the Yellow River Water Allocation Scheme for Thirty Years, Yellow River, 41, 6–13, 19, https://doi.org/10.3969/j.issn.1000-1379.2019.09.002, 2019a.
Wang, Y., Zhao, W., Wang, S., Feng, X., and Liu, Y.: Yellow River water rebalanced by human regulation, Sci. Rep., 9, 1–10, https://doi.org/10.1038/s41598-019-46063-5, 2019b.
Wang, Y., Peng, S., Wu, J., Chang, J., Zhou, X., and Shang, W.: Research on the Theory and Model of Water Resources Equilibrium Regulation in the Yellow River Basin, J. Hydraul. Eng., 51, 44–55, https://doi.org/10.13243/j.cnki.slxb.20190523, 2020.
Wang, Z. and Lou, J.: Some Thoughts on the Adjustment of Water Resources Allocation of “87 Scheme” of Yellow River, Yellow River, 44, 1–5, https://doi.org/10.3969/j.issn.1000-1379.2022.08.001, 2022.
Ward, F. A.: Hydroeconomic Analysis to Guide Climate Adaptation Plans, Frontiers in Water, 3, 1–26, https://doi.org/10.3389/frwa.2021.681475, 2021.
Ward, F. A., Booker, J. F., and Michelsen, A. M.: Integrated Economic, Hydrologic, and Institutional Analysis of Policy Responses to Mitigate Drought Impacts in Rio Grande Basin, J. Water Resour. Plan. Manag., 132, 488–502, https://doi.org/10.1061/(asce)0733-9496(2006)132:6(488), 2006.
Wei, X., Li, X., and Cai, B.: Problems of Ice Jam Flood in the Lower Reaches of the Yellow River after Xiaolangdi Reservoir Operating, J. Glaciol. Geocryol., 25, 241–244, 2003.
Wu, B., Wang, Z., and Li, C.: Yellow River Basin management and current issues, Supplement, J. Geogr. Sci., 29–37, https://doi.org/10.1007/BF02841104, 2004.
Wu, X., Wang, H., Bi, N., Xu, J., Nittrouer, J. A., Yang, Z., Lu, T., and Li, P.: Impact of Artificial Floods on the Quantity and Grain Size of River-Borne Sediment: A Case Study of a Dam Regulation Scheme in the Yellow River Catchment, Water Resour. Res., 57, 1–18, https://doi.org/10.1029/2021WR029581, 2021.
Xia, C. and Pahl-Wostl, C.: The Development of Water Allocation Management in The Yellow River Basin, Water Resour. Manag., 26, 3395–3414, https://doi.org/10.1007/s11269-012-0078-1, 2012.
Xu, H., Taylor, R. G., and Xu, Y.: Quantifying uncertainty in the impacts of climate change on river discharge in sub-catchments of the Yangtze and Yellow River Basins, China, Hydrol. Earth Syst. Sci., 15, 333–344, https://doi.org/10.5194/hess-15-333-2011, 2011.
Yan, D., Li, D., and Qiao, M.: Research on Reservoir Regulation Scheme for Ice Run Prevention of the Lower Yellow River, Yellow River, 34, 4–6, https://doi.org/10.3969/j.issn.1000-1379.2012.12.002, 2012.
Yang, X., Xu, J., Donzier, J. F., and Noel, C.: A comparison of the water management systems in France and China, Front. Environ. Sci. Eng., 7, 721–734, https://doi.org/10.1007/s11783-013-0550-z, 2013.
Yang, Y.-C. E., Zhao, J., and Cai, X.: Decentralized Optimization Method for Water Allocation Management in the Yellow River Basin, J. Water Resour. Plan. Manag., 138, 313–325, https://doi.org/10.1061/(asce)wr.1943-5452.0000199, 2012.
Yin, W. and Yi, C.: Empirical Analysis on the Competitiveness of Industrial Structure and Its improvement of Luoyang, China Population, Resources and Environment, 26, 2016.
Yin, Y., Tang, Q., Liu, X., and Zhang, X.: Water scarcity under various socio-economic pathways and its potential effects on food production in the Yellow River basin, Hydrol. Earth Syst. Sci., 21, 791–804, https://doi.org/10.5194/hess-21-791-2017, 2017.
Yin, Z., Ottlé, C., Ciais, P., Zhou, F., Wang, X., Jan, P., Dumas, P., Peng, S., Li, L., Zhou, X., Bo, Y., Xi, Y., and Piao, S.: Irrigation, damming, and streamflow fluctuations of the Yellow River, Hydrol. Earth Syst. Sci., 25, 1133–1150, https://doi.org/10.5194/hess-25-1133-2021, 2021.
YRCC: Executive Summary of the Yellow River Basin Comprehensive Planning 2012–2030, http://yrcc.gov.cn/zwzc/ghjh/202312/t20231220_365017.html (last access: 15 January 2026), 2015.
YRCC: Yellow River Water Resources Bulletin, http://yrcc.gov.cn/gzfw/szygb/202403/P020240321414822641155.pdf (last access: 15 January 2026), 2020.
YRCC: Yellow River Water Regulation Plan, http://yrcc.gov.cn/gzfw/yhgs/ (last access: 15 January 2026), 2025.
Yu, S.: Study on the path of population change in Henan Province to promote high-quality economic development, Contemporary Economics, 40, 75–84, 2023.
Yuan, X., Ma, F., Wang, L., Zheng, Z., Ma, Z., Ye, A., and Peng, S.: An experimental seasonal hydrological forecasting system over the Yellow River basin – Part 1: Understanding the role of initial hydrological conditions, Hydrol. Earth Syst. Sci., 20, 2437–2451, https://doi.org/10.5194/hess-20-2437-2016, 2016.
Zhai, J.: Functions of Sanmenxia Reservoir in Flood Control Engineering System of the Yellow River, Yellow River, 26, 8–9, 32, 2004.
Zhang, F. and Cheng, X.: China's industrial water demand price elasticity: Based on simultaneous equations model, Resources Science, 44, 583–594, https://doi.org/10.18402/resci.2022.03.12, 2022.
Zhang, Q., Liu, J., Singh, V. P., Shi, P., and Sun, P.: Hydrological responses to climatic changes in the Yellow River basin, China: Climatic elasticity and streamflow prediction, J. Hydrol., 554, 635–645, https://doi.org/10.1016/j.jhydrol.2017.09.040, 2017.
Zhao, Y., Wang, H., Wang, Y., Niu, Z., Hu, Q., Zhao, F., Suo, L., Xu, Z., and Chen, X.: Efficient Utilization and Optimal Allocation of Agricultural Water Resources in the Yellow River Basin, Chinese Journal of Engineering Science, 25, 158–168, https://doi.org/10.15302/j-sscae-2023.04.013, 2023.
Zheng, H., Zhang, L., Zhu, R., Liu, C., Sato, Y., and Fukushima, Y.: Responses of streamflow to climate and land surface change in the headwaters of the Yellow River Basin, Water Resour. Res., 45, 1–9, https://doi.org/10.1029/2007WR006665, 2009.
Zheng, H., Lyle, C., and Wang, Z.: A comparative study of flexibility in water allocation in the context of hydrologic variability, Water Resour. Manag., 28, 785–800, https://doi.org/10.1007/s11269-014-0515-4, 2014.
Zhou, F., Bo, Y., Ciais, P., Dumas, P., Tang, Q., Wang, X., Liu, J., Zheng, C., Polcher, J., Yin, Z., Guimberteau, M., Peng, S., Ottle, C., Zhao, X., Zhao, J., Tan, Q., Chen, L., Shen, H., Yang, H., Piao, S., Wang, H., and Wada, Y.: Deceleration of China's human water use and its key drivers, P. Natl. Acad. Sci. USA, 117, 7702–7711, https://doi.org/10.1073/pnas.1909902117, 2020.
Zhu, Q. and Sun, M.: Analysis of Horizontal Ecological Compensation Mechanism in the Yellow River Basin Based on Tax Revenue, Yellow River, 47, 24–29, 55, https://doi.org/10.3969/j.issn.1000-1379.2025.03.004, 2025.
Zhu, T., Marques, G. F., and Lund, J. R.: Hydroeconomic optimization of integrated water management and transfers under stochastic surface water supply, Water Resour. Res., 51, 3568–3587, https://doi.org/10.1111/j.1752-1688.1969.tb04897.x, 2015.