the Creative Commons Attribution 4.0 License.
the Creative Commons Attribution 4.0 License.
 | 13 Apr 2026
Diffuse sources of TFA: atmospheric and terrestrial inputs, retention and pathways at the catchment scale
Immanuel Frenzel
Dario Nöltge
Finnian Freeling
Michael Müller
Jens Lange
Trifluoroacetate (TFA) is a contaminant from various human sources. The degradation of fluorinated gases in the atmosphere leads to a ubiquitous input through precipitation. Degradation of certain agricultural pesticides and wastewater-borne pharmaceuticals adds to the amount of TFA pollution. Once released into the aquatic environment, TFA is nearly conservative due to its negative charge, high water solubility, and absence of degradation pathways. Consequently, TFA concentrations in the environment are constantly increasing, following the production of precursor substances. Previous studies suggested the accumulation of TFA in plants and its retention in organic soil. This knowledge, however, is based on a small number of environmental samples or laboratory experiments. Catchment-scale studies are so far missing. In particular, hydrological processes controlling the retention and mobilization of TFA are poorly understood. Therefore, we analyzed a two-year dataset of weekly water samples for major ions and isotope tracers with TFA in the mountainous Dreisam catchment (Black Forest, Germany). We sampled precipitation, the discharge of three nested catchments, and a hillslope spring. A balancing approach suggested that TFA was not permanently retained in forested headwaters. Therefore, we were able to estimate evapotranspiration in the sub-catchments from two years of TFA concentrations in streamflow. A correlation analysis using environmental tracers, combined with knowledge of runoff generation in the study catchment, suggested that previously retained TFA was flushed from soils under wet conditions, with subsurface stormflow serving as a primary transport path. These findings indicate that TFA concentrations in soils may be higher than average concentrations found in rain or streamflow. Hence, future research should focus on TFA retention in the unsaturated zone.
- Article
(19998 KB) - Full-text XML
- BibTeX
- EndNote


Trifluoroacetate (TFA) is a smaller member of the Per- and Polyfluorinated Substances (PFASs) and a degradation product of various anthropogenic fluorinated compounds. Ongoing emissions of fluorinated refrigerants have resulted in a ubiquitous input of TFA through precipitation (Franklin, 1993; Jordan and Frank, 1999; Berg et al., 2000; Freeling et al., 2020). In addition to atmospheric input, increased use of fluorinated plant protection products (PPPs) poses a terrestrial diffuse source of TFA (Scheurer et al., 2017; Arena et al., 2017; Bhat et al., 2022; Diehle et al., 2025). Furthermore, point sources such as industrial sites or municipal wastewater treatment plants (WWTP) contribute to the overall TFA pollution. Once released, TFA is persistent and highly mobile in the aqueous phase (Boutonnet et al., 1999). Its stability raises concerns about the potential for accumulation (Arp et al., 2024). Elevated TFA concentrations have been documented across various environmental media. For instance, Freeling et al. (2022) reported increasing TFA levels in the leaves and needles of four tree species over the last three decades in Germany, while Li et al. (2010) observed elevated TFA levels in soils. Notably, elevated and increasing concentrations of TFA have also been found in groundwater (Liang et al., 2023; Albers and Sültenfuss, 2024) and surface waters (Cahill et al., 2001; German Environment Agency, 2021; Cahill, 2022; Freeling and Björnsdotter, 2023). However, knowledge about TFA transport within environmental compartments remains limited. Two field studies investigated TFA retention and transport over a half-year study period (Berger et al., 1997; Likens et al., 1997). Forests retained TFA in soils (with retention rates between 10 %–20 % and 5 %–30 %) and in plants (5 %–20 % and 5 %–35 %), whereas retention observed in wetlands was significantly higher, ranging from 20 %–60 % for soils and 20 %–50 % for plants. This discrepancy suggests considerable variability in TFA uptake and retention between different ecosystems. Moreover, both studies were situated in the same area, which limits transferability. Furthermore, they relied on short measurement periods (half a year), and may have failed to capture longer-term processes.
Thus, we identify a general lack of comprehensive field studies concerning the accumulation, retention, and transport of atmospherically deposited TFA at the catchment scale. This gap extends to terrestrial TFA input from agriculture, since recent meta-analyses relied on sales data, estimated application masses, and hypothetical transformation rates to derive potential TFA contributions from PPPs for European countries and the contiguous USA (German Environment Agency, 2023; Joerss et al., 2024). Although TFA formation from some PPP has been proven in theory, it remains unknown if agricultural TFA plays a notable role in a catchment's TFA balance. To address the fate and transport of TFA from terrestrial and atmospheric sources, we created a two-year dataset of TFA concentrations and loads in different environmental compartments. We chose the mesoscale Dreisam River Catchment (DRC) as our study area, because its hydrological processes have an extensive history of research (Hoeg et al., 2000; Hangen et al., 2001; Uhlenbrook, 1999; Seibert et al., 2000; Uhlenbrook et al., 2002; Uhlenbrook and Leibundgut, 2002; Wenninger et al., 2004; Lange and Haensler, 2012). For two consecutive years, we took weekly samples of precipitation at a weather station, in stream water of three nested catchments and in a hillslope spring.
First, we correlated TFA dynamics in river and spring discharge with major ions and stable water isotopes. Together with existing knowledge on runoff generation processes, we gained insights into the transport processes of TFA. Second, we applied a balancing approach in the headwaters, which are free of arable land. This enabled us to determine the amount of retained TFA in natural catchments. Third, we compared the TFA balance in the main catchment with mixed land use to the agricultural-free sub-catchments, acquiring insights into a potential impact of agriculture on the TFA balance. Finally, we elucidated the potential of catchment-scale TFA data to estimate actual evapotranspiration (ET). We aimed to answer the following research questions:
-
Do atmospheric TFA inputs accumulate in catchments devoid of arable land?
-
Are terrestrial TFA inputs from agriculture relevant?
-
Which pathways dominate TFA transport?
-
How reliable are ET estimates from TFA?
2.1 The Dreisam river catchment (DRC)
The 257 km2 DRC (Fig. 1) is located in the southern Black Forest, Baden-Württemberg, Southwest Germany. The mean annual air temperature ranges from 4.5 °C at the mountain peak of the Feldberg (1493 m a.s.l.) to 10.7 °C at the catchment outlet (309 m a.s.l.) in Ebnet, located in the eastern part of the city of Freiburg. Annual precipitation increases from 955 mm in the city of Freiburg to 1900 mm at the Feldberg (Fuchs et al., 2001). Bedrock consists of crystalline rocks, mainly granite and gneiss, overlain by unconsolidated glacial and periglacial drift covers of varying thickness. This loose material has led to the development of cambisols, with bedrock outcrops appearing at various locations (Tilch et al., 2002). The DRC comprises two distinct topographical units: (i) The lower part is characterized by the Dreisam Valley (315–460 m a.s.l.), a flat valley filled with glacial deposits up to 50 m thick. Here, land use is a mix of settlements and agricultural land, with winter wheat and silage corn as the dominant crops. Arable land accounts for 2 % of the total catchment area (CORINE Land Cover, 2018). The Ebnet waterworks, located in the lower Dreisam Valley, abstract 9 million m3 of groundwater per year to supply the city of Freiburg. Additional groundwater export from the aquifer below the Dreisam gauge was estimated at 60 mm (Didszun and Uhlenbrook, 2008). (ii) The mountainous Black Forest surrounding the Dreisam Valley is typified by the 40 km2 Brugga sub-catchment. Here, 75 % of the area is covered by steep, forested slopes with inclinations of up to 62°. Grazing is limited to rounded mountaintops (20 % of the area) and narrow valley floors (5 %). The Brugga sub-catchment encompasses the 15.2 km2 Talbach sub-catchment, which is largely designated as a nature conservation area.
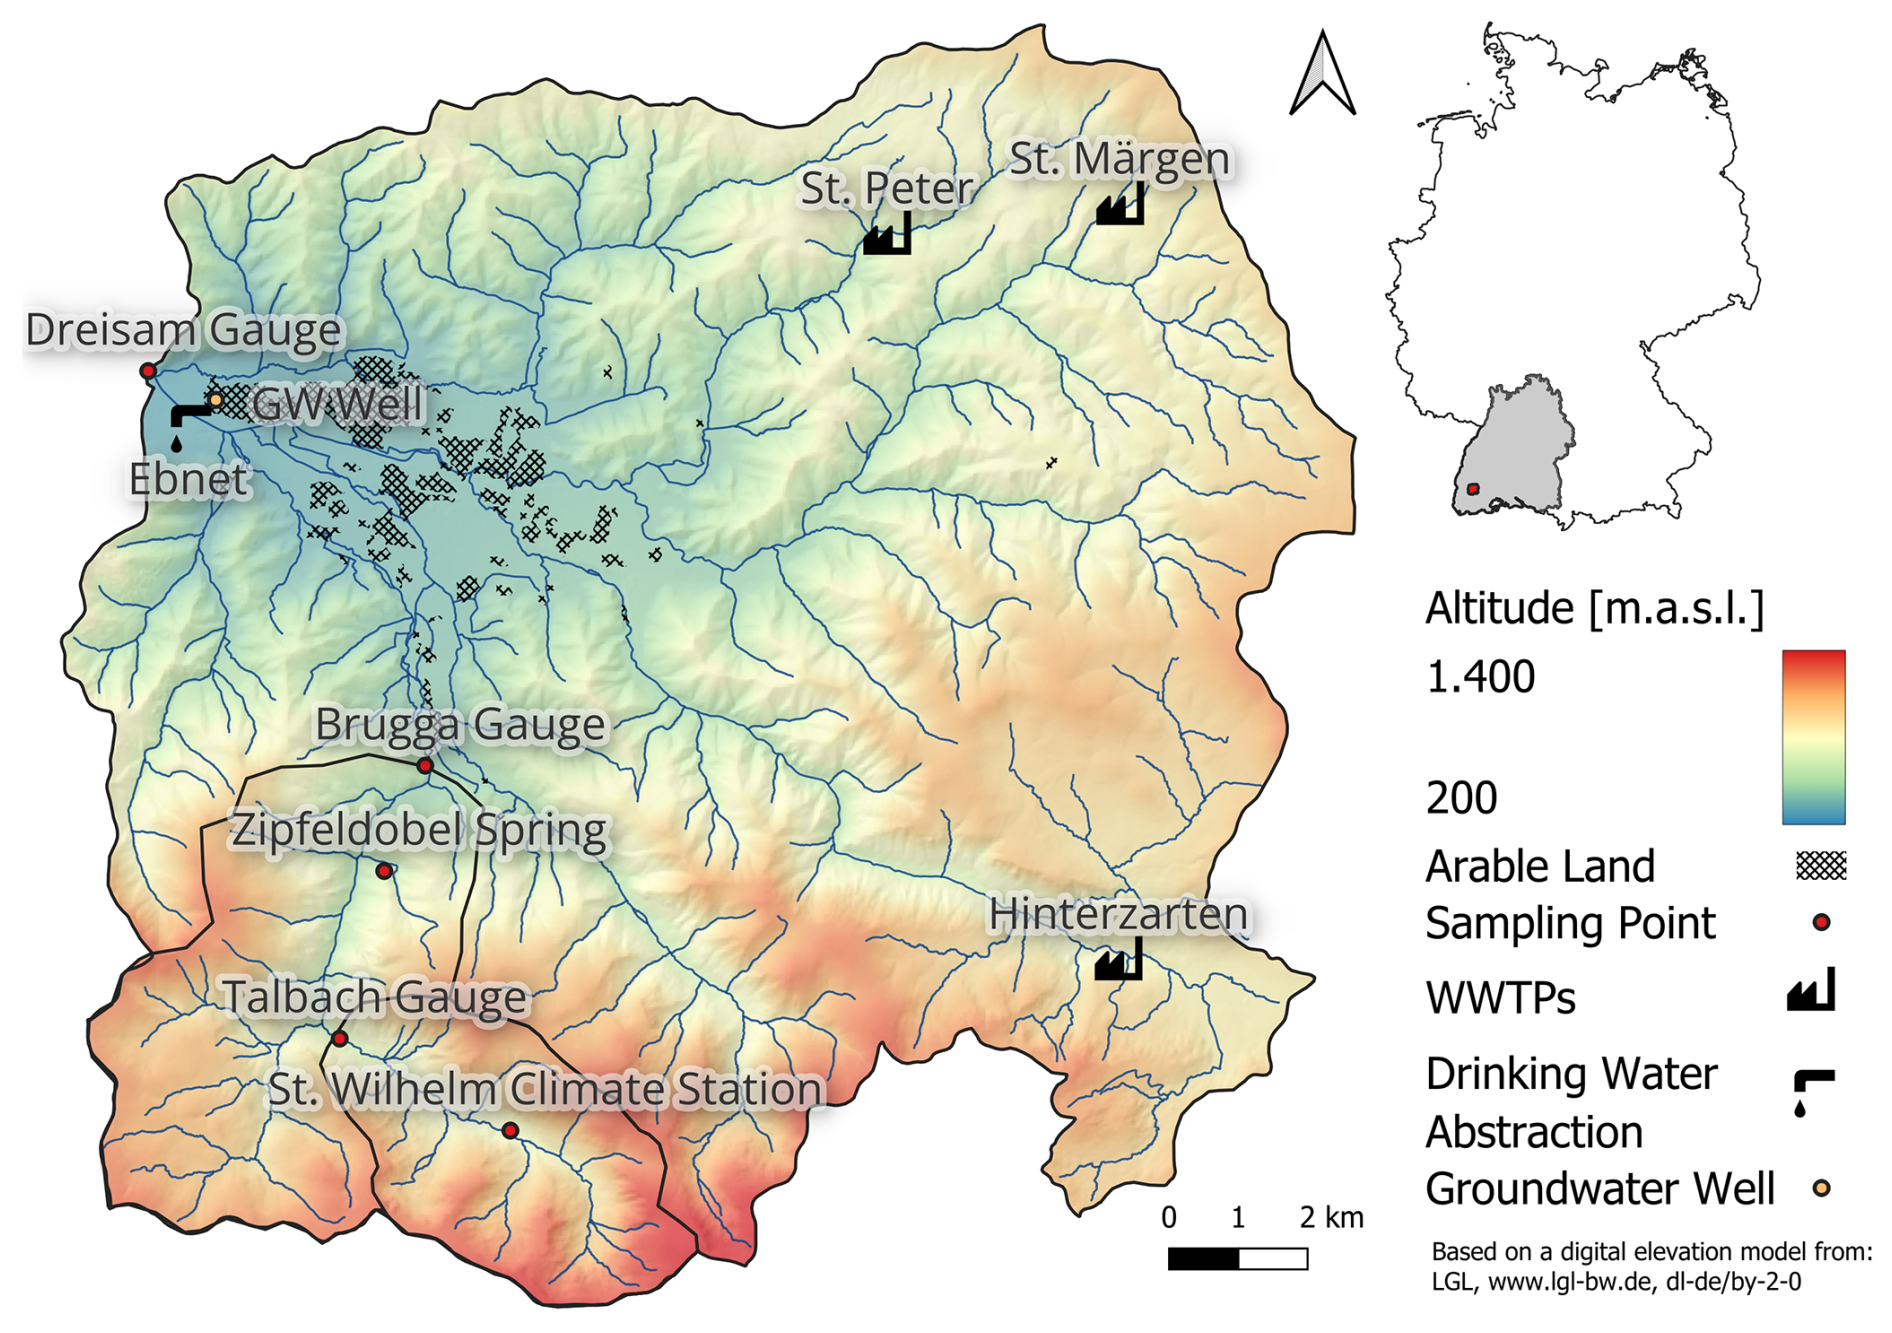
Figure 1The Dreisam catchment: sampling locations and sites with potential TFA input.
2.2 Hydrological Processes in the DRC
TFA is a highly mobile anion whose transport is closely linked to hydrological pathways. We correlated TFA concentrations to environmental tracer data indicative of the active flow system. Three main streamflow components originating from different runoff generation processes were identified in the DRC by chemical (major ions, silica, and chlorofluorocarbons – CFCs, namely freons F-11, F-12, and F-113) and isotopic tracers (2H and 18O) (Uhlenbrook et al., 2002).
The first component is event water, which may account for up to 50 % of streamflow during storm events. It is generated by Hortonian Overland Flow (HOF) from impervious surfaces, such as roads, rock outcrops, or urban areas, and by Saturation Overland Flow (SOF) from saturated areas, including wetlands and riparian zones. Furthermore, Subsurface Storm Flow (SSF), which was observed in the steep hillslopes, also carries an event water component (Bachmair and Weiler, 2014). SSF occurs when a network of pores interconnects to a system of hydrological flow paths that respond to precipitation according to its connectivity. Connectivity is dependent on soil moisture, and therefore, the intensity of SSF is dependent on both pre-event conditions and the magnitude of the event. Although event water may travel rapidly through SSF, a considerable portion of the mobilized water consists of “old” water already present in the flow system (Kienzler and Naef, 2008). In terms of magnitude, SSF is the dominating process of storm discharge generation when compared to HOF and SOF (Steinbrich et al., 2016). We refer to the sum of the quick runoff components (surface runoff and SSF) as quick flow in the following manuscript.
The second component is shallow groundwater from the hillslopes, exhibiting an estimated mean transit time of approximately 2 to 3 years. Shallow groundwater accounts for the major fraction (approximately 70 %) of runoff in the Brugga sub-catchment. It is exemplified by the Zipfeldobel spring, which primarily consists of this component and was an additional sampling point.
The third component is deep groundwater originating from the crystalline bedrock, with an estimated mean transit time of approximately 6 to 9 years. This component contributes to approximately 20 % of the overall streamflow, but its proportion increases during prolonged drought periods (Uhlenbrook et al., 2002).
Additionally, Wenninger et al. (2004) observed the effects of piston flow. They found that rapidly moving water from hillslopes exerted pressure on a shallow, confined valley aquifer, pushing old water into the Talbach. However, such conditions only prevail in valleys that were glaciated during the last ice age. These areas comprise only a small part of the upper Brugga catchment, and we do not consider this process to play a significant role in streamflow generation within the entire DRC.
2.3 Sources of TFA in DRC
Atmospheric TFA is a transformation product of volatile organic precursor molecules such as HFC-134a and HFO-1234yf, and reaches the earth's surface through wet deposition (Freeling et al., 2020; Franklin, 1993). Those gases are typically used as refrigerants, e.g., in automobile air conditioning systems. TFA concentrations are higher in samples from smaller precipitation events. Therefore, volume weighting is necessary to obtain representative mean precipitation concentrations.
Furthermore, atmospheric TFA deposition is higher during the summer (Freeling et al., 2020); therefore, measurements of at least one year are required to account for seasonality. In the DRC, we measured precipitation input at the St. Wilhelm climate station over two years.
In the DRC, most arable land is located in the Dreisam valley near the catchment outlet (Fig. 1). There, in addition to the ubiquitous atmospheric input, TFA can additionally be released from agricultural activities:
- i.
Pesticides are fluorinated compounds that may contain carbon-bound –CF3 groups and potentially degrade to TFA (Scheurer et al., 2017; Sun et al., 2020). The surge in the use of such pesticides (Ogawa et al., 2020; Alexandrino et al., 2022) could result in high TFA releases from agricultural areas.
- ii.
Agricultural land receives additional TFA inputs from organic fertilizers. Concentrations of TFA in liquid manure and biogas digestate range between tens and hundreds of µg L−1 (German Environment Agency, 2023). This is due to the accumulation of TFA in plants and foodstuffs (Ghisi et al., 2019; Scheurer and Nödler, 2021). Spreading of organic fertilizers is prohibited in Europe during winter (Liu et al., 2018) and pesticides are mainly applied during the growing season. Hence, the input pattern of pesticides and liquid manure presumably follows the annual pattern of atmospheric TFA deposition. Since data on the exact amounts of applied pesticides and manure are missing, we quantified the relevance of diffuse TFA input from agriculture through a mass balance using weekly TFA concentrations in the Dreisam River and samples from the aquifer beneath.
Scheurer et al. (2017) measured elevated TFA concentrations in the effluents of wastewater treatment plants (WWTPs). Three small WWTPs with a capacity of 14 650 population equivalents are located in the DRC, discharging on average about 17 L s−1 (see Fig. 1). We sampled all three WWTP effluents to quantify the TFA introduced into the Dreisam river through wastewater.
Apart from precipitation, agriculture, and wastewater, the direct release of TFA from fluorochemical industries is reported in the literature (Scheurer et al., 2017). Since no such sites are located in the Dreisam catchment, this source was not considered in this study.
2.4 Sample Collection
We collected weekly streamflow samples from the river at a fixed position with turbulent flow. On the same day, we retrieved precipitation samples: rainwater was stored in a tank located below the funnel, which was emptied after sampling. The tank, funnel, and connecting tube (0.82 m) were composed of polyethylene (PE). We blank-tested the PE material to exclude any contamination. Because TFA is a small, negatively charged ion, we assumed sorption to the precipitation sampling setup to be negligible. The setup allowed the tank to be placed in the high grass to keep temperatures low. Furthermore, the tank was protected with a black rubber mat to minimize evaporation, shielding it from solar radiation. Evaporation protection was necessary because the funnel was permanently left open to allow additional dry deposition sampling. Furthermore, we obtained weekly grab samples from the hillslope spring. All samples (n=479) were filled in 100 mL brown glass bottles for major ion analysis and stored at 4 °C in the dark for up to three weeks. The same number of TFA samples was collected in parallel in 50 mL polypropylene centrifuge tubes (Greiner, Kremsmünster, Austria) for subsequent analysis. Samples were stored in the dark and at room temperature (15–20 °C) for up to four months. Numerous reanalyses of three samples over one year (n=22) suggest that TFA concentrations remained stable during storage, which is also supported by the reanalysis of samples stored over several decades in current literature (Henne et al., 2025). The Ebnet waterworks collected groundwater samples from eight deep wells penetrating the Dreisam Valley aquifer. Drinking water in the eastern part of the city of Freiburg is supplied by the same wells. Therefore, we compared the mean TFA value from the wells to drinking water values. The comparison suggested that groundwater TFA levels remained relatively constant over the two-year study period but might exhibit seasonal variability (2024 – January: 0.81 µg L−1, 2024 – November: 0.64 µg L−1, 2025 – April: 0.84 µg L−1). To account for seasonality, we set the error in the groundwater TFA concentration to 30 % to ensure that this uncertainty is reflected in the results. Considering the relatively short sampling period, we emphasize that we cannot make any statements about long-term TFA trends in groundwater. Three effluent samples were collected from the WWTPs in St. Peter, Hinterzarten, and St. Märgen to determine the WWTPs' inputs. A detailed description of all sampling sites is provided in Table A1. We measured conductivity (C), water temperature (T), and pH using handheld meters (LF325, pH330, WTW, Weilheim, Germany) during sampling in the rivers Dreisam and Brugga, as well as in the Zipfeldobel spring. At the River Talbach, no measurements were taken due to the site's inaccessibility.
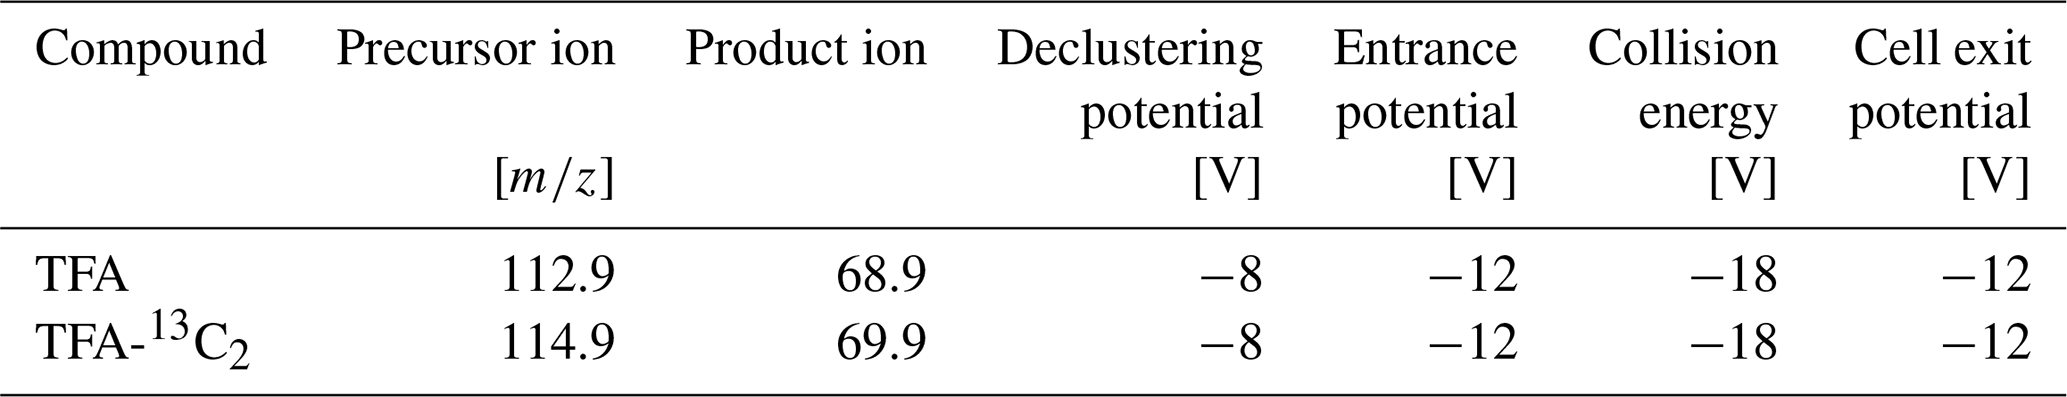
2.5 High-Pressure Liquid Chromatography-Tandem Mass Spectrometry (HPLC MS/MS) TFA Analysis
Samples were transferred into 1.5 mL Eppendorf tubes and centrifuged for 15 min at 18 000 g (Centrifuge 5417, Eppendorf, Germany). A 1 mL aliquot was transferred into LC vials (Isera Düren) and moved to the pre-cooled (4 °C) Autosampler. Ion exchange liquid chromatography-electrospray tandem mass spectrometry (LC-ESI MS/MS) analysis was performed using a Shimadzu LC-AD20 coupled with API 5500 Q Trap triple-quadrupole mass spectrometer (Applied Biosystems/MDS Sciex Instruments, Concord, ON, Canada). The electrospray interface operated in negative ionization mode (see Table 1 for MS conditions). The injection volume was set to 50 µL, with separation performed on an IonPac AS17-C column (2 × 250 mm) and an IonPac AG17-C guard column (2 × 50 mm) (both from Thermo Fisher Scientific, Waltham, USA), which are optimized for separating small anionic molecules like TFA. The column compartment was kept at 40 °C and a flow rate of 0.28 mL min−1. The analysis was conducted using an ultra-pure water solution containing 50 mM ammonium hydrogen carbonate (Honeywell Fluka™) (A) and methanol (ROTISOLV® ≥ 99.98 %, Ultra LC-MS Grade Carl Roth) (B) as eluents. The used columns were pre-equilibrated with the starting conditions of 20 % A, and all samples were analyzed using the following gradient: 20 % of eluent A (0–1 min), 20 %–50 % A (1–10 min), 50 %–20 % A (11–16 min). This gradient was sufficient for efficient binding and elution of TFA. Calibration was performed using a precisely prepared dilution series of TFA standards (pure trifluoracetic acid, Sigma-Aldrich) in ultra-pure water. UltraPure H2O (18.2 MΩ cm) was prepared in-house with a Milli-Q® Direct Water Purification System (Thermo-scientific®). For more details on this method, see Scheurer et al. (2017).
Samples were measured in duplicate from the same vial and averaged, with a mean relative standard deviation of 1.9 % over all duplicates, calculated as described in Synek (2008). Each sampling batch (n=12) included two MilliQ® blanks, prepared with the same procedure as the other sample in the batch to ensure the purity of the chemicals used, as well as at least three in-house standard samples (0.2, 0.29, 0.45, 0.5, 1.5, 3, and 6 µg L−1) to ensure reproducibility (mean absolute percent error, MAPE, 8 %). To prevent contamination from the LC-MS system, we measured MilliQ®-blanks until the background levels were below 20 ng L−1 before each batch. A limit of quantification (LOQ) of 0.08 µg L−1 was determined according to DIN 32645 from the standard deviation (SD) of blank values.
Because contamination during sample preparation is a concern, all used laboratory equipment (for example, Falcon tubes, Tips, and Eppendorf tubes) was washed with UltraPure H2O and/or Ultrapure MeOH and analyzed by the method described above. None of the laboratory equipment used showed relevant background levels of TFA. Consequently, blank correction of the analytical results was not necessary.
2.6 Ion Chromatography (IC) Major Ions and Cavity Ring down Spectrometry (CRDS) Isotope Analysis
From the 100 mL glass bottles, 5 mL aliquots were filtered using 0.45 µm syringe Millipore filters (VWR, Darmstadt, Germany) and analyzed for major anions (chloride, nitrate, sulfate) and cations (sodium, potassium, magnesium, calcium) via ion chromatography (DIONEX ICS-1100, Thermo Fisher Scientific, Waltham, USA). For separation, we used an IonPac AS17-C column (4 × 250 mm) and an IonPac AG17-C guard column (4 × 50 mm) (both from Thermo Fisher Scientific, Waltham, USA). Thermo Fisher Scientific reported a precision of 5 % and an LOQ of 1 mg L−1 for the IC system. Actual LOQ values, calculated analog to the TFA LOQ, were below the supplier-defined ones (Na+ 0.83, K+ 0.18, Mg2+ 0.026, Ca2+ 0.15, Cl− 0.66, NO 0.126, SO 0.188, all mg L−1). Additionally, 1 mL aliquots were analyzed for stable isotopes using Cavity Ring-Down Spectroscopy with a L2130i System (Picarro, Santa Clara, USA), achieving supplier-defined precisions of 0.16 ‰ for 18O and 0.6 ‰ for deuterium.
2.7 Analysis of the TFA Time Series
We obtained 30 years of 15 min discharge data from the Regional Council Freiburg for the Brugga River and from the State Institute for Environment Baden-Württemberg (LUBW) for the Dreisam. For the Talbach, only historical discharge data (daily resolution, 1980–2009, also from LUBW) were available. The historical Talbach discharge data showed a high correlation (R2=0.92) with the Brugga discharge. We therefore used Brugga discharges to obtain a recent Talbach discharge timeseries by linear interpolation. At Zipfeldobel, a flow meter (IFC 010 System, KROHNE, Duisburg, Germany) was installed in 2014 to log average discharge every 10 min. Flow meter data gaps (37 % of all flow readings) were filled by linear interpolation after adding weekly manual discharge measurements to the data to bridge longer intervals with no data (see Fig. B1). This allowed us to calculate annual discharge values in years with extended flow meter downtime, thereby obtaining a more accurate value as described in the following section. Regarding the analysis of the timeseries, the flow meter was operational for most of the hydrological years 2023 and 2024; however, there is a data gap of two months in August and September 2024. Weekly precipitation amounts were collected at the St. Wilhelm Climate Station. Hourly precipitation volumes were logged by a tipping bucket setup at the same station and aggregated to daily values. To ensure accurate data from the tipping bucket setup, we calibrated the data using the manual samples. Data gaps were filled with data from a nearby station without prior interpolation (DWD-Buchenbach, distance ∼ 5 km). First, we visually inspected our time series and compared discharge, precipitation, and TFA concentrations during runoff events. Two time periods were selected to analyse the influence of dry and wet conditions: 15 September to 30 November 2023 and 9 August to 20 October 2024. We correlated TFA concentrations with water temperature and discharge, major ions, pH, and isotopic tracer concentrations to gain insights into the active flow system and the source areas of TFA. We utilized the correlation_matrix function from the R-package Hmisc (Harrell, 2024) to calculate the Pearson correlation coefficients and determine the corresponding significance levels (p-values).
2.8 TFA Import and Export
We calculated annual water in- and outputs for all catchments, covering the hydrological years 2023 and 2024, from 1 November to 31 October, and for the whole sampling period. Precipitation volumes were extracted from the HYRAS precipitation interpolation product for all catchment areas with a one square kilometer spatial resolution (Rauthe et al., 2013). HYRAS corrects for wind and wetting errors at the precipitation sampling stations before interpolation. To reduce noise and interpolation artifacts, we calculated the mean of nine cells surrounding the pixel at the Zipfeldobel spring. The catchment areas necessary for extraction at Talbach, Brugga, and Dreisam were obtained from the LUBW. The water balance method estimated the springs' theoretical catchment area size (AZI, mm2) from 10 years of annual discharge (QZI, mm3), HYRAS-precipitation (P, mm) and (ETZI, mm):
For the calculation, we estimated evapotranspiration (ET) at Zipfeldobel from the 600 mm Brugga catchment average (Uhlenbrook et al., 2002) and reduced according to (Liu et al., 2012) for a north-facing slope of 30° to 300 ± 100 mm to fit the conditions uphill of the spring. Annual discharge volumes were calculated as the mean from discharge data at Zipfeldobel, Talbach, Brugga and Dreisam. Because the Dreisam discharge gauge is located above the Dreisam aquifer, water exits the catchment as groundwater below the gauge. Groundwater flow (QGW, m3) was estimated using Darcy's Law, from the hydraulic conductivity (kf, m s−1), the hydraulic potential gradient (, dimensionless), and the water-filled cross-sectional area of the aquifer (A, m2):
Appendix C provides details on groundwater flow calculation. In the Brugga and Talbach catchments, groundwater flow could be excluded due to a lack of significant aquifers beneath the gauges. The input and output masses for each catchment (m, kg) are calculated according to Eqs. (3)–(4), assuming no transfer of ionic substances to the vapor phase. Hereby, VS (L) is the stream discharge and VGW (L) the groundwater outflow in the given time interval. cS (µg L−1) is the flow-weighted mean TFA concentration in streamflow (Qi, L s−1) (Eq. 5). cP (µg L−1) is the precipitation volume (P, L) weighted mean concentration, and cGW (µg L−1) is the mean groundwater TFA concentration of eight deep wells, which we assumed to be constant (Eq. 6).
The input and output masses were calculated for the hydrological years 2023 and 2024, as well as for the entire two-year sampling period, along with the corresponding weighted mean concentrations and volumes.
2.9 Calculating ET based on TFA-concentrations
Assuming that TFA is not permanently retained, we calculated ET based on the two-year weighted mean TFA concentrations in discharge and precipitation, as well as the mean TFA concentration from eight groundwater wells, along with the 30-year mean annual streamflow (QS, mm) (only 10 years for Zipfeldobel Spring) and groundwater outflow (QGW, mm) (Eq. 7).
We compared the TFA-based ET with the difference between precipitation input and runoff output from a 30-year water balance to test the feasibility of this method.
2.10 Error Estimation
We propagated the error of the individual measurements through the calculations described in the chapter above. Appendix H describes the error propagation calculations in detail.
3.1 Visual analysis of two years' time series
From the two-year TFA time series of the St. Wilhelm climate station, Zipfeldobel Spring, the Brugga, Talbach, and Dreisam Rivers, we observed the following (Fig. 2):
-
TFA levels in precipitation exhibited a seasonal pattern, with high values in summer and lower levels in winter.
-
Despite low TFA levels in precipitation, high TFA levels were observed in the Dreisam River during winter.
-
TFA concentrations increased with discharge, particularly noticeable in the Dreisam River. This effect was also evident in the Brugga and Talbach Rivers, but less distinct at the Zipfeldobel Spring. We also refer to Table 2 where correlations and significance levels are listed. The discharge-TFA correlation was statistically significant at Dreisam and Brugga (p≤0.001), but not at the Zipfeldobel Spring.
-
At the end of drought periods in early November 2023 and October 2024, TFA concentrations in the Dreisam reached levels comparable to those in the Zipfeldobel Spring and the Brugga and Talbach Rivers.
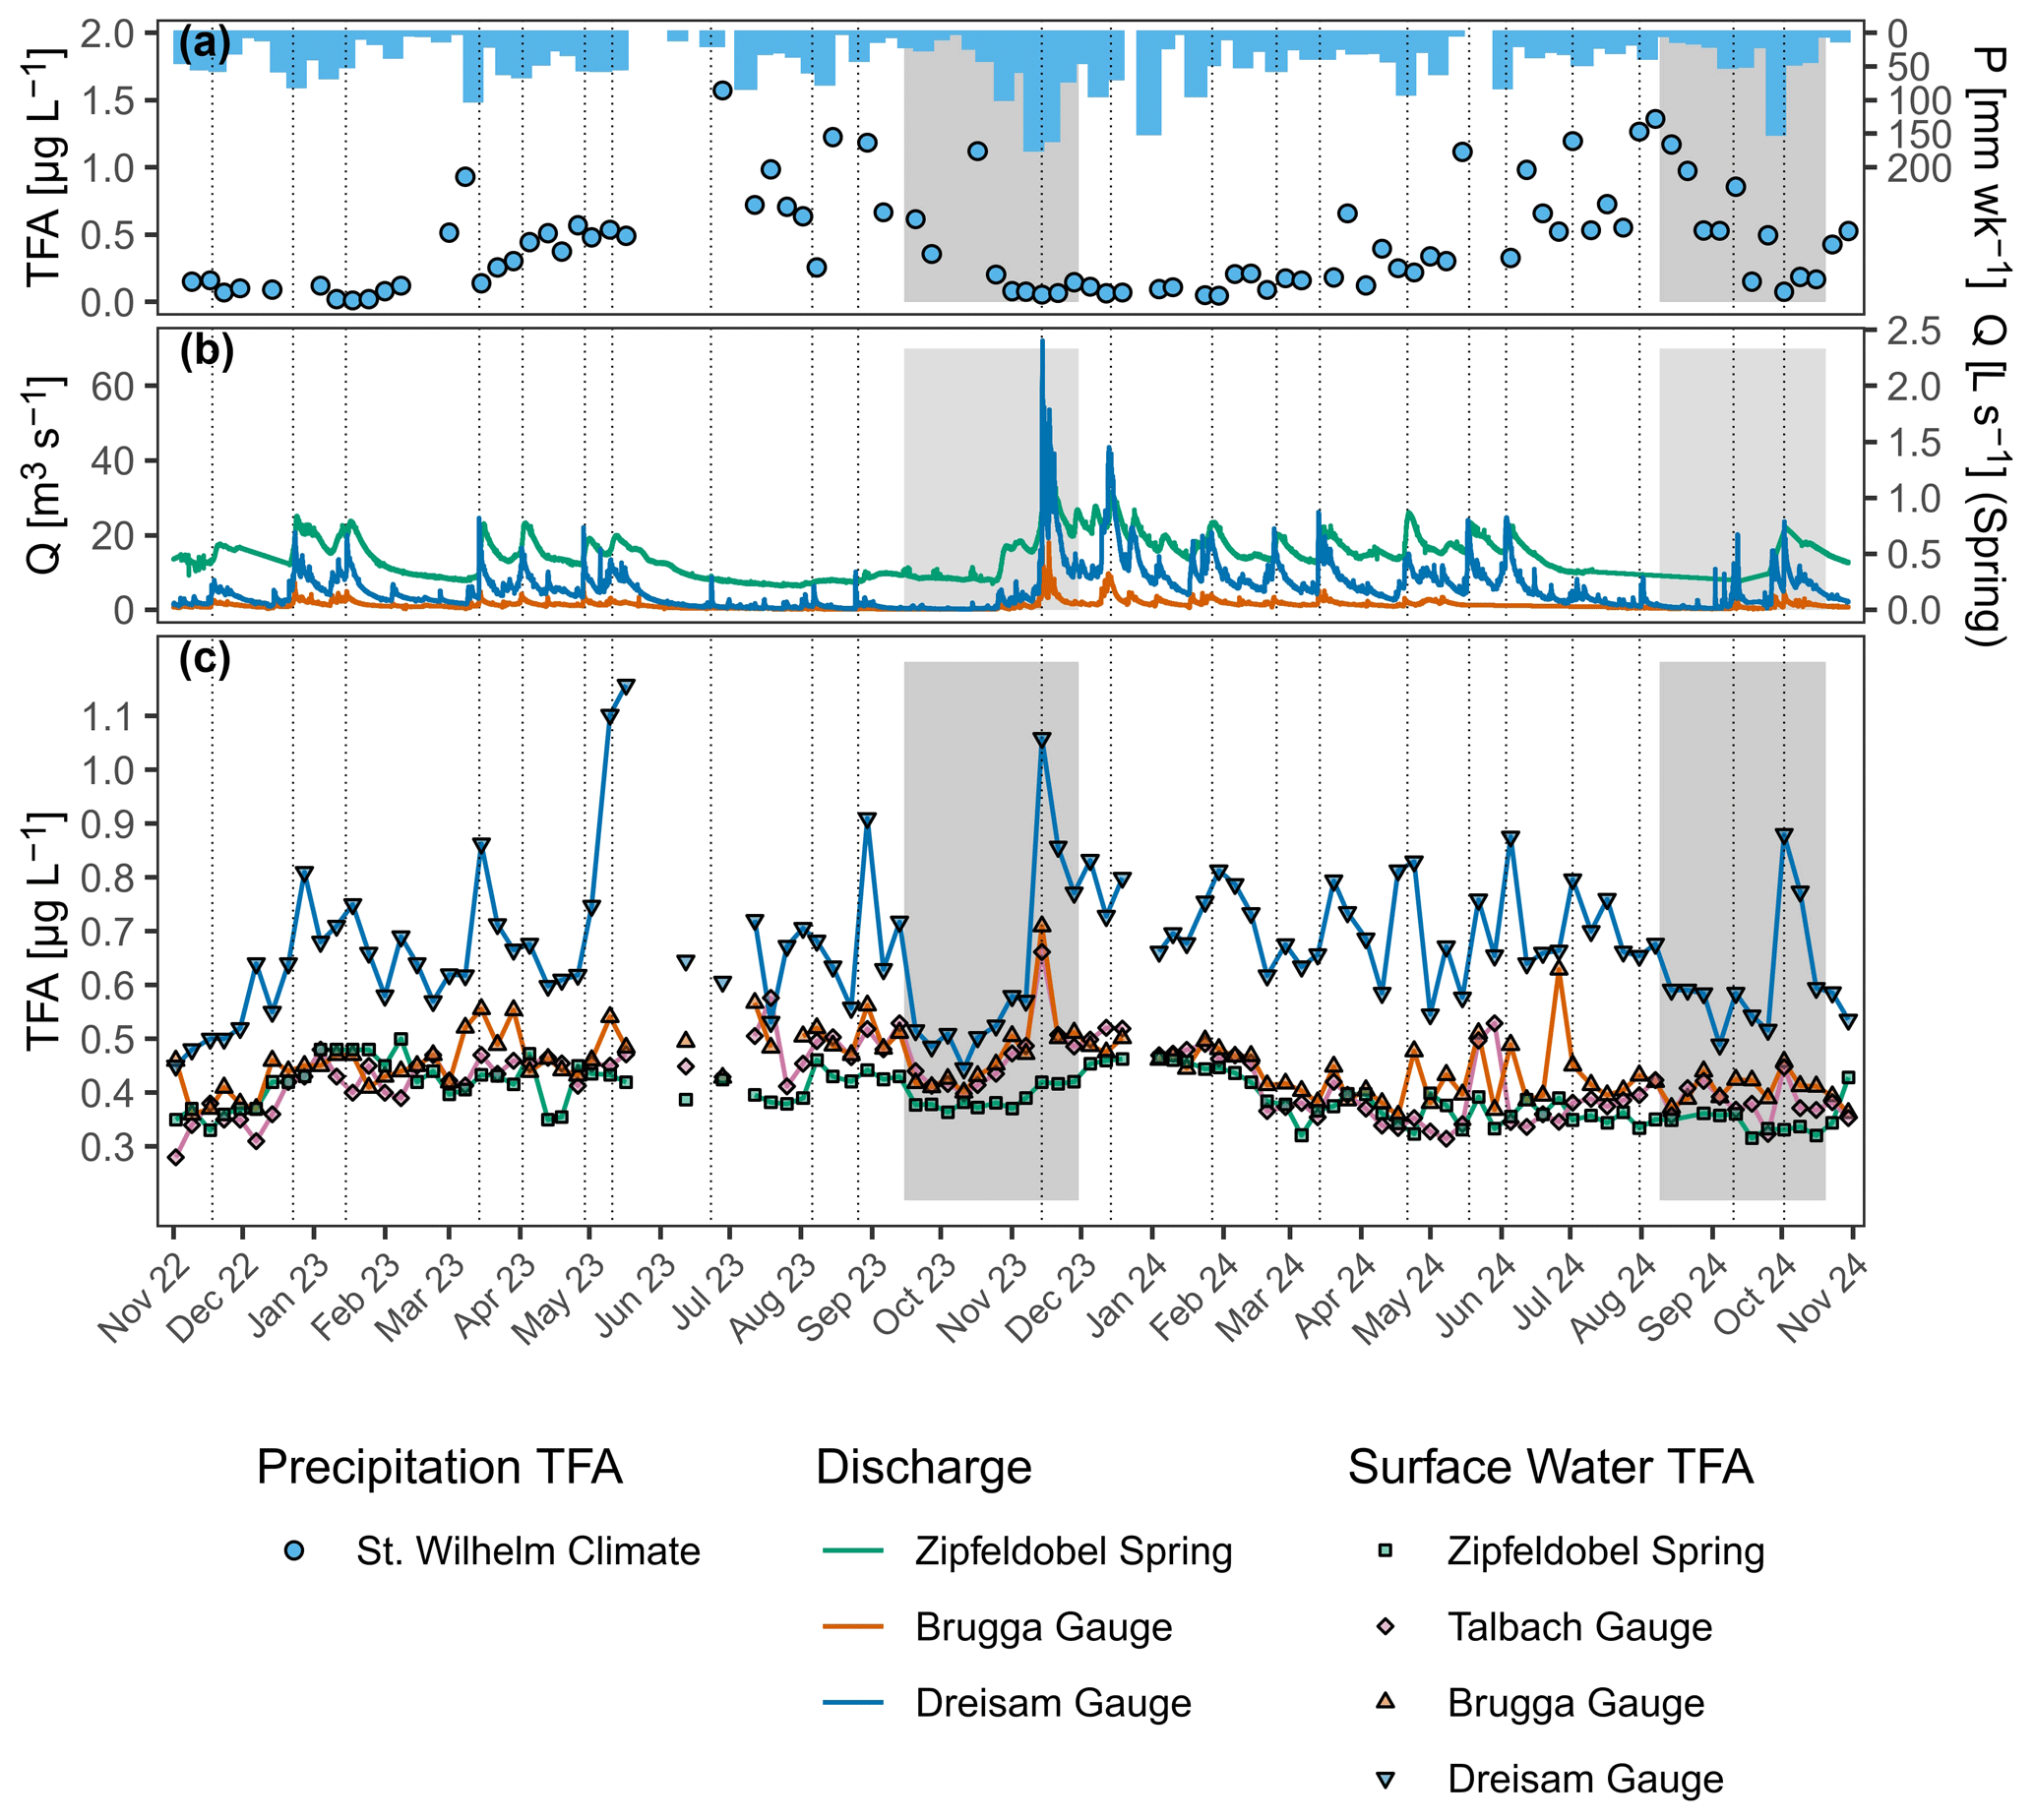
Figure 2Time series of precipitation, discharge, and TFA concentrations. Grey areas, showing changes from dry to wet conditions, are highlighted in Fig. 3. (a) Weekly precipitation is plotted against the corresponding weekly TFA concentration in rainwater at the St. Wilhelm station. (b) Dreisam, Brugga, and Zipfeldobel Spring discharge. (c) Weekly TFA concentration measurements in four surface waters of the DRC. Vertical dotted lines indicate discharge events.
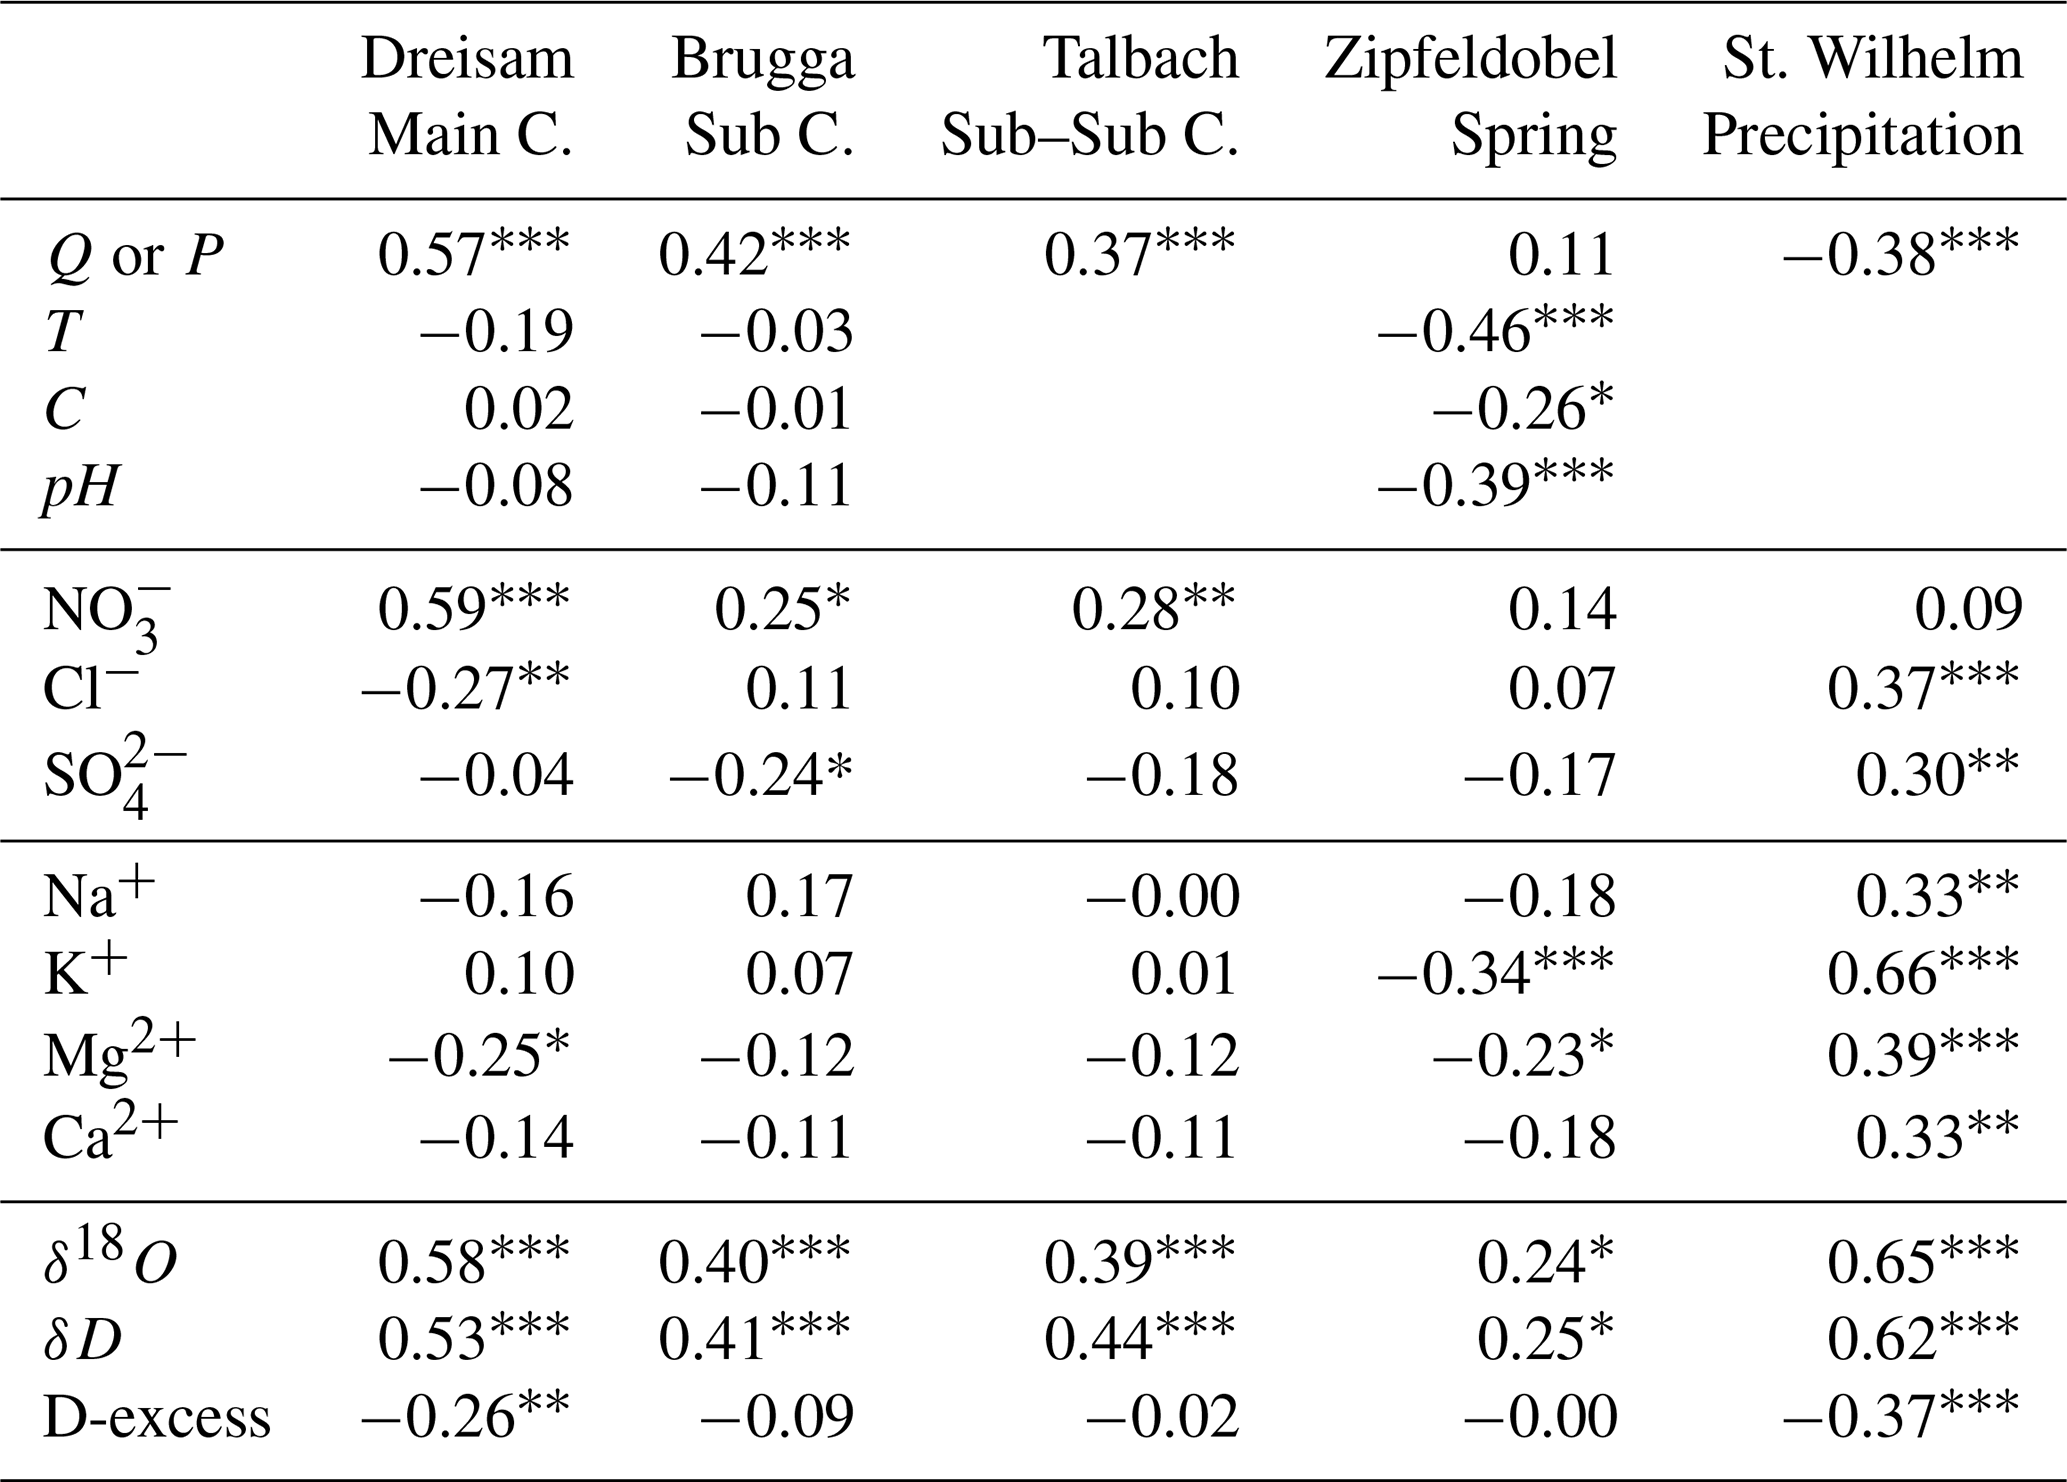
Table 2Pearson correlation coefficients of water parameters with TFA concentrations. Stars indicate the significance levels with * p≤0.05, p≤0.01 and p≤0.001.
3.2 Events with changing flow conditions
We selected two time periods to understand changes in TFA streamflow levels under varying flow conditions (see Fig. 3). Both periods transitioned from low-flow to high-flow conditions. In 2023, increasing precipitation depleted of TFA (a), resulted in increased discharge (b) and TFA levels (c) in the Dreisam, Brugga, and Talbach rivers. The springs' discharge reaction was delayed, and TFA levels remained almost constant. However, when discharge increased markedly on 14 November, TFA spiked in all streams. The highest TFA concentration was observed in the Dreisam River. Talbach and Brugga showed less pronounced TFA spiking. In 2024, minor precipitation events (d) resulted in a slight increase in discharge (e), which led to a corresponding rise in TFA levels on 11 September. Until the next major precipitation event on the 25 September, TFA levels decreased concurrently with discharge. The precipitation event then led to a doubling of TFA concentrations in the Dreisam River, but only to minor peaks in Talbach and Brugga. The TFA level at the Zipfeldobel spring remained constant, despite the precipitation water exhibiting TFA concentrations below the Zipfeldobel levels.
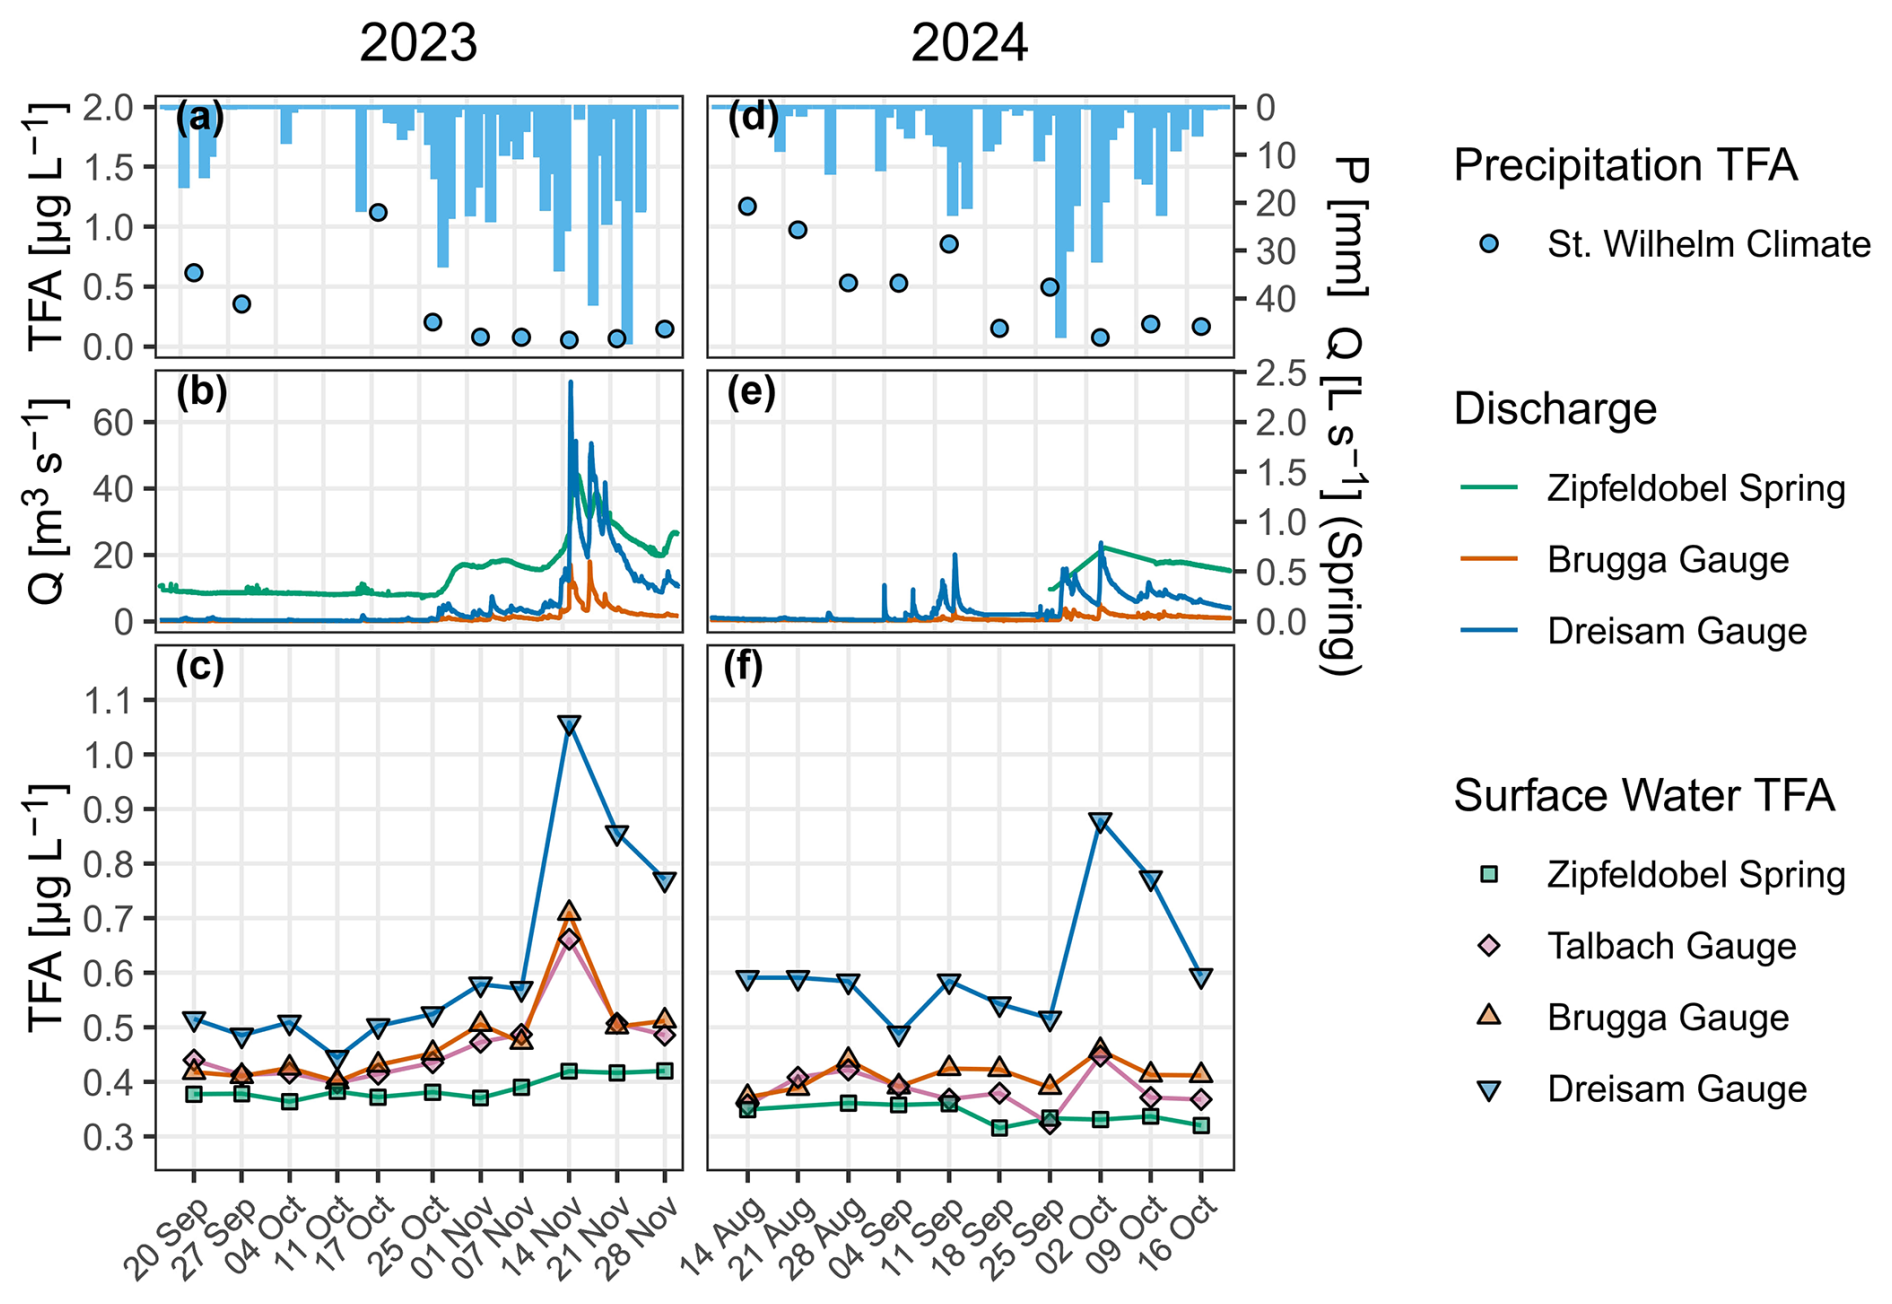
Figure 3Zoom into late summer/early autumn 2023 and 2024 periods. Due to a data gap, the Zipfeldobel spring discharge is not shown before 25 September 2024 (e).
3.3 Correlation with water parameters
In addition to TFA concentrations, we recorded time series for T, pH, C, major ions, and stable water isotopes (see Figs. F1–F5), and correlated them with the TFA concentrations in streamflow and precipitation (Table 2). In rainfall, TFA exhibited statistically significant positive correlations with all tracers except nitrate, showing the strongest associations with potassium and stable water isotopes. A significant negative correlation was found for precipitation volume and deuterium excess (D-excess). We found positive correlations in surface waters with nitrate, stable water isotopes, and discharge. The coefficients increased from spring water to the catchment outlet. We also found weak to moderate negative correlations between TFA and temperature, pH, and potassium concentration in Zipfeldobel Spring water, and between TFA and chloride in the Dreisam River.
3.4 Water balance and mean TFA concentrations
We calculated mean volume-weighted TFA concentrations for two consecutive hydrological years. During the observation period, various climatic and hydrological conditions prevailed (see Table G1). The dry year in 2023 was followed by a wet year in 2024 (see Table 3). This resulted in a decrease of TFA concentrations in precipitation from 2023 to 2024, which was offset by a slight mean increase of 5.3 % in all three rivers (Table 4). Only concentrations in the Zipfeldobel Spring decreased by 7.0 %. Volume-weighted mean annual TFA concentrations were highest in the Dreisam aquifer, followed by the Dreisam, Brugga, and Talbach rivers, and were lowest at the hillslope Zipfeldobel Spring.
Table 3Water Balance – Precipitation Input, Groundwater and Surface Water Output. Values were calculated for the hydrological years 2023 and 2024 and the 30-year average (10 years at Zipfeldobel). Errors are given as standard errors.
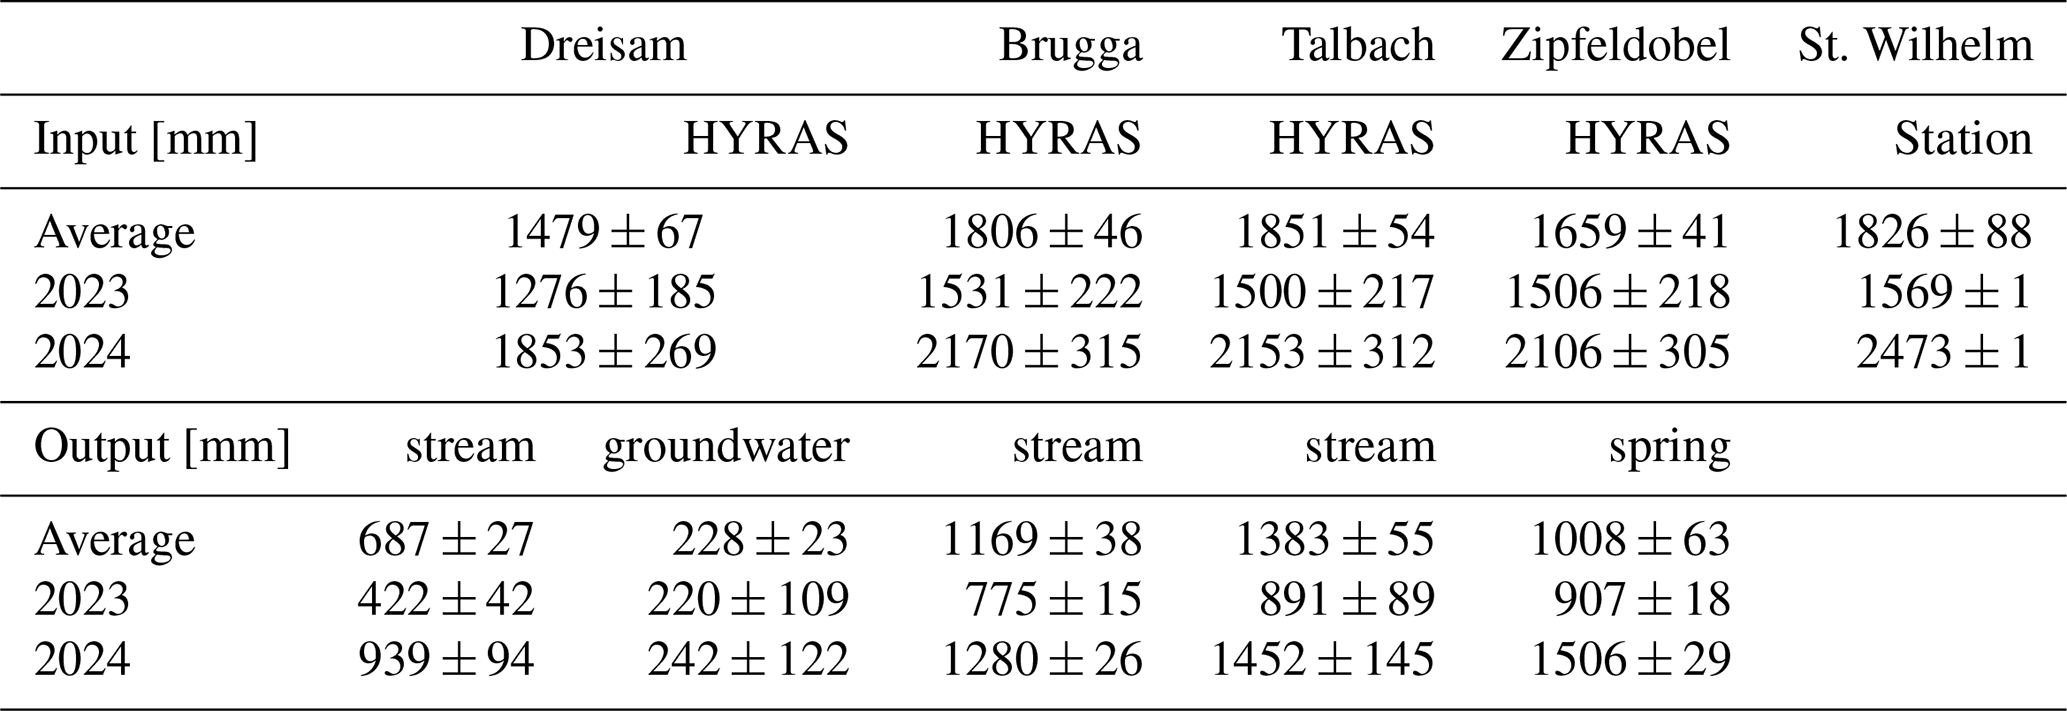
Table 4Volume-weighted mean TFA values for the hydrological years 2023 and 2024 and for an average of both years.
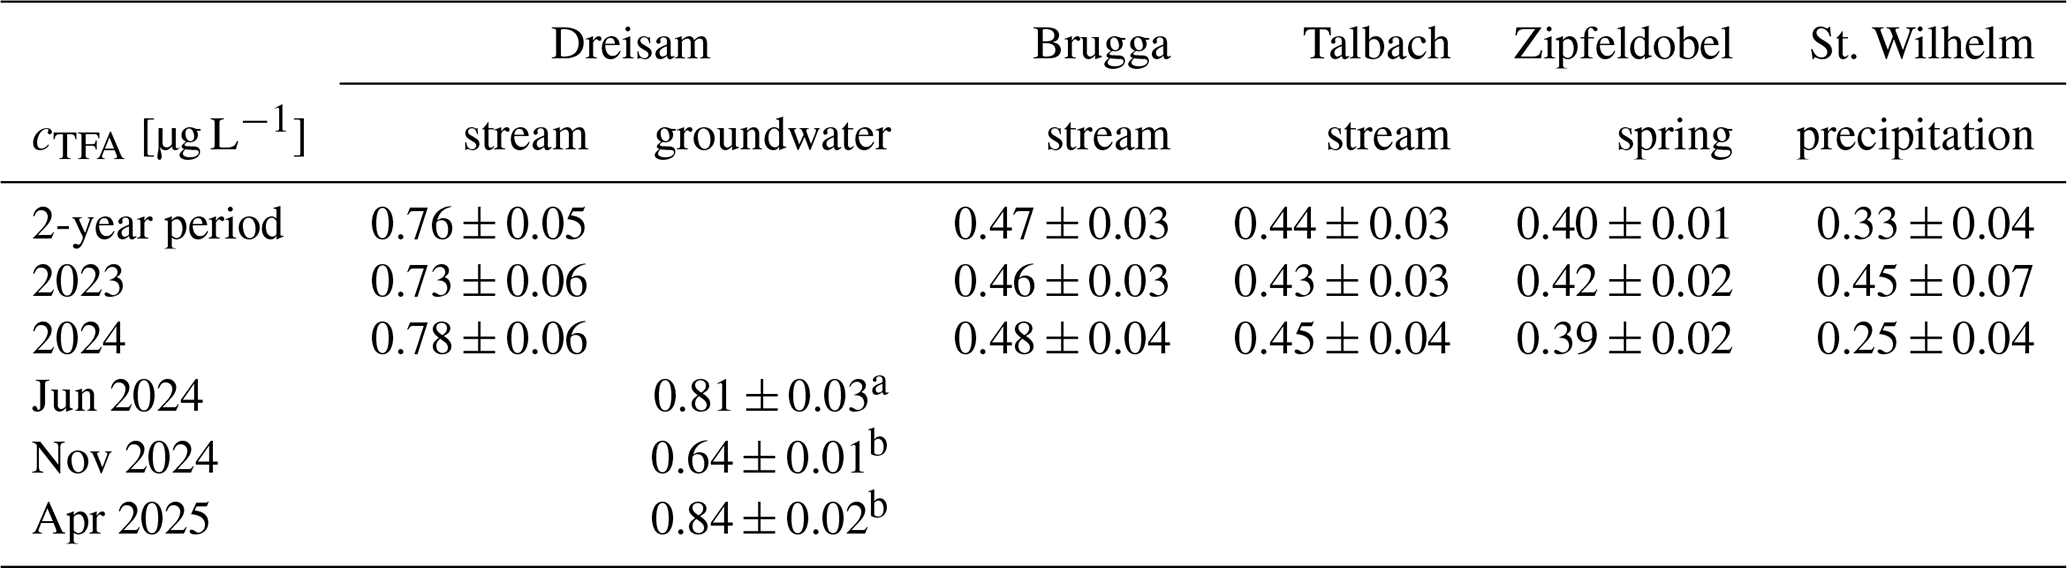
a average from eight deep wells, b drinking water from Ebnet waterworks.
3.5 TFA import and export
By combining volumes and concentrations, we calculated the TFA import and export (Fig. 4). Lower precipitation levels decreased TFA mass input in all catchments from year 2023 to year 2024 by an average of 29 % for all three stations with annual data. Contrasting the decreased input and the stable weighted mean TFA concentrations in streamflow, TFA export increased in 2024. The increase was particularly pronounced in the Dreisam River, where exports nearly doubled due to increased TFA loads in streamflow.
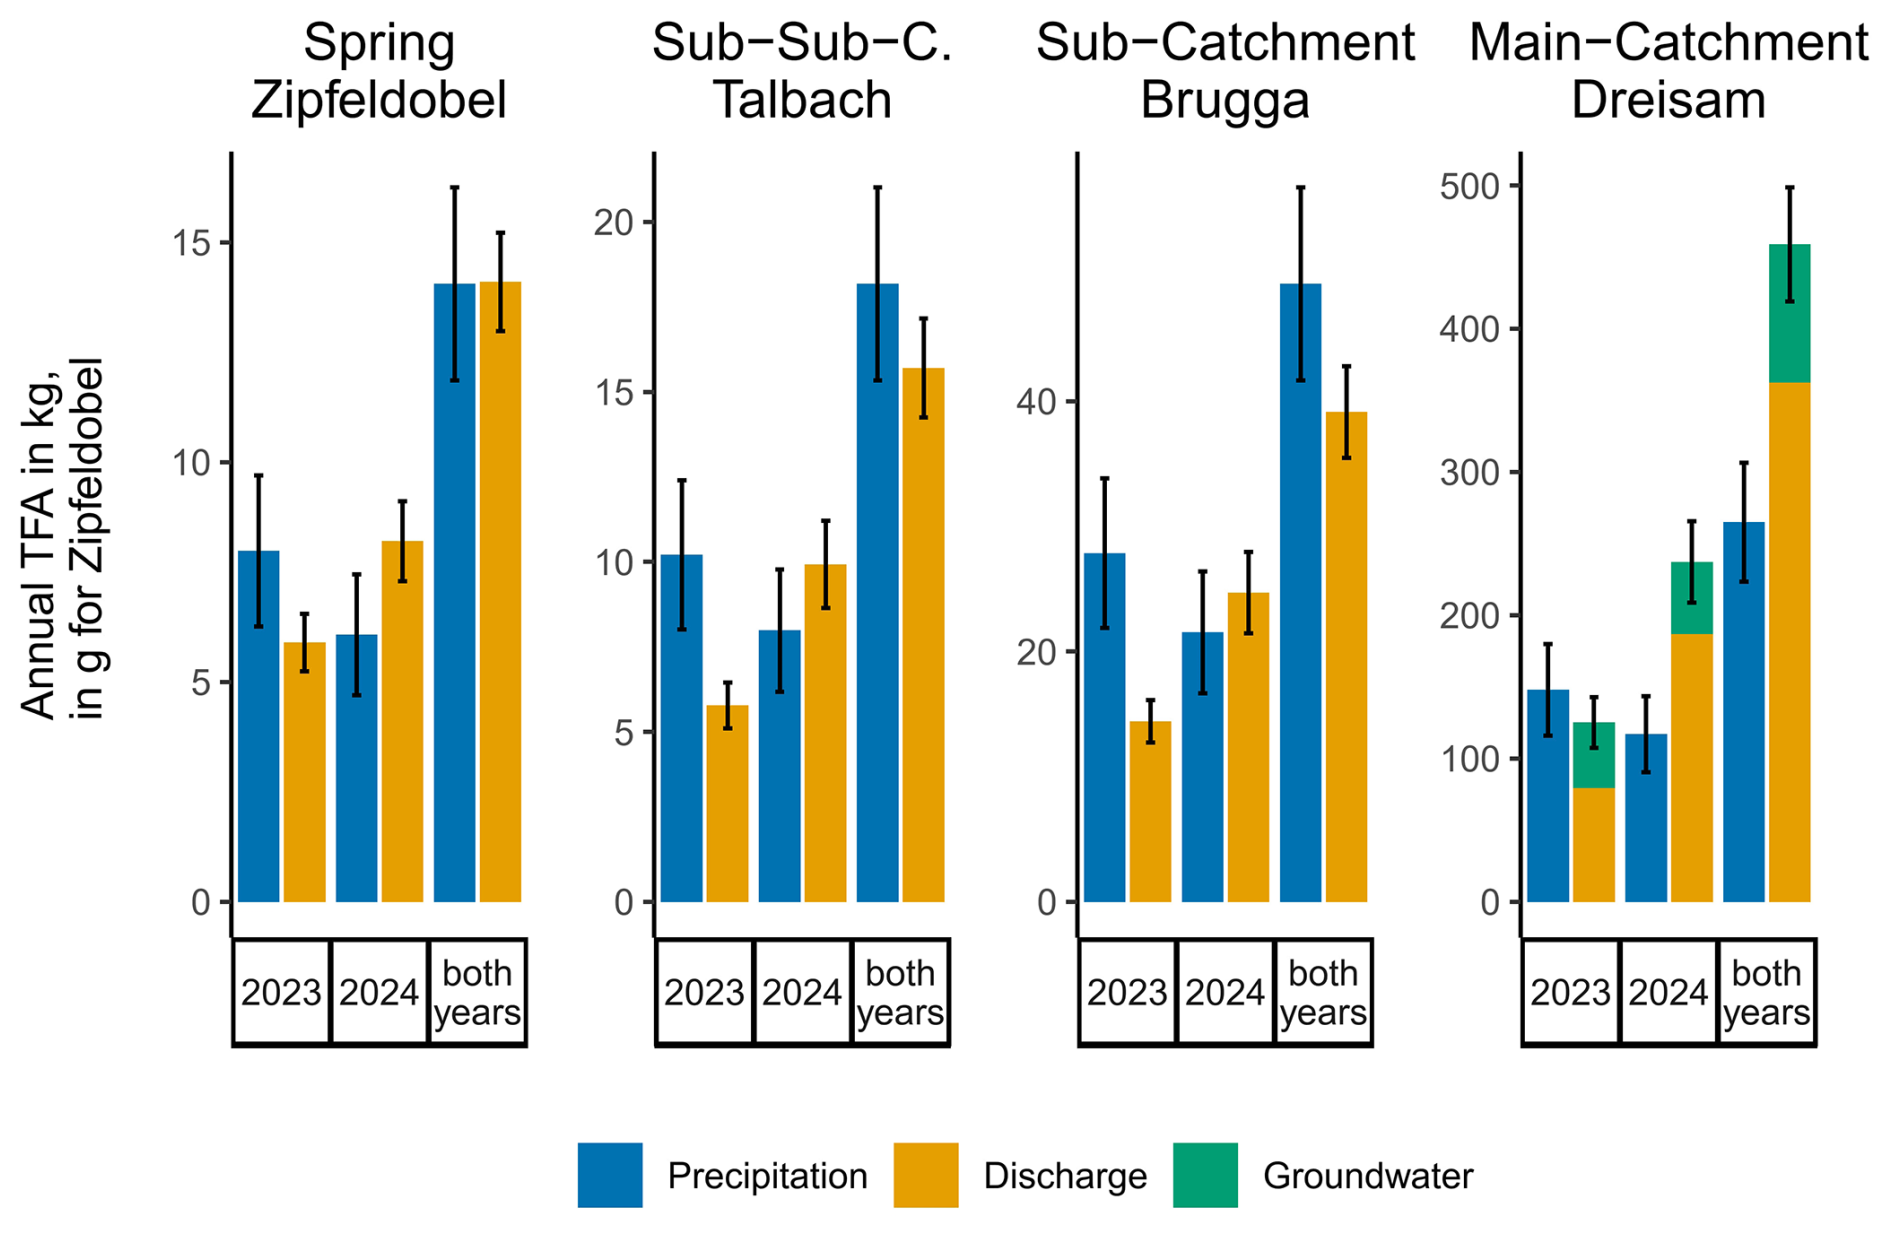
Figure 4The TFA mass balance for the spring Zipfeldobel, the nested sub-catchments Talbach and Brugga, and the DRC. Whiskers indicate statistical significance as standard errors, calculated from bootstrapped standard errors for mean concentrations and volumes and consecutive Gaussian error propagation.
In addition to the separate balances for 2023 and 2024, we calculated combined mass balances for both years. The sub-catchment and the spring showed evenly balanced import and export. Slight differences at the Talbach (−14 ± 17 %) and the Brugga (−18 ± 18 %) remained within the estimated error margins. The Dreisam River showed a 84 ± 22 % excess of TFA. About one-quarter was groundwater export. Based on the observation from the headwater catchments, we did not assume any retention. The catchment's three WWTPs' TFA input, calculated from the single-day measurements, was minor (0.21 kg a−1; Table E1) and is not shown in the balance.
3.6 Calculation of ET from TFA concentrations
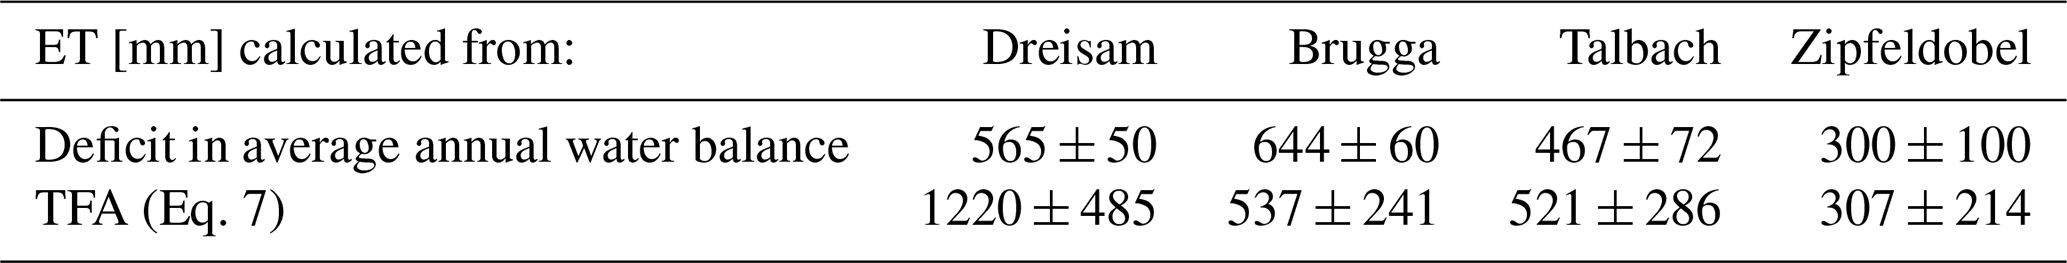
Finally, we calculated the ET based on the deficit in the water balance (see Table 3) and from volume-weighted mean TFA concentrations in combination with the annual discharge (Table 5). ET from TFA at the Dreisam river was more than twice as high as the value obtained from the water balance. Brugga, Talbach, and Zipfeldobel Spring showed comparable results within the estimated error margins.
Table 5ET values in mm, calculated from the water balance and TFA concentrations.
4.1 Quick discharge components control streamflow TFA concentration
In the Zipfeldobel hillslope spring, we hypothesize that the absence of TFA peaks in discharge stems from missing quick runoff components, as indicated by stable isotopes and water chemistry (compare Figs. F1–F5), coupled with a slow discharge response to recent precipitation (Fig. 3). Previous studies also found that the portion of the event water component was lower than 10 % (Frey, 1999; Uhlenbrook, 1999). Consequently, TFA concentrations in precipitation did not noticeably affect spring TFA dynamics. Instead, weekly TFA concentrations remained nearly constant. Still, they showed a slight seasonal pattern (Fig. 2). A weak positive correlation with stable water isotopes, enriched in summer precipitation, implied that the seasonality in spring discharge resulted from the seasonality of the input signal: Summer precipitation, enriched in TFA, was displaced from the flow system by more intense winter rainfalls. Therefore, any correlation with temperature may be coincidental, as the seasonal input signal shifts from input to discharge, and elevated TFA concentrations in spring discharge occur during winter. Potassium negatively correlated with TFA. Potassium in the spring water mainly stems from the weathering of silicate minerals in the soil or at the soil/rock interface. Therefore, low concentrations might indicate old water from deep aquifers, depleted of TFA. However, we advocate for care when interpreting the potassium-TFA correlation, because changes in potassium and TFA concentrations were minor and for potassium within the uncertainty range of the measurement (5 %) (see Fig. F3). Furthermore, pH showed a negative correlation with TFA. Prior findings indicated that TFA sorption to soils decreased with increasing pH. The increased sorption potential was observed up to pH 5 for soils with organic content smaller than 10 % (Richey et al., 1997). The springs' primary flow path lies at the bedrock-soil interface in the hillslope, where organic content is low. However, the spring's pH levels were above 6. Consequently, sorption and desorption are unlikely to be the driving processes explaining the correlation between TFA and pH at the Zipfeldobel spring.
The Talbach and Brugga rivers mimicked the Zipfeldobel TFA seasonal pattern with a slight tendency towards higher levels. However, TFA concentrations in both streams responded to discharge peaks with elevated TFA concentrations. On some dates, stream TFA concentrations even exceeded those in precipitation, as indicated by the events shown in Fig. 3. Thus, we hypothesize a temporary TFA storage that released TFA into the quick runoff component, which is mainly SSF in the Brugga and Talbach catchments. A weak negative correlation with Ca2+ and Mg2+ implied the absence of groundwater influence on TFA peaks in discharge. Generally, this aligns with our understanding of a groundwater-dominated system. We calculated Kirchner's new water fraction, i.e., the proportion of water younger than two months (Kirchner, 2019), from weekly stable water isotope values, and ended up with a low single-digit percent value for the entire observation period. Under dry conditions, groundwater influence stabilized TFA concentrations in streamflow, and under storm conditions, SSF gained importance, mobilizing TFA. Furthermore, TFA concentrations peaked in conjunction with nitrate, as indicated by moderate positive correlations. In forested areas, comparable to the Brugga catchment, nitrate mainly originates from the organic soil. Under dry conditions, the hillslopes are hydrologically disconnected, but when rewetting occurs, connectivity is restored. Then, SSF can transport nitrate from the soil to the stream (Lange and Haensler, 2012; Bachmair and Weiler, 2014). The parallel dynamics of TFA and nitrate suggested a common source and a similar transport mechanism. Therefore, our hypothesis of a temporary TFA storage, which is most likely associated with organic soil, seems valid. Significant effects of TFA concentrations exceeding 1 µg g−1 in soils on litter decomposition (Xu et al., 2022) warrant additional investigation. TFA concentrations also correlated with stable water isotopes in Talbach and Brugga river discharge. Stable isotopes are enriched in summer precipitation due to higher temperatures, as are TFA concentrations due to increased UV radiation (Franklin, 1993; Freeling et al., 2020). Therefore, simultaneous peaks of stable water isotopes and TFA suggest that water with high TFA concentrations was introduced to the system during summer.
We argue that elevated TFA concentrations in the main catchment were caused by the use of PPPs on the arable land at the valley floor, which is why the Dreisam exhibited higher absolute TFA concentrations than the Brugga and Talbach rivers and stronger correlations with nitrate and stable water isotopes. In the main catchment, nitrate presumably originates from agricultural activities, and precipitation tends to be isotopically heavier in the lower parts of the catchment, where the arable land is located. Consequently, water emanating from the agricultural Dreisam Valley should display a heavier isotopic signature and higher nitrate levels, ultimately adding to the correlations already observed at Talbach and Brugga. Therefore, we argue that elevated TFA concentrations and increased correlations with nitrate and stable water isotopes indicate agricultural TFA transported from the Dreisam Valley into the stream by quick flow. In reverse, during dry periods devoid of quick runoff components, TFA concentrations were comparable to Talbach and Brugga. Then, TFA levels dropped during prolonged droughts, suggesting a higher fraction of groundwater in streamflow during autumn in 2023 and 2024 (Fig. 3). An increased groundwater influence was also indicated by high Mg2+ and Ca2+ concentrations during both drought periods (Fig. F3) and in general by the weak negative correlation of both ions with TFA. Freeling and Björnsdotter (2023) found a similar pattern in an agricultural catchment in Saxony, Germany. They showed that high TFA concentrations in streamflow were in line with parallel peaks of flufenacet-ESA, a substance indicating the release of TFA from pesticide degradation. The catchment's fraction of agricultural area was 72 %, about 36 times higher than in the DRC. This might explain why TFA in Saxony showed TFA concentrations of 1–2 µg L−1 during late summer and 7–10 µg L−1 during winter, much more elevated than in the Dreisam river (late summer: 0.45–0.6 µg L−1, wet conditions in winter up to 1.1 µg L−1). Additionally, increased dilution in the DRC due to a higher precipitation amount and an increased discharge compared to the Saxony catchment might add to the difference.
4.2 TFA mass balances reveal no significant retention in areas free of agriculture but a TFA excess in the agricultural main catchment
In the dry year 2023, we observed higher input than output in the TFA mass balance at all sampling locations. In the wet year 2024, this pattern was reversed. Then, precipitation volumes increased, but precipitation TFA concentrations dropped, and the overall precipitation input load decreased. Freeling et al. (2020) found a correlation between TFA levels in precipitation and incoming solar radiation and attributed this to the atmospheric degradation of TFA precursors. Indeed, the incoming shortwave solar radiation measured at the St. Wilhelm station decreased by 23 % from 2023 to 2024, explaining the average 29 % decrease in TFA input mass. Consequently, our data suggest that the mass of TFA deposited in a catchment primarily depends on the radiation-driven degradation of atmospheric precursors and not on the amount of precipitation. Contrary to the input, the TFA output increased in 2024. Most of the additional load stems from increased discharge, as weighted mean TFA concentrations in the rivers only rose slightly. Apparently, the effects of the previously discussed TFA mobilization by SSF might have overruled the dilution effect of TFA-depleted event water in 2024.
The increased export observed in 2024 was particularly pronounced in the DRC compared to the Talbach, Brugga, and Zipfeldobel catchments. The surplus might stem from previous year's wet deposition or PPP use. PPP applications have been shown to leave residues in soils. Moreover, prolonged transformation times in soils, dependent on moisture conditions, have been reported for PPPs such as flufenacet, a compound that degrades into TFA. Thus, the hypothesis that fluorinated PPPs accumulate in soils and create a potential legacy storage of TFA is consistent with our observations. Moreover, contributions from previous years' wet deposition might also add to TFA export. Interpreting the two-year balance, we assumed that the storage state of the catchment was similar at the beginning and end of the sampling period. We justify this assumption by referring to groundwater levels in a well close to the catchment outlet, which were similar at both times and close to the long-term mean (see Fig. 5).
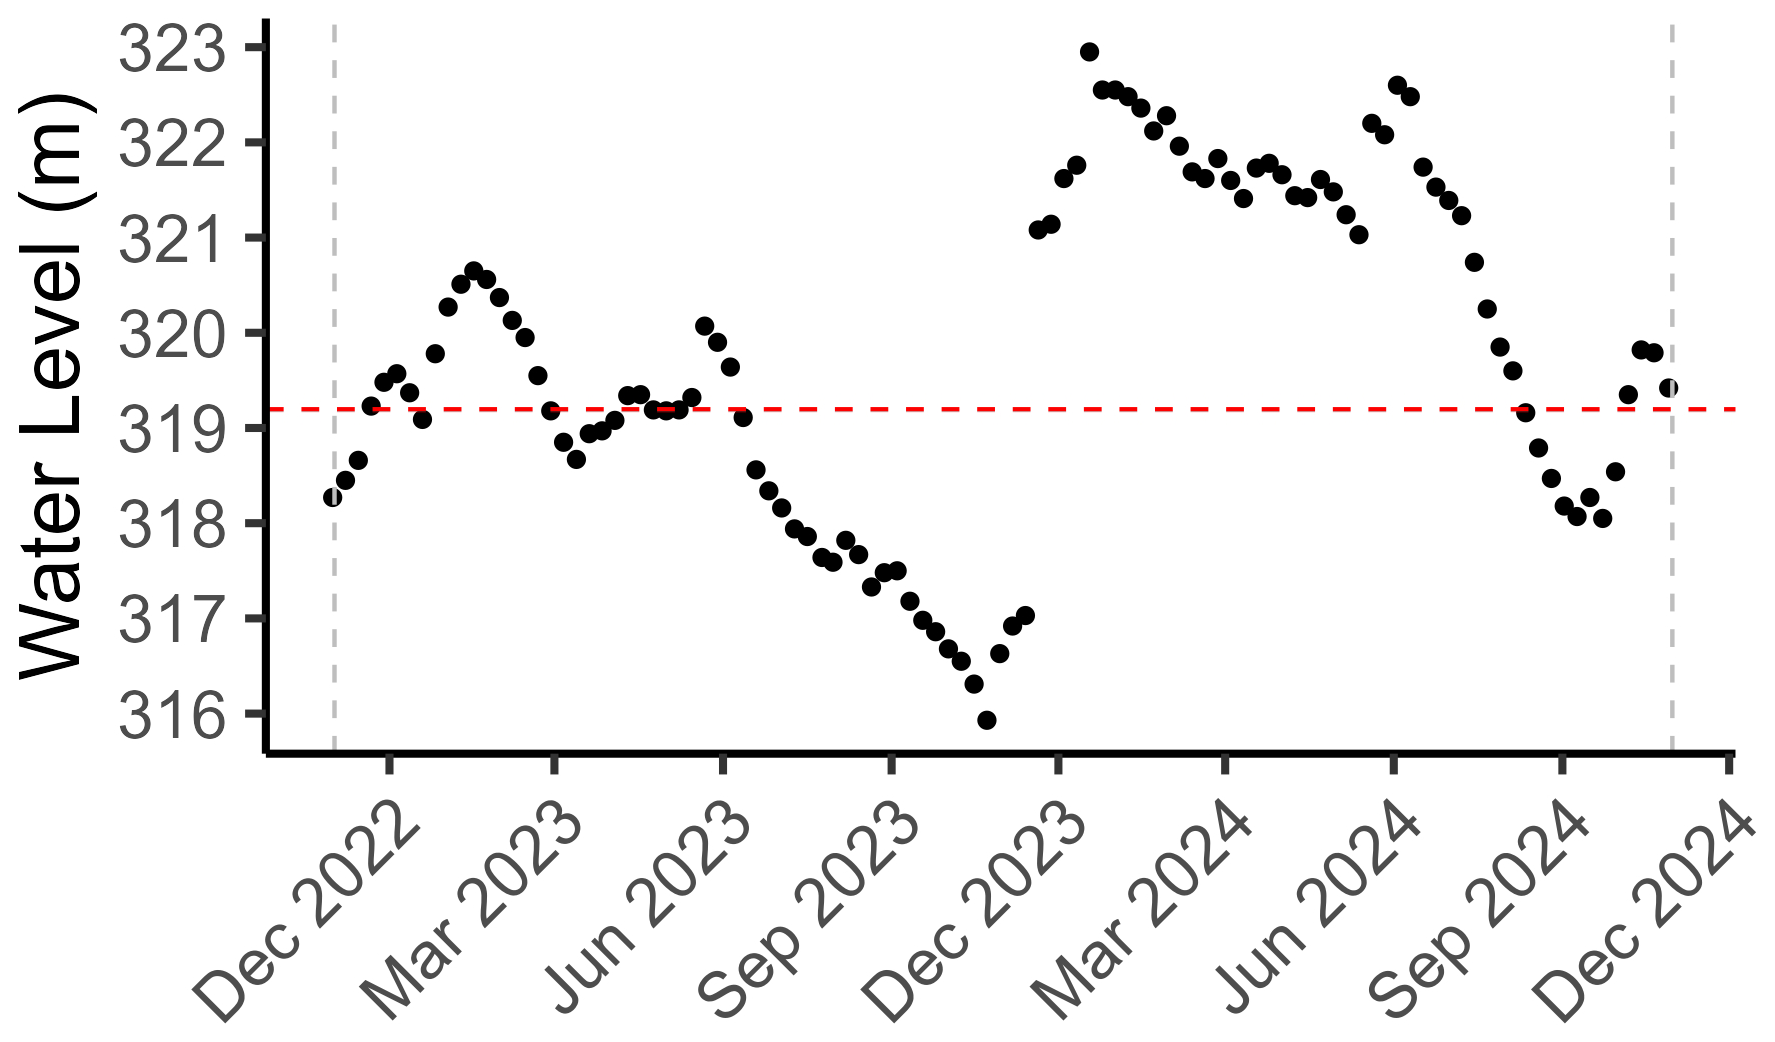
Figure 5Groundwater table at the DRC outlet (Ebnet) for the whole sampling period is indicated by vertical grey dashed lines. The horizontal red line indicates the 60-year mean.
Similar TFA inputs and outputs during the two-year sampling period suggest negligible retention in spring and in the two headwater catchments. This observation, however, is subject to uncertainties related to the interpolated Talbach discharge and potential errors in the estimation of the Zipfeldobel spring's catchment area. We emphasize that the catchment area of the spring is theoretical, as water may bypass beneath or near the spring. The actual recharge area cannot be inferred from topography due to the hillslope position and may change depending on the connection of underground flow paths, which vary according to season and wetness conditions. One should rather regard the contributing catchment of the Zipfeldobel spring as a theoretical ∼ 2 ha district within the 9 km2 of the nine cells used for precipitation interpolation.
Additional uncertainties may arise from legacy TFA stored in all catchments, particularly in the groundwater of the crystalline bedrock. However, Richey et al. (1997) reported negligible retention in mineral soils, suggesting that crystalline bedrock does not serve as a significant reservoir for TFA. Moreover, historically lower TFA concentrations in rainfall would have resulted in lower concentrations within these systems. Therefore, although long transit times in the deep crystalline aquifer might delay TFA transport, the limited water flux, lower historical TFA inputs, and the weak binding affinity of TFA to crystalline rock collectively indicate that this effect is likely minor.
The observation of non-significant retention disagrees with former studies, which claimed TFA retention in plants and soils (Likens et al., 1997; Berger et al., 1997). Potentially, differences compared to our results originate from the study design of both historic field experiments: Labeling with roughly a 1000-fold of today's annual background flux might have led to higher TFA uptake, and the sampling duration of below one year might not have captured effects like the release of previously taken up TFA from decomposing dead organic matter. With up to 1 mg kg−1 dry weight (Freeling et al., 2022), leaves and needles might build up a substantial organic TFA pool. The decomposition of organic matter might thereafter release TFA from soils during wet conditions, aligning with the observation from the previous chapter (correlation with nitrate and discharge due to SSF through the soil zone). Since the wet winter following labeling in summer was not captured, TFA export might have been missed by the two 1997 studies, resulting in higher retention values.
Underestimating the total TFA input into the system could be another reason for an apparent lack of retention. For instance, TFA deposition via fog condensation, which can be significant in coniferous forests, may not be adequately captured by standard precipitation samplers. Fog can precipitate on tree canopies, increasing atmospheric deposition in forests compared to amounts collected by open area samplers (Dawson, 1998). Indeed, studies have reported increased TFA levels in throughfall compared to bulk precipitation, supporting the likelihood of additional inputs via fog and dry deposition in forest ecosystems (Jordan and Frank, 1999). This suggests that our atmospheric TFA input estimates solely based on open field bulk precipitation measurements might be too low, resulting in an apparent lack of retention when performing mass balance calculations. Thus, the absence of observed TFA retention in our mass balance should be interpreted with caution, as retention could be masked by underestimated atmospheric inputs through fog condensation and dry deposition pathways inherent to forest environments.
Contrasting the observation in the spring and headwater catchments, we found excess TFA in the main DRC catchment, which contains arable land at the valley floor. We hypothesize that this excess TFA stems from the degradation of PPPs containing TFA precursors (also compare Sect. 4.1). Roughly a quarter of the total TFA export was through groundwater, which in the Dreisam valley is recharged from the unsaturated soil zone and from rivers such as the Dreisam or Brugga. Since TFA concentrations are higher in groundwater compared to rainfall and rivers, an input from arable soil seems plausible, a phenomenon already observed in other agricultural areas (Albers and Sültenfuss, 2024; Lange et al., 2025). Joerss et al. (2024) published a dataset estimating the potential agricultural TFA input based on a European dataset on emissions from PPPs; however, it is still largely unknown to what extent fluorinated PPPs contribute to TFA. This calls for additional research in scrutinizing the transformation kinetics of fluorinated PPPs, yet the TFA excess in the lower DRC suggests at least some additional input from this source.
Another explanation for an agricultural surplus is the application of manure, containing TFA, which has been imported with fodder into the DRC. We assume a TFA concentration of 100 µg L−1 in liquid manure (German Environment Agency, 2023) and an application of 210 million tons of manure (Federal Statistical Office of Germany, 2021) on 16.6 million hectares (German Environment Agency, 2025) of agricultural land in Germany. The resulting application rate of 13 t ha−1 yields a theoretical annual input of less than 13 kg of TFA across the entire agricultural area, including meadows in the DRC (98 km2). In practice, the estimated manure input should be much lower, as most manure is produced within the catchment area itself, and only TFA originating from external sources is reflected in the balance. Consequently, liquid manure can be considered a negligible source of TFA, given the large export surplus of over 200 kg a−1.
Furthermore, heterogeneities in the precipitation input might cause TFA export excess. Elevated TFA precipitation concentrations in the vicinity of cities were observed (Freeling et al., 2020; Wang et al., 2014). The lower part of the DRC is located downwind of the city of Freiburg and might receive more TFA compared to the upper catchment. This might also explain a part of the agricultural TFA excess.
4.3 ET calculations from TFA compared to the water balance
ET values calculated by TFA (Eq. 7) aligned with those from the water balance within the given error margins, except for the Dreisam River, where a surplus of TFA export led to overestimated ET. Values for Brugga and Talbach (537 and 521 mm) were in the range of magnitudes reported in literature: Didszun and Uhlenbrook (2008) reported 600 mm for the Brugga catchment, Wenninger et al. (2004) 530 mm for the Talbach basin, Hangen et al. (2001) 248 mm in winter, and 588 mm in summer for the nearby Conventwald study area, and Hoeg et al. (2000) 620 mm for the neighboring Zastler catchment.
Calculating ET based on weighted mean TFA concentrations resulted in larger error margins than using the deficit between precipitation and runoff. High fluctuations in TFA precipitation concentrations are the primary cause for uncertainty.
Overall, we expected an underestimation of ET calculated from TFA, mainly because recent precipitation concentrations might overestimate the amount of TFA that entered the system in the past. The mean time shift between input and outflow, also known as the mean residence time in the Brugga catchment, is in the range of 11 to 16 months (Uhlenbrook et al., 2002). The 3–4 fold increase of TFA concentrations in precipitation over the last three decades (Freeling et al., 2020) translates to an annual growth between 4 % and 5 % based on the assumption of an exponential increase (German Environment Agency, 2021). Consequently, when comparing recent streamflow and precipitation concentrations to determine ET, we overestimate the input by 4 %–8 %. Additionally, the transit time distribution affects TFA concentrations in stream flow. Within the crystalline bedrock, long flow paths might still release “old” water, which exhibits lower TFA levels due to lower historic TFA levels in precipitation. This portion of “old” water could lower stream flow TFA concentrations and lead to lower output.
Adding to the uncertainty, the interannual variability of TFA concentrations in precipitation can be considerable (see Table 4 and Jordan and Frank, 1999; Henne et al., 2025), as reflected in the relatively large error margins for ET values from TFA, ranging from 45 % at Brugga to 70 % at Zipfeldobel. This constitutes a methodological challenge, as the sampling period must be sufficiently long to capture interannual variation, and at the same time short enough to minimize errors arising from the progressive increase in TFA concentrations over time. In our case, two years of observations produced reasonable ET estimates for all three sub-catchments in the DRC.
Our study suggests that the organic soil zone exhibits TFA storage, and SSF is the dominant process that transports TFA from soils to the river. We stress the need for direct measurements in soils to empirically confirm these observations. However, a two-year mass balance provided no evidence of permanent TFA retention in the two mountainous headwaters and at a hillslope spring. Temporary accumulation was only observed during dry periods; thereafter, the export of retained TFA was enhanced during the following wet conditions. Exports in the DRC, including arable land, were exceptionally high in the wet year 2024 and almost doubled the input over our two-year study period, pointing to potential legacy storage of fluorinated PPPs.
Our findings on limited TFA retention have a bearing on the use of TFA as a tool to estimate actual ET. This approach is applicable in catchments with solely atmospheric TFA input. Mean residence times should remain below 5 years to minimize the error from rising TFA concentrations in precipitation. Main uncertainties arise from difficulties in finding representative TFA concentrations in precipitation, since overall TFA concentrations are increasing, and the interannual variability can be quite high (see Table 4). Our results showed that ET could be estimated from just two years of weekly TFA concentrations in areas of the DRC devoid of intensive agriculture.
Therefore, ET calculations from TFA concentrations have the potential to substitute for the widely used chloride method (Wood and Sanford, 1995) in areas where chloride is, e.g., introduced by road salt or geogenic chloride is present.
We generally advocate for a dual perception of TFA as both a contaminant and a valuable tool for hydrological process research. Albers and Sültenfuss (2024) demonstrated the use of TFA concentrations in groundwater for age dating, and Lange et al. (2025) evaluated the potential of TFA as a new hydrological pollution tracer. In the future, elevated TFA concentrations in SSF, combined with higher-frequency sampling, could yield valuable insights into this runoff generation process, supposed that TFA is not retained in the long term, a fact which remains to be proven in other areas. The seasonal input signal and the rising concentrations in precipitation principally qualify TFA as a tool for transit time estimations. Future research in other catchments should address this question.
Table A1Overview of all sampled locations, intervals, parameters, and timely resolution.
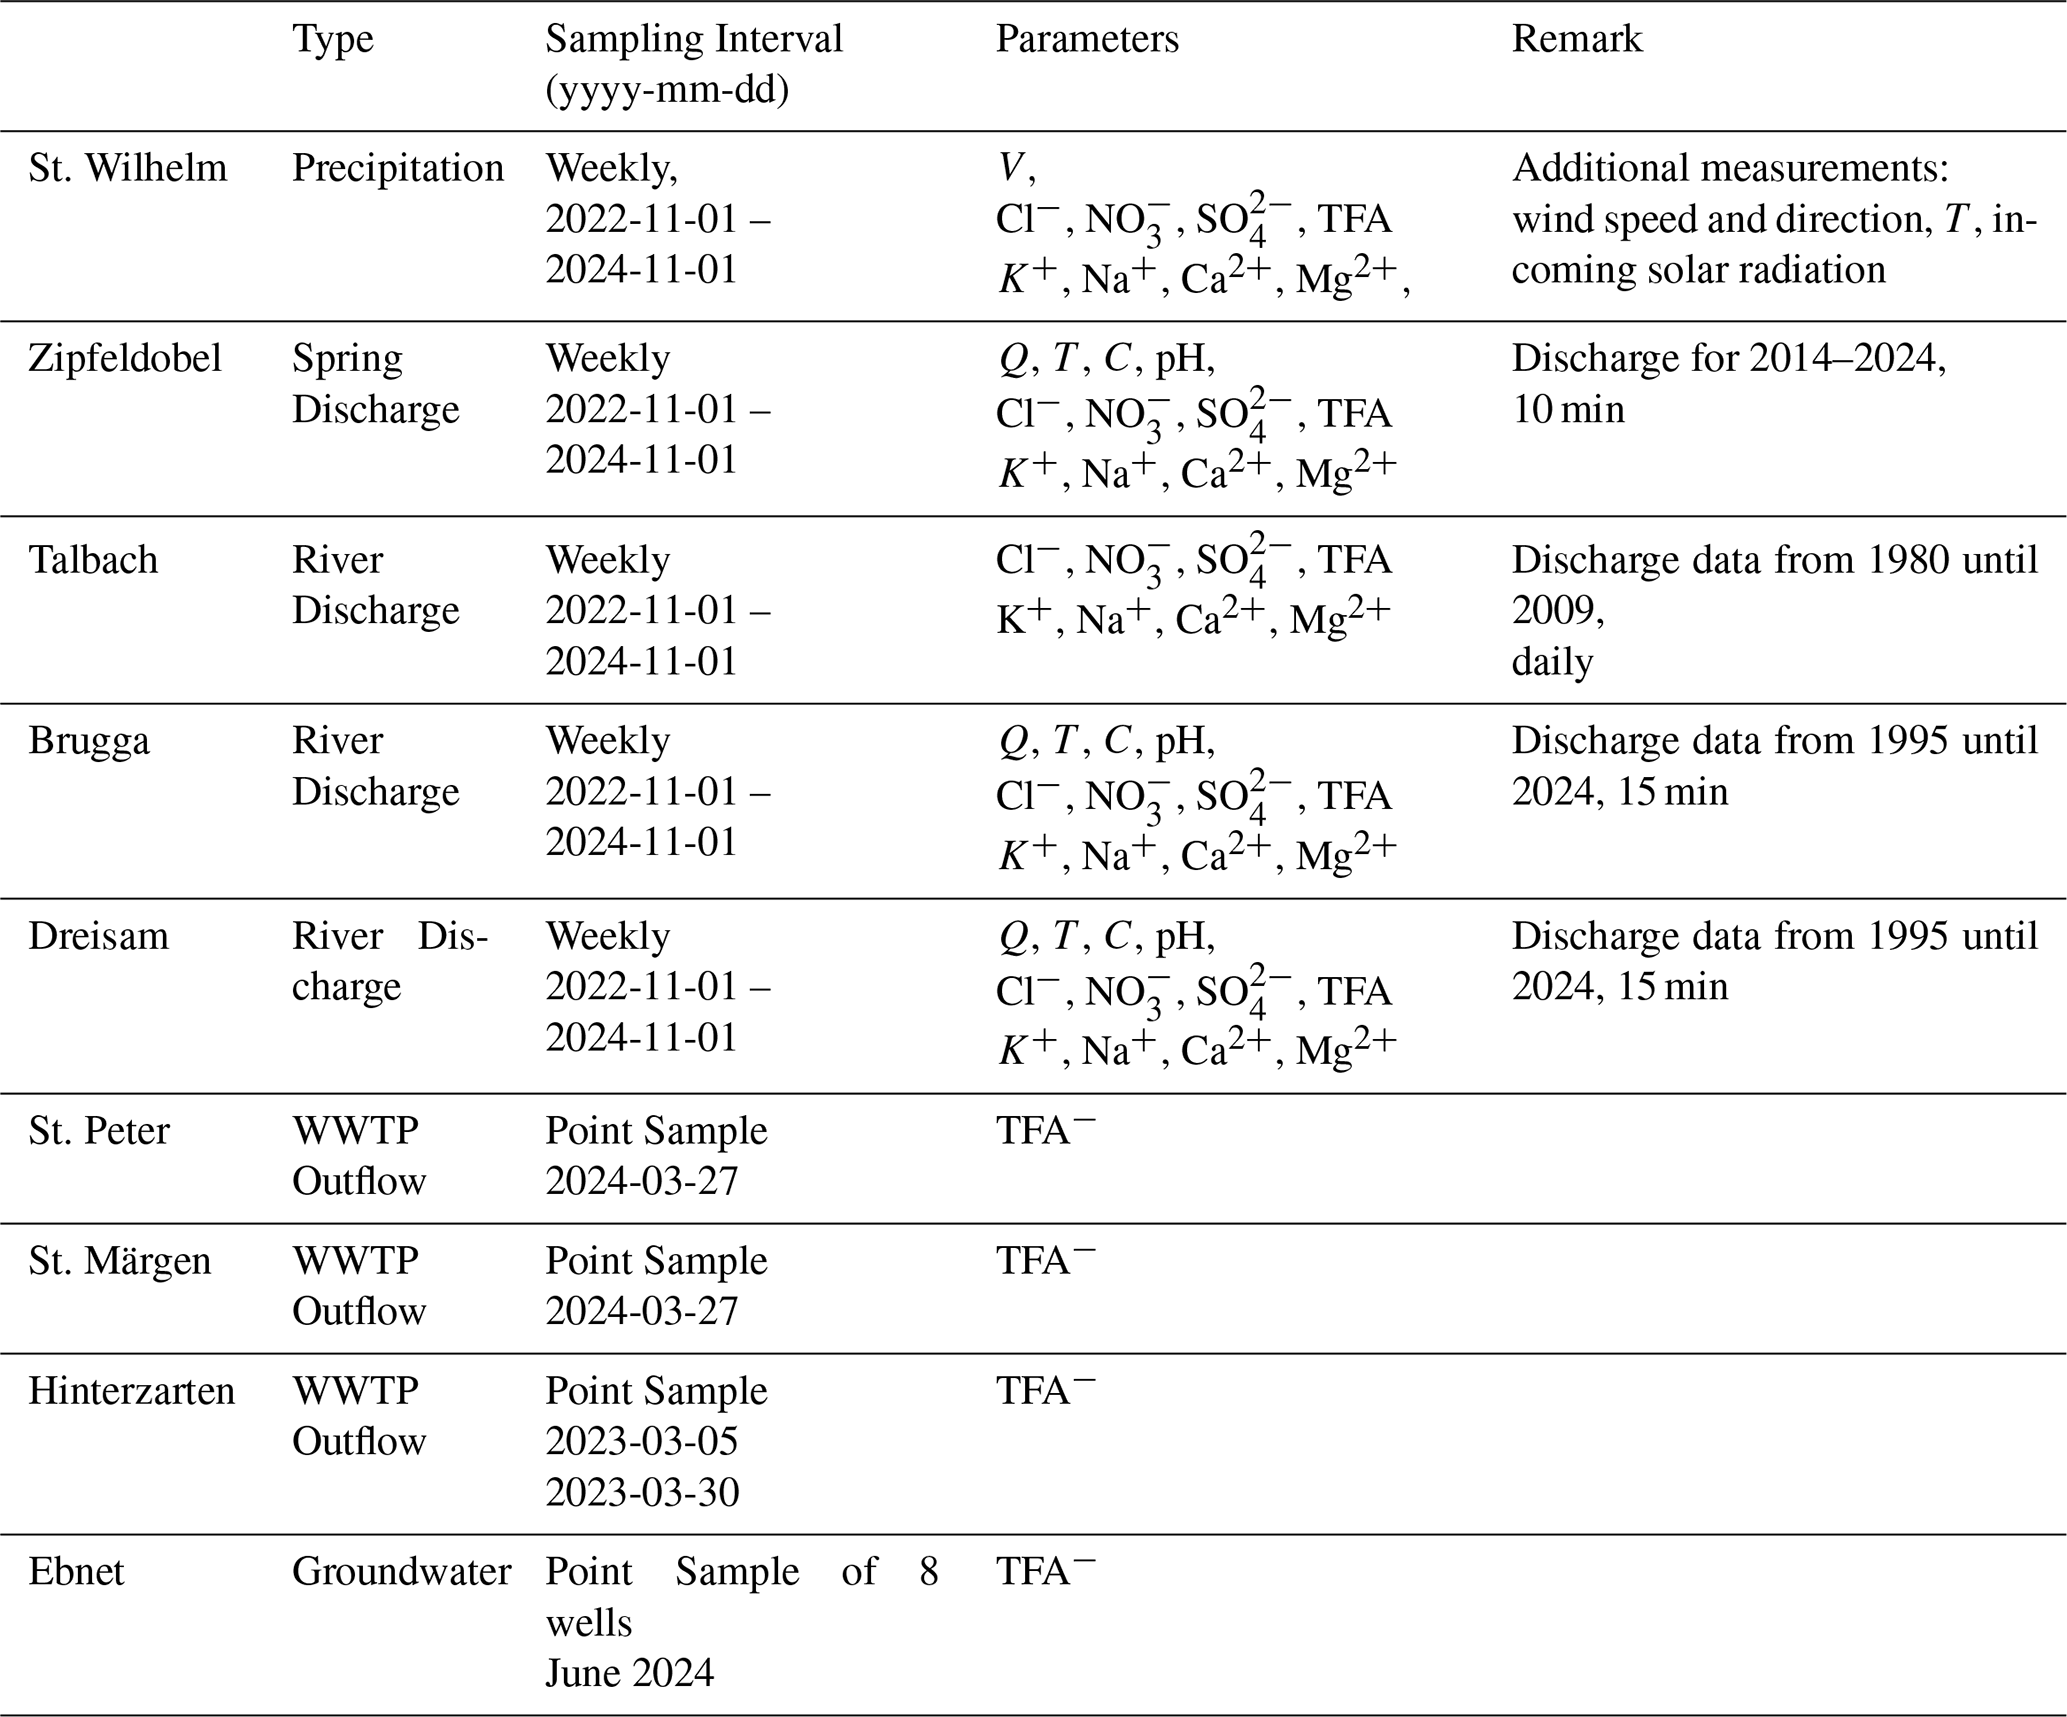
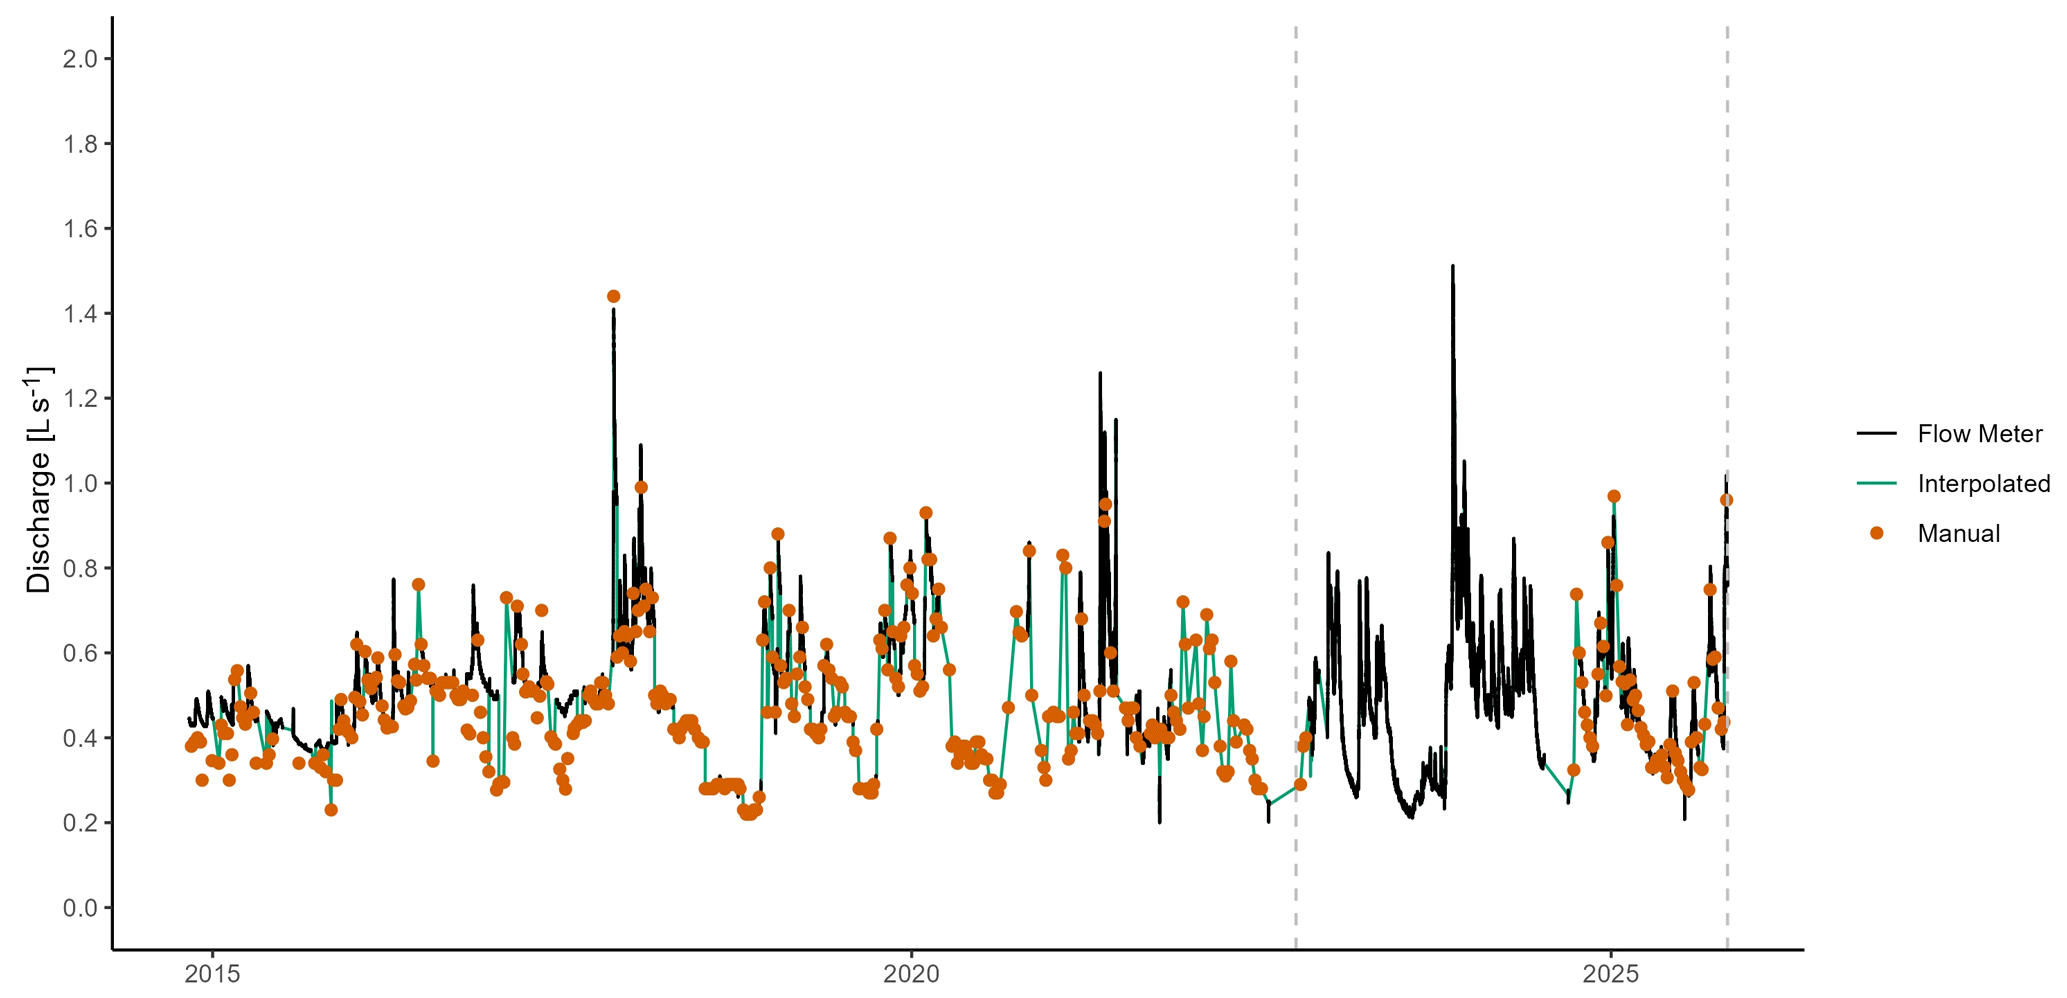
Figure B1Discharge time series measured by the inductive flow meter at Zipfeldobel (black), manual measurements used for linear interpolation (orange dots), and interpolated values (green). The sampling period is shown as grey – dashed lines.
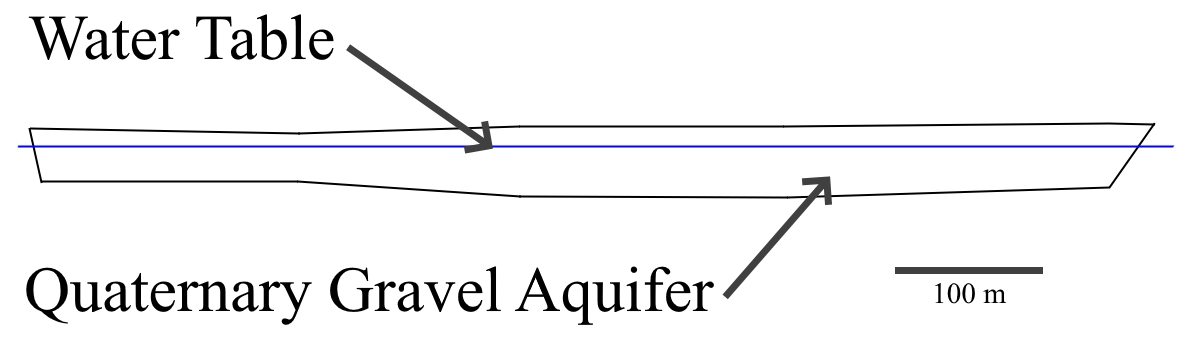
In the Dreisam catchment, groundwater flow was calculated using Darcy's law. kf-values of three well-duplets and two individual wells (, , , , , , , , distance <1 km from the gauge) were obtained from a local engineering office. The average kf-value of 7.04 × 10⁻³ m s−1 was calculated. Hydraulic potential and water-filled area were estimated using groundwater wells located upstream and downstream (see Fig. C1, L1, and L2), supplemented by geological data from the ISONG product by Landesamt für Geologie, Rohstoffe und Bergbau (LGRB) (see Fig. C2): We calculated annual mean water table depths at L1 and L2. The difference in the water tables divided by the sum of each vertical distance to the transect is the slope of the groundwater table. The water table at the transect is then calculated by adding the slope times the perpendicular distance L1-transect to the L1 groundwater table. Then, the water-filled area is calculated from the geological profile and the water table. For the hydrological years 2023 and 2024, 183 and 205 mm values were calculated. Based on 25 years of groundwater table data, the mean annual groundwater flow is 191 mm. We added 37 ± 2 mm due to groundwater pumping activity at the drinking water facility Ebnet, resulting in 220, 242, and 228 mm.
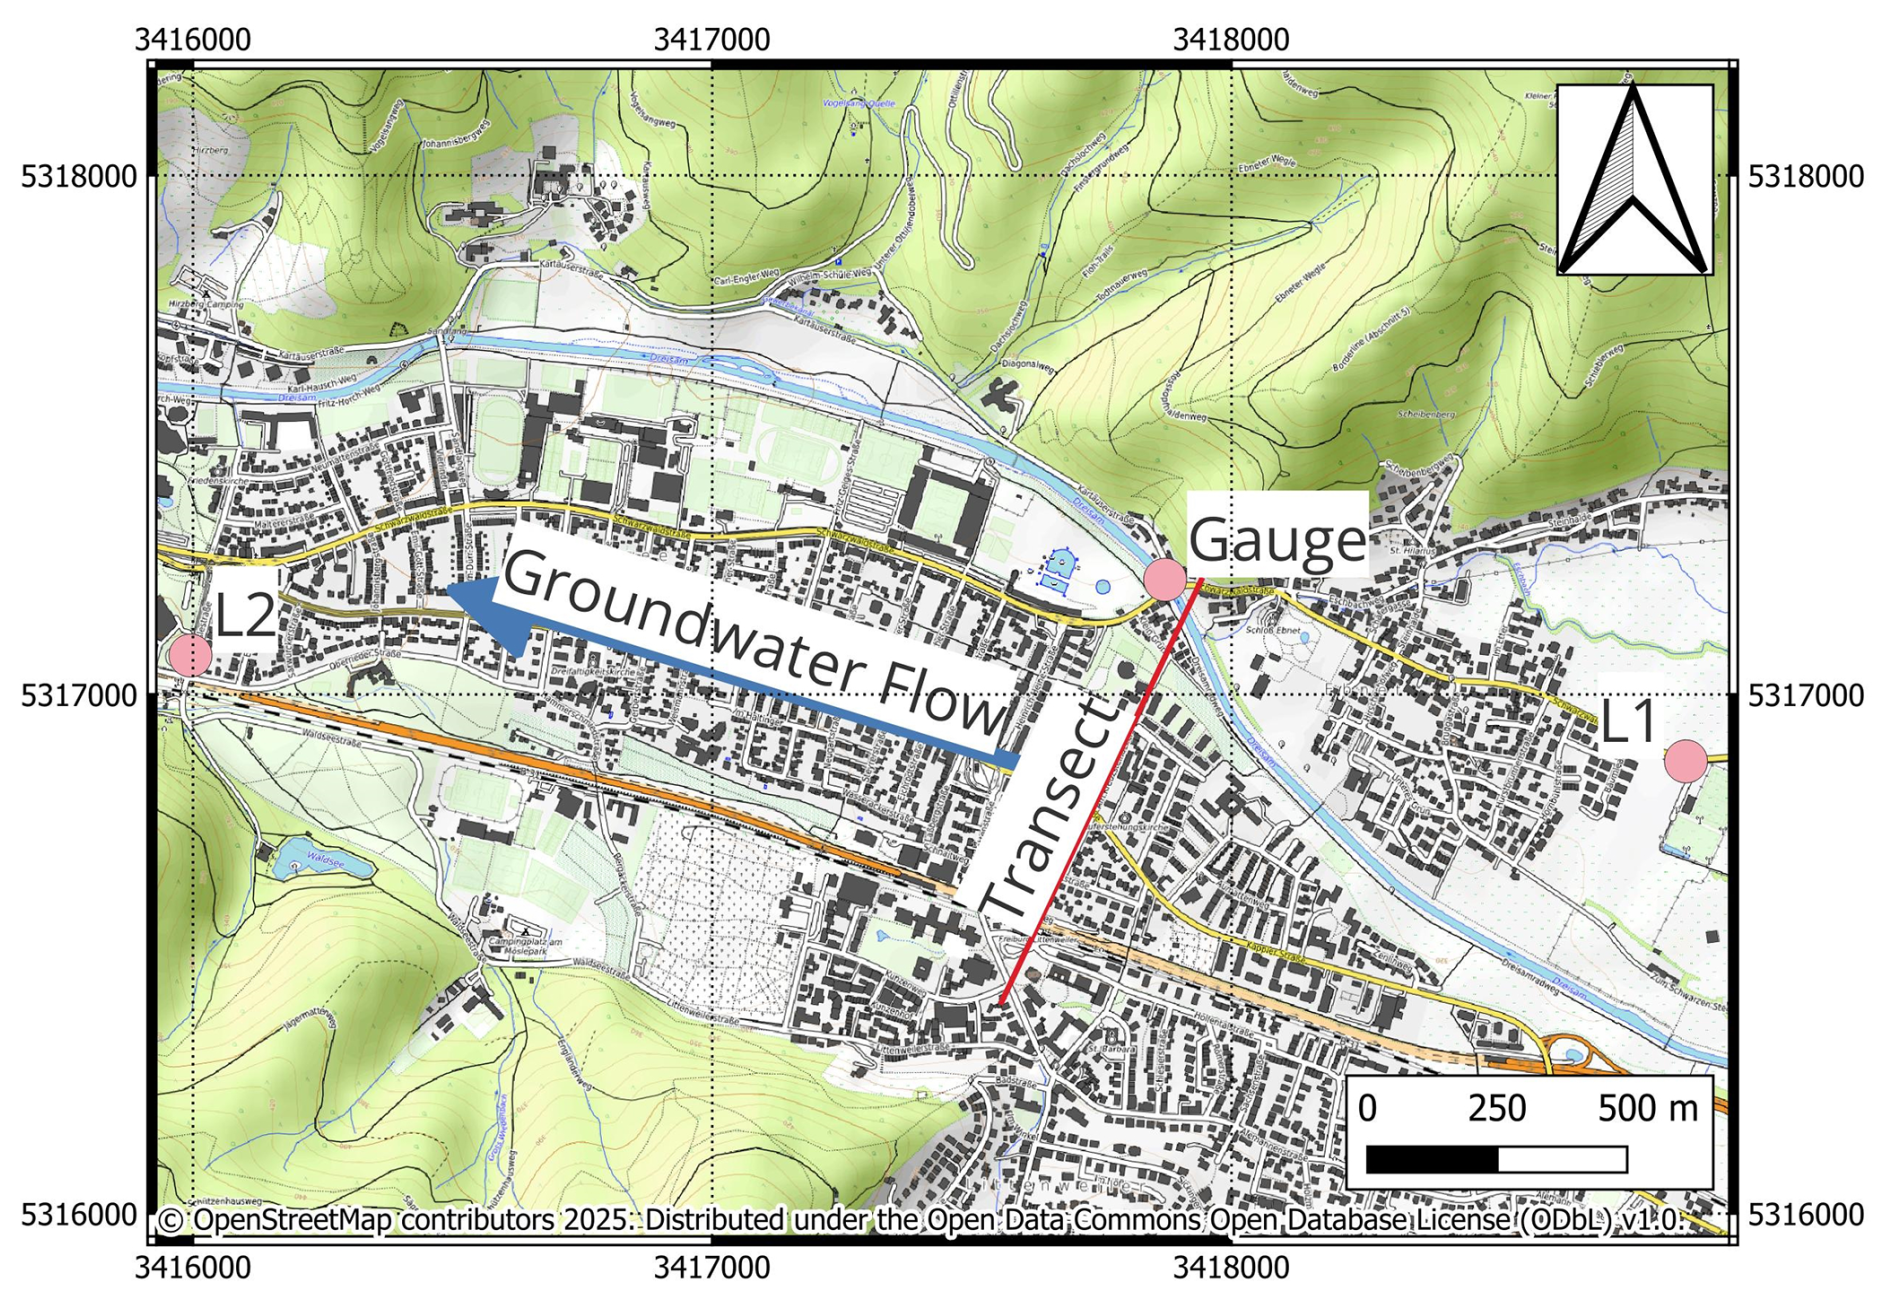
Figure C1DRC gauge area. Groundwater wells L1 and L2, the transect on which a geologic profile was taken, and the main groundwater flow direction (blue arrow).
We compared historical data collected within the study catchment at five locations to grid point estimates from the HYRAS product (Fig. D1). The station data (Fig. D2) was not used in the interpolation algorithm and corrected as described in Richter (1995) before comparison. The basic assumption was that the mean error from the stations represents the error of the whole interpolated area. At an annual aggregation level, we obtained a relative standard error of the estimate (rSEE) of 16 %, a mean relative absolute error (MRAE) of 12.0 %, and a bias of −51 mm. The bias was relatively small compared to all stations' mean HYRAS prediction of 1700 mm combined. Additionally, most of the bias stemmed from the Schauinsland (si) climate station, which is located on the windward slope of the mountain, leading to increased precipitation amounts. The model did not capture this effect. The error was normally distributed (Shapiro and Wilk, 1965, W=0.98, p=0.76). The distribution is shown in Fig. D3. Therefore, we used the rSEE as a standard error for later error calculations.
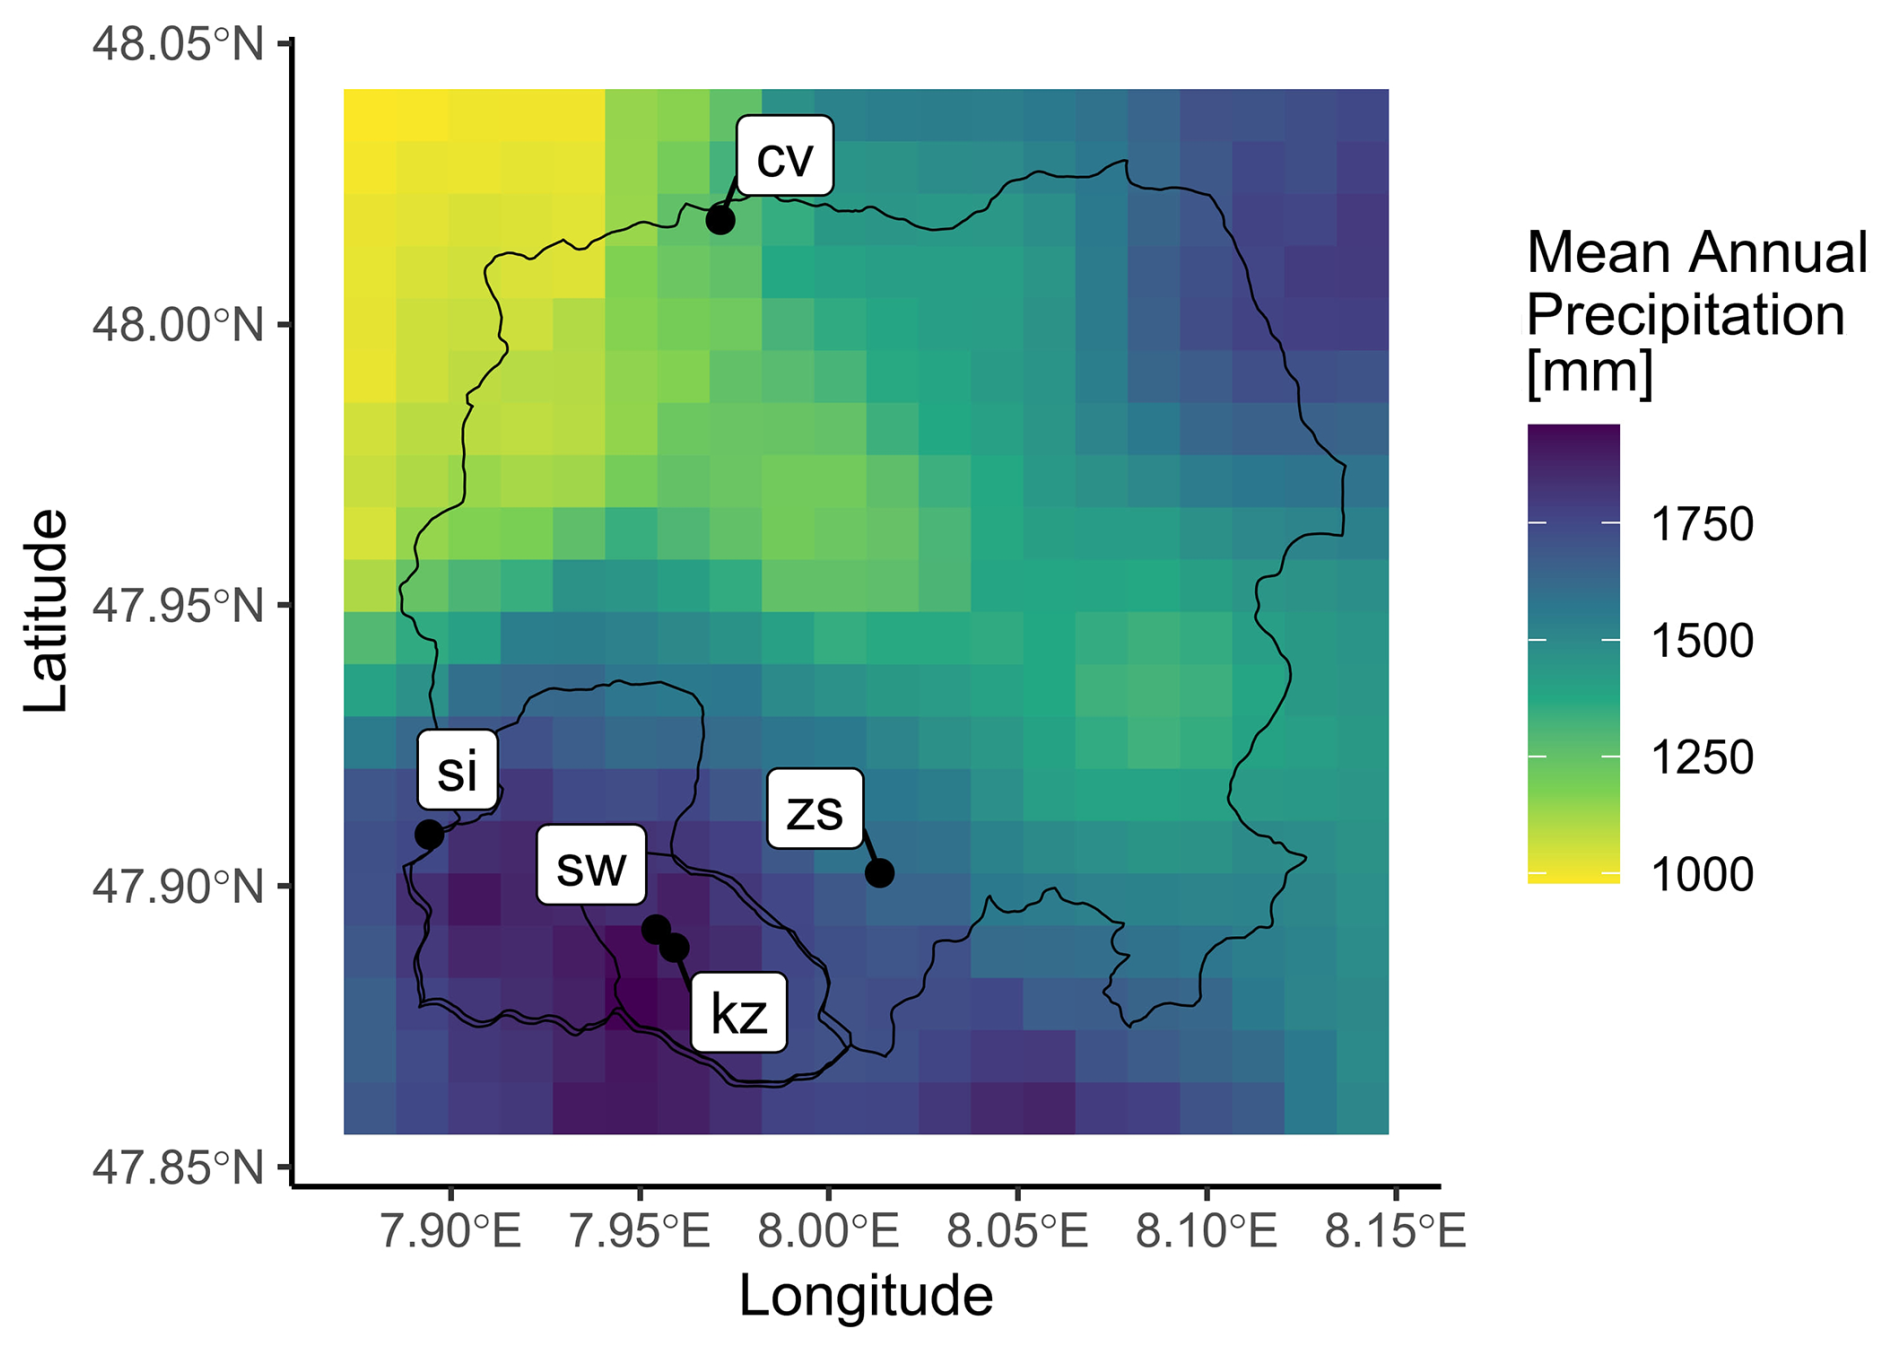
Figure D1Annual mean precipitation of the HYRAS interpolation product. Points indicate climate stations not included in the interpolation algorithm and used for error estimation.
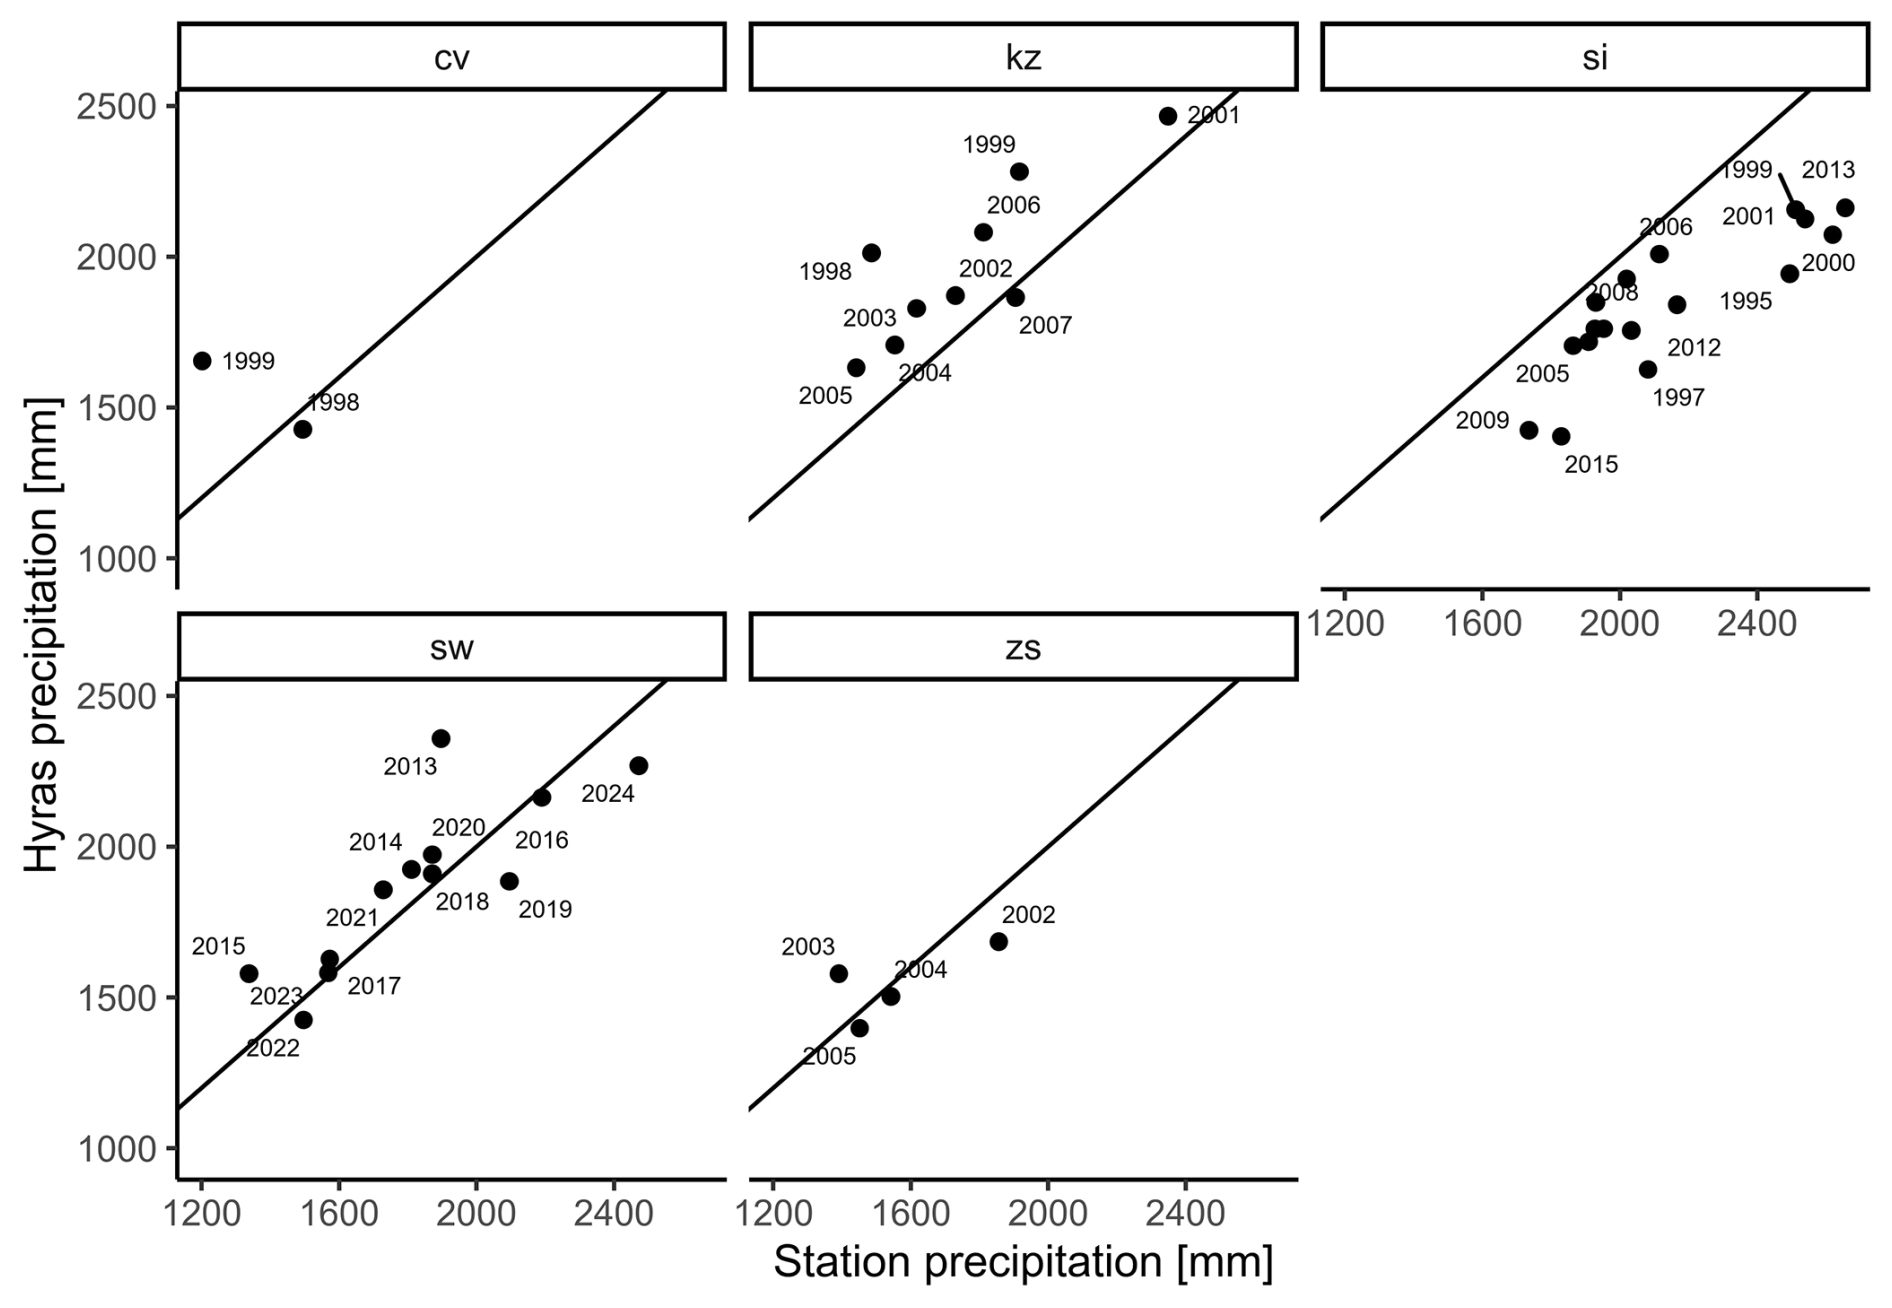
Figure D2Comparison of annual HYRAS precipitation data with five climate stations' values. The black line indicates the perfect fit.
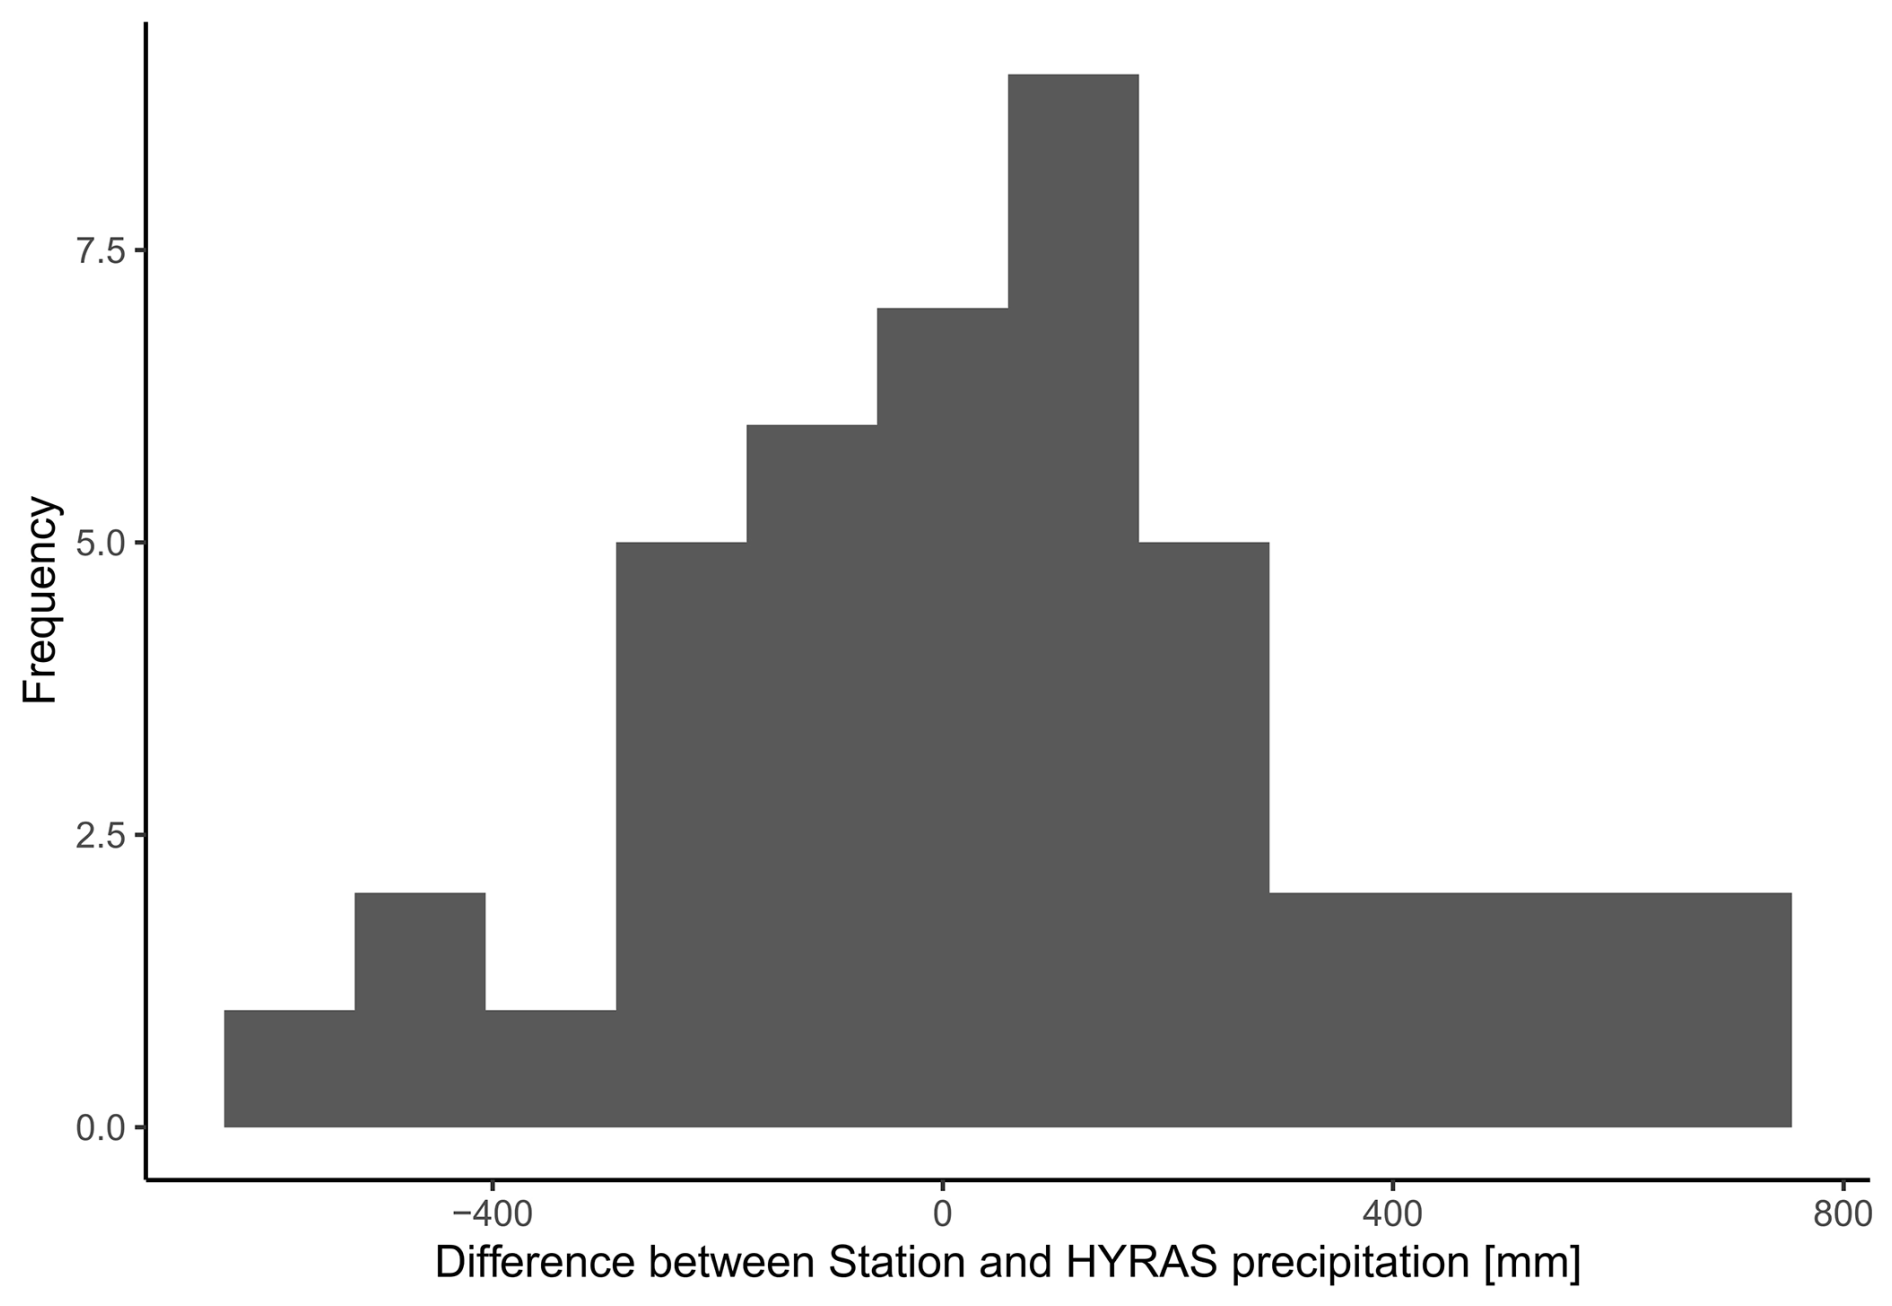
Figure D3Distribution of differences between the annual station and HYRAS precipitation data.
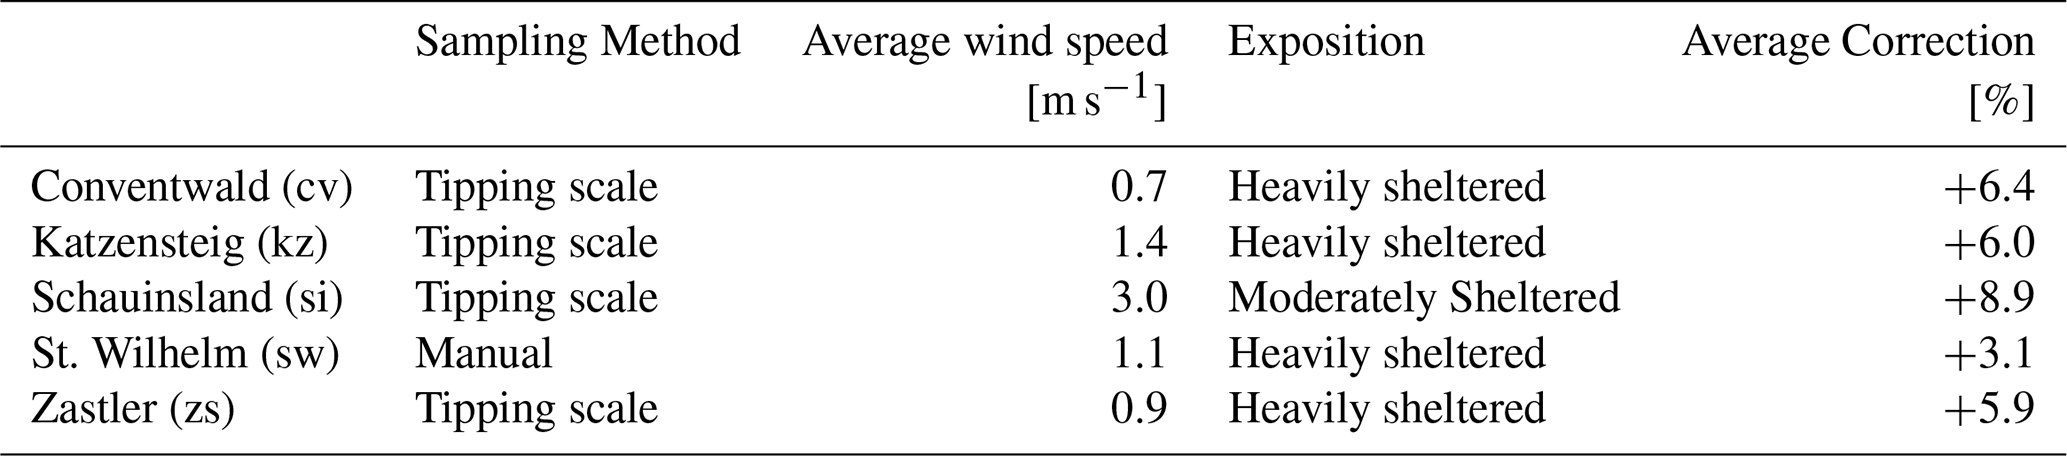
Table D1Correction for wind and wetting errors and parameters necessary for correction for climate stations located in the Dreisam catchment.
We point-sampled all three WWTP in the Dreisam catchment (Table E1). The calculation of total TFA load is based on a single-day measurement. The total TFA load released from the WWTPs is 0.43 kg a−1 year. The drinking water that ultimately goes to wastewater is mainly abstracted from springs in the area. Assuming a mean TFA concentration of 0.39 µg L−1 (measured at the Zipfeldobel spring), 0.22 kg had been introduced into the system before by precipitation and was already captured by the balance. Consequently, we subtracted that value and found a surplus of 0.21 kg a−1 for all three WWTPs combined.
Table E1Discharge, TFA concentrations, and loads at WWTPs in the Dreisam catchment.
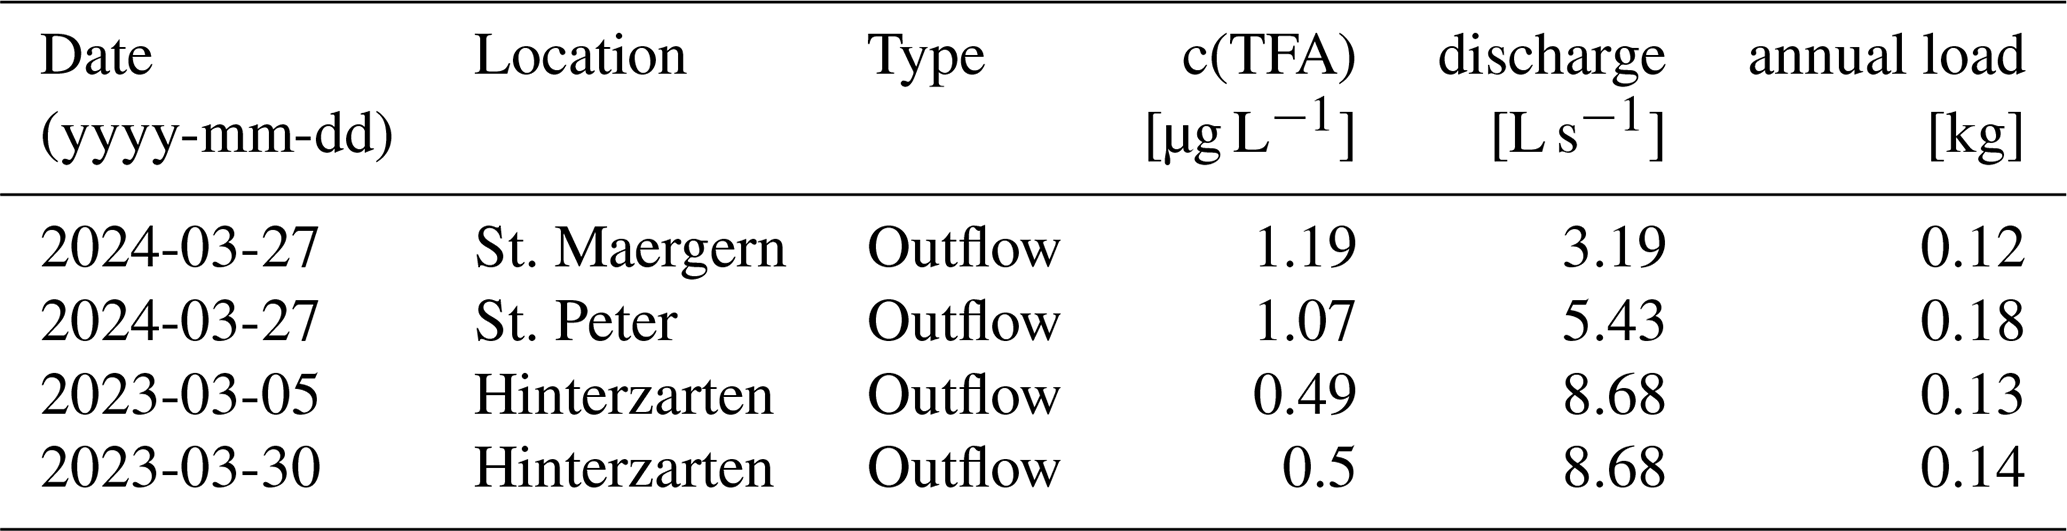
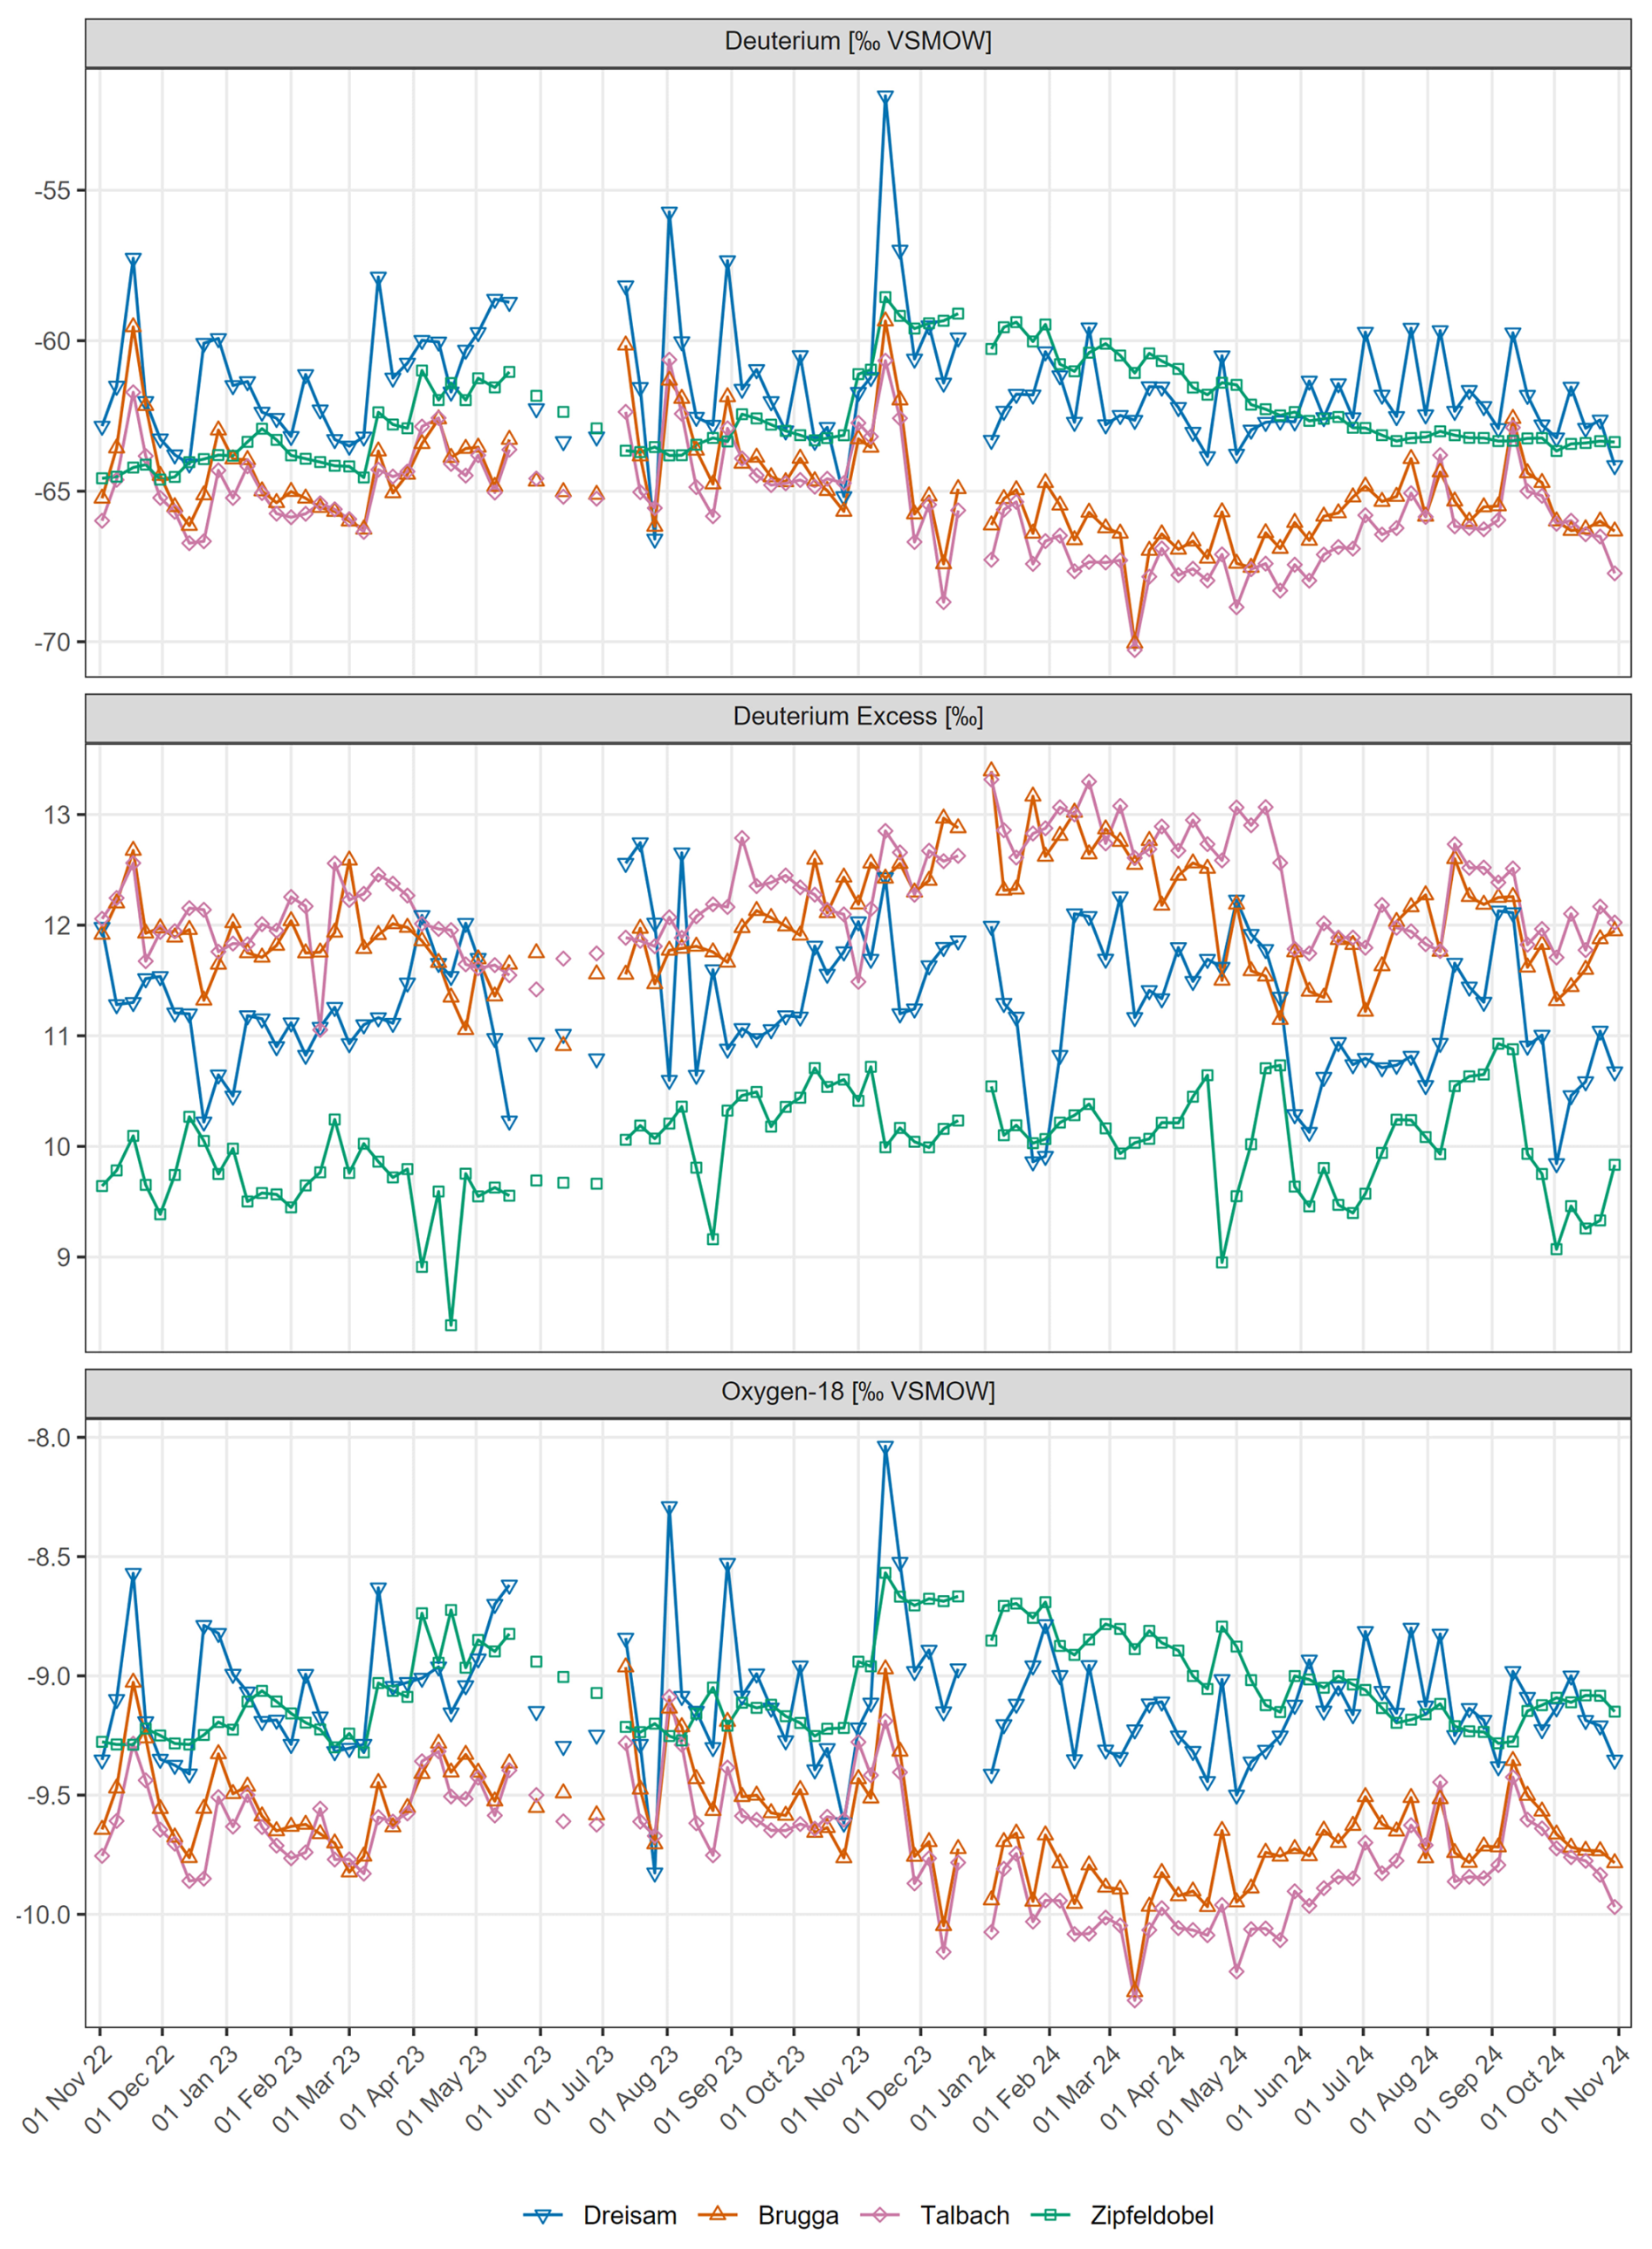
Figure F1Time series of isotopic tracer data recorded in surface waters for the hydrological years 2023 and 2024.
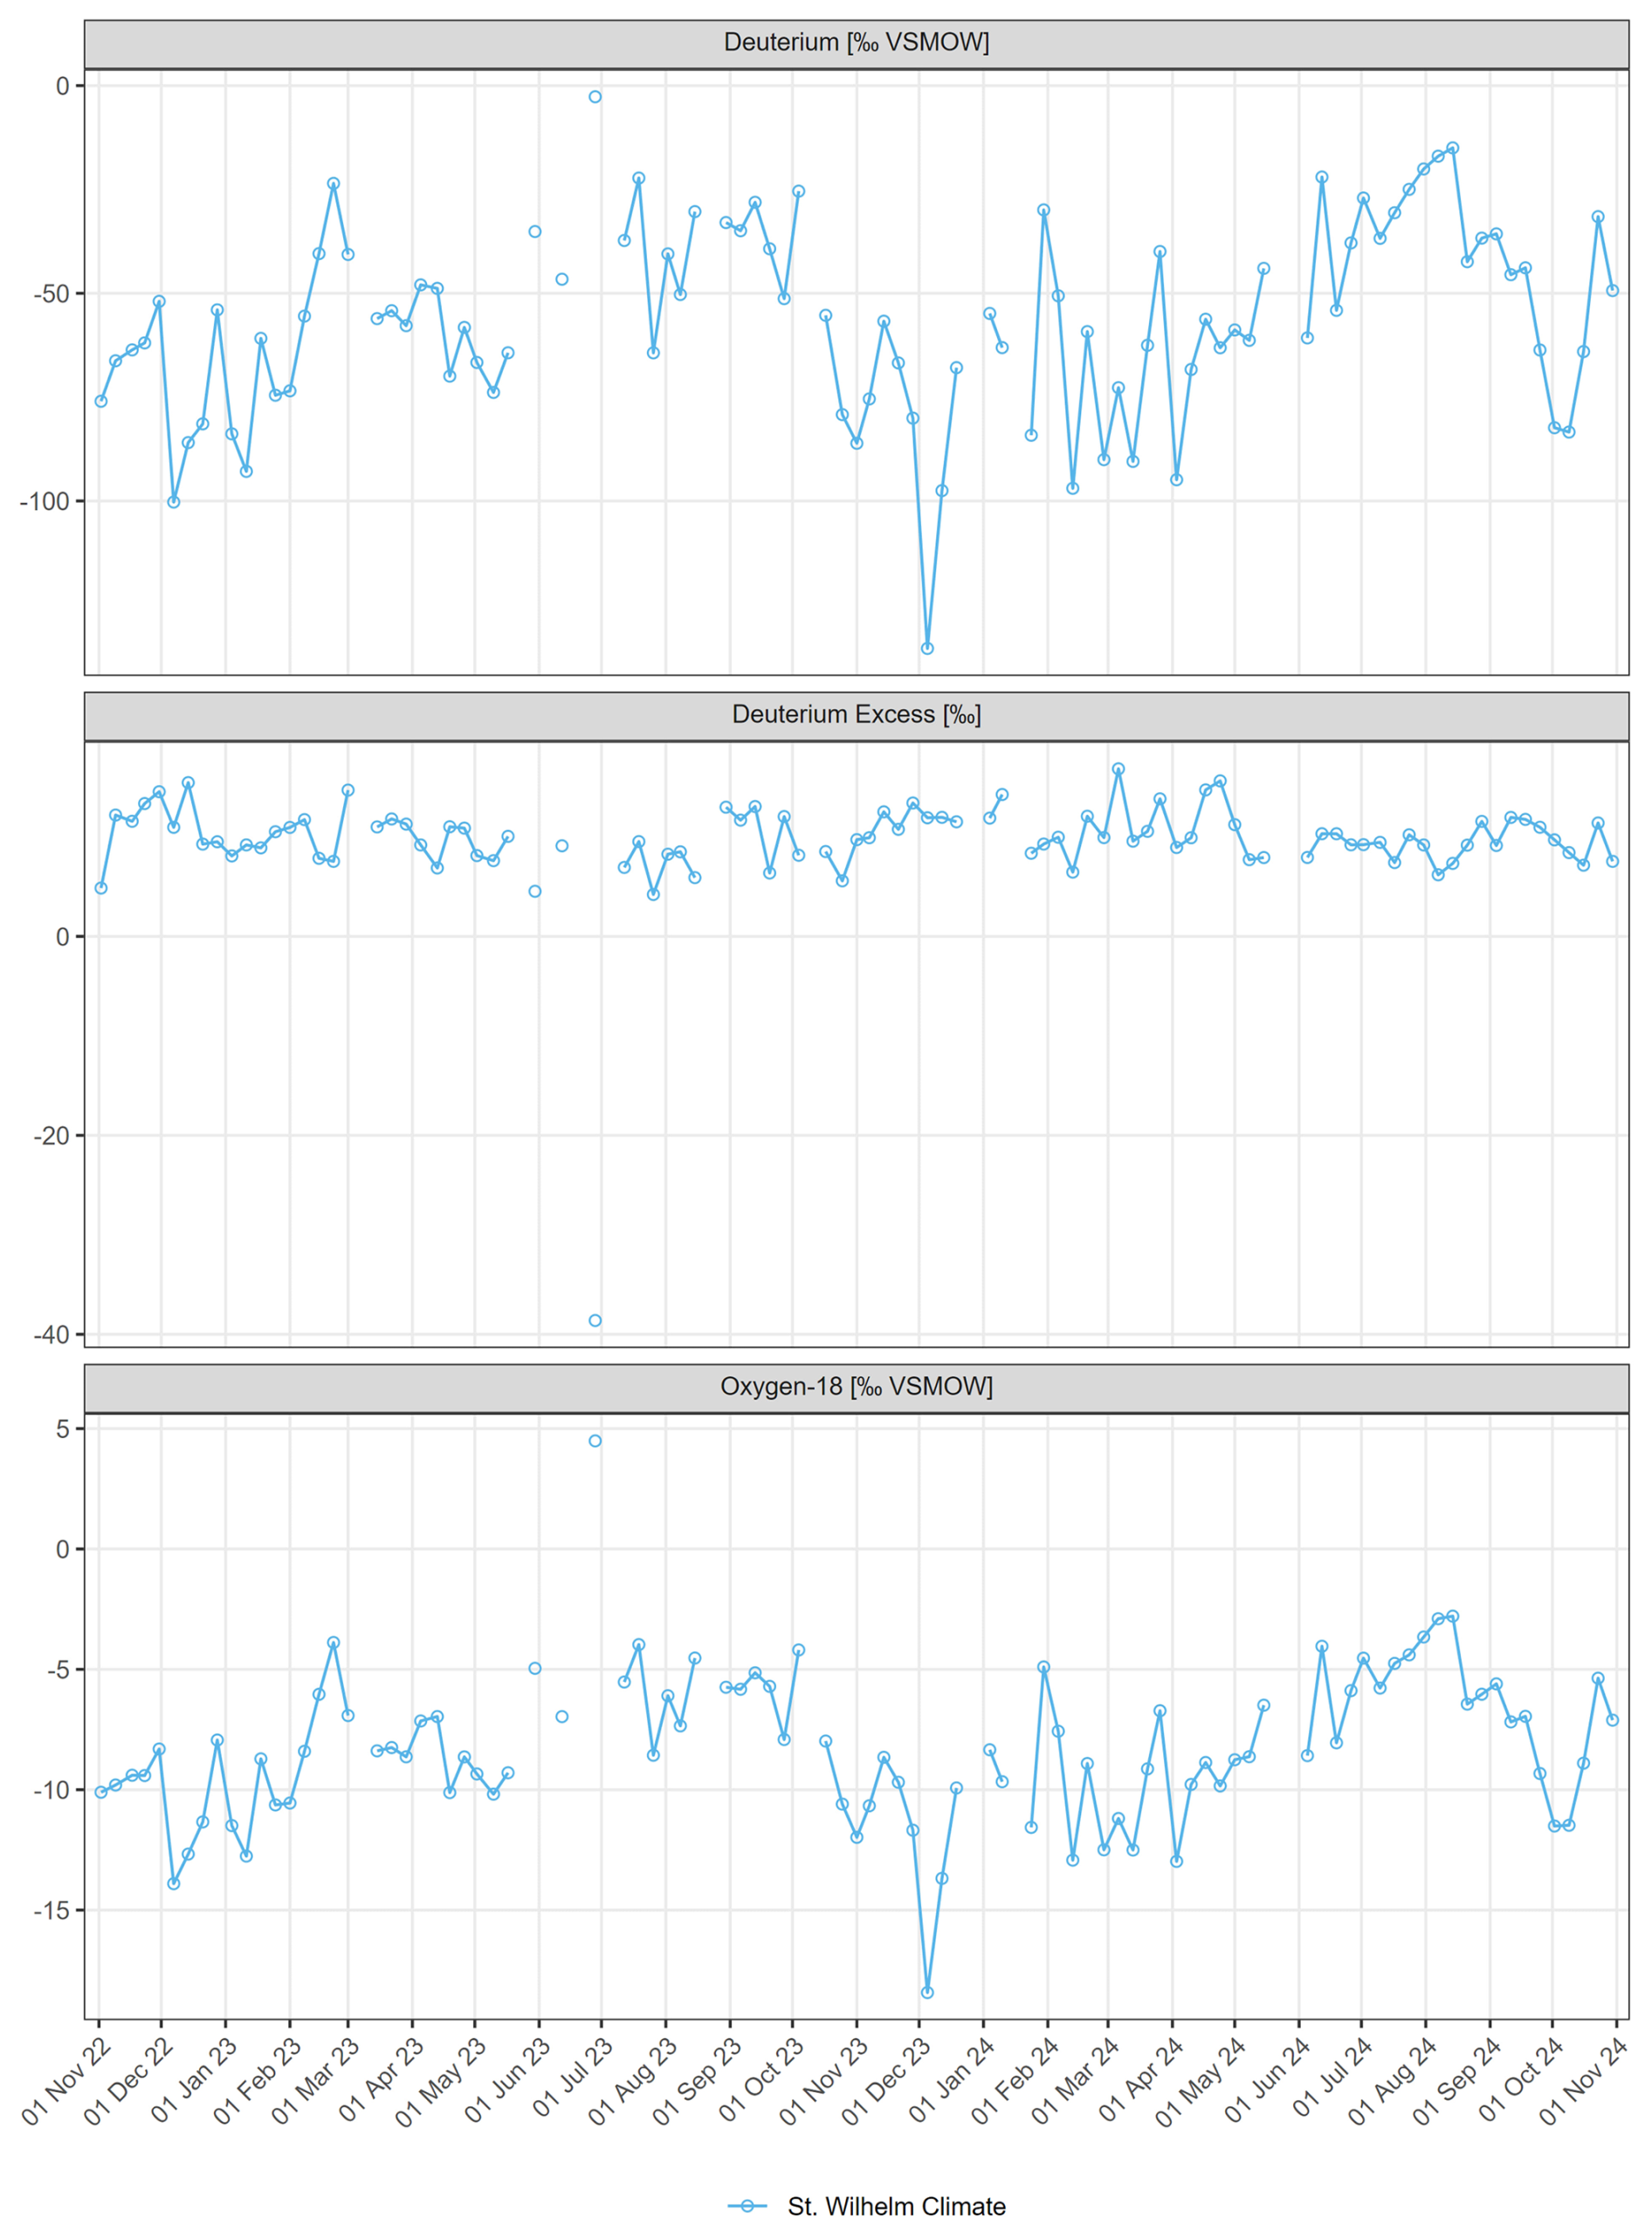
Figure F2Time series of isotopic tracer data recorded in precipitation for the hydrological years 2023 and 2024.
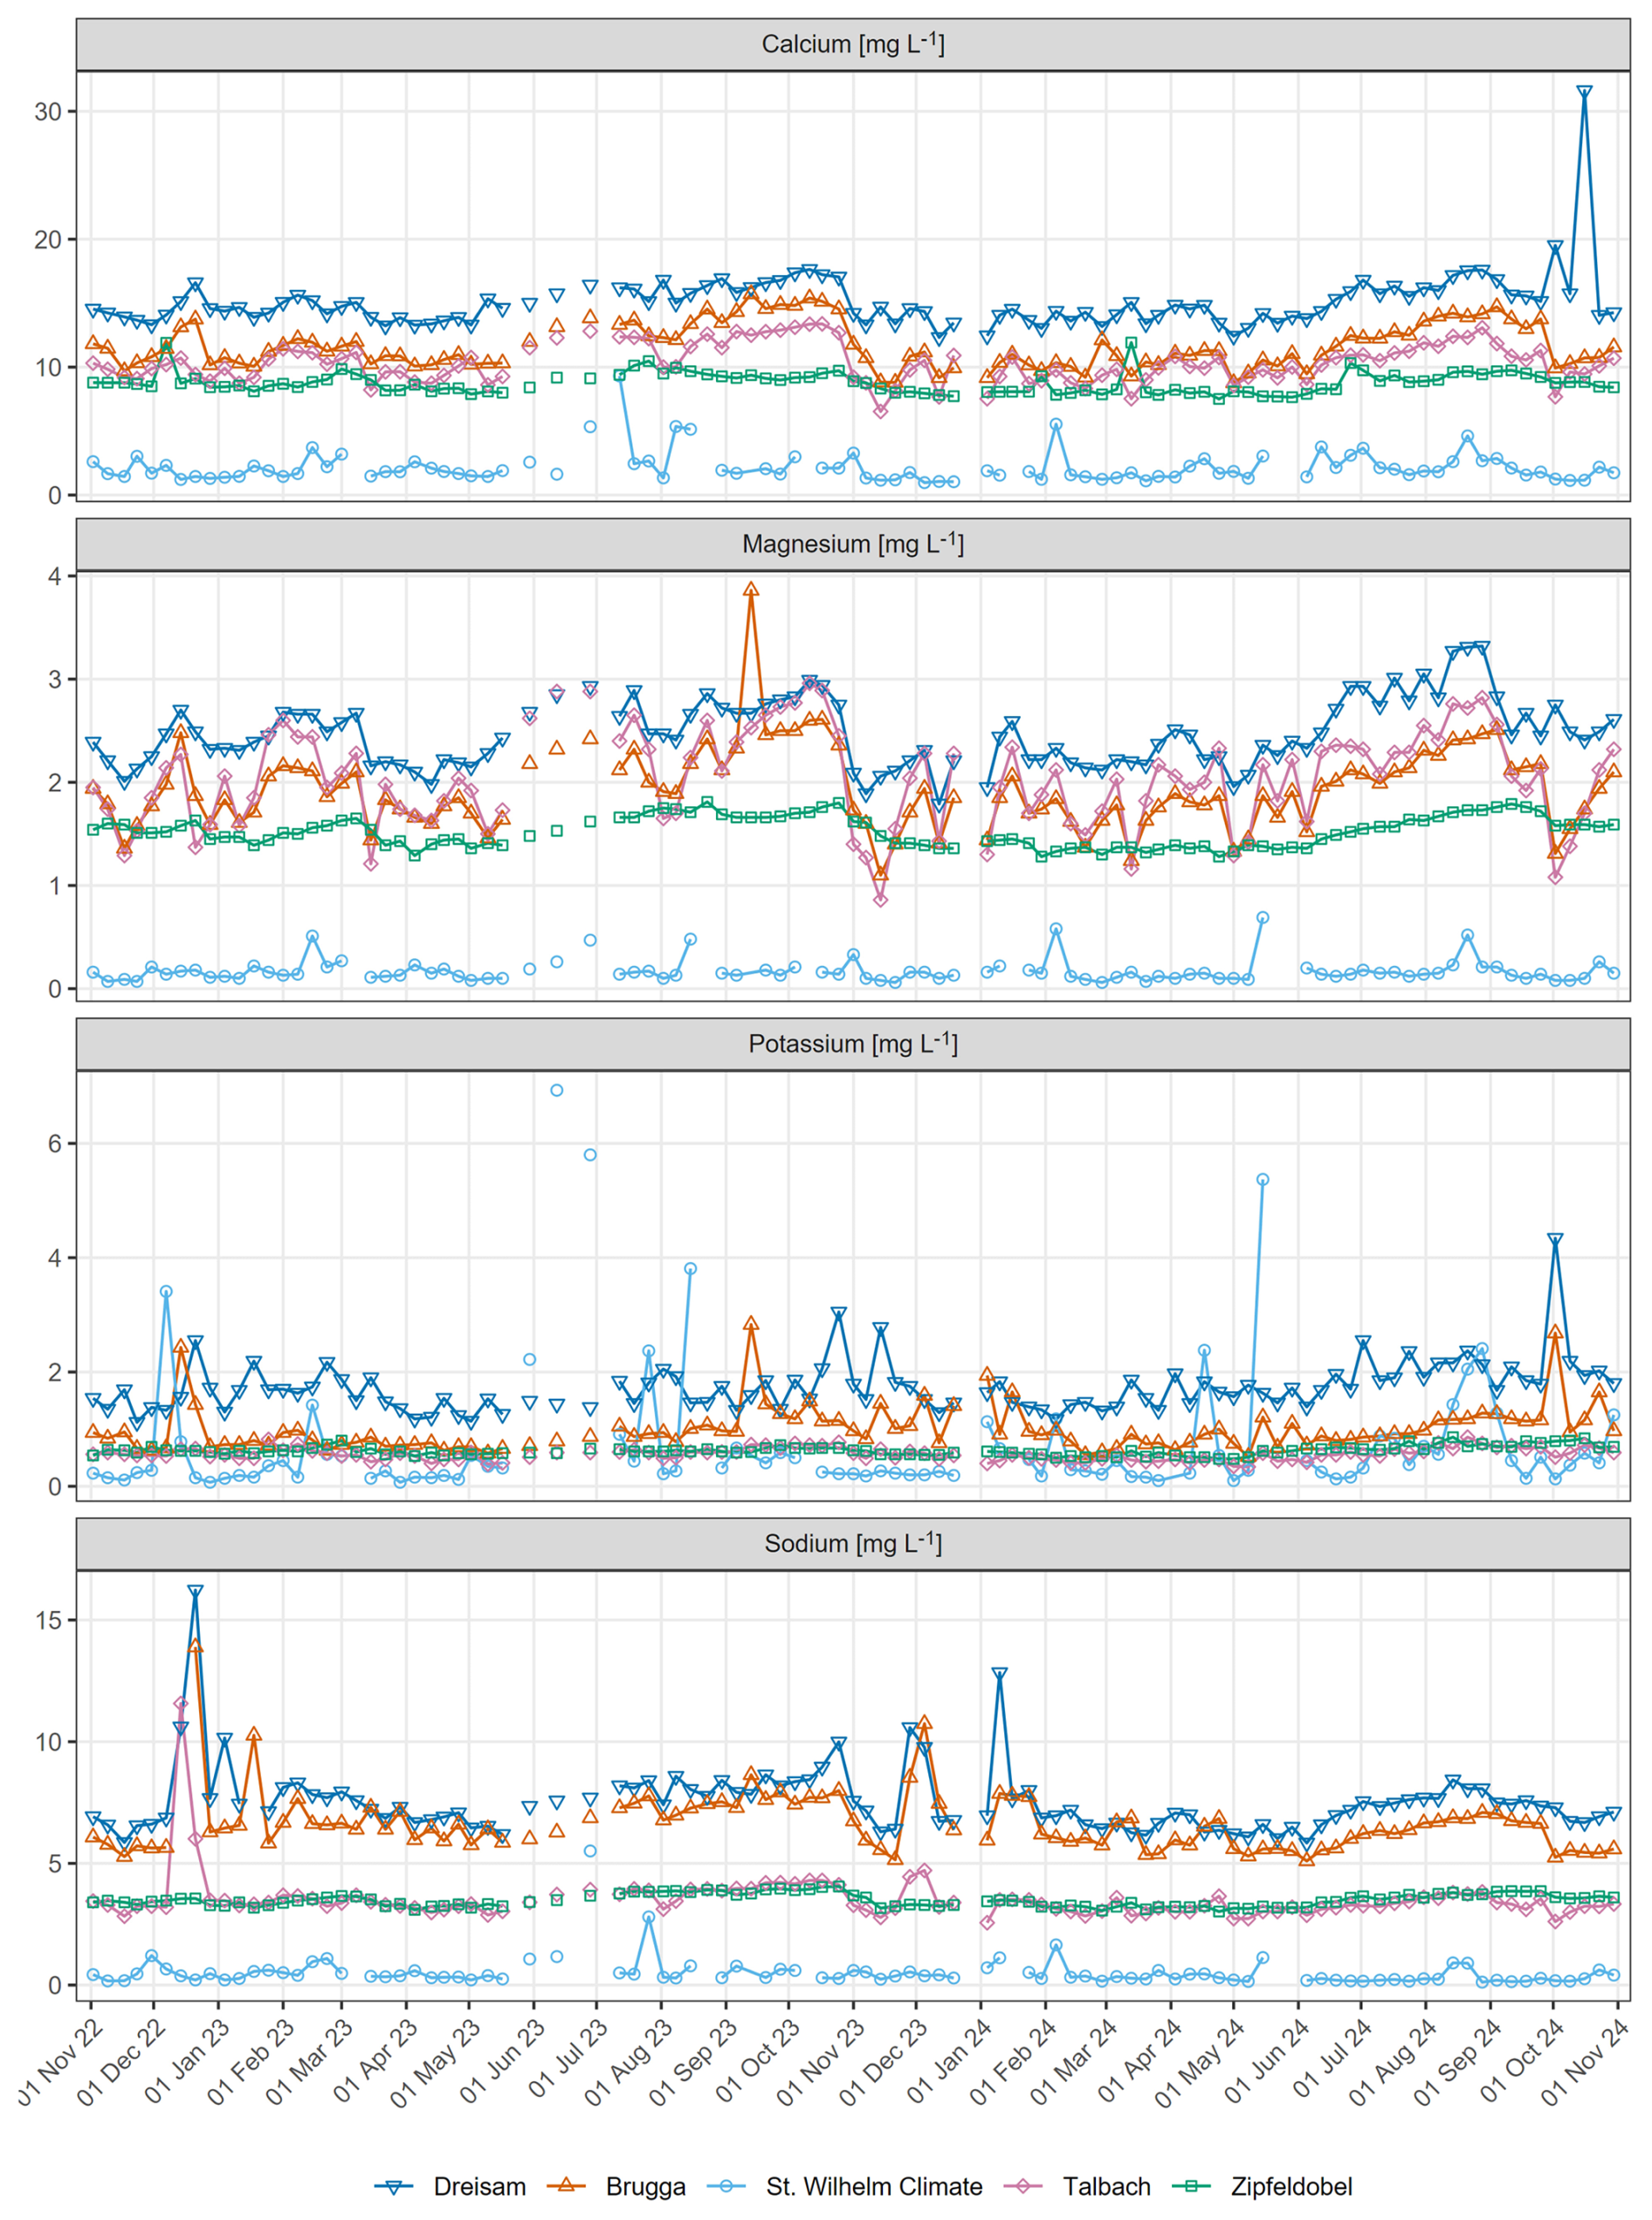
Figure F3Time series of cation tracer data recorded in surface waters and precipitation for the hydrological years 2023 and 2024.
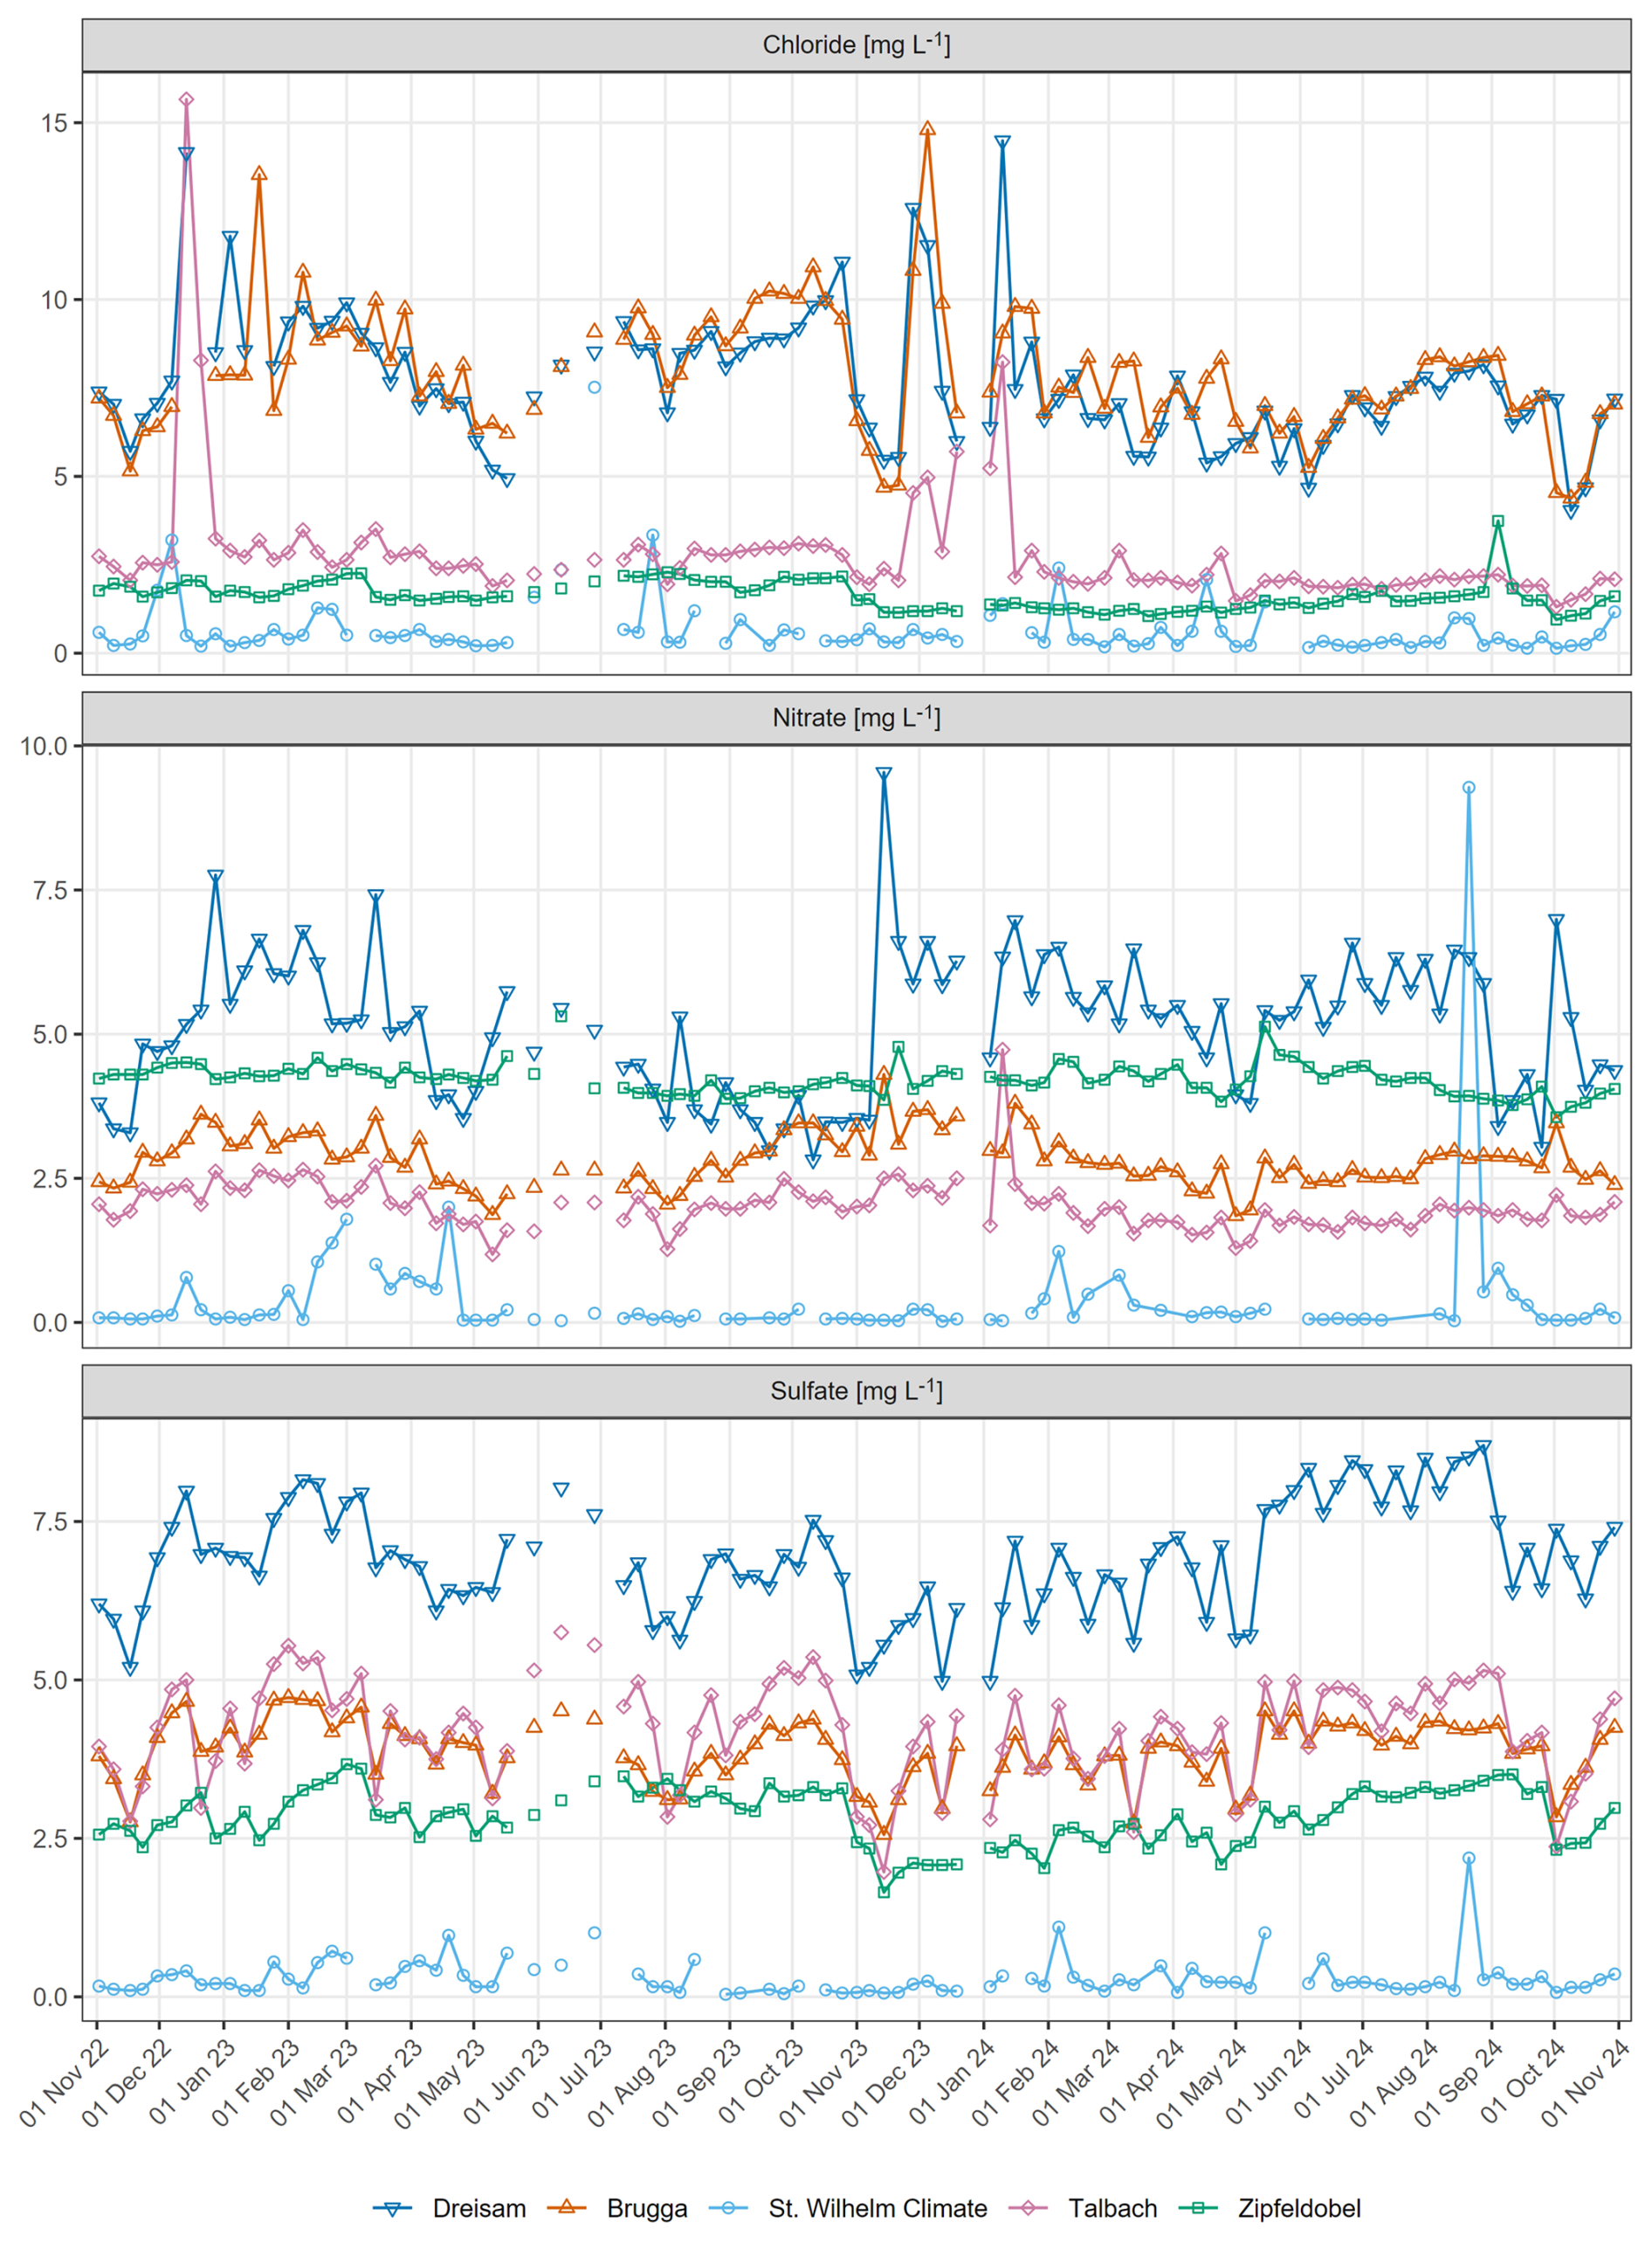
Figure F4Time series of anion tracer data recorded in surface waters and precipitation for the hydrological years 2023 and 2024.
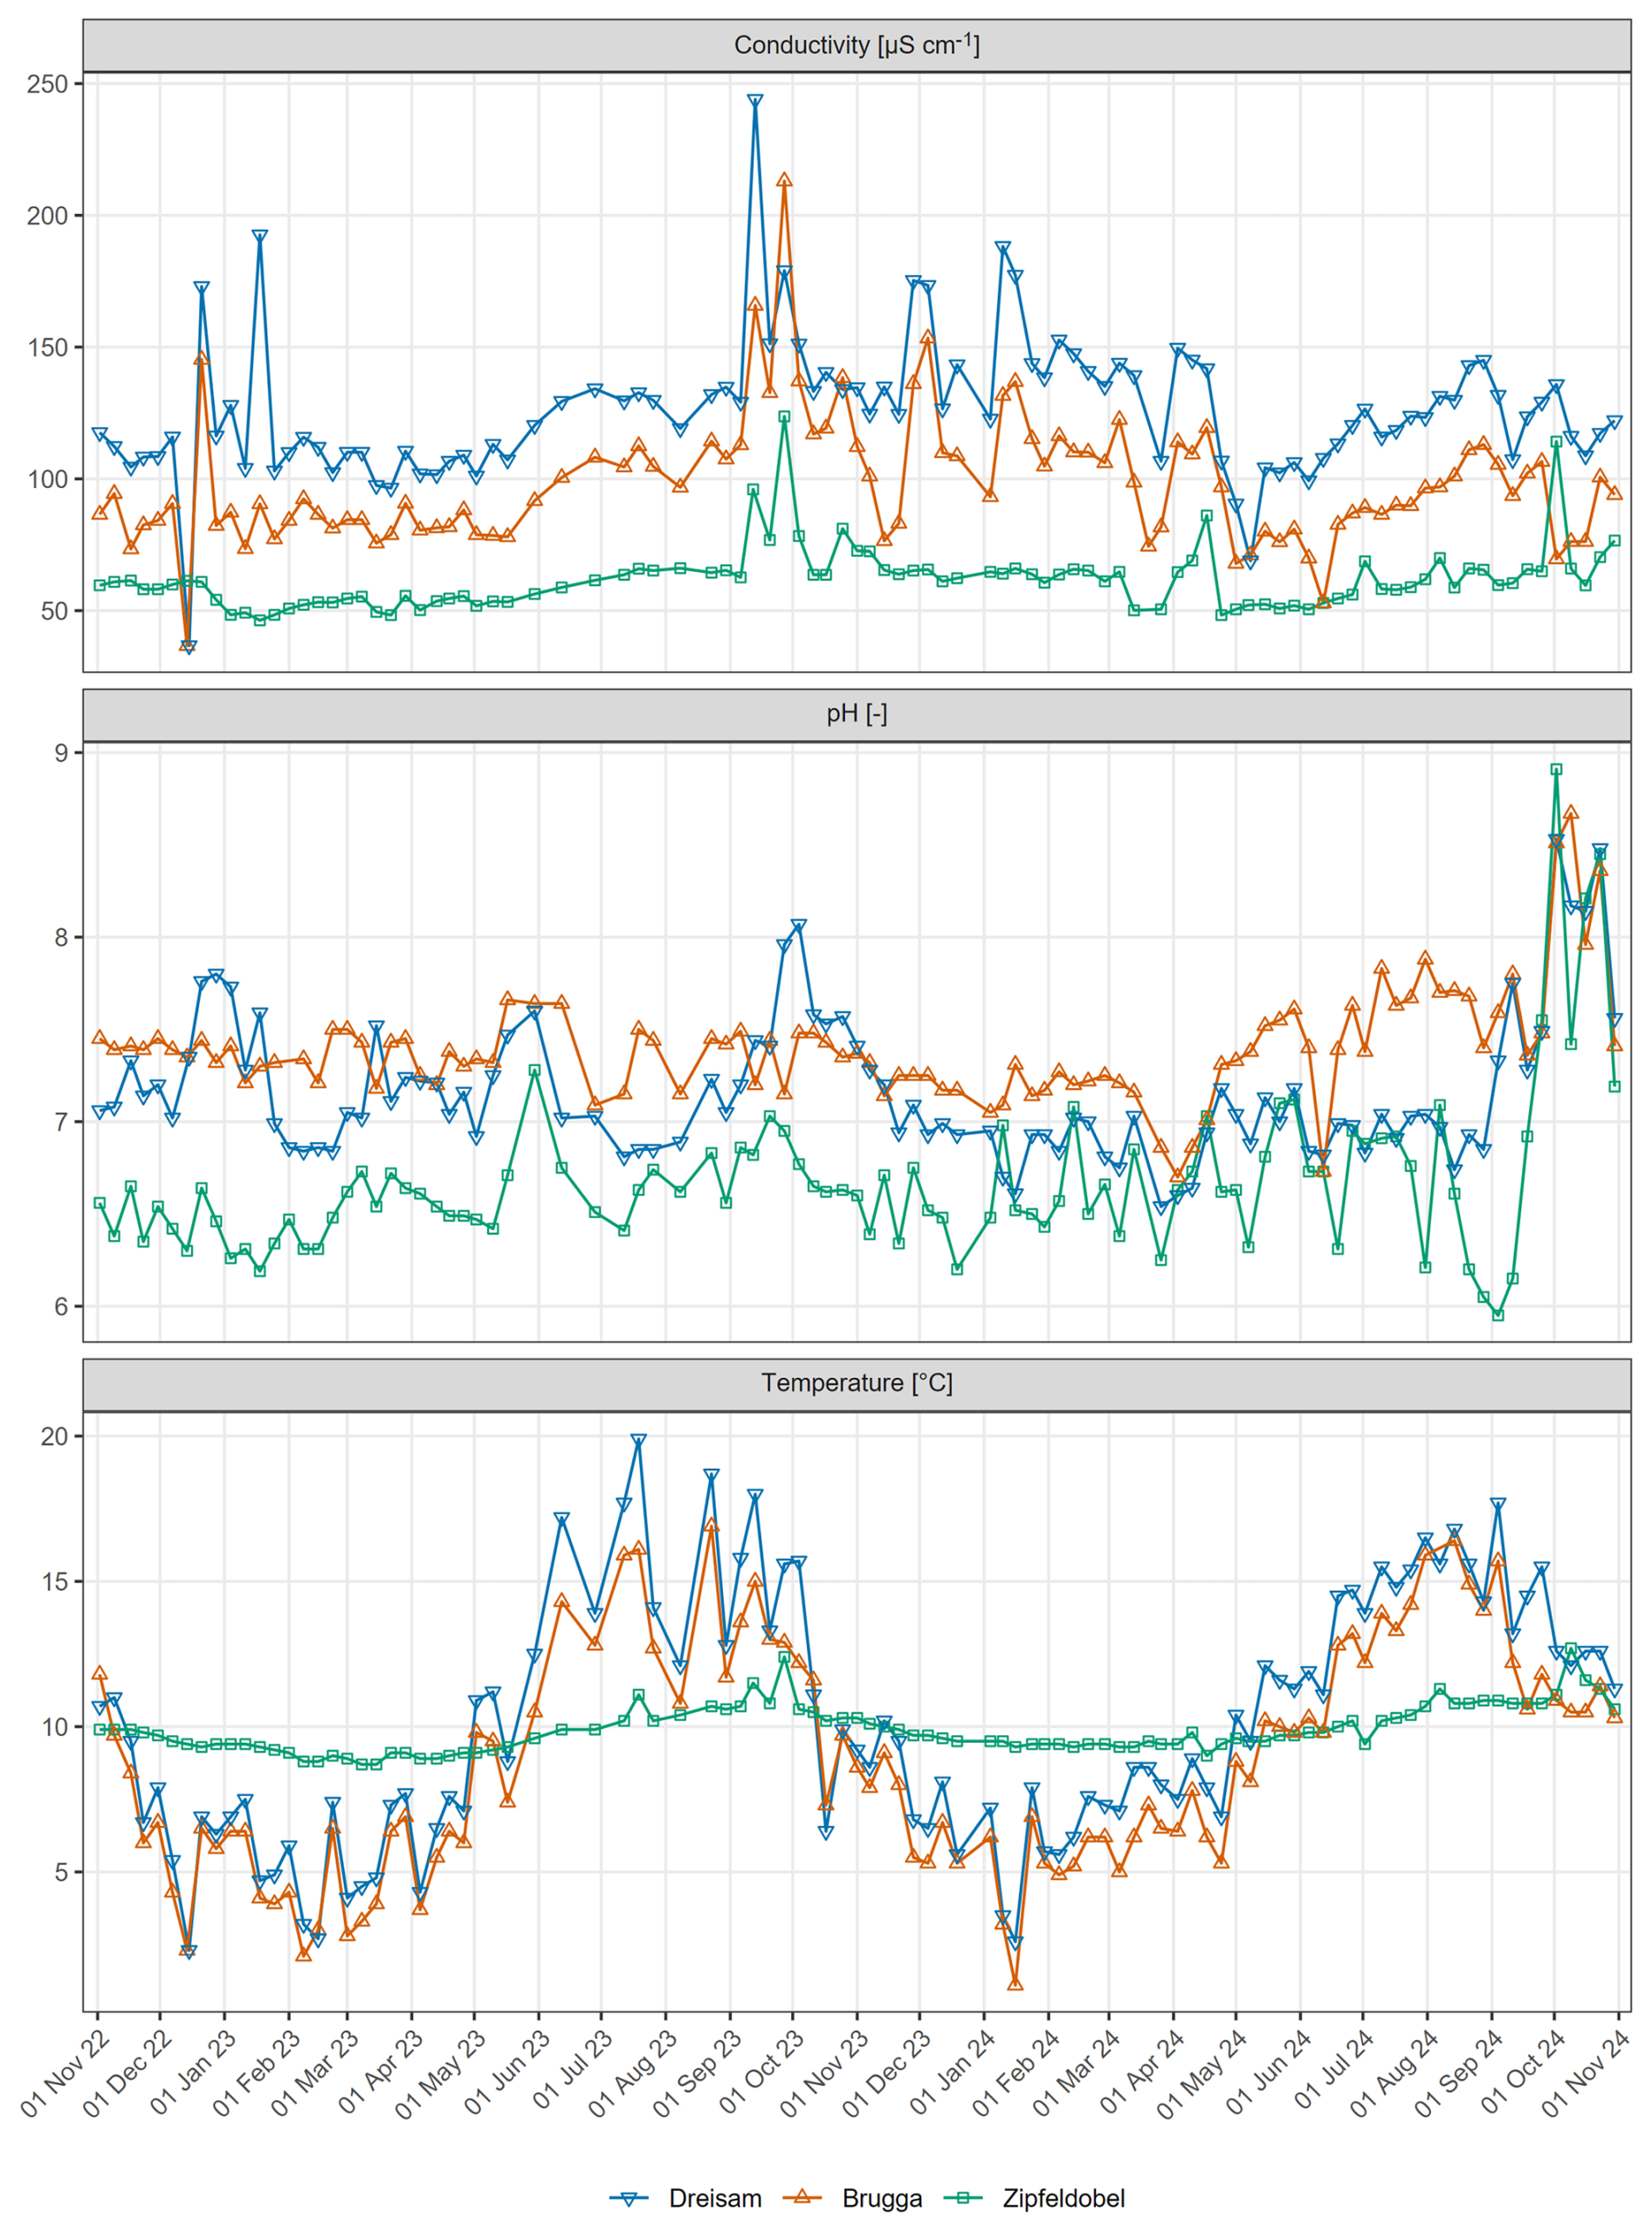
Figure F5Time series of physical parameters recorded in surface waters for the hydrological years 2023 and 2024.
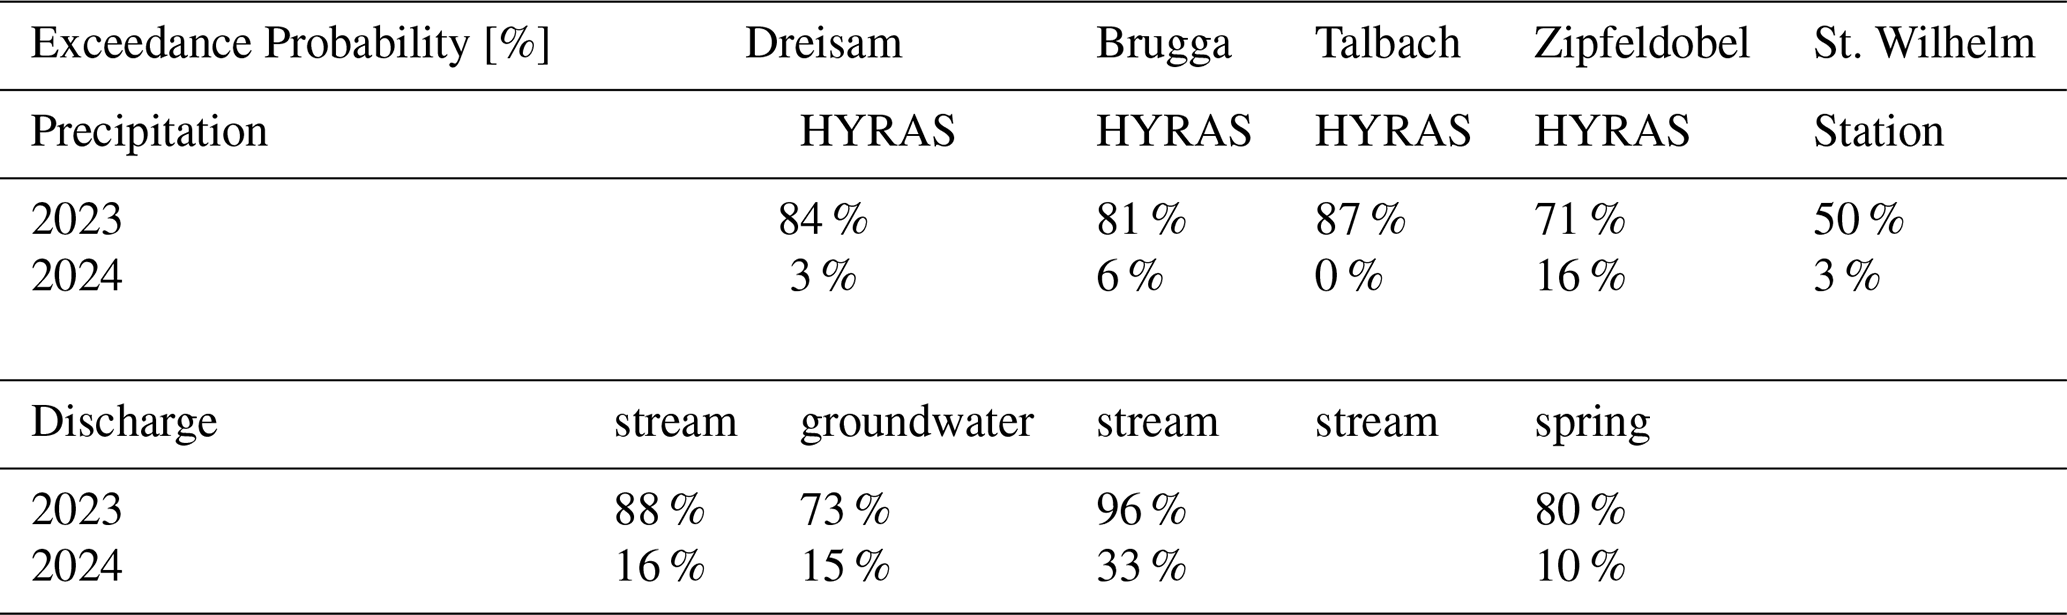
Table G1Exceedance probabilities for annual precipitation and discharge volumes shown in Table 3 for the hydrological years 2023 and 2024 in the 30 years of recorded data (10 for Zipfeldobel).
H1 Error Estimation
H1.1 Bootstrap
Errors for means and weighted means were bootstrapped. The bootstrap method utilizes random resampling with replacement to obtain more observations. We resampled the datasets 10 000 times, added random noise to the data according to the initial errors of the observations and weights, and computed the mean or the weighted mean for each resampling. From the yielded (weighted) means, we calculated the standard error.
H1.2 Discharge
Discharge at the gauges Dreisam, Brugga, and Talbach is measured using a stage-discharge relationship. Therefore, errors occur in the stage measurement and the estimation of the rating curve. (Horner et al., 2018) estimated the median total uncertainty for eight French rivers at different time scales. Uncertainties ranged between 5 % and 34 % for hourly discharge measurement and between 1.4 % and 10 % for annual discharge, with most of the error stemming from the rating curve estimate. Based on those values, we assume 30 % for the 15 and 10 min discharge measurements and 10 % for annual discharge. At Zipfeldobel, the supplier reported a volume error of 0.5 % for the magnetic inductive flow meter. A comparison revealed a CV of 0.49 % between the manual discharge measurements and those obtained using the flow meter. Therefore, 0.5 % was used as the error for individual discharge measurements. The high amount of missing data potentially influences the annual discharge volumes. As a result, the annual volume error could be significantly higher; we assumed 5 times the error of individual measurements, which results in a 2.5 % error. At all locations, the uncertainty of the long-term mean discharge was calculated from the annual discharges and their corresponding errors using the bootstrap method described in the previous chapter.
H1.3 Precipitation
To estimate the error in the annual precipitation input predicted by the HYRAS model, we compared the HYRAS data with historical data from five climate stations located within the Dreisam catchment. The standard error of the annual estimate (σest=14.5 %) (Eq. H1) was used as the standard error for subsequent error propagation. di represents the distance between the estimate and the station value (PS, mm), and n is the sample size:
The reader is referred to Appendix D for a detailed description of the method. The long-term precipitation mean is calculated by bootstrapping from annual precipitation values and their corresponding errors. Manual precipitation measurements at St. Wilhelm climate station were uncertain due to the manual volume measurement. Calculating the amount of precipitation results in an error (σP,weekly) of 0.1 mm for a weekly measurement. Later, we used this error to measure uncertainty for the weights when computing the volume-weighted mean TFA concentration in precipitation. The annual volume error (σP,annual, mm) is calculated as described in Eq. H2:
H1.4 Groundwater Flow
Errors arise from the variance in the found kf-values for the Dreisam aquifer (eight individual kf values from wells, all located within 1 km of the Dreisam gauge) and potential errors in the water-filled area. The error for a mean kf-value was bootstrapped. For the water-filled area (see Fig. C2), we assumed a random error σA=10 %. Errors arising from water table depth measurements were estimated to σΔh=1 cm. We propagated the Gaussian error for the single-year groundwater flow, neglecting errors in the distance measurements (QGIS measurement tool) due to their relatively small impact as described in Eq. (H3). We bootstrapped the error for the 25-year long-term mean.
H1.5 Spring Zipfeldobel catchment area
The error of the mean Zipfeldobel spring catchment area (σA,ZI, m2) is bootstrapped (see Sect. 2.10.1) from the calculated annual catchment areas. The catchment area's error for a single year is given by Eq. (H4):
H1.6 TFA concentrations
The relative standard error of the analytical method (σs, %) is calculated from the relative distances (rdi, %) of all the duplicated measurements from their mean by Eq. (H5) (Eckschlager, 1969):
Errors in the volume-weighted mean TFA concentrations in surface waters were bootstrapped using the standard error of the TFA measurement (1.9 %) and the error of the 15 min discharge values (30 %). Errors for the weighted precipitation means were bootstrapped using the weekly precipitation (±1 mm) and TFA values from the St. Wilhelm climate station. The mean TFA groundwater concentration error was set to 30 % because measurements in the Freiburg drinking water supply indicated seasonal variability, with the same magnitude.
H1.7 Errors of the mass balance's components
The propagation of the error for each component of the mass balance (precipitation input, streamflow output, and groundwater output, kg) was calculated from the concentration ci and the corresponding Volume (Vi, m3) and their corresponding errors ( and , kg and g L−1) according to Eq. (H6):
At Dreisam, the values for groundwater (mGW, kg) and streamflow export (mS, kg) were added together. The error for the sum of both export values (, kg) was calculated according to Eq. (H7):
H1.8 Error of the ET value calculated from TFA concentrations
The error of the ET values from TFA concentrations as calculated in Eq. (F9) results from the errors σ in annual discharge QS and groundwater discharge QGW and the volume-weighted TFA concentrations in precipitation cP, discharge cdis, and groundwater cGW as shown in Eq. (H9):
An R-script, performing the necessary calculations for this paper's results, can be found at https://doi.org/10.5281/zenodo.17572244 (Frenzel, 2025).
Data necessary to reproduce this paper's results are supplied under https://doi.org/10.5281/zenodo.17572244 (Frenzel, 2025).
Conceptualization: IF, JL. Data curation: IF. Formal analysis: IF. Funding acquisition: JL. Investigation: IF, DN. Methodology: DN, IF, FF. Project administration: JL, MM. Resources: JL, MM. Software: IF. Supervision: JL, MM. Validation: IF. Visualization: IF. Writing (original draft preparation): IF, JL. Writing (review and editing): IF, JL, MM, FF, DN.
The contact author has declared that none of the authors has any competing interests.
Publisher's note: Copernicus Publications remains neutral with regard to jurisdictional claims made in the text, published maps, institutional affiliations, or any other geographical representation in this paper. The authors bear the ultimate responsibility for providing appropriate place names. Views expressed in the text are those of the authors and do not necessarily reflect the views of the publisher.
We want to express our sincere thanks to the individuals and organizations who contributed to this research. We thank Badenova and Simon Brenner for providing groundwater samples essential for our analysis. Our appreciation also goes to the anonymous engineering office for supplying conductivity values for the Dreisam aquifer. We acknowledge the Deutscher Wetterdienst (DWD) and Monica Rauthe's assistance in providing the corrected HYRAS version. Special thanks to the Regierungspräsidium Freiburg and Stefanie Rauscher for supplying discharge data for the Brugga River. We are grateful to the AK Andexer for granting us access to the LC-MS system and allowing us to conduct necessary chemical analyses. Furthermore, we thank Adelheid Nagel for her help in the LC-MS sample preparation. Additionally, we would like to thank Barbara Herbstritt for her facilitation of ion chromatography and Franziska Heinel for her sampling efforts. Finally, we would like to thank all partners and founders of the Interreg Project Reactive City for their support in making this work possible. Without the contributions of these individuals and organizations, this study would not have been possible.
Furthermore, we declare that Grammarly AI was used to improve the readability, grammar, and spelling of this manuscript, and GitHub Copilot supported coding.
This research has been supported by the European Regional Development Fund, Interreg (grant no. A3-4).
This open-access publication was funded by the University of Freiburg.
This paper was edited by Bo Guo and reviewed by four anonymous referees.
Albers, C. N. and Sültenfuss, J.: A 60-Year Increase in the Ultrashort-Chain PFAS Trifluoroacetate and Its Suitability as a Tracer for Groundwater Age, Environ. Sci. Technol. Lett., 11, 1090–1095, https://doi.org/10.1021/acs.estlett.4c00525, 2024.
Alexandrino, D. A. M., Almeida, C. M. R., Mucha, A. P., and Carvalho, M. F.: Revisiting pesticide pollution: The case of fluorinated pesticides, Environ. Pollut., 292, 118315, https://doi.org/10.1016/j.envpol.2021.118315, 2022.
Arena, M., Auteri, D., Barmaz, S., Bellisai, G., Brancato, A., Brocca, D., Bura, L., Byers, H., Chiusolo, A., Court Marques, D., Crivellente, F., Lentdecker, C. de, Maglie, M. de, Egsmose, M., Erdos, Z., Fait, G., Ferreira, L., Goumenou, M., Greco, L., Ippolito, A., Istace, F., Jarrah, S., Kardassi, D., Leuschner, R., Lythgo, C., Magrans, J. O., Medina, P., Miron, I., Molnar, T., Nougadere, A., Padovani, L., Parra Morte, J. M., Pedersen, R., Reich, H., Sacchi, A., Santos, M., Serafimova, R., Sharp, R., Stanek, A., Streissl, F., Sturma, J., Szentes, C., Tarazona, J., Terron, A., Theobald, A., Vagenende, B., Verani, A., and Villamar-Bouza, L.: Updated peer review of the pesticide risk assessment of the active substance flurtamone, EFSA Journal, 15, e04976, https://doi.org/10.2903/j.efsa.2017.4976, 2017.
Arp, H. P. H., Gredelj, A., Glüge, J., Scheringer, M., and Cousins, I. T.: The Global Threat from the Irreversible Accumulation of Trifluoroacetic Acid (TFA), Environ. Sci. Technol., 58, 19925–19935, https://doi.org/10.1021/acs.est.4c06189, 2024.
Bachmair, S. and Weiler, M.: Interactions and connectivity between runoff generation processes of different spatial scales, Hydrol. Process., 28, 1916–1930, https://doi.org/10.1002/hyp.9705, 2014.
Berg, M., Müller, S. R., Mühlemann, J., Wiedmer, A., and Schwarzenbach, R. P.: Concentrations and Mass Fluxes of Chloroacetic Acids and Trifluoroacetic Acid in Rain and Natural Waters in Switzerland, Environ. Sci. Technol., 34, 2675–2683, https://doi.org/10.1021/es990855f, 2000.
Berger, T. W., Tartowski, S. L., and Likens, G. E.: Trifluoroacetate Retention in a Northern Hardwood Forest Soil, Environ. Sci. Technol., 31, 1916–1921, https://doi.org/10.1021/es960667e, 1997.
Bhat, A. P., Pomerantz, W. C. K., and Arnold, W. A.: Finding Fluorine: Photoproduct Formation during the Photolysis of Fluorinated Pesticides, Environ. Sci. Technol., 56, 12336–12346, https://doi.org/10.1021/acs.est.2c04242, 2022.
Boutonnet, J. C., Bingham, P., Calamari, D., Rooij, C. de, Franklin, J., Kawano, T., Libre, J.-M., McCul-loch, A., Malinverno, G., Odom, J. M., Rusch, G. M., Smythe, K., Sobolev, I., Thompson, R., and Tiedje, J. M.: Environmental Risk Assessment of Trifluoroacetic Acid, Hum. Ecol. Risk Assess., 5, 59–124, https://doi.org/10.1080/10807039991289644, 1999.
Cahill, T. M., Thomas, C. M., Schwarzbach, S. E., and Seiber, J. N.: Accumulation of trifluoroacetate in seasonal wetlands in California, Environ. Sci. Technol., 35, 820–825, https://doi.org/10.1021/es0013982, 2001.
Cahill, T. M.: Increases in Trifluoroacetate Concentrations in Surface Waters over Two Decades, Environ. Sci. Technol., 56, 9428–9434, https://doi.org/10.1021/acs.est.2c01826, 2022.
CORINE Land Cover: CLMS, European Commission Copernicus Land Monitoring Service, https://land.copernicus.eu/en/products/corine-land-cover (last access: 2 June 2025), 2018.
Dawson, T. E.: Fog in the California redwood forest: ecosystem inputs and use by plants, Oecologia, 117, 476–485, https://doi.org/10.1007/s004420050683, 1998.
Didszun, J. and Uhlenbrook, S.: Scaling of dominant runoff generation processes: Nested catchments approach using multiple tracers, Water Resour. Res., 44, https://doi.org/10.1029/2006WR005242, 2008.
Diehle, M., Schneider, F., Banning, H., and Heinrich, C.: Trifluoroacetate leaching potential from fluorinated pesticides: an emission estimation and FOCUS modelling approach, Environ. Sci. Eur., 37, https://doi.org/10.1186/s12302-025-01215-5, 2025.
Eckschlager, K.: Errors, Measurement and Results in Chemical Analysis, Van Nostrand series in analytical chemistry, Van Nostrand Reinhold Company, ISBN 13 9780442022303, 1969.
Federal Statistical Office of Germany: Landwirtschaftliche Betriebe und Menge an Wirtschaftsdünger auf Ackerland oder Dauergrünland ausgebracht haben, nach Düngerarten, https://www.destatis.de/DE/Themen/Branchen-Unternehmen/Landwirtschaft-Forstwirtschaft-Fischerei/Produktionsmethoden/Tabellen/landwirtschaftliche-betriebe-wirtschaftsduenger.html (last access: 30 October 2025), 2021.
Franklin, J.: The atmospheric degradation and impact of 1,1,1,2-tetrafluoroethane (hydrofluorocarbon 134a), Chemosphere, 27, 1565–1601, 1993.
Freeling, F. and Björnsdotter, M. K.: Assessing the environmental occurrence of the anthropogenic contaminant trifluoroacetic acid (TFA), Current Opinion in Green and Sustainable Chemistry, 41, 100807, https://doi.org/10.1016/j.cogsc.2023.100807, 2023.
Freeling, F., Scheurer, M., Koschorreck, J., Hoffmann, G., Ternes, T. A., and Nödler, K.: Levels and Temporal Trends of Trifluoroacetate (TFA) in Archived Plants: Evidence for Increasing Emissions of Gaseous TFA Precursors over the Last Decades, Environ. Sci. Technol. Lett., 9, 400–405, https://doi.org/10.1021/acs.estlett.2c00164, 2022.
Freeling, F., Behringer, D., Heydel, F., Scheurer, M., Ternes, T. A., and Nödler, K.: Trifluoroacetate in Precipitation: Deriving a Benchmark Data Set, Environ. Sci. Technol., 54, 11210–11219, https://doi.org/10.1021/acs.est.0c02910, 2020.
Frenzel, I.: Markdown and Data – Diffuse sources of TFA: atmospheric and terrestrial inputs, retention and pathways at the catchment scale, Zenodo [code and data set], https://doi.org/10.5281/zenodo.17572244, 2025.
Frey, M.: Tracerhydrologische Untersuchungen im Brugga Einzugsgebiet: Gase, Silikat und stabile Isotopen, Institut for Hydrology, Albert Ludwigs Universität, Freiburg i. Br., https://www.hydrology.uni-freiburg.de/abschluss/Frey_M_1999_DA.pdf (last access: 9 April 2026), 1999.
Fuchs, P., Muller-Westermeier G., and Schmidt, A.: Hydrologischer Atlas von Deutschland, Bundesministerium für Umwelt, Naturschutz und Reaktorsicherheit, ISBN 3-00-005624-6, 2001.
German Environment Agency: Wie wird die landwirtschaftliche Fläche in Deutschland genutzt?, https://www.umweltbundesamt.de/umweltatlas/umwelt-landwirtschaft/einfuehrung/landwirtschaft-in-deutschland/wie-wird-die-landwirtschaftliche-flaeche-in, last access: 30 October 2025.
German Environment Agency: Trifluoroacetate (TFA): Laying the foundations for effective mitigation – Spatial analysis of the input pathways into the water cycle, 75 pp., https://www.umweltbundesamt.de/publikationen/trifluoroacetate-tfa-laying-the-foundations-for (last access: 9 April 2026), 2023.
German Environment Agency: Persistent degradation products of halogenated refrigerants and blowing agents in the environment: type, environmental concentrations, and fate with particular regard to new halogenated substitutes with low global warming potential, 259 pp., https://www.umweltbundesamt.de/en/publikationen/persistent-degradation-products-of-halogenated (last access: 9 April 2026), 2021.
Ghisi, R., Vamerali, T., and Manzetti, S.: Accumulation of perfluorinated alkyl substances (PFAS) in agricultural plants: A review, Environ. Res., 169, 326–341, https://doi.org/10.1016/j.envres.2018.10.023, 2019.
Hangen, E., Lindenlaub, M., Leibundgut, C., and von Wilpert, K.: Investigating mechanisms of stormflow generation by natural tracers and hydrometric data: a small catchment study in the Black Forest, Germany, Hydrol. Process., 15, 183–199, https://doi.org/10.1002/hyp.142, 2001.
Harrell, F. J.: Hmisc, R package version 5.2-3, https://doi.org/10.32614/CRAN.package.Hmisc, 2024.
Henne, S., Storck, F. R., Wöhrnschimmel, H., Leuenberger, M., Vollmer, M. K., and Reimann, S.: Trifluoroacetate (TFA) in precipitation and surface waters in Switzerland: trends, source attribution, and budget, Atmos. Chem. Phys., 25, 18157–18186, https://doi.org/10.5194/acp-25-18157-2025, 2025.
Hoeg, S., Uhlenbrook, S., and Leibundgut, C.: Hydrograph separation in a mountainous catchment – combining hydrochemical and isotopic tracers, Hydrol. Process., 14, 1199–1216, https://doi.org/10.1002/(SICI)1099-1085(200005)14:7<1199::AID-HYP35>3.0.CO;2-K, 2000.
Horner, I., Renard, B., Le Coz, J., Branger, F., McMillan, H. K., and Pierrefeu, G.: Impact of Stage Measurement Errors on Streamflow Uncertainty, Water Resour. Res., 54, 1952–1976, https://doi.org/10.1002/2017WR022039, 2018.
Joerss, H., Freeling, F., van Leeuwen, S., Hollender, J., Liu, X., Nödler, K., Wang, Z., Yu, B., Zahn, D., and Sigmund, G.: Pesticides can be a substantial source of trifluoroacetate (TFA) to water resources, Environ. Int., 193, 109061, https://doi.org/10.1016/j.envint.2024.109061, 2024.
Jordan, A. and Frank, H.: Trifluoroacetate in the Environment. Evidence for Sources Other Than HFC/HCFCs, Environ. Sci. Technol., 33, 522–527, https://doi.org/10.1021/es980674y, 1999.
Kienzler, P. M. and Naef, F.: Subsurface storm flow formation at different hillslopes and implications for the “old water paradox”, Hydrol. Process., 22, 104–116, https://doi.org/10.1002/hyp.6687, 2008.
Kirchner, J. W.: Quantifying new water fractions and transit time distributions using ensemble hydrograph separation: theory and benchmark tests, Hydrol. Earth Syst. Sci., 23, 303–349, https://doi.org/10.5194/hess-23-303-2019, 2019.
Lange, J. and Haensler, A.: Runoff generation following a prolonged dry period, J. Hydrol., 464–465, 157–164, https://doi.org/10.1016/j.jhydrol.2012.07.010, 2012.
Lange, J., Bulka, L., Nöltge, D., Freeling, F., Ilgen, K., Külls, C., and Müller, M.: Trifluoroacetate (TFA) – Potentials and limits of a new hydrological pollution tracer, Sci. Total Environ., 997, 180175, https://doi.org/10.1016/j.scitotenv.2025.180175, 2025.
Li, F., Zhang, C., Qu, Y., Chen, J., Chen, L., Liu, Y., and Zhou, Q.: Quantitative characterization of short- and long-chain perfluorinated acids in solid matrices in Shanghai, China, Sci. Total Environ., 408, 617–623, https://doi.org/10.1016/j.scitotenv.2009.10.032, 2010.
Liang, S.-H., Steimling, J. A., and Chang, M.: Analysis of ultrashort-chain and short-chain (C1 to C4) per- and polyfluorinated substances in potable and non-potable waters, J. Chromatogr. Open, 4, 100098, https://doi.org/10.1016/j.jcoa.2023.100098, 2023.
Likens, G. E., Tartowski, S. L., Berger, T. W., Richey, D. G., Driscoll, C. T., Frank, H. G., and Klein, A.: Transport and fate of trifluoroacetate in upland forest and wetland ecosystems, P. Natl. Acad. Sci. USA, 94, 4499–4503, https://doi.org/10.1073/pnas.94.9.4499, 1997.
Liu, H., He, S., Anenkhonov, O., Guozheng, H., Sandanov, D., and Badmaeva, N.: Topography-Controlled Soil Water Content and the Coexistence of Forest and Steppe in Northern China, Phys. Geogr., 33, https://doi.org/10.2747/0272-3646.33.6.561, 2012.
Liu, J., Kleinman, P. J. A., Aronsson, H., Flaten, D., McDowell, R. W., Bechmann, M., Beegle, D. B., Robinson, T. P., Bryant, R. B., Liu, H., Sharpley, A. N., and Veith, T. L.: A review of regulations and guidelines related to winter manure application, Ambio, 47, 657–670, https://doi.org/10.1007/s13280-018-1012-4, 2018.
Ogawa, Y., Tokunaga, E., Kobayashi, O., Hirai, K., and Shibata, N.: Current Contributions of Organofluorine Compounds to the Agrochemical Industry, iScience, 23, 101467, https://doi.org/10.1016/j.isci.2020.101467, 2020.
Rauthe, M., Steiner, H., Riediger, U., Mazurkiewicz, A., and Gratzki, A.: A Central European precipitation climatology Part I: Generation and validation of a high-resolution gridded daily data set (HYRAS), Meteorol. Z., 22, 235–256, https://doi.org/10.1127/0941-2948/2013/0436, 2013.
Richey, D. G., Driscoll, C. T., and Likens, G. E.: Soil Retention of Trifluoroacetate, Environ. Sci. Technol., 31, 1723–1727, https://doi.org/10.1021/es960649x, 1997.
Richter, D.: Ergebnisse methodischer Untersuchungen zur Korrektur des systematischen Meßfehlers des Hellmann-Niederschlagmessers, Offenbach am Main, 194, 97 pp., https://www.dwd.de/EN/ourservices/pbfb_verlag_berichte/pdf_einzelbaende/194_pdf.pdf?__blob=publicationFile&v=3 (last access: 9 April 2026), 1995.
Scheurer, M. and Nödler, K.: Ultrashort-chain perfluoroalkyl substance trifluoroacetate (TFA) in beer and tea - An unintended aqueous extraction, Food Chem., 351, 129304, https://doi.org/10.1016/j.foodchem.2021.129304, 2021.
Scheurer, M., Nödler, K., Freeling, F., Janda, J., Happel, O., Riegel, M., Müller, U., Storck, F. R., Fleig, M., Lange, F. T., Brunsch, A., and Brauch, H.-J.: Small, mobile, persistent: Trifluoroacetate in the water cycle – Overlooked sources, pathways, and consequences for drinking water supply, Water Res., 126, 460–471, https://doi.org/10.1016/j.watres.2017.09.045, 2017.
Shapiro, S. S. and Wilk, M. B.: An Analysis of Variance Test for Normality (Complete Samples), Biometrika, 52, 591, https://doi.org/10.2307/2333709, 1965.
Seibert, J., Uhlenbrook, S., Leibundgut, C., and Halldin, S.: Multiscale calibration and validation of a conceptual rainfall-runoff model, Phys. Chem. Earth Pt. B, 25, 59–64, https://doi.org/10.1016/S1464-1909(99)00121-5, 2000.
Steinbrich, A., Leistert, H., and Weiler, M.: Model-based quantification of runoff generation processes at high spatial and temporal resolution, Environ. Earth Sci., 75, https://doi.org/10.1007/s12665-016-6234-9, 2016.
Sun, M., Cui, J., Guo, J., Zhai, Z., Zuo, P., and Zhang, J.: Fluorochemicals biodegradation as a potential source of trifluoroacetic acid (TFA) to the environment, Chemosphere, 254, 126894, https://doi.org/10.1016/j.chemosphere.2020.126894, 2020.
Synek, V.: Evaluation of the standard deviation from duplicate results, Accred. Qual. Assur., 13, 335–337, https://doi.org/10.1007/s00769-008-0390-x, 2008.
Tilch, N., Uhlenbrook, S., and Leibundgut, C.: Regionalisierungsverfahren zur Ausweisung von Hydrotopen in von periglazialem Hangschutt geprägten Gebieten, Grundwasser, 7, 206–216, https://doi.org/10.1007/s007670200032, 2002.
Uhlenbrook, S. and Leibundgut, C.: Process-oriented catchment modelling and multiple-response validation, Hydrol. Process., 16, 423–440, https://doi.org/10.1002/hyp.330, 2002.
Uhlenbrook, S.: Untersuchung und Modellierung der Abflußbildung in einem mesoskaligen Einzugsgebiet, Institut für Hydrologie, Albert Ludwigs Universität Freiburg i. Br., Freiburg i. Br., 218 pp., https://www.hydrology.uni-freiburg.de/publika/FSH-Bd10-Uhlenbrook.pdf (last access: 9 April 2026), 1999.
Uhlenbrook, S., Frey, M., Leibundgut, C., and Maloszewski, P.: Hydrograph separations in a mesoscale mountainous basin at event and seasonal timescales, Water Resour. Res., 38, https://doi.org/10.1029/2001WR000938, 2002.
Wang, Q., Wang, X., and Ding, X.: Rainwater trifluoroacetic acid (TFA) in Guangzhou, South China: levels, wet deposition fluxes and source implication, Sci. Total Environ., 468–469, 272–279, https://doi.org/10.1016/j.scitotenv.2013.08.055, 2014.
Wenninger, J., Uhlenbrook, S., Tilch, N., and Leibundgut, C.: Experimental evidence of fast groundwater responses in a hillslope/floodplain area in the Black Forest Mountains, Germany, Hydrol. Process., 18, 3305–3322, https://doi.org/10.1002/hyp.5686, 2004.
Wood, W. W. and Sanford, W. E.: Chemical and Isotopic Methods for Quantifying Ground-Water Recharge in a Regional, Semiarid Environment, Groundwater, 33, 458–468, https://doi.org/10.1111/j.1745-6584.1995.tb00302.x, 1995.
Xu, B., Alizray, R., Lammel, D. R., Riedel, S., and Rillig, M. C.: Concentration-dependent response of soil parameters and functions to trifluoroacetic acid, European J. Soil Science, 73, e13266, https://doi.org/10.1111/ejss.13266, 2022.
- Abstract
- Introduction
- Materials and Methods
- Results
- Discussion
- Conclusion
- Appendix A
- Appendix B
- Appendix C
- Appendix D
- Appendix E
- Appendix F
- Appendix G
- Appendix H
- Code availability
- Data availability
- Author contributions
- Competing interests
- Disclaimer
- Acknowledgements
- Financial support
- Review statement
- References