the Creative Commons Attribution 4.0 License.
the Creative Commons Attribution 4.0 License.
 | 23 Oct 2025
Enhancing urban pluvial flood modeling through graph reconstruction of incomplete sewer networks
Jiapei Liu
Jian Shao
Fuqiang Tian
Guangheng Ni
This work presents an efficient graph-reconstruction-based approach for generating physical sewer models from incomplete information, addressing the challenge of representing the sewer drainage effect in urban pluvial flood simulations. The approach utilizes graph-based topological analysis and hydraulic design constraints to derive gravitational flow directions and nodal invert elevations in decentralized sewer networks with multiple outfalls. By incorporating linearized programming formulation to solve reconstruction problems, this approach can achieve high computational efficiency, making it suitable for application to city-scale sewer networks with thousands of nodes and links. Tested in Yinchuan, China, the approach integrates with a 1D/2D coupled hydrologic–hydrodynamic model and accurately reproduces maximum inundation depths (R2=0.95) when the complete network layout and regulated facilities are available. Simplifications, such as the adoption of road-based layouts and the omission of regulated facilities, can degrade simulation performance for extreme rainfall events compared to calibrated equifinal methods. However, design rainfall analysis demonstrates that the physical reconstruction approach can reliably outperform equifinal methods, achieving reduced variation and higher accuracy in simulating inundation areas. However, proper configuration of regulated facilities and network connectivity remains crucial, particularly for simulating local inundation during extreme rainfall. Thus, it is recommended that the proposed algorithm be integrated with targeted field investigations to further improve urban pluvial flood simulation performance in data-scarce regions.
- Article
(15524 KB) - Full-text XML
-
Supplement
(1527 KB) - BibTeX
- EndNote


Global climate change and intensified human activities have significantly altered climatic conditions and surface environments, leading to an increase in the frequency and magnitude of urban pluvial floods, particularly where rainfall exceeds the design capacity of drainage systems (Rosenzweig et al., 2018). As key drainage infrastructure, sewer networks can effectively mitigate pluvial flood risks by transporting rainwater to downstream sites such as river channels and detention ponds (Wang et al., 2022). However, their performance can be inherently insufficient and gradually deteriorate due to outdated design and poor maintenance (Tran et al., 2024), potentially resulting in system overflow and worsening surface flood conditions during extreme rainfall events (Schmitt and Scheid, 2020). Thus, accurately modeling the drainage effects of sewer networks is essential for urban pluvial flood simulation and risk attribution (Luan et al., 2024).
However, detailed sewer network information may not always be available, and implementing it in hydraulic models requires laborious work with highly uncertain outcomes (Montalvo et al., 2024). As a result, various simplified approaches have been developed to approximate the effect of sewer drainage. These approaches typically introduce the term sewer-induced mass loss in rainfall–runoff simulations within specific regions, such as roads and inlets (Li et al., 2020; Xing et al., 2021, 2019). However, such approaches fail to explicitly account for the relative differences in hydraulic head between sewer networks and surface water, and thus are incapable of capturing critical processes such as overflow caused by system overload. To address these limitations, Montalvo et al. (2024) proposes a physics-based approach that can be used to design a representative virtual sewer network using publicly available datasets and local design standards. This approach enables the development of a physical sewer hydraulic model with bidirectional interactions between surface and sewer flows, thereby offering a more comprehensive representation of sewer drainage processes. The virtual network design (VND) consists mainly of two steps:
-
Layout definition. This step determines the geometric connections and hydraulic directions between nodes in the sewer network. Typical algorithms include surface-elevation-driven delineation (Blumensaat et al., 2012; Duque et al., 2022), graph-theory-based modeling (Bakhshipour et al., 2019; Kim et al., 2021), and street-network-guided configuration (Chegini and Li, 2022; Reyes-Silva et al., 2023). Most existing work assumes the target system to be a centralized layout with a single outfall (Hesarkazzazi et al., 2022), facilitating the application of tree-based solutions such as the minimum spanning tree (Reyes-Silva et al., 2023) and the Steiner minimal tree (Machine Hsie and Huang, 2019). However, this simplification ignores the rich topological structures of real-world decentralized networks with potential cycles and forests (Bakhshipour et al., 2019). Furthermore, most approaches assume that gravitational flow direction aligns with surface gradients – an assumption that may not hold in flat urban areas or in the presence of inaccurate elevation data (Hesarkazzazi et al., 2022; Dunton and Gardoni, 2024).
-
Hydraulic design. In this step, the sizes and slopes of pipes are determined, as well as the configuration of rainwater treatment facilities, with the objective of satisfying the design discharge requirements estimated by the Rational Method (Wang and Wang, 2018; Reyes-Silva et al., 2023). To achieve this, most approaches formulate the design task as an optimization problem and employ mathematical programming techniques such as linear programming (Swamee and Sharma, 2013), mixed-integer linear programming (Safavi and Geranmehr, 2017), nonlinear programming (Li and Matthew, 1990), and multi-objective programming (Bakhshipour et al., 2021). However, it requires significant computational efforts to obtain global optima in nonlinear or integer cases. Thus, approximate approaches such as piecewise linearization (Elimam et al., 1989), evolutionary algorithms (Wang et al., 2017; Bakhshipour et al., 2021), and topological-driven prediction-correction (Sitzenfrei et al., 2020; Chegini and Li, 2022) are proposed to alleviate the computational burden associated with optimization procedures. Nevertheless, a trade-off between approximation-based solution quality and computational efficiency still exists for large-scale cases (Yu et al., 2024).
Considering previous achievements in VND, this study further proposes a virtual network reconstruction (VNR) approach to improve the physical realism of sewer representations in urban pluvial flood simulations. While VND optimizes network design for economic costs and drainage performance, VNR estimates the most possible network properties constrained by partially known information. Although existing tools such as SWMManywhere (Dobson et al., 2025) offer practical solutions for high-quality VND using publicly available datasets, certain discrepancies between virtual and real networks exist due to inherent assumptions and simplifications, such as predefined road alignments for network topology, river proximity for outfall placement, and ideal hydraulic design using the Rational Method. These discrepancies can potentially alter hydrological connectivity and lead to the poor performance of flood simulations (Tran et al., 2024). Thus, to enhance the physical realism of virtual networks, additional efforts should be devoted to incorporating partially known information as constraints for network generation. This leads to a critical challenge: while basic network attributes, such as terminal nodes, spatial layout, and pipe sizes, can be identified and easily adjusted through existing VND toolsets, field surveys, and engineering drawings, key hydraulic parameters, such as flow direction and invert elevation, often remain unknown or are hard to estimate efficiently at city scale. To bridge this gap, we present our VNR approach, which integrates partial network information with surface elevation data to derive the most possible hydraulic parameters, thereby reducing the simulation uncertainty associated with sewer drainage effects in urban flood modeling.
In the remainder of this paper, we first describe the proposed workflow for VNR (Sect. 2) along with the corresponding 1D/2D coupled hydrologic-hydrodynamic model for urban pluvial flood simulation (Sect. 3). We then conduct a comparative analysis of flood simulation performance given varying levels of information completeness during reconstruction, taking into account factors such as regulated facility removal and road-based layout simplification (Sect. 4).
2.1 Graph representation of sewer networks
The necessary inputs for sewer network reconstruction include the sewer network layout with specified outfalls and the corresponding digital elevation model (DEM). For convenience of topological analysis, we represent the sewer network as an undirected graph , where V={vi} and represent the sets of nodes and links, respectively (Shi et al., 2023). Then we can specify the link directions as related gravitational flow directions and convert the original undirected graph to the corresponding directed form , where represents the set of directed links evaluated as follows:
where and 𝒩G(vi) represent the neighboring nodes of node vj in GD and G.
For one node vi, its out-degree dout,i and in-degree din,i can be defined as the number of directed links pointed from/to it:
In addition to these basic attributes, some useful structures can be derived from the graph representation. Considering the potential cycles in the geometric layout of G, we identify the set of simple cycles 𝒞={Ck} defined as the set of closed paths where no node appears twice (Johnson, 1975), such as C1 and C2 in Fig. 1. For a cycle Ck∈𝒞, we group its internal nodes into the corresponding set, denoted by CVk, where the ith node is indexed by . Then its out-degree dCout,k and in-degree dCin,k can be defined as follows:
where 𝒩G(vi)\CVk represents the difference set between 𝒩G(vi) and CVk, i.e., the set of nodes that are neighboring nodes of vi but not in Ck.
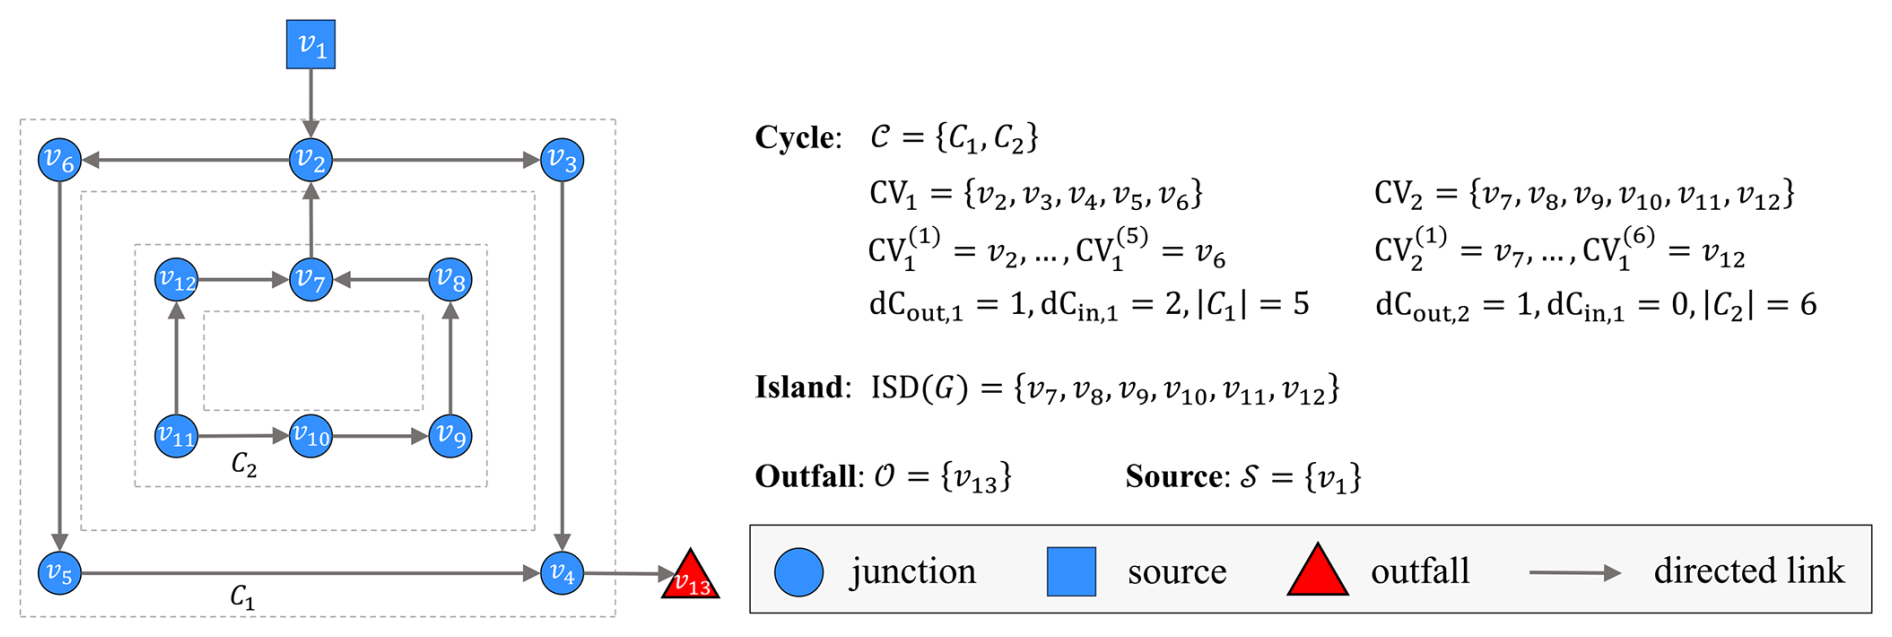
Figure 1Cycles, islands, outfalls, and sources in the graph-based sewer network representation.
According to Eq. (3), we define a cycle Ck as an “island” if the sum of its in-degree and out-degree is equal to 1, such as C2 in Fig. 1. We further denote the set of nodes located in the islands of G as ISD(G):
In addition to general properties, we also consider some sewer-related hydraulic characteristics for the convenience of the following analysis. For a node vi∈V, we include it in the set of outfalls (denoted as 𝒪) if its out-degree is 0 and in-degree is 1, such as v13 in Fig. 1, or in the set of sources (denoted as 𝒮) if its in-degree is 0 and out-degree is 1, such as v1 in Fig. 1:
During practical usage, the set of sources can be derived as the difference set between the set of predefined outfalls and the set of nodes whose in-degree and out-degree sum to 1.
To allow for hydraulic simulation, we attach the invert elevation attribute to vi (denoted as zi), which can be initialized as follows:
where is the initial value of zi; zg,i is the surface elevation at the location of vi; Dmin is the minimum allowable cover depth and is set as Dmin=0.6 m by default (MOHURD, 2021).
By comparing the invert elevations of neighboring nodes, link directions can be initialized as follows:
2.2 Gravitational flow direction derivation
Since flow direction initialization using Eq. (7) does not consider the necessary topological constraints for a feasible layout of the sewer network (Fig. 2), it may produce an unfeasible or unreasonable layout that requires further correction (Reyes-Silva et al., 2023).
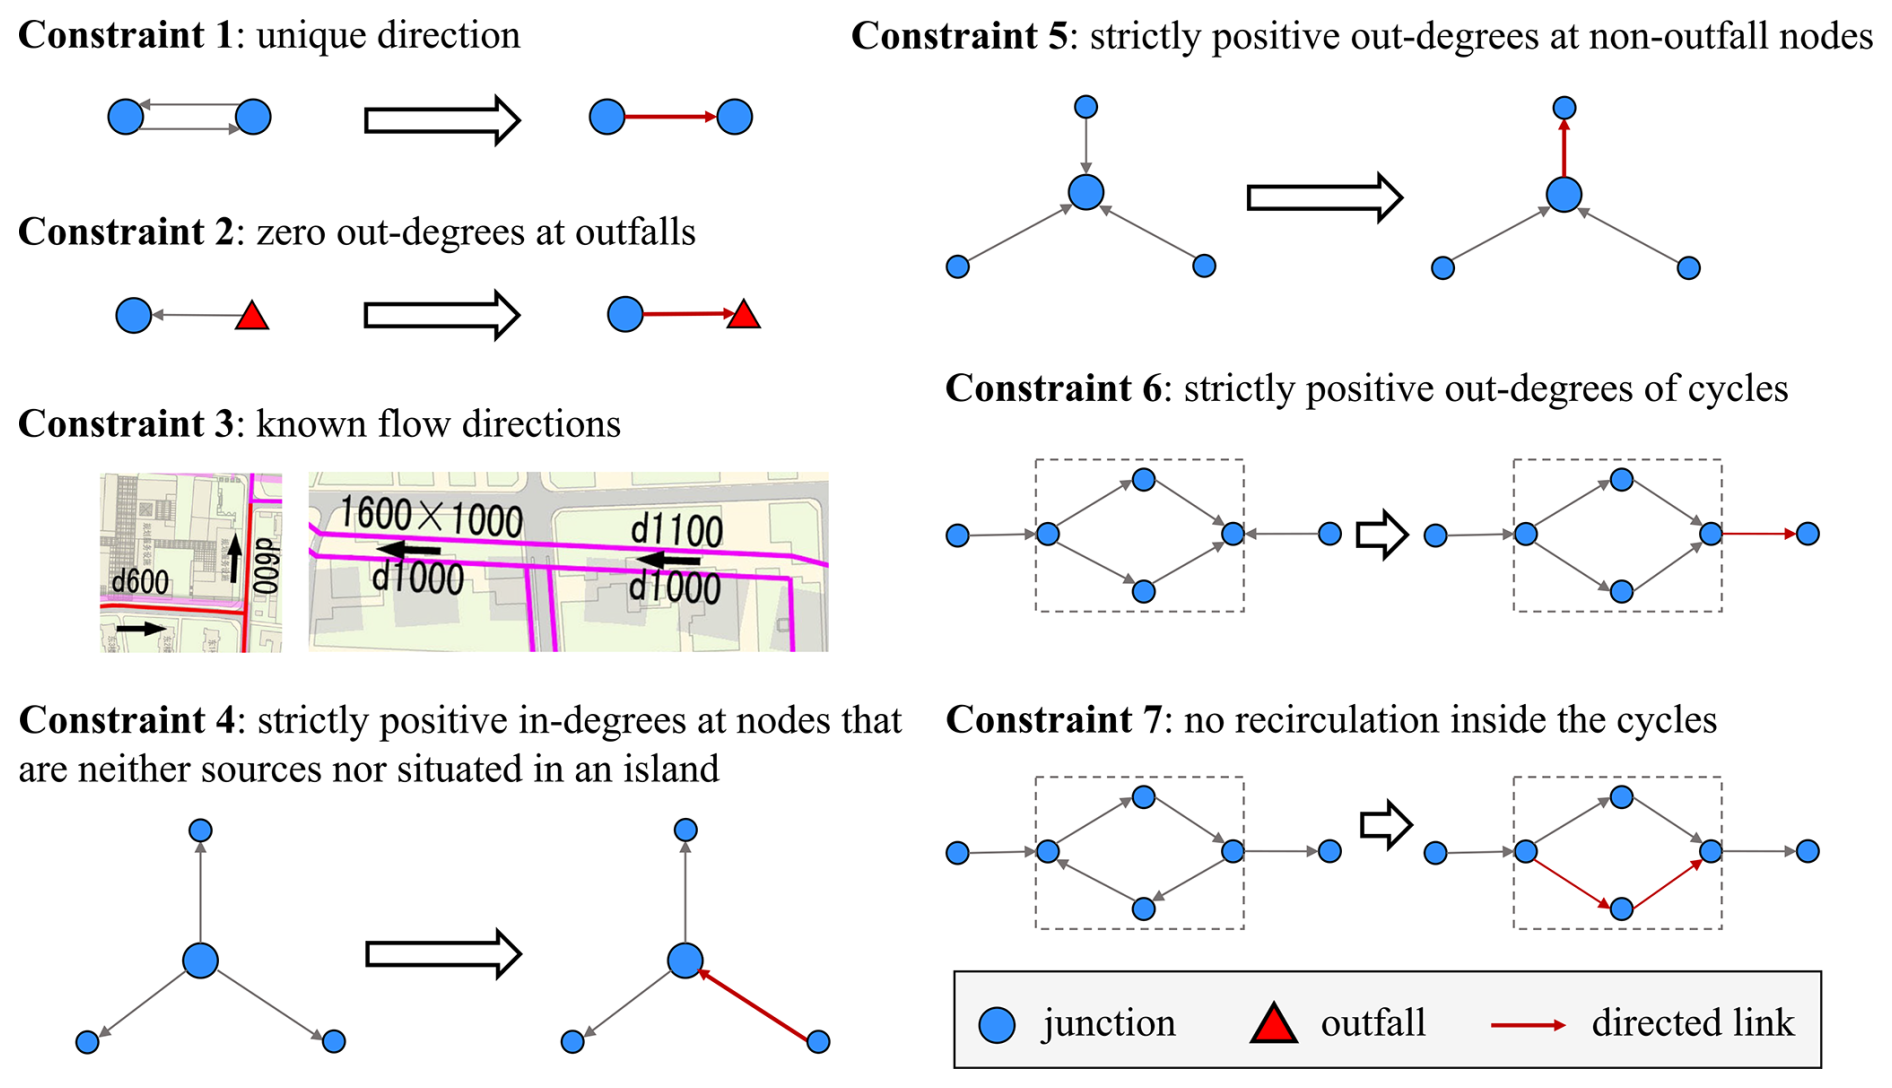
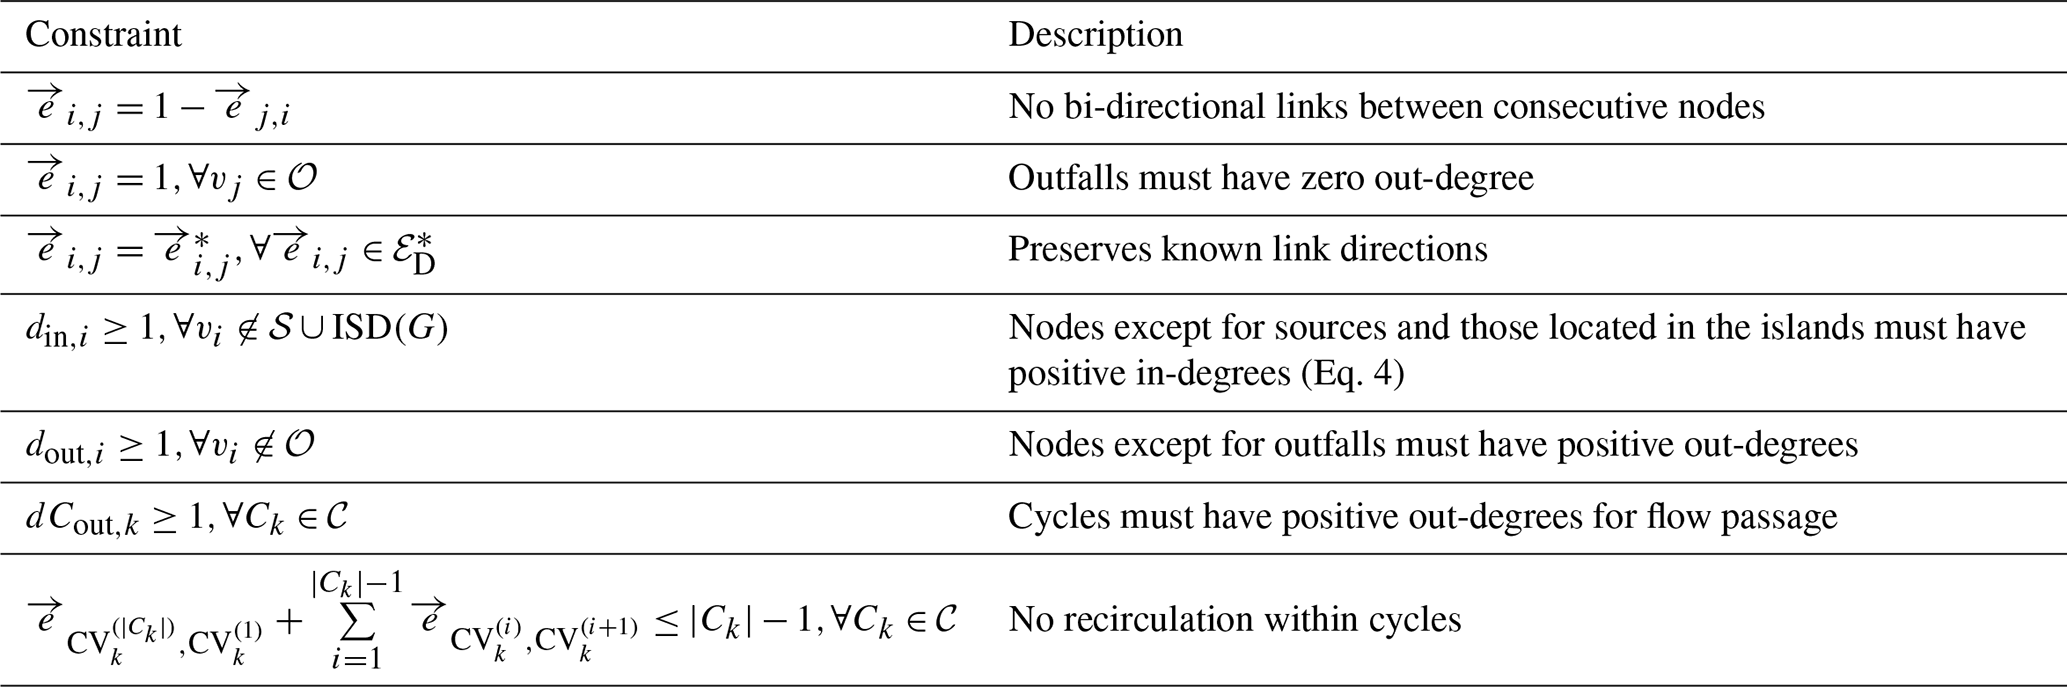
To ensure flow directions are preserved as much as possible during correction, we formulate the following 0–1 programming problems with linear constraints summarized in Table 1:
Table 1Optimization constraints for gravitational flow direction derivation. is the number of nodes in Ck; is the set of links with known directions (denoted by ); is the sum of consecutively connected direction values along Ck.
Prior to optimization, pipes are discretized into 50 m segments following common inlet spacing (MOHURD, 2021). This ensures uniform link lengths for objective evaluation and provides computational elements with inlets at segment endpoints, enabling surface–sewer exchange in the hydraulic simulation.
2.3 Nodal invert elevation derivation
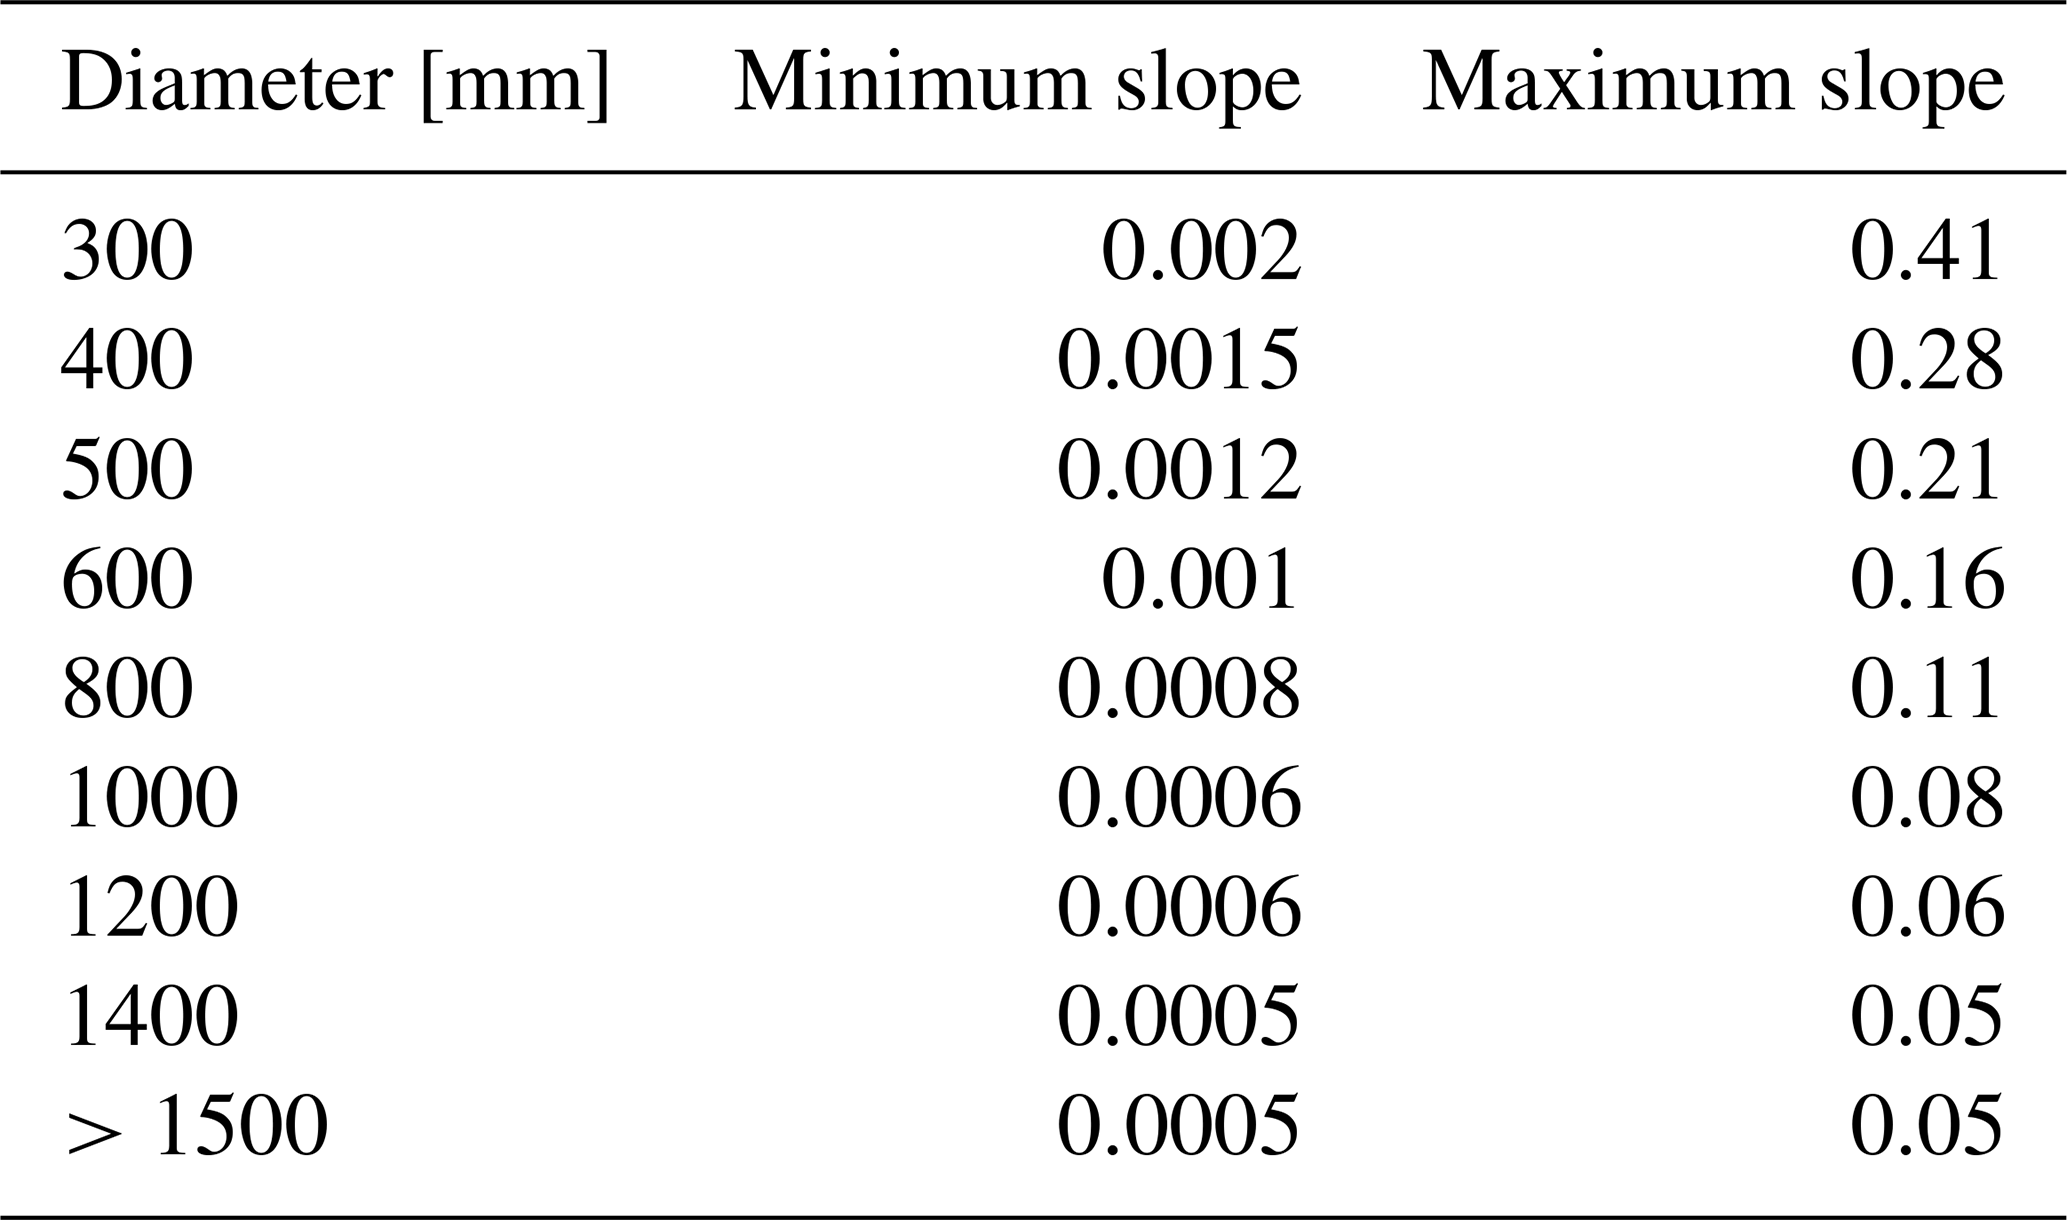
Correcting gravitational flow directions enable the derivation of nodal invert elevations required for downstream hydraulic simulation. Based on invert elevation initialized by Eq. (6), further adjustment is needed to keep the slopes of links within the range of minimum and maximum allowable slopes (Safavi and Geranmehr, 2017).
To achieve the least deviation from the initial results considering sewer construction costs proportional to excavation depth (Swamee and Sharma, 2013; Machine Hsie and Huang, 2019), we introduce the following nonlinear optimization problem to estimate the invert elevation of nodes:
where ii,j is the slope of ; are the minimum and maximum allowable slopes of , summarized from the Standard for Design of Outdoor Wastewater Engineering (MOHURD, 2021), considering both explicitly stated slope limits and those derived from velocity constraints (Swamee and Sharma, 2013).
For simplicity, but without loss of generality, ii,j is estimated using the invert elevation of two consecutive nodes, ensuring the linearity of constraints for the above optimization problem:
It should also be noted that Eq. (10) can be extended to multiple consecutive nodes. The corresponding slope estimator remains a linear combination of nodal invert elevation (see Sect. S1 in the Supplement), which maintains the linearity of constraints in the original optimization problem.
2.4 Computational efficiency considerations
The objective functions of Eqs. (8) and (9) are expressed as the sum of absolute deviations and can be further reduced to an equivalent linear form following (Wagner, 1959; Giangrande et al., 2013), thus ensuring their solution efficiency for large-scale applications.
Without loss of generality, for minimizing the summation of absolute values:
where ki,bi are fixed numbers with respect to N decision variables xi, we can introduce auxiliary decision variables constrained by:
Thus, the original unconstrained nonlinear problem can be reformulated into an equivalent linear one with additional constraints:
Furthermore, if additional constraints are present with Eq. (11), they can be added directly to the reformulated problem (Eq. 13) without loss of equivalence. This reformulation strategy has been used in previous research (Giangrande et al., 2013) and thus can be easily extended to our work on efficient sewer network reconstruction (Eqs. 8 and 9). In terms of solving the reformulated linear programming problems, we select the open-source Computational Infrastructure for Operations Research (COIN-OR) branch-and-cut solver (CBC) (Forrest and Lougee-Heimer, 2005) through its Python interface in PuLP (Mitchell et al., 2011).
Using the sewer network reconstructed from incomplete information, we further adopt a 1D/2D coupled hydrologic-hydrodynamic model, AUTOSHED, to simulate pluvial flood process in an urbanized area. AUTOSHED delineates the whole simulation domain into multiple triangular-shaped units (TSUs). For each unit, AUTOSHED uses the rain-on-grid approach, also known as the fully hydrodynamic approach (Hall, 2015; Chen and Huang, 2024; Perrini et al., 2024), and performs sequential hydrologic-hydrodynamic computations for surface runoff generation and routing, respectively.
3.1 Surface runoff generation and routing
The surface runoff generation scheme is mainly built upon the core module of the Surface Urban Energy and Water Balance Scheme (SUEWS) (Järvi et al., 2011) and Tsinghua Integrated Hydrological Modeling System (THIHMS) (Ni et al., 2008), except for overland and channel flow routing. Each TSU is divided into impervious and pervious parts according to the empirical impervious ratio αimp derived from the unit land use statistic by area-weighted averaging (Cao et al., 2020; Krebs et al., 2014). And the total surface runoff ΔSsr is calculated as the area-weighted sum of runoff from the impervious and pervious parts, considering typical hydrological processes such as vegetation interception, building interception, and soil infiltration (Fig. 3). Details of methodologies for rainfall–runoff simulation can be found in the work of Ni et al. (2008) and Järvi et al. (2011).
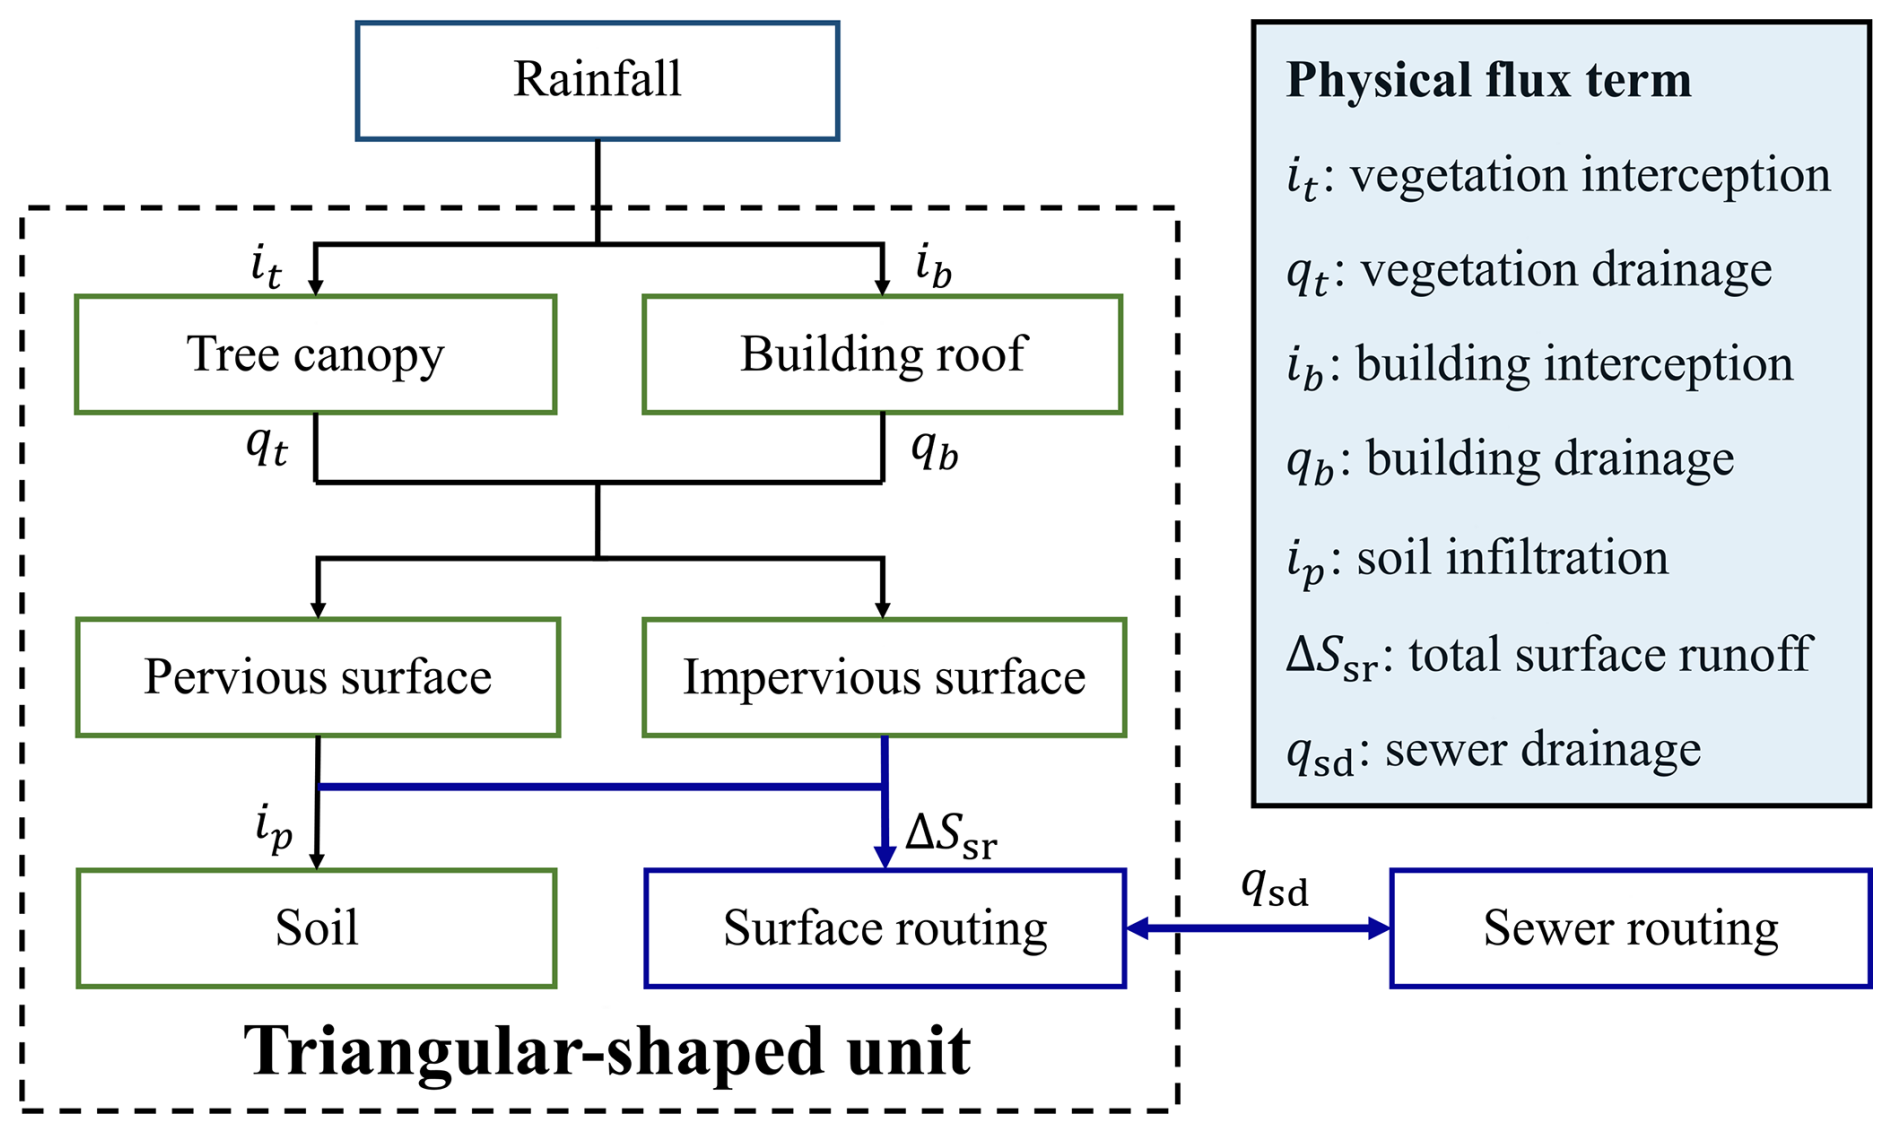
Figure 3Flux calculation within a typical triangular-shaped unit and across the surface–sewer system.
After obtaining the total surface runoff, a well-balanced formulation of 2D shallow water equations (SWEs) (Song et al., 2011) is adopted to simulate the subsequent surface routing process:
where h is the water depth; u,v are the depth-averaged velocity components in the x- and y-directions; zb is the bed elevation; g is the gravitational acceleration; qsd is the mass loss term caused by sewer drainage; n is the empirical Manning coefficient initialized as n0 by land-use type and further increased according to the intersected area ratio of TSUs with buildings (denoted as bf) by the building roughness method (Schubert and Sanders, 2012), where the maximum roughness is set as 0.5 s m. Details on the methodologies used for solving 2D SWEs can be found in the work of Song et al. (2011).
3.2 Sewer flow simulation
In TSUs with rainwater inlets, vertical linkages enable bidirectional coupling between surface and sewer flows. A modified form of the 1D Saint-Venant equations is introduced to simulate the sewer flow process using a node-link approach (Rossman and Huber, 2017):
where H is the total nodal hydraulic head of water; Q is the flow rate; U is the flow velocity; A is the cross-sectional area; Aas is the node assembly surface area consisting of the node's storage surface area and half the surface area of connected links (Rossman, 2015); Sf is the friction slope parameterized by the Manning formula; Qnl is the flow contributed by neighboring links in the sewer system; Q1D-2D is the mass source term exchanged between the surface flow and the sewer flow. Further details regarding the methodologies used for solving 1D Saint-Venant equations under regulation can be found in Rossman (2015). The corresponding surface–sewer flow coupling scheme is given in the Sect. S2.
4.1 Study area and data
The study area is the main city zone of Yinchuan (CYC), Ningxia Hui autonomous region, situated in the northwestern part of China, covering an area of 137.15 km2. Despite being located in an arid region with an average annual rainfall of 189 mm and annual evaporation of 1825 mm, CYC has experienced several flood disasters due to increasing extreme rainfall events in recent years (Lu et al., 2024). According to local documents, most of the drainage system in CYC is a combined sewer system. Its drainage capacity is largely constrained by downstream wastewater treatment plants (WTPs) due to restrictive environmental regulations, which can cause overflow at rainwater inlets and further increase surface inundation risks.
To establish the urban pluvial flood model for scenario analysis, we collected the following multi-source geographical datasets :
-
5 m digital elevation model (DEM, Fig. 4a) generated from the stereo images of ZiYuan-3 satellite. Following common DEM preprocessing practices for urban flood simulation, we delete the inaccurate building roof elevation from the original product (Chen and Huang, 2024) and lower the surface elevation of grids containing roads by 0.2 m (Liu et al., 2022) to improve the representation of hydrological connectivity in DEM.
-
10 m land-use map (Fig. 4b) from the European Space Agency (ESA) WorldCover 2021 product (Zanaga et al., 2022), which covers tree, grassland, cropland, built-up and bare-land area in the study area.
-
Building footprint (Fig. 4a) and road network layers (Fig. 4b) downloaded via the application programming interface of the Baidu map. Considering the potential underestimation of the impervious area identified from remote sensing datasets (Weng, 2012), we further reclassified pixels intersecting with buildings and roads as the built-up land-use type.
-
Sewer network layout and the corresponding attribute of pipeline size (Fig. 5a) were digitized from investigation and design documents authorized by the local government. It should be noted that when detailed information was unavailable, previous research would generate a virtual sewer network from the street network (Montalvo et al., 2024). To investigate the potential effects of such simplification, we further created a road-based sewer network by identifying pipes that intersected with the major roadway zone and then performed the necessary reconnections at pipes broken intermediately (Fig. 5b). Here, we define the term “major road” (Fig. 4b) as including primary, secondary, tertiary and trunk roads. Roadway zones are generated by buffering road centerlines with widths determined according to The Design of Urban Road Engineering (CJJ 37-2012).
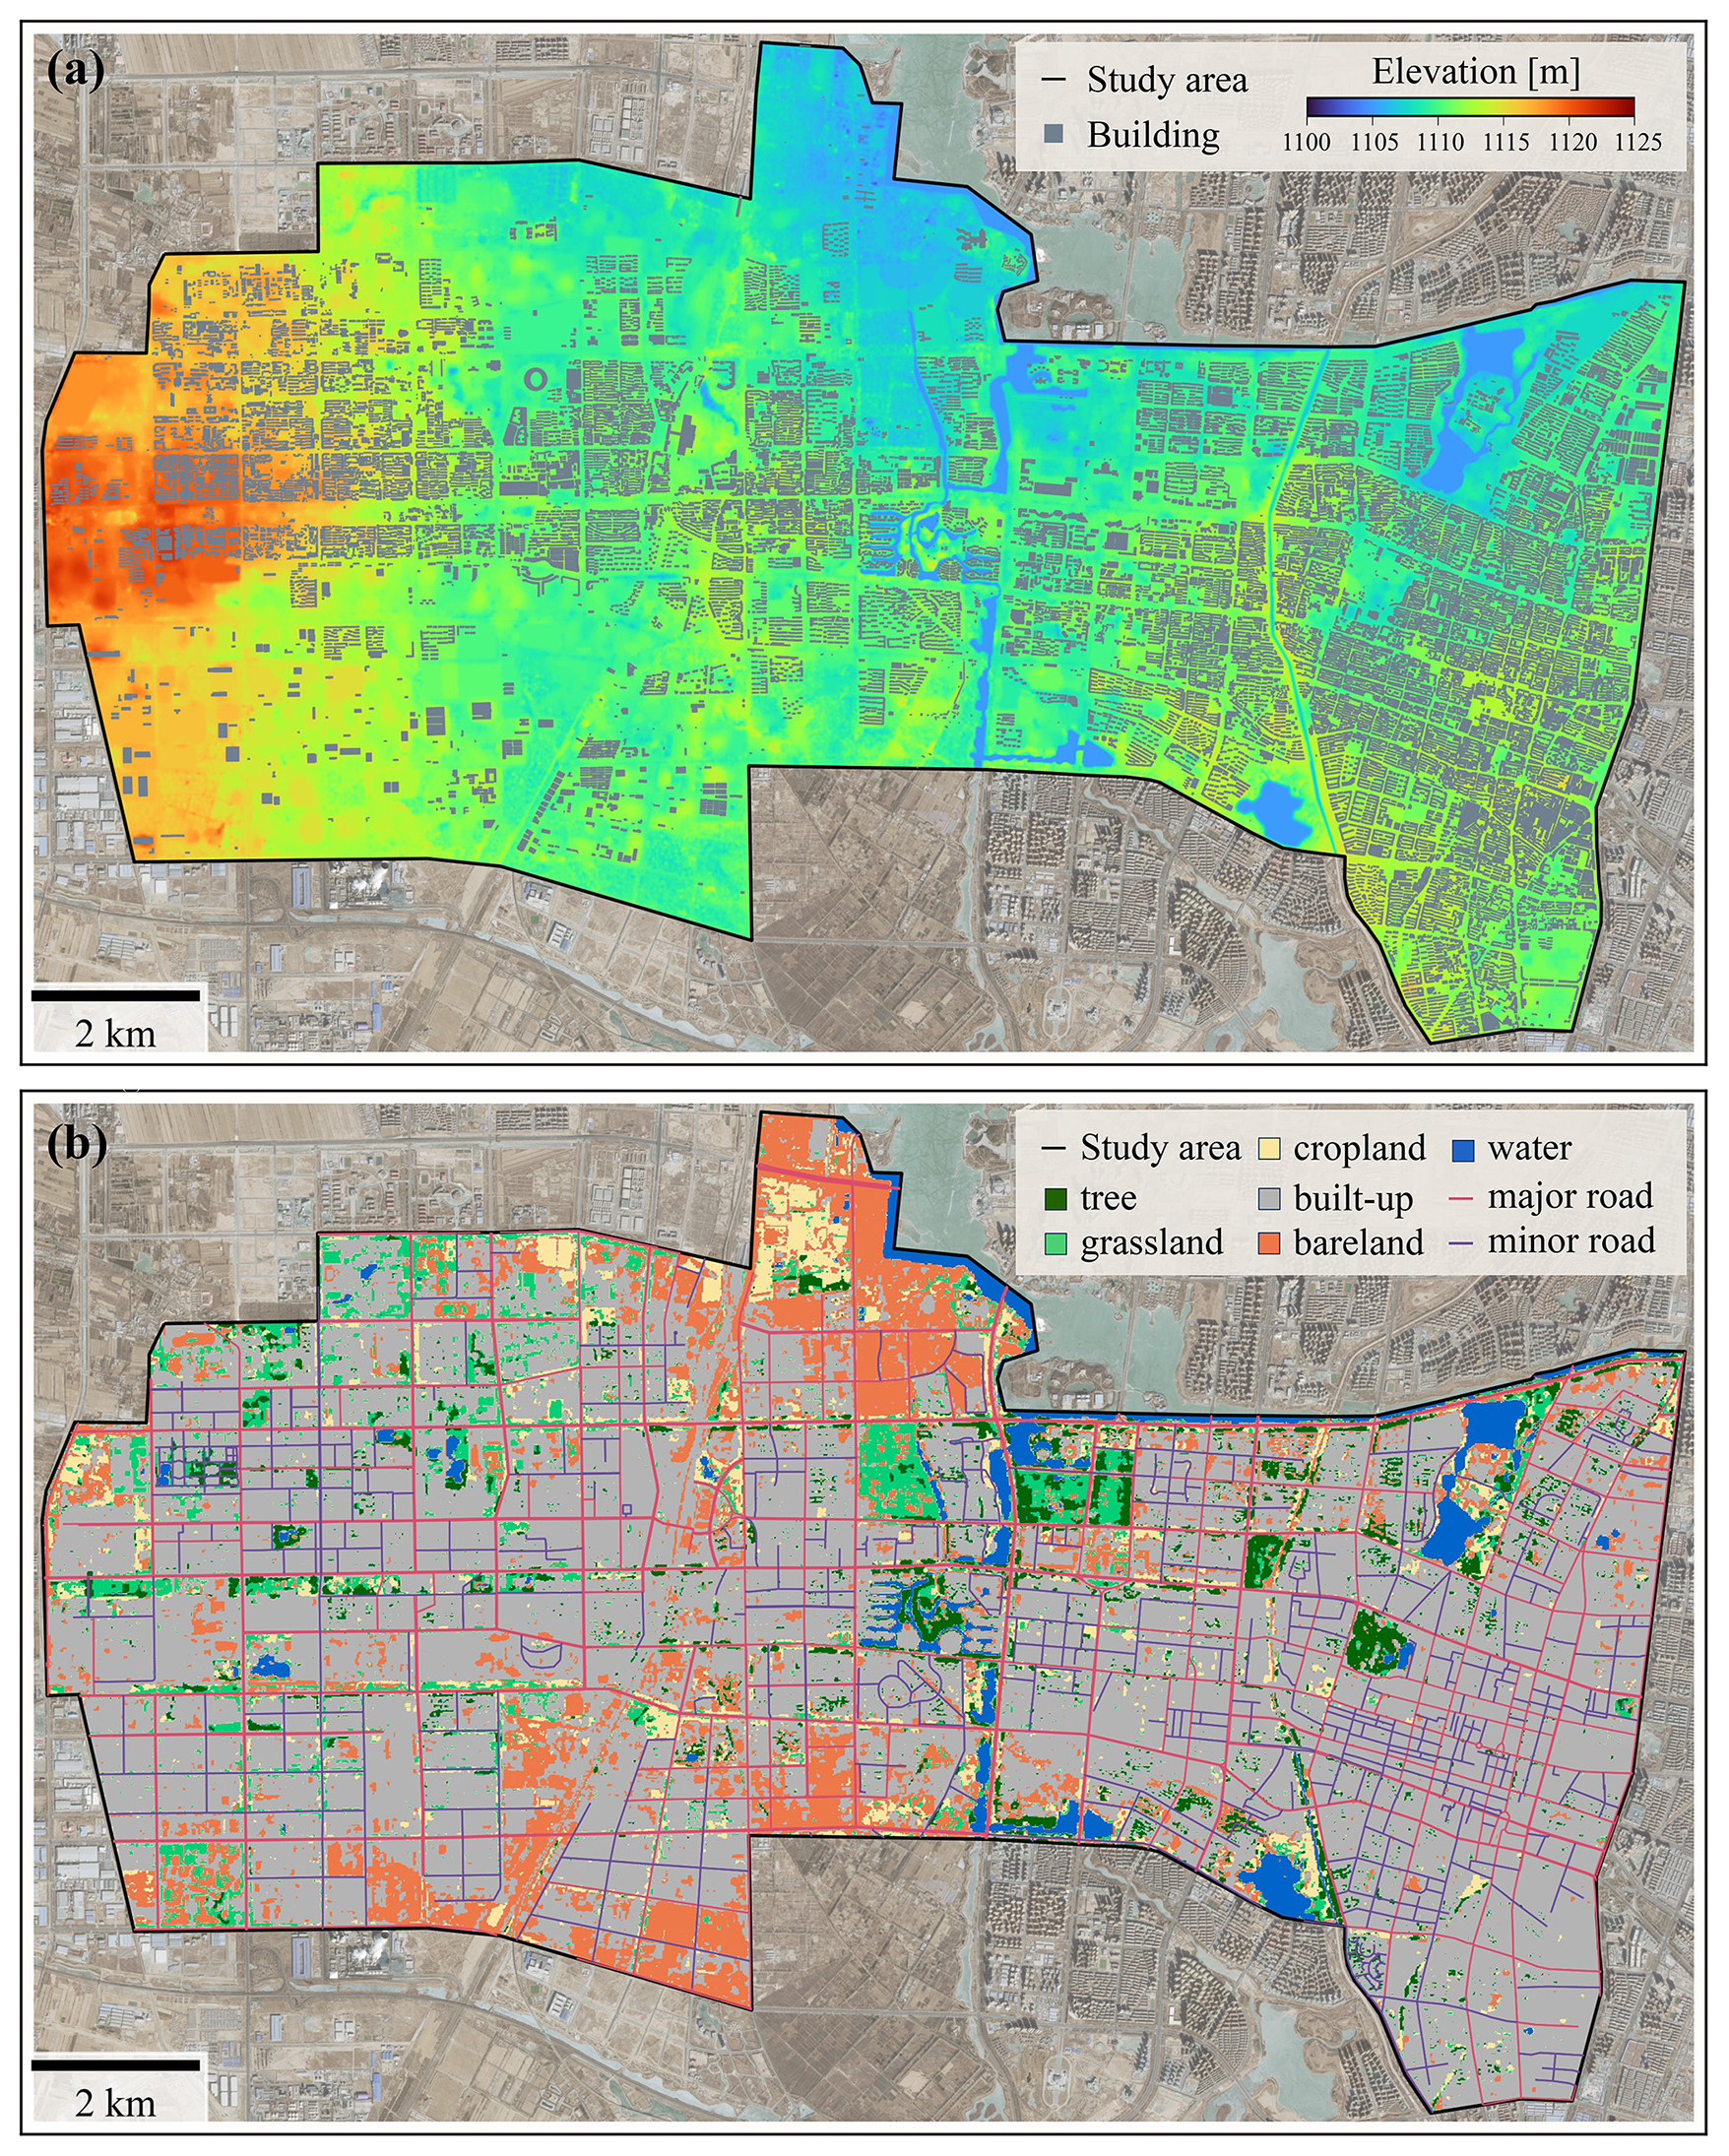
Figure 4Geographical datasets in the study area. (a) Digital elevation model. (b) Land-use map and road networks. Basemaps are derived from ESRI World Imagery (Credit: Esri, TomTom, Garmin, FAO, NOAA, USGS © OpenStreetMap contributors, and the GIS User Community).
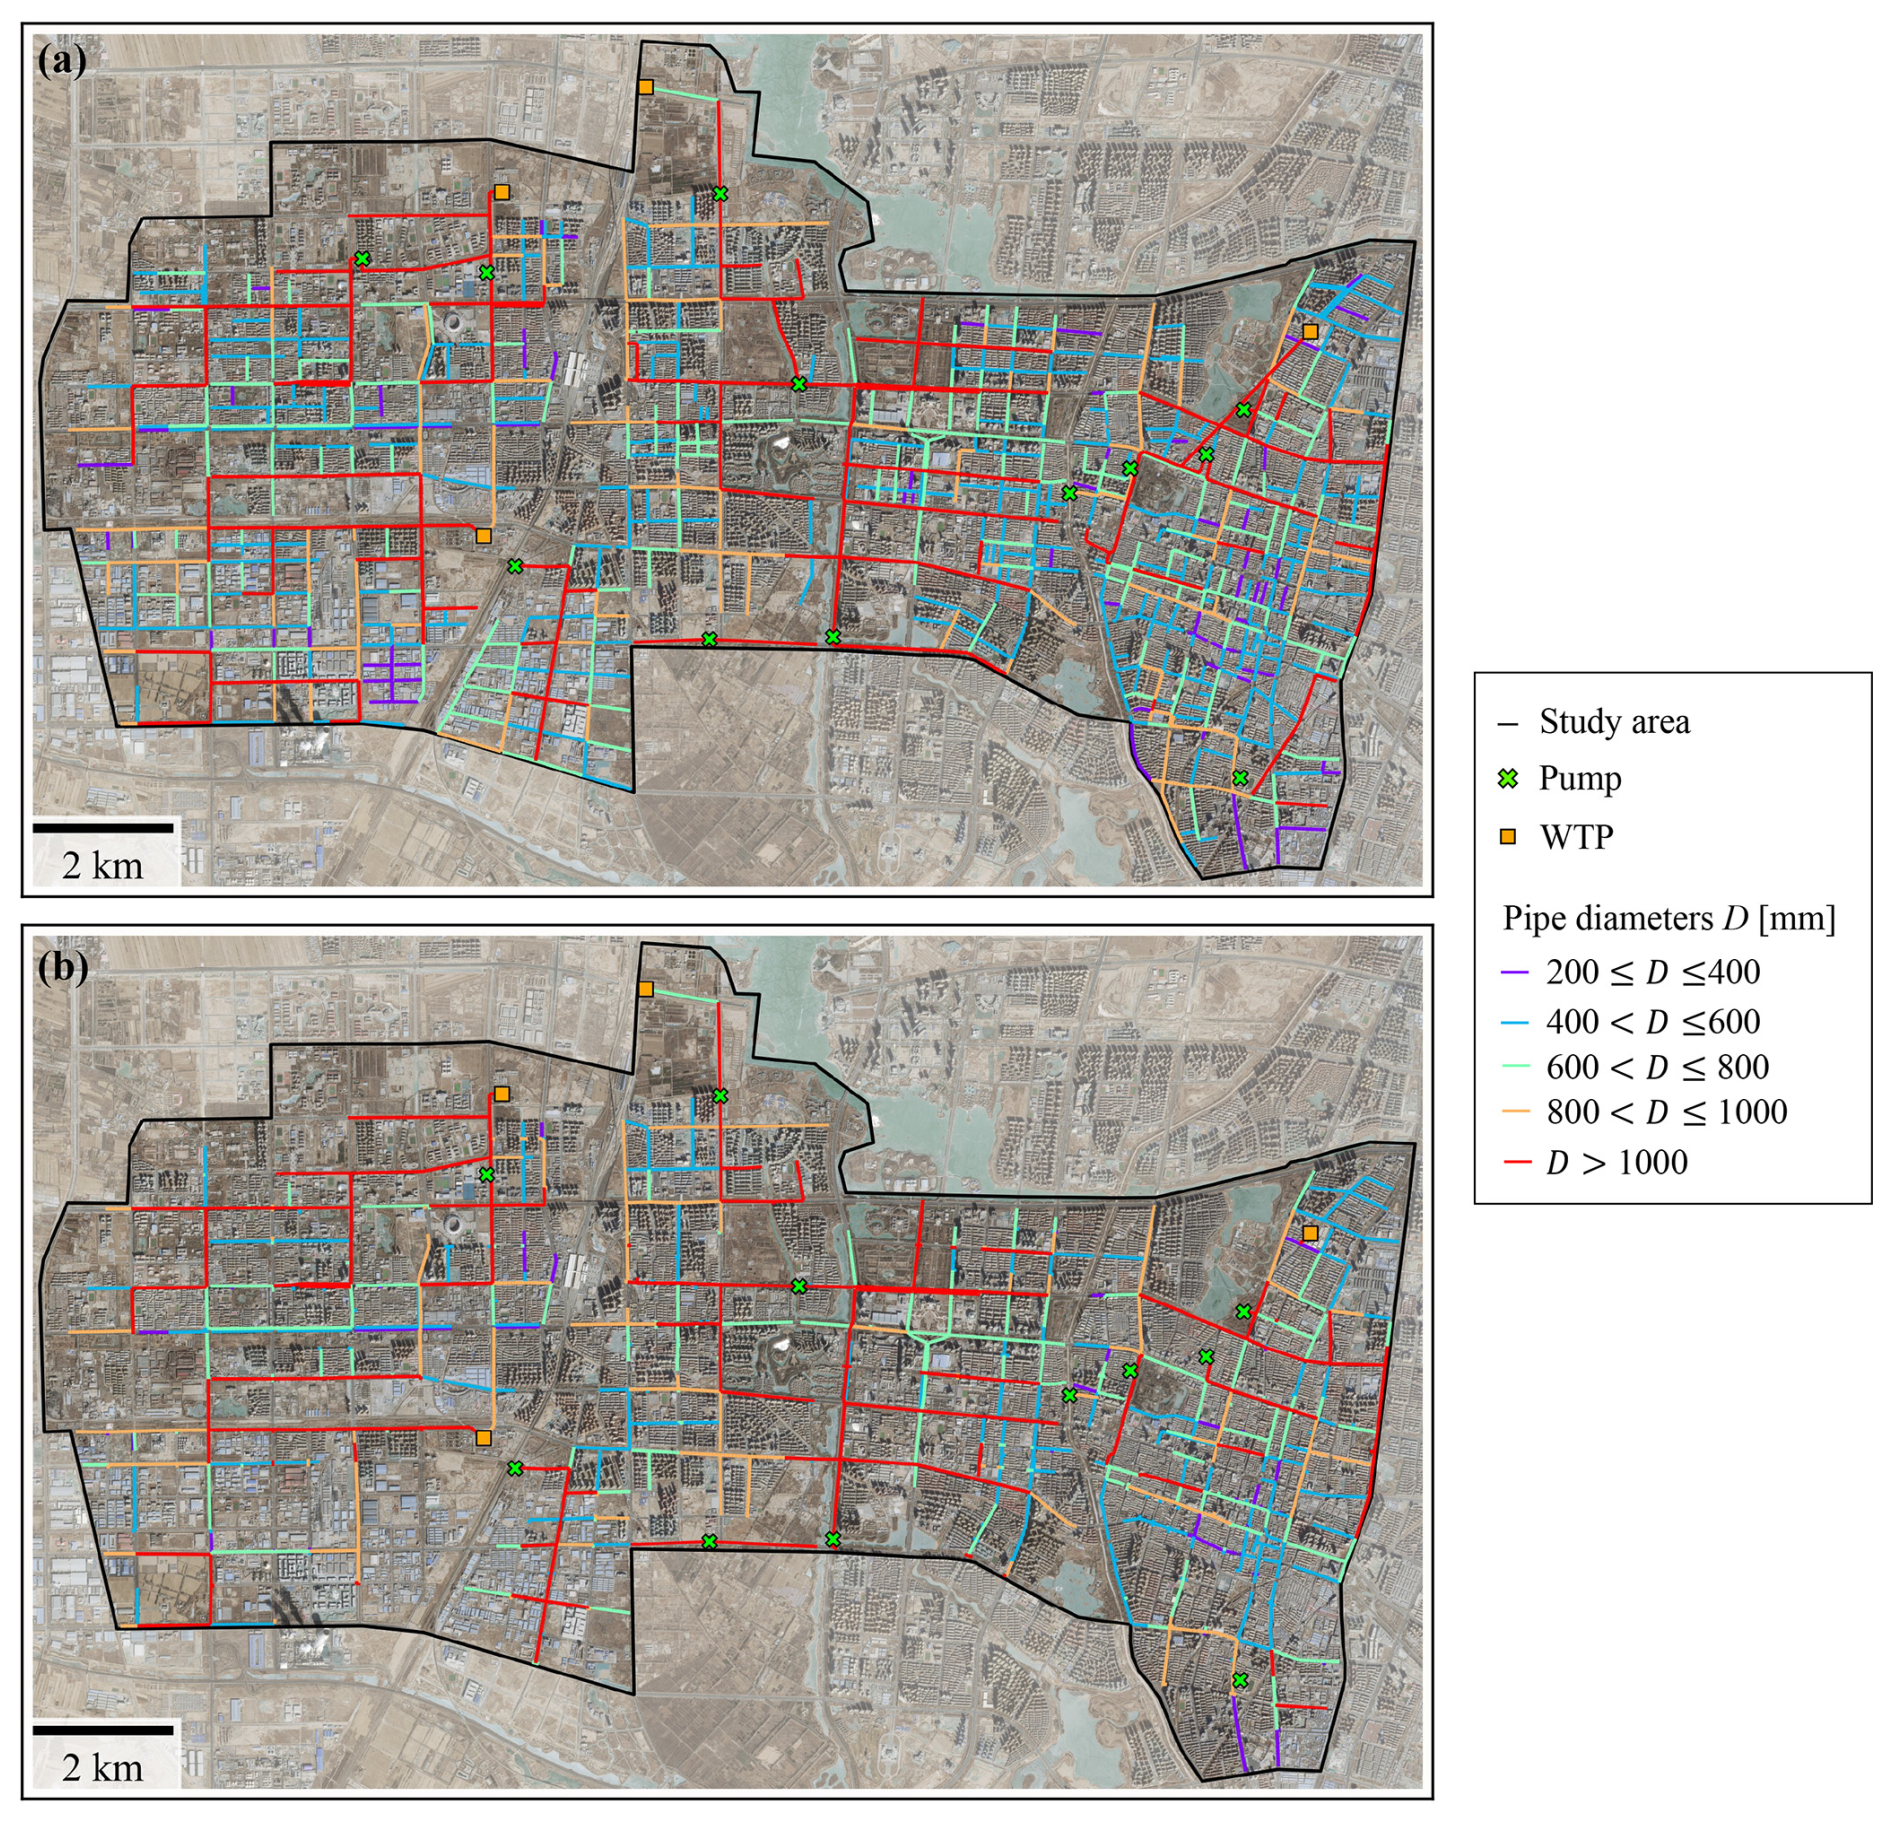
Figure 5Sewer network in the study area. (a) Complete sewer network digitized from the local document. (b) Simplified sewer network filtered by the major roadway zone. Basemaps are derived from ESRI World Imagery (Credit: Esri, TomTom, Garmin, FAO, NOAA, USGS, © OpenStreetMap contributors, and the GIS User Community).
The design rainfall formula in CYC is calculated based on local rainfall statistics:
where q is the rainfall intensity, L (s ha)−1; P is the return period; t is the rainfall duration in min.
Seven designed rainfalls with return years of 1a, 5a, 10a, 20a, 50a, 100a, and 200a are selected for the scenario analysis, where each rainfall event lasts for 2 h (see Fig. S1 in the Supplement), followed by an additional 2 h period without any precipitation.
4.2 Baseline configurations
Five baseline configurations are selected for comparing the performance of the proposed approach (denoted as the FSR approach) and other approximation methods:
-
Full-Sewer-reconstruction-No-controls (FSN), which uses the same reconstruction approach but ignores the existence of regulated facilities such as pump stations and wastewater treatment plants. To be specific, regulated facilities located at outflow and intermediate points are configured as free outfalls and uncontrolled junctions, respectively.
-
Road-based-Sewer-reconstruction-No-controls (RSN) which uses the same reconstruction approach but adopts the layout of sewers filtered by the major roadway zone (Fig. 5b) and ignores the existence of regulated facilities.
-
Road-based-Sewer-reconstruction-with-Controls (RSC) which uses the reconstructed sewer network from RSN and further incorporates regulated facilities at corresponding locations.
-
Road-Drainage Approximation (RDA) (Xing et al., 2021; Li et al., 2023), which removes water mass at a uniform rate id within roadway zones buffered from road centerlines, with widths evaluated using The Design of Urban Road Engineering (CJJ 37-2012).
-
No-Drainage Approximation (NDA) which ignores the drainage effects of the sewer network.
According to whether the sewer hydraulic module is reconstructed for simulation with AUTOSHED, we can further classify the above approximation methods into two categories: physical approaches (including FSR, FSN, RSN, and RSC), and equifinal ones (including RDA and NDA). This means that similar flood simulation results can be achieved by different methods with appropriate parameters of drainage effects (Dobson et al., 2025).
To quantify the simulation performance of different approximation methods under various design scenarios, we calculate the probability of detection (POD), false alarm rate (FAR), critical success index (CSI), and bias (BIAS) of inundation area simulations (McGrath et al., 2018), using results from the FSR approach as the reference (see Sect. S3).
4.3 Sewer network reconstruction performance
According to the layout of the digitized sewer network (Fig. 5), gravitational flow directions are initialized by surface elevation (Eq. 7) and then estimated by solving 0–1 programming problems (Eq. 8). For simplicity, Fig. 6 summarizes the results for the initialized and reconstructed directions of the complete sewer network with 11 outfall points consisting of wastewater treatment plants and pumping stations. The directions of 359 among 908 pipes are reversed to satisfy topological constraints. The majority of the modified pipes are located in the southern part of the study area and exhibit a pattern of cyclic structures over relatively flat areas, posing challenges for the direct identification of dominant flow directions and thus necessitating the incorporation of additional topological constraints (Table 1) for rational reconstruction.
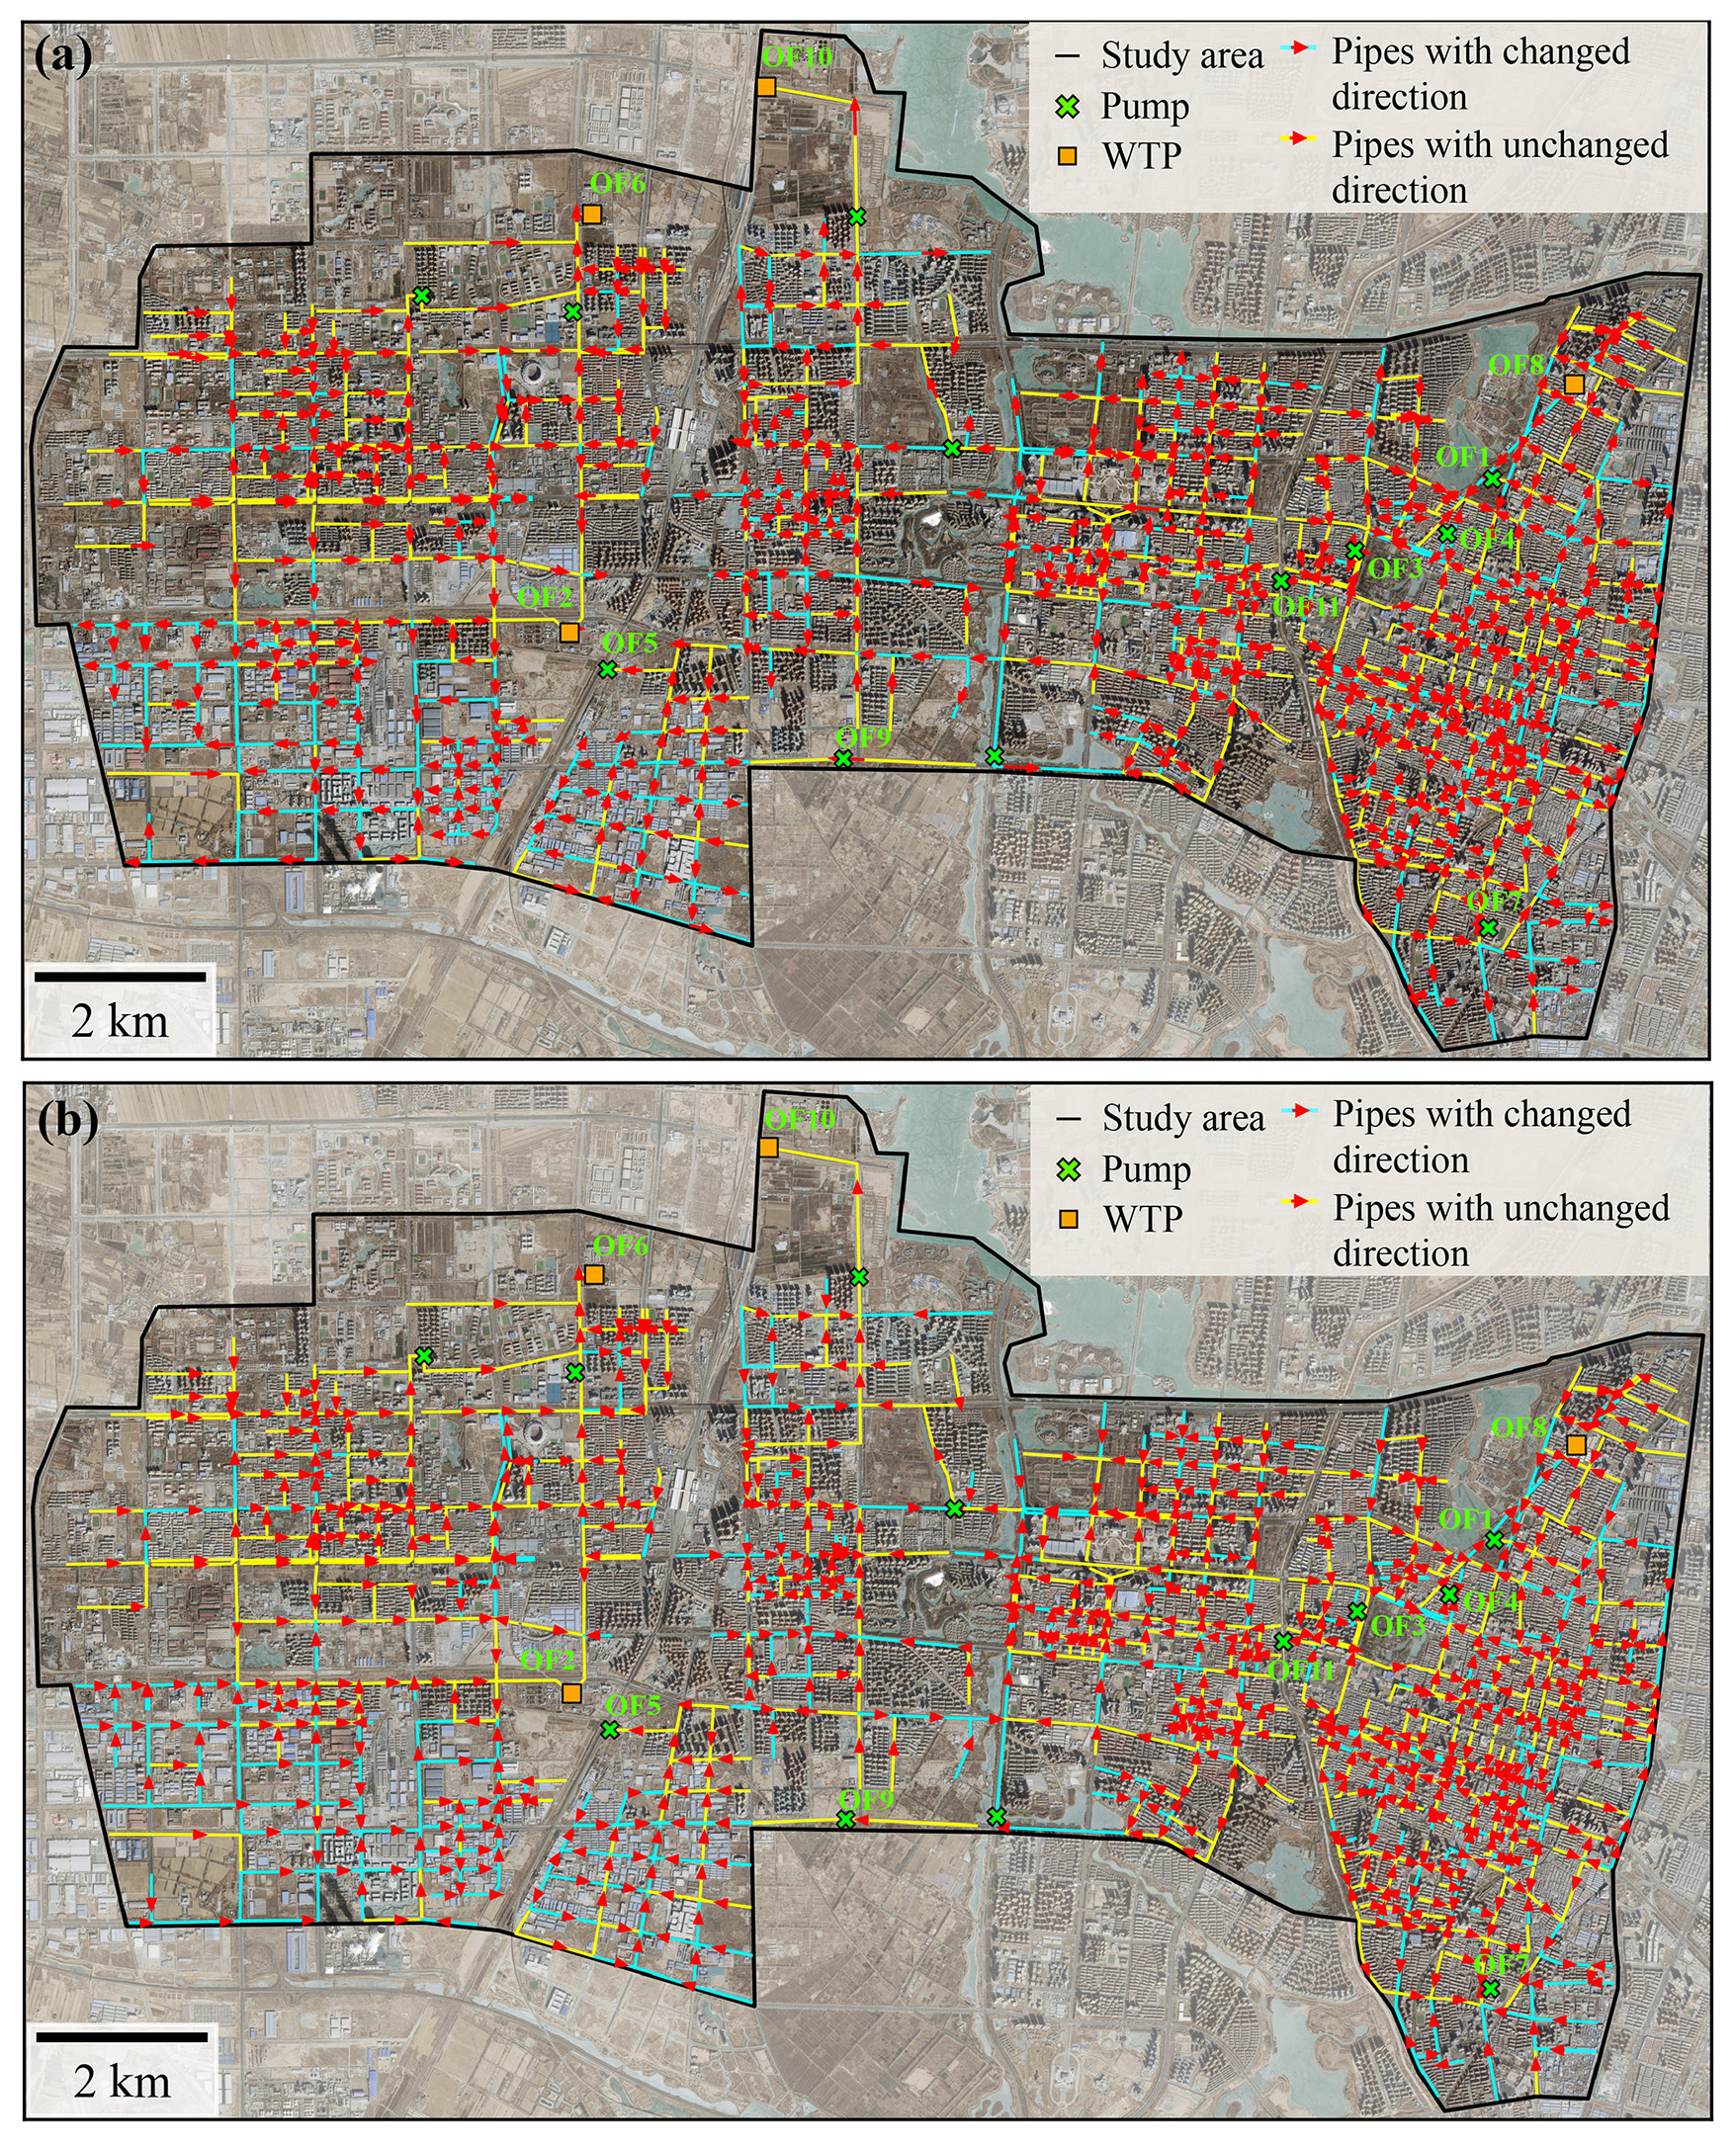
Figure 6Comparison of the initial and reconstructed gravitational flow directions of the complete sewer network in the study area. (a) Flow directions initialized by surface elevation. (b) Flow directions reconstructed from topological constraints. Basemaps are derived from ESRI World Imagery (Credit: Esri, TomTom, Garmin, FAO, NOAA, USGS, © OpenStreetMap contributors, and the GIS User Community).
According to the reconstructed flow directions, nodal invert elevation is further derived from values initialized by constant cover depth (Eq. 6). The slope distributions before/after adjustment are summarized in Fig. 7. The initial slopes of both the complete and simplified sewer network exhibit a relatively symmetric distribution centered on 0, indicating adverse slopes in nearly half the links due to the reversal of nearly 40 % of the pipes in the previous step. After reconstruction using Eq. (9), slope distributions shift to strictly positive ones, where the majority of slopes are around 0.001. Additionally, the simplified sewer network shares a similar pattern of slope distribution as the complete one, except for minor increases around 0 because its layout is slightly modified due to the aforementioned reconnection of broken pipes in Sect. 4.1. Thus, it can be concluded that the proposed reconstruction approach is robust to empirical simplification of the sewer network layout following road networks and can be stably extended to applications using street-based network generation.
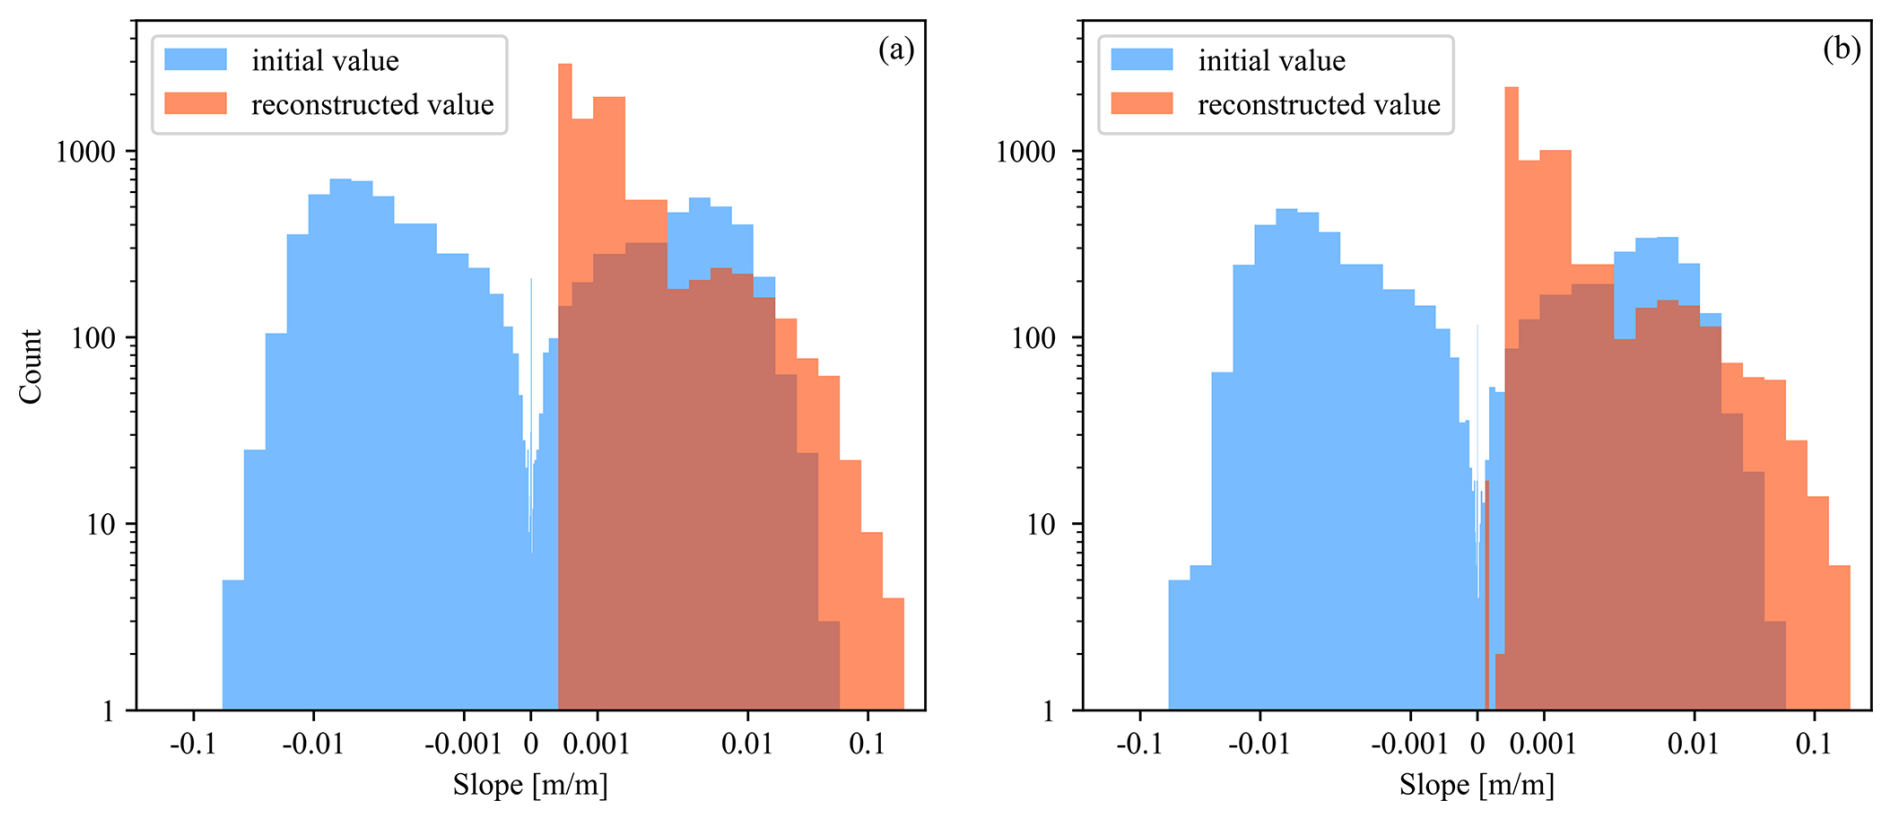
Figure 7Comparison of the initial and reconstructed sewer slope distributions. (a) Complete sewer network used in the FSR and FSN approaches. (b) Road-based sewer network used in the RSN and RSC approach.
Owing to the linearized programming formulation used in the process of reconstructing gravitational flow directions and nodal invert elevation (Sect. 2.4), 1D sewer hydraulic models can be built from prepared geographical datasets in 33 s on a local desktop using a single core of Intel(R) Core(TM) i7-14700KF CPU and 400 MB RAM occupancy. For reconstructed sewer networks initialized with a uniform spacing of 50 m (cf. Sect. 2.2), the FSR/FSN and RSN/RSC models have 8242 links and 8131 inlets, and 5268 links and 5188 inlets, respectively. Furthermore, the entire study area is discretized into 7222150 TSUs with a median area of 18.2 m2 for surface runoff generation and routing computation.
4.4 Model calibration and evaluation
To compare pluvial flood simulation performance across different approaches, we first calibrate the model parameters using a severe storm that hit CYC on 11 July 2022 (denoted as the July 2022 storm). This storm caused an average total rainfall of 57.8 mm and a peak intensity of 44.5 mm h−1, resulting in 31 inundated points, as reported by the local government, of which 18 were recorded to have the corresponding maximum waterlogging depth. Considering its representativeness as a disastrous torrential event and data availability, we use the recorded maximum waterlogging depth to calibrate the parameters in the aforementioned model and the related approximation approaches for the sewer drainage effect.
For AUTOSHED, the main physical parameters include the empirical impervious ratio αimp and the Manning coefficient n estimated from land-use types. Considering the dominance of built-up area, and to avoid possible parameter equifinality between physical processes such as soil infiltration and sewer drainage, we tested the model performance using the recommended empirical values of the corresponding parameters from the Technical Specification for Construction and Application of Mathematical Model of Urban Flooding Prevention and Control System (DB11/T 2074-2022) and finalized the values of parameters without exhaustive search (see Table S1 in the Supplement for details). Figure 8 shows the inundation map simulated by AUTOSHED using the sewer hydraulic module reconstructed from the FSR approach for the July 2022 storm.
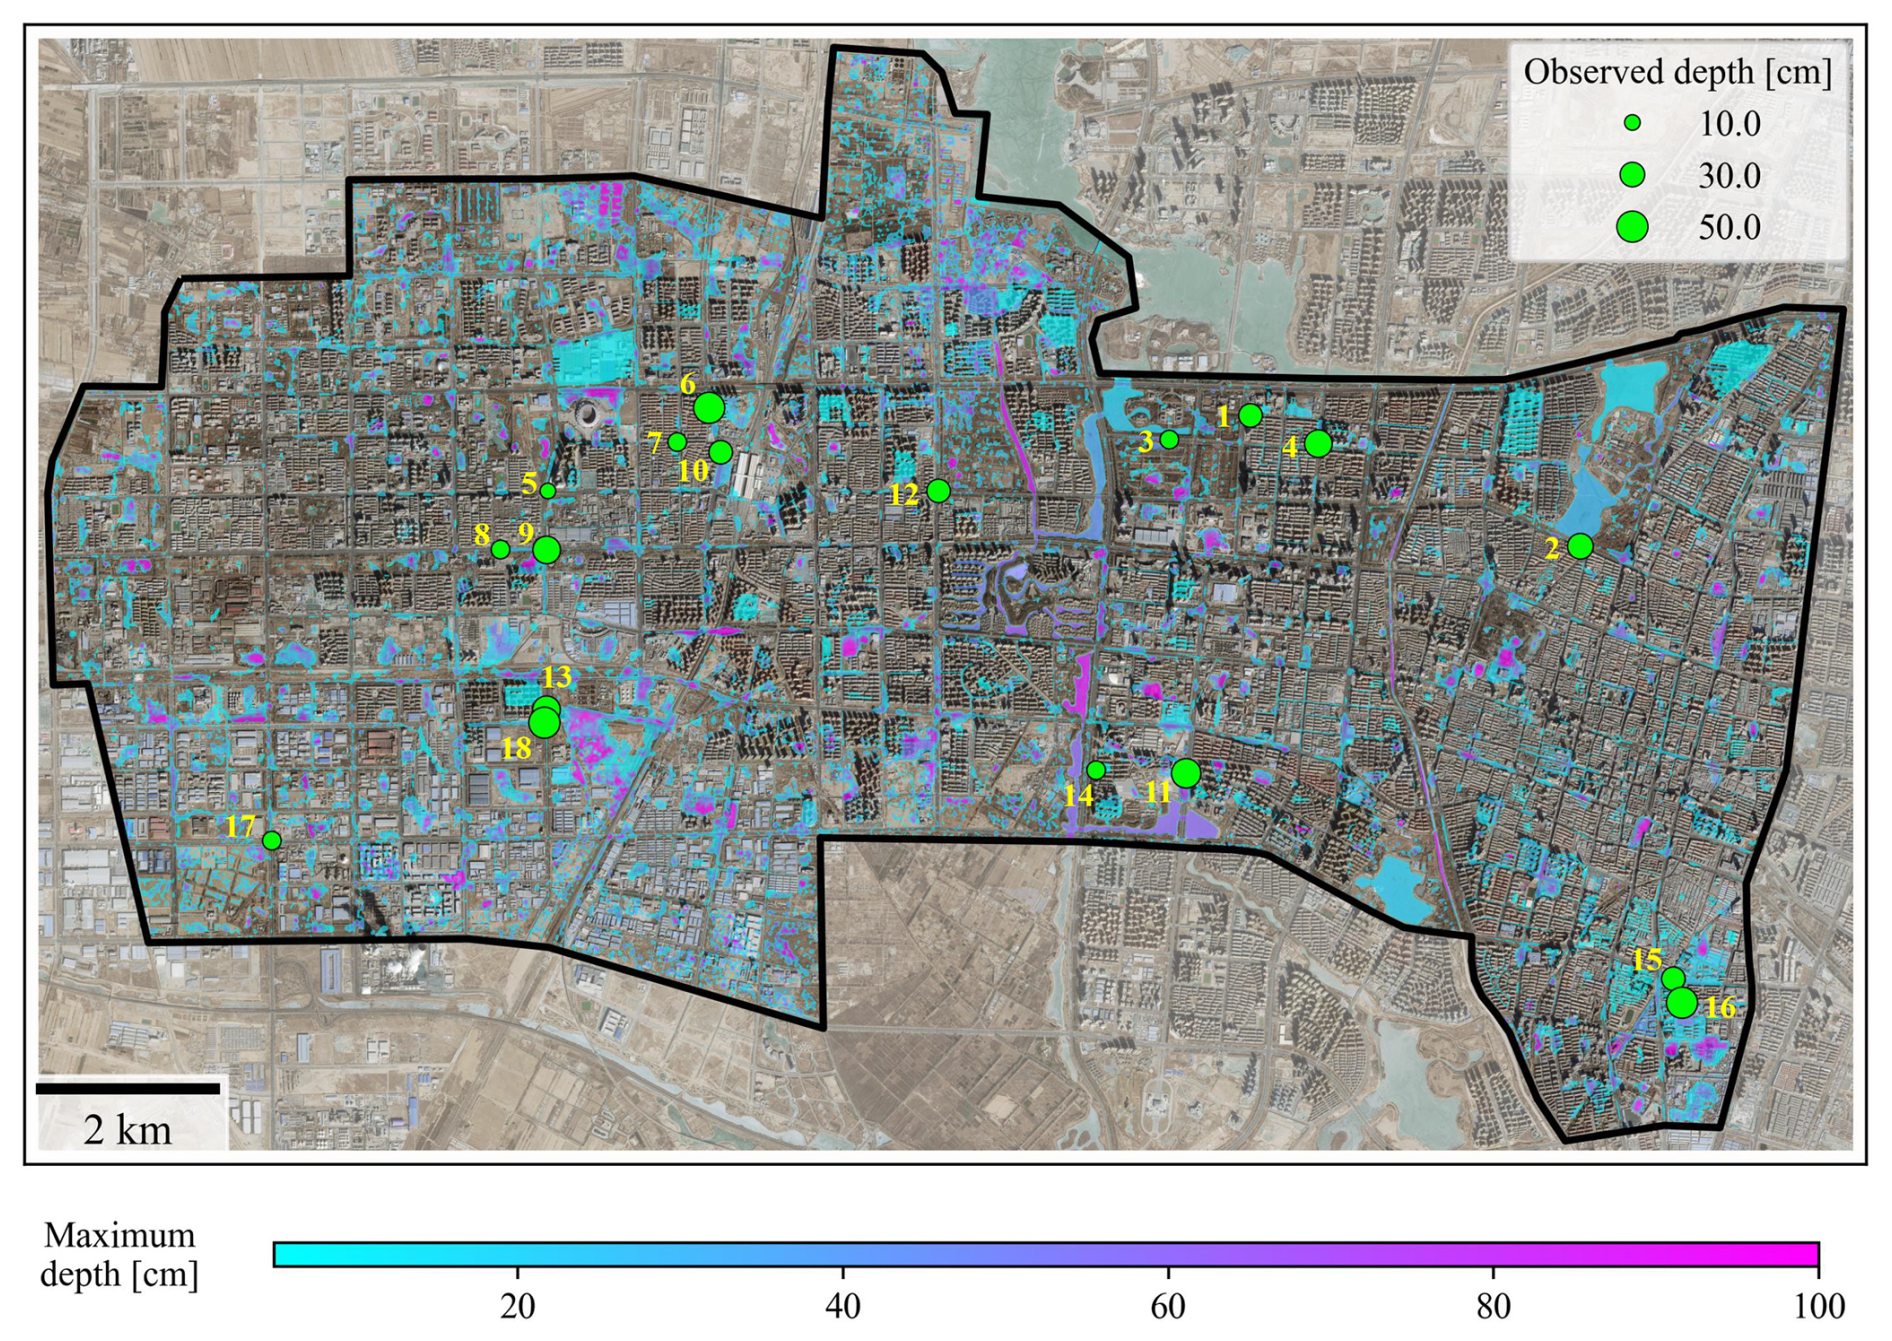
Figure 8Maximum inundation depth map simulated by the FSR approach for the July 2022 storm. Basemaps are derived from ESRI World Imagery (Credit: Esri, TomTom, Garmin, FAO, NOAA, USGS, © OpenStreetMap contributors, and the GIS User Community).
The coefficient of determination (R2) is used to quantify the overall performance of the models using different parameters. According to Fig. 9a, the FSR approach achieves an R2 of 0.95, indicating strong agreement between the simulated and observed values and establishing the physical validity of the model for further comparison. In addition, we further examine the performance of the FSR approach with varying inlet spacings (denoted as ILS) from 30 to 100 m. According to Fig. 9b, the FSR approach demonstrates relatively robust performance with R2 ranging from 0.85 to 0.95 where ILS of 50 m achieves the highest R2. It is worth noting that increasing ILS leads to both underestimation and overestimation, such as P5 and P2 in Fig. 9b, highlighting the dual role of rainwater inlets in either alleviating surface inundation through drainage or contributing to it when overloaded.
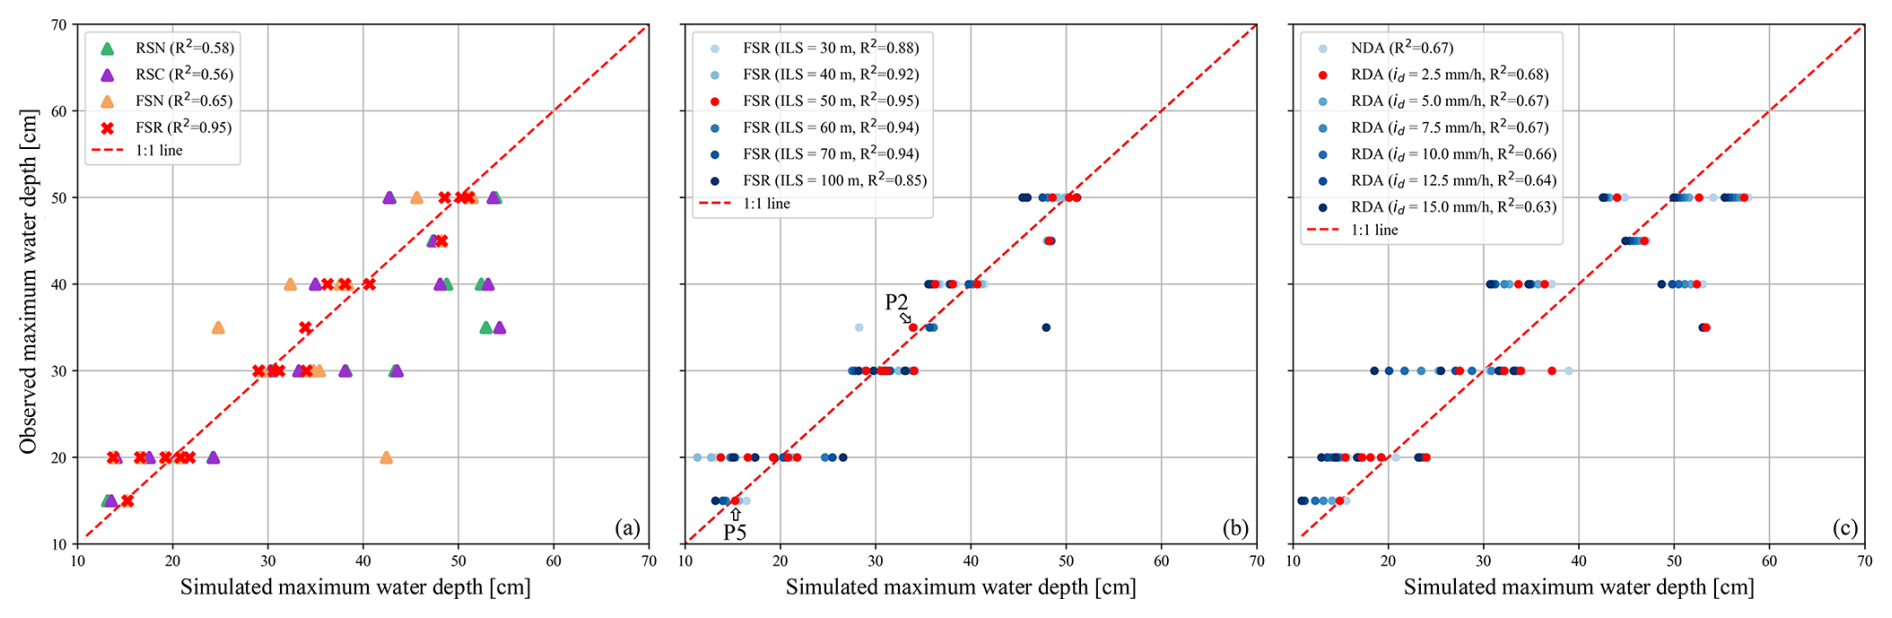
Figure 9Simulation performance of the maximum inundation depth at inundated points using different approximation methods and parameters. The index of inundated points follow Fig. 8.
Based on calibrated parameters of the physical model, we further use the grid search strategy to optimize the most possible equivalent drainage rate id for use in the RDA method when detailed sewer network information is unavailable. Specifically, we set the possible range of id according to the local design drainage standard and perform simulations with id = 2.5, 5.0, 7.5, 10.0, 12.5, 15.0 mm h−1. According to Fig. 9c, id = 2.5 mm h−1 achieves the highest R2 and is thus selected as the final value for the drainage rate for further scenario analysis.
4.5 Extreme rainfall analysis: both local inlets and global regulation matter
After calibrating the AUTOSHED model integrated with the reconstructed sewer hydraulic modules, we now delve deeper into how the proposed graph-reconstruction-based approach performs compared to simplified alternatives across different rainfall scenarios and varying levels of available information. The aforementioned July 2022 storm event, with an average total rainfall exceeding the 500-year return period threshold (40.8 mm), highlights its extremity in an arid region. According to Fig. 9, when information on regulated facilities and detailed layouts is unavailable, simplified physical approaches, such as FSN, RSC and RSN, exhibit relatively lower accuracy than calibrated equifinal ones, which approximate limited drainage capacities during extreme rainfall events using a small equivalent drainage rate.
As physical approaches incorporate drainage effects at rainwater inlets, we further investigate the relationship between simulation errors in maximum inundation depth and the distance to the nearest inlet, denoted as Df for the complete sewer network and Ds for the simplified one (see Sect. 4.1). According to evaluation results (see Fig. S2), simulation error variability decreases as Df and Ds increase, with the maximum absolute value of deviations remaining less than 5 cm for distances exceeding 30 m, where local microtopography predominantly influences inundation. Furthermore, NDA can underestimate the maximum inundation depth at points such as P8 and P18, suggesting the occurrence of potential overflows around nearby rainwater inlets due to insufficient drainage capacity during extreme rainfall.
To assess differences in simulated sewer drainage performance, we further summarize accumulated discharges at rainwater inlets and conduct two steps of comparisons based on the available information.
-
Effects of neglecting regulation: when regulated facilities are excluded, FSN can significantly underestimate the maximum inundation depth at points such as P2 compared to FSR. This mainly results from overestimated inflows () at surrounding inlets, as seen at P2 in Fig. 10a and e. Similar overestimation can also be observed when comparing RSN with RSC, but with greatly decreased magnitude, since road-based simplification reduces the rainwater collected into the sewer system and thus alleviates the drainage burden. However, when regulated facilities are deleted, FSN also overestimates the maximum inundation depth at certain points such as P1 and P3, which may seem counterintuitive. Analysis of P1's nearby inlets reveals lower inflows using FSN compared to FSR, particularly at IL1 (Fig. 10b and f), causing model overestimation of surrounding maximum inundation depth. After tracking accumulated discharges at downstream inlets with respect to IL1, we further locate the drainage bottleneck at one pump station, PM1. As illustrated in Fig. 10d, its removal can significantly increase inflows at upstream inlets, further increasing water heads at adjacent sewer nodes and consequently reducing upstream inlet drainage capacities due to backwater effects.
-
Impact of network simplification: when approximating the sewer layout using major roads, RSN generally overestimates the maximum water depth at inundated points within 30 m of rainwater inlets compared to FSN, driven by intensified overflows from excessive surface water flowing through a single drainage pathway, as seen at P1 in Fig. 11a and c. However, some inundated points, like P13 and P18, where surrounding inlets are removed, may also underestimate maximum water depths. This occurs because these inlets initially contribute to surface overflows in FSN-based simulations, as evidenced by the underestimation of maximum water depth when NDA is adopted. In particular, we can also observe the overestimation of maximum water depths at certain flood points without removing local inlets during simplification, such as in P2 and P4 with ΔD=0. Examining the simulated total discharges at rainwater inlets near P2 (Fig. 11b and d) reveals that increased local inflows are outweighed by amplified upstream overflows, thus exacerbating downstream inundation conditions.
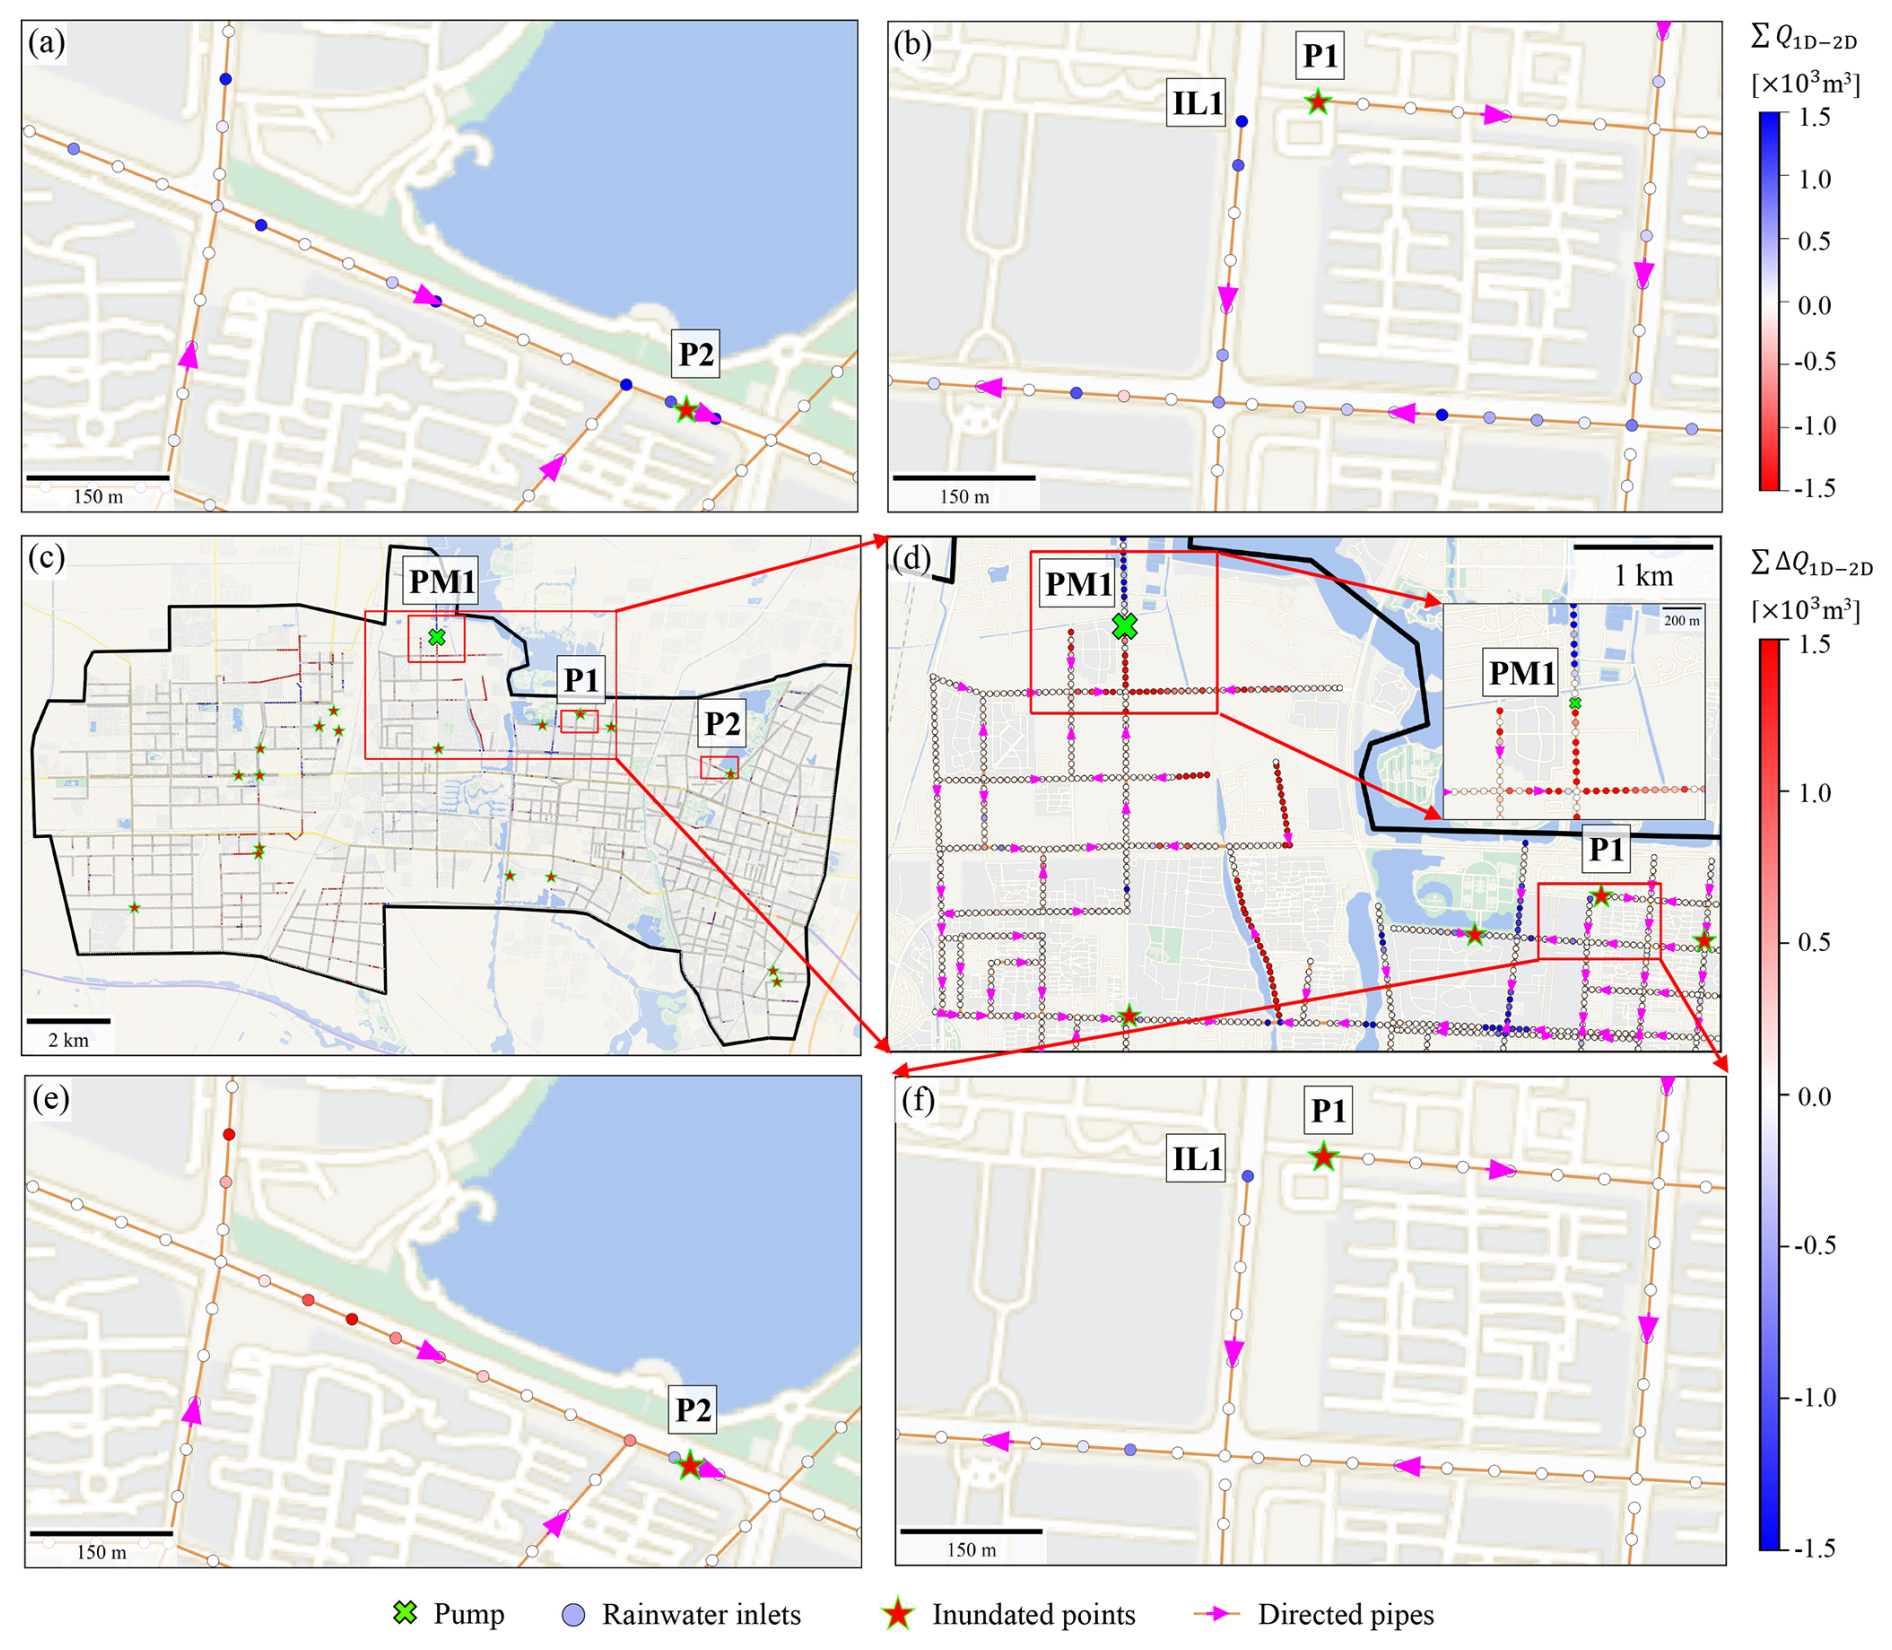
Figure 10Comparison of accumulated discharges (∑Q1D-2D) at rainwater inlets during the July 2022 storm, where positive values indicate inflows. (a–b) FSN simulated discharges. (c–f) Simulated discharge differences (∑ΔQ1D-2D) between FSN and FSR, defined as FSN minus FSR. Basemaps are provided by Tianditu (https://map.tianditu.gov.cn/, last access: 14 October 2025).
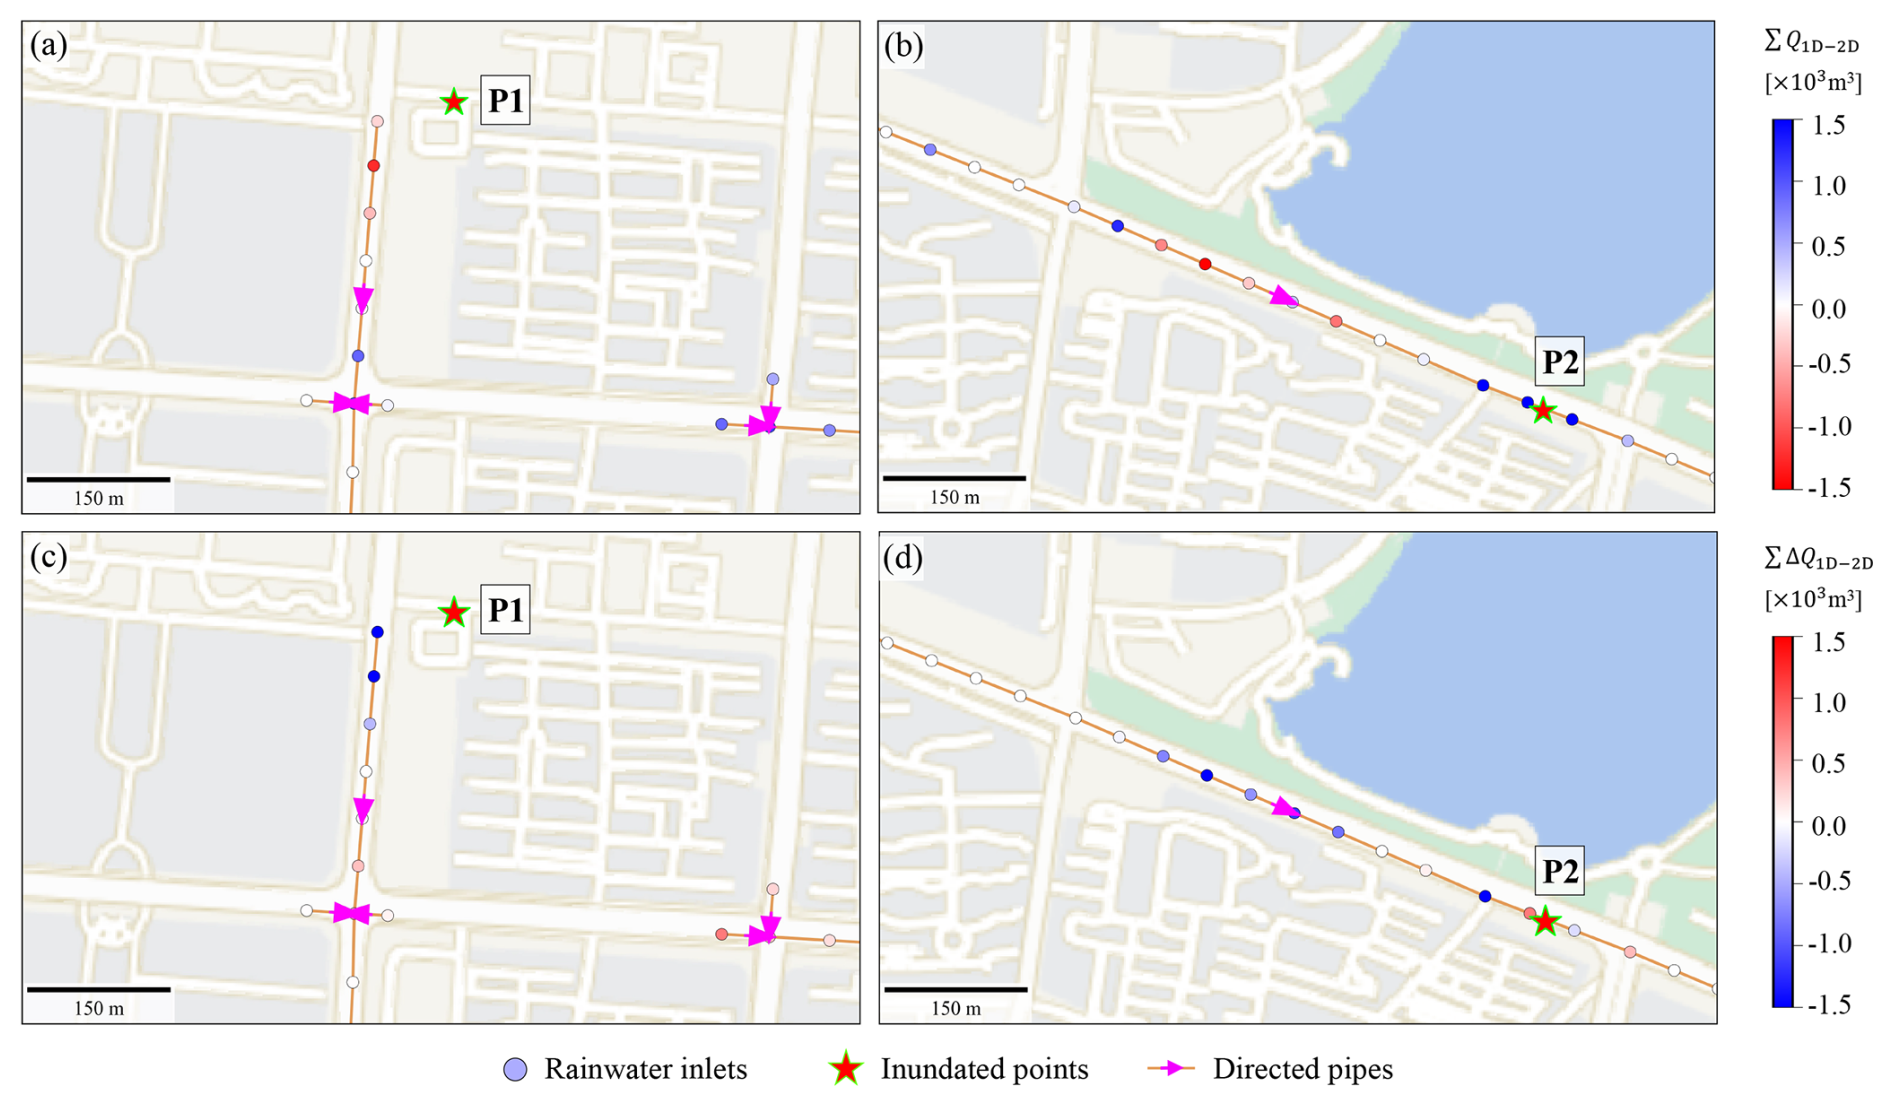
Figure 11Comparison of accumulated discharges at rainwater inlets during the July 2022 storm. (a–b) RSN simulated discharges. (c–d) Simulated discharge differences between RSN and FSN defined by RSN minus FSN. Basemaps are provided by Tianditu (https://map.tianditu.gov.cn/).
In summary, while simplified physical approaches based on major roads can yield a similar pipe slope distribution (Sect. 4.3), achieving an accurate simulation of maximum inundation depths requires the proper configuration of regulated facilities and drainage pathways. Otherwise, equifinal methods, which offer flexible parameter calibration, can offer better performance, especially when observational data are available.
4.6 Design rainfall analysis: physical approaches outperform but require more complete information
To assess whether equifinal approaches exhibit comparable or even better performance than physical counterparts, we further compare inundated areas simulated by different approaches under design rainfalls where the FSR-based results serve as the reference.
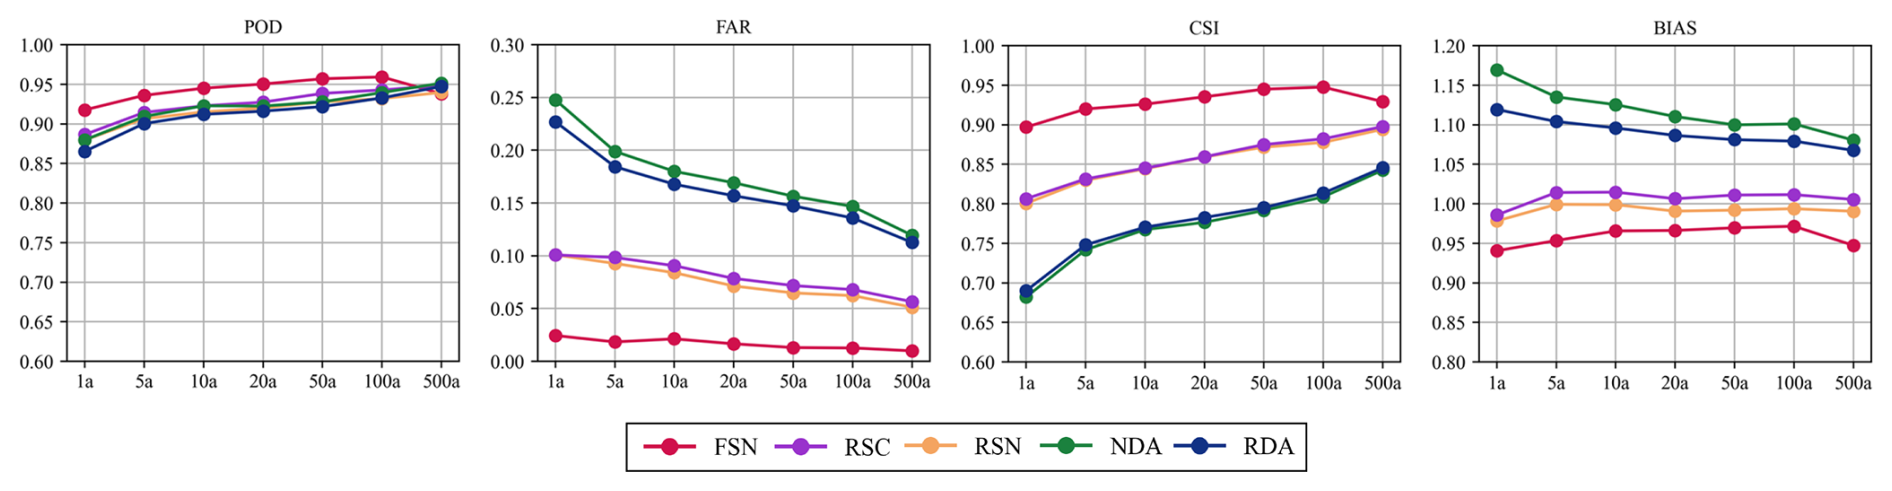
Figure 12Comparison of simulated inundation area under design rainfall scenarios using different approximation methods.
In terms of detecting potential inundated areas, all approaches show only minor variations with high POD values ranging between 0.85 and 0.95. The NDA and RDA approaches even slightly outperform FSN, RSC, and RSN under extreme rainfall conditions, aligning with previous results in Sect. 4.5. As rainfall return periods decrease, the FAR values of the RSC, RSN, NDA and RDA approaches gradually increase, with the latter two showing much more significant variations. This indicates that the performance of the equivalent drainage rate id, calibrated using a single event, still has high uncertainty when applied to rainfall scenarios of varying intensities. Therefore, while differences in PODs are minimal, the dramatically higher FARs of equifinal approaches widen the overall performance gap, as measured by CSI, especially for rainfall events with return periods below 50 years. Regarding bias, physical approaches that adopt reconstructed networks but without controls consistently underestimate the total inundated area with BIAS values less than 1. In contrast, other equifinal approaches tend to overestimate the inundated area. Specifically, RDA and NDA can overestimate the total inundated area by more than 8 % and 10 %, respectively, for rainfall events with return periods less than 100 years. Thus, a constant equivalent drainage rate is insufficient to achieve an accurate simulation of sewer drainage effects under diverse rainfall conditions. However, physical approaches can also yield biased estimations of the inundated area if regulated facilities are not properly configured.
From the perspective of water balance, the total inundated area (or volume) is closely related to the volume of rainwater drained outside the system. Thus, we further compare the discharge processes at outfalls, simulated using different physical approaches (see Fig. S3). Being the solution reconstructed using the most detailed information, FSR clearly reveals insufficient drainage capacities at most outfalls, such as OF1. When regulated facilities are excluded but the sewer layout remains unchanged, FSN demonstrates significantly higher discharges, especially at major outflow points such as OF2 and OF3, recording peak flows that are over 300 % higher, thereby leading to an underestimation of total inundated areas (Fig. 12). When the sewer layout is further simplified using the roads layout, the simulated outflows decrease by approximately 27 % due to reduced inlets that collect rainwater into the sewer system. This attribution can be further supported by the improved alignment of outflow hydrographs between RSN and RSC, which exhibit fewer truncations during peak flows under regulated conditions when compared to FSR and FSN. This indicates an alleviation of drainage deficiency due to reduced rainwater inflow. However, certain outflow points, such as OF3, still yield substantially higher discharges with simplified networks. A comparison of the layouts used in FSN and RSN reveals that a main pipe, measuring 6.8 m × 2.6 m (near OF1 and OF8, cf. Fig. 13) is removed during simplification, blocking the drainage pathway that would otherwise divert upstream rainwater to the northern outflow points such as OF1 and OF8, eventually magnifying the inflow to OF3. Thus, for real urban environments with complicated sewer layouts due to practical factors such as multistage construction, direct geometric simplification through major roads may remove some critical connectivity inside a graph-like drainage system and thus fail to accurately represent the drainage effects of the sewer network due to topological incompleteness.
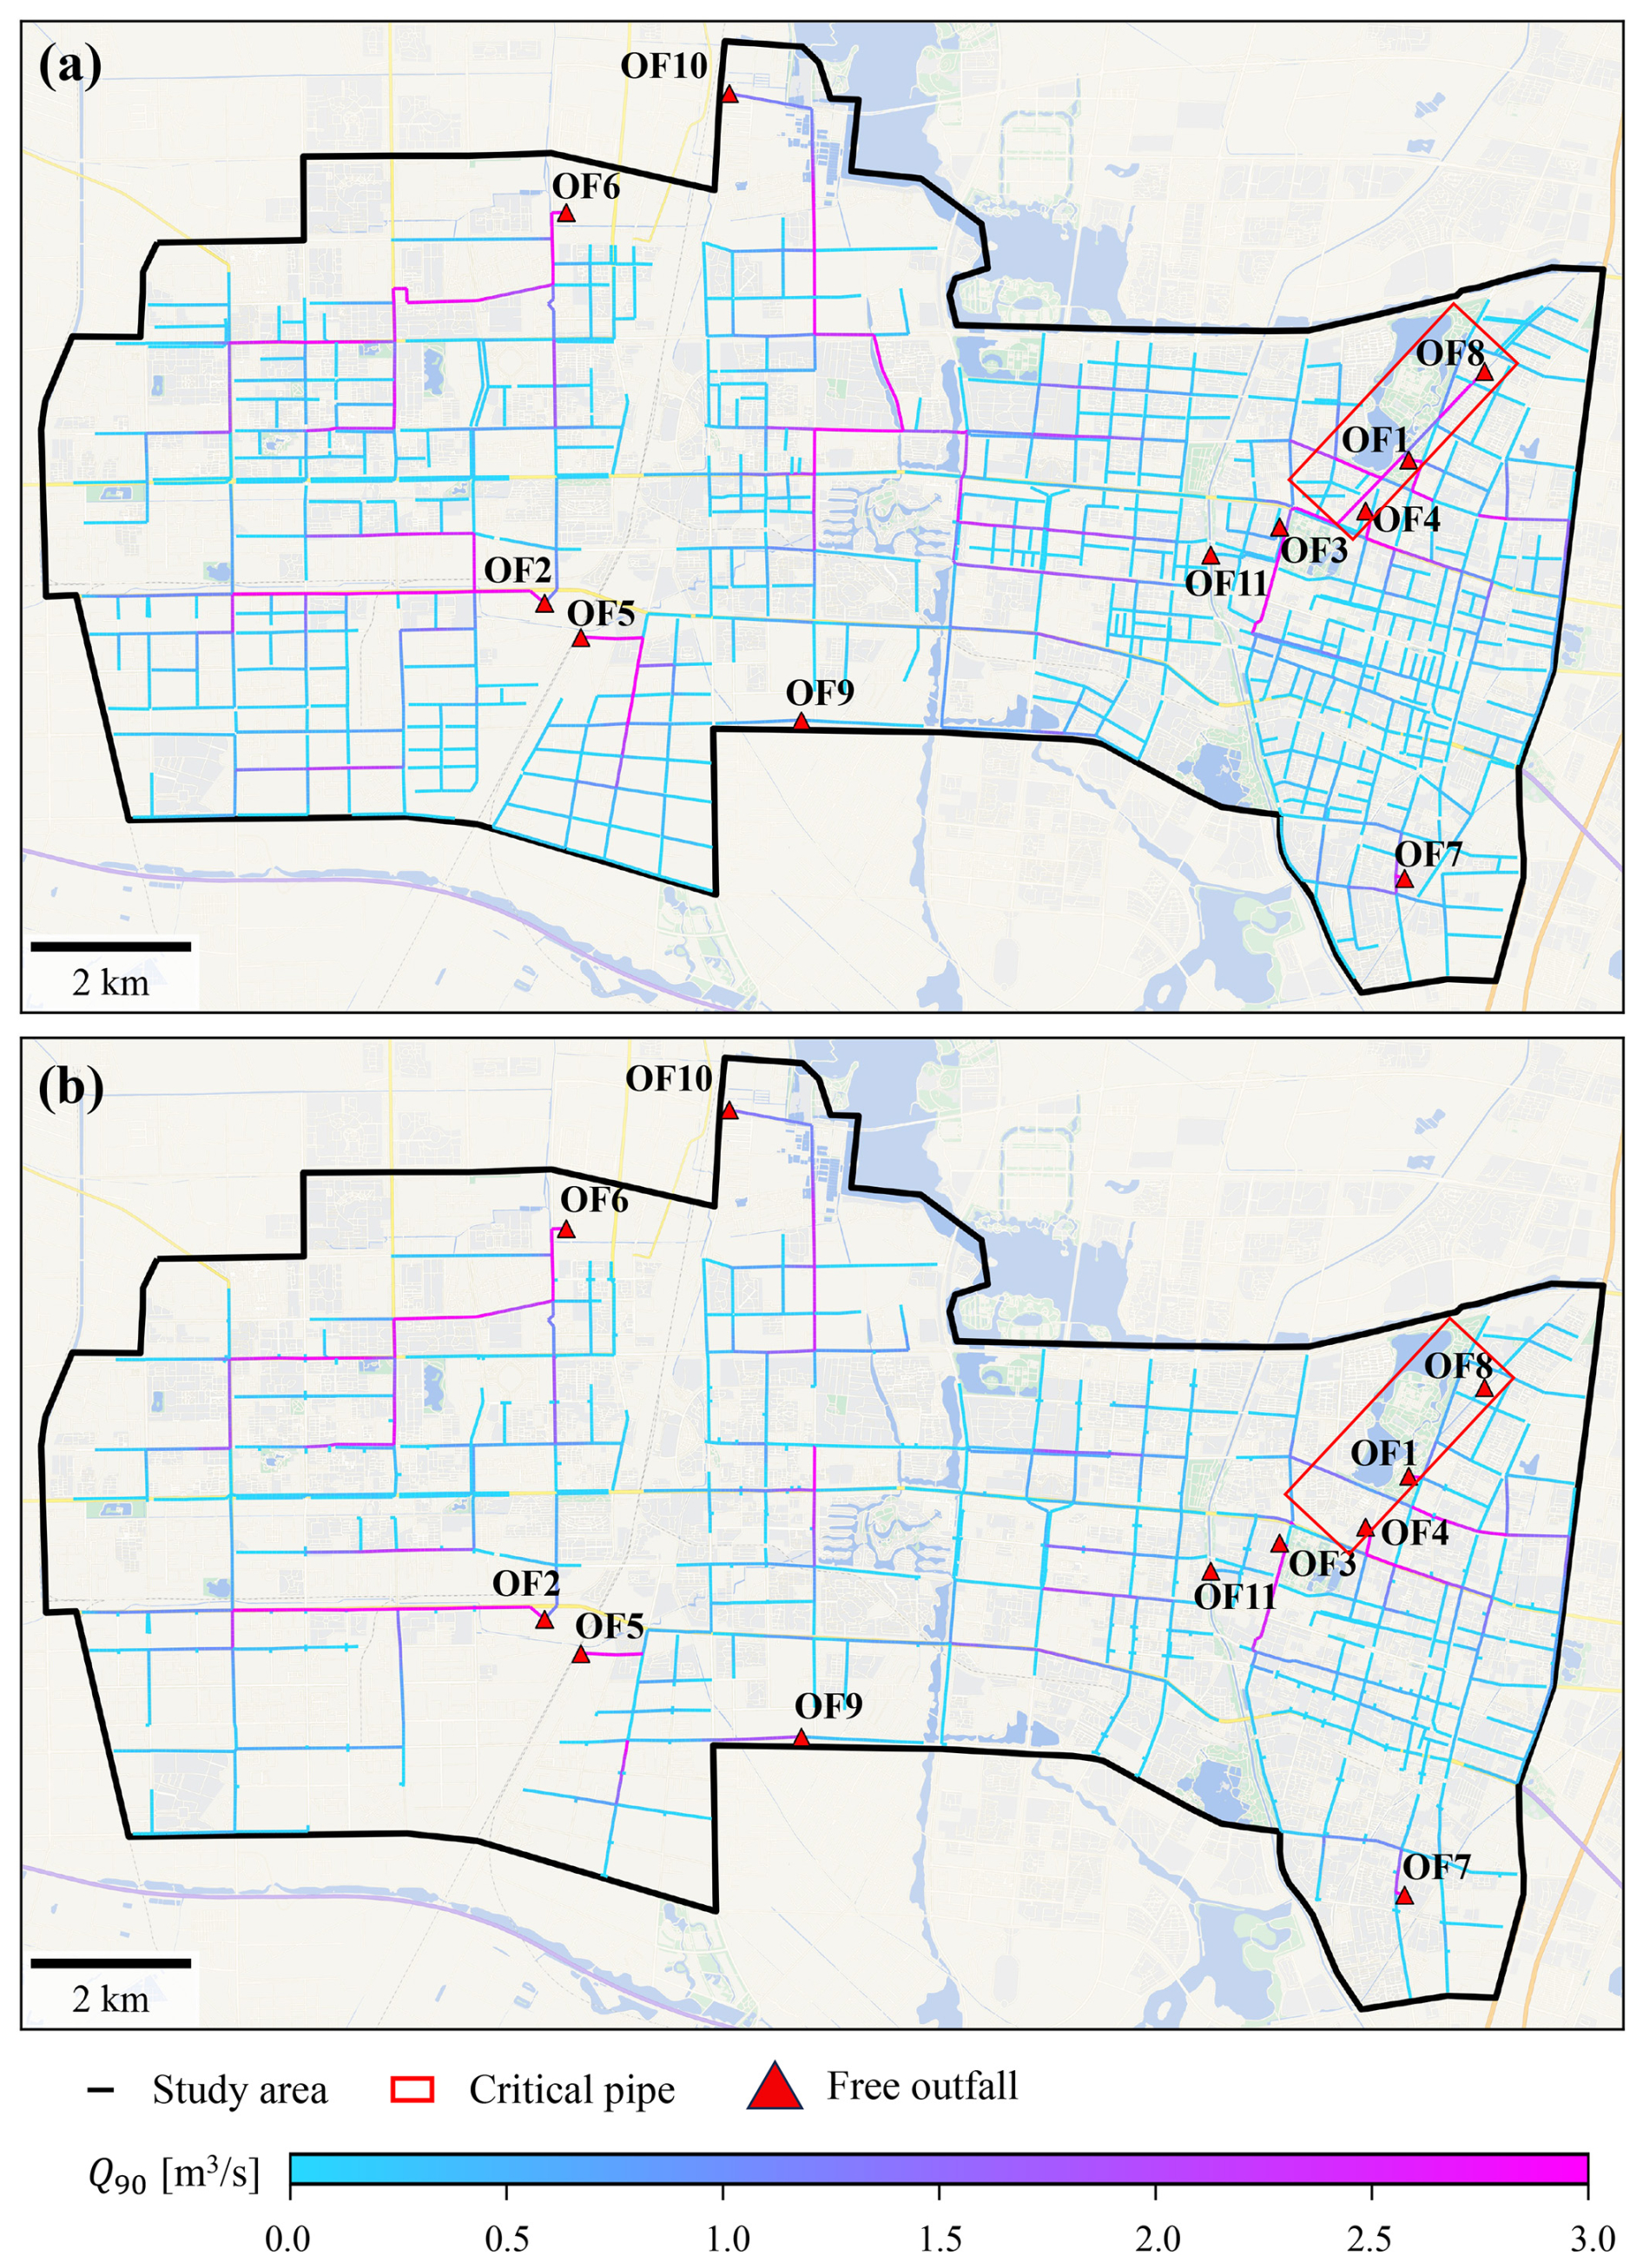
Figure 13Comparison of simulated flows at 90 percentiles (Q90) of pipes under design rainfall scenarios using physical approaches with/without network simplification. (a) FSN approach. (b) RSN approach. Basemaps are provided by Tianditu (https://map.tianditu.gov.cn/).
4.7 Outlook and limitations
The proposed graph-reconstruction-based approach offers an efficient solution for generating physical sewer models using available data on sewer layouts and surface elevation, which can be obtained from local surveys (Xing et al., 2022), engineering drawings (Lyu et al., 2018), or open source software such as SWMManywhere (Dobson et al., 2025). Given the significant influence of network topology and regulated facilities on inundation simulation results (as discussed in Sect. 4.5 and 4.6), in addition to the aforementioned data sources, it is imperative to further implement intelligent surveying systems targeting relevant critical components such as inlets and outfalls. These data can then be integrated with the proposed reconstruction algorithm to achieve more reliable pluvial flood modeling. In particular, outfall identification still remains a difficult task, especially for decentralized sewer networks in relatively flat urban areas, challenging the applicability of existing topography-driven approaches (Dobson et al., 2025) and highlighting the need for user-defined configurations based on prior knowledge of the area (Reyes-Silva et al., 2023). In addition, it should be acknowledged that given the inherent quality issues of multi-source geographical datasets, the mathematical programming procedures in the proposed approach may occasionally fail because of infeasible configurations such as over-elevated outfalls and dangling pipelines. While introducing data cleaning procedures may help alleviate such issues and streamline the downstreaming reconstruction process, it also necessitates a trade-off between algorithm robustness and accuracy owing to embedded assumptions during quality control, which deserves further investigations. In addition to related cleaning functions implemented in existing packages like SWMManywhere (Dobson et al., 2025), we propose leveraging the built-in functionality of irreducible inconsistent subset (IIS) computation within our optimization-based framework, which can be steadily accessed in solvers such as Gurobi (https://docs.gurobi.com/projects/optimizer, last access: 14 October 2025). This tool can help identify the specific constraints responsible for infeasibility and thus support the spatial pinpointing of ill-conditioned sewer elements that over-constrain the optimization and may require further correction or elimination. In summary, additional integration with other existing tools will further enhance the practicality of the proposed reconstruction method and facilitate a more realistic representation of drainage effects in urban pluvial flood simulation.
In this work, we present a graph-reconstruction-based approach for building a physical sewer hydraulic model, leveraging incomplete information and a surface elevation model, while adhering to design guidelines. In contrast to conventional optimal-design-based approaches, our approach seeks to reconstruct the most possible sewer network with related hydraulic properties, such as gravitational flow direction and nodal invert elevation, constrained by minimal deviation from the initial status based on available information. The resulting mathematical programming problems can be equivalently transformed into corresponding linearized formulations, ensuring their computational efficiency for large-scale applications. We apply the proposed approach to Yinchuan's main city zone, characterized by multiple outfalls consisting of wastewater treatment plants and pump stations, yielding the following key insights:
-
The reconstructed sewer hydraulic module, integrated into a 1D/2D coupled hydrologic-hydrodynamic model, achieves high accuracy in simulating maximum inundation depths, with an R2 of 0.95. A comparison with road-layout-based simplifications further demonstrates the robustness of our approach in reconstructing sewer hydraulic properties, as the simplified model maintains a similar distribution of pipe slopes.
-
While equifinal approaches ease parameter calibration by encapsulating complex sewer drainage processes into equivalent drainage rates, the proposed reconstruction approach can reliably achieve superior performance in simulating inundated areas across various rainfall scenarios. This improvement stems from its physically grounded structure in simulating the bidirectional interaction between the ground surface and the sewer system, indicating that physical reconstruction is preferable to approximate sewer drainage effects in operational applications.
-
The completeness of the available information has non-negligible effects on the simulated hydraulic performance of reconstructed sewer networks. Simplifications involving road-based layouts and regulated facility removal lead to complex deviation patterns in local maximum inundation depths and outflow hydrographs, with both overestimations and underestimations arising from the combined effects of surface microtopography, sewer connectivity modification, and regulated facility operation.
In conclusion, we provide an efficient sewer reconstruction approach that improves simulation performance and understanding of sewer drainage effects during urban pluvial floods, accounting for varying levels of information completeness. However, uncertainties persist in reconstructed physical models when detailed information on regulated facilities and drainage pathways is lacking. Thus, future research will focus on integrating advanced techniques, such as data assimilation and intelligent surveying systems, with reconstructed physical models to augment the realism of sewer drainage process representation.
Land use data are available at https://worldcover2021.esa.int/download (last access: 14 October 2025). DEM and sewer network information are not publicly available due to privacy reasons. The snapshot of the source code and compiled application for sewer reconstruction has been archived on Zenodo (https://doi.org/10.5281/zenodo.15522608, Li et al., 2025). And the up-to-date version is available at https://github.com/LllC-mmd/ASHED_sewerReconstruction (last access: 14 October 2025).
The supplement related to this article is available online at https://doi.org/10.5194/hess-29-5677-2025-supplement.
RL conceived the idea and implement the algorithm. JL and JS collected the data. RL, TS, JL, FT, and GN conducted the analysis. RL drafted the manuscript and all authors reviewed and edited the manuscript.
At least one of the (co-)authors is a member of the editorial board of Hydrology and Earth System Sciences. The peer-review process was guided by an independent editor, and the authors also have no other competing interests to declare.
Publisher's note: Copernicus Publications remains neutral with regard to jurisdictional claims made in the text, published maps, institutional affiliations, or any other geographical representation in this paper. While Copernicus Publications makes every effort to include appropriate place names, the final responsibility lies with the authors. Views expressed in the text are those of the authors and do not necessarily reflect the views of the publisher.
This work was supported by the Gansu Province Science and Technology Department (22ZD6WA043), Program of Joint Research Institute of Tsinghua University-Ningxia Yinchuan for the Internet of Water and Digital Governance (SKL-IOW-2022TC2010), and the NERC Independent Research Fellowship (NE/P018637/2).
This paper was edited by Nadav Peleg and reviewed by three anonymous referees.
Bakhshipour, A. E., Bakhshizadeh, M., Dittmer, U., Haghighi, A., and Nowak, W.: Hanging Gardens Algorithm to Generate Decentralized Layouts for the Optimization of Urban Drainage Systems, Journal of Water Resources Planning and Management, 145, 04019034, https://doi.org/10.1061/(ASCE)WR.1943-5452.0001103, 2019. a, b
Bakhshipour, A. E., Hespen, J., Haghighi, A., Dittmer, U., and Nowak, W.: Integrating Structural Resilience in the Design of Urban Drainage Networks in Flat Areas Using a Simplified Multi-Objective Optimization Framework, Water, 13, https://doi.org/10.3390/w13030269, 2021. a, b
Blumensaat, F., Wolfram, M., and Krebs, P.: Sewer model development under minimum data requirements, Environmental Earth Sciences, 65, 1427–1437, https://doi.org/10.1007/s12665-011-1146-1, 2012. a
Cao, X., Lyu, H., Ni, G., Tian, F., Ma, Y., and Grimmond, C.: Spatial Scale Effect of Surface Routing and Its Parameter Upscaling for Urban Flood Simulation Using a Grid-Based Model, Water Resources Research, 56, e2019WR025468, https://doi.org/10.1029/2019WR025468, 2020. a
Chegini, T. and Li, H.-Y.: An algorithm for deriving the topology of belowground urban stormwater networks, Hydrol. Earth Syst. Sci., 26, 4279–4300, https://doi.org/10.5194/hess-26-4279-2022, 2022. a, b
Chen, Z. and Huang, G.: Numerical simulation study on the effect of underground drainage pipe network in typical urban flood, Journal of Hydrology, 638, 131481, https://doi.org/10.1016/j.jhydrol.2024.131481, 2024. a, b
Dobson, B., Jovanovic, T., Alonso-Álvarez, D., and Chegini, T.: SWMManywhere: A workflow for generation and sensitivity analysis of synthetic urban drainage models, anywhere, Environmental Modelling & Software, 186, 106358, https://doi.org/10.1016/j.envsoft.2025.106358, 2025. a, b, c, d, e
Dunton, A. and Gardoni, P.: Generating network representations of small-scale infrastructure using generally available data, Computer-Aided Civil and Infrastructure Engineering, 39, 1143–1158, https://doi.org/10.1111/mice.13137, 2024. a
Duque, N., Bach, P. M., Scholten, L., Fappiano, F., and Maurer, M.: A Simplified Sanitary Sewer System Generator for Exploratory Modelling at City-Scale, Water Research, 209, 117903, https://doi.org/10.1016/j.watres.2021.117903, 2022. a
Elimam, A. A., Charalambous, C., and Ghobrial, F. H.: Optimum Design of Large Sewer Networks, Journal of Environmental Engineering, 115, 1171–1190, https://doi.org/10.1061/(ASCE)0733-9372(1989)115:6(1171), 1989. a
Forrest, J. and Lougee-Heimer, R.: CBC User Guide, Chapter 10, 257–277, INFORMS, https://doi.org/10.1287/educ.1053.0020, 2005. a
Giangrande, S. E., McGraw, R., and Lei, L.: An Application of Linear Programming to Polarimetric Radar Differential Phase Processing, Journal of Atmospheric and Oceanic Technology, 30, 1716–1729, https://doi.org/10.1175/JTECH-D-12-00147.1, 2013. a, b
Hall, J.: Direct Rainfall Flood Modelling: The Good, the Bad and the Ugly, Australasian Journal of Water Resources, 19, 74–85, https://doi.org/10.7158/13241583.2015.11465458, 2015. a
Hesarkazzazi, S., Hajibabaei, M., Bakhshipour, A. E., Dittmer, U., Haghighi, A., and Sitzenfrei, R.: Generation of optimal (de)centralized layouts for urban drainage systems: A graph-theory-based combinatorial multi-objective optimization framework, Sustainable Cities and Society, 81, 103827, https://doi.org/10.1016/j.scs.2022.103827, 2022. a, b
Johnson, D. B.: Finding All the Elementary Circuits of a Directed Graph, SIAM Journal on Computing, 4, 77–84, https://doi.org/10.1137/0204007, 1975. a
Järvi, L., Grimmond, C., and Christen, A.: The Surface Urban Energy and Water Balance Scheme (SUEWS): Evaluation in Los Angeles and Vancouver, Journal of Hydrology, 411, 219–237, https://doi.org/10.1016/j.jhydrol.2011.10.001, 2011. a, b
Kim, S. E., Seo, Y., Hwang, J., Yoon, H., and Lee, J.: Connectivity-informed drainage network generation using deep convolution generative adversarial networks, Scientific Reports, 11, 1519, https://doi.org/10.1038/s41598-020-80300-6, 2021. a
Krebs, G., Kokkonen, T., Valtanen, M., Setälä, H., and Koivusalo, H.: Spatial resolution considerations for urban hydrological modelling, Journal of Hydrology, 512, 482–497, https://doi.org/10.1016/j.jhydrol.2014.03.013, 2014. a
Li, D., Hou, J., Xia, J., Tong, Y., Yang, D., Zhang, D., and Gao, X.: An Efficient Method for Approximately Simulating Drainage Capability for Urban Flood, Frontiers in Earth Science, 8, https://doi.org/10.3389/feart.2020.00159, 2020. a
Li, D., Hou, J., Shen, R., Li, B., Tong, Y., and Wang, T.: Approximation method for the sewer drainage effect for urban flood modeling in areas without drainage-pipe data, Frontiers in Environmental Science, 11, https://doi.org/10.3389/fenvs.2023.1134985, 2023. a
Li, G. and Matthew, R. G. S.: New Approach for Optimization of Urban Drainage Systems, Journal of Environmental Engineering, 116, 927–944, https://doi.org/10.1061/(ASCE)0733-9372(1990)116:5(927), 1990. a
Li, R., Liu, J., Sun, T., Shao, J., Tian, F., and Ni, G.: Graph-based sewer reconstruction with incomplete information, Zenodo [data set], https://doi.org/10.5281/zenodo.15522608, 2025. a
Liu, L., Sun, J., and Lin, B.: A large-scale waterlogging investigation in a megacity, Natural Hazards, 114, 1505–1524, https://doi.org/10.1007/s11069-022-05435-3, 2022. a
Lu, Y., Zhai, G., and Zhou, S.: An integrated Bayesian networks and Geographic information system (BNs-GIS) approach for flood disaster risk assessment: A case study of Yinchuan, China, Ecological Indicators, 166, 112322, https://doi.org/10.1016/j.ecolind.2024.112322, 2024. a
Luan, G., Hou, J., Wang, T., Zhou, Q., Xu, L., Sun, J., and Wang, C.: Method for analyzing urban waterlogging mechanisms based on a 1D-2D water environment dynamic bidirectional coupling model, Journal of Environmental Management, 360, 121024, https://doi.org/10.1016/j.jenvman.2024.121024, 2024. a
Lyu, H., Ni, G., Cao, X., Ma, Y., and Tian, F.: Effect of Temporal Resolution of Rainfall on Simulation of Urban Flood Processes, Water, 10, https://doi.org/10.3390/w10070880, 2018. a
Machine Hsie, M.-Y. W. and Huang, C. Y.: Optimal urban sewer layout design using Steiner tree problems, Engineering Optimization, 51, 1980–1996, https://doi.org/10.1080/0305215X.2018.1560436, 2019. a, b
McGrath, H., Bourgon, J.-F., Proulx-Bourque, J.-S., Nastev, M., and Abo El Ezz, A.: A comparison of simplified conceptual models for rapid web-based flood inundation mapping, Natural Hazards, 93, 905–920, https://doi.org/10.1007/s11069-018-3331-y, 2018. a
Mitchell, S., O’Sullivan, M., and Dunning, I.: Pulp: a linear programming toolkit for python, Optimization Online, https://optimization-online.org/2011/09/3178/ (last access: 14 October 2025), 2011. a
Ministry of Housing and Urban–Rural Development of the People's Republic of China (MOHURD): Standard for Design of Outdoor Wastewater Engineering (GB 50014–2021), Beijing, China, https://www.ceasjx.com/ueditor/php/upload/file/20211026/1635222094210836.pdf (last access: 14 October 2025), 2021 (in Chinese). a, b, c, d
Montalvo, C., Reyes-Silva, J., Sañudo, E., Cea, L., and Puertas, J.: Urban pluvial flood modelling in the absence of sewer drainage network data: A physics-based approach, Journal of Hydrology, 634, 131043, https://doi.org/10.1016/j.jhydrol.2024.131043, 2024. a, b, c
Ni, G.-H., Liu, Z.-Y., Lei, Z.-D., Yang, D.-W., and Wang, L.: Continuous Simulation of Water and Soil Erosion in a Small Watershed of the Loess Plateau with a Distributed Model, Journal of Hydrologic Engineering, 13, 392–399, https://doi.org/10.1061/(ASCE)1084-0699(2008)13:5(392), 2008. a, b
Perrini, P., Cea, L., Chiaravalloti, F., Gabriele, S., Manfreda, S., Fiorentino, M., Gioia, A., and Iacobellis, V.: A Runoff-On-Grid Approach to Embed Hydrological Processes in Shallow Water Models, Water Resources Research, 60, e2023WR036421, https://doi.org/10.1029/2023WR036421, 2024. a
Reyes-Silva, J. D., Novoa, D., Helm, B., and Krebs, P.: An Evaluation Framework for Urban Pluvial Flooding Based on Open-Access Data, Water, 15, https://doi.org/10.3390/w15010046, 2023. a, b, c, d, e
Rosenzweig, B. R., McPhillips, L., Chang, H., Cheng, C., Welty, C., Matsler, M., Iwaniec, D., and Davidson, C. I.: Pluvial flood risk and opportunities for resilience, WIREs Water, 5, e1302, https://doi.org/10.1002/wat2.1302, 2018. a
Rossman, L. A.: Storm Water Management Model User's Manual, Version 5.1, U.S. Environmental Protection Agency, Office of Research and Development, Cincinnati, OH, EPA/600/R-14/413b, 353 pp., September 2015, available at: https://www.epa.gov/sites/default/files/2019-02/documents/epaswmm5_1_manual_master_8-2-15.pdf (last access: 14 October 2025), 2015. a, b
Rossman, L. A. and Huber, W.: Storm Water Management Model Reference Manual, Volume II Hydraulics, U.S. Environmental Protection Agency, Office of Research and Development, Washington, DC, EPA/600/R-17/111, May 2017, available at: https://www.epa.gov/water-research/storm-water-management-model-swmm#documents (last access: 15 October 2025), 2017. a
Safavi, H. and Geranmehr, M. A.: Optimization of sewer networks using the mixed-integer linear programming, Urban Water Journal, 14, 452–459, https://doi.org/10.1080/1573062X.2016.1176222, 2017. a, b
Schmitt, T. G. and Scheid, C.: Evaluation and communication of pluvial flood risks in urban areas, WIREs Water, 7, e1401, https://doi.org/10.1002/wat2.1401, 2020. a
Schubert, J. E. and Sanders, B. F.: Building treatments for urban flood inundation models and implications for predictive skill and modeling efficiency, Advances in Water Resources, 41, 49–64, https://doi.org/10.1016/j.advwatres.2012.02.012, 2012. a
Shi, X., Liu, Z., Carlos, V., and Jia, H.: The role of graph-based methods in urban drainage networks (UDNs): review and directions for future, Urban Water Journal, 20, 1095–1109, https://doi.org/10.1080/1573062X.2023.2252807, 2023. a
Sitzenfrei, R., Wang, Q., Kapelan, Z., and Savić, D.: Using Complex Network Analysis for Optimization of Water Distribution Networks, Water Resources Research, 56, e2020WR027929, https://doi.org/10.1029/2020WR027929, 2020. a
Song, L., Zhou, J., Guo, J., Zou, Q., and Liu, Y.: A robust well-balanced finite volume model for shallow water flows with wetting and drying over irregular terrain, Advances in Water Resources, 34, 915–932, https://doi.org/10.1016/j.advwatres.2011.04.017, 2011. a, b
Swamee, P. K. and Sharma, A. K.: Optimal design of a sewer line using Linear Programming, Applied Mathematical Modelling, 37, 4430–4439, https://doi.org/10.1016/j.apm.2012.09.041, 2013. a, b, c
Tran, V. N., Ivanov, V. Y., Huang, W., Murphy, K., Daneshvar, F., Bednar, J. H., Alexander, G. A., Kim, J., and Wright, D. B.: Connectivity in urbanscapes can cause unintended flood impacts from stormwater systems, Nature Cities, 1, 654–664, https://doi.org/10.1038/s44284-024-00116-7, 2024. a, b
Wagner, H. M.: Linear Programming Techniques for Regression Analysis, Journal of the American Statistical Association, 54, 206–212, https://doi.org/10.1080/01621459.1959.10501506, 1959. a
Wang, J., Liu, J., Mei, C., Wang, H., and Lu, J.: A multi-objective optimization model for synergistic effect analysis of integrated green-gray-blue drainage system in urban inundation control, Journal of Hydrology, 609, 127725, https://doi.org/10.1016/j.jhydrol.2022.127725, 2022. a
Wang, Q., Savić, D. A., and Kapelan, Z.: GALAXY: A new hybrid MOEA for the optimal design of Water Distribution Systems, Water Resources Research, 53, 1997–2015, https://doi.org/10.1002/2016WR019854, 2017. a
Wang, S. and Wang, H.: Extending the Rational Method for assessing and developing sustainable urban drainage systems, Water Research, 144, 112–125, https://doi.org/10.1016/j.watres.2018.07.022, 2018. a
Weng, Q.: Remote sensing of impervious surfaces in the urban areas: Requirements, methods, and trends, Remote Sensing of Environment, 117, 34–49, https://doi.org/10.1016/j.rse.2011.02.030, 2012. a
Xing, Y., Liang, Q., Wang, G., Ming, X., and Xia, X.: City-scale hydrodynamic modelling of urban flash floods: the issues of scale and resolution, Natural Hazards, 96, 473–496, https://doi.org/10.1007/s11069-018-3553-z, 2019. a
Xing, Y., Shao, D., Yang, Y., Ma, X., and Zhang, S.: Influence and interactions of input factors in urban flood inundation modeling: An examination with variance-based global sensitivity analysis, Journal of Hydrology, 600, 126524, https://doi.org/10.1016/j.jhydrol.2021.126524, 2021. a, b
Xing, Y., Shao, D., Liang, Q., Chen, H., Ma, X., and Ullah, I.: Investigation of the drainage loss effects with a street view based drainage calculation method in hydrodynamic modelling of pluvial floods in urbanized area, Journal of Hydrology, 605, 127365, https://doi.org/10.1016/j.jhydrol.2021.127365, 2022. a
Yu, X., Wu, Y., Meng, F., Zhou, X., Liu, S., Huang, Y., and Wu, X.: A review of graph and complex network theory in water distribution networks: Mathematical foundation, application and prospects, Water Research, 253, 121238, https://doi.org/10.1016/j.watres.2024.121238, 2024. a
Zanaga, D., Van De Kerchove, R., Daems, D., De Keersmaecker, W., Brockmann, C., Kirches, G., Wevers, J., Cartus, O., Santoro, M., Fritz, S., Lesiv, M., Herold, M., Tsendbazar, N.-E., Xu, P., Ramoino, F., and Arino, O.: ESA WorldCover 10 m 2021 v200, Zenodo, https://doi.org/10.5281/zenodo.7254221, 2022. a
- Abstract
- Introduction
- Graph-based sewer network reconstruction
- AUTOSHED: A 1D/2D coupled hydrologic-hydrodynamic model
- Performance analysis: from graph reconstruction to urban flood simulation
- Conclusions
- Code and data availability
- Author contributions
- Competing interests
- Disclaimer
- Financial support
- Review statement
- References
- Supplement