the Creative Commons Attribution 4.0 License.
the Creative Commons Attribution 4.0 License.
 | 21 Jul 2025
Influence of storm type on compound flood drivers of a mid-latitude coastal urban environment
Philip M. Orton
James F. Booth
Thomas Wahl
Arthur DeGaetano
Joel Kaatz
Radley M. Horton
A common feature within coastal cities is small, urbanized watersheds where the time of concentration is short, leading to vulnerability to flash flooding during coastal storms that can also cause storm surge. While many recent studies have provided evidence of dependency in these two flood drivers for many coastal areas worldwide, few studies have investigated their co-occurrence locally in detail or the storm types that are involved. Here we present a bivariate statistical analysis framework with historical rainfall and storm surge and tropical cyclone (TC) and extratropical cyclone (ETC) track data, using New York City (NYC) as a mid-latitude demonstration site where these storm types play different roles. In contrast to prior studies that focused on daily or longer durations of rain, we apply hourly data and study simultaneous drivers and lags between them. We quantify characteristics of compound flood drivers, including their dependency, magnitude, lag time, and joint return periods (JRPs), separately for TCs, ETCs, non-cyclone-associated events, and merged data from all events. We find TCs have markedly different driver characteristics from other storm types and dominate the joint probabilities of the most extreme rain surge compound events, even though they occur much less frequently. ETCs are the predominant source of more frequent moderate compound events. The hourly data also reveal subtle but important spatial differences in lag times between the joint flood drivers. For Manhattan and southern shores of NYC during top-ranked TC rain events, rain intensity has a strong negative correlation with lag time to peak surge, promoting pluvial–coastal compound flooding. However, for the Bronx River in northern NYC, fluvial–coastal compounding is favored due to a 2–6 h lag from the time of peak rain to peak surge.
- Article
(5419 KB) - Full-text XML
-
Supplement
(1599 KB) - BibTeX
- EndNote


Floods are one of the most catastrophic natural hazards, and frequently threaten human life and property worldwide. They are normally classified by several types, such as coastal, pluvial, and fluvial flooding, based on their triggering mechanisms, also known as flood drivers (Pachauri and Reisinger, 2007). These flood drivers can occur at the same time to cause what is referred to as compound flooding (e.g., Field et al., 2012).
Flood hazard assessments traditionally focus on evaluating the extreme values of coastal and riverine or rainfall drivers separately (e.g., Arns et al., 2013; Abdelkader et al., 2023; Orton et al., 2023; Rosenzweig et al., 2024). However, this may underestimate hazard risk by neglecting the co-occurrence of two or more extremes in a single event (Zscheischler et al., 2018). Beginning after Hurricane Katrina (2005), the joint occurrence of multiple extremes is emphasized and documented in the new flood protection construction criteria (Resio et al., 2007).
In response to this growing understanding of the risk from compound flood hazards, the topic has been studied in several ways, including statistical analyses of correlations and joint probabilities of the historical extremes of the compound flood drivers (e.g., Wahl et al., 2010), hydrologic and hydrodynamic modeling of historical events (e.g., Orton et al., 2012; Mita et al., 2023), and hybrid approaches using synthetic storms (e.g., Gori et al., 2022).
In statistical analyses of historical compound extreme flood drivers, multivariate statistical models (e.g., Najibi et al., 2023; Jane et al., 2020; Wahl et al., 2012) and probabilistic modeling frameworks to select the best model (e.g., Bender et al., 2016; Torre et al., 2019) are developed to improve modeling of the dependency structure of the compound correlated extremes. Copula theory (Sklar, 1959) is commonly applied as a solution for multivariate probabilistic modeling, since copulas (e.g., Joe, 2014; Roch and Alegre, 2006) have flexible joint distributions to quantify the dependency of correlated events. Bivariate or trivariate combinations of flooding factors, such as waves, storm surge, water level, river discharge and volume, rainfall intensity and duration, groundwater, and sea level rise (SLR), are selected for the multivariate statistical analysis based on various research interests (e.g., Kim et al., 2023; Lai et al., 2021; Moftakhari et al., 2017; Sadegh et al., 2017; Salvadori et al., 2014; Ward et al., 2018; Al Azad et al., 2018). These studies have been done at global (e.g., Ward et al., 2013), national (e.g., Wahl et al., 2015), regional (e.g., Gori et al., 2020b), and local scales (e.g., Jane et al., 2020).
Most of these studies quantify the compound flood events from a single population dataset without distinguishing what meteorological systems are causing them. Tropical cyclones (TCs; including post-tropical cyclones) and extratropical cyclones (ETCs) both can cause coastal hazard extremes and compound flooding. However, these storm types have different energy and moisture sources and cause different hazard intensities in terms of maximum wind speed, storm surge (e.g., Orton et al., 2016; Ayyad et al., 2022), and rainfall rates. ETCs normally have a larger spatial extent and have wind speeds far below the maxima exhibited by TCs (e.g., Dolan and Davis, 1992; Landsea and Franklin, 2013), and TCs can have more abundant moisture. Each storm type has often been shown to exhibit different univariate extreme value probability distributions (Lin et al., 2010; Villarini and Vecchi, 2013; Orton et al., 2016). Thus, each storm type may also have distinct compound flood hazard characteristics, pointing to the importance of not assessing all storm events together as one population (Orton et al., 2016). However, this separation by storm type has only rarely been attempted in past studies of compound flooding (e.g., Kim et al., 2023), especially in mid-latitude areas that are affected by both TCs and ETCs.
Also, many studies ignore the question of relative timing of the drivers within a storm, using the storm-maximum flood drivers rather than the simultaneous ones as the compound sampling pairs. It is unclear in these studies whether the flood drivers are compounding or sequentially occurring. Due to the more widespread and longer-duration historical archives of daily versus hourly rain data, most prior studies used daily data. This limits our understanding of relative timing of drivers and is not an appropriate timescale to understand pluvial flooding processes.
The urban environment has a much larger proportion of unvegetated impervious surfaces and additional vulnerability due to dense population and extensive infrastructure. There is little infiltration of water into soils, and stormwater systems are often insufficient to convey heavy rainfall, leading to flooding from the backing up of water (e.g., Villarini et al., 2009). Short-duration (hourly or sub-hourly) intensified rain values have been found to be the predominant drivers of pluvial flooding for New York City (NYC) (NYC, 2021) and other urban environments (Rosenzweig et al., 2018). Their timing relative to the peak of coastal water levels is a critical factor for compound flooding (Gori et al., 2020a; Xu et al., 2024). While pluvial flood research has often utilized hourly and sub-hourly data, much of the past research on compound flooding mentioned above has relied upon daily rainfall data.
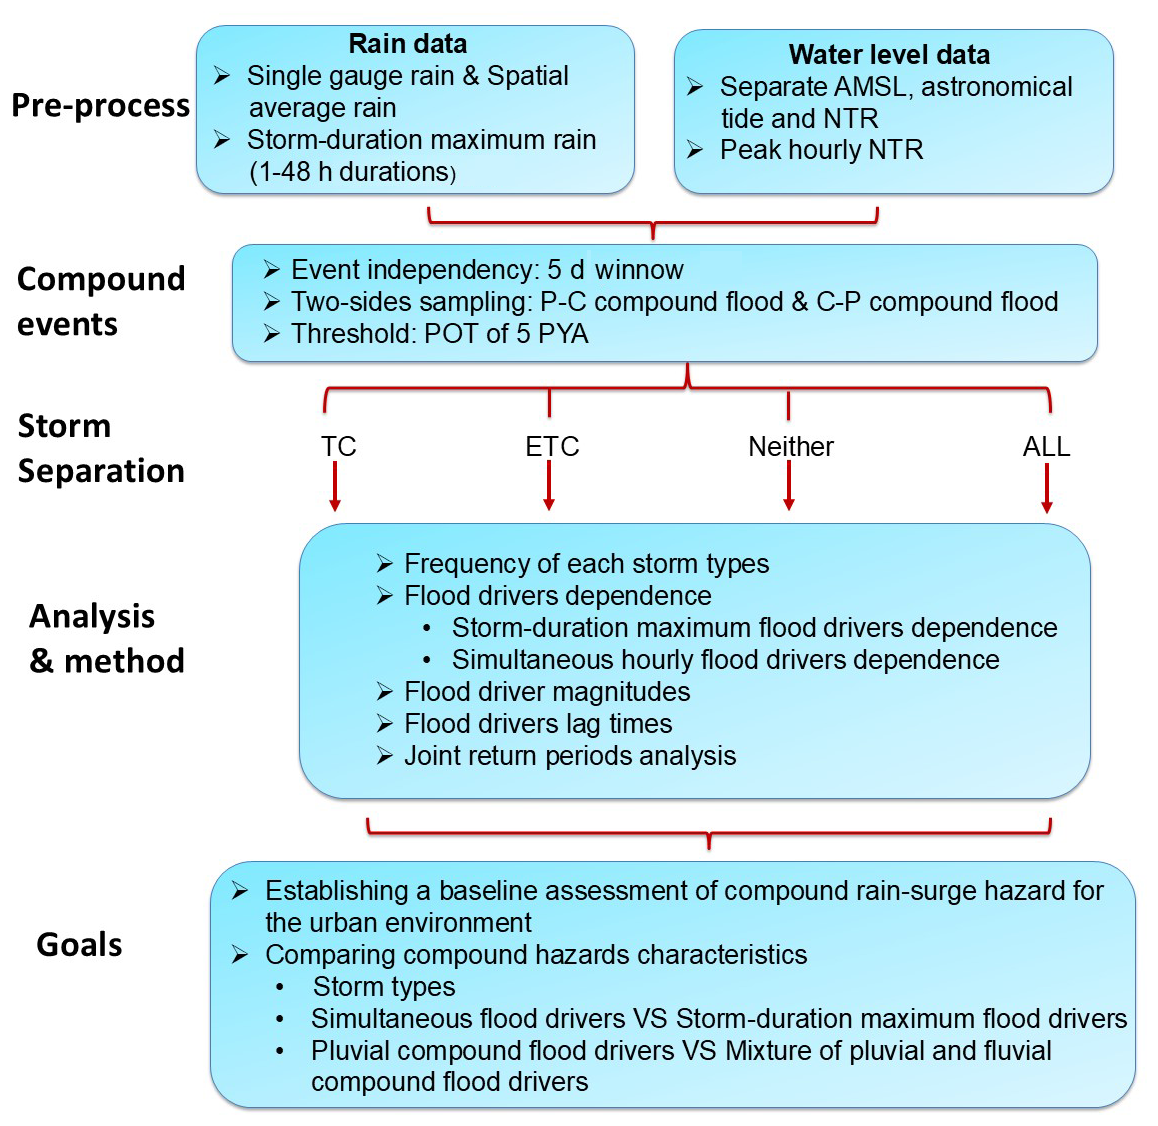
In this study, we address the above weaknesses and demonstrate a framework for assessing compound rain surge hazard for different storm types and applying hourly data, using NYC as a demonstration site. We evaluate the compound hazard characteristics from separate populations of TC and ETC events and events that are attributed to “Neither” type of storm and “All” events combined. Our framework is tailored to the compound flood risk of a typical urban pluvial flood environment where the peak flood depth occurs relatively rapidly after the peak rainfall (i.e., the time of concentration is below 1 h). We use higher-resolution spatiotemporal data to study compound flood driver characteristics that have not been sufficiently evaluated in prior national and global studies.
Below, Sect. 2 introduces the study area and data for this research; Sect. 3 gives a full picture of the methodology from pre-processing the data and identifying compound events to storm type association analysis methods for multiple aspects of compound characteristics. Section 4 shows the results under the framework described above. Section 5 discusses the key results, limitations, and future work for this research, and Sect. 6 summarizes our study's conclusions.
2.1 Study site
NYC is the most densely populated city in the United States, with more than 8 million residents, an area of 778 km2, and approximately 70 % impervious land coverage. It is vulnerable to pluvial and coastal flooding and likely compound flooding from both (e.g., Sarhadi et al., 2024; Georgas et al., 2014; Chen and Orton, 2023). It consists of several small, urbanized watersheds (ranging from 4.7–60 km2), where the time of concentration is short. The Bronx River is one exception, a small river with an elongated 39 km long, 105 km2 watershed and by far the largest inland stream passing through NYC. The city is located in a low-elevation region with a lengthy coastline subject to flooding from both the NY/NJ Bight to the south and Long Island Sound to the northeast. It has extensive coastal floodplains along its adjacent tidal water bodies (Fig. 1). A recent study found that many of the NYC neighborhoods with the most flood complaints are in these coastal areas (Agonafir et al., 2022); compound flooding could be an important contributing factor. Another study used data from 311 flood report phone calls and found relationships between flood reports and other spatial datasets (Smith and Rodriguez, 2017).
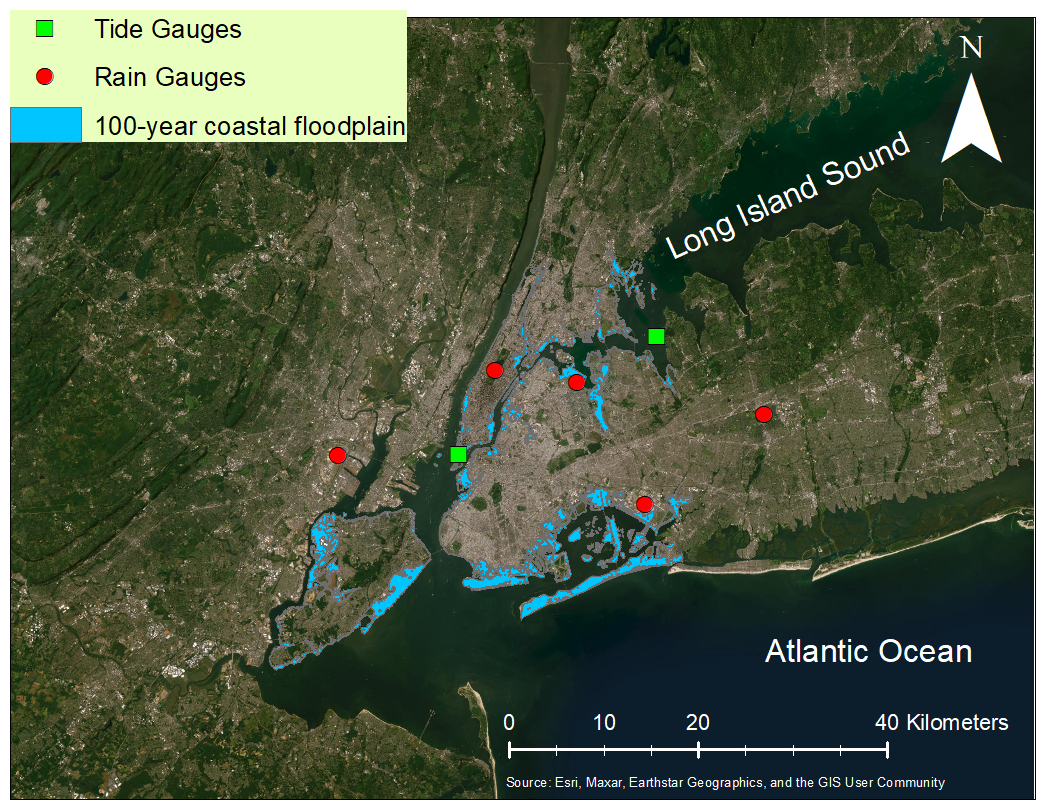
Figure 1Map of the locations of rain gauges (red) and tide gauges (green) around NYC. The low-elevation 100-year coastal floodplain (FEMA, 2014) is shaded blue, where pluvial and coastal compound floods are more likely to occur during storms than more elevated areas (see Sect. 3.3). Listed from left to right, the rain gauges are Newark Liberty Airport (EWR), Central Park, LaGuardia Airport (LGA), John F. Kennedy Airport (JFK), and Mineola, and the tide gauges are The Battery and Kings Point.
Historically, severe coastal floods (e.g., Hurricane Sandy in 2012, a Nor'easter in December 1992), pluvial floods (e.g., Hurricane Ida in 2021), and compound floods (Hurricane Irene in 2012; Orton et al., 2012) have struck NYC and can be associated with TCs, ETCs, and convective thunderstorms. Four of NYC's top five storm surges from 1788–present were TCs (or post-tropical cyclones), three of the top five hourly rain events from 1948–present were TCs (KNYC: Central Park), and four of the top five daily rain events from 1869–present were TCs (KNYC: Central Park).
2.2 Historical observations
In the interest of using a long-term database to study compound flooding, rain and coastal water level data were assembled with the longest possible hourly data resolution. Given that there are hourly tide gauge data back to the 1800s (Talke et al., 2014), the limitation on data availability came from hourly rain gauge data, which were continuously available for several NYC region gauges from 1948 to present.
2.2.1 Tide gauges
Hourly water level data are obtained from NOAA tide gauges in UTC time zone and the North American Vertical Datum of 1988 (NAVD88), including gauges (blue points in Fig. 1) at The Battery (8 518 750), Kings Point (8 516 945, from 1999 to 2022), and Willets Point (8 516 990, from 1948 to 1998). The gauge in The Battery has near-complete long-term temporal coverage during the period of hourly rain data from 1948 to 2022, spanning approximately 75 years. The locations of Kings Point and Willets Point are only 3 km apart along the East River and have similar storm surge (O'Donnell and O'Donnell, 2012). We merge their data to represent storm surge conditions for northern Queens and the southern Bronx, simply referring to the joint dataset as Kings Point.
2.2.2 Rain gauges
Observed hourly rainfall data at and around NYC (red points in Fig. 1) were obtained from the NOAA National Climatic Data Center (NCDC). The hourly rainfall data can be used to capture the short-duration (hours) rain intensity, which is critical to the pluvial flood impacts for an urban environment like NYC. Also, the hourly temporal resolution can be simultaneously matched with the hourly data around its nearby tide gauge to study simultaneous or lagged occurrences. The rain gauges we selected are all within 20 km of the coast and at elevations below 100 m and have near-complete long-term temporal coverage from 1948 to 2022. Each of them is within 30 km of the tide gauge at The Battery or Kings Point. Overall, these gauges have good spatial coverage around the NYC area.
2.2.3 TC and ETC tracks
Datasets of 6-hourly storm location and time (cyclone tracks) are utilized to associate the rainfall/coastal flood drivers with specific storm types (see Sect. 3.4). The TC tracks dataset is from the National Hurricane Center (HURDAT2; Landsea and Franklin, 2013). The ETC tracks are obtained by running an automated cyclone-tracking algorithm on the ERA5 reanalysis. The tracking algorithm used is the MAP Climatology of Mid-latitude Storminess (MCMS) documented in Bauer et al. (2016). MCMS identifies closed low-pressure locations in the sea level pressure field and then links the low centers through time. The algorithm was developed explicitly for tracking ETCs; however, MCMS sometimes identifies TCs. Before using MCMS, the TC tracks are removed by identifying matching tracks in HURDAT2 and the MCMS output.
3.1 Extreme rainfall
3.1.1 Rain gauges and metro-scale rain
We compute the spatial average rain within 30 km of each tide gauge separately (The Battery and Kings Point in Fig. 1) to represent the metro-scale rainfall, while each single rain gauge represents a point measurement of rainfall. Calculating a spatial average over rain gauges within a 30 km radius helps smooth out the localized variability in rainfall, giving a perspective more reflecting an integrated hourly effect of rain on flooding. Each individual rain gauge captures extreme rainfall intensity of local convective rain events and the spatial variability during localized convective and synoptic events (TCs or ETCs). For example, TC Ida 2022 caused extreme rainfall at Central Park and LaGuardia Airport (LGA) but much less rainfall at John F. Kennedy Airport (JFK).
3.1.2 Top-ranked rain intensity of different durations
We temporally accumulate the continuous hourly rainfall data to different durations (from 1 to 48 h) on both single rain gauges and metro-scale-averaged rainfall and isolate the extreme values of the accumulated rainfall. To guarantee event independence, we eliminate peaks that occur within 5 d windows. This 5 d window was chosen to account for the typical maximum duration of cyclonic storm events.
3.2 Top-ranked storm surge or non-tidal residual
Storm surge was estimated as the non-tidal residual (NTR) and excludes seasonal, interannual, and secular sea level changes through the following process. We compute and remove the annual mean sea level (AMSL) from the water level data of each tide gauge. Then, we perform harmonic analysis (Schureman, 1994; Lin et al., 2015) on the resulting data year by year to obtain the tidal signals across the time series. 37 harmonic constituents are considered, including the solar annual constituent and the solar semi-annual constituent. Then, we compute the non-tidal residual (NTR) by removing the AMSL and tide from the total water levels, thus removing sea level rise (SLR) from the NTR data. The NTR is mainly composed of storm surge (driven by wind and atmospheric pressure) but also includes smaller contributions from river runoff and rainfall. It excludes the SLR and interannual and seasonal variabilities. Prior hydrodynamic model experiments for Hurricane Irene (2011) showed that the effect of local rainfall on harbor water levels was only 2 cm at the time of peak water levels (Orton et al., 2012). Similarly to the rain data processing in Sect. 3.1.2, we capture the peak 1 h NTR and ensure event independence with a 5 d window.
3.3 Compound events
Storm surge and rainfall have several important differences that motivate different treatment in the sampling of compound events. Storm surge can be positive and negative, whereas the minimum rainfall is zero. As a result, we use surge maxima to avoid averaging negative and positive values within a storm's passage. Our statistical analyses are conditioned on the primary flood driver being top-ranked, while the secondary flood driver can be of any value. Thus, we study events conditioned on top-ranked rain (peak 1 to 48 h accumulations), which we refer to as pluvial–coastal (P-C) events, and top-ranked NTR (peak 1 h intensity), which we refer to as coastal–pluvial (C-P) events. The primary flood drivers are sampled by a peaks-over-threshold (POT) approach based on a per-year average (PYA) frequency of five events. This two-sided conditional sampling approach with a POT of certain percentile (e.g., 0.95 or 0.99) is typically used in many studies to identify compound extreme events from two conditioned aspects (Jane et al., 2020; Wahl et al., 2015; Ward et al., 2018).
The relative timing of the compound flood drivers is critical to their compound effects, especially for an urban environment. Here, we investigate the characteristics of the simultaneous hourly flood drivers (Sect. 4.2.2, 4.3, and 4.5). For comparison to common practice (e.g., Wahl et al., 2015; Lai et al., 2021, 2023), we also evaluate the characteristics of storm-duration (non-simultaneous) maximum flood drivers (Sect. 4.2.1), defined as having the secondary flood driver occur within ±1.5 d of the peak of the primary flood driver. We also study the lag times between these storm-duration maximum flood drivers. Considering the joint occurrence of rain and surge, when the peak rain intensity occurs several hours away from the peak storm surge, these two may result in more of a sequential pair of flood events with little exacerbation from compounding. However, if they co-occur at or near the same hour, the resulting compound flood magnitude may be substantially increased (e.g., Gori et al., 2022). For pluvial–coastal compound flood events, the compounding typically arises due to the drainage of the urban stormwater system being blocked by the simultaneous coastal high water levels (e.g., Gold et al., 2022). For coastal–pluvial compound flooding, a coastal flood can be aggravated by simultaneous rainfall (e.g., Orton et al., 2012).
3.4 Storm type association
Cyclone tracks (Sect. 2.2.3) are used to associate the top-ranked rainfall and NTR events with specific TC and ETC events or to determine if they are a “Neither” case that does not match any cyclone track. If the top-ranked rain/NTR events occur within 500 km of the center of a TC or within 1000 km of the center of an ETC, the event is considered to be associated with TCs or ETCs. Storms in the HURDAT dataset were considered TCs, given that they are nearly always either TCs or post-tropical cyclones as they pass NYC. TC events include those that may have become post-tropical because these storms often continue to have unusually high winds and moisture. We additionally evaluate all the events together (“All”; see the diagram in Fig. 2).
Similar distances are used to judge the storm association in other studies (e.g., Kim et al., 2023; Lai et al., 2021). In the Supplement, we test the sensitivity of additional distances for storm association.
3.5 Dependence analysis of compound flood drivers
Kendall's rank correlation coefficient (Kendall, 1938) between flood drivers is computed for both the “storm maximum” and the “simultaneous” cases for each storm type to assess their dependency. In addition, the non-parametric upper tail dependence coefficients (UTDCs) (Schmidt and Stadtmüller, 2006; Wahl et al., 2015) are used to check the dependence of values in the upper tail region as a consistency check with their overall rank correlation. The UTDC represents the probability of a second driver being in the upper tail region, conditional on the primary driver being in the upper tail.
3.6 Lag time of storm-duration maximum flood drivers
The lag time between the maximum flood drivers reflects another aspect of compound flood risk (e.g., Jane et al., 2020). We identify the timing of the maximum flood drivers of each compound event and define the “lag time” as Tpeak surge−Tpeak rain, so a positive lag means the rain peak occurs before the NTR peak. Here, our main purpose is to compare the lag time characteristics of compound events associated with different storm types and to contrast the difference between The Battery and Kings Point. We also use the Kendall's rank correlation coefficient to evaluate the dependence between the primary and secondary flood drivers and the absolute lag time.
3.7 Magnitude of compound flood drivers
Prior research often focused only on rank correlations and copula modeling of joint probabilities for assessing compounding. While a high rank correlation reflects tight coupling between drivers, it is not a prerequisite for extreme compound hazard. If the secondary driver is often extreme but does not have a high rank correlation with the primary driver, there can still occasionally be co-occurrence of both drivers' extremes.
To capture the high-end intensity of the secondary flood drivers and provide an alternative method for understanding the potential magnitude of compounding that comes from different storm types, we compute the 50th and 90th percentiles (empirical quantiles) of the rain and NTR for the hours around the time of peak rain (for P-C compound events) and for the hours around the time of peak NTR (for C-P compound events). This analysis compares the “simultaneous” compound hourly intensity at a range of times around the peak (±10 h), for a consistency check with lag time characteristics analyzed in Sect. 3.6. This approach is similar to looking at fitted marginal distributions but is an empirical approach, without any scaling by annual frequency. It also has an added benefit of being more straightforward for risk communication than rank correlations and copula models.
3.8 Magnitude of compound flood drivers
The joint probabilities and return periods of rainfall and NTR are resolved by using a recently developed copula software for bivariate analysis of compound hazards by Sadegh et al. (2018), known as the Multi-hazard Scenario Analysis Toolbox (MhAST). This toolbox is utilized to assess 17 marginal distributions (e.g., GPD) with quantile–quantile plots and chi-square tests and identify the optimal one based on the Bayesian information criterion (BIC) (Sadegh et al., 2017). Similarly, the bivariate dependency structure is analyzed by fitting 25 copula models (e.g., Nelsen, 2003), and these are assessed with multiple goodness-of-fit tests, including the Cramér–von Mises test (e.g., Genest et al., 2009), the BIC, the Akaike information criterion (AIC), the maximum likelihood, and the Nash–Sutcliffe efficiency (NSE). (Sadegh et al., 2017). The “AND” hazard scenario is chosen to consider compound drivers from the joint extreme values of both drivers (Salvadori and De Michele, 2004; Ward et al., 2018; Moftakhari et al., 2019; Couasnon et al., 2020).
For intercomparing probabilities, we select one copula model that is suitable across all event types (TC, ETC, All, and Neither). Instead of pursuing the copula that leads to the best goodness-of-fit metric for each event type, we use the same copula for all to avoid differences arising due to differing copula models. For example, we avoid intercomparing probability (or return period) results where one event type has been fitted with an extreme value copula and another has been fitted with a non-extreme value copula.
The p values from the Cramér–von Mises test are used to eliminate the inadmissible copulas (p<0.05) (Genest et al., 2009; Mazdiyasni et al., 2019; Lucey and Gallien, 2022). BIC is commonly used in previous studies among the metrics for goodness-of-fit, because it considers both sample size and the complexity of the model to avoid overfitting (e.g., Bevacqua et al., 2019; Tootoonchi et al., 2022). Hence, we use BIC as the primary judgment for suitability checks among all the plausible copula models. The Plackett Copula is the most consistently highly ranked copula based on BIC across all event types. The Plackett Copula is flexible in modeling various types of dependence structures and can exhibit tail dependence as well (Nelsen, 2006); it was found here to be suitable across all cases (Table S1 in the Supplement).
Results below include the relative frequencies of top-ranked pluvial and coastal events by storm type (Sect. 4.1), the measures of dependence of the rain and NTR (Sect. 4.2), and the magnitude of the marginals of the rain and NTR (Sect. 4.3). The lag times between the rain and NTR flood drivers are evaluated in Sect. 4.4. The first three aspects above are dominant factors that influence the joint probability analysis results in Sect. 4.5.
4.1 Frequency by event types
Figure 3 gives a picture of the average annual frequency for the top-ranked coastal and pluvial events at The Battery associated with different storm types above a total of five PYA thresholds from all events (i.e., both NTR and rain exceed their respective PYA thresholds). At Kings Point, the frequencies have similar patterns. Events associated with TCs contribute a small proportion of all top-ranked P-C compound events (0.20–0.40 PYA) and C-P compound events (0.35 PYA). Events associated with ETCs are the major proportion of the top-ranked C-P compound events, while neither TCs nor ETCs drive the majority for the top-ranked P-C compound events. For the P-C compound events conditioned on rain of short duration (1–6 h), a higher proportion is associated with Neither (e.g., summer convective rain storms) than for those conditioned on longer durations. These convective events normally do not last long and typically have a short duration of intense rain.
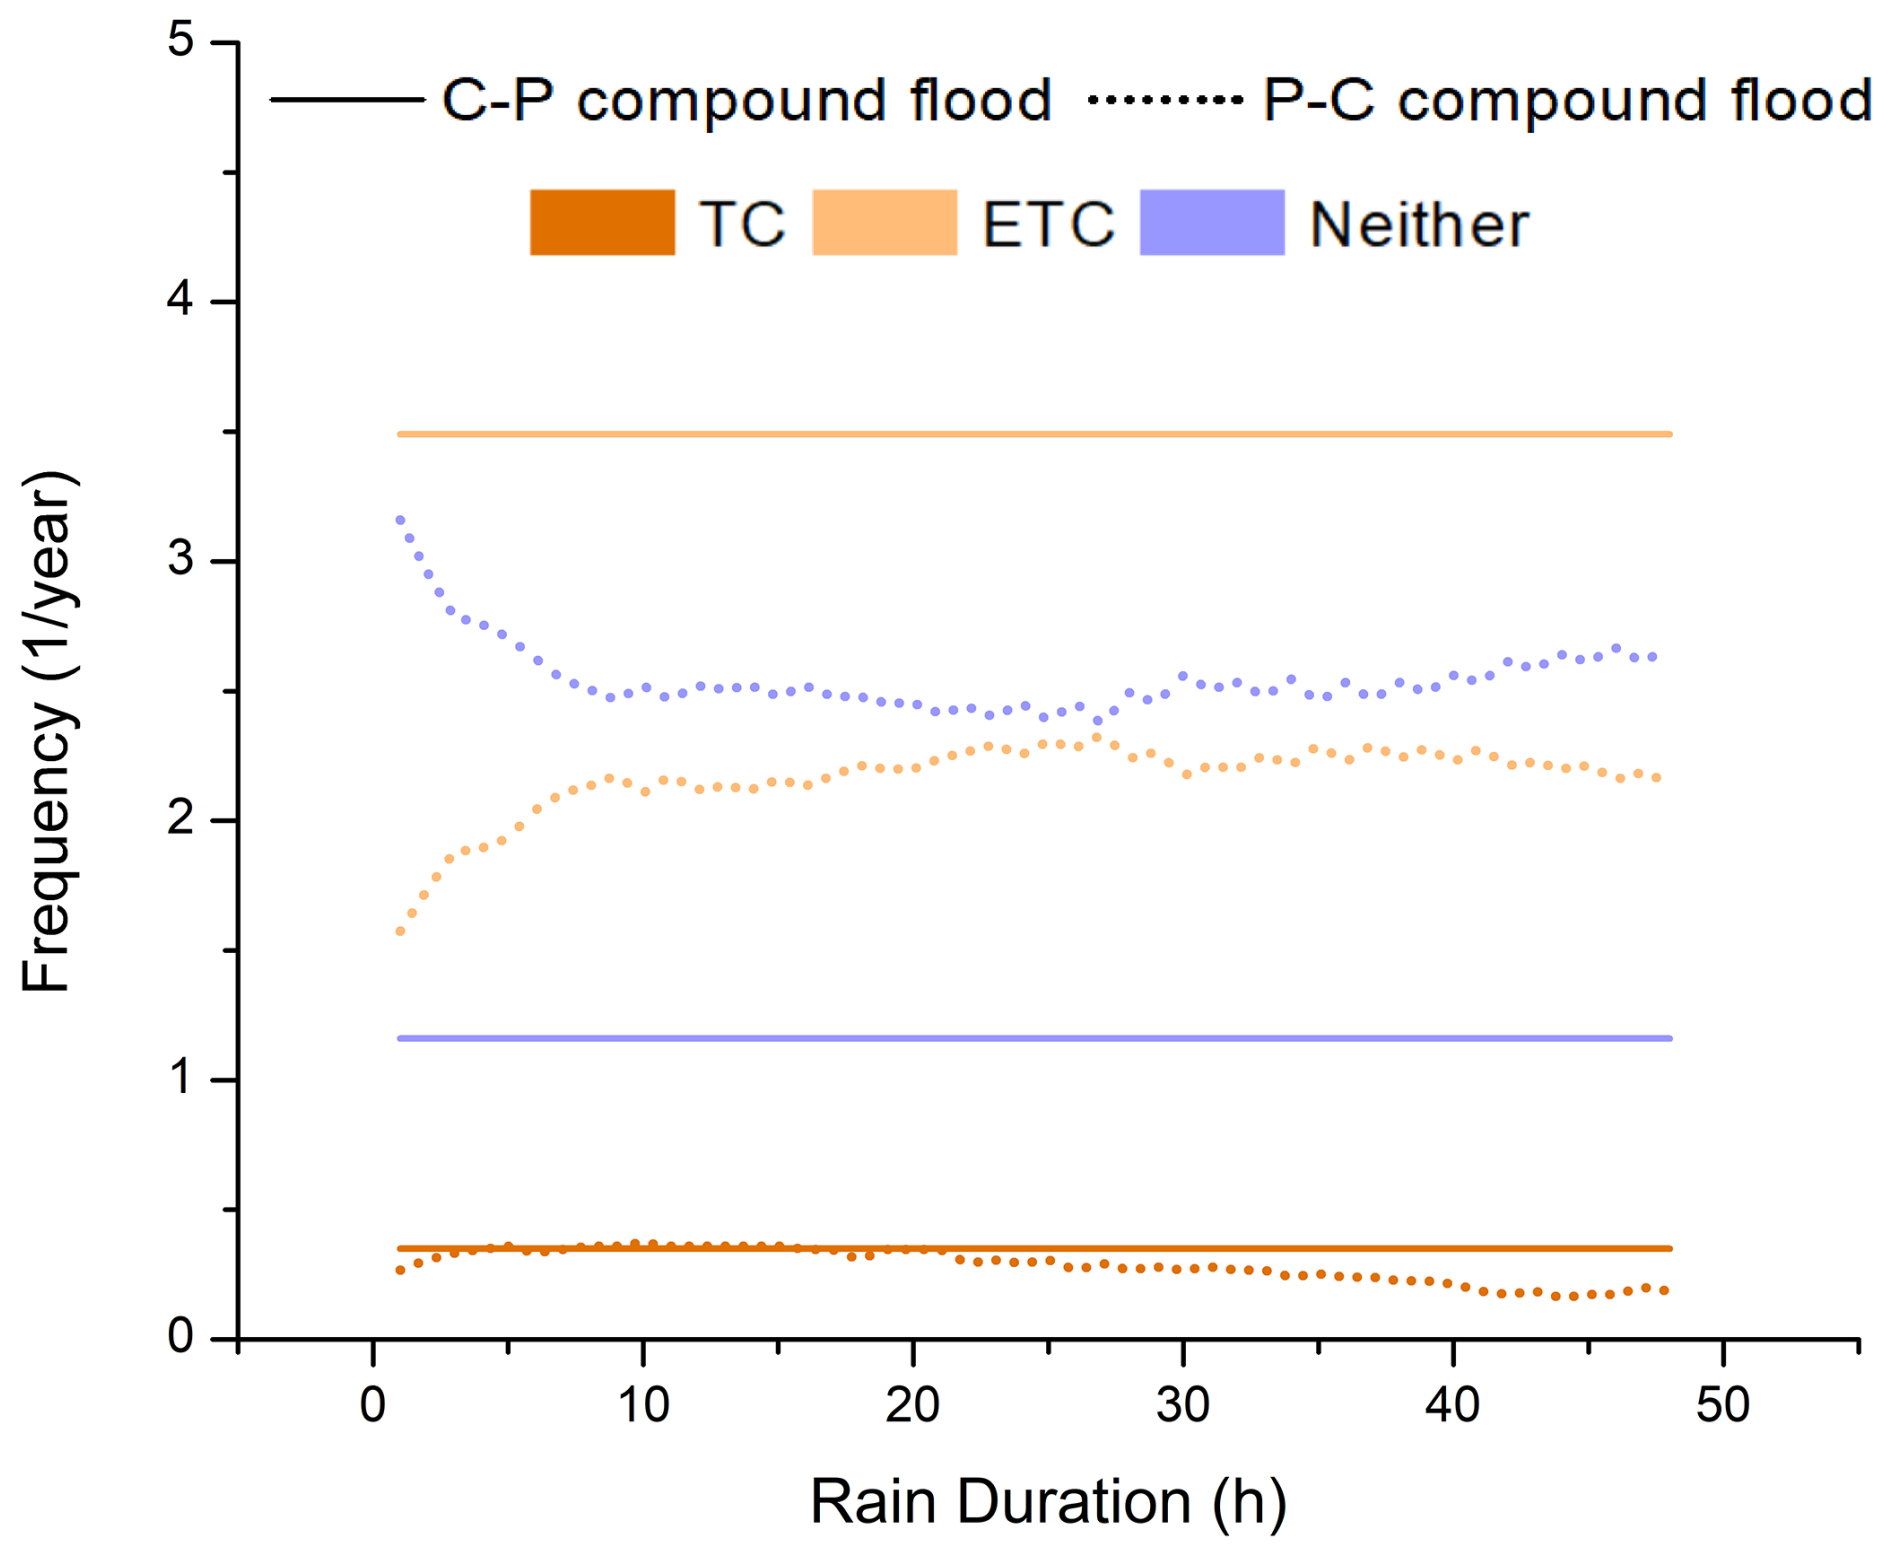
Figure 3Compound events at The Battery associated with different storm types and primary drivers. The average annual frequencies of each storm type within the top-ranked total rainfall events across different durations are represented by dotted lines (P-C compound events), and peak NTR events are represented by solid lines (C-P compound events). The latter are always flat because the ranked list of NTR (a peak) is the same regardless of rain duration, while the former vary because each duration has a different ranked list.
4.2 Dependence
4.2.1 Top-ranked rain intensity of different durations
Using the common method of assessing correlations of storm-duration maximum flood drivers, we find for TCs a large difference between correlations of P-C and C-P events. TC-induced P-C and C-P compound events at NYC have quite different rain–NTR correlations of 0.3–0.5 and 0.0–0.1, respectively (Fig. S1 in the Supplement). On the other hand, the correlations for All, Neither, and ETCs are ∼0.1 for both P-C compound events and C-P compound events. Their correlation is not sensitive to the durations of maximum rain accumulations, except for the short durations (1–5 h), which have ∼0.0 correlation for P-C compound events. Among the short-duration high-rain events, a higher proportion of them are in the Neither category, presumably induced by convective events (Fig. 3). These events have a lower chance of co-occurring with a coastal flood. The P-C correlations are relatively sensitive to the short rain durations (1–5 h) associated with both TCs and ETCs (Fig. S1a). Short, extreme rain events tend to have high intermittency, leading to high variation in the correlation from one duration to the next.
The storm-duration maximum compound events could have maximum flood drivers sequentially or simultaneously, depending on the lag time (explored in Sect. 4.4) of the compound drivers. So, their compound effects on a pluvial environment like NYC has a large uncertainty. In Sect. 4.2.2, we investigate the dependence of simultaneous compound flood drivers.
4.2.2 Simultaneous hourly flood drivers
Figure 4 shows that the P-C simultaneous compound flood drivers associated with TCs have much higher overall correlation than the other storm types. This pattern is consistent across space in terms of overall dependency (Fig. 4) and upper tail dependence (Fig. S2 in the Supplement). This implies a higher joint risk for TCs compared with other storms in terms of dependence.
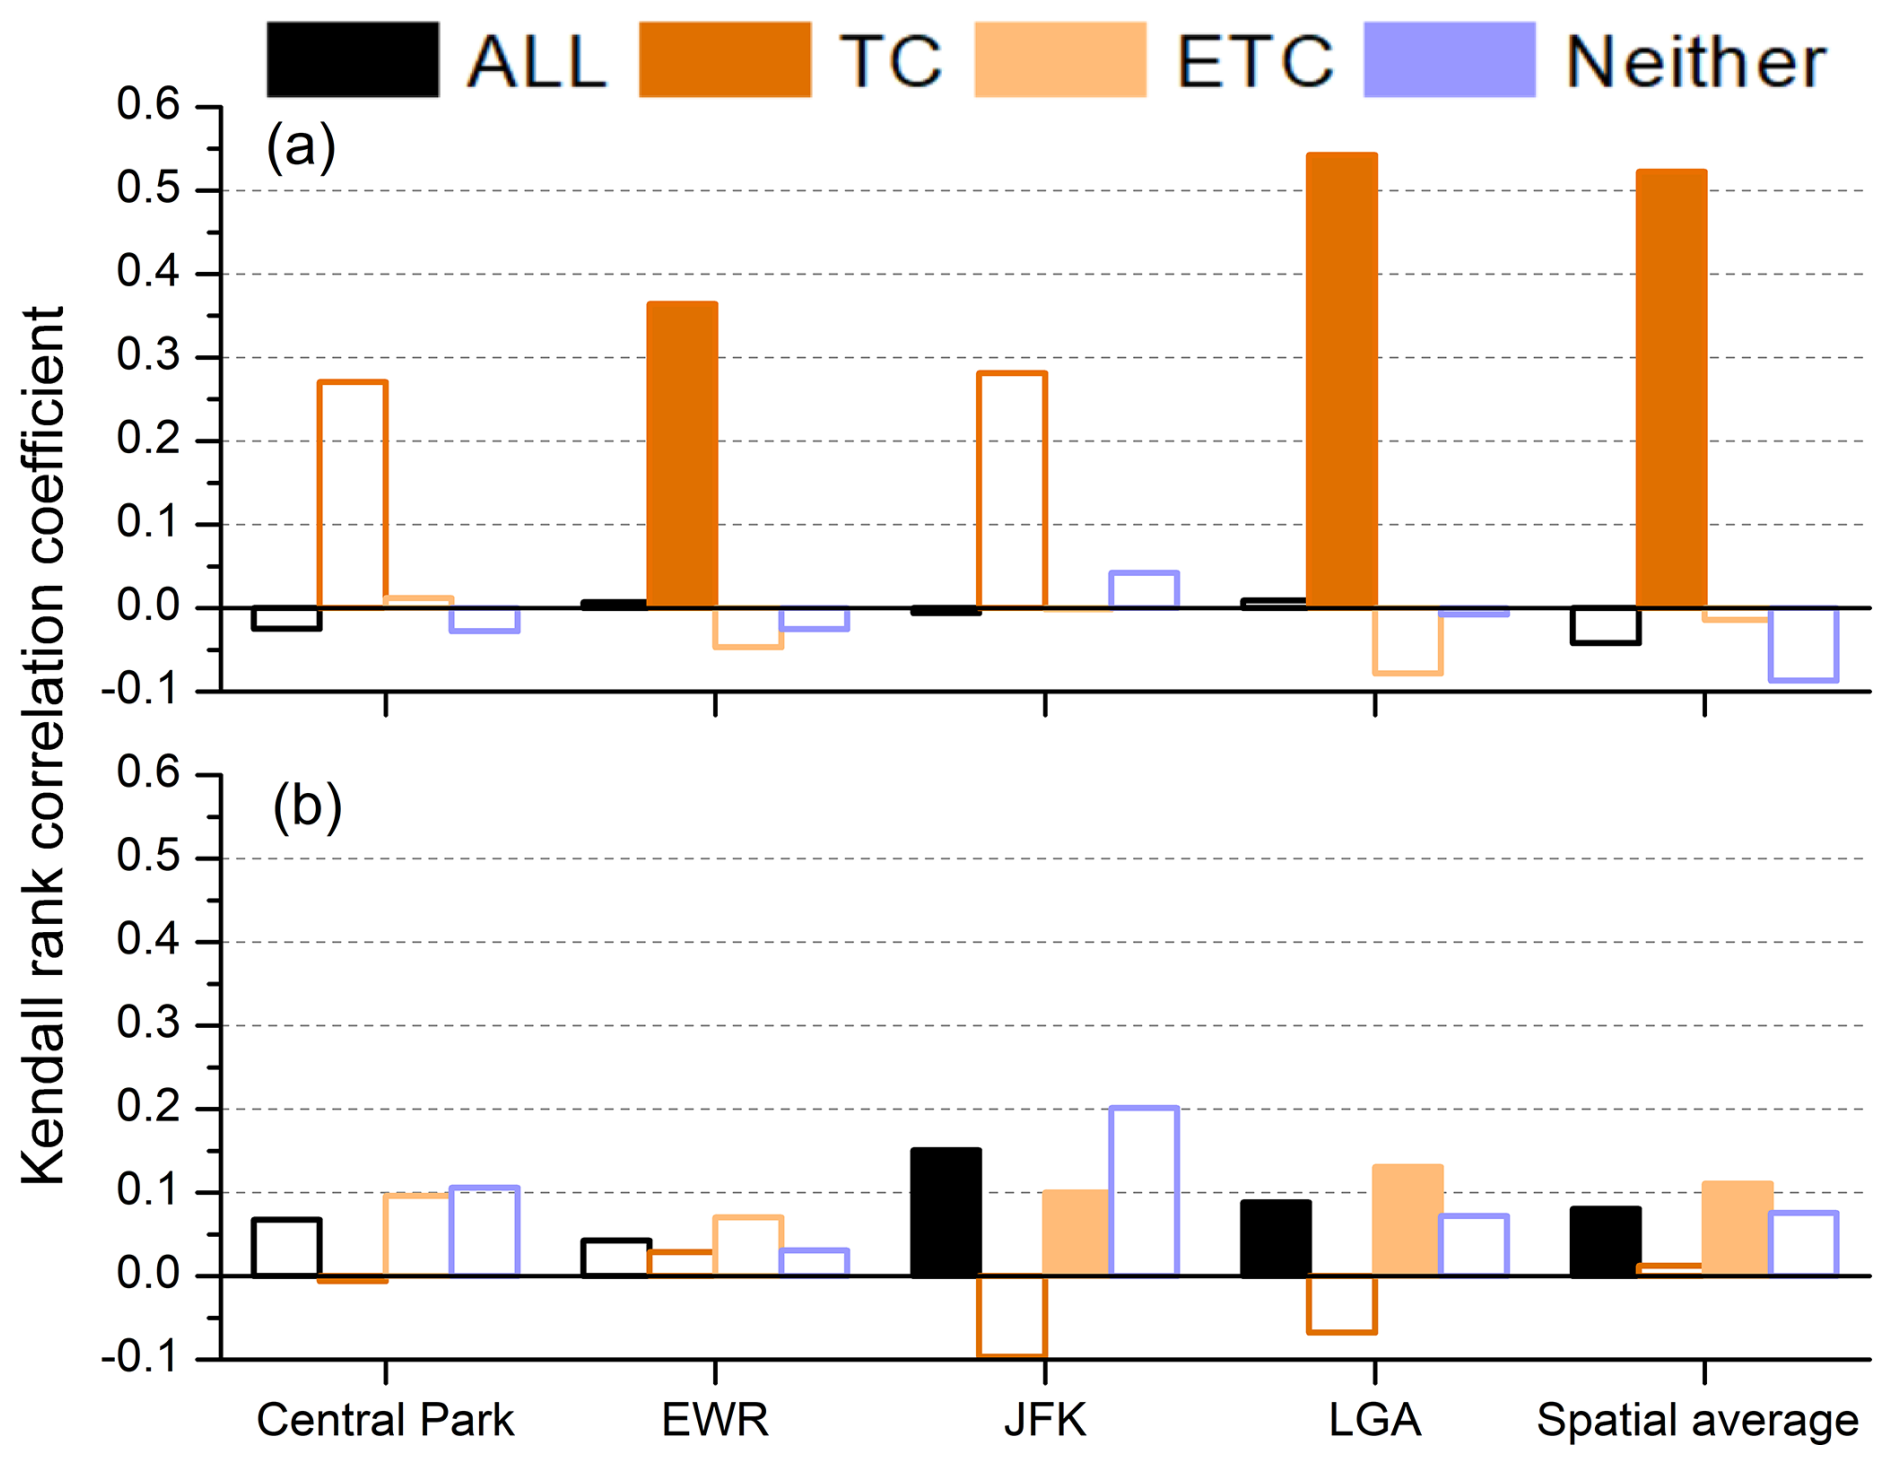
Figure 4The Kendall rank correlation coefficients for (a) the P-C simultaneous compound flood drivers and (b) the C-P simultaneous compound flood drivers associated with different storm types for each single gauge and the spatial average around The Battery. The filled color bars represent statistically significant cases (p<0.05).
However, for TCs, the C-P simultaneous correlation is near zero at both The Battery and Kings Point. Even if we only look at the upper tail region, the C-P compound events are still less correlated than the P-C compound events driven by TCs (comparing panels a and b in Fig. S2). The upper tail dependence coefficients associated with TCs are close to or slightly higher than other storm types for the majority of locations (e.g., EWR, LGA, or the spatial average in Fig. S2).
For certain stations (e.g., JFK, LGA in Fig. 4), the C-P simultaneous compound hourly flood drivers associated with ETCs or All have moderate dependency, but they are not evident in the upper tail region (Fig. S2). At LGA and EWR, their upper tail correlations are less than those associated with TCs. The rain–NTR dependency could be significantly different depending on storm type and the choice of primary flood driver. Location and rainfall accumulation duration also cause minor changes in correlation. The phenomena are not explored in detail in prior studies in this area. More comparisons are discussed in Sect. 5.2.
4.3 Magnitudes of flood drivers
The hourly magnitudes of the primary flood drivers are similar for different storm types, but the magnitude of secondary flood drivers associated with TCs stands out compared with other storm types. In Fig. 5, for the P-C compound event, the empirical percentiles (50th and 90th) of top-ranked rainfall are slightly higher for TCs than the other storm types, while the empirical percentiles (50th and 90th) of the associated NTR are much higher for TCs than the other types (panels a6 vs. a5, a7, a8). Similarly, for the C-P compound event, the empirical 90th percentiles of top-ranked NTR are much higher for TCs than the other types, but the 50th percentiles are similar for all cyclone types. The empirical percentiles (50th and 90th) of the associated compound rainfall are much higher for TCs than the other types (panels b6 vs. b7 and b8). This higher magnitude of the secondary flood driver associated with TCs is not only seen during the simultaneous peak rain or peak NTR hour (at “0” h in Fig. 5), but also during the few hours around it.
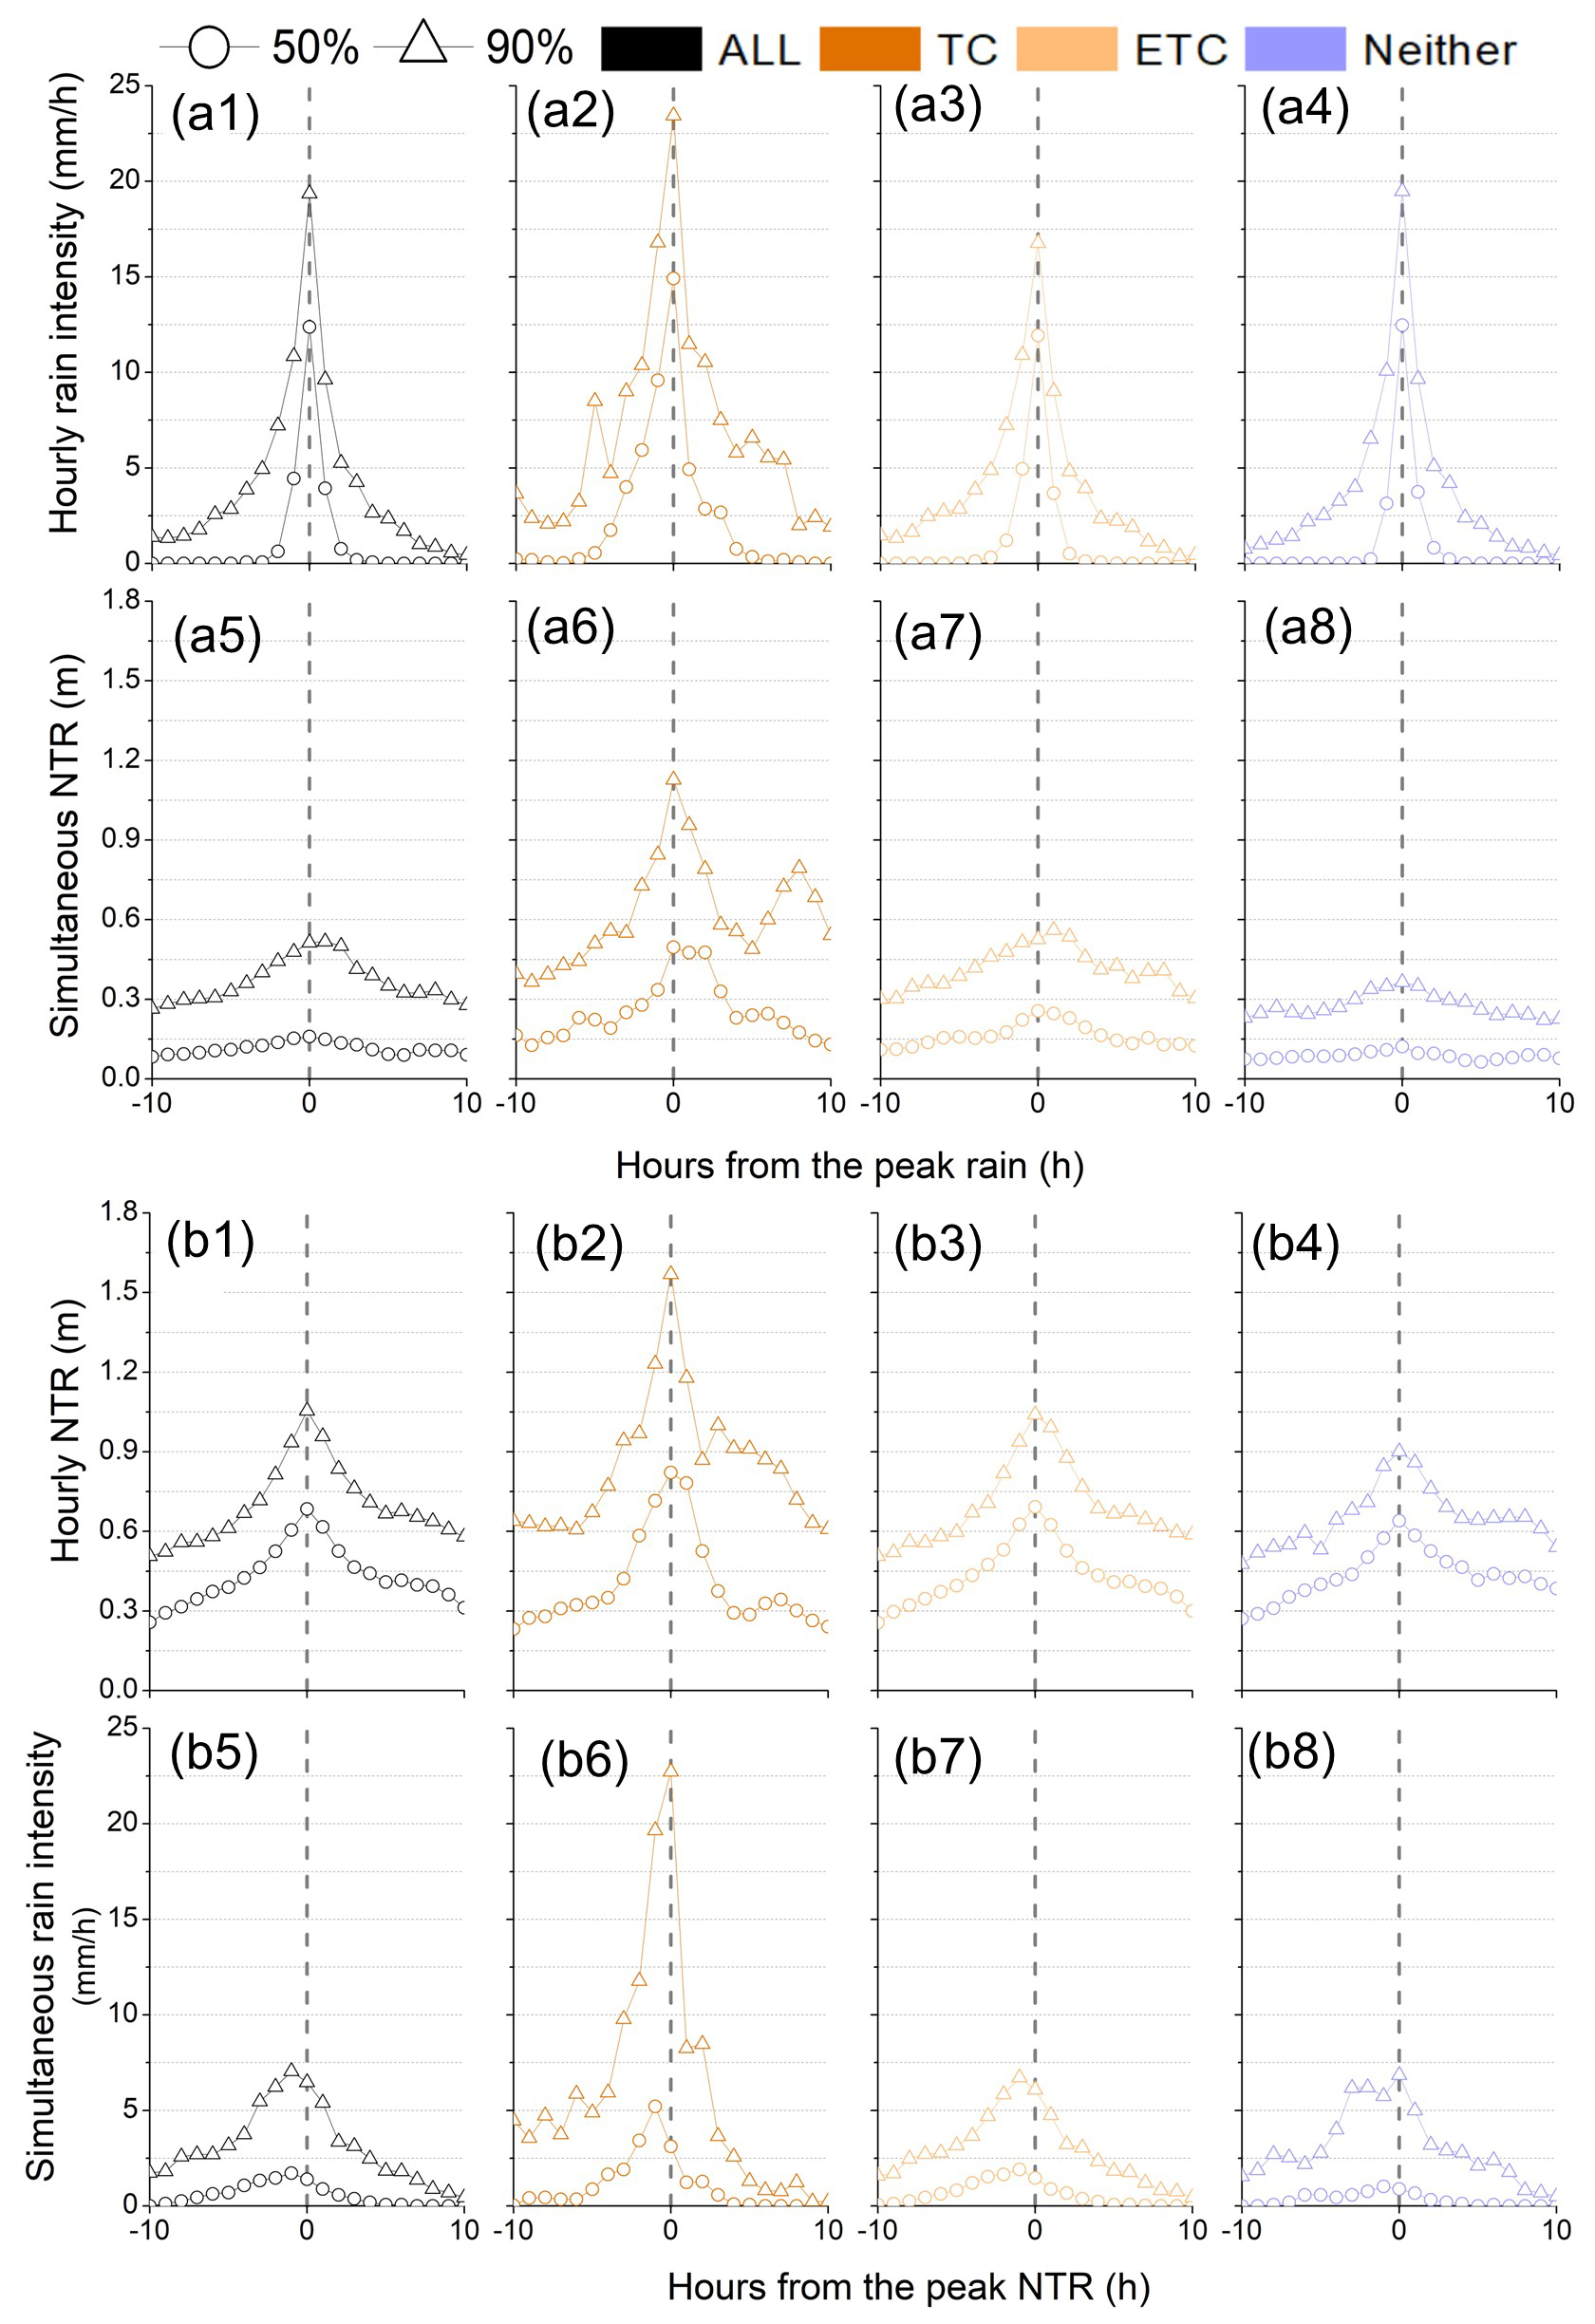
Figure 5The magnitude of the P-C compound flood drivers (top, a1–a8) and the C-P compound flood drivers (bottom, b1–b8) by different storm types for The Battery. The top row (a1–a4) and third row (b1–b4) show the primary flood driver magnitudes (50th and 90th percentile), and the second row (a5–a8) and bottom row (b5–b8) show the secondary flood driver magnitudes. The x axis ranges from −10 to 10 h, indicating time relative to the peak hour of rain (a1–a8) or NTR (b1–b8).
The Battery and Kings Point have similar magnitudes of coupled flood drivers for different storm types. The pattern for the magnitude of secondary flood drivers described above is also true for Kings Point (Fig. S3 in the Supplement). However, the magnitude of the secondary flood drivers for The Battery (panels a5–a8 and b5–b8 in Fig. 5) is relatively symmetrically distributed temporally around the peak hourly rain (P-C compound events) or the peak hourly NTR (C-P compound events), while the temporal distribution at Kings Point is asymmetrical (panels a5–a8 and b5–b8 in Fig. S3). Regardless of storm type, the hourly peak magnitudes of the coupled flood drivers at The Battery are almost simultaneous, while they lag by a few hours at Kings Point. Even though there is still a simultaneous compound effect at Kings Point, the magnitude of the simultaneous secondary flood drivers tends to be lower than that of The Battery.
4.4 Lag time of flood drivers
Figure 6 shows a large proportion of the historical compound events have their maximum coastal NTR after their maximum hourly rainfall, no matter what storm type, primary flood driver, or location (Battery or Kings Point). This could arise if rainfall precedes a storm or if the propagation of storm surge into the harbor from offshore is slower than the storm speed (e.g., Orton et al., 2012).
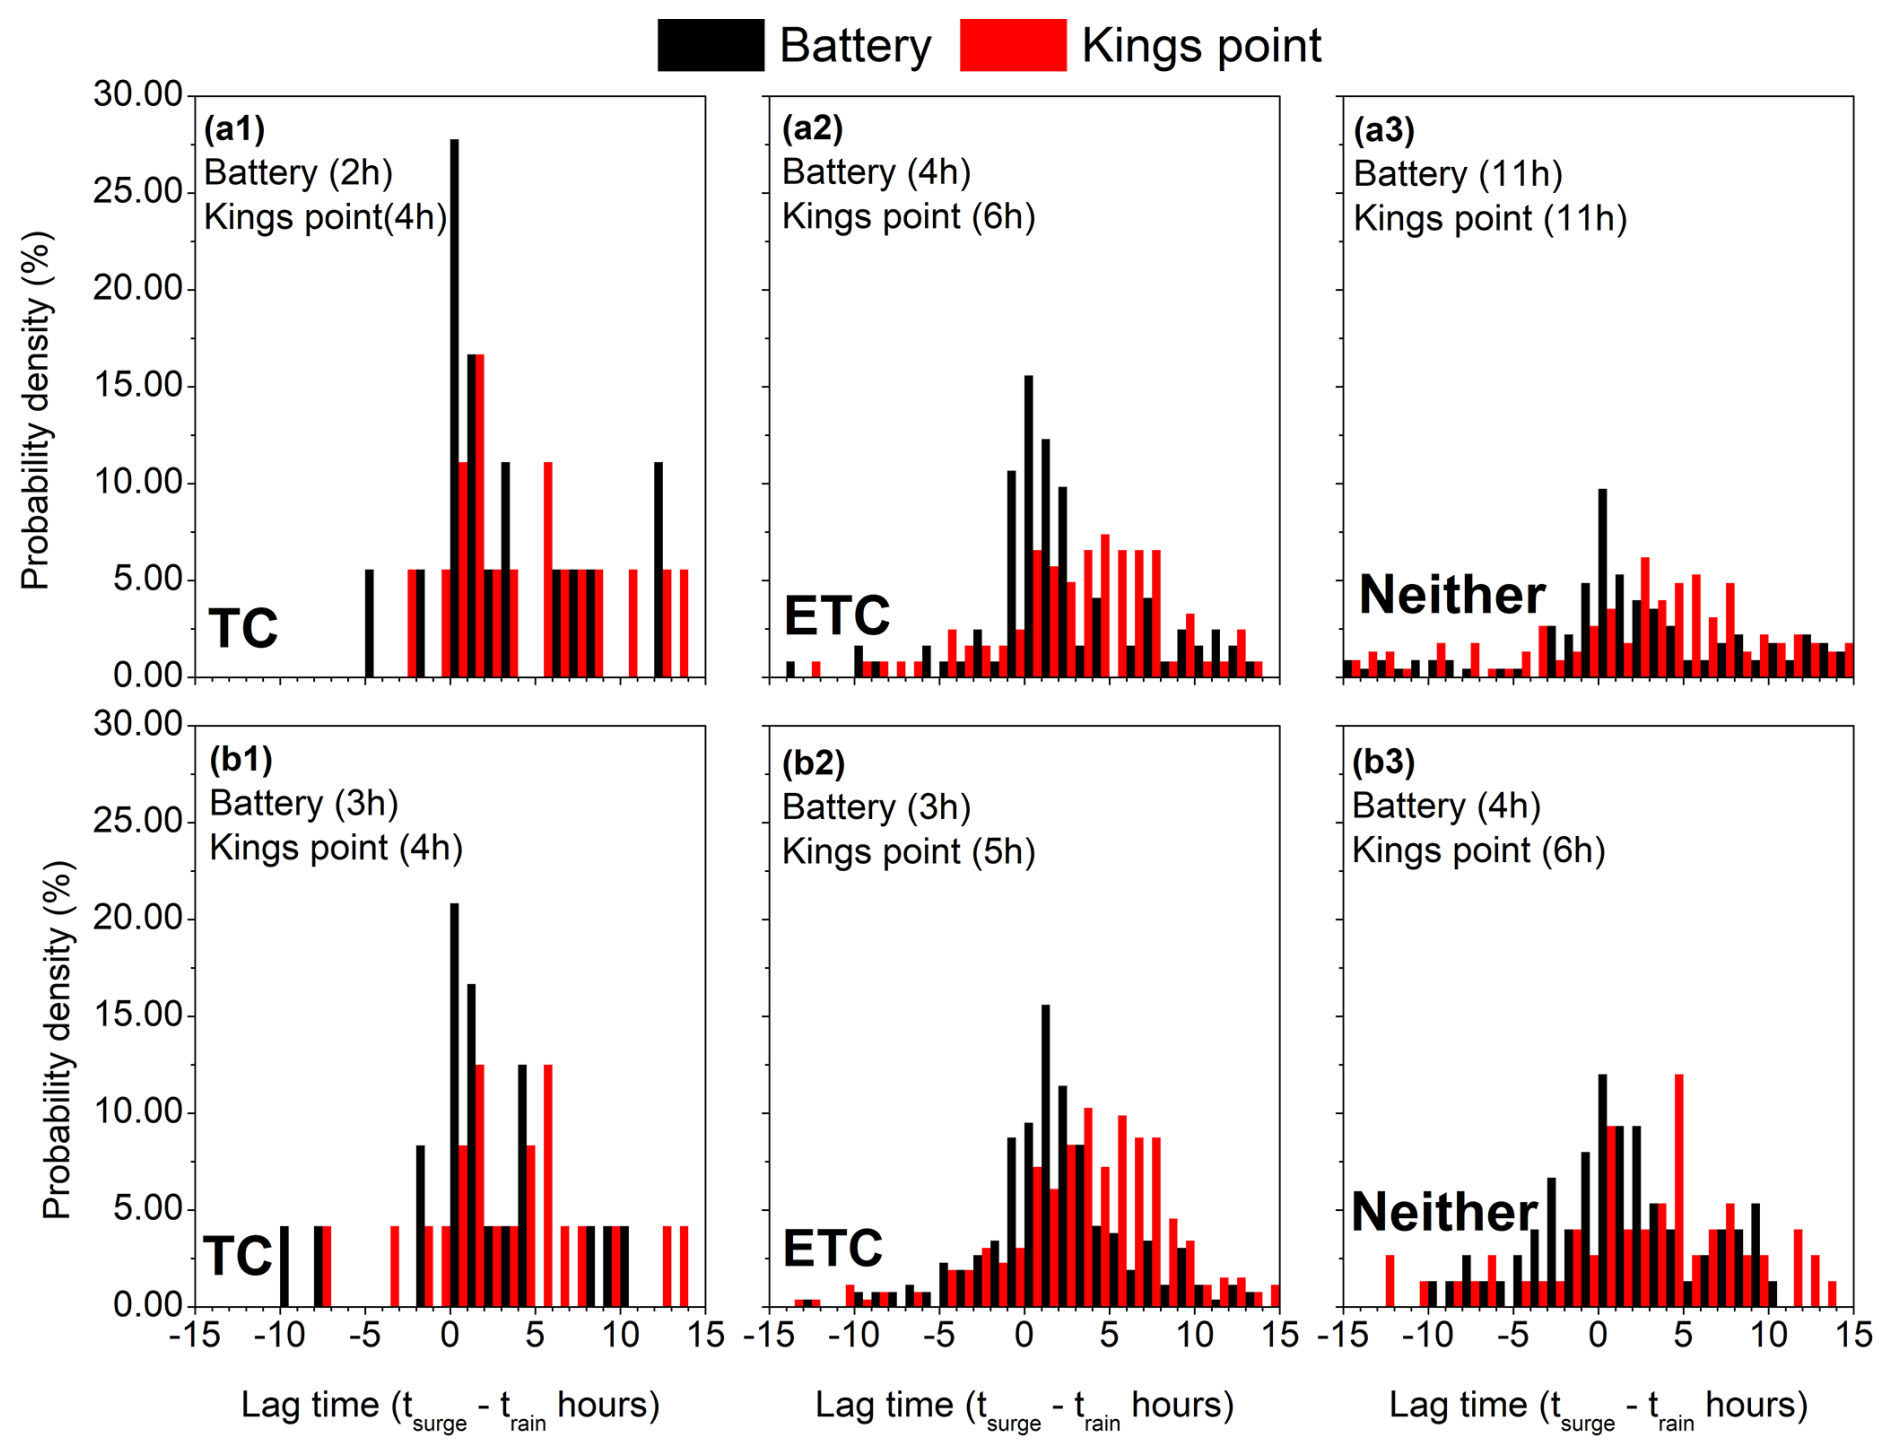
Figure 6Histograms of lag time for the P-C compound events (top, a1–a3) and the C-P compound events (bottom, b1–b3). The left, middle, and right panels are associated with TCs (a1, b1), ETCs (a2, b2), and Neither (a3, b3). The red and black bars represent histograms for The Battery and Kings Point separately. The numbers in each plot are the median of the absolute lag time for Battery and Kings Point. Positive lag time values indicate that peak storm surge occurs after peak of rainfall. Here we only show the lag time within ±15 h.
The statistical characteristics of lag time are different across the three storm types (Fig. 6). During TCs, the secondary maximum flood drivers tend to either be simultaneous or occur with a smaller lag time than for other storm types, which can be seen by comparing histograms a1 and b1 with histograms a2–3 and b2–3 in Fig. 6. The median lag time for TCs tends to be the smallest and is shown as the parenthetic numbers at top left of each panel. Also, there is a significant negative correlation of the extreme rainfall and the absolute value of lag time during TCs for P-C compound events (Fig. 7). This indicates that the most intense rainfall events tend to have the shortest absolute lag times to the peak, which raises the risk of amplifying the compound flood effects during TCs. These negative correlations are significant at many stations around The Battery (Fig. 7) and Kings Point.
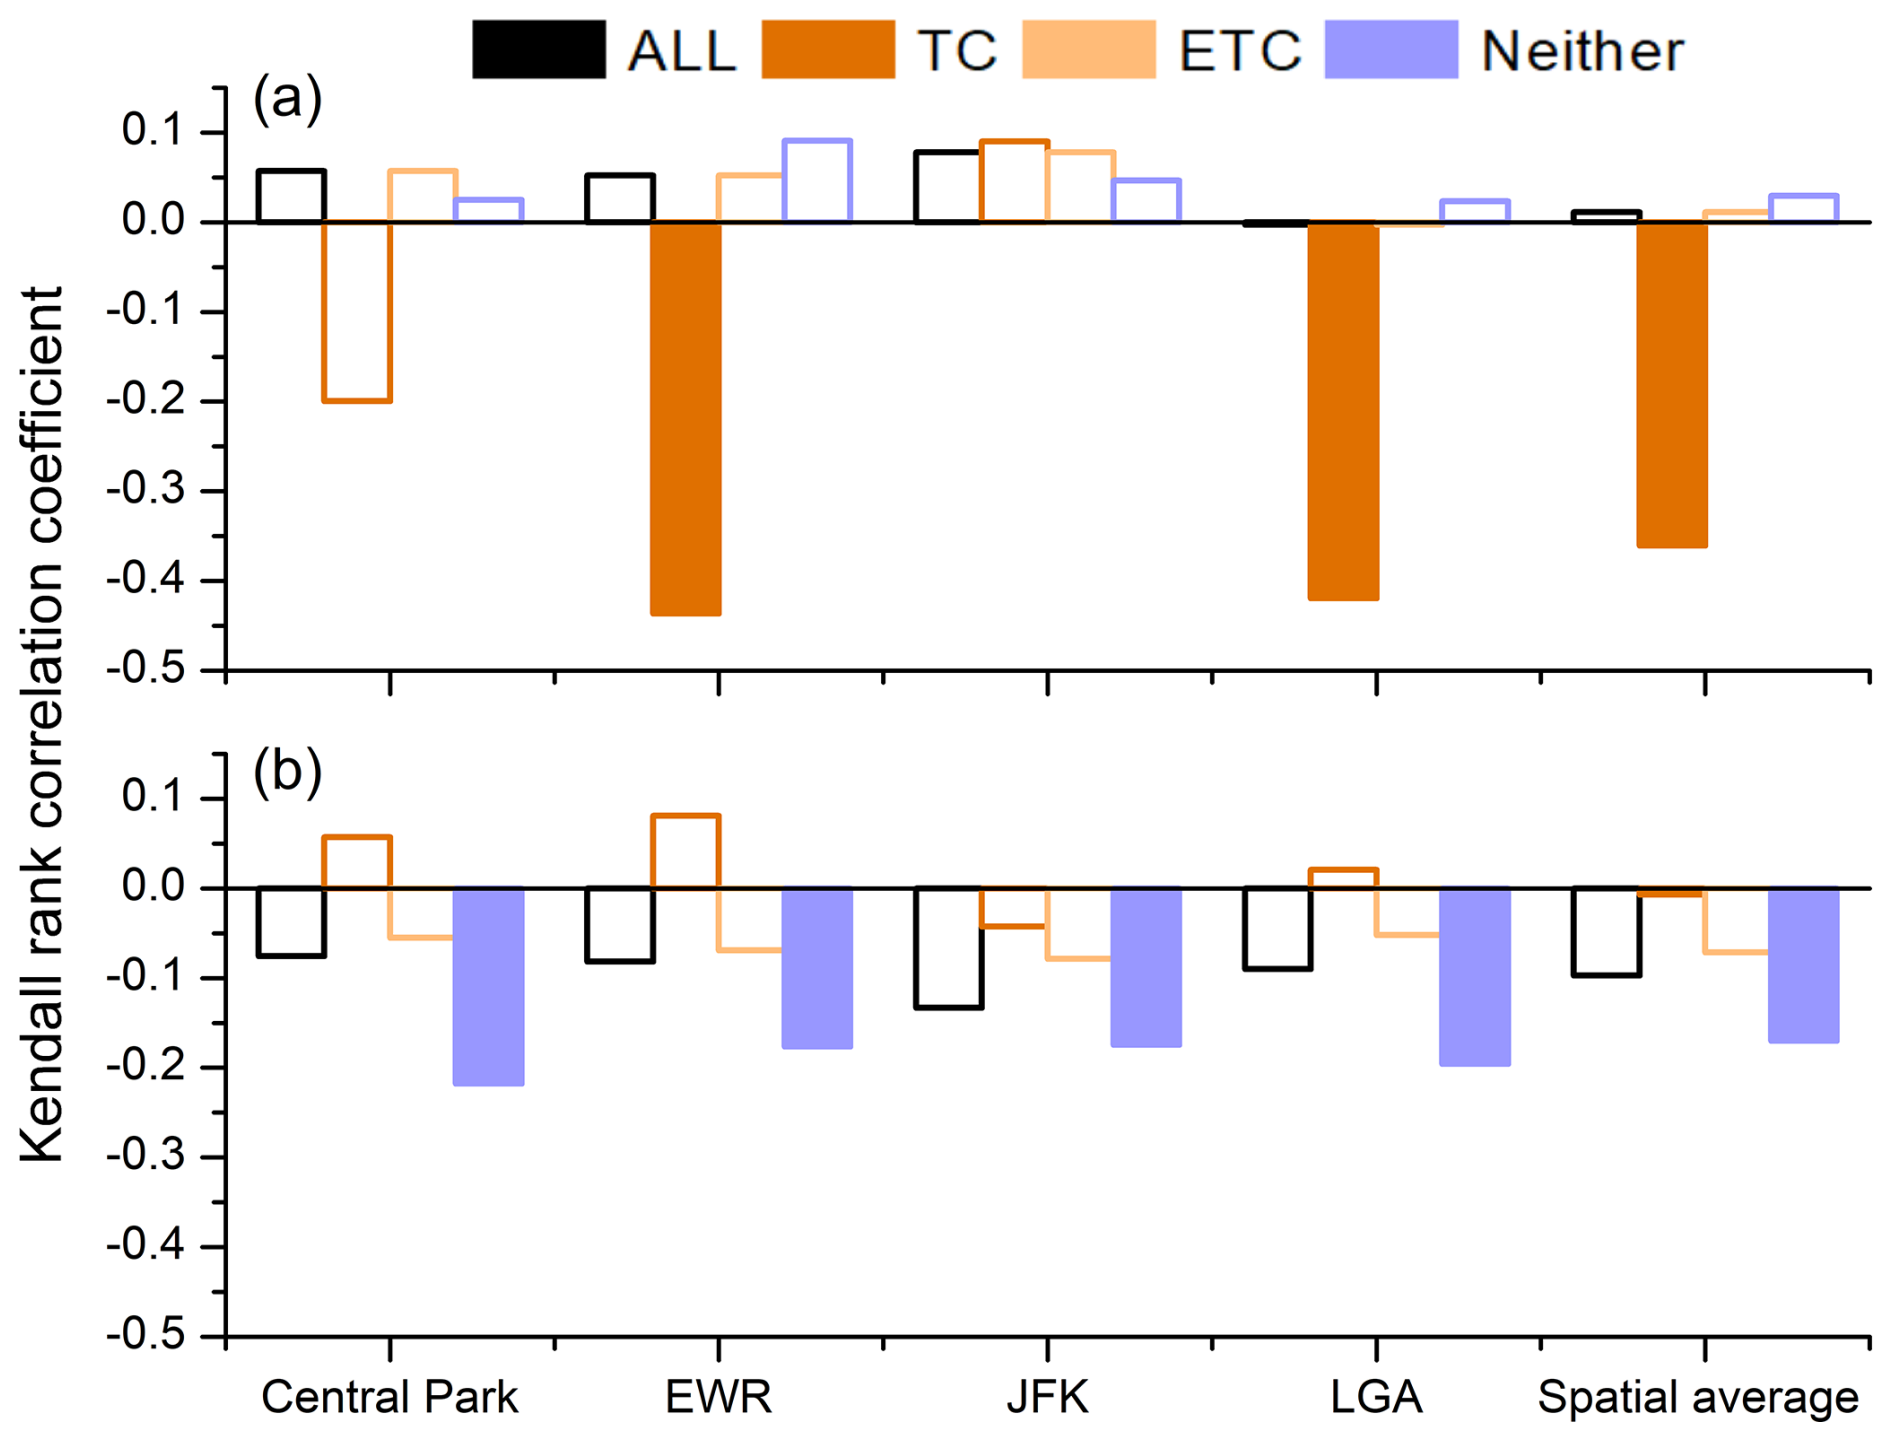
Figure 7The Kendall rank correlation coefficients between primary flood drivers and absolute lag time of the secondary driver for (a) the P-C compound events and (b) the C-P compound events associated with different storm types for each single gauge and the spatial average around The Battery. The filled bars represent statistically significant cases (p<0.05).
For the Neither type (panels a3 and b3 in Fig. 6), the lag time for P-C compound events (panel a3 in Fig. 6) is more spread out than for C-P compound events (panel b3 in Fig. 6). This may be because C-P compound events have storm surge and are thus often associated with a synoptic storm. P-C compound events in the Neither category are more likely not to be associated with an organized storm that produces surge, so there is less reason for timing to be coupled.
The histograms and the median absolute lag time also show that the lag time around The Battery tends to be shorter than that around Kings Point. This is consistent with the magnitude results in Sect. 4.3. This phenomenon will be further discussed in Sect. 5.3.
4.5 Joint return period analysis
In Fig. 8, we contrast the resulting joint return period (JRP) curves associated with each storm type with those evaluated from All. For P-C events, the analysis uses simultaneous NTR. For C-P events, the analysis uses rainfall within a ±1 h window from the time of peak NTR. This is done to conservatively assess the joint occurrence because rainfall during severe storms can sharply change from one hour to the next. Extreme surge typically lasts for several hours at minimum (Booth et al., 2016), whereas extreme rain can last for only 1 h or less and then drop to zero or can abruptly alternate between extreme and zero when there is banding of rainfall. This is demonstrated in Fig. 8, comparing the sharpness of peaks in panels a6 and b6. For P-C events (a6), the simultaneous hourly NTR barely drops for lags of ±1 h. For C-P events (b6), the 90th percentile simultaneous rain on average drops to ∼40 % in the hour after peak NTR. For the 50th percentile, the average drop is ∼50 %. The need for the ±1 h window is also illustrated by the fact that the peak for the 50th percentile rain (panel b6) is at −1 h.
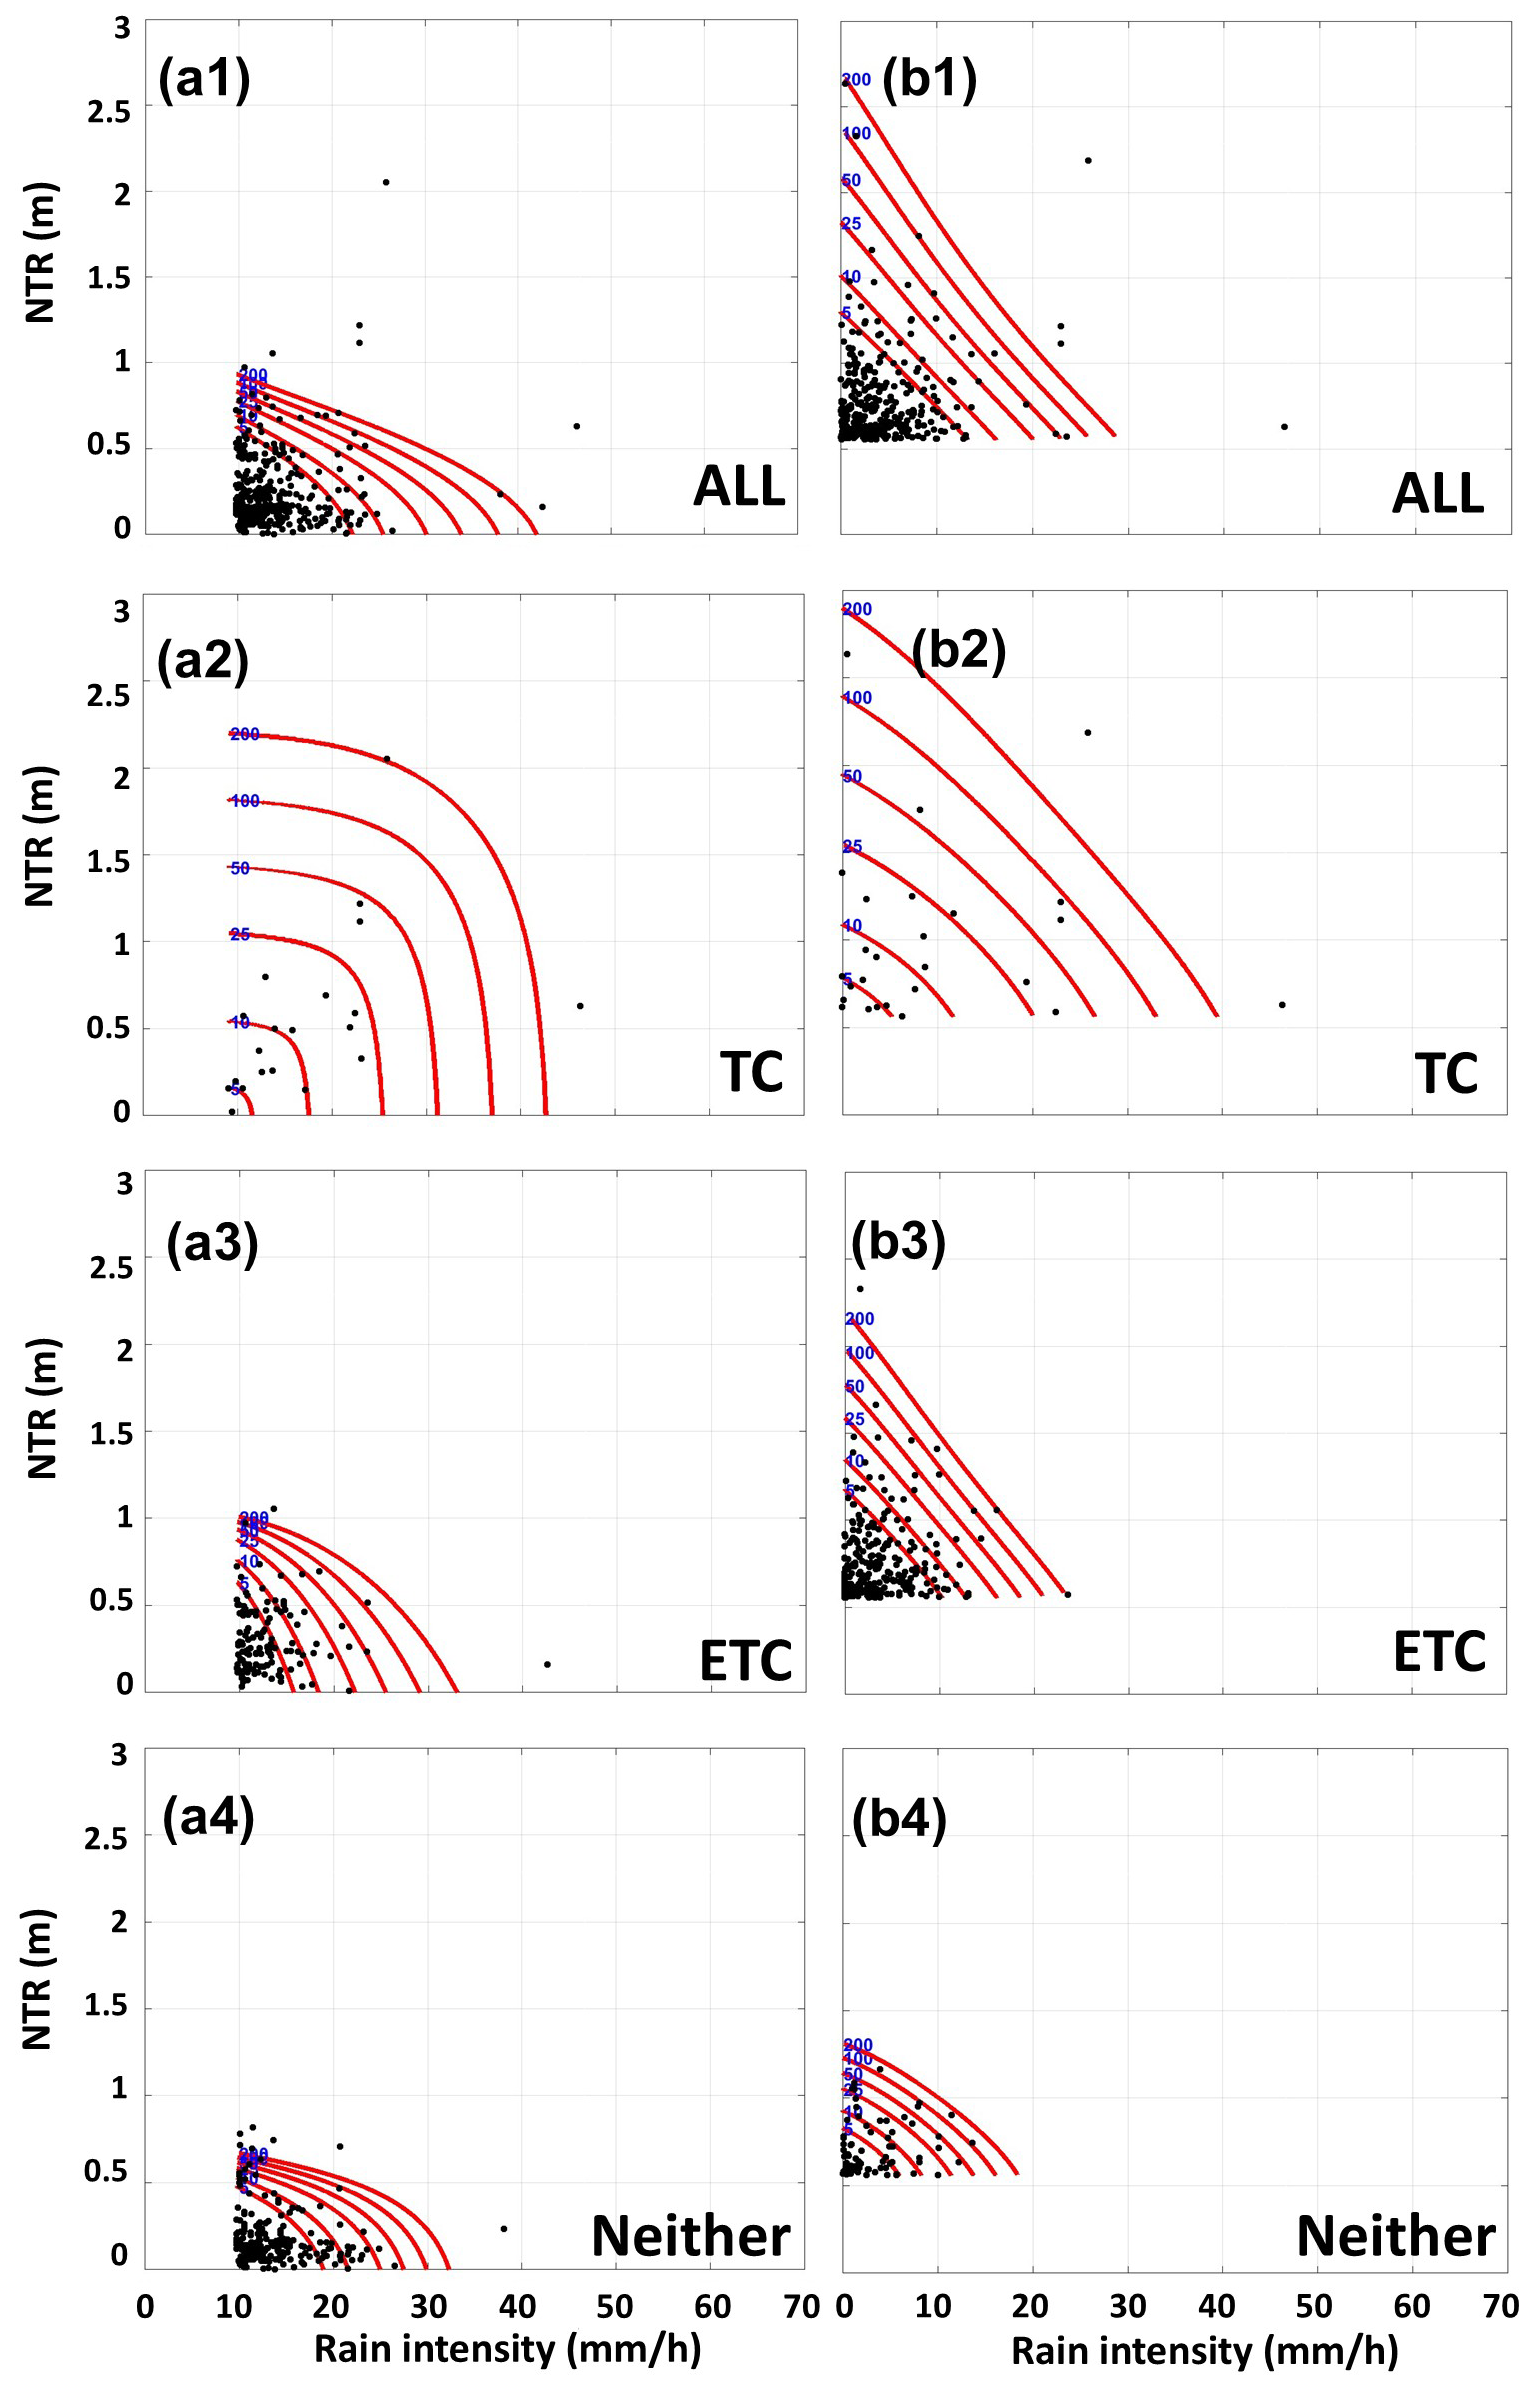
Figure 8Observations (black points) and joint return period curves (5 to 200 years) for P-C compound events (left, a1–a4) and C-P compound events (right, b1–b4) by different storm types. All the compound flood drivers are hourly and simultaneous, except maximum rainfall within a ±1 h window was used for C-P events (see Sect. 4.5).
The JRP results show that TCs play a dominant role in driving the most extreme (50-year return period and above) compound events, while ETCs contribute mainly to the more frequent compound events (10-year events and below). Specifically in Fig. 8, for the joint extreme values of the 50-year (or above) return periods, higher values occur for TCs than for All, but, for the joint extreme values of the 10-year (or less) return periods, the joint values of TCs are much smaller than those of All. Conversely, the ETC joint extreme values of the 10-year (or less) return period are similar to All but much smaller than TCs for the 50-year (or above) return periods. The values for Neither are lower than for the other storm types and thus play a very limited role.
The characteristics of the JRP curves relate to both the rank correlations and the marginal intensities presented in Sect. 4.2 and 4.3. The P-C joint return period (JRP) curves associated with TCs, for example, are more convex than those associated with other storm types, as they have a higher dependency. For the C-P compound event, the JRP curves associated with TCs are less convex than the P-C compound event, due to low correlations. However, they still cause stronger extreme compound events than other storm types. While TCs are far less frequent than other storm types (Sect. 4.1), they are the primary source of extreme compound rain surge (e.g., 50–200-year events).
While this study focuses on flood drivers over one city and its relatively small watersheds, our research has important implications for the broader field of urban compound flood research. Firstly, through our separation of storm types, our study is the first to demonstrate the importance of both TCs and ETCs in assessing compound flooding. Our results illustrate that events driven by TCs, ETCs, and Neither can have significant differences in their compound flood hazard characteristics. Separating the data from different storm types results in different estimates of their dependency, magnitudes of marginals, lag time, and occurrence frequency. TCs have markedly different driver characteristics from other storm types and dominate the joint probabilities of the most extreme rain surge compound events, even though they occur much less frequently. ETCs are the predominant source of more frequent, moderate compound events. Critically, the 50–200-year return periods for compound events are higher when only assessing TCs versus assessing All events together. This is mainly due to the larger magnitude of the secondary flood driver (Sect. 4.3) and, in the case of P-C events, also a higher dependency (Sect. 4.2). This research demonstrates that the danger of compound hazards from TCs can be underestimated if aggregated with data with other storm types, which is common practice. This is discussed in more detail below in Sect. 5.1.
Secondly, by using hourly data and looking at simultaneous occurrence and hourly lags, our analyses demonstrate the importance of subtle lags that can be important to compound pluvial–coastal flooding for both small urban watersheds and small rivers (e.g., the Bronx River). Prior research on pluvial–coastal compounding typically uses the daily rainfall data and ±1 d window to capture the compound flood drivers (e.g., Lai et al., 2021; Kim et al., 2023) and evaluate the joint return periods using All events (e.g., Ghanbari et al., 2023; Wahl et al., 2015). However, small lags of 0–2 h between maximum rainfall and coastal drivers were found to be a critical factor in the magnitude of urban compound flood impacts (e.g., Gori et al., 2020a). The analysis of hourly data verifies that rain and NTR occur simultaneously and also opens up many new windows into potential compounding that would be missed if using daily rainfall data and the storm-maximum approach. Results show the compound hazard statistics using the hourly simultaneous approach can reveal smaller hazard extremes from those resulting from the more commonly applied “storm-duration maximum” approach (Fig. S4 in the Supplement), especially for the location (Kings Point) with more prominent lag times (Fig. 5 vs. Fig. S3 or Fig. 6). Storm-duration co-occurrences of extreme flood drivers can be 1 d or more apart, so they can have sequential or compounding impacts, whereas the hourly simultaneous approach guarantees that the drivers coincide. The hourly simultaneous analysis results can also be different for nearby tide stations due to the direction and pathway of storm surge propagation. This phenomenon is discussed in Sect. 5.3. Limitations and simplifications of the research are discussed in Sect. 5.4.
5.1 Storm separation
TCs, ETCs, and Neither can be responsible for similar individual events, but their clouds of data points and copula-modeled JRP curves for rain and NTR are often distinct (Fig. 8). TCs and ETCs can both trigger extreme coastal flooding and extreme rainfall, whereas storms in the Neither category (often summer convective thunderstorms) mostly only cause extreme rainfall.
The decision to separate rare TCs from other more frequent storm event types in extreme value analyses is a difficult one, as it results in more uncertainty in probability distributions. This can be a challenge for policy-oriented metrics such as the 100-year flood zone, especially if it leads to widely varying estimates across different assessment methods or for consecutive studies from one organization (e.g., FEMA; Orton et al., 2016). Nevertheless, for environments like NYC, where TCs are infrequent but responsible for a majority of historical rain and storm surge extreme events, merging data in an analysis of All storm event data can often lead to low biases in probabilistic assessments. If TCs are separated, the results in Fig. 8 show that additional separation of ETCs from Neither may also be beneficial for proper quantification of 10-year-return-period joint rain surge events.
Recent studies (e.g., Gori et al., 2022) have begun to use synthetic TC storms to evaluate the joint probability of compound rain and coastal flood hazards, which can be particularly useful for assessing future climate change. The observation-based approach we have used and this new model-based approach can be complementary. While the observation-based approach is grounded in real-world data, the model-based approach can improve sample sizes for extreme events and enable extending the science to climate projections.
5.2 Different correlations for C-P and P-C associated with TCs
NYC C-P compound hazard induced by TCs has a much lower correlation than P-C compound hazard, in contrast to prior research for Florida and Texas. Typical TCs have their heaviest rain and strongest onshore winds (and thus surge) in separate quadrants (Yang et al., 2021), and, as a result, rain and surge are not typically highly correlated. Typical correlations for Florida and Texas are 0.2–0.4 for both P-C and C-P events (Jane et al., 2020; Kim et al., 2023). For top-ranked NYC NTR (C-P) events, the correlations are near zero. One reason this could be the case is because the TCs at this high latitude are typically undergoing extratropical transition causing the rain to become even more separated, moving radially outward further from the storm center (e.g., Evans et al., 2017). For example, during Hurricane Sandy, the storm size became larger as the storm transitioned, and the distance between rain and surge became large. Storm surge was concentrated near the right side of the storm track in the region of highest onshore winds (New York Bight), and precipitation was radially outward and to the west of the storm (e.g., Virginia, West Virginia; Blake et al., 2013). Regardless of the lower or even negative correlations between NTR and rain, there are still stronger secondary driver magnitudes and higher joint return period curves (50–200-year return periods) during TCs than All events.
5.3 Storm track and surge path dependence of compounding
The results by storm type reveal that characteristics of compound flood drivers could be dramatically different depending on the storm type association. Similarly, for one specific storm type, compound hazard risk may mainly come from events with certain cyclone tracks. For example, NYC has exposure to three main hurricane paths pertinent to surge: (1) New Jersey landfalls, which maximize storm surge “to the right of the storm” at NYC but often co-occur with low rainfall, as the rain tends to occur toward the west (e.g., Sandy); (2) direct hits from the south bringing large surges and heavy rains; and (3) tracks crossing Long Island to the east, where surges travel westward across Long Island Sound and where there is also potential for heavy coincident rainfall to the “left” of the track. An initial hypothesis of this research was that Kings Point, due to events with track type (3), would have higher compound rain–NTR hazard than The Battery. However, we find mixed evidence that is not strongly supportive of this hypothesis. Firstly, rank correlations for both stations were very similar. For P-C compounding, Kings Point has higher 90th and 50th percentiles of NTR than Battery (Figs. 5 and S3), supporting the hypothesis. However, for C-P compounding, Battery has higher 90th percentile rainfall than Kings Point.
A complexity not explored here is that different storm types have different track paths. ETCs have tracks from both seaward (the south) and landward (Booth et al., 2016), while TCs do not come over land, or, more precisely, they weaken and convert to post-tropical status (e.g., Ida) or dissipate when they do. Compound flood characteristics of these different storm types could stratify depending on the tracks. More research on the storm track dependency of compound flood hazards would be useful.
The surge path is also an important factor that could affect the timing of compound flood drivers, which could change the compound effects and risk locally during storms. For example, for an urban pluvial environment like NYC. The Battery and Kings Point have qualitatively similar storm-duration maximum rain–NTR compound hazard characteristics. However, we found the peak NTR at Kings Point tends to have longer hours of lag time from its peak rain during TCs and other storm events, due to surge propagation along Long Island Sound. This could reduce the risk of pluvial–coastal compound flood hazards but raise the risk of fluvial–coastal compound (e.g., storms in Table 1 in Chen et al., 2020). Examining river stage data (USGS station #01302020) for post-TC Ida, we see a 2 h lag time between the onset of heavy rainfall and the exceedance of the major flood stage, with river stage remaining high for 18+ h afterward. Given the typical lag time to peak surge for TCs of 2–6 h for Kings Point (red histogram of panels a1 and b1 in Fig. 6), this could lead to an elevated risk of compound fluvial–coastal flooding.
5.4 Limitations and simplifications
Some limitations or challenges of our study are noted herein. Firstly, a few C-P compound events associated with Neither have zero rainfall, which causes anomalies (Kojadinovic and Yan, 2010) when modeling its marginal distribution and dependency with NTR. We found that there are only slight changes in the correlation coefficient when omitting these few events. Nevertheless, neglecting them could cause a small negative effect on the joint probability results (Panel b4 in Fig. 8). The joint probability curves for Neither are not the key result for this research, so we did not apply a more sophisticated approach (e.g., randomization techniques in De Michele et al., 2013) to improve this issue. Secondly, tide is a relatively uncorrelated component in the total water level. Our main research interest is to investigate the statistical characteristics of the joint rainfall and storm surge. We choose to use the NTR, instead of water level, as the values for coastal hazards to avoid the interference of the randomness of tide (Bevacqua et al., 2019; Jane et al., 2022; Paprotny et al., 2018; Wahl et al., 2015). Future analysis could include tide as another driver of coastal hazards, assuming tide is an independent component that could be near-linearly superimposed with the NTR at this location (e.g., Jordi et al., 2019). Especially for those areas (e.g., the coast of Jamaica Bay) already suffering from nuisance flooding (Orton et al., 2015) due to low elevation, there could be potential compound nuisance floods dominated by rainfall and high tide (e.g., 29 September 2023 flood around Flushing Bay with moderate rainfall, high tide, and no storm surge).
Different locations of rain gauges may introduce timing lags and lead to uncertainties in defining “simultaneous” extremes. However, the timing differences of NTR across New York Harbor, e.g., in Jamaica Bay, off Manhattan, or in Newark Bay, are at most 30 min based on the shallow water wave travel time (similar to tide) from offshore to reach these locations, which have pathways with distances of at most 20 km. For single-gauge analysis of rainfall–surge timing, these location differences may help explain different rank correlations, but, for the joint probability analysis and lag time histograms, we use a spatial average rainfall, which captures regions surrounding the tide gauges well and should introduce very little timing difference.
Lastly, this study does not evaluate historical or future climate change but focuses instead on establishing a baseline assessment of rain surge compound hazard. We use past data to look at the present compound flood risk, requiring an assumption that the past processes and probabilities reflect those of the present. We remove sea level rise from the storm surge data in order to eliminate the most well established climate change effect. While the broader northeastern US region has seen an increase in rainfall coming in extreme events (Huang et al., 2021), no observational study has revealed increases in extreme rainfall for New York City. One study has shown increasing storm surges and storm tides from 1844–2013, but those increases occurred in the century leading up to the 1950s (Talke et al., 2014). Extremes of both rainfall and storm surges were not found to have significant increases during the historic period that we evaluate in our research (1948–present; Wahl et al., 2015), though, for some other regions, trends have been discovered (e.g., Calafat et al., 2022). So, it is reasonable for this first baseline assessment that we assume that rainfall and storm surge are statistically stationary.
Flood risk studies, insurance products, and flood maps typically assume rain and storm surge are independent processes. However, for NYC, our research shows non-zero correlations between these flood drivers and that there is a higher probability of one variable being extreme when the other is extreme. Based on 75 years of historical observations, compound rain and NTR overall have a low but non-zero rank correlation (∼0.10–0.15). However, the dependency of compound rain and NTR associated with TCs alone can be high. In addition, the magnitudes of secondary flood drivers during TCs are much higher compared with other event types. The lag time between the compound flood drivers also differs by storm type, with TCs tending to have the lowest absolute lag time compared with ETCs or Neither (convective storms and other types of events). TCs also tend to have more simultaneous occurrence with NTR as the rain intensity rises. In total, this evidence suggests that TC events need separate assessment, to avoid underestimating compound flood risk.
The Battery and Kings Point coastal areas of NYC have qualitatively similar compound rain surge hazard correlations. However, we found that the peak NTR at Kings Point tends to lag hours behind the peak rain for all storm types, likely due to propagation of the storm surge along Long Island Sound. The timing between the compound flood drivers is a critical factor that affects their compound effects, especially in terms of an urban pluvial environment like NYC. This lag could reduce the risk of pluvial–coastal compound flood hazards but may raise the risk of fluvial–coastal compound floods.
The historical data analysis shows that the combination of extreme rain and extreme surge (e.g., Hurricane Irene in 2011 (50 years) and Hurricane Gloria in 1985 (200 years)) generally has a low annual probability in NYC. However, these statistical results are only based on the limited number of TC events (roughly 0.3 events per year) that hit NYC. NYC's extreme events often cause only one extreme flood driver. For example, Hurricane Sandy (2012) triggered an extreme storm surge in NYC with only moderate rain, and Hurricane Ida (2021) triggered extreme rainfall but went through the ETC transition with less wind and only a small storm surge to the right of the storm track. However, our joint probabilistic analysis demonstrates that TCs have the potential to trigger both extremes at the same time, potentially causing a major flood disaster due to the non-linear increase in impacts with flood magnitude. While TCs are far less frequent than other storm types, they are the primary source of compound rain surge extremes (e.g., 50- and 100-year events).
Statistical and probabilistic assessments of rain and storm surge such as this demonstrate that flood drivers can co-occur during extreme storm events. Furthermore, statistical analysis choices between hourly and daily data, and rules for storm-duration maxima, may be debated. Co-occurrence does not guarantee additive behavior where flooding is actually compounded. Therefore, an important next step will be to simulate these extreme event scenarios in flood models such as those described above. Given the availability of one or more such flood models (e.g., Ghanbari et al., 2023), it is recommended that an assessment of the on-the-ground impacts of these compound events is initiated.
The codes for the data are primarily available at https://doi.org/10.17632/64kx95ckr4.1 (Chen and Orton, 2024). One exception is the MATLAB copula toolbox, which is available at https://amir.eng.uci.edu/MhAST.php (Sadegh et al., 2018).
The hourly rainfall data are from the NOAA National Climatic Data Center (NCDC) https://doi.org/10.25921/p7j8-2170 (Wuertz et al., 2025) and the Automated Surface Observing System (ASOS) https://doi.org/10.26023/PN6M-3PYC-WP0D (National Centers for Environmental Information, 2011). The water level data are available at https://doi.org/10.25921/dt9g-2p60 (Center for Operational Oceanographic Products and Services, 2018). The TC track data can be obtained from the National Hurricane Center (NHC) at https://www.nhc.noaa.gov/data/ (National Hurricane Center, 2025).
The supplement related to this article is available online at https://doi.org/10.5194/hess-29-3101-2025-supplement.
ZC, PMO, JFB, and TW conceived the research. PMO acquired the funding and administrated the project. ZC performed the data analysis. TW contributed to the copula method. ZC and PMO prepared the draft. All authors revised the article.
The contact author has declared that none of the authors has any competing interests.
Publisher's note: Copernicus Publications remains neutral with regard to jurisdictional claims made in the text, published maps, institutional affiliations, or any other geographical representation in this paper. While Copernicus Publications makes every effort to include appropriate place names, the final responsibility lies with the authors.
The authors would like to thank Moji Sadegh (Boise State University) for the constructive instructions on the MhAST. We also thank James Booth and Max Sehaumpai (City University of New York) for sharing their reanalysis ETC track data. We acknowledge the copyright ownership of Esri (the company behind ArcGIS) for the software used to create the map in Fig. 1.
This research has been supported by the City of New York (consortium contract, “Climate Vulnerability, Impact, and Adaptation Analysis”), the National Oceanic and Atmospheric Administration (grant no. NA21OAR4310313), the National Science Foundation (grant nos. 1929382 and 2103754), and the National Oceanic and Atmospheric Administration (grant no. NE-EN6100-23-00822).
This paper was edited by Thomas Kjeldsen and reviewed by two anonymous referees.
Abdelkader, M., Temimi, M., and Ouarda, T. B. M. J.: Assessing the National Water Model's Streamflow Estimates Using a Multi-Decade Retrospective Dataset across the Contiguous United States, Water-Sui., 15, 2319, https://doi.org/10.3390/w15132319, 2023.
Agonafir, C., Pabon, A. R., Lakhankar, T., Khanbilvardi, R., and Devineni, N.: Understanding New York City street flooding through 311 complaints, J. Hydrol., 605, 127300, https://doi.org/10.1016/j.jhydrol.2021.127300, 2022.
Al Azad, A. A., Mita, K. S., Zaman, M. W., Akter, M., Asik, T. Z., Haque, A., Hussain, M. A., and Rahman, M. M.: Impact of tidal phase on inundation and thrust force due to storm surge, Journal of Marine Science and Engineering, 6, 110, https://doi.org/10.3390/jmse6040110, 2018.
Arns, A., Wahl, T., Haigh, I., Jensen, J., and Pattiaratchi, C.: Estimating extreme water level probabilities: a comparison of the direct methods and recommendations for best practise, Coast. Eng., 81, 51–66, https://doi.org/10.1016/j.coastaleng.2013.07.003, 2013.
Ayyad, M., Orton, P. M., El Safty, H., Chen, Z., and Hajj, M. R.: Ensemble forecast for storm tide and resurgence from Tropical Cyclone Isaias, Weather and Climate Extremes, 38, 100504, https://doi.org/10.1016/j.wace.2022.100504, 2022.
Bauer, M., Tselioudis, G., and Rossow, W. B.: A New Climatology for Investigating Storm Influences in and on the Extratropics, J. Appl. Meteorol. Clim., 55, 1287–1303, https://doi.org/10.1175/JAMC-D-15-0245.1, 2016.
Bender, J., Wahl, T., Müller, A., and Jensen, J.: A multivariate design framework for river confluences, Hydrolog. Sci. J., 61, 471–482, https://doi.org/10.1080/02626667.2015.1052816, 2016.
Bevacqua, E., Maraun, D., Vousdoukas, M., Voukouvalas, E., Vrac, M., Mentaschi, L., and Widmann, M.: Higher probability of compound flooding from precipitation and storm surge in Europe under anthropogenic climate change, Science Advances, 5, eaaw5531, https://doi.org/10.1126/sciadv.aaw5531, 2019.
Blake, E. S., Kimberlain, T. B., Berg, R. J., Cangialosi, J. P., and Beven, J. L.: Tropical Cyclone Report: Hurricane Sandy (AL182012), National Hurricane Cent., Miami, Fla, https://www.nhc.noaa.gov/data/tcr/AL182012_Sandy.pdf (last access: 16 July 2025), 2013.
Booth, J. F., Rieder, H. E., and Kushnir, Y.: Comparing hurricane and extratropical storm surge for the Mid-Atlantic and Northeast Coast of the United States for 1979–2013, Environ. Res. Lett., 11, 094004, https://doi.org/10.1088/1748-9326/11/9/094004, 2016.
Calafat, F. M., Wahl, T., Tadesse, M. G., and Sparrow, S. N.: Trends in Europe storm surge extremes match the rate of sea-level rise, Nature, 603, 841–845, https://doi.org/10.1038/s41586-022-04426-5, 2022.
Center for Operational Oceanographic Products and Services (CO-OPS): CO-OPS Water Level Data from the Coastal Tide Gauge and Great Lake Water Level Network of the United States and US Territories [Water Level Data], NOAA National Centers for Environmental Information, https://doi.org/10.25921/dt9g-2p60 (last access: 12 July 2025), 2018.
Chen, Z. and Orton, P.: Effects of storm surge barrier closures on estuary saltwater intrusion and stratification, Water Resour. Res., 59, e2022WR032317, https://doi.org/10.1029/2022WR032317, 2023.
Chen, Z. and Orton, P.: Codes of Chen et al., Mendeley Data, V1 [code], https://doi.org/10.17632/64kx95ckr4.1, 2024.
Chen, Z., Orton, P., and Wahl, T.: Storm surge barrier protection in an era of accelerating sea-level rise: Quantifying closure frequency, duration and trapped river flooding, Journal of Marine Science and Engineering, 8, 725, https://doi.org/10.3390/jmse8090725, 2020.
Couasnon, A., Eilander, D., Muis, S., Veldkamp, T. I. E., Haigh, I. D., Wahl, T., Winsemius, H. C., and Ward, P. J.: Measuring compound flood potential from river discharge and storm surge extremes at the global scale, Nat. Hazards Earth Syst. Sci., 20, 489–504, https://doi.org/10.5194/nhess-20-489-2020, 2020.
De Michele, C., Salvadori, G., Vezzoli, R., and Pecora, S.: Multivariate assessment of droughts: Frequency analysis and dynamic return period, Water Resour. Res., 49, 6985–6994, https://doi.org/10.1002/wrcr.20551, 2013.
Dolan, R. and Davis, R. E.: An intensity scale for Atlantic coast northeast storms, J. Coastal Res., 8, 840–853, 1992.
Evans, C., Wood, K. M., Aberson, S. D., Archambault, H. M., Milrad, S. M., Bosart, L. F., Corbosiero, K. L., Davis, C. A., Dias Pinto, J. R., Doyle, J., Fogarty, C., Galarneau, T. J., Grams, C. M., Griffin, K. S., Gyakum, J., Hart, R. E., Kitabatake, N., Lentink, H. S., McTaggart-Cowan, R., Perrie, W., Quinting, J. F. D., Reynolds, C. A., Riemer, M., Ritchie, E. A., Sun, Y., and Zhang, F.: The Extratropical Transition of Tropical Cyclones. Part I: Cyclone Evolution and Direct Impacts, Mon. Weather. Rev., 145, 4317–4344, https://doi.org/10.1175/MWR-D-17-0027.1, 2017.
FEMA: Region II Coastal Storm Surge Study: Overview, Federal Emergency Management Agency, Washington, DC, 15, https://feedback.region2coastal.com/NationalDisasters/Hurricane Sandy/RiskMAP/Public/Public_Documents/Storm_Surge_Reports/R2_Surge_SummaryReport.pdf (last access: 16 July 2025), 2014.
Field, C. B., Barros, V., Stocker, T. F., Qin, D., Dokken, D., Ebi, K., Mastrandrea, M., Mach, K., Plattner, G., and Allen, S.: Managing the risks of extreme events and disasters to advance climate change adaptation, A Special Report of Working Groups I and II of the Intergovernmental Panel on Climate Change Cambridge University Press, Cambridge, UK, and New York, NY, USA, https://doi.org/10.1017/CBO9781139177245, 2012.
Genest, C., Rémillard, B., and Beaudoin, D.: Goodness-of-fit tests for copulas: A review and a power study, Insur. Math. Econ., 44, 199–213, https://doi.org/10.1016/j.jmva.2004.07.004, 2009.
Georgas, N., Orton, P., Blumberg, A., Cohen, L., Zarrilli, D., and Yin, L.: The impact of tidal phase on Hurricane Sandy's flooding around New York City and Long Island Sound, Journal of Extreme Events, 1, 1450006, https://doi.org/10.1142/S2345737614500067, 2014.
Ghanbari, M., Dell, T., Saleh, F., Chen, Z., Cherrier, J., Colle, B., Hacker, J., Madaus, L., Orton, P., and Arabi, M.: Compounding Effects of Changing Sea Level and Rainfall Regimes on Pluvial Flooding in New York City, Nat. Hazards, 120, 6377–6400, https://doi.org/10.1007/s11069-024-06466-8, 2023.
Gold, A. C., Brown, C. M., Thompson, S. P., and Piehler, M. F.: Inundation of Stormwater Infrastructure Is Common and Increases Risk of Flooding in Coastal Urban Areas Along the US Atlantic Coast, Earths Future, 10, e2021EF002139, https://doi.org/10.1029/2021EF002139, 2022.
Gori, A., Lin, N., and Smith, J.: Assessing compound flooding from landfalling tropical cyclones on the North Carolina coast, Water Resour. Res., 56, e2019WR026788, https://doi.org/10.1029/2019WR026788, 2020a.
Gori, A., Lin, N., and Xi, D.: Tropical cyclone compound flood hazard assessment: From investigating drivers to quantifying extreme water levels, Earths Future, 8, e2020EF001660, https://doi.org/10.1029/2020EF001660, 2020b.
Gori, A., Lin, N., Xi, D., and Emanuel, K.: Tropical cyclone climatology change greatly exacerbates US extreme rainfall–surge hazard, Nat. Clim. Change, 12, 171–178, https://doi.org/10.1038/s41558-021-01272-7, 2022.
Huang, H., Patricola, C. M., Winter, J. M., Osterberg, E. C., and Mankin, J. S.: Rise in Northeast US extreme precipitation caused by Atlantic variability and climate change, Weather and Climate Extremes, 33, 100351, https://doi.org/10.1016/j.wace.2021.100351, 2021.
Jane, R., Cadavid, L., Obeysekera, J., and Wahl, T.: Multivariate statistical modelling of the drivers of compound flood events in south Florida, Nat. Hazards Earth Syst. Sci., 20, 2681–2699, https://doi.org/10.5194/nhess-20-2681-2020, 2020.
Jane, R., Wahl, T., Santos, V. M., Misra, S. K., and White, K. D.: Assessing the potential for compound storm surge and extreme river discharge events at the catchment scale with statistical models: sensitivity analysis and recommendations for best practice, J. Hydrol. Eng., 27, 04022001, https://doi.org/10.1061/(ASCE)HE.1943-5584.0002154, 2022.
Joe, H.: Dependence modeling with copulas, CRC Press, https://doi.org/10.1201/b17116, 2014.
Jordi, A., Georgas, N., Blumberg, A., Yin, L., Chen, Z., Wang, Y., Schulte, J., Ramaswamy, V., Runnels, D., and Saleh, F.: A next generation coastal ocean operational system: probabilistic flood forecasting at street scale, B. Am. Meteorol. Soc., 100, 41–54, https://doi.org/10.1175/BAMS-D-17-0309.1, 2019.
Kendall, M. G.: A new measure of rank correlation, Biometrika, 30, 81–93, https://doi.org/10.1093/biomet/30.1-2.81, 1938.
Kim, H., Villarini, G., Jane, R., Wahl, T., Misra, S., and Michalek, A.: On the generation of high-resolution probabilistic design events capturing the joint occurrence of rainfall and storm surge in coastal basins, Int. J. Climatol., 43, 761–771, https://doi.org/10.1002/joc.7825, 2023.
Kojadinovic, I. and Yan, J.: Modeling multivariate distributions with continuous margins using the copula R package, J. Stat. Softw., 34, 1–20, https://doi.org/10.18637/jss.v034.i09, 2010.
Lai, Y., Li, J., Gu, X., Liu, C., and Chen, Y. D.: Global compound floods from precipitation and storm surge: Hazards and the roles of cyclones, J. Climate, 34, 8319–8339, https://doi.org/10.1175/JCLI-D-21-0050.1, 2021.
Lai, Y., Li, J., Chen, Y. D., Chan, F. K. S., Gu, X., and Huang, S.: Compound floods in Hong Kong: Hazards, triggers, and socio-economic consequences, Journal of Hydrology: Regional Studies, 46, 101321, https://doi.org/10.1016/j.ejrh.2023.101321, 2023.
Landsea, C. W. and Franklin, J. L.: Atlantic hurricane database uncertainty and presentation of a new database format, Mon. Weather. Rev., 141, 3576–3592, https://doi.org/10.1175/MWR-D-12-00254.1, 2013.
Lin, N., Emanuel, K., Smith, J., and Vanmarcke, E.: Risk assessment of hurricane storm surge for New York City, J. Geophys. Res, 115, D18121, https://doi.org/10.1029/2009JD013630, 2010.
Lin, L., Liu, Z., Xie, L., Gao, H., Cai, Z., Chen, Z., and Zhao, J.: Dynamics governing the response of tidal current along the mouth of Jiaozhou Bay to land reclamation, J. Geophys. Res.-Oceans, 120, 2958–2972, https://doi.org/10.1002/2014JC010434, 2015.
Lucey, J. T. D. and Gallien, T. W.: Characterizing multivariate coastal flooding events in a semi-arid region: the implications of copula choice, sampling, and infrastructure, Nat. Hazards Earth Syst. Sci., 22, 2145–2167, https://doi.org/10.5194/nhess-22-2145-2022, 2022.
Mazdiyasni, O., Sadegh, M., Chiang, F., and AghaKouchak, A.: Heat wave Intensity Duration Frequency Curve: A Multivariate Approach for Hazard and Attribution Analysis, Sci. Rep.-UK, 9, 14117, https://doi.org/10.1038/s41598-019-50643-w, 2019.
Mita, K. S., Orton, P., Montalto, F., Saleh, F., and Rockwell, J.: Sea Level Rise-Induced Transition from Rare Fluvial Extremes to Chronic and Compound Floods, Water-Sui., 15, 2671, https://doi.org/10.3390/w15142671, 2023.
Moftakhari, H., Schubert, J. E., AghaKouchak, A., Matthew, R. A., and Sanders, B. F.: Linking statistical and hydrodynamic modeling for compound flood hazard assessment in tidal channels and estuaries, Adv. Water Resour., 128, 28–38, https://doi.org/10.1016/j.advwatres.2019.04.009, 2019.
Moftakhari, H. R., Salvadori, G., AghaKouchak, A., Sanders, B. F., and Matthew, R. A.: Compounding effects of sea level rise and fluvial flooding, P. Natl. Acad. Sci. USA, 114, 9785–9790, https://doi.org/10.1073/pnas.1620325114, 2017.
Najibi, N., Devineni, N., and Lall, U.: Compound continental risk of multiple extreme floods in the United States, Geophys. Res. Lett., 50, e2023GL105297, https://doi.org/10.1029/2023GL105297, 2023.
National Centers for Environmental Information: VORTEX2: Automated Surface Observing Systems (ASOS) 1-minute Data. Version 1.0, UCAR/NCAR [data set], https://doi.org/10.26023/PN6M-3PYC-WP0D, 2011.
National Hurricane Center: HURDAT2 Atlantic and Eastern North Pacific Best Track Data, National Hurricane Center [data set], https://www.nhc.noaa.gov/data/ (last access: 12 July 2025), 2025.
Nelsen, R. B.: Properties and applications of copulas: A brief survey, in: Proceedings of the First Brazilian Conference on Statistical Modelling in Insurance and Finance, Ubatuba 1–6 September 2003, São Paulo, Brazil, 10–28 pp., University Press USP, https://www.matematica.unito.it/didattica/att/d11d.7507.file.pdf (last access: 16 July 2025), 2003.
Nelsen, R. B.: An introduction to copulas, Springer, https://doi.org/10.1007/0-387-28678-0, 2006.
NYC: New York City Stormwater Resiliency Plan, https://www.nyc.gov/assets/orr/pdf/publications/stormwater-resiliency-plan.pdf (last access: 16 July 2025), 2021.
O'Donnell, J. and O'Donnell, J. E.: Coastal vulnerability in Long Island Sound: The spatial structure of extreme sea level statistics, in: Proceedings of the OCEANS 2012 MTS/IEEE Conference: Harnessing the Power of the Ocean, Hampton Roads (Norfolk/Virginia Beach), Virginia, IEEE, 1–4, https://doi.org/10.1109/OCEANS.2012.6405099, 2012.
Orton, P., Georgas, N., Blumberg, A., and Pullen, J.: Detailed modeling of recent severe storm tides in estuaries of the New York City region, J. Geophys. Res., 117, C09030, https://doi.org/10.1029/2012JC008220, 2012.
Orton, P., Talke, S. A., Jay, D. A., Yin, L., Blumberg, A. F., Georgas, N., Zhao, H., Roberts, H. J., and MacManus, K.: Channel Shallowing as Mitigation of Coastal Flooding, Journal of Marine Science and Engineering, 3, 654–673, https://doi.org/10.3390/jmse3030654, 2015.
Orton, P., Hall, T., Talke, S., Blumberg, A. F., Georgas, N., and Vinogradov, S.: A Validated Tropical-Extratropical Flood Hazard Assessment for New York Harbor, J. Geophys. Res., 121, 8904–8929, https://doi.org/10.1002/2016JC011679, 2016.
Orton, P., Ralston, D., van Prooijen, B., Secor, D., Ganju, N., Chen, Z., Fernald, S., Brooks, B., and Marcell, K.: Increased utilization of storm surge barriers: A research agenda on estuary impacts, Earth's Future, 11, e2022EF002991, https://doi.org/10.1029/2022EF002991, 2023.
Pachauri, R. K. and Reisinger, A.: IPCC fourth assessment report, IPCC, Geneva, 044023, ISBN 978-0521-880012, 2007.
Paprotny, D., Vousdoukas, M. I., Morales-Nápoles, O., Jonkman, S. N., and Feyen, L.: Compound flood potential in Europe, Hydrol. Earth Syst. Sci. Discuss. [preprint], https://doi.org/10.5194/hess-2018-132, 2018.
Resio, D. T., Boc, S. J., Borgman, L. E., Cardone, V. J., Dean, R. G., Ratcliff, J. J., Vickery, P. J., Suhayda, J. N., and Westerink, J. J.: White paper on estimating hurricane inundation probabilities, U.S. Army Corps of Engineers, Engineer Research and Development Center, Coastal and Hydraulics Laboratory, Technical Report Number: ERDC/CHL–TR-07-10, 2007.
Roch, O. and Alegre, A.: Testing the bivariate distribution of daily equity returns using copulas. An application to the Spanish stock market, Comput. Stat. Data An., 51, 1312–1329, https://doi.org/10.1016/j.csda.2005.11.007, 2006.
Rosenzweig, B. R., McPhillips, L., Chang, H., Cheng, C., Welty, C., Matsler, M., Iwaniec, D., and Davidson, C. I.: Pluvial flood risk and opportunities for resilience, WIRes Water, 5, e1302, https://doi.org/10.1002/wat2.1302, 2018.
Rosenzweig, B., Montalto, F.A., Orton, P., Kaatz, J., Maher, N., Kleyman, J., Chen, Z., Sanderson, E., Adhikari, N., McPhearson, T., and Herreros‐Cantis, P.: NPCC4: Climate change and New York City's flood risk, Ann. NY Acad. Sci., 1539, 127–184, https://doi.org/10.1111/nyas.15175, 2024.
Sadegh, M., Ragno, E., and AghaKouchak, A.: Multivariate Copula Analysis Toolbox (MvCAT): describing dependence and underlying uncertainty using a Bayesian framework, Water Resour. Res., 53, 5166–5183, https://doi.org/10.1002/2016WR020242, 2017.
Sadegh, M., Moftakhari, H., Gupta, H. V., Ragno, E., Mazdiyasni, O., Sanders, B., Matthew, R., and AghaKouchak, A.: Multihazard scenarios for analysis of compound extreme events, Geophys. Res. Lett., 45, 5470–5480, https://doi.org/10.1029/2018GL077317, 2018 (code available at: https://amir.eng.uci.edu/MhAST.php, last access: 12 July 2025).
Salvadori, G. and De Michele, C.: Frequency analysis via copulas: Theoretical aspects and applications to hydrological events, Water Resour. Res., 40, W12511, https://doi.org/10.1029/2004WR003133, 2004.
Salvadori, G., Tomasicchio, G., and D'Alessandro, F.: Practical guidelines for multivariate analysis and design in coastal and off-shore engineering, Coast. Eng., 88, 1–14, https://doi.org/10.1016/j.coastaleng.2014.01.011, 2014.
Sarhadi, A., Rousseau-Rizzi, R., Mandli, K., Neal, J., Wiper, M. P., Feldmann, M., and Emanuel, K.: Climate change contributions to increasing compound flooding risk in New York City, B. Am. Meteorol. Soc., 105, E337–E356, https://doi.org/10.1175/BAMS-D-23-0177.1, 2024.
Schmidt, R. and Stadtmüller, U.: Non-parametric estimation of tail dependence, Scand. J. Stat., 33, 307–335, 2006.
Schureman, P.: Manual of harmonic analysis and prediction of tides, US Department of Commerce, Coast and Geodetic Survey, https://www.govinfo.gov/content/pkg/CZIC-vk943-u7-y3/pdf/CZIC-vk943-u7-y3.pdf (last access: 16 July 2025), 1994.
Sklar, M. J.: Fonctions de repartition a n dimensions et leurs marges, Université Paris, 229–231, CRID 1573387449735953792, 1959.
Smith, B. and Rodriguez, S.: Spatial analysis of high-resolution radar rainfall and citizen-reported flash flood data in ultra-urban New York City, Water-Sui., 9, 736, https://doi.org/10.3390/w9100736, 2017.
Talke, S., Orton, P., and Jay, D.: Increasing storm tides at New York City, 1844–2013, Geophys. Res. Lett., 41, 3149–3155, https://doi.org/10.1002/2014GL059574, 2014.
Tootoonchi, F., Sadegh, M., Haerter, J. O., Räty, O., Grabs, T., and Teutschbein, C.: Copulas for hydroclimatic analysis: A practice-oriented overview, WIRes Water, 9, e1579, https://doi.org/10.1002/wat2.1579, 2022.
Torre, E., Marelli, S., Embrechts, P., and Sudret, B.: A general framework for data-driven uncertainty quantification under complex input dependencies using vine copulas, Probabilist. Eng. Mech., 55, 1–16, https://doi.org/10.1016/j.probengmech.2018.08.001, 2019.
Villarini, G. and Vecchi, G. A.: Projected increases in North Atlantic tropical cyclone intensity from CMIP5 models, J. Climate, 26, 3231–3240, https://doi.org/10.1175/JCLI-D-12-00441.1, 2013.
Villarini, G., Smith, J. A., Serinaldi, F., Bales, J., Bates, P. D., and Krajewski, W. F.: Flood frequency analysis for nonstationary annual peak records in an urban drainage basin, Adv. Water Resour., 32, 1255–1266, https://doi.org/10.1016/j.advwatres.2009.05.003, 2009.
Wahl, T., Jensen, J., and Mudersbach, C.: A multivariate statistical model for advanced storm surge analyses in the North Sea, Proceedings of the 32nd International Conference on Coastal Engineering, 29 August–3 September 2010, Shanghai, China, 1, currents-19, https://doi.org/10.9753/icce.v32.currents.19, 2010.
Wahl, T., Mudersbach, C., and Jensen, J.: Assessing the hydrodynamic boundary conditions for risk analyses in coastal areas: a multivariate statistical approach based on Copula functions, Nat. Hazards Earth Syst. Sci., 12, 495–510, https://doi.org/10.5194/nhess-12-495-2012, 2012.
Wahl, T., Jain, S., Bender, J., Meyers, S. D., and Luther, M. E.: Increasing risk of compound flooding from storm surge and rainfall for major US cities, Nat. Clim. Change, 5, 1093–1097, https://doi.org/10.1038/nclimate2736, 2015.
Ward, P. J., Jongman, B., Weiland, F. S., Bouwman, A., van Beek, R., Bierkens, M. F., Ligtvoet, W., and Winsemius, H. C.: Assessing flood risk at the global scale: model setup, results, and sensitivity, Environ. Res. Lett., 8, 044019, https://doi.org/10.1088/1748-9326/8/4/044019, 2013.
Ward, P. J., Couasnon, A., Eilander, D., Haigh, I. D., Hendry, A., Muis, S., Veldkamp, T. I., Winsemius, H. C., and Wahl, T.: Dependence between high sea-level and high river discharge increases flood hazard in global deltas and estuaries, Environ. Res. Lett., 13, 084012, https://doi.org/10.1088/1748-9326/aad400, 2018.
Wuertz, D., Lawrimore, J., and Korzeniewski, B.: Cooperative Observer Program (COOP) Hourly Precipitation Data (HPD), Version 2.0, NOAA National Centers for Environmental Information [data set], https://doi.org/10.25921/p7j8-2170 (last access: 12 July 2025), 2018.
Xu, H., Ragno, E., Jonkman, S. N., Wang, J., Bricker, J. D., Tian, Z., and Sun, L.: Combining statistical and hydrodynamic models to assess compound flood hazards from rainfall and storm surge: a case study of Shanghai, Hydrol. Earth Syst. Sci., 28, 3919–3930, https://doi.org/10.5194/hess-28-3919-2024, 2024.
Yang, S., Lao, V., Bankert, R., Whitcomb, T. R., and Cossuth, J.: Improved Climatology of Tropical Cyclone Precipitation from Satellite Passive Microwave Measurements, J. Climate, 34, 4521–4537, https://doi.org/10.1175/JCLI-D-20-0196.1, 2021.
Zscheischler, J., Westra, S., Van Den Hurk, B. J., Seneviratne, S. I., Ward, P. J., Pitman, A., AghaKouchak, A., Bresch, D. N., Leonard, M., and Wahl, T.: Future climate risk from compound events, Nat. Clim. Change, 8, 469–477, https://doi.org/10.1038/s41558-018-0156-3, 2018.