the Creative Commons Attribution 4.0 License.
the Creative Commons Attribution 4.0 License.
 | 25 Jul 2024
Machine-learning-constrained projection of bivariate hydrological drought magnitudes and socioeconomic risks over China
Rutong Liu
Louise Slater
Shengyu Kang
Yuanhang Yang
Jiali Guo
Xiang Zhang
Aliaksandr Volchak
Climate change influences the water cycle and alters the spatiotemporal distribution of hydrological variables, thus complicating the projection of future streamflow and hydrological droughts. Although machine learning is increasingly employed for hydrological simulations, few studies have used it to project hydrological droughts, not to mention bivariate risks (referring to drought duration and severity) as well as their socioeconomic effects under climate change. We developed a cascade modeling chain to project future bivariate hydrological drought characteristics in 179 catchments over China, using five bias-corrected global climate model (GCM) outputs under three shared socioeconomic pathways (SSPs), five hydrological models, and a deep-learning model. We quantified the contribution of various meteorological variables to daily streamflow by using a random forest model, and then we employed terrestrial water storage anomalies and a standardized runoff index to evaluate recent changes in hydrological drought. Subsequently, we constructed a bivariate framework to jointly model drought duration and severity by using copula functions and the most likely realization method. Finally, we used this framework to project future risks of hydrological droughts as well as the associated exposure of gross domestic product (GDP) and population. Results showed that our hybrid hydrological–deep-learning model achieved > 0.8 Kling–Gupta efficiency in 161 out of the 179 catchments. By the late 21st century, bivariate drought risk is projected to double over 60 % of the catchments mainly located in southwestern China under SSP5-85, which shows the increase in drought duration and severity. Our hybrid model also projected substantial GDP and population exposure by increasing bivariate drought risks, suggesting an urgent need to design climate mitigation strategies for a sustainable development pathway.
- Article
(15039 KB) - Full-text XML
-
Supplement
(499 KB) - BibTeX
- EndNote


In a warming world, the change in the global water cycle is expected to alter the regional and seasonal distribution of key hydrological variables such as precipitation and evapotranspiration (Allan et al., 2020; Yin et al., 2023b). As precipitation patterns are particularly sensitive to changes in atmospheric forcing and local conditions, precipitation extremes are generally increasing globally, exacerbating the spatial heterogeneity of precipitation (Donat et al., 2016; Tabari, 2020). A suite of shared socioeconomic pathways (SSPs) has been proposed to simulate different possible future scenarios of social responses to climate change, and these are employed to investigate the possible effects of long-term climate change (Meinshausen et al., 2020; Zhang et al., 2021). By using the SSP framework, numerous works have indicated that the redistribution of precipitation may lead to a decline in water storage in some regions and intensify water scarcity in arid regions (Sönmez and Kale, 2018; Woolway et al., 2020; Yao et al., 2023). With increasing atmospheric greenhouse gases, numerous studies have reported a widespread increase in drought events, even in areas with increasing annual runoff (Dai et al., 2018). The rapidly changing distribution of precipitation and other meteorological elements under climate change complicates projection of future runoff and drought.
China's socioeconomic development, particularly of its agricultural sector, is threatened by the rapid intensification of extreme hazards under climate change (Piao et al., 2010). Over the past few years, China has been hit by severe drought events which have caused considerable damage to ecosystem productivity and socioeconomic growth (Yin et al., 2023a; Zhai and Zou, 2005). For instance, one extreme drought in Sichuan Province in 2022 resulted in power shortages and led to economic losses of USD 669 million. Water shortage is also a key challenge that hinders the sustainable development of the North China Plain (Chen and Yang, 2013). Over the period of 1985–2014, drought accounted for about 19 % of economic losses from all meteorological hazards (Chen and Sun, 2019). With continuing global warming, the economic losses from severe drought events might increase by over USD 10 billion per year by the late 21st century, underscoring the importance of projecting future droughts over China (Lu et al., 2023).
Droughts can be triggered by divergent mechanisms and are thus distinguished according to the type of drought, such as meteorological or hydrological drought (Yihdego et al., 2019). The majority of studies have focused on meteorological droughts, which can then be translated to a hydrological drought, while fewer works have focused on hydrological drought, probably due to a lack of measurements like in the standardized runoff index (SRI) (Barker et al., 2016; Kumar et al., 2016; Tirivarombo et al., 2018). Furthermore, hydrological droughts are affected not only by the water cycle, but also by human interventions, which makes them difficult to predict accurately (Wu et al., 2021). Currently, the majority of drought impact assessments focus on the investigation of individual drought variables (i.e., drought duration, severity, and intensity) through univariate probabilistic models and stochastic theory (Byakatonda et al., 2018; Myronidis et al., 2018; Zhang et al., 2022). However, univariate drought analysis cannot accurately describe the probability of drought events, because droughts of either long duration or severe intensity can lead to substantial socio-ecosystem damages (Castle et al., 2014; Udall and Overpeck, 2017). Therefore, the bivariate framework based on copula functions has been developed for drought projection, compensating for the incompleteness of a single-variable analysis (Ayantobo et al., 2017; Nabaei et al., 2019). At present, studies on hydrological drought within a bivariate framework are still lacking. Beyond the choice of approach (univariate or bivariate), the Gravity Recovery and Climate Experiment (GRACE) and GRACE Follow-On (GRACE-FO) satellites now provide 2 decades of large-scale terrestrial water storage (TWS) data, which capture the water deficit in various forms on land and which can be used to monitor droughts (Schmidt et al., 2006). The drought severity index based on TWS (TWS-DSI) can be used to monitor past drought events and also shows potential advantages in drought warning, forecasting, and projection (Nie et al., 2018; Pokhrel et al., 2021).
In recent decades, many studies have used bias-corrected outputs from global climate models (GCMs) to project future hydrological drought scenarios (e.g., Ashrafi et al., 2020; Dixit et al., 2022; Kim et al., 2021). The growing application of machine learning has revealed a high potential for improving the accuracy of hydrological simulation and prediction (Mokhtar et al., 2021). In recent years, many machine learning algorithms have been adopted in drought simulation and have produced good performance, such as wavelet neural networks (WNNs) (Xiujia et al., 2022), support vector machines (SVMs) (Zhu et al., 2021), and long short-term memory (LSTM) neural networks (Dikshit et al., 2021a). These algorithms can be used to simulate the evolution of future droughts and construct risk maps for drought contingency planning (Rahmati et al., 2020). Among the different models, the LSTM can effectively simulate short-term and long-term streamflow series, and their performances have been validated at short temporal scales (Dikshit et al., 2021b; Kang et al., 2023).
In this study, we project changes in bivariate hydrological drought characteristics (duration and severity) and their associated socioeconomic risks under three SSPs (i.e., SSP1-26, SSP3-70, and SSP5-85) over 179 catchments in China. To achieve this, we combine five hydrological models and a deep-learning model (i.e., the LSTM) and then drive the hybrid models with the five bias-corrected GCM outputs in the sixth phase of the Coupled Model Intercomparison Project (CMIP6). Then, we employ a machine-learning-based framework (i.e., a random forest (RF) model) to quantify the sensitivity of daily streamflow to different meteorological variables. We employ the run theory and two drought metrics, the SRI and TWS-DSI, to identify and explore recent changes in drought characteristics. In addition, we use copula functions to build the bivariate model of drought duration and severity during both the reference and future periods. After identifying shifts in bivariate drought characteristics based on the most likely realization approach, we project the exposure of the gross domestic product (GDP) and population to increasing drought risks in the future. Finally, we decompose the uncertainties arising from different sources by employing the multivariate analysis of variance (MANOVA) method. This study illustrates the used materials and methods in Sects. 2 and 3, respectively. We compare the SRI and TWS-DSI when assessing drought conditions in Sect. 4.1. The contributions of meteorological factors to simulating streamflow and calibrating hybrid terrestrial models are shown in Sect. 4.2. The evolution of univariate droughts is projected in Sect. 4.3. The bivariate droughts of future scenarios and the associated socioeconomic exposures are evaluated in Sect. 4.4. We discuss the uncertainty of our analysis and the main limitations of this study in Sect. 5 and finally summarize our work in Sect. 6.
The workflow of this study is divided into four modules (Fig. 1) described briefly below and detailed in the following sections. In step 1, the hydrological models and LSTM are trained using the ERA5-Land dataset, and then the output of hydrological models (HMs) is used as input to feed the LSTM. Thus we build hybrid terrestrial models (HTMs). In step 2, the trained HTMs are validated using in situ streamflow observations and are then driven by using the outputs of five GCMs from CMIP6 to project streamflow and the SRI series. In step 3, monthly drought characteristics (i.e., drought duration and severity) are defined using run theory and combined with copula functions to construct a bivariate drought framework. Future bivariate drought change is evaluated using the most likely realization method. Meanwhile, the TWS measurements from GRACE missions are also employed to characterize recent changes in TWS-based droughts, which are also compared with the hydrological droughts. In step 4, we employ future scenarios of GDP and population alongside our future drought projections to produce a socioeconomic assessment of drought exposure over China. Finally, we examine the contribution of uncertainty from different sources in projecting drought change and exposure.
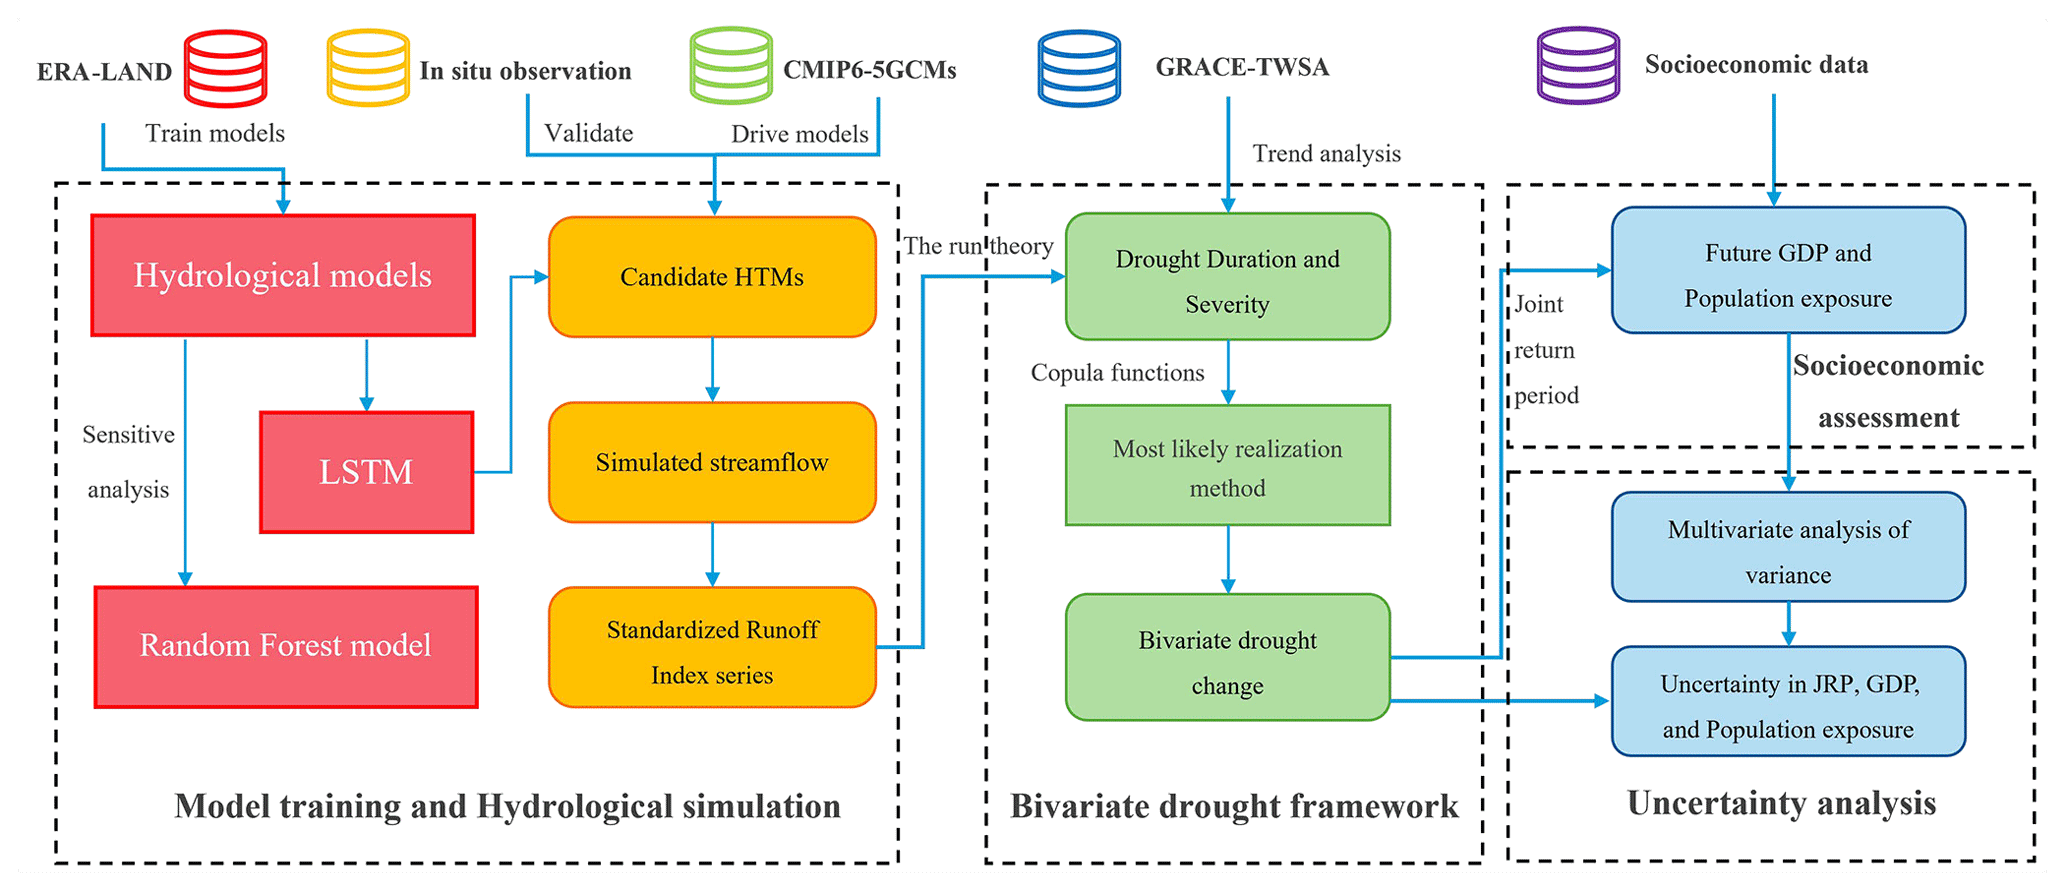
Figure 1Schematic flowchart of the method, including machine learning (ML)-constrained hydrological simulations, evaluation of bivariate hydrological drought characteristics and change, and socioeconomic evaluation of drought exposure under climate change.
2.1 Derivation of 2 m relative and specific humidity
As relative humidity and specific humidity are not directly available from the ERA5-Land dataset, we estimate these two variables based on the physical relationship in the atmosphere. The Clausius–Clapeyron relationship is used to derive saturated vapor pressure (es) and air temperature (T) and is expressed as follows (Koutsoyiannis, 2012):
where T0, e0, L0, and R0 are the freezing temperature in Kelvin, the saturated vapor pressure at the freezing temperature, the latent heat of vaporization, and the gas constant of water vapor (with values of 273.15 K, 611 Pa, 2.5 × 10⁶ J kg−1, and 461 , respectively).
Since near-surface relative humidity (RH) cannot be directly obtained from the ERA5-Land dataset, the 2 m temperature (T2 m) and dew-point temperature (Td) are substituted into Eq. (1) to calculate RH:
Then, the near-surface air pressure (ps) and Td are used to deduce the specific humidity (SH), which is mathematically expressed as follows (Simmons et al., 1999):
2.2 Sensitivity analysis of meteorological variables for runoff
The RF model (Catani et al., 2013) is used to calculate the sensitivity of runoff to different meteorological variables, including precipitation (pr), air pressure (ps), surface downwelling shortwave and longwave radiation (srsds and srlds), RH, SH, average temperature, and maximum and minimum temperature. The contribution of a key variable is derived by using the pre-established model, the perturbed meteorological variable, and the remaining (non-perturbed) variables (Antoniadis et al., 2021; Green et al., 2020). The percentage change in streamflow is derived from the following equation:
where Si indicates the sensitivity of streamflow to the ith meteorological variables, which are pr, ps, SH, RH, srlds, srsds, and temperature. Robs is the observation of streamflow (m3 s−1). R(i+1SD) is the streamflow simulated by perturbing i by +1SD. R(all) is the streamflow simulated by all the meteorological variables. stdev(Robs) represents the standard deviation of Robs.
2.3 Deep-learning-constrained hydrological modeling
2.3.1 Conceptual hydrological models
For preliminary hydrological simulations, we select five hydrological models to represent hydrological characteristics in different environments. GR4J (Génie Rural à 4 paramètres Journalier) is a lumped model with four parameters developed by Perrin et al. (2003). It consists of two water storage modules (runoff yielding and routing) and uses daily rainfall and evapotranspiration as inputs to simulate streamflow series (Kunnath-Poovakka and Eldho, 2019). This model has been successfully used to simulate hybrid runoff processes on many continents (Gu et al., 2023; Shin and Kim, 2021). Additionally, we use a temperature-based method (Oudin et al., 2005) to estimate the potential evapotranspiration of the GR4J model.
The HBV (Hydrologiska Byråns Vattenbalansavdelning) model was initially developed by the Swedish Meteorological and Hydrological Institute for Hydrological Forecasting (Bergström and Forsman, 1973). This model includes five modules and one transform function to quantify hydrological variables (i.e., precipitation, snow, soil moisture, runoff, and baseflow) (Bergström, 1995). It has been employed widely to simulate streamflow, and it has a particularly good capacity for simulating snowmelt runoff (Kriauciuniene et al., 2013).
HMETS (Hydrological Model of École de technologie supérieure) contains 21 parameters and two reservoirs (i.e., the saturated and vadose zones) and is considered to efficiently complete hydrological simulation on limited scales (Martel et al., 2017). The model can simulate six processes in the water cycle, including the accumulation, melt, and refreezing of snow, water infiltration and routing, and evapotranspiration (Qi et al., 2020). It has been widely used for streamflow simulation under climate change and has shown great performance (Chen et al., 2018).
The SIMHYD (simple lumped conceptual daily rainfall-runoff) model is a daily rainfall-runoff model developed by Porter and McMahon (1975). There are four types of water fluxes from different sources: impervious areas, infiltration, interflow, and groundwater storage (Chiew et al., 2002). Although the model was developed earlier, it has shown good accuracy in simulating runoff over China (Yu and Zhu, 2015).
The XAJ (Xinanjiang) model is a hydrological model, which can usually achieve better performance in humid and semi-humid areas than in arid areas (Ren-Jun, 1992). As the model was developed based on the underlying surface of the Yangtze River Basin in China, it is composed of a three-layer evapotranspiration module with four parameters and separates the runoff into four components (i.e., surface water, groundwater, interflow water, and flow routing) (Tian et al., 2013). To date, it has been widely reported that the XAJ model usually shows great performance in simulating hydrological conditions in China (Hu et al., 2005; Jiang et al., 2007). However, due to inadequacies in the simulation of arid regions, the results of the XAJ model were not considered the best option in northern China.
We used the SCE (shuffled complex evolution) approach to maximize the objective function (i.e., the Kling–Gupta efficiency) to optimize these models (Duan et al., 1992). The most complete 20-year observation period is selected to calibrate five models in each watershed using a daily time step. To calibrate the hydrological models, a cross-validation method developed by Arsenault et al. (2017) is used for calibration, which employs the odd years of the data to calibrate the models and the even years of the data to validate them. As the catchments are located in different climatic regions, the parameters of the models are calibrated for each catchment, which means that the parameters are not universal. Although the uncertainties shown by the hydrological models are ineradicable, the overall uncertainty is acceptable on the current scale after optimizing the five hydrological models for each catchment.
2.3.2 Hybrid scheme of hydrological model and machine learning
Recurrent neural network (RNN) models have had considerable success in hydrological modeling (Cho et al., 2014; Sherstinsky, 2020). However, when considering long input sequences, RNNs struggle to capture the relationships between distant points due to a phenomenon known as “long-term dependencies” (Yu et al., 2019). With the development of deep learning, this problem can be successfully avoided by using LSTMs.
An LSTM cell includes input, output, and forget gates. The input gate determines which new information can be stored in the cell state, and the forget gate identifies which information will be discarded from the cell state. The output gate controls which part of the cell state is selected as the output. The updated cell state is a combination of the information retailed and the new information to be added. By using this architecture, the LSTM can avoid the problem of gradient vanishing or explosion during backpropagation, especially when a series is long (Gers et al., 2000). The LSTM can be expressed as follows:
where xt, fgt, igt, and ogt are input variables and forget, input, and output gates at time t. W⋅ are the weights, where Wi, , Wf, and Wo are the weights of each gate, Wx⋅ are the weights of each gate at time t, and Wh⋅ are the weights of each gate at the former time t−1. The operator ⊙ is the symbol for the dot product of two vectors. ct and hst are the cell state of the LSTM and the hidden unit at time t, respectively, and ct−1 and hst−1 are at the former time t−1. is the activation function of the hidden layer. bi, bf, bo, and bc are bias items, and σ(⋅) and tanh(⋅) are the sigmoid function and the hyperbolic tangent function, respectively. At the initial moment, cell and hidden states are set to zero arrays.
The hydrological outputs together with other climate variables are used as inputs to feed the LSTM model (i.e., the LSTM is thus constrained by the HMs). Because changes in meteorological variables require some time to converge before they are reflected in the runoff, it is essential to calculate the lag time caused by the flow convergence for the model. The catchment response lag time d is defined as the time during which precipitation accumulates in the river to generate runoff for the gauge downstream, and this is expressed mathematically as follows (Berne et al., 2004; Ganguli and Merz, 2019):
where Ad (km2) represents the catchment area. Meteorological variables from day T−d to day T are employed to drive HTMs.
We combine the five hydrological models with LSTM to construct five HTMs. To compare the performance of these HTMs, we use 10 HTMs as candidates for streamflow simulation in each catchment. The calibrated HTMs are then driven by the outputs of five GCMs under each SSP (aggregated to produce a basin average series) during 1985–2100 over 179 catchments to project future daily streamflow.
2.4 Drought indexes and run theory
The TWS-DSI is employed to measure the degree of terrestrial drought severity (Zhao et al., 2017). It is a dimensionless standardized water storage anomaly index that can indicate terrestrial drought conditions when below the mean standard value. The TWS-DSI can be expressed mathematically as follows:
where TWSx,y is the TWS at year x and month y. and σy represent the means and standard deviation of TWS at month y.
The SRI is a measure of the variability of runoff for a given duration based on the percentage of accumulated runoff (Shukla and Wood, 2008). The hydrological drought classification and ranges indicated by the SRI are shown in Table S1 in the Supplement. To calculate the SRI, we simulate the retrospective time series of streamflow and fit the sample series to a probability distribution. The SRI is considered to follow a Pearson type-III distribution (Vicente-Serrano et al., 2012) and is calculated as follows:
where . F(x) is the cumulative probability density of the SRI. c0, c1, c2, d1, d2, and d3 are the empirical constants, taken as 2.516, 0.803, 0.010, 1.433, 0.189, and 0.001 separately.
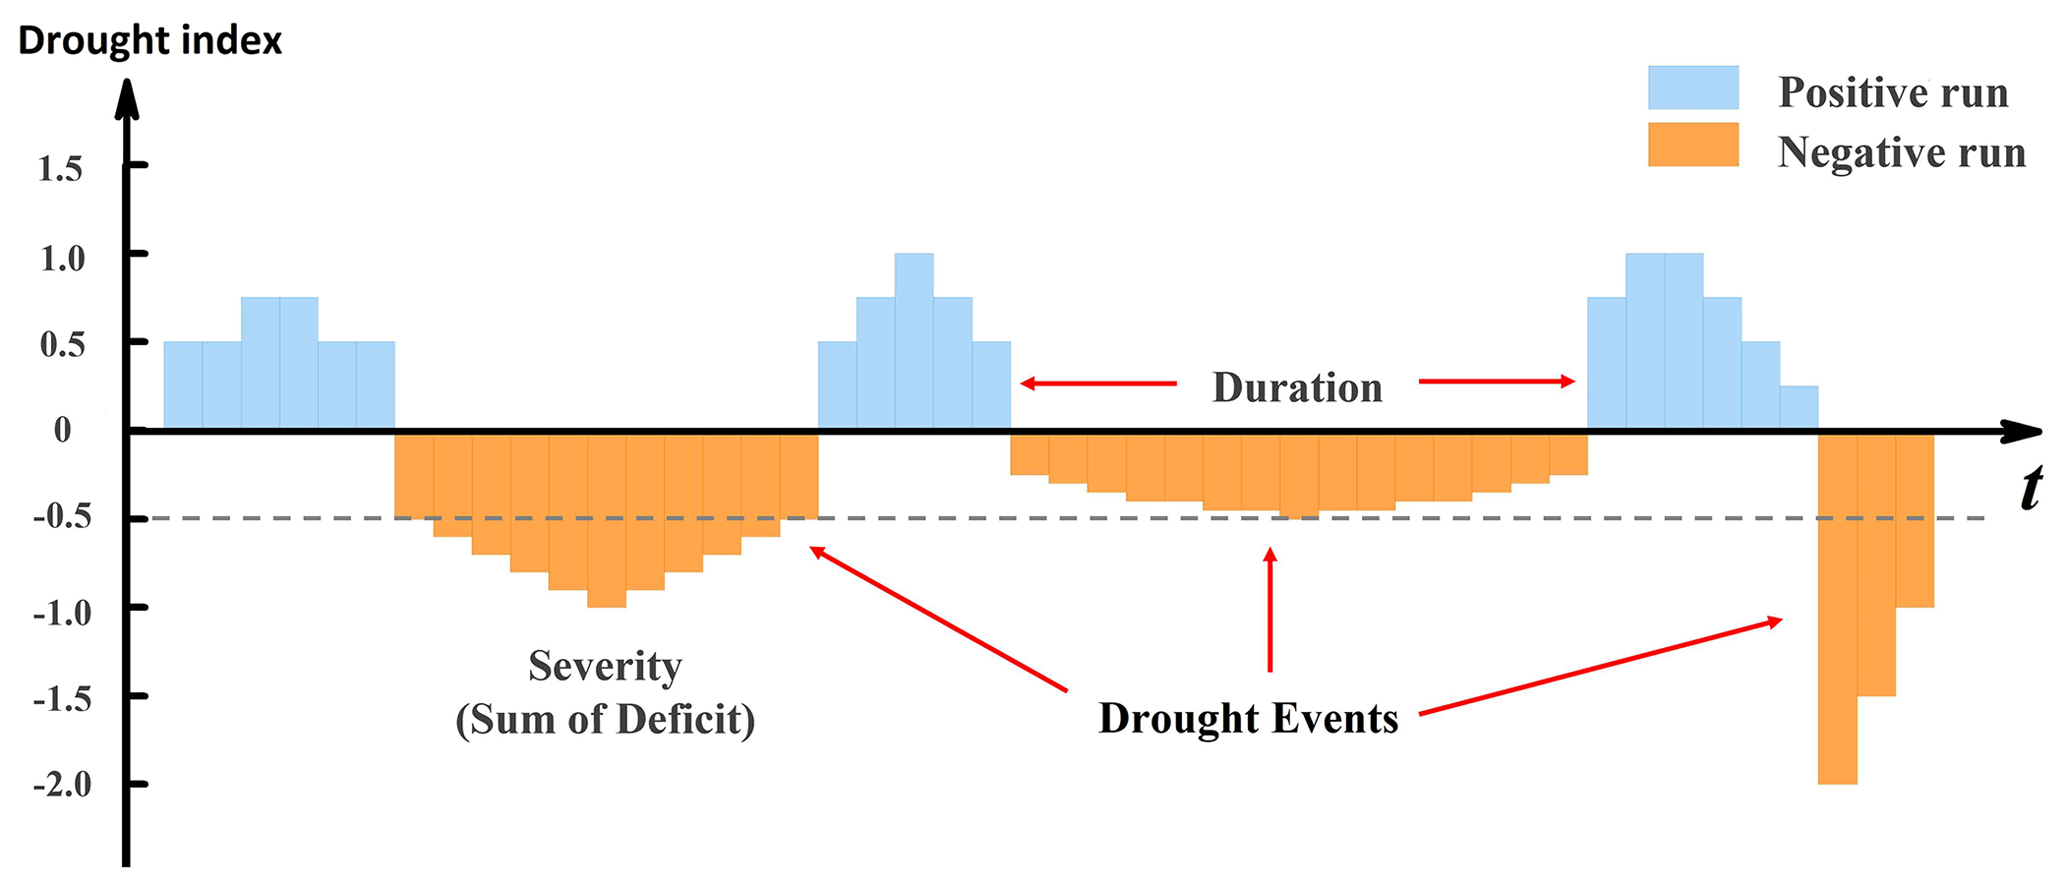
Figure 2Drought duration and severity identification based on the run theory, where −0.5 denotes the drought threshold (grey dashed line).
After calculating the two drought indexes, the degree of water deficit can be determined according to the Grades of Meteorological Drought and the previous classification (Dikici, 2020). Table S1 presents the drought classification and thresholds used to identify the drought degrees. The run theory is employed to obtain characteristics of drought events from the time series (Yevjevich, 1967). When the drought index is below a mild drought (i.e., drought index), a drought event is detected (Fig. 2), and then the drought duration and drought severity are extracted.
2.5 Socioeconomic exposure assessments based on the copulas and the most likely realization
To integrate the assessment of drought change arising from the duration and severity under climate change, we employed a copula framework by constructing the joint probability distribution of two variables. After extracting the drought duration (D) and severity (S), we fit their marginal distributions with the seven distributions shown in Table S2. The OR case (i.e., where a bivariate drought event is identified with either high severity or long duration) of the joint return period (JRP) in a copula-based framework is used to quantify the occurrence of drought events (Yin et al., 2020). The joint distribution of drought duration and severity is constructed by using a copula function, which is valuable for describing correlated hydrological variables (Li, 1999). Unlike univariate drought frequency analysis, the JRP within a bivariate framework can be represented by an isoline, which contains infinite combinations of values of these two multivariate arrays of variables. It is important for risk assessments to select a representative combination along the isoline. Previous studies have only selected joint design values according to the same frequency hypothesis that considering two correlated variables follows the same cumulative probability in their distributions, but this approach lacks a statistical basis and poorly describes the physical characteristics of droughts (Yin et al., 2018). In this paper, the joint probability density is used to optimize the most likely realization (Fig. 3), which is expressed mathematically as follows:
where c[Fd,Fs] is the copula probability density function; fd and fs are the fitted probability density functions of D and S, respectively; Fd and Fs are the marginal distributions of D and S, respectively; is the most likely realization under a given JRP Tor; and μ is the mean interarrival time between two consecutive droughts.
The future socioeconomic exposure after the 2020s has been defined directly as ranging from 0 % to 100 % (Gu et al., 2020a), but dynamically shifting climate risks cannot be represented under this definition without considering fluctuation in the frequency of hazards. Here, the socioeconomic exposure is defined by considering the shift in the JRP and is expressed at the catchment scale as follows:
where EPOP and EGDP denote the population and GDP exposure; Th and Tf denote the historical and future JRPs, respectively; I(⋅) denotes the controlling function, which is 1 when or 0 when ; and POP and GDP denote the population and the gross domestic product (USD), respectively, of a given catchment in the future climate.
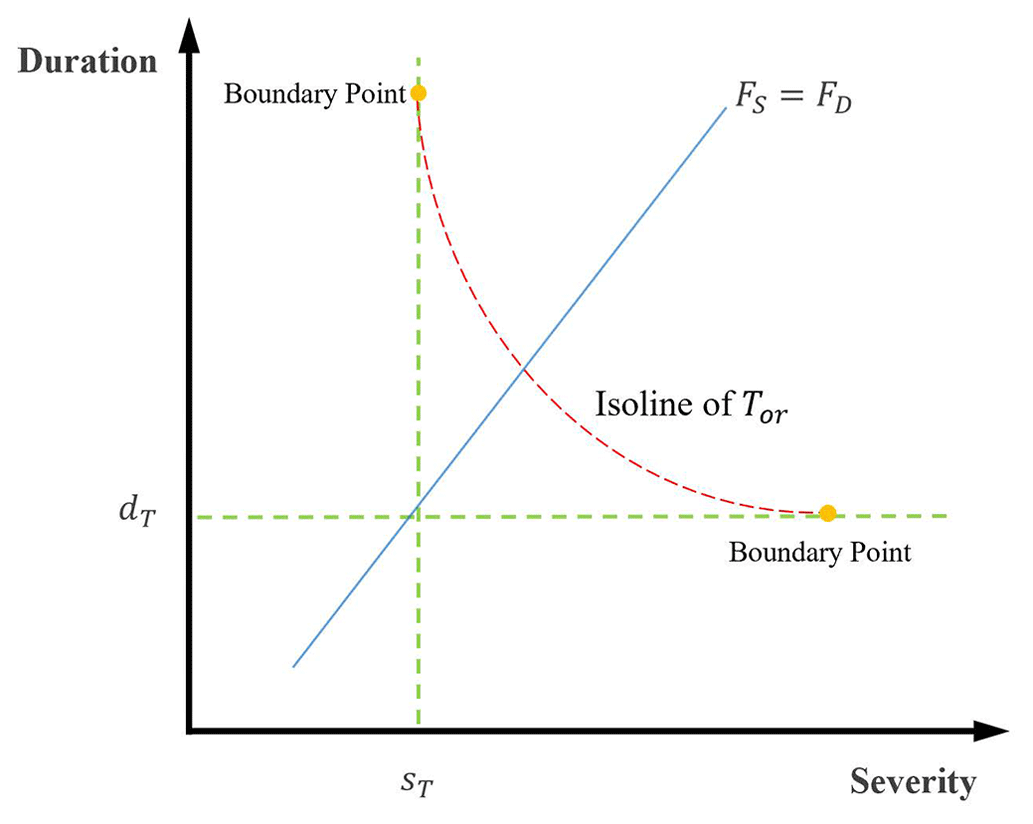
Figure 3Joint distribution of drought duration and severity under a critical Tor. The green lines are two arbitrary values of duration and severity. The red line is the isoline of two variables under a critical Tor, and the blue line denotes the traditional equal-frequency assumption. The dT and sT are marginal distribution quantiles for a given probability level T. FS and FD are the cumulative probability densities of severity and duration, respectively. Tor is a given probability level in the OR case.
2.6 Quantifying the uncertainty contributed by different sources
Uncertainties in the future drought projections can arise from the SSPs, GCMs, and HTMs. During both the historical (1985–2014) and future (2071–2100) periods, the combination of three SSPs, five GCMs, and 10 HTMs through the impact modeling chain resulted in 150 hybrid combinations. The overall uncertainty is calculated from the variance of the future estimated JRP relative to the historical 50-year droughts. To partition the uncertainty from different sources of data and their interaction effects, the MANOVA is used and expressed as follows (Weinfurt, 1995):
where M denotes the mean change in all the indicators in the models; Sx, Gy, and Hz denote the impacts on the indicators of the xth SSP, yth GCM, and zth HTM, respectively; and is the overall impact arising from the interactions of different sources. The overall variance V is then expressed as follows:
where VS, VG, and VH are the variances from the SSPs, GCMs, and HTMs, respectively. VISG, VISH, VIGH, and VISGH denote the variances caused by the coupling between the different sources of data. The contribution of each source to the overall uncertainty is quantified by the variance of each source and the total variance.
3.1 In situ observation dataset
We use a gridded meteorological dataset with 0.5° × 0.5° resolution, including daily temperature (maximum, minimum, and average; °) and daily precipitation (mm) from 1961 to 2018 provided by the National Meteorological Bureau of China. The dataset is regarded as the latest gridded meteorological dataset in China and has been applied to some studies (e.g., Wu et al., 2018; Yin et al., 2021a, b). Meanwhile, we gathered the daily streamflow of 463 in situ hydrological stations spanning different periods during 1961–2018 (Liu, 2023). The hydrological stations are densely distributed in eastern China, while western China has a sparser distribution. Through rigorous data quality checks, 179 unnested basins with at least 20 years of data were selected, covering nine major watersheds in China. For more details on streamflow data processing and catchment screening, please refer to Yin et al. (2021b).
3.2 GRACE and GRACE-FO measurements
Temporal variations in Earth's gravitational field observed by the GRACE satellites have been used to retrieve TWS data (Tapley et al., 2004). Many international institutes have released the TWS mascon products at a monthly scale, including the JPL (Jet Propulsion Laboratory of the California Institute of Technology), the GSFC (Goddard Space Flight Center of NASA), and the CSR (Center for Space Research of the University of Texas). As these three mascon solutions are produced at different spatial resolutions, we generated blended TWS data based on the average of the JPL, GSFC, and CSR with a 0.5° × 0.5° resolution from 2002 to 2022 and fill in the missing data using a linear interpolation approach (Yin et al., 2022).
3.3 ERA5-Land dataset
ERA5-Land is a dataset that consists of a large volume of meteorological variables, including precipitation, temperature, and air pressure. The spatial resolution of the dataset is 9 km, and the temporal resolution is 1 h (Yilmaz, 2023). Under the latest global reanalysis and the lapse rate correction, the ERA5-Land reanalysis dataset provides a substitute for unavailable observed weather data by taking the effect of altitude on the spatial scheme of climate variables into account (Pelosi et al., 2020). Six variables are used in the study (i.e., pr, ps, T2 m, Td, srlds, and srsds) and are aggregated to the daily scale from the hourly scale before conducting data analysis (Muñoz Sabater, 2019).
3.4 Bias-corrected GCM outputs and socioeconomic scenarios
The climate outputs of five GCMs of the historical scenario and three SSPs (i.e., SSP1-26, SSP3-70, and SSP5-85) in CMIP6 are used to represent different climate scenarios. Generally, the SSP5-85 configured the highest carbon emission and human interference with the natural environment. SSP3-70 and SSP1-26 have progressively conservative changes to represent climate change resulting from different levels of human activity. The series of bias-corrected variables have been downscaled to 0.5° × 0.5° resolution from 1850 to 2100 in the Intersectoral Impact Model Intercomparison Project 3b (ISIMIP3b) (Lange, 2019). To reduce the systematic biases of CMIP6 raw outputs, seven variables from the bias-corrected ISMIP3b dataset have been used, i.e., temperature (daily average, maximum, and minimum), pr, ps, srsds, srlds, RH, and SH (Lange and Büchner, 2021).
Population and GDP data under three SSPs are employed to evaluate the potential socioeconomic risks of drought in a warming world. An open-access population dataset is adopted which takes into account the universal two-child policy, the census results, and the statistical annual report (Jiang et al., 2017). The economic index from 2010 to 2100 is estimated based on the Cobb–Douglas and Population–Environment–Development model (Jiang et al., 2018). All of the data have been used previously to assess the socioeconomic impact of extreme hydrological hazards (Yin et al., 2022).
4.1 Observed changes in SRI- and TWS-DSI-based drought
As there are insufficient streamflow observations to compute the SRI in northwestern China, we also employed the TWS-DSI as the Supplement. This approach enriches the variety of the water storage or flux being evaluated. Based on linear regression and the least-squares method, trends in drought characteristics (i.e., frequency, duration, and severity) are estimated by using the GRACE and GRACE-FO dataset and observed runoff across China. Figures 4 and 5 show the drought trends based on the TWS-DSI and the SRI, respectively. Overall, the two indexes show similar trends in most catchments, suggesting that drought hazards increased from 2002 to 2022. TWS-DSI droughts increased in 54 % of the areas, which are mainly located in the Qinghai–Tibet Plateau, the North China Plain, and northwestern Xinjiang Province. Likewise, SRI droughts increased in over 51 % of the studied catchments, which mainly dominate northeastern and southeastern China. The severity of the droughts measured by the TWS-DSI is twice that of the hydrological drought, primarily because the TWS-DSI metric incorporates all the vertical water fluxes, offering a comprehensive view of the shifts in water scarcity. On the other hand, the TWS-DSI can with difficulty represent the aquifer recharge processes, which are fundamental physical processes of baseflow and the hydrological drought in its entire extension. Therefore, catchments with aquifer recharge and storage capacity will exceed several times the time step of the analysis, enlarging the severity of the droughts. Some locations exhibit discrepancies depending on the index considered. For instance, droughts in the Qinghai–Tibet Plateau and northeastern China show opposite trends. Anomalies in the Qinghai–Tibetan Plateau may be explained by the transformation of snowpack melt into surface runoff under the influence of climate change, which helps to compensate for the lack of surface water in the area (Stewart, 2009). The discrepancy observed in northeastern China could potentially be linked to the rise in soil moisture from increased infiltration, which causes a higher proportion of water to be stored within the soil than at the surface, interfering with the quantification of hydrological drought (Wang et al., 2017). Finally, both indicators show a consistent positive drought trend in most areas of China, and particularly in the North China Plain and the Pearl River Basin.
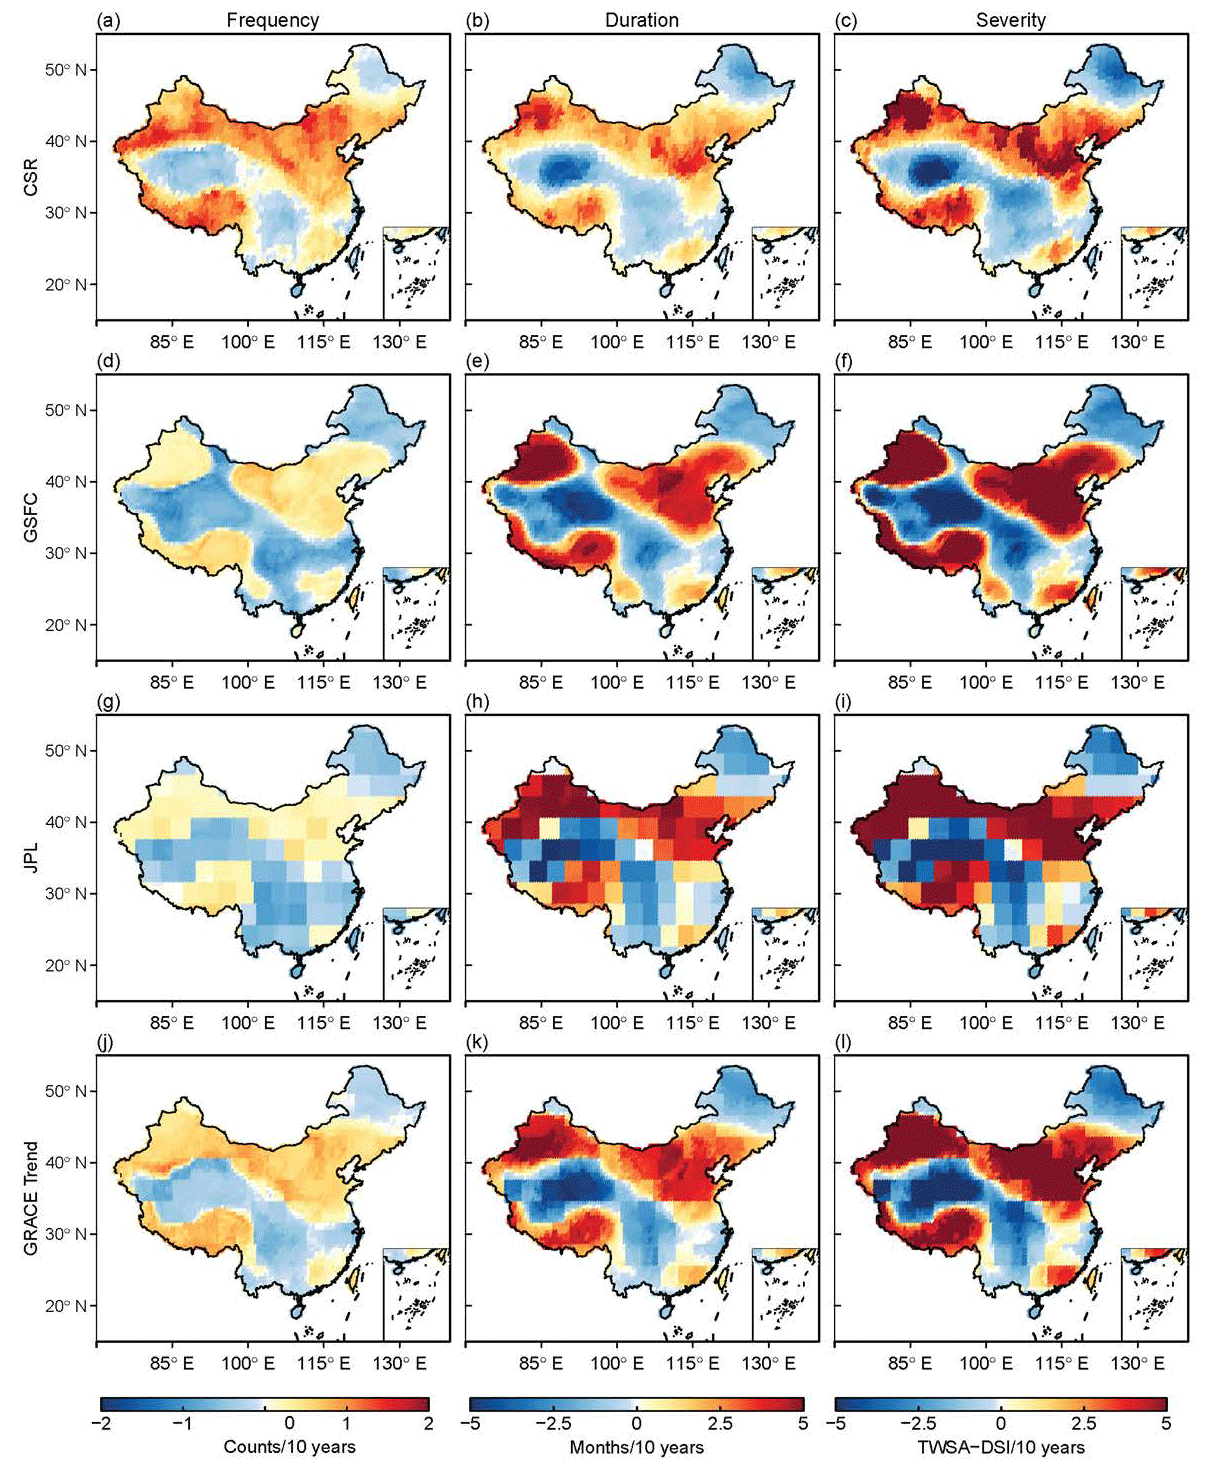
Figure 4Trends in drought frequency, duration, and severity based on the TWS-DSI from 2002 to 2022 using three GRACE and GRACE-FO products (a–i) and the blended data (j–l).
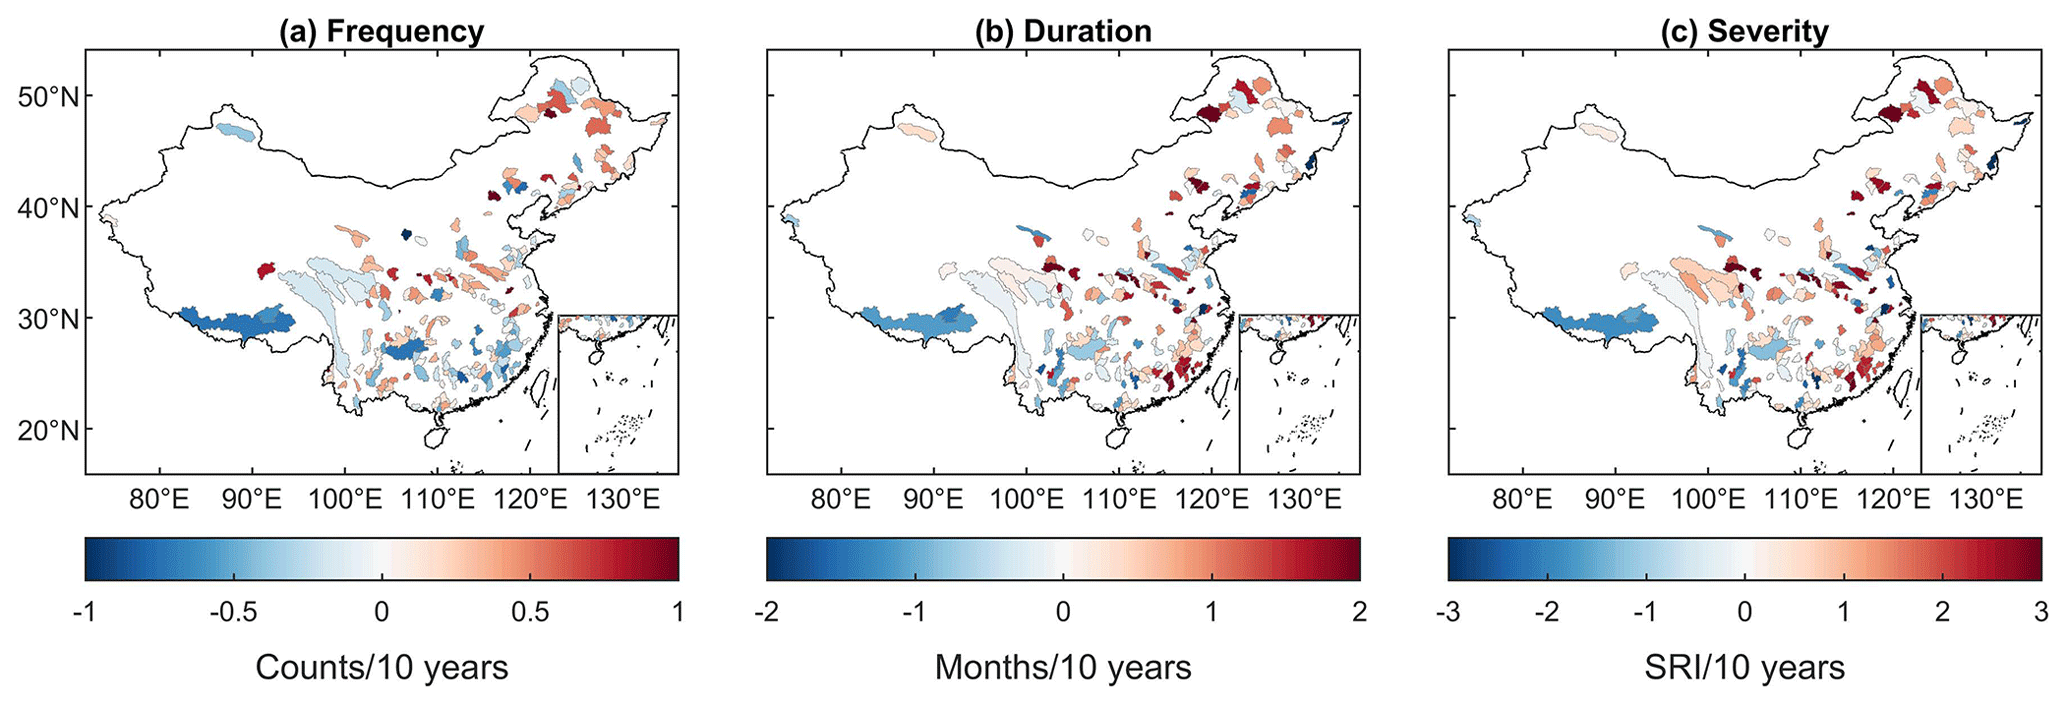
Figure 5Trends in drought frequency, duration, and severity from 2002 to 2022 over China. (c) The index of severity is based on the SRI statistic (Eq. 13).
4.2 Machine-learning-constrained streamflow simulation and model evaluation
The RF model was used to quantify the sensitivity of streamflow to different meteorological variables (Fig. 6). Since a station can be attributed to catchments of different sizes, we only considered the largest catchment scales in our analysis. We quantified the sensitivity of seven historical mean meteorological variables (i.e., pr, ps, SH, RH, srlds, srsds, and temperature) to the monthly streamflow in each grid. Due to the sparse number of observation stations in northwestern China, the reliability of the sensitivity analysis for these regions is lower than that of the dense observed areas. Precipitation typically plays a major role in generating runoff in southeastern China, although SH plays the most important role in some regions, such as central, southwestern, and northeastern China. Over 30 % and 38 % of the stations show a SH sensitivity rate of > 10 % in western and northeastern China, respectively, indicating the dominance of SH in these areas. In contrast, RH and shortwave radiation have a negative contribution to streamflow, especially shortwave radiation, which has a pronounced negative sensitivity in 394 stations, probably due to enhanced evapotranspiration (Ma et al., 2019). These negative contributions mean that enhancement of these two variables will inhibit the generation of streamflow, showing the potential adverse effects of climate change on streamflow generation. In general, RH contributes to increasing streamflow over most regions of China, but the opposite effect is observed in 179 stations mainly located in southwestern China and in the Yellow River and Huaihe River basins. This is a result of the mutual feedback of water and heat dynamics (i.e., saturated vapor pressure increases with warming and intensifies evaporation, leading to a decrease in surface water), which was also found by Liu et al. (2017). The temperature has a positive contribution to streamflow generation in northeastern China, suggesting potential mitigation for the deficiency of the surface flow. However, there is interactive feedback between hydrological and thermal factors that results in an inability to directly assess the impact of temperature on hydrological droughts (Fig. 6i and f).
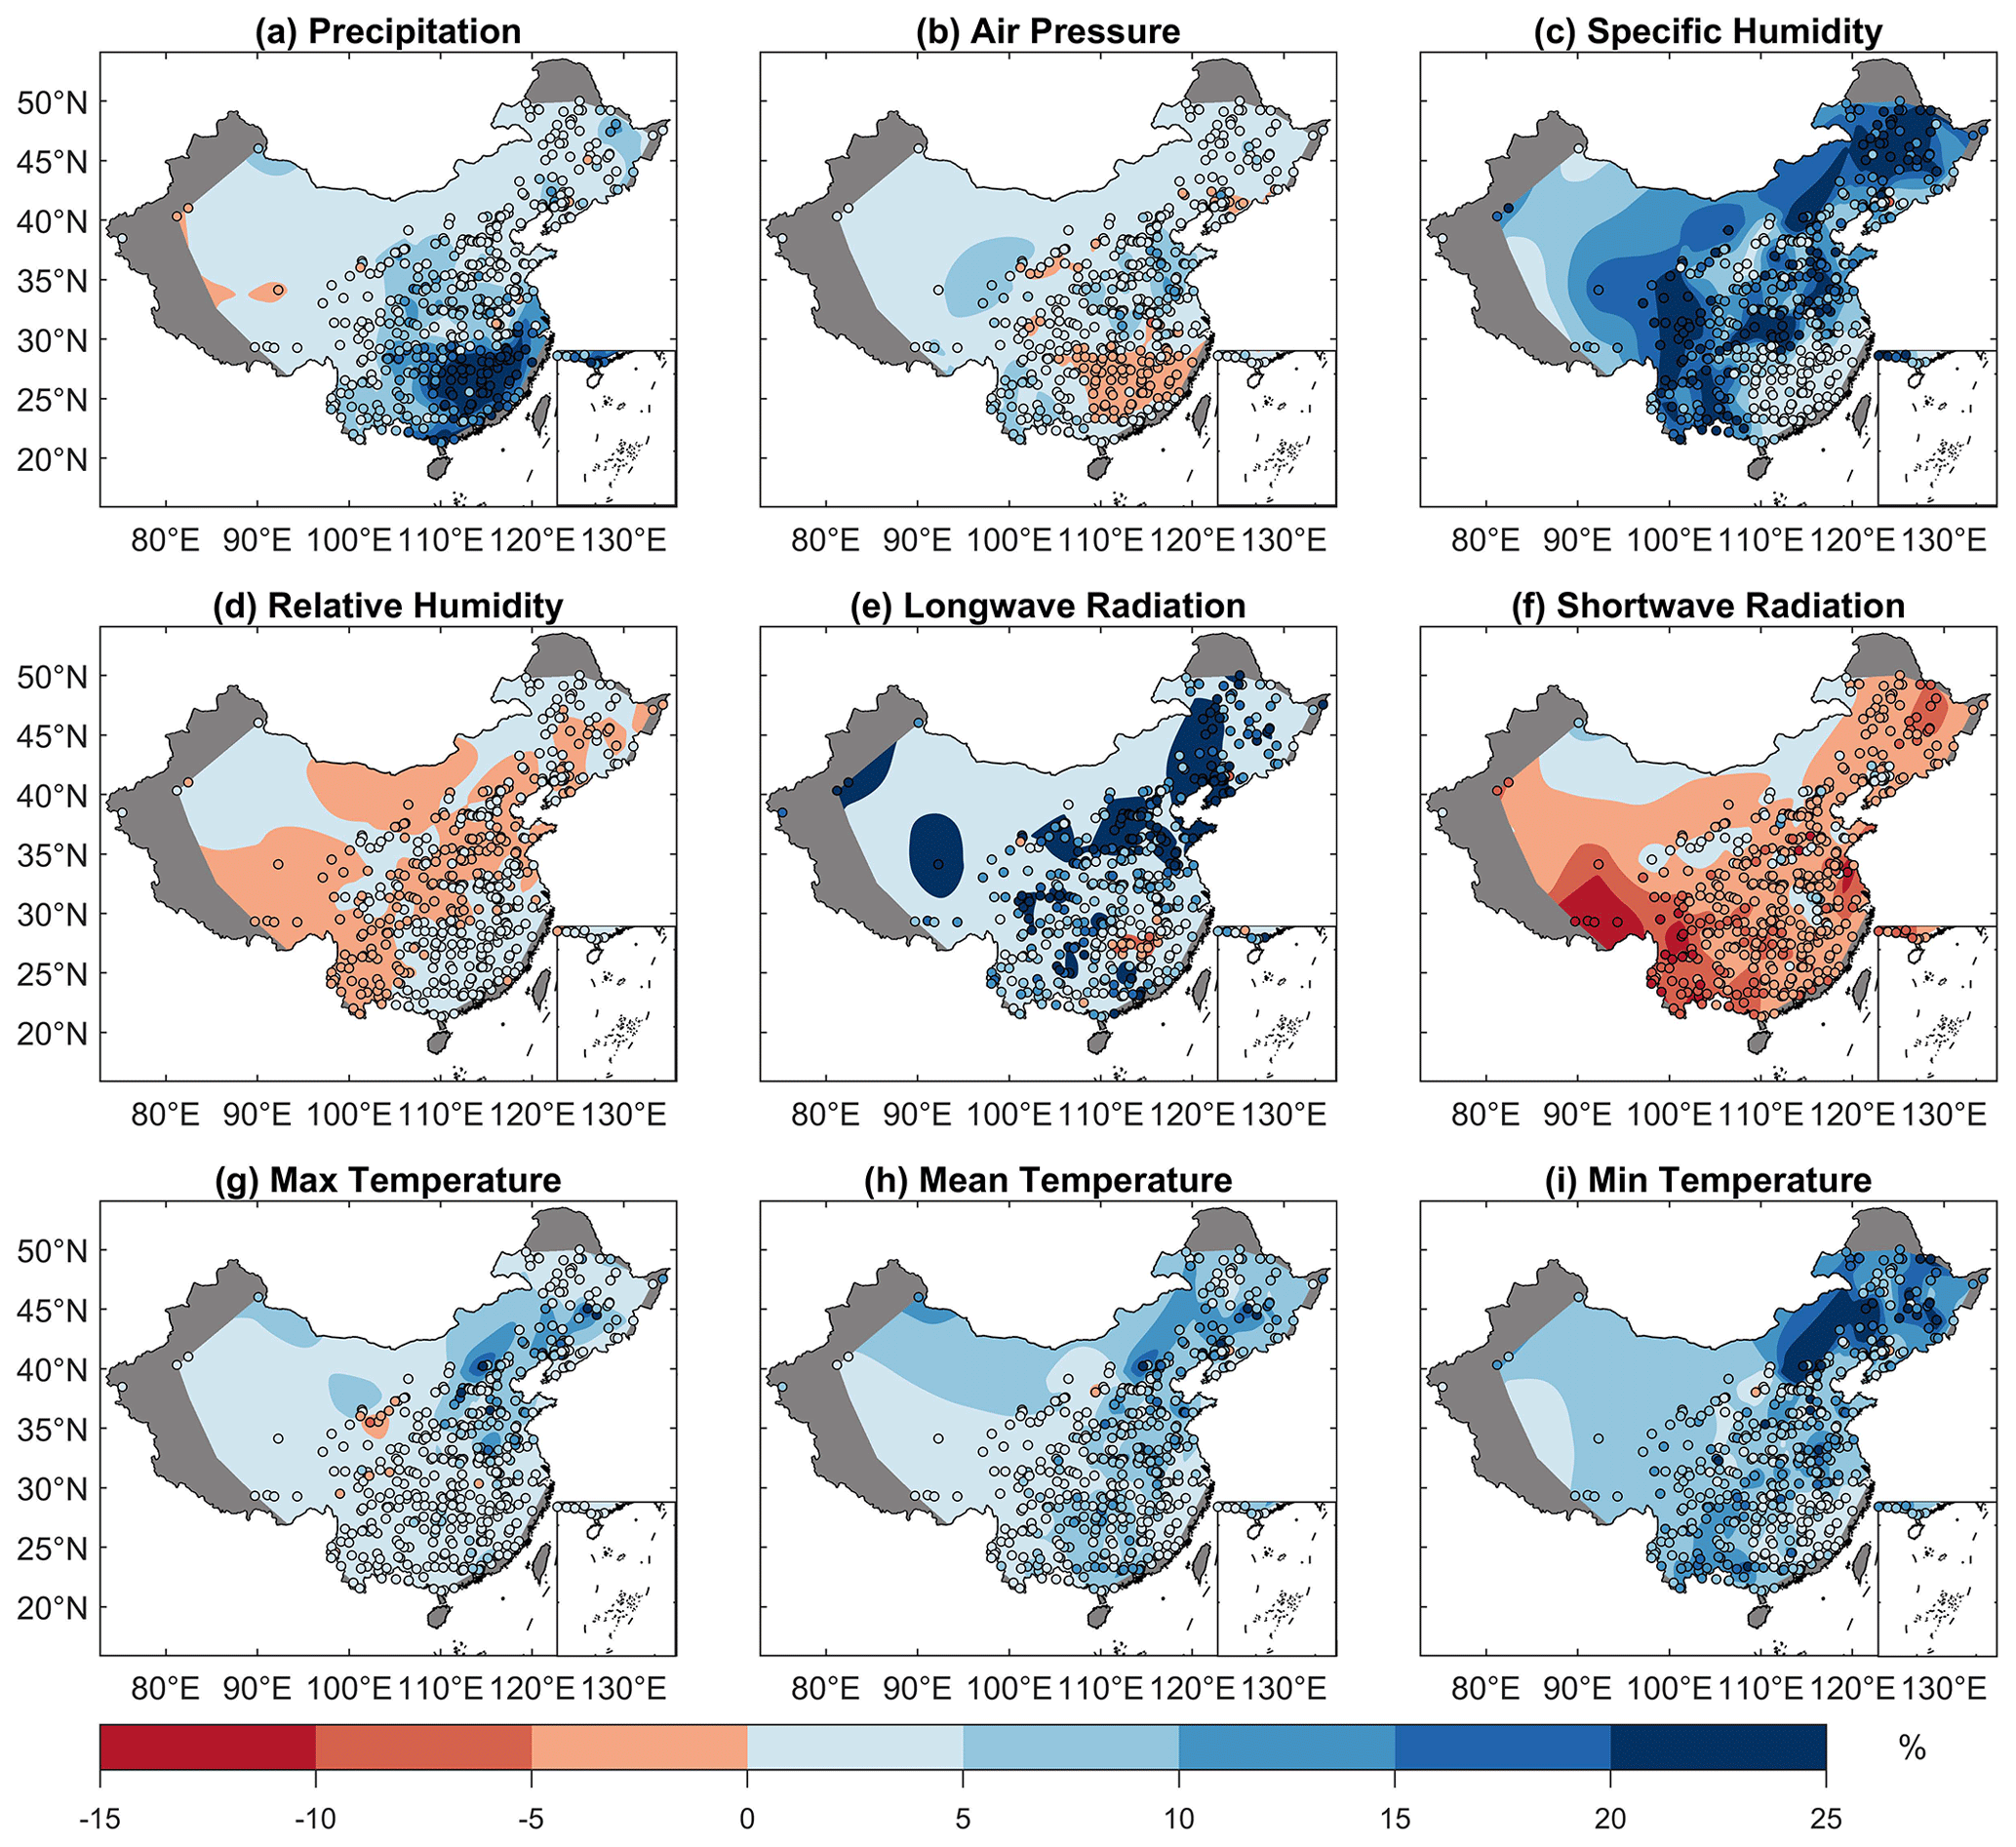
Figure 6Sensitivity of meteorological variables to daily streamflow. The figure uses a thin-plate smoothing spline method to interpolate the point-based station data (circles). The grey areas indicate missing data.
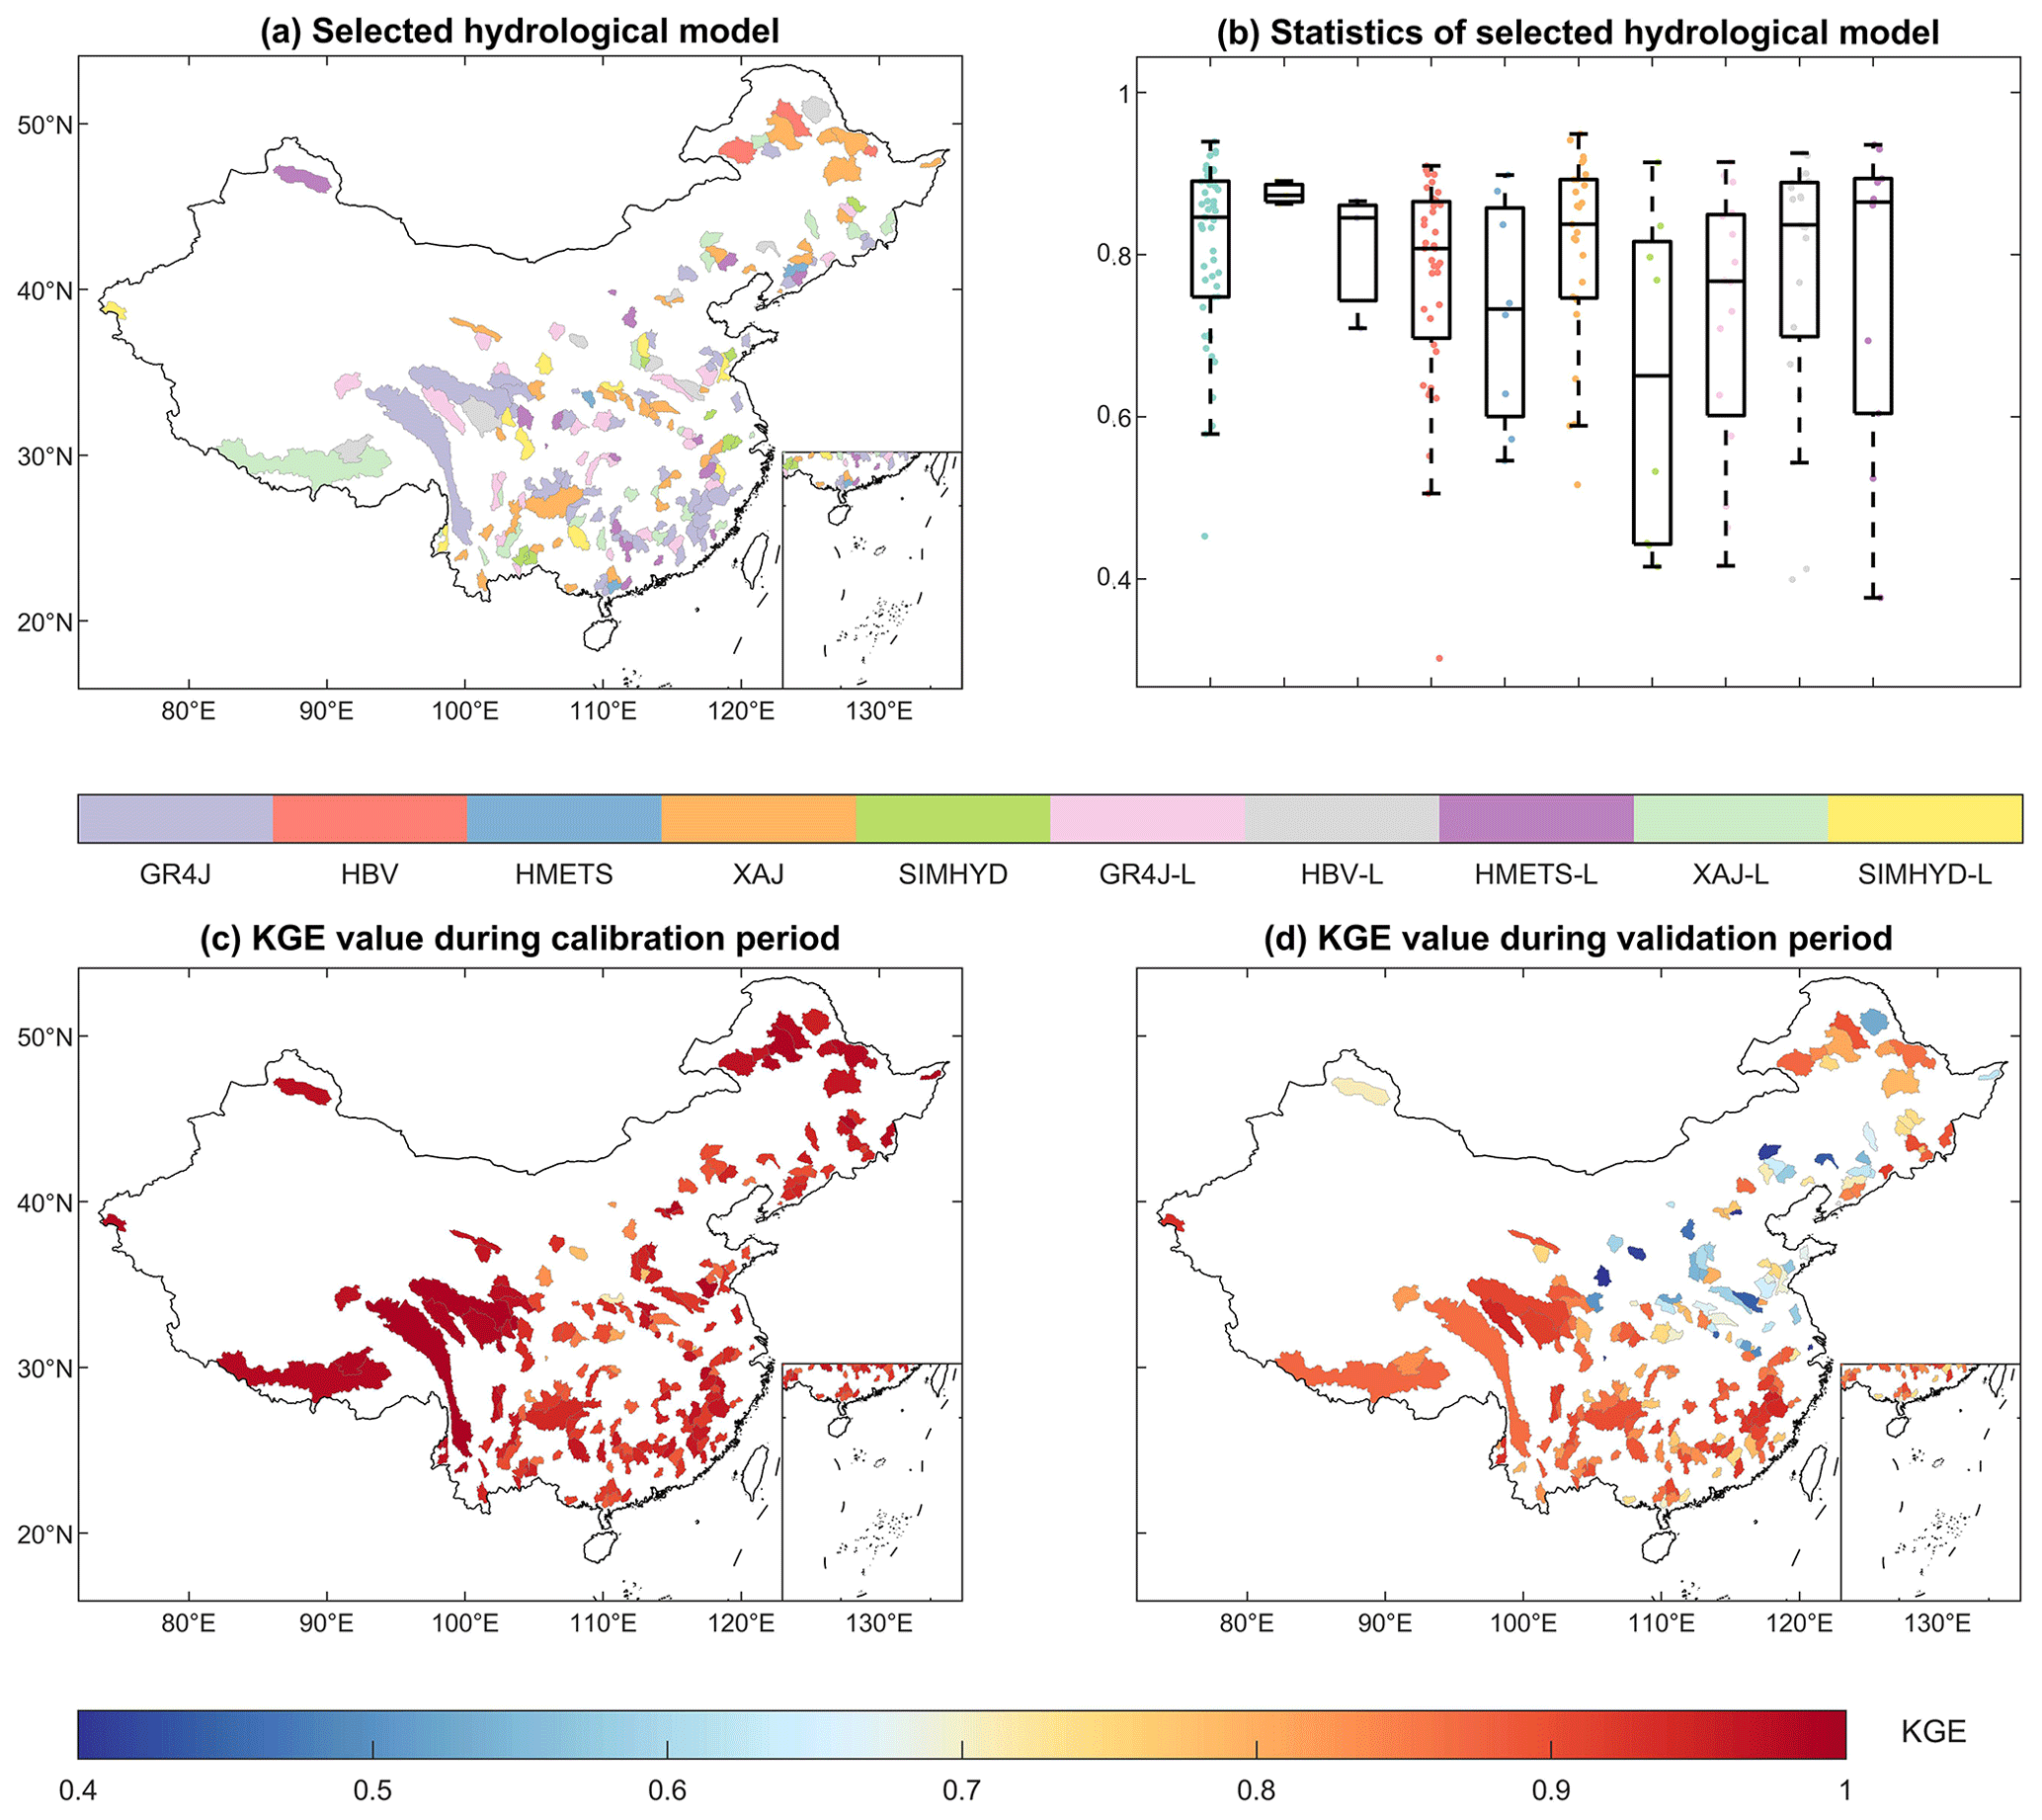
Figure 7Hydrological simulation performances of all the candidate models. (a) The best-performing model with the highest KGE value. The catchments are colored according to the best-performing models. (b) Boxplots of all the catchments for 10 HTMs indicated by KGE values. (c, d) The highest KGE values during the calibration (c) and validation (d) periods, respectively.
The performances of simulated streamflow by different HTMs are shown in Fig. 7. The model that has the largest Kling–Gupta efficiency (KGE) is considered to be the best-performing one in each catchment. In Fig. 7a and b, the GR4J and GR4J LSTM performed best in 77 out of the 179 studied catchments. The median KGE value of GR4J is higher than 0.83, revealing a superior performance to the other hydrological models. Subsequently, the XAJ and XAJ LSTM are the best models in 57 catchments, mainly located in the southern Yangtze River. Finally, the HBV and HBV LSTM performed best in only 10 catchments, where the streamflow was impacted by snowfall in plateaus and northern frozen areas. All the catchments exhibit KGE values greater than 0.9 during the calibration period in Fig. 7c, showing good performance in simulation. During the validation period, only 18 catchments have KGE values below 0.6, and most of the catchments have KGE values greater than 0.8 (Fig. 7d). In summary, the trained models simulate streamflow well in all the studied catchments. Additionally, the KGE values in the southern region are generally higher than those in the northern region during the validation period, which is consistent with previous hydrological simulation works (Gu et al., 2020b, 2021). This phenomenon may be attributed to the higher dependence of streamflow on rainfall in southern China, which is governed by a humid climate pattern (Zheng et al., 2022).
4.3 Projected changes in univariate drought characteristics
We projected the future daily runoff series by driving the HTMs with the bias-corrected CMIP6 variables, and then we estimated the monthly SRI to identify the drought duration and severity. Based on the maximum Bayesian information criterion (BIC), we selected the best-performing marginal distributions for duration and severity from seven candidate distributions shown in Table S2, based on the historical data for each catchment. Figures 8 and 9 show the multimodel ensemble average severity and duration for the 50-year historical return period (RP).
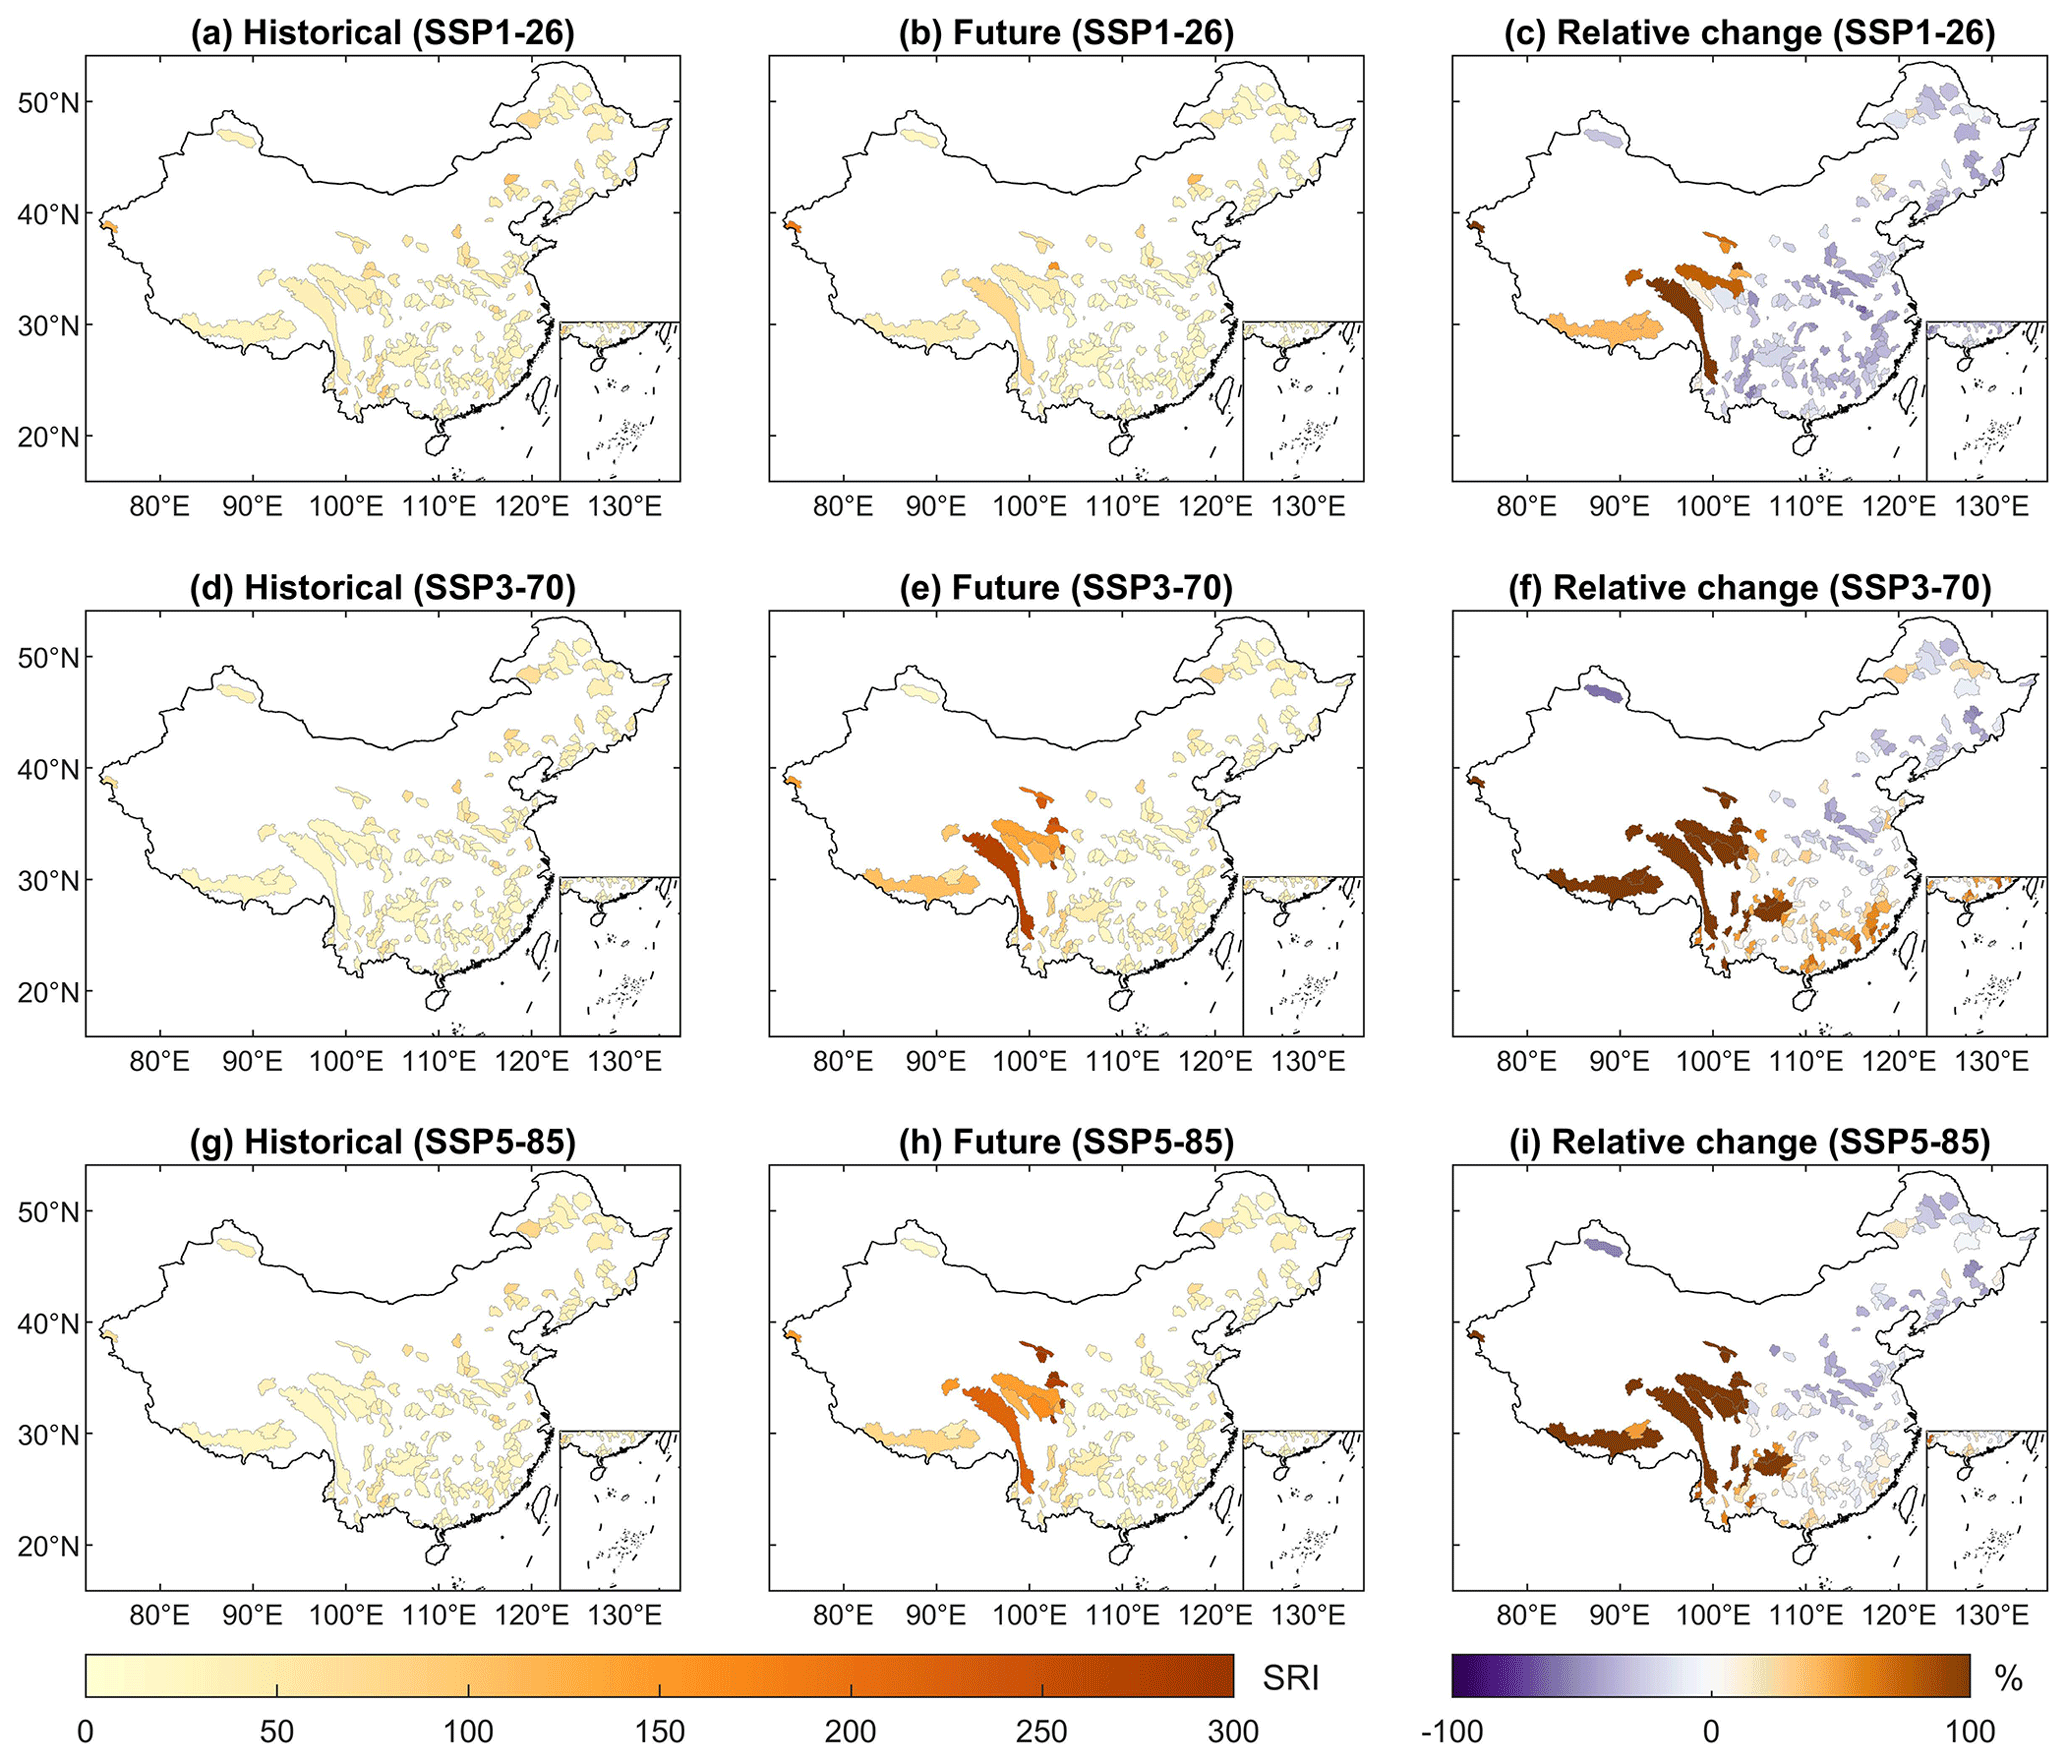
Figure 8Multimodel ensemble average design severity (dimensionless) under a 50-year RP for three SSPs, together with relative changes (%) in 2071–2100 compared to 1985–2014.
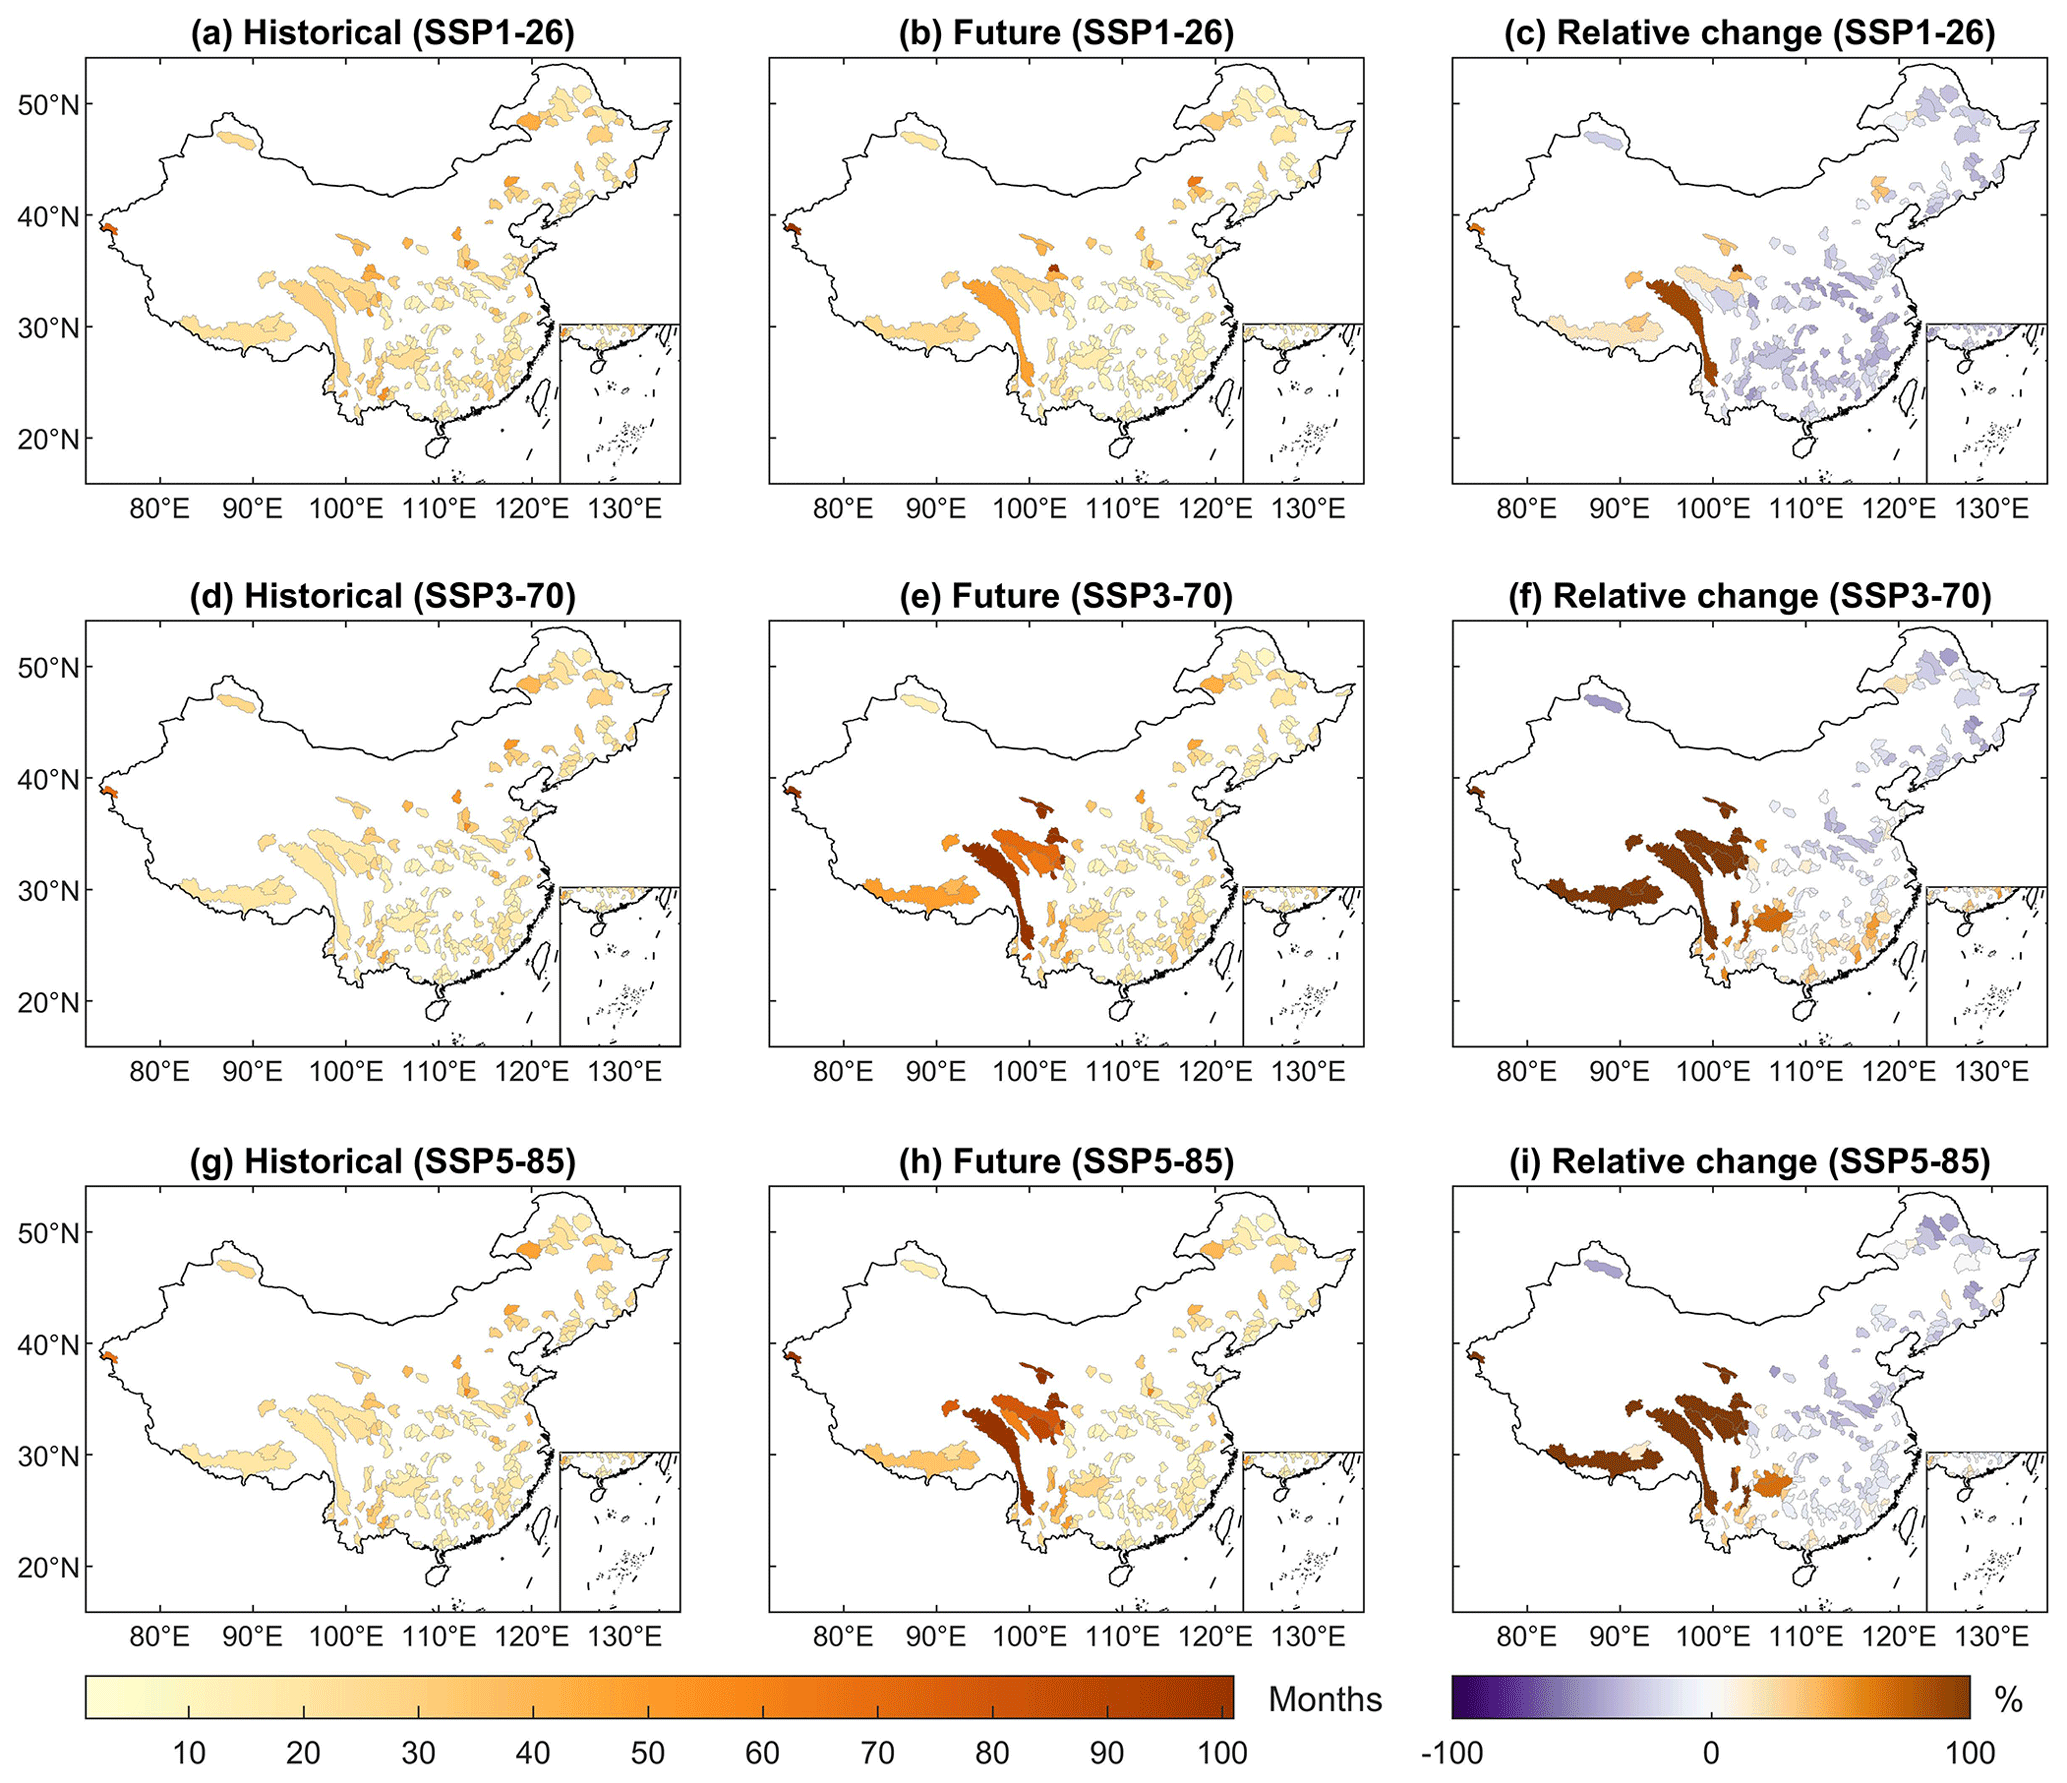
Figure 9Multimodel ensemble average design duration (months) of the multiple models for a 50-year RP for three SSPs, together with relative changes (%) in 2071–2100 compared to 1985–2014.
In western China, we projected a significantly increasing drought trend under the three SSPs, which indicates potential for increased water scarcity and more frequent extreme drought events. In southeastern China, we projected that drought events are likely to intensify under SSP3-70 but not under SSP5-85. It is generally considered that SSP5-85 is accompanied by higher carbon emissions than SSP3-70 (O'Neill et al., 2016). However, future work should also take significant action to control the extent of climate change, combined with strong climate policies under SSP5-85 (Fujimori et al., 2017). As a result, there is no deterioration of drought severity with policy interventions, which emphasizes the significance of ensuring the implementation of climate strategies. In northern China, in contrast, we found that future drought risks are projected to decrease in the three scenarios, which is possibly related to more moisture convergence from the East Asian monsoon circulation as the climate warms (Chowdary et al., 2019).
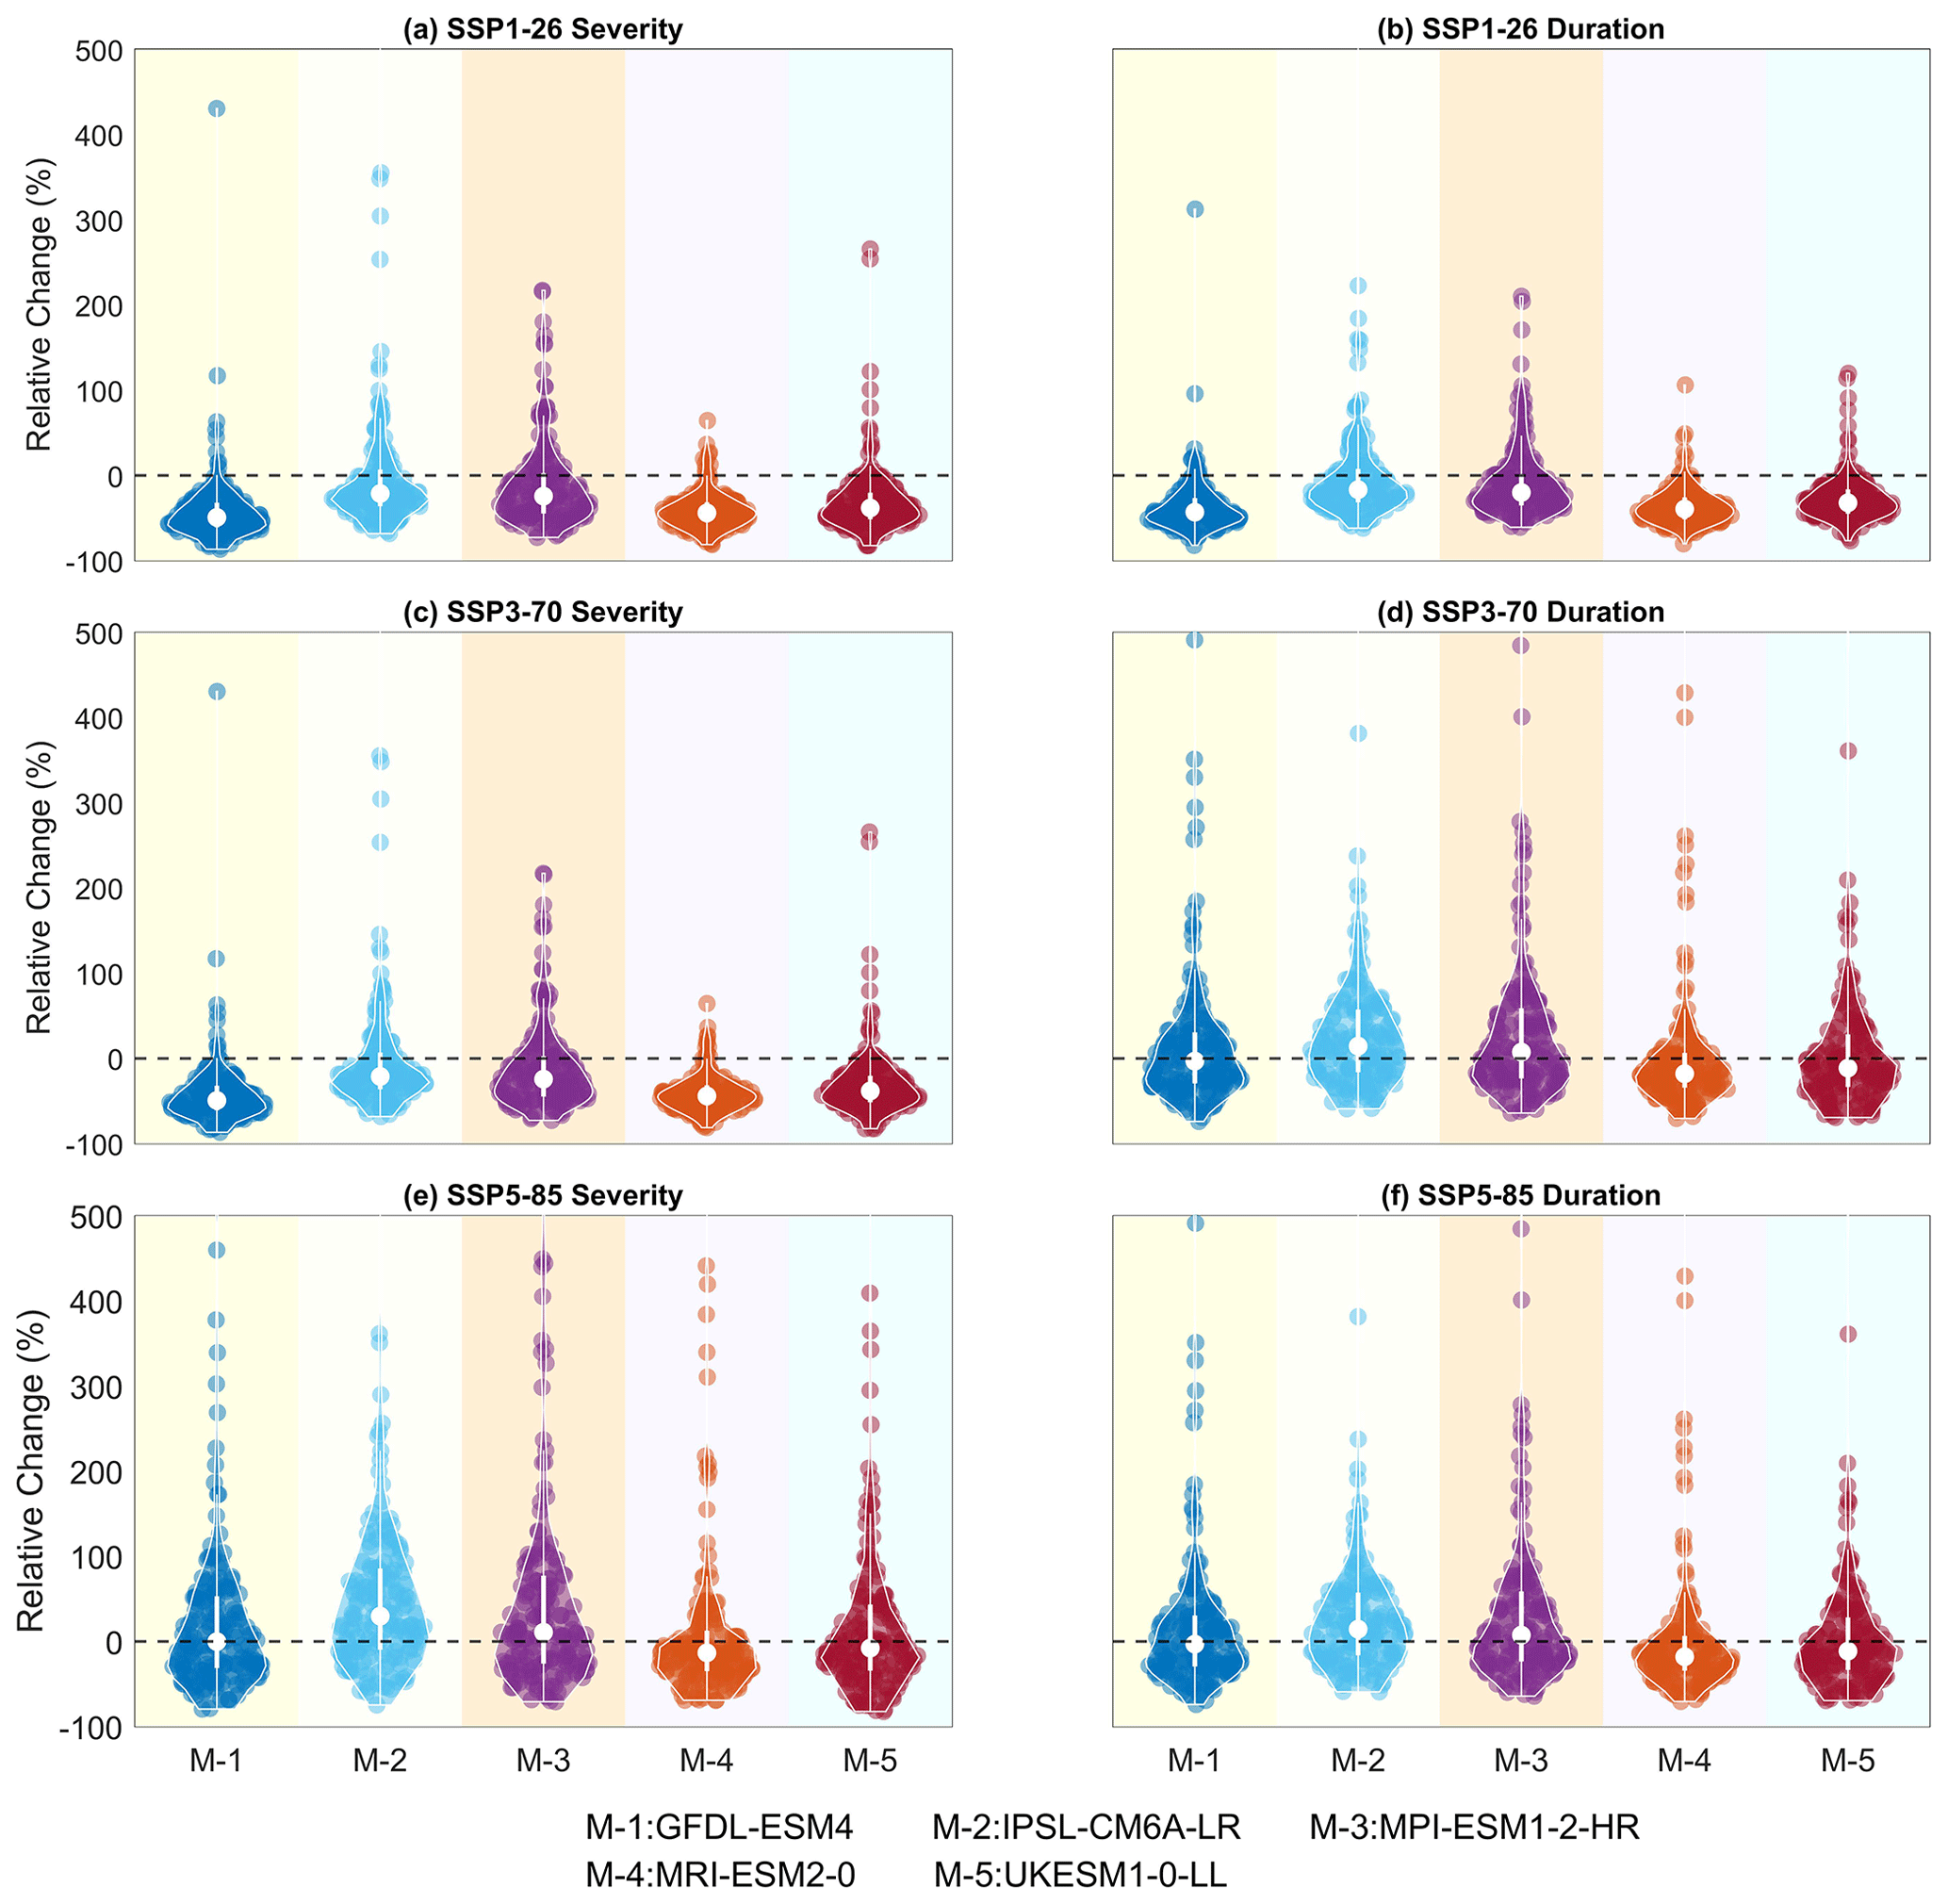
Figure 10Violin plots of the relative changes (%) in severity and duration during the historical drought event with a 50-year RP under three SSPs. The white circles are the median values of the relative changes.
We display the relative change in drought characteristics with a 50-year RP for all the catchments for five GCMs under the three SSPs using violin plots (Fig. 10). For most catchments, the relative change in drought duration and severity is negative. However, the relative change in some scenarios reached a maximum of 400 %, highlighting the extreme change in drought. The median relative change in severity based on IPSL-CM6A-LR under SSP3-70 is 30 %, and 22 % of the catchments have a relative change of over 200 %, representing the most severe case of drought evolution. Furthermore, the distributions of the projections based on the MPI-ESM1-2-HR, MRI-ESM2-0, and UKESM1-0-LL models are highly skewed and bimodal under SSP3-70 and SSP5-85, revealing substantial spatial heterogeneity across China. Overall, the severity and duration of droughts slightly increase in some catchments and have a risk of extreme intensification as a result of global warming.
4.4 Bivariate drought changes and corresponding socioeconomic risks
To capture the complex dependence structure between drought severity and duration, we used a copula function to quantify the bivariate risk of hydrological droughts under climate change. Changes in the JRP of the historical (1985–2014) drought event with the 50-year JRP in the future (2071–2100) period are shown in Fig. 11. The medians of the projected future JRP are 38.78, 14.52, and 19.24 years under SSP1-26, SSP3-70, and SSP5-85, respectively. For the 69 % and 60 % catchments under SSP3-70 and SSP5-85, we find that the JRP of the 50-year drought is reduced to less than 25 years in the future period, suggesting that the risk of drought increases by more than 2 times in these catchments. In addition, we find a marked increase in the number of catchments with increased drought risk compared to the univariate drought assessments. The JRP of catchments in northeastern and central China tends to decrease, suggesting higher changes in risks than with univariate assessments. This result is consistent with previous studies (He et al., 2011; Xu et al., 2015), which indicates that the use of bivariate drought analysis can amplify the individual effects of two drought characteristics.
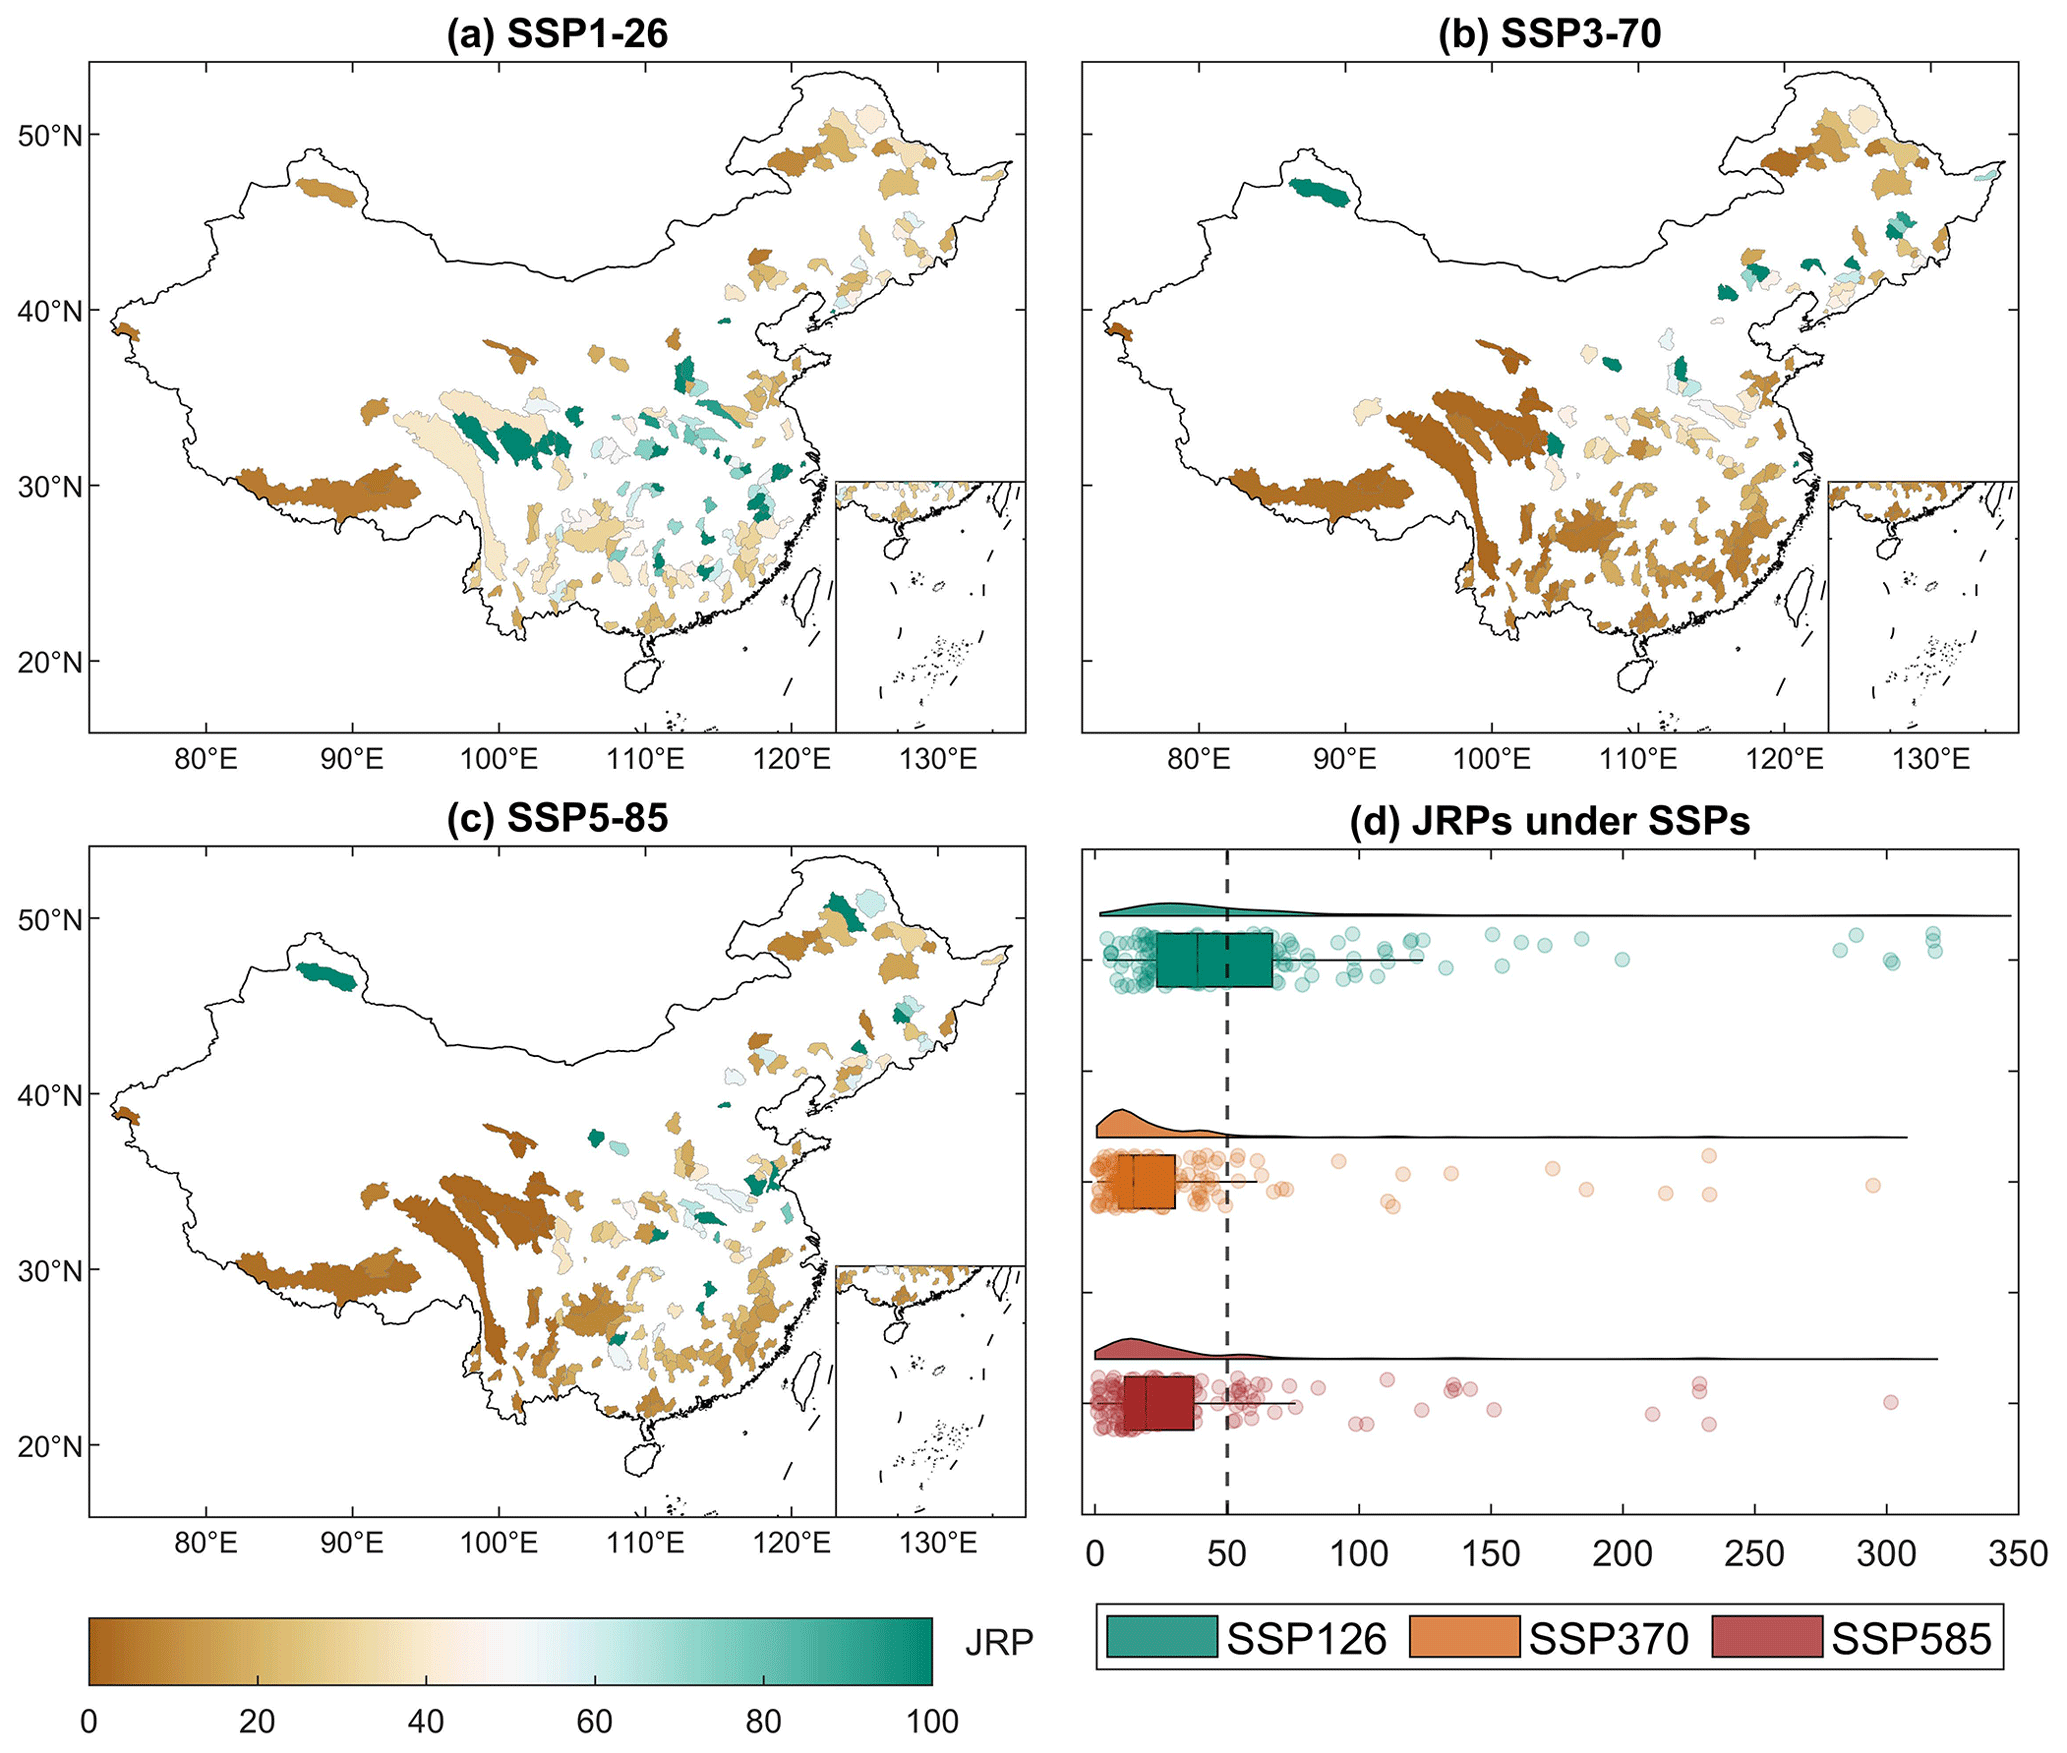
Figure 11The future multimodel ensemble mean JRP of the historical drought with a 50-year Tor based on the bivariate approach. The future JRPs of 179 catchments under three SSPs are presented in panels (a–c), while panel (d) displays rain cloud plots of the projected JRP under each SSP.
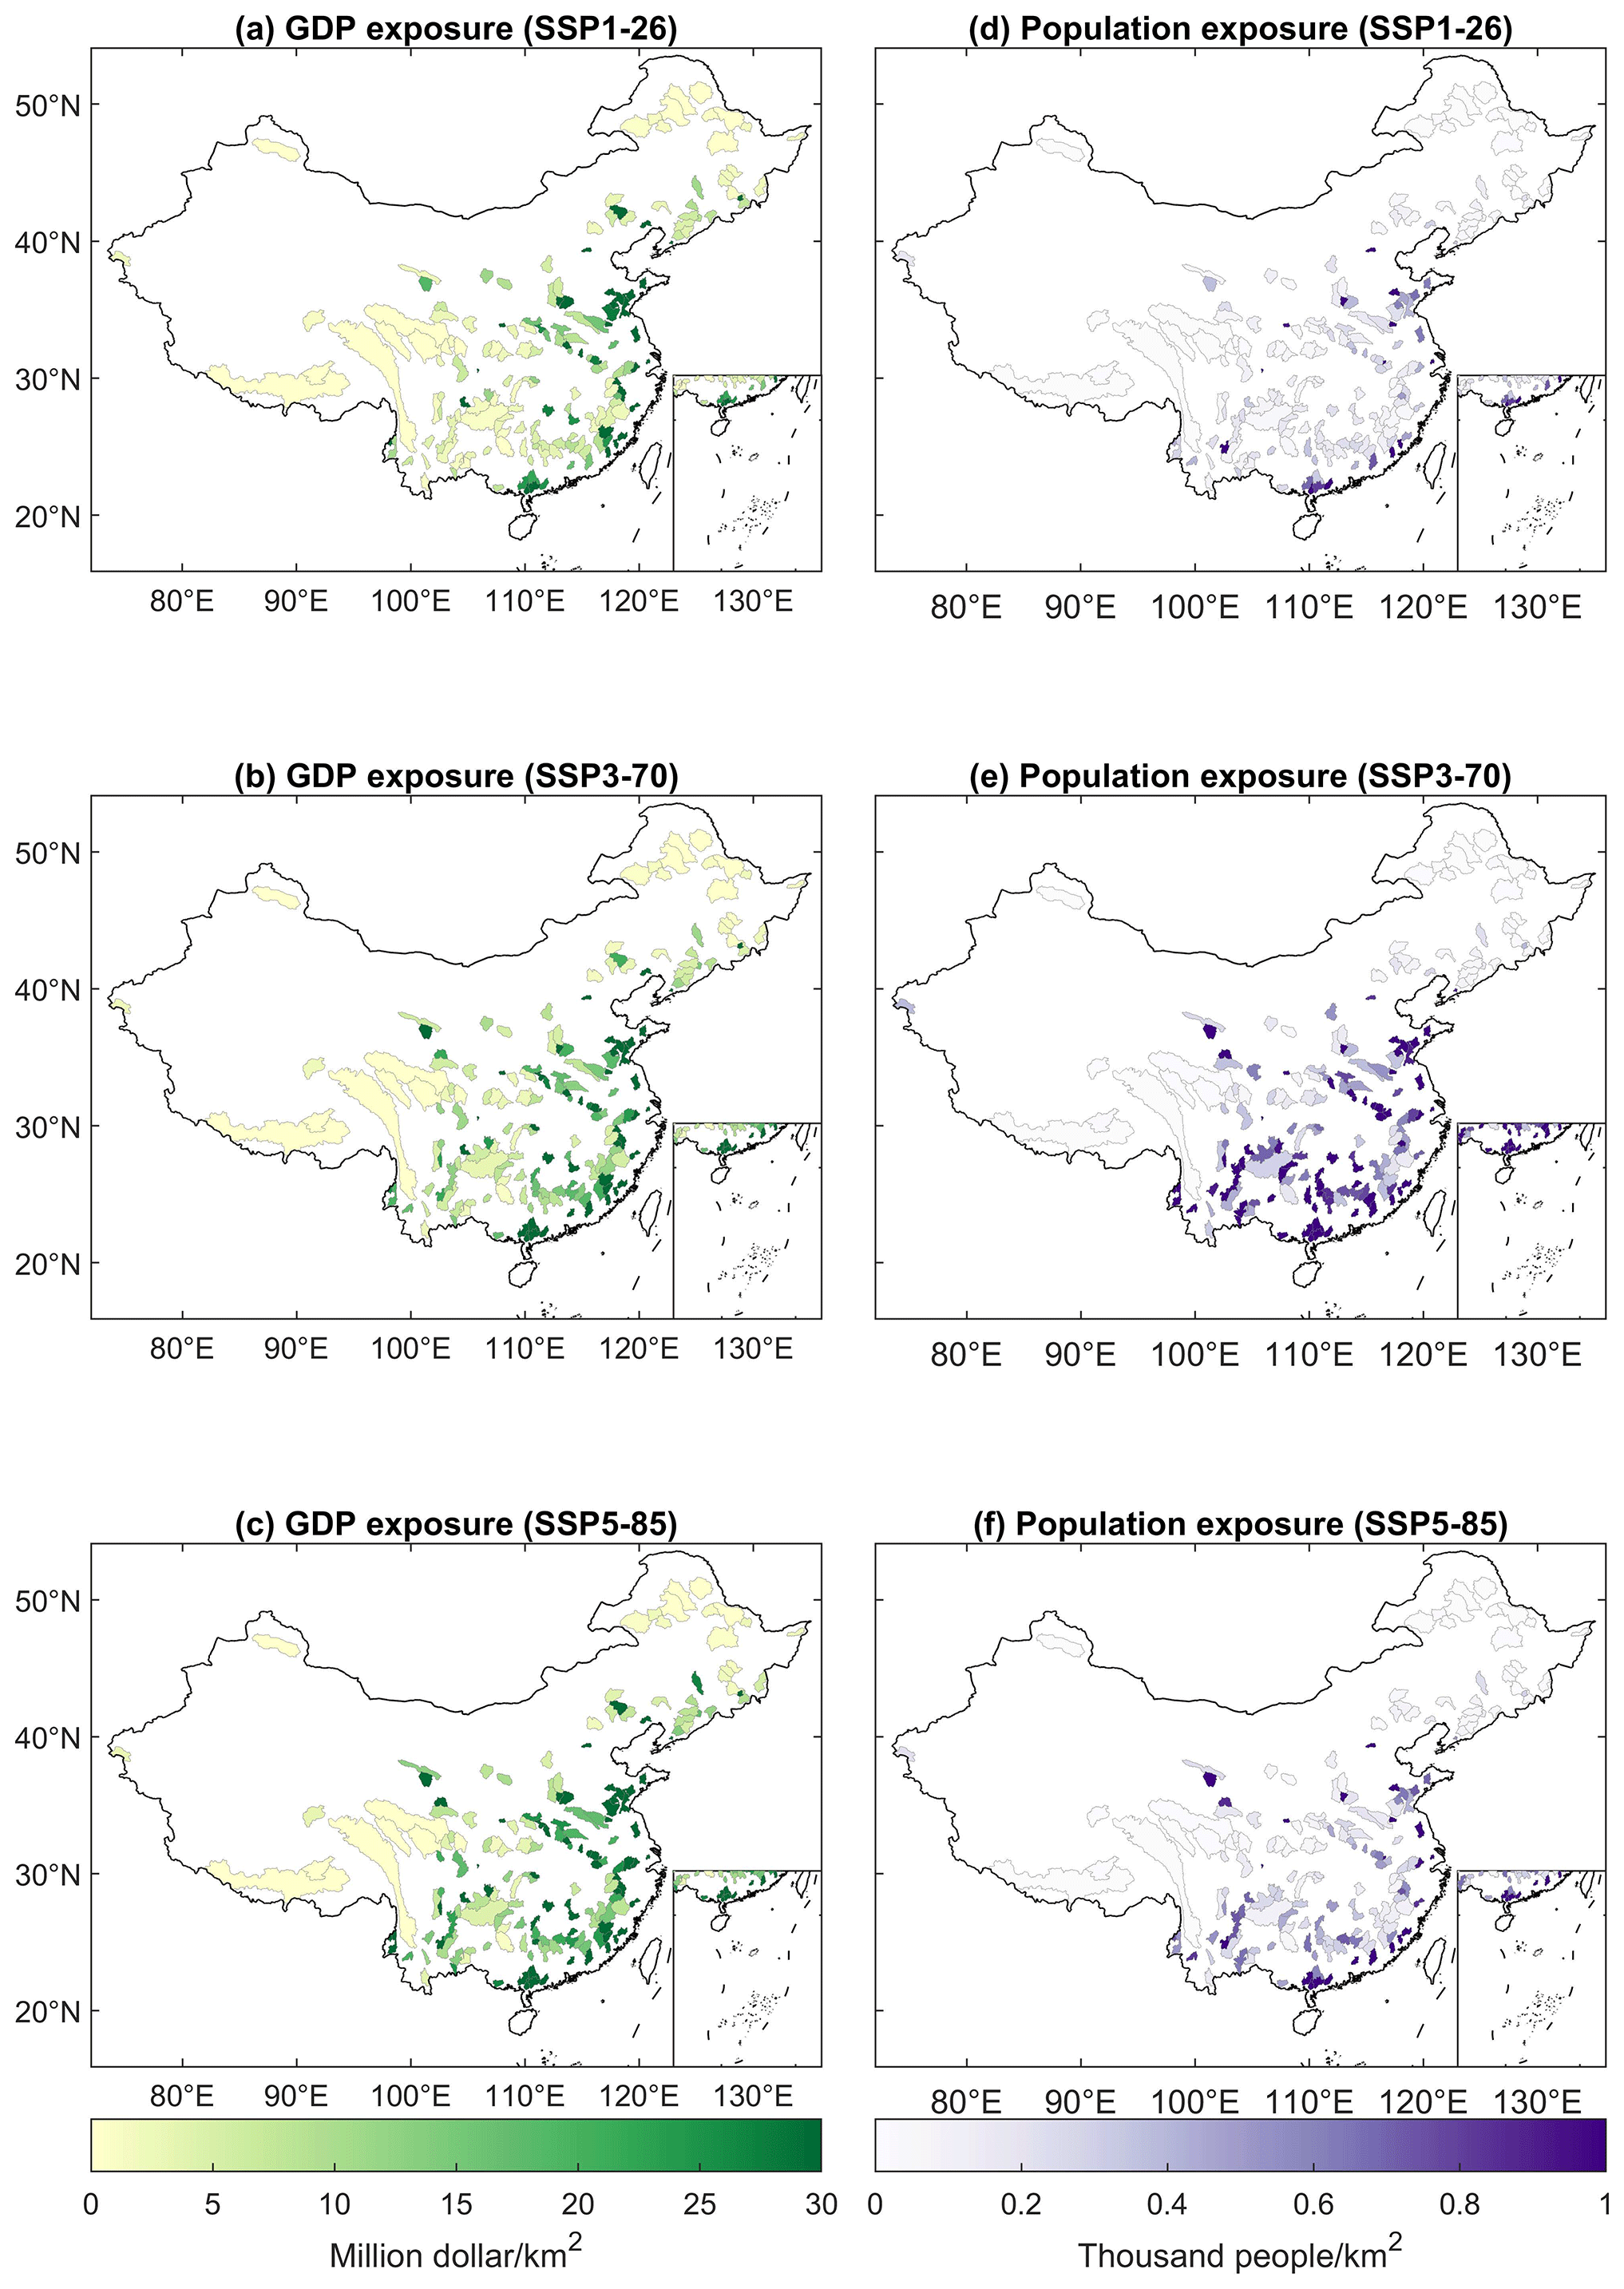
Figure 12The multimodel ensemble mean exposure of GDP (a–c) and population (d–f) to bivariate drought characteristics under different SSPs in the future period.
Future GDP and population exposures to increasing bivariate drought risk in three scenarios are shown in Fig. 12. The eastern coastal regions have higher significant economic exposure, such as in the Huaihe River Basin, the Yangtze River Basin, and the Pearl River Basin, which is consistent with the distribution of economically developed regions in China. The medians of GDP exposure are USD 5.5, USD 9.8, and USD 14.3 million per square kilometer under the three SSPs, respectively, which indicates the vulnerability of economic losses to drought disasters under global warming. The population affected by drought is mainly located in the southern Yangtze River Basin and the Huaihe River Basin under SSP3-70, as the median exposure is 525 and 205 people per square kilometer under SSP3-70 and SSP5-85, respectively. This is because the increase in population is higher in Sichuan, Guangdong, and Zhejiang provinces than in other Chinese provinces under SSP3-70 (Chen et al., 2020). Overall, the exposures of GDP and population show large heterogeneity in their sensitivities to different scenarios, and the distribution of the affected catchments is consistent with economic and social development.
5.1 Uncertainty decomposition
The overall uncertainty in our projections arises from the different SSPs, GCMs, and HTMs as well as their interactions. We assemble these seven sources using MANOVA (Fig. 13). For GDP and POP exposure, we find HTMs to be the main source of uncertainty; they contribute uncertainties of 27.55 % and 26.14 %, respectively. This indicates that the quality of an HTM is important for the accuracy of socioeconomic predictions. Likewise, the GCM and GCM–HTM provide over 30 % of the uncertainty in GDP and population exposures, which indicates the critical importance of bias-corrected GCM outputs for accurate projections. Further, the contributions of the SSPs to population exposure are 1.5 times those of GDP exposure, which shows that the effect of climate change is greater for POP exposure than for GDP exposure. In particular, the independent factors (i.e., SSPs, GCMs, and HTMs) contribute over 50 % of the uncertainty of GDP and population exposures, suggesting that GDP and population exposures are less responsive to complex coupling. In contrast, the coupled factors (i.e., the combination of SSPs, GCMs, and HTMs) mainly contribute to the uncertainty of the JRP, accounting for 82.63 % of the overall uncertainty, especially SSM–GCM–HTM, which accounts for 36.97 % of the uncertainty. Finally, the relatively low contribution of the choice of SSP, SSP–GCM, and SSP–HTM to the JRP uncertainty indicates that the future risk projection uncertainty is relatively stable in future risk projections.
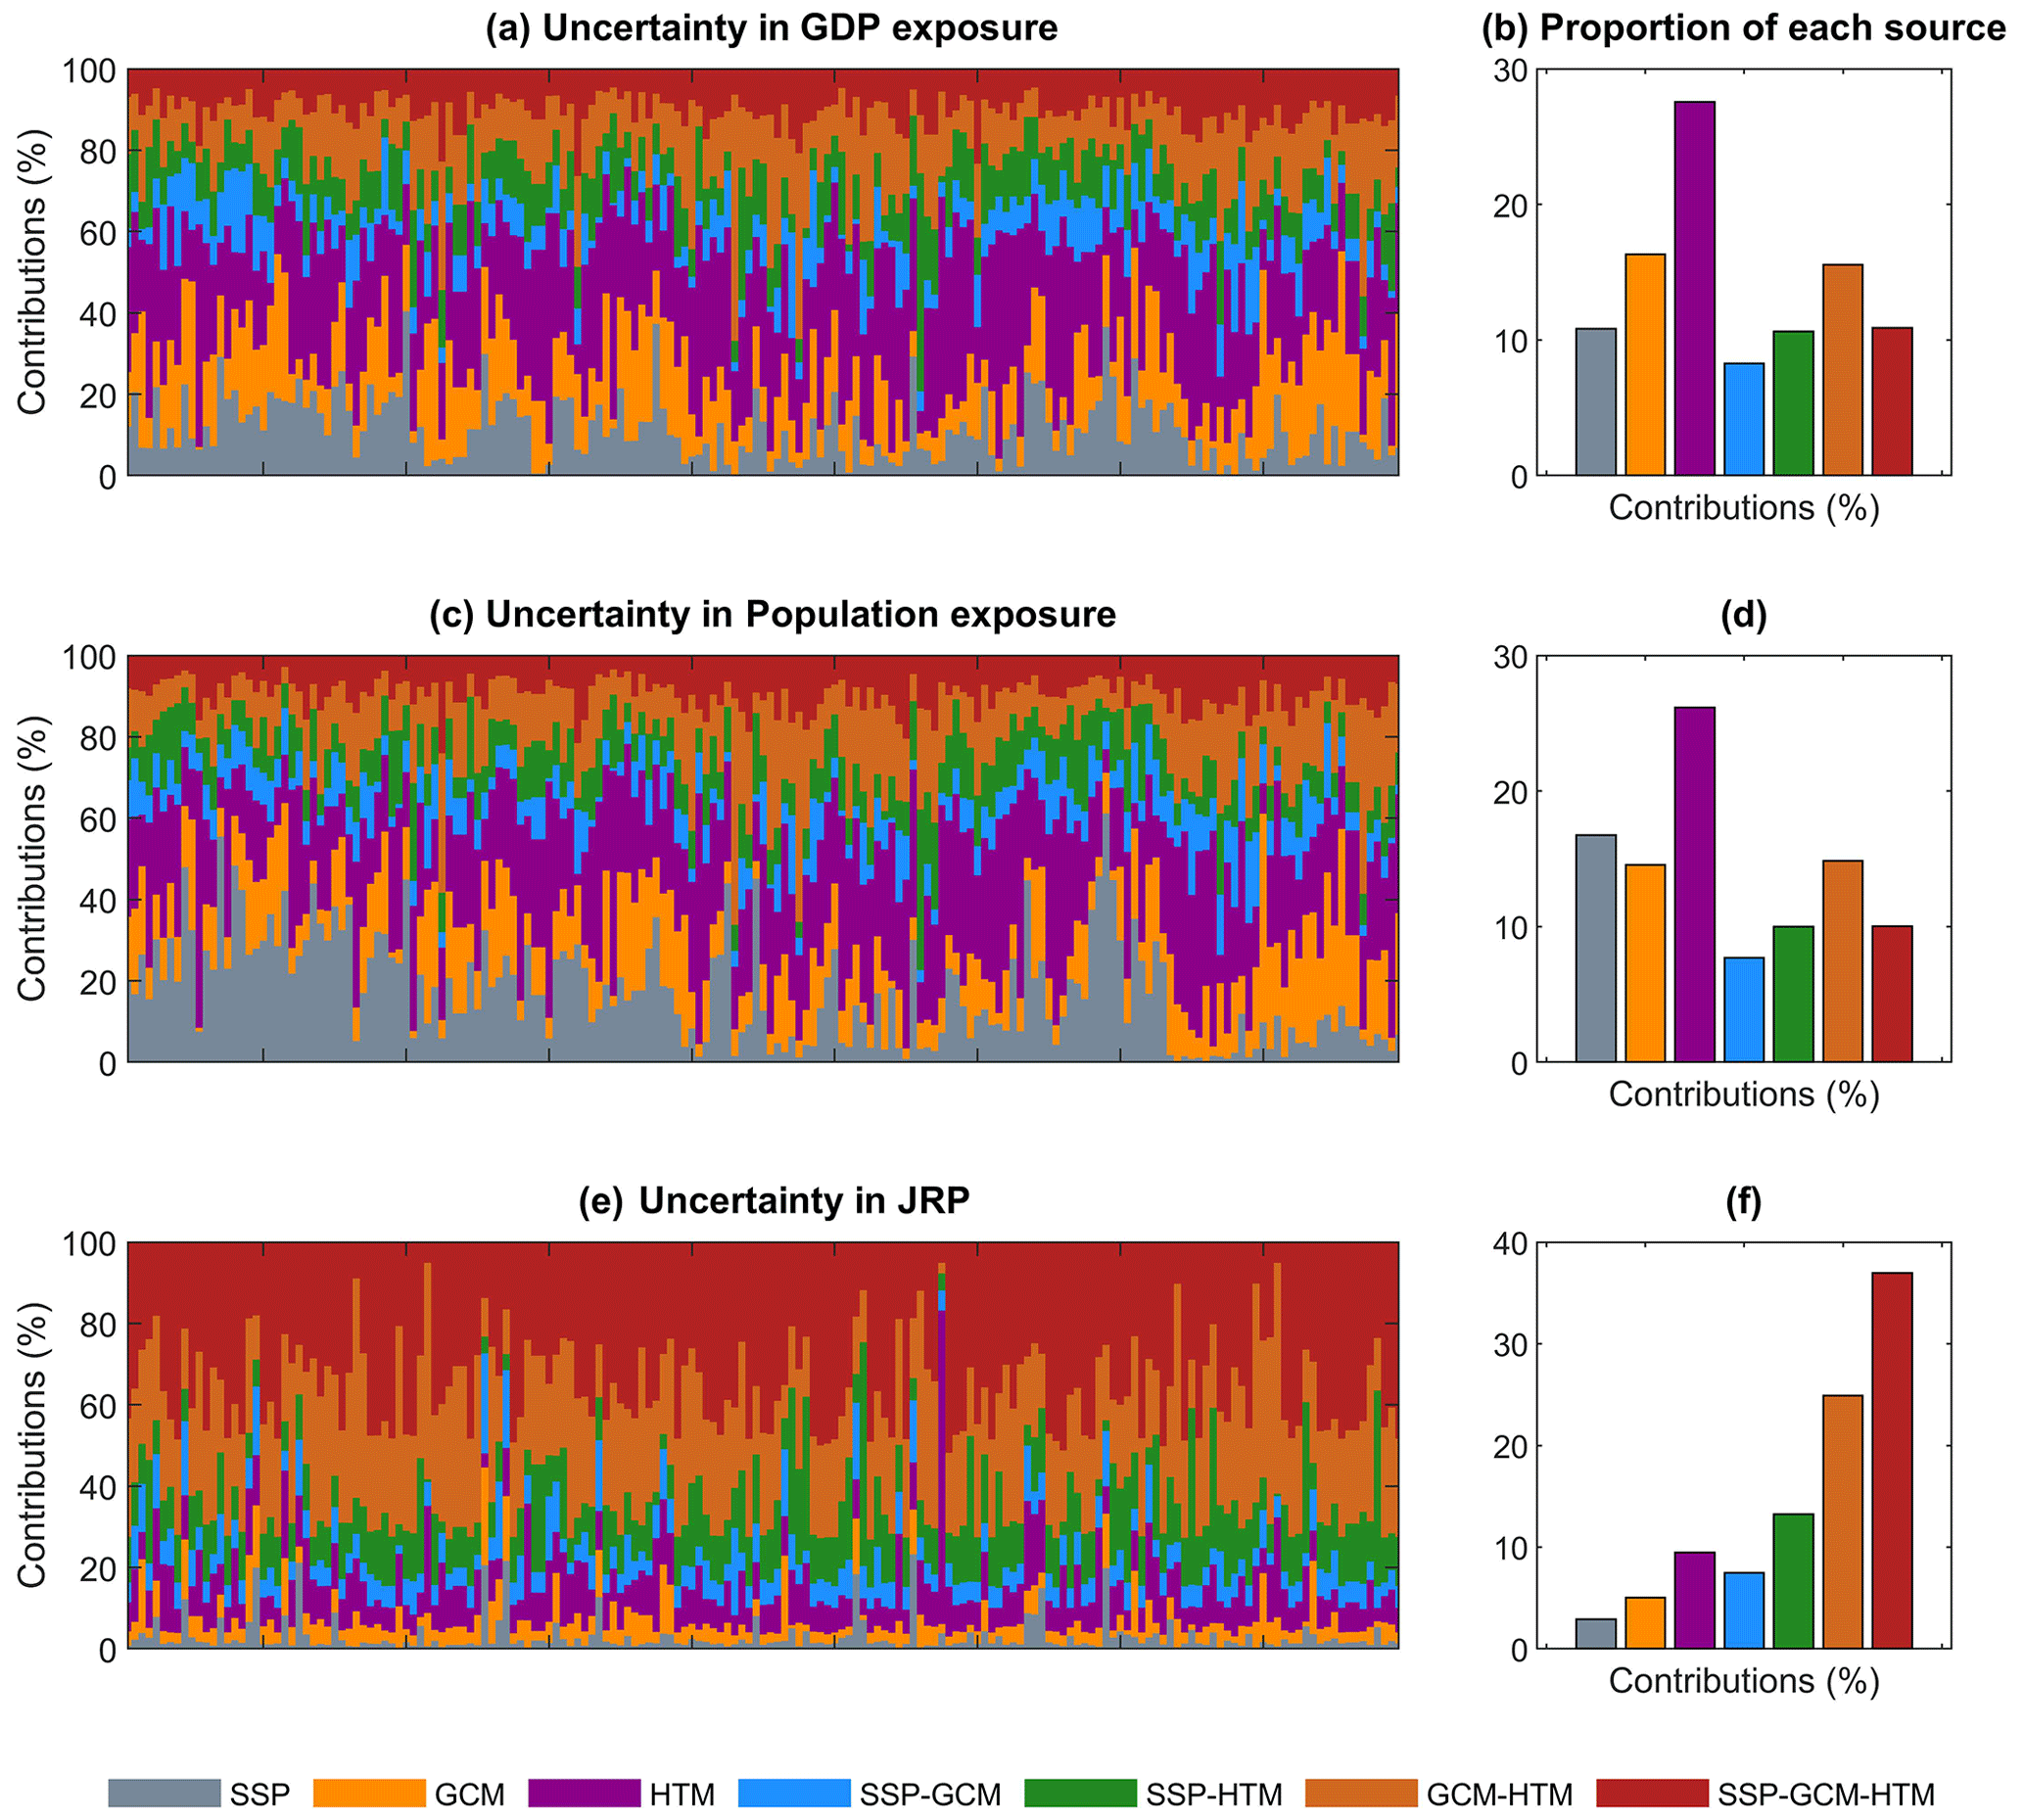
Figure 13The fractional uncertainty contributions of all the sources to the GDP exposure, population exposure, and JRP estimate for all 179 catchments (a, c, e) and the average fractional contribution of each source (b, d, f).
5.2 Limitations and future work
The uncertainty caused by the underlying surface situation and the coupling relationships behind interrelated variables remains unexplained in this study. Therefore, revealing interactions between multisource data is important for understanding how the drivers affect the water cycle under climate change. Here, only five GCM outputs and one in situ observation dataset were used to drive our HTMs. The sparse dataset may undermine the robustness of the approach. Providing a larger number of GCMs and observational data to assemble a more sophisticated model might be an effective approach for improving accuracy and reliability. Although the catchments gathered in this study cover nine major watersheds in China, there is still a requirement for streamflow data with a more uniform spatial density. Considering geospatial sampling techniques, a homogeneous density of catchments is significant for revealing the spatial distribution of drought. On the other hand, due to the heterogeneity of the different climatic regions in China, we would like to expand hydrological models (e.g., the Weather Research and Forecasting hydrological modeling system, the Soil and Water Assessment Tool, or the hydrological modules of land surface process models) to reduce uncertainty in future research. Finally, the GDP and population projections cannot reflect future economic development and population migration well, especially governmental intervention in immigration and economic policies. It is better to consider the dynamic impact of human management on socioeconomic development, which is essential for the construction of a more reliable projection framework.
5.3 Suggestions for drought mitigation in China
In order to curb global warming and mitigate the threats of climate change, the Chinese government is striving to reach its carbon peak before 2030, achieve carbon neutrality before 2060, and bolster efforts in disaster reduction (Kundzewicz et al., 2019; Z. Liu et al., 2022). China has nonetheless experienced several extreme drought events during the past 5 years, threatening the population's health and economic development (Ding and Gao, 2020; Y. Liu et al., 2022; Mallapaty, 2022). The Intergovernmental Panel on Climate Change (IPCC) has emphasized that projections of future climate trends can equip policymakers with the scientific insight needed to navigate the challenges of climate change (Pörtner et al., 2022). The results of this study aim to alert policymakers to drought risk in southwestern China, which was just hit by severe drought events that are expected to significantly intensify with climate change. We strongly highlight the importance of strictly implementing carbon emission reduction initiatives and developing prevention programs to limit potential drought losses. Preserving local ecological balance and employing rational use of water resources could be the key to mitigating potential losses from extreme droughts (Chang et al., 2019; Sohn et al., 2016). Although China has constructed hydraulic structures with a total water storage capacity of over 7064 ×109 m3, current irrigation facilities need to expand to mitigate the challenge of drought under climate change (Cai et al., 2015; Xiao-jun et al., 2012). In addition, it is beneficial for policymakers to establish a drought information system to get a comprehensive collection of drought impacts from all potential sectors, which can link government and research organizations (Wilhite et al., 2007).
The IPCC has emphasized that projections of future climate trends can equip policymakers with the scientific insight needed to navigate the challenges of climate change (Pörtner et al., 2022). The results of this study aim to alert policymakers to drought risk in southwestern China, which is expected to intensify with climate change. Preserving local ecological balance and employing rational use of water resources could be the key to mitigating potential losses from extreme droughts (Chang et al., 2019; Sohn et al., 2016). Finally, this work highlights the importance of strictly implementing carbon emission reduction initiatives and developing prevention programs to limit potential drought losses.
In this study, hybrid LSTM-constrained hydrological models show high efficiency in studied catchments over China, demonstrating that machine learning can effectively constrain hydrological simulation. Projected changes in 50-year bivariate drought characteristics, expressed as a JRP, indicate that the risk of hydrological drought is likely to more than double in over 60 % of catchments by the end of the 21st century under SSP5-85. The spatial distribution of change reveals that the catchments with severely increased drought risk are mainly located in southwestern China. Notably, the exposure of GDP and population varies greatly across different SSPs. The median GDP exposure under SSP5-85 is 1.5 times that of SSP3-70, but the median population exposure is just 40 % that of SSP3-70. The higher population exposure under SSP3-70 can be attributed to rapid population growth. Finally, we find that the interaction between multiple sources of data explains more than 80 % of the uncertainty in future changes in JRPs, showing the importance of considering the relationships between model components. Our findings demonstrate that China will face higher drought risks in a warmer future, emphasizing the urgency of implementing strategies to reduce carbon emissions. Our study is insufficient in the revelation of drought hazard drivers and needs to expand datasets and hydrological models to promote the reliability of simulations in future studies. We would also like to take governmental interference in economic and demographic policies into consideration.
The ISIMIP3b data can be downloaded from https://doi.org/10.48364/ISIMIP.842396.1 (Lange and Büchner, 2021). The ERA5-Land data can be downloaded from https://doi.org/10.24381/cds.e2161bac (Muñoz Sabater, 2019). The gridded meteorological data for China and the streamflow simulations used in this study are available at https://doi.org/10.17605/OSF.IO/FVYSE (Liu, 2023).
The supplement related to this article is available online at: https://doi.org/10.5194/hess-28-3305-2024-supplement.
JY and RL conceived this study. RL, SK and YY performed the modeling and data processing. PL, JG, XG and XZ helped with the data analysis. RL, LS and AV drafted the manuscript. All the authors reviewed the paper and approved the submission.
At least one of the (co-)authors is a member of the editorial board of Hydrology and Earth System Sciences. The peer-review process was guided by an independent editor, and the authors also have no other competing interests to declare.
Publisher's note: Copernicus Publications remains neutral with regard to jurisdictional claims made in the text, published maps, institutional affiliations, or any other geographical representation in this paper. While Copernicus Publications makes every effort to include appropriate place names, the final responsibility lies with the authors. Regarding the maps used in this paper, please note that Figs. 4–9 and 11–12 contain disputed territories.
The numerical calculations in this paper were performed on the supercomputing system in the Supercomputing Center of Wuhan University.
This research has been supported by the National Natural Science Foundation of China (grant nos. 52009091, 52242904, 52261145744, and 52179018) and UK Research and Innovation (grant no. MR/V022008/1).
This paper was edited by Lelys Bravo de Guenni and reviewed by Federico Gómez-Delgado and three anonymous referees.
Allan, R. P., Barlow, M., Byrne, M. P., Cherchi, A., Douville, H., Fowler, H. J., Gan, T. Y., Pendergrass, A. G., Rosenfeld, D., Swann, A. L. S., Wilcox, L. J., and Zolina, O.: Advances in understanding large-scale responses of the water cycle to climate change, Ann. NY Acad. Sci., 1472, 49–75, https://doi.org/10.1111/nyas.14337, 2020.
Antoniadis, A., Lambert-Lacroix, S., and Poggi, J.-M.: Random forests for global sensitivity analysis: A selective review, Reliab. Eng. Syst. Safe., 206, 107312, https://doi.org/10.1016/j.ress.2020.107312, 2021.
Arsenault, R., Essou, G. R., and Brissette, F. P.: Improving hydrological model simulations with combined multi-input and multimodel averaging frameworks, J. Hydrol. Eng., 22, 04016066, https://doi.org/10.1061/(ASCE)HE.1943-5584.0001489, 2017.
Ashrafi, S. M., Gholami, H., and Najafi, M. R.: Uncertainties in runoff projection and hydrological drought assessment over Gharesu basin under CMIP5 RCP scenarios, J. Water Clim. Change, 11, 145–163, 2020.
Ayantobo, O. O., Li, Y., Song, S., and Yao, N.: Spatial comparability of drought characteristics and related return periods in mainland China over 1961–2013, J. Hydrol., 550, 549–567, 2017.
Barker, L. J., Hannaford, J., Chiverton, A., and Svensson, C.: From meteorological to hydrological drought using standardised indicators, Hydrol. Earth Syst. Sci., 20, 2483–2505, https://doi.org/10.5194/hess-20-2483-2016, 2016.
Bergström, S.: The HBV model, in: Computer models of watershed hydrology, 443–476, ISBN 978-0-918334-91-6, 1995.
Bergström, S. and Forsman, A.: DEVELOPMENT OF A CONCEPTUAL DETERMINISTIC RAINFALL-RUNOFF MODEL, Hydrol. Res., 4, 147–170, https://doi.org/10.2166/nh.1973.0012, 1973.
Berne, A., Delrieu, G., Creutin, J.-D., and Obled, C.: Temporal and spatial resolution of rainfall measurements required for urban hydrology, J. Hydrol., 299, 166–179, 2004.
Byakatonda, J., Parida, B. P., Moalafhi, D. B., and Kenabatho, P. K.: Analysis of long term drought severity characteristics and trends across semiarid Botswana using two drought indices, Atmos. Res., 213, 492–508, 2018.
Cai, X., Zeng, R., Kang, W. H., Song, J., and Valocchi, A. J.: Strategic Planning for Drought Mitigation under Climate Change, J. Water Res. Pl., 141, 04015004, https://doi.org/10.1061/(ASCE)WR.1943-5452.0000510, 2015.
Castle, S. L., Thomas, B. F., Reager, J. T., Rodell, M., Swenson, S. C., and Famiglietti, J. S.: Groundwater depletion during drought threatens future water security of the Colorado River Basin, Geophys. Res. Lett., 41, 5904–5911, 2014.
Catani, F., Lagomarsino, D., Segoni, S., and Tofani, V.: Landslide susceptibility estimation by random forests technique: sensitivity and scaling issues, Nat. Hazards Earth Syst. Sci., 13, 2815–2831, https://doi.org/10.5194/nhess-13-2815-2013, 2013.
Chang, J., Guo, A., Wang, Y., Ha, Y., Zhang, R., Xue, L., and Tu, Z.: Reservoir operations to mitigate drought effects with a hedging policy triggered by the drought prevention limiting water level, Water Resour. Res., 55, 904–922, 2019.
Chen, H. and Sun, J.: Increased population exposure to extreme droughts in China due to 0.5 °C of additional warming, Environ. Res. Lett., 14, 064011, https://doi.org/10.1088/1748-9326/ab072e, 2019.
Chen, J., Li, C., Brissette, F. P., Chen, H., Wang, M., and Essou, G. R.: Impacts of correcting the inter-variable correlation of climate model outputs on hydrological modeling, J. Hydrol., 560, 326–341, 2018.
Chen, Y., Guo, F., Wang, J., Cai, W., Wang, C., and Wang, K.: Provincial and gridded population projection for China under shared socioeconomic pathways from 2010 to 2100, Scientific Data, 7, 83, https://doi.org/10.1038/s41597-020-0421-y, 2020.
Chen, Z. and Yang, G.: Analysis of drought hazards in North China: distribution and interpretation, Nat. Hazards, 65, 279–294, https://doi.org/10.1007/s11069-012-0358-3, 2013.
Chiew, F. H. S., Peel, M. C., and Western, A. W.: Application and testing of the simple rainfall-runoff model SIMHYD, in: Mathematical models of small watershed hydrology and applications, 335–367, ISBN 1-887201-35-1, 2002.
Cho, K., Van Merriënboer, B., Gulcehre, C., Bahdanau, D., Bougares, F., Schwenk, H., and Bengio, Y.: Learning phrase representations using RNN encoder-decoder for statistical machine translation, arXiv [preprint], arXiv:1406.1078, 2014.
Chowdary, J. S., Hu, K., Srinivas, G., Kosaka, Y., Wang, L., and Rao, K. K.: The Eurasian jet streams as conduits for East Asian monsoon variability, Curr. Clim. Change Rep., 5, 233–244, 2019.
Dai, A., Zhao, T., and Chen, J.: Climate Change and Drought: a Precipitation and Evaporation Perspective, Curr. Clim. Change Rep., 4, 301–312, https://doi.org/10.1007/s40641-018-0101-6, 2018.
Dikici, M.: Drought analysis with different indices for the Asi Basin (Turkey), Sci. Rep., 10, 20739, https://doi.org/10.1038/s41598-020-77827-z, 2020.
Dikshit, A., Pradhan, B., and Huete, A.: An improved SPEI drought forecasting approach using the long short-term memory neural network, J. Environ. Manage., 283, 111979, https://doi.org/10.1016/j.jenvman.2021.111979, 2021a.
Dikshit, A., Pradhan, B., and Alamri, A. M.: Long lead time drought forecasting using lagged climate variables and a stacked long short-term memory model, Sci. Total Environ., 755, 142638, https://doi.org/10.1016/j.scitotenv.2020.142638, 2021b.
Ding, T. and Gao, H.: The record-breaking extreme drought in Yunnan Province, Southwest China during spring-early summer of 2019 and possible causes, J. Meteorol. Res.-PRC, 34, 997–1012, 2020.
Dixit, S., Atla, B. M., and Jayakumar, K. V.: Evolution and drought hazard mapping of future meteorological and hydrological droughts using CMIP6 model, Stoch. Env. Res. Risk A., 36, 3857–3874, 2022.
Donat, M. G., Lowry, A. L., Alexander, L. V., O'Gorman, P. A., and Maher, N.: More extreme precipitation in the world's dry and wet regions, Nat. Climate Change, 6, 508–513, 2016.
Duan, Q., Sorooshian, S., and Gupta, V.: Effective and efficient global optimization for conceptual rainfall-runoff models, Water Resour. Res., 28, 1015–1031, 1992.
Fujimori, S., Hasegawa, T., Masui, T., Takahashi, K., Herran, D. S., Dai, H., Hijioka, Y., and Kainuma, M.: SSP3: AIM implementation of shared socioeconomic pathways, Global Environ. Chang., 42, 268–283, 2017.
Ganguli, P. and Merz, B.: Trends in compound flooding in northwestern Europe during 1901–2014, Geophys. Res. Lett., 46, 10810–10820, 2019.
Gers, F. A., Schmidhuber, J., and Cummins, F.: Learning to forget: continual prediction with LSTM, Neural Comput., 12, 2451–71, 2000.
Green, J. K., Berry, J., Ciais, P., Zhang, Y., and Gentine, P.: Amazon rainforest photosynthesis increases in response to atmospheric dryness, Science Advances, 6, eabb7232, https://doi.org/10.1126/sciadv.abb7232, 2020.
Gu, L., Chen, J., Yin, J., Sullivan, S. C., Wang, H.-M., Guo, S., Zhang, L., and Kim, J.-S.: Projected increases in magnitude and socioeconomic exposure of global droughts in 1.5 and 2 °C warmer climates, Hydrol. Earth Syst. Sci., 24, 451–472, https://doi.org/10.5194/hess-24-451-2020, 2020a.
Gu, L., Chen, J., Yin, J., Xu, C.-Y., and Zhou, J.: Responses of precipitation and runoff to climate warming and implications for future drought changes in China, Earths Future, 8, e2020EF001718, https://doi.org/10.1029/2020EF001718, 2020b.
Gu, L., Yin, J., Zhang, H., Wang, H.-M., Yang, G., and Wu, X.: On future flood magnitudes and estimation uncertainty across 151 catchments in mainland China, Int. J. Climatol., 41, E779–E800, 2021.
Gu, L., Yin, J., Wang, S., Chen, J., Qin, H., Yan, X., He, S., and Zhao, T.: How well do the multi-satellite and atmospheric reanalysis products perform in hydrological modelling, J. Hydrol., 617, 128920, https://doi.org/10.1016/j.jhydrol.2022.128920, 2023.
He, B., Lü, A., Wu, J., Zhao, L., and Liu, M.: Drought hazard assessment and spatial characteristics analysis in China, J. Geogr. Sci., 21, 235–249, 2011.
Hu, C., Guo, S., Xiong, L., and Peng, D.: A modified Xinanjiang model and its application in northern China, Hydrol. Res., 36, 175–192, 2005.
Jiang, T., Chen, Y. D., Xu, C., Chen, X., Chen, X., and Singh, V. P.: Comparison of hydrological impacts of climate change simulated by six hydrological models in the Dongjiang Basin, South China, J. Hydrol., 336, 316–333, https://doi.org/10.1016/j.jhydrol.2007.01.010, 2007.
Jiang, T., Jing, Z., Cheng, J., Lige, C., Yanjun, W., Hemin, S., Anqian, W., Jinlong, H., Buda, S., and Run, W.: National and provincial population projected to 2100 under the shared socioeconomic pathways in China, Advances in Climate Change Research, 13, 128, 28–137 https://doi.org/10.12006/j.issn.1673-1719.2016.249, 2017.
Jiang, T., Jing, Z., Li-Ge, C. A. O., Yan-Jun, W., Bu-Da, S. U., Cheng, J., Run, W., and Chao, G. A. O.: Projection of national and provincial economy under the shared socioeconomic pathways in China, Advances in Climate Change Research, 14, 50–58, http://www.climatechange.cn/EN/10.12006/j.issn.1673-1719.2017.161 (last access: 20 July 2024), 2018.
Kang, S., Yin, J., Gu, L., Yang, Y., Liu, D., and Slater, L.: Observation-constrained projection of flood risks and socioeconomic exposure in China, Earth's Future, 11, e2022EF003308, https://doi.org/10.1029/2022EF003308, 2023.
Kim, J. H., Sung, J. H., Chung, E.-S., Kim, S. U., Son, M., and Shiru, M. S.: Comparison of Projection in Meteorological and Hydrological Droughts in the Cheongmicheon Watershed for RCP4.5 and SSP2-4.5, Sustainability, 13, 2066, https://doi.org/10.3390/su13042066, 2021.
Koutsoyiannis, D.: Clausius–Clapeyron equation and saturation vapour pressure: simple theory reconciled with practice, Eur. J. Phys., 33, 295, https://doi.org/10.1088/0143-0807/33/2/295, 2012.
Kriauciuniene, J., Jakimavicius, D., Sarauskiene, D., and Kaliatka, T.: Estimation of uncertainty sources in the projections of Lithuanian river runoff, Stoch. Env. Res. Risk A., 27, 769–784, 2013.
Kumar, R., Musuuza, J. L., Van Loon, A. F., Teuling, A. J., Barthel, R., Ten Broek, J., Mai, J., Samaniego, L., and Attinger, S.: Multiscale evaluation of the Standardized Precipitation Index as a groundwater drought indicator, Hydrol. Earth Syst. Sci., 20, 1117–1131, https://doi.org/10.5194/hess-20-1117-2016, 2016.
Kundzewicz, Z., Su, B., Wang, Y., Xia, J., Huang, J., and Jiang, T.: Flood risk and its reduction in China, Adv. Water Resour., 130, 37–45, https://doi.org/10.1016/j.advwatres.2019.05.020, 2019.
Kunnath-Poovakka, A. and Eldho, T. I.: A comparative study of conceptual rainfall-runoff models GR4J, AWBM and Sacramento at catchments in the upper Godavari river basin, India, J. Earth Syst. Sci., 128, 33, https://doi.org/10.1007/s12040-018-1055-8, 2019.
Lange, S.: Trend-preserving bias adjustment and statistical downscaling with ISIMIP3BASD (v1.0), Geosci. Model Dev., 12, 3055–3070, https://doi.org/10.5194/gmd-12-3055-2019, 2019.
Lange, S. and Büchner, M.: ISIMIP3b bias-adjusted atmospheric climate input data (v1.1), ISIMIP Repository [data set], https://doi.org/10.48364/ISIMIP.842396.1, 2021.
Li, D. X.: On default correlation: A copula function approach, SSRN Electr., 9, 187289, https://doi.org/10.2139/ssrn.187289, 1999.
Liu, J., Zhang, Q., Singh, V. P., and Shi, P.: Contribution of multiple climatic variables and human activities to streamflow changes across China, J. Hydrol., 545, 145–162, https://doi.org/10.1016/j.jhydrol.2016.12.016, 2017.
Liu, R.: The streamflow data simulated by 10 hybrid terrestrial models under CMIP6, and TWSA trends data, OSF [data set], https://doi.org/10.17605/OSF.IO/FVYSE, 2023.
Liu, Y., Hu, Z.-Z., Wu, R., and Yuan, X.: Causes and predictability of the 2021 spring southwestern China severe drought, Adv. Atmos. Sci., 39, 1766–1776, 2022.
Liu, Z., Deng, Z., He, G., Wang, H., Zhang, X., Lin, J., Qi, Y., and Liang, X.: Challenges and opportunities for carbon neutrality in China, Nat. Rev. Earth Environ., 3, 141–155, https://doi.org/10.1038/s43017-021-00244-x, 2022.
Lu, R., Xu, K., Chen, R., Chen, W., Li, F., and Lv, C.: Heat waves in summer 2022 and increasing concern regarding heat waves in general, Atmospheric and Oceanic Science Letters, 16, 100290, https://doi.org/10.1016/j.aosl.2022.100290, 2023.
Ma, N., Szilagyi, J., Zhang, Y., and Liu, W.: Complementary-Relationship-Based Modeling of Terrestrial Evapotranspiration Across China During 1982–2012: Validations and Spatiotemporal Analyses, J. Geophys. Res.-Atmos., 124, 4326–4351, https://doi.org/10.1029/2018JD029850, 2019.
Mallapaty, S.: China's extreme weather challenges scientists studying it, Nature, 609, 888, https://doi.org/10.1038/d41586-022-02954-8, 2022.
Martel, J., Demeester, K., Brissette, F., Poulin, A., and Arsenault, R.: HMETS-A simple and efficient hydrology model for teaching hydrological modelling, flow forecasting and climate change impacts, Int. J. Eng. Educ., 33, 1307–1316, 2017.
Meinshausen, M., Nicholls, Z. R. J., Lewis, J., Gidden, M. J., Vogel, E., Freund, M., Beyerle, U., Gessner, C., Nauels, A., Bauer, N., Canadell, J. G., Daniel, J. S., John, A., Krummel, P. B., Luderer, G., Meinshausen, N., Montzka, S. A., Rayner, P. J., Reimann, S., Smith, S. J., van den Berg, M., Velders, G. J. M., Vollmer, M. K., and Wang, R. H. J.: The shared socio-economic pathway (SSP) greenhouse gas concentrations and their extensions to 2500, Geosci. Model Dev., 13, 3571–3605, https://doi.org/10.5194/gmd-13-3571-2020, 2020.
Mokhtar, A., Jalali, M., He, H., Al-Ansari, N., Elbeltagi, A., Alsafadi, K., Abdo, H. G., Sammen, S. S., Gyasi-Agyei, Y., and Rodrigo-Comino, J.: Estimation of SPEI meteorological drought using machine learning algorithms, IEEE Access, 9, 65503–65523, 2021.
Muñoz Sabater, J.: ERA5-Land hourly data from 1950 to present, Copernicus Climate Change Service (C3S) Climate Data Store (CDS) [data set], https://doi.org/10.24381/cds.e2161bac, 2019.
Myronidis, D., Ioannou, K., Fotakis, D., and Dörflinger, G.: Streamflow and hydrological drought trend analysis and forecasting in Cyprus, Water Resour. Manag., 32, 1759–1776, 2018.
Nabaei, S., Sharafati, A., Yaseen, Z. M., and Shahid, S.: Copula based assessment of meteorological drought characteristics: regional investigation of Iran, Agr. Forest Meteorol., 276, 107611, https://doi.org/10.1016/j.agrformet.2019.06.010, 2019.
Nie, N., Zhang, W., Chen, H., and Guo, H.: A global hydrological drought index dataset based on gravity recovery and climate experiment (GRACE) data, Water Resour. Manag., 32, 1275–1290, 2018.
O'Neill, B. C., Tebaldi, C., van Vuuren, D. P., Eyring, V., Friedlingstein, P., Hurtt, G., Knutti, R., Kriegler, E., Lamarque, J.-F., Lowe, J., Meehl, G. A., Moss, R., Riahi, K., and Sanderson, B. M.: The Scenario Model Intercomparison Project (ScenarioMIP) for CMIP6, Geosci. Model Dev., 9, 3461–3482, https://doi.org/10.5194/gmd-9-3461-2016, 2016.
Oudin, L., Hervieu, F., Michel, C., Perrin, C., Andréassian, V., Anctil, F., and Loumagne, C.: Which potential evapotranspiration input for a lumped rainfall–runoff model?: Part 2—Towards a simple and efficient potential evapotranspiration model for rainfall–runoff modelling, J. Hydrol., 303, 290–306, 2005.
Pelosi, A., Terribile, F., D'Urso, G., and Chirico, G. B.: Comparison of ERA5-Land and UERRA MESCAN-SURFEX reanalysis data with spatially interpolated weather observations for the regional assessment of reference evapotranspiration, Water, 12, 1669, https://doi.org/10.3390/w12061669, 2020.
Perrin, C., Michel, C., and Andréassian, V.: Improvement of a parsimonious model for streamflow simulation, J. Hydrol., 279, 275–289, 2003.
Piao, S., Ciais, P., Huang, Y., Shen, Z., Peng, S., Li, J., Zhou, L., Liu, H., Ma, Y., Ding, Y., Friedlingstein, P., Liu, C., Tan, K., Yu, Y., Zhang, T., and Fang, J.: The impacts of climate change on water resources and agriculture in China, Nature, 467, 43–51, https://doi.org/10.1038/nature09364, 2010.
Pokhrel, Y., Felfelani, F., Satoh, Y., Boulange, J., Burek, P., Gädeke, A., Gerten, D., Gosling, S. N., Grillakis, M., and Gudmundsson, L.: Global terrestrial water storage and drought severity under climate change, Nat. Climate Change, 11, 226–233, 2021.
Porter, J. W. and McMahon, T. A.: Application of a catchment model in southeastern Australia, J. Hydrol., 24, 121–134, 1975.
Pörtner, H.-O., Roberts, D. C., Poloczanska, E. S., Mintenbeck, K., Tignor, M., Alegría, A., Craig, M., Langsdorf, S., Löschke, S., and Möller, V.: IPCC: Summary for policymakers, Cambridge University Press, Cambridge, UK and New York, NY, USA, https://doi.org/10.1017/9781009157926.001, 2022.
Qi, W., Chen, J., Li, L., Xu, C., Li, J., Xiang, Y., and Zhang, S.: A framework to regionalize conceptual model parameters for global hydrological modeling, Hydrol. Earth Syst. Sci. Discuss. [preprint], https://doi.org/10.5194/hess-2020-127, 2020.
Rahmati, O., Falah, F., Dayal, K. S., Deo, R. C., Mohammadi, F., Biggs, T., Moghaddam, D. D., Naghibi, S. A., and Bui, D. T.: Machine learning approaches for spatial modeling of agricultural droughts in the south-east region of Queensland Australia, Sci. Total Environ., 699, 134230, https://doi.org/10.1016/j.scitotenv.2019.134230, 2020.
Ren-Jun, Z.: The Xinanjiang model applied in China, J. Hydrol., 135, 371–381, 1992.
Schmidt, R., Schwintzer, P., Flechtner, F., Reigber, C., Güntner, A., Döll, P., Ramillien, G., Cazenave, A., Petrovic, S., and Jochmann, H.: GRACE observations of changes in continental water storage, Global Planet. Change, 50, 112–126, 2006.
Sherstinsky, A.: Fundamentals of recurrent neural network (RNN) and long short-term memory (LSTM) network, Physica D, 404, 132306, https://doi.org/10.1016/j.physd.2019.132306, 2020.
Shin, M.-J. and Kim, C.-S.: Component combination test to investigate improvement of the IHACRES and GR4J rainfall–runoff models, Water, 13, 2126, https://doi.org/10.3390/w13152126, 2021.
Shukla, S. and Wood, A. W.: Use of a standardized runoff index for characterizing hydrologic drought, Geophys. Res. Lett., 35, L02405, https://doi.org/10.1029/2007GL032487, 2008.
Simmons, A. J., Untch, A., Jakob, C., Kållberg, P., and Undén, P.: Stratospheric water vapour and tropical tropopause temperatures in Ecmwf analyses and multi-year simulations, Q. J. Roy. Meteor. Soc., 125, 353–386, 1999.
Sohn, J. A., Saha, S., and Bauhus, J.: Potential of forest thinning to mitigate drought stress: A meta-analysis, Forest Ecol. Manag., 380, 261–273, https://doi.org/10.1016/j.foreco.2016.07.046, 2016.
Sönmez, A. Y. and Kale, S.: Climate change effects on annual streamflow of Filyos River (Turkey), J. Water Clim. Change, 11, 420–433, https://doi.org/10.2166/wcc.2018.060, 2018.
Stewart, I. T.: Changes in snowpack and snowmelt runoff for key mountain regions, Hydrol. Process., 23, 78–94, https://doi.org/10.1002/hyp.7128, 2009.
Tabari, H.: Climate change impact on flood and extreme precipitation increases with water availability, Sci. Rep., 10, 1–10, 2020.
Tapley, B. D., Bettadpur, S., Ries, J. C., Thompson, P. F., and Watkins, M. M.: GRACE measurements of mass variability in the Earth system, Science, 305, 503–505, 2004.
Tian, Y., Xu, Y.-P., and Zhang, X.-J.: Assessment of Climate Change Impacts on River High Flows through Comparative Use of GR4J, HBV and Xinanjiang Models, Water Resour. Manag., 27, 2871–2888, 2013.
Tirivarombo, S., Osupile, D., and Eliasson, P.: Drought monitoring and analysis: standardised precipitation evapotranspiration index (SPEI) and standardised precipitation index (SPI), Phys. Chem. Earth Pt. A/B/C, 106, 1–10, 2018.
Udall, B. and Overpeck, J.: The twenty-first century Colorado River hot drought and implications for the future, Water Resour. Res., 53, 2404–2418, 2017.
Vicente-Serrano, S. M., López-Moreno, J. I., Beguería, S., Lorenzo-Lacruz, J., Azorin-Molina, C., and Morán-Tejeda, E.: Accurate computation of a streamflow drought index, J. Hydrol. Eng., 17, 318–332, 2012.
Wang, Z., Li, J., Lai, C., Zeng, Z., Zhong, R., Chen, X., Zhou, X., and Wang, M.: Does drought in China show a significant decreasing trend from 1961 to 2009?, Sci. Total Environ., 579, 314–324, https://doi.org/10.1016/j.scitotenv.2016.11.098, 2017.
Weinfurt, K. P.: Multivariate analysis of variance, in: Reading and understanding multivariate statistics, American Psychological Association, Washington, DC, US, 245–276, ISBN: 1-55798-273-2, 1995.
Wilhite, D. A., Svoboda, M. D., and Hayes, M. J.: Understanding the complex impacts of drought: A key to enhancing drought mitigation and preparedness, Water Resour. Manage., 21, 763–774, https://doi.org/10.1007/s11269-006-9076-5, 2007.
Woolway, R. I., Kraemer, B. M., Lenters, J. D., Merchant, C. J., O'Reilly, C. M., and Sharma, S.: Global lake responses to climate change, Nat. Rev. Earth Environ., 1, 388–403, https://doi.org/10.1038/s43017-020-0067-5, 2020.
Wu, J., Chen, X., Yao, H., and Zhang, D.: Multi-timescale assessment of propagation thresholds from meteorological to hydrological drought, Sci. Total Environ., 765, 144232, https://doi.org/10.1016/j.scitotenv.2020.144232, 2021.
Wu, X., Guo, S., Yin, J., Yang, G., Zhong, Y., and Liu, D.: On the event-based extreme precipitation across China: Time distribution patterns, trends, and return levels, J. Hydrol., 562, 305–317, 2018.
Xiao-jun, W., Jian-yun, Z., Shahid, S., ElMahdi, A., Rui-min, H., Zhen-xin, B., and Ali, M.: Water resources management strategy for adaptation to droughts in China, Mitig. Adapt. Strat. Gl., 17, 923–937, https://doi.org/10.1007/s11027-011-9352-4, 2012.
Xiujia, C., Guanghua, Y., Jian, G., Ningning, M., and Zihao, W.: Application of WNN-PSO model in drought prediction at crop growth stages: A case study of spring maize in semi-arid regions of northern China, Comput. Electron. Agr., 199, 107155, https://doi.org/10.1016/j.compag.2022.107155, 2022.
Xu, K., Yang, D., Yang, H., Li, Z., Qin, Y., and Shen, Y.: Spatio-temporal variation of drought in China during 1961–2012: A climatic perspective, J. Hydrol., 526, 253–264, 2015.
Yao, F., Livneh, B., Rajagopalan, B., Wang, J., Crétaux, J.-F., Wada, Y., and Berge-Nguyen, M.: Satellites reveal widespread decline in global lake water storage, Science, 380, 743–749, https://doi.org/10.1126/science.abo2812, 2023.
Yevjevich, V. M.: An objective approach to definitions and investigations of continental hydrologic droughts, PhD thesis, Libraries, Colorado State University, https://doi.org/10.1016/0022-1694(69)90110-3, 1967.
Yihdego, Y., Vaheddoost, B., and Al-Weshah, R. A.: Drought indices and indicators revisited, Arab. J. Geosci., 12, 69, https://doi.org/10.1007/s12517-019-4237-z, 2019.
Yilmaz, M.: Accuracy assessment of temperature trends from ERA5 and ERA5-Land, Sci. Total Environ., 856, 159182, https://doi.org/10.1016/j.scitotenv.2022.159182, 2023.
Yin, J., Guo, S., He, S., Guo, J., Hong, X., and Liu, Z.: A copula-based analysis of projected climate changes to bivariate flood quantiles, J. Hydrol., 566, 23–42, 2018.
Yin, J., Guo, S., Gu, L., He, S., Ba, H., Tian, J., Li, Q., and Chen, J.: Projected changes of bivariate flood quantiles and estimation uncertainty based on multi-model ensembles over China, J. Hydrol., 585, 124760, https://doi.org/10.1016/j.jhydrol.2020.124760, 2020.
Yin, J., Guo, S., Gu, L., Zeng, Z., Liu, D., Chen, J., Shen, Y., and Xu, C.-Y.: Blending multi-satellite, atmospheric reanalysis and gauge precipitation products to facilitate hydrological modelling, J. Hydrol., 593, 125878, https://doi.org/10.1016/j.jhydrol.2020.125878, 2021a.
Yin, J., Guo, S., Gentine, P., Sullivan, S. C., Gu, L., He, S., Chen, J., and Liu, P.: Does the hook structure constrain future flood intensification under anthropogenic climate warming?, Water Resour. Res., 57, e2020WR028491, https://doi.org/10.1029/2020WR028491, 2021b.
Yin, J., Guo, S., Yang, Y., Chen, J., Gu, L., Wang, J., He, S., Wu, B., and Xiong, J.: Projection of droughts and their socioeconomic exposures based on terrestrial water storage anomaly over China, Sci. China Earth Sci., 65, 1772–1787, https://doi.org/10.1007/s11430-021-9927-x, 2022.
Yin, J., Gentine, P., Slater, L., Gu, L., Pokhrel, Y., Hanasaki, N., Guo, S., Xiong, L., and Schlenker, W.: Future socio-ecosystem productivity threatened by compound drought–heatwave events, Nat. Sustain., 6, 259–272, https://doi.org/10.1038/s41893-022-01024-1, 2023a.
Yin, J., Guo, S., Wang, J., Chen, J., Zhang, Q., Gu, L., Yang, Y., Tian, J., Xiong, L., and Zhang, Y.: Thermodynamic driving mechanisms for the formation of global precipitation extremes and ecohydrological effects, Sci. China Earth Sci., 66, 92–110, https://doi.org/10.1007/s11430-022-9987-0, 2023b.
Yu, B. and Zhu, Z.: A comparative assessment of AWBM and SimHyd for forested watersheds, Hydrolog. Sci. J., 60, 1200–1212, 2015.
Yu, Y., Si, X., Hu, C., and Zhang, J.: A Review of Recurrent Neural Networks: LSTM Cells and Network Architectures, Neural Comput., 31, 1235–1270, 2019.
Zhai, P. M. and Zou, X. K.: Changes in temperature and precipitation and their impacts on drought in China during 1951–2003, Advances in Climate Change Research, 1, 16–18, 2005.
Zhang, F., Deng, X., Xie, L., and Xu, N.: China's energy-related carbon emissions projections for the shared socioeconomic pathways, Resour. Conserv. Recy., 168, 105456, https://doi.org/10.1016/j.resconrec.2021.105456, 2021.
Zhang, G., Gan, T. Y., and Su, X.: Twenty-first century drought analysis across China under climate change, Clim. Dynam., 59, 1665–1685, 2022.
Zhao, M., A, G., Velicogna, I., and Kimball, J. S.: Satellite Observations of Regional Drought Severity in the Continental United States Using GRACE-Based Terrestrial Water Storage Changes, J. Climate, 30, 6297–6308, https://doi.org/10.1175/JCLI-D-16-0458.1, 2017.
Zheng, J., Wang, H., and Liu, B.: Impact of the long-term precipitation and land use changes on runoff variations in a humid subtropical river basin of China, Journal of Hydrology: Regional Studies, 42, 101136, https://doi.org/10.1016/j.ejrh.2022.101136, 2022.
Zhu, Q., Luo, Y., Zhou, D., Xu, Y.-P., Wang, G., and Tian, Y.: Drought prediction using in situ and remote sensing products with SVM over the Xiang River Basin, China, Nat. Hazards, 105, 2161–2185, 2021.