the Creative Commons Attribution 4.0 License.
the Creative Commons Attribution 4.0 License.
 | 17 Jul 2024
Global-scale evaluation of precipitation datasets for hydrological modelling
Solomon H. Gebrechorkos
Julian Leyland
Simon J. Dadson
Sagy Cohen
Louise Slater
Michel Wortmann
Philip J. Ashworth
Georgina L. Bennett
Richard Boothroyd
Hannah Cloke
Pauline Delorme
Helen Griffith
Richard Hardy
Laurence Hawker
Stuart McLelland
Jeffrey Neal
Andrew Nicholas
Andrew J. Tatem
Ellie Vahidi
Yinxue Liu
Justin Sheffield
Daniel R. Parsons
Stephen E. Darby
Precipitation is the most important driver of the hydrological cycle, but it is challenging to estimate it over large scales from satellites and models. Here, we assessed the performance of six global and quasi-global high-resolution precipitation datasets (European Centre for Medium-Range Weather Forecasts (ECMWF) Reanalysis version 5 (ERA5), Climate Hazards group Infrared Precipitation with Stations version 2.0 (CHIRPS), Multi-Source Weighted-Ensemble Precipitation version 2.80 (MSWEP), TerraClimate (TERRA), Climate Prediction Centre Unified version 1.0 (CPCU), and Precipitation Estimation from Remotely Sensed Information using Artificial Neural Networks-Cloud Classification System-Climate Data Record (PERSIANN-CCS-CDR, hereafter PERCCDR) for hydrological modelling globally and quasi-globally. We forced the WBMsed global hydrological model with the precipitation datasets to simulate river discharge from 1983 to 2019 and evaluated the predicted discharge against 1825 hydrological stations worldwide, using a range of statistical methods. The results show large differences in the accuracy of discharge predictions when using different precipitation input datasets. Based on evaluation at annual, monthly, and daily timescales, MSWEP followed by ERA5 demonstrated a higher correlation (CC) and Kling–Gupta efficiency (KGE) than other datasets for more than 50 % of the stations, whilst ERA5 was the second-highest-performing dataset, and it showed the highest error and bias for about 20 % of the stations. PERCCDR is the least-well-performing dataset, with a bias of up to 99 % and a normalised root mean square error of up to 247 %. PERCCDR only show a higher KGE and CC than the other products for less than 10 % of the stations. Even though MSWEP provided the highest performance overall, our analysis reveals high spatial variability, meaning that it is important to consider other datasets in areas where MSWEP showed a lower performance. The results of this study provide guidance on the selection of precipitation datasets for modelling river discharge for a basin, region, or climatic zone as there is no single best precipitation dataset globally. Finally, the large discrepancy in the performance of the datasets in different parts of the world highlights the need to improve global precipitation data products.
- Article
(4527 KB) - Full-text XML
-
Supplement
(1482 KB) - BibTeX
- EndNote


Whilst precipitation is one of the most important components of the global hydrological cycle and regulates the climate system (Miao et al., 2019; Sadeghi et al., 2021), it remains one of the most challenging variables to estimate at a global scale using satellite data and modelling approaches (Michaelides et al., 2009; Kidd and Levizzani, 2011; Beck et al., 2017a; Ursulak and Coulibaly, 2021). Reliable precipitation data with sufficient spatial and temporal coverage and accurate representation of extreme events are crucial for various applications. These include the development of water resource management and planning strategies, hydrological applications including forecasting hydrological extremes, and climate change analysis (Mehran and AghaKouchak, 2014; Nguyen et al., 2018; Sadeghi et al., 2021; Acharya et al., 2019). Observed precipitation from meteorological stations is typically used at local to river basin scale with gauge-based gridded precipitation datasets, such as from the Global Historical Climatology Network (Menne et al., 2012), developed to study climate and hydrology over larger scales. However, precipitation from gauges and gauge-based gridded datasets has several drawbacks such as limited spatial and temporal coverage, prevalence of missing values, and limited accuracy in sparsely populated and remote areas (Kidd and Levizzani, 2011; Reichle et al., 2011; Kidd et al., 2017; Sun et al., 2018; Gebrechorkos et al., 2018; Hafizi and Sorman, 2022). In addition, data-sharing policies have caused significant challenges in obtaining data, particularly in developing countries (Gebrechorkos et al., 2018; Hafizi and Sorman, 2022).
Given the challenges in representing precipitation at global scales, satellite, climate model, and reanalysis-based precipitation datasets can form the basis for monitoring and prediction of water resources and hydrological extremes, particularly in data-scarce regions of the world (Sheffield et al., 2018; Dembélé et al., 2020). Nevertheless, uncertainties and errors in these datasets require careful analysis to assess their suitability for a specific use. Error in satellite-based precipitation estimates can be due to errors in the sensor measurements, the frequency of sampling, the retrieval algorithms, and the representation of cloud physics (Dembélé et al., 2020; Laiti et al., 2018; Alazzy et al., 2017). Climate-model-based datasets, including reanalyses, have large uncertainty due to their coarse spatial resolution and ambiguity associated with model parameters (Gebrechorkos et al., 2018; AL-Falahi et al., 2020; Dembélé et al., 2020; Her et al., 2019). Reanalysis datasets may correct for some of these errors via the assimilation of observational data, but this comes with its own uncertainties due to the error characteristics of the assimilated observations and the assimilation scheme (Sheffield et al., 2006; Parker, 2016). In hydrological modelling, errors and biases in precipitation data result in poor representation of the hydrological responses and affect applications (Maggioni and Massari, 2018; Zambrano-Bigiarini et al., 2017). For example, according to Bárdossy et al. (2022), uncertainty in precipitation can lead to hydrological model errors of up to 50 %. Hence, it is important to assess the quality and accuracy of the precipitation products before using them in global- or basin-scale hydrological models. In data-limited regions, hydrological models driven by precipitation datasets developed from satellite sources, reanalysis, or climate models are the only plausible way to represent the terrestrial water cycle (van Huijgevoort et al., 2013).
Over the last few decades, several global and quasi-global precipitation datasets have been developed that address some of these challenges and can be used to drive hydrological models at regional and global scales. These precipitation datasets differ in terms of their spatial resolution, spatial coverage (e.g. global or regional), data sources (e.g. gauge, satellite, reanalysis and radar), temporal resolution (e.g. sub-daily and daily), and length of record. It is therefore important to evaluate the accuracy of the datasets before they are used to drive global- or regional-scale hydrological models. Most studies have evaluated precipitation datasets using observed data from field-based meteorological stations at a range of scales (e.g. Beck et al., 2017a; Gebrechorkos et al., 2018; Xiang et al., 2021; Sun et al., 2018; Hong et al., 2022; Wati et al., 2022; AL-Falahi et al., 2020; Ahmed et al., 2019; Fallah et al., 2020). Hydrological models have also been used to assess the quality of the precipitation dataset by comparing simulated and observed discharge across different spatial scales (e.g. Mazzoleni et al., 2019; Beck et al., 2017a; Zhu et al., 2018; Raimonet et al., 2017; Guo et al., 2018; Wang et al., 2020; Salehi et al., 2022; Zhu et al., 2018; Seyyedi et al., 2015). In principle, this latter approach is able to identify the precipitation datasets which best represent hydrological variability including extremes, even in catchments where there have been multiple drivers of change.
There are a limited number of studies assessing multiple precipitation datasets for global hydrological model applications (Voisin et al., 2008; Beck et al., 2017a; Mazzoleni et al., 2019). Voisin et al. (2008) conducted a global-scale evaluation of two precipitation datasets for hydrological modelling. Beck et al. (2017a) compared the performance of 22 precipitation datasets for global hydrological modelling. Mazzoleni et al. (2019) evaluated 18 different precipitation datasets in eight river basins in different continents. Both Beck et al. (2017a) and Mazzoleni et al. (2019) found that merged satellite–observation precipitation products showed the best performance compared to satellite-only products. These studies exclusively concentrate on a daily timescale, evaluating performance solely through the Nash–Sutcliffe efficiency (NSE). Neither study extends this assessment to monthly and annual timescales, and notably, they do not assess the hydrological extremes which are often considered important to capture. Here, we build upon the work by Beck et al. (2017a) by adding recently developed high-resolution precipitation datasets. These include the European Centre for Medium-Range Weather Forecasts (ECMWF) Reanalysis version 5 (ERA5) (Hersbach et al., 2020), TerraClimate (Abatzoglou et al., 2018), Precipitation Estimation from Remotely Sensed Information using Artificial Neural Networks-Cloud Classification System-Climate Data Record (PERSIANN-CCS-CDR, hereafter PERCCDR; Sadeghi et al., 2021), and the latest Multi-Source Weighted-Ensemble Precipitation version 2.80 (MSWEP). These additions significantly broaden the scope of our study, offering a diverse range of products with distinct methodologies. In addition, we use multiple statistical metrics to evaluate the performance of the precipitation products for hydrological modelling at daily, monthly and annual timescales and for daily extremes, which represents a current gap in the modelling literature.
The aim of this study is to undertake a comprehensive evaluation, spanning various temporal and spatial scales, to examine how different input precipitation datasets impact the predictions of a global hydrological model. We assess six high-resolution precipitation datasets, each with records spanning more than 30 years. A comprehensive and physically based gridded global hydrological model (WBMsed; Cohen et al., 2013) is used to simulate river discharge globally. The model incorporates various datasets, including data on reservoirs, dams, and crop water requirements, which significantly influence streamflows. The objective is not to evaluate the absolute performance of the hydrological model, which can be influenced by local factors; rather, our focus is on comparing the relative performance of the six precipitation datasets at individual locations. The modelled discharge, derived from the six precipitation datasets, is assessed across the various timescales by comparing it with observed discharge data collected from 1825 river gauge stations worldwide. Furthermore, we assess the performance of the precipitation products by examining their accuracy in representing daily extreme precipitation events across various percentiles. In summary, this research offers a thorough evaluation of this set of diverse precipitation products, spanning daily extreme events to annual timescales, providing an invaluable resource for selecting appropriate basin-, regional-, and global-scale inputs for hydrological modelling applications.
In the following sections, we outline the various input and evaluation datasets which were used within the WBMsed hydrological modelling framework. The statistical evaluation methods used to assess the results are also outlined.
2.1 Precipitation datasets
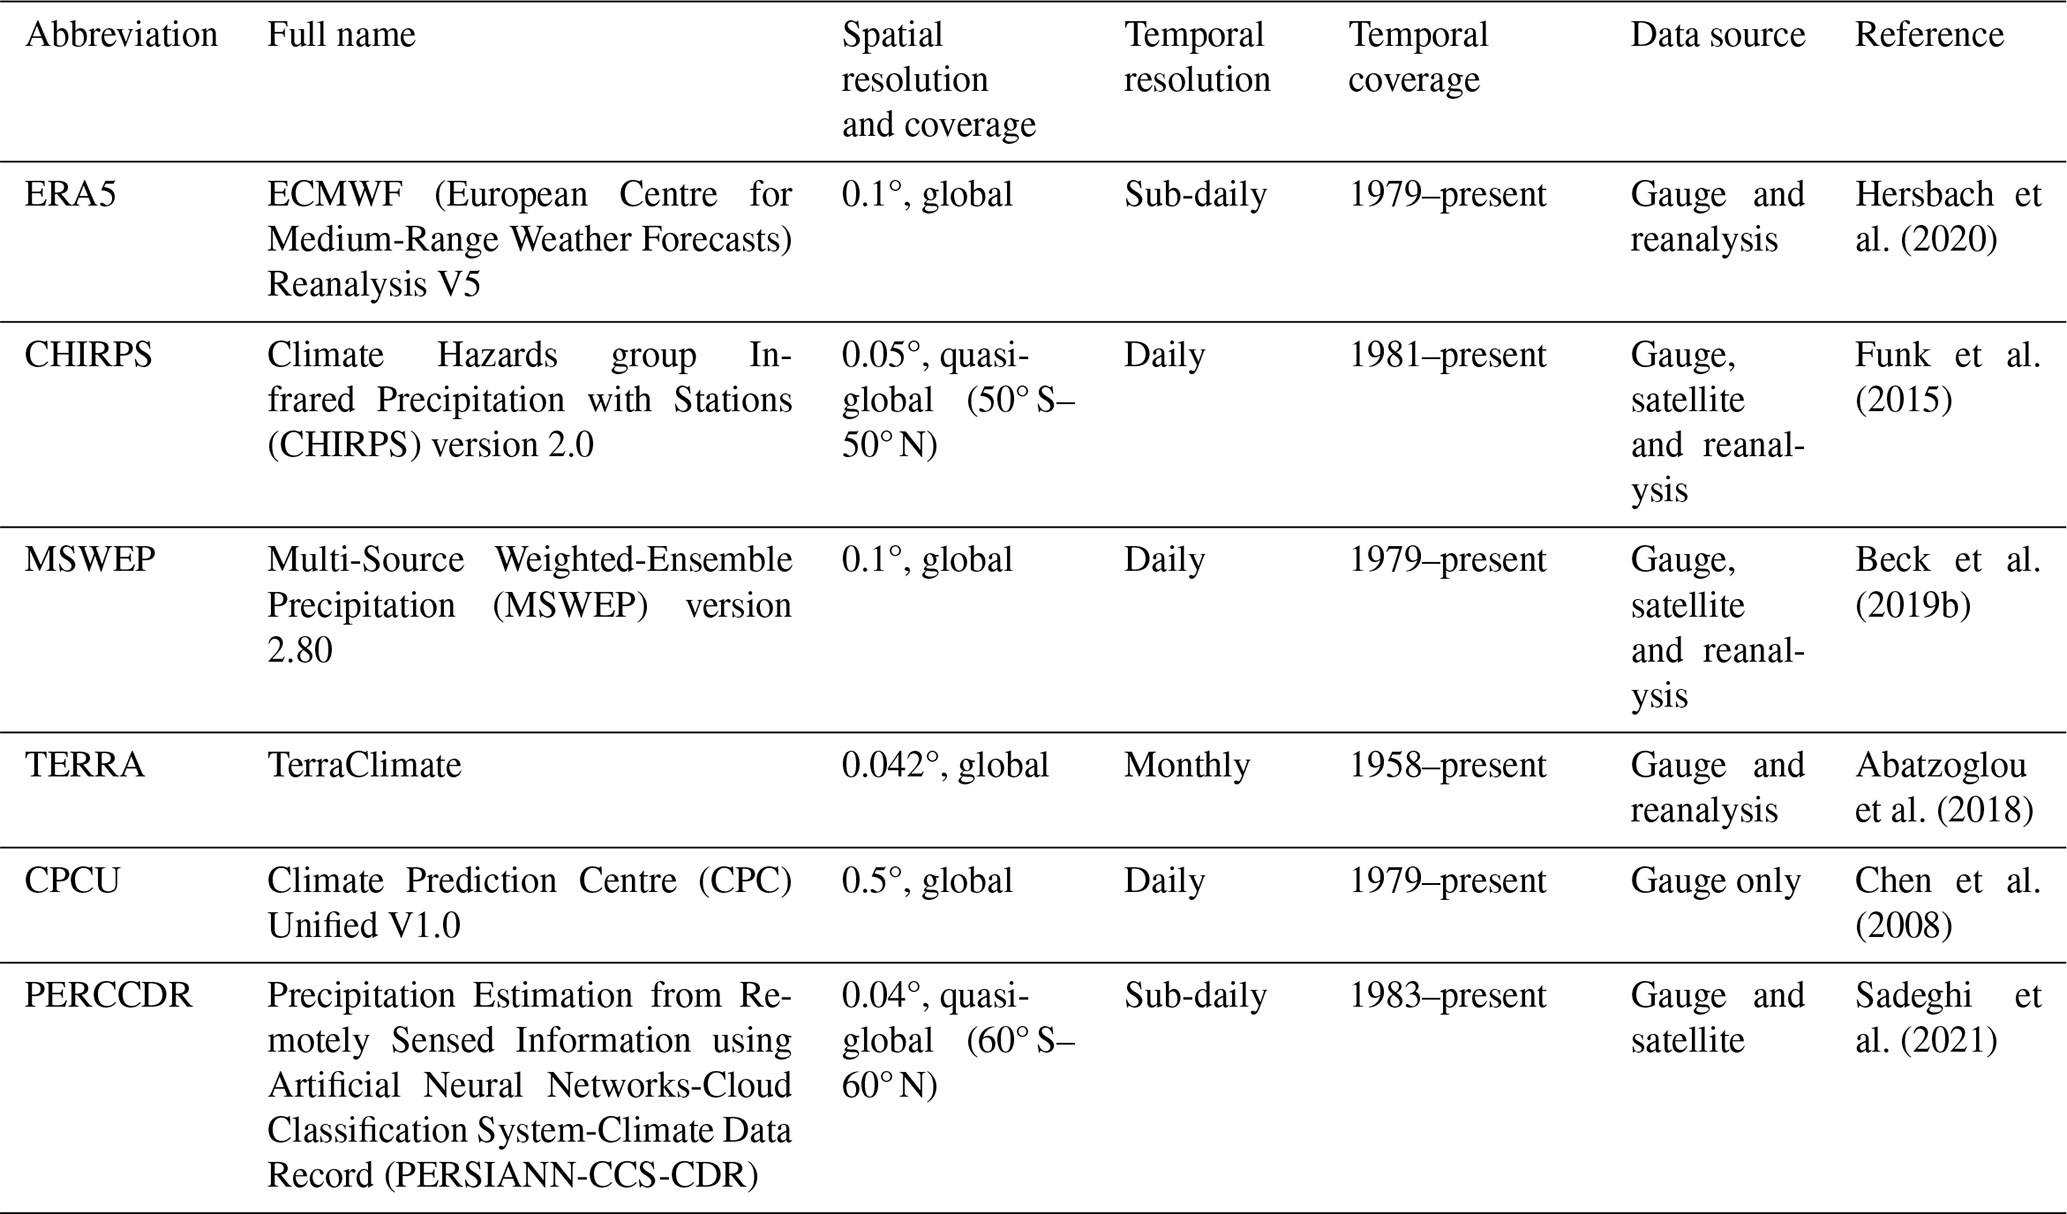
The precipitation datasets used herein are selected based on their length of record (>30-year period), spatial coverage (global and quasi-global), and recommendations from previous research (Beck et al., 2017a) (Table 1). Based on the findings of Beck et al. (2017a), datasets with low performance were excluded, while those demonstrating the highest performance, such as MSWEP and Climate Hazards group Infrared Precipitation with Stations version 2.0 (CHIRPS), were retained, and new datasets were incorporated. The selected precipitation datasets are the ERA5, CHIRPS, MSWEP, TerraClimate (TERRA), Climate Prediction Centre Unified version 1.0 (CPCU), and PERCCDR. Due to their spatial coverage, CHIRPS and PERCCDR are only evaluated up to latitudes of 50 and 60° N, respectively (Table 1). Each dataset was subsequently used to force the WBMsed hydrological model in order to generate streamflow estimates. The availability of these datasets with longer records enables the assessment of long-term hydrological changes at global, regional, and catchment scales.
ERA5 is the fifth-generation European Centre for Medium-Range Weather Forecasts (ECMWF) reanalysis dataset available globally from 1940 to present (Hersbach et al., 2020). ERA5 combines modelled data and observations to create a complete and consistent global climate dataset using advanced data assimilation methods. ERA5 provides improved precipitation representation such as the inclusion of tropical cyclones when compared to ERA-Interim (He et al., 2020; Jiao et al., 2021). In addition, ERA5-Land, a subset of ERA5 focusing on land areas, delivers more detailed climate information at higher spatial resolution (0.1°) from 1950 to the present compared to ERA5 (Hersbach et al., 2020). Here, ERA5-Land (referred to as ERA5) is used to evaluate its performance for global hydrological modelling. The data are freely available from the Copernicus Climate Data Store (https://cds.climate.copernicus.eu/cdsapp#!/dataset/reanalysis-era5-land?tab=overview, last access: 28 April 2023).
CHIRPS is a high-resolution (0.05°) quasi-global rainfall product primarily developed for monitoring droughts and global environmental changes (Funk et al., 2015). CHIRPS provides coupled gauge–satellite precipitation estimates with a 0.05° spatial resolution and long-period records. The product is developed by combining satellite-only Climate Hazards group Infrared Precipitation (CHIRP), Climate Hazards group Precipitation climatology (CHPclim), and data from ground stations. CHIRP and CHPclim were developed based on calibrated infrared cold cloud duration (CCD) precipitation estimates and ground station data from the Global Historical Climate Network (GHCN). The product is available from the Climate Hazards Group (https://www.chc.ucsb.edu/data/chirps/, last access: 20 March 2023) on daily, 10 d, and monthly timescales from the 1981–near present. Due to its availability at high spatial and temporal resolution, CHIRPS is widely used in hydrological studies (Luo et al., 2019; Gebrechorkos et al., 2020; Geleta and Deressa, 2021; Wang et al., 2021; Opere et al., 2022; Day and Howarth, 2019; Gebrechorkos et al., 2019) and modelling of hydrological extremes such as droughts and floods (Chen et al., 2020; Mianabadi et al., 2022; Peng et al., 2020).
MSWEP is a global high-resolution (0.1°) precipitation product developed by merging multiple datasets such as ground stations (∼ 77 000), satellite-based rainfall estimates, and reanalysis data (Beck et al., 2019b). MSWEP was developed by merging station data satellite datasets and reanalysis datasets (Beck et al., 2017b, 2019b). MSWEP has been widely used in regional- and global-scale hydrological studies such as for floods and droughts (Gu et al., 2023; Gebrechorkos et al., 2022b; Reis et al., 2022; Wu et al., 2018; Sun et al., 2022; Gebrechorkos et al., 2022c; Xiang et al., 2021; López López et al., 2017) and for developing high-resolution global-scale hydrological extreme and climate datasets and regional drought monitoring (Gebrechorkos et al., 2023, 2022a; Li et al., 2022b). MSWEP is available from 1979 to present at multiple timescales (e.g. 3-hourly) and can be accessed from the GloH2O website (https://www.gloh2o.org/mswep/, last access: 22 April 2023).
TerraClimate (TERRA) is a high-resolution (0.04°) terrestrial monthly climate (e.g. precipitation and temperature) and climatic water-balance dataset available from 1958–2020 (Abatzoglou et al., 2018). TERRA was developed by combining high- and coarse-spatial-resolution datasets such as WorldClim climatological normals and Climatic Research Unit gridded Time Series (CRU TS) and JRA-55, respectively. The data were evaluated against ground observation from the Historical Climate Network and exhibited better performance than the CRU-TS (Abatzoglou et al., 2018). The monthly climate and climatic water balance is available from the Climatology Lab website (https://www.climatologylab.org/, last access: 21 April 2023).
CPCU is a gauge-based analysis of daily precipitation datasets available globally from 1979 to present at a spatial resolution of 0.5° (Chen et al., 2008). CPCU is the product of the CPC Unified Precipitation project at NOAA Climate Prediction Center. The product uses data from more than 30 000 (1979–2005) and 17 000 (2006–present) stations. The CPCU data are publicly available at the NOAA Physical Sciences Laboratory (PSL; https://downloads.psl.noaa.gov/Datasets/cpc_global_precip/, last access: 28 April 2023) and have been used for hydrological and climate studies (Beck et al., 2017a; Zhu et al., 2021; Hou et al., 2014).
PERCCDR is a quasi-global (latitude from 60° S to 60° N) dataset developed at the University of California (Sadeghi et al., 2021). PERCCDR provides precipitation estimates at high spatial (0.04°) and temporal (3-hourly) resolutions from 1983 to present. The dataset is developed using the rain rate output from the PERSIANN-CCS model, which uses GridSat-B1 IR and NOAA Climate Prediction Center (CPC-4km) IR data. Compared to other PERSIANN precipitation datasets, PERCCDR provides a realistic representation of precipitation extremes globally and shows better agreement with CPCU precipitation (Sadeghi et al., 2021). PERCCDR has been used in hydrological studies (Salehi et al., 2022; Eini et al., 2022) and is freely available from the Center for Hydrometeorology and Remote Sensing (CHRS) Data Portal (https://chrsdata.eng.uci.edu/, last access: 22 April 2023).
Table 1The six precipitation datasets used in this study and their spatial and temporal resolution, spatial coverage, and data sources.
2.2 WBMsed hydrological model
The WBMsed (Cohen et al., 2013, 2014) model is used to assess the performance of the different precipitation datasets for hydrological modelling globally. WBMsed is a global-scale hydrogeomorphic model, an extension of the WBMplus global hydrology model (Wisser et al., 2010), which is part of the FrAMES biogeochemical modelling framework (Wollheim et al., 2008). The WBMplus model is one of the first global hydrological models (GHMs) applied to a global domain (Cohen et al., 2013; Grogan et al., 2022). The WBMsed model extends the WBMplus model by including sediment flux modules (suspended, bedload and suspended bed material; Cohen et al., 2022). While we are not analysing sediment flux in this paper, we opted to use the WBMsed model for consistency with consequent analysis. The hydrological prediction of WBMsed is equivalent to WBMplus.
The model represents the major hydrological cycle components of the land surface and tracks the balances and fluxes between the atmosphere, surface water storages, vegetation, runoff, and groundwater (Grogan et al., 2022). The model includes hydrological infrastructure (e.g. dams and reservoirs), agricultural water requirements, and domestic and industrial water uses. A gridded river network connects grid cells, which allows for the routing of fluxes downstream (e.g. streamflow). The model requires several climate datasets as input in addition to precipitation, including temperature, humidity, air pressure, and wind speed (Table S1). Additional parameters such as field capacity, rooting depth, and riverbed slope are used to drive the model.
We use an identical model setup to that used by Cohen et al. (2022) with all input datasets as detailed in Cohen et al. (2013). Updates include daily ERA5 air temperature (Hersbach et al., 2020) re-gridded at 10 arcmin resolution, reservoir capacity from the global reservoir and dam database (GRanD v1.3; Lehner et al., 2011), and a 6 arcmin HydroSTN30 network derived from HydroSHEDS (Lehner et al., 2008). In addition, we used each of the six input precipitation datasets, ERA5, CHIRPS, MSWEP, TERRA, CPCU, and PERCCDR in turn, keeping all other parameters and inputs the same. All the input precipitation datasets are bilinearly interpolated to the same spatial resolution of 0.1°. Even though WBMsed can disaggregate monthly time series into daily time series, TERRA (only available at monthly resolution; see Table 1) is evaluated on monthly and annual timescales, whilst all other datasets are evaluated at daily, monthly, and annual timescales. WBMsed simulations were run at 0.1° (∼11 km at the Equator) spatial and daily and monthly temporal resolutions. Several WBMsed streamflow validation analyses have been reported previously (e.g. Cohen et al., 2022; Dunn et al., 2019; Cohen et al., 2014, 2013; Moragoda and Cohen, 2020), which indicates that the model represents the long-term average observed streamflow globally. It is important to note that this study assesses the precipitation datasets without calibration of the WBMsed model for each precipitation dataset, which could theoretically improve their performance in replicating observed river discharge.
2.3 Observed river discharge from ground stations
Observed daily and monthly river discharge used to evaluate the hydrological model was obtained from the Global Runoff Data Centre (GRDC, 2023). The GRDC is an international data archive (https://www.bafg.de/GRDC/, last access: 26 February 2023), which hosts data for over 10 000 hydrological stations. The number of stations with a length of record greater than 10 years during the evaluation period (1981–2019) is limited. Here, we consider stations with a minimum record length of 10 years, allowing for missing values within this period. Due to the spatial resolution of the input datasets and the model simulations (∼ 11×11 km), we only consider stations with a catchment area of greater than 100 km2. Overall, 1825 suitable stations were identified with daily and monthly records, largely in North and South America, Europe, and Australia, with very few stations in Africa and Asia (Fig. 1).
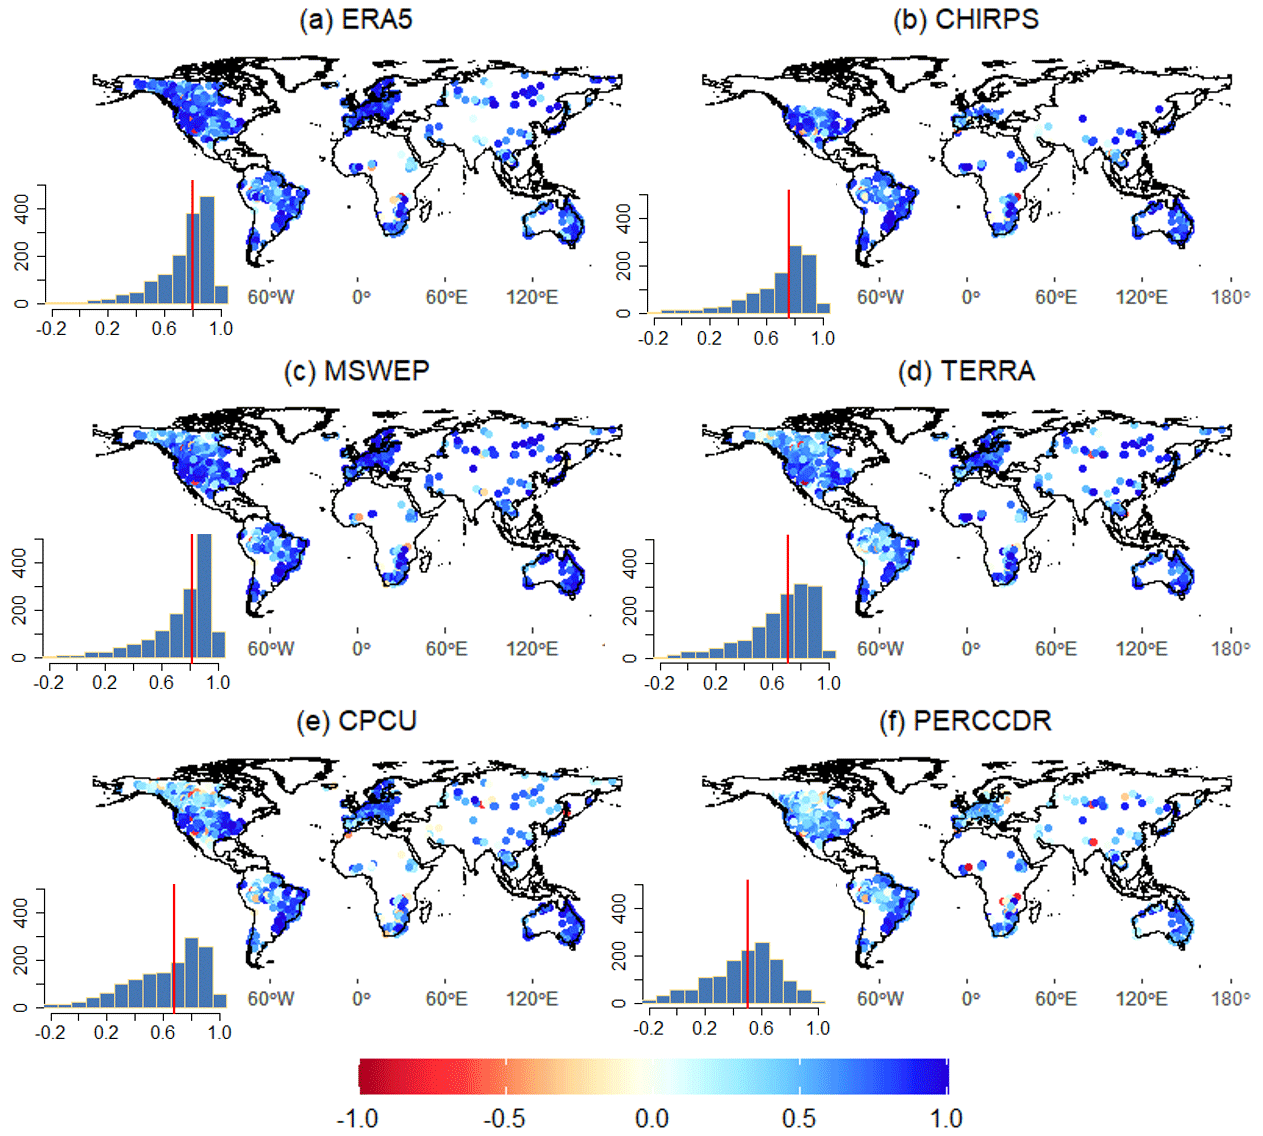
Figure 1Correlation (CC) between annual observed and modelled streamflow data using (a) ERA5, (b) CHIRPS, (c) MSWEP, (d) TERRA, (e) CPCU, and (f) PERCCDR precipitation datasets. The inset histograms show the frequency distribution (y axis) of the annual CC (x axis), with the vertical red line indicating the median value.
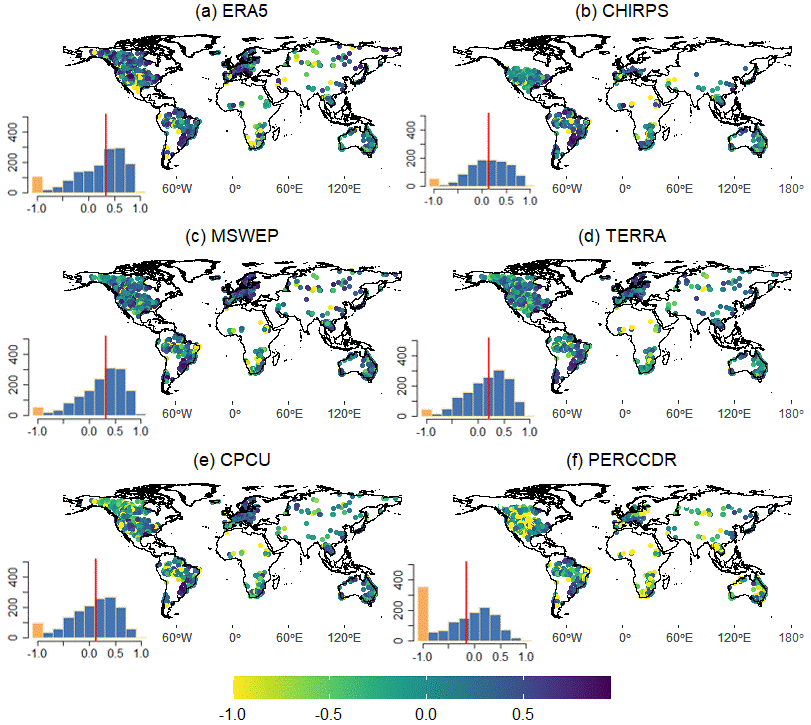
Figure 2KGE between observed and modelled annual streamflow based on (a) ERA5, (b) CHIRPS, (c) MSWEP, (d) TERRA, (e) CPCU, and (f) PERCCDR precipitation datasets. KGE values below −0.41 indicate worse model performance than using observed discharge mean as a predictor. The inset histograms show the frequency distribution (y axis) of the annual KGE (x axis). KGE values lower than −1 are highlighted in orange. The vertical red line indicates the median value.
2.4 Evaluation metrics
Several methods are used to assess the modelled discharge using the streamflow observations: the Pearson correlation coefficient (CC; Eq. 1), Kling–Gupta efficiency (KGE; Eq. 2) (Gupta et al., 2009), root mean square error (RMSE; Eq. 3), and percentage of bias (Pbias; Eq. 4). CC measures the linear relationship between observed discharge and simulated discharge, focusing primarily on the degree of association between the two datasets. It is particularly useful for assessing the strength and direction of this relationship, highlighting how well the model captures the variability in discharge (Moazami et al., 2013). KGE is a comprehensive metric that evaluates the overall agreement between observed and simulated streamflow, considering similarities in variability, amplitude, and timing. It provides an assessment of the model's ability to capture both the magnitude and temporal dynamics of the observed discharge (Gupta et al., 2009). RMSE measures the average magnitude of the differences between observed and simulated discharge, providing a measure of the overall goodness of fit. Moreover, the percentage of bias is used to quantify the systematic overestimation or underestimation of discharge by the model compared to observations (Moazami et al., 2013). A KGE value of 1.0 indicates a perfect match between the observed and simulated discharge, whereas values lower than −0.41 show that the model is worse than using the mean of the observed discharge as a predictor (Knoben et al., 2019). For spatial comparison, the RMSE is normalised by the standard deviation of the observed data (NRMSE; Eq. 5).
where r is the linear correlation between observed (O) and modelled (M) discharge, and α and β are the variability and bias ratios, respectively. The NRMSE and SD are the normalised RMSE and standard deviation, respectively. To assess the performance of the precipitation datasets for representing daily hydrological extremes, the 90th and 10th percentiles are used, which indicate high and low flows, respectively. To derive high- and low-flow thresholds from a daily flow time series, the data are first arranged in ascending order. The 90th percentile (Q10) is then determined as the flow value above which 90 % of the daily flows lie, representing high-flow conditions. Similarly, the 10th percentile (Q90) represents the flow value below which 90 % of the daily flows occur, indicating low-flow conditions.
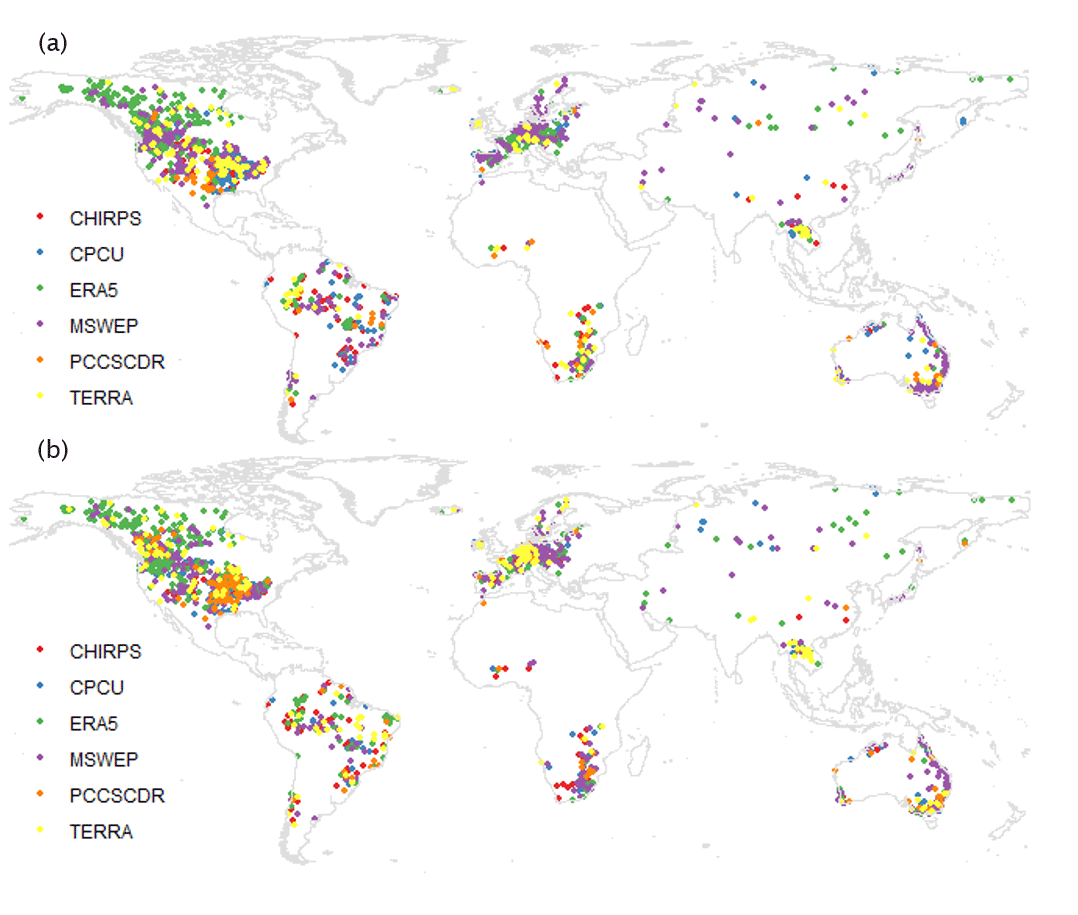
Figure 3The best-performing precipitation dataset (ERA5, CHIRPS, MSWEP, TERRA, CPCU, and PERCCDR) at each of the observed discharge stations based on annual CC (a) and KGE (b).
3.1 Performance of the six precipitation datasets for annual discharge prediction
The temporal correlation coefficient (CC) between the observed and simulated annual discharge based on the six precipitation datasets is summarised in Fig. 1. Most of the datasets, particularly ERA5, MSWEP, and CHIRPS, showed a high CC in basins of Europe (e.g. Danube basin), South America (e.g. Rio de la Plata–Parana), North America, and Australia (e.g. Murray–Darling). MSWEP and ERA5 showed the highest CC for 34 % and 32 % of the stations, respectively, followed by CPCU and CHIRPS. TERRA and PERCCDR were the least-well-performing datasets, with a lower CC overall and a higher CC than other datasets for less than 9 % of stations. The median CC of MSWEP and ERA5 is 0.82 and 0.8, respectively. MSWEP and TERRA showed lower Pbias and NRMSE compared to the other datasets (Figs. S1 and S2). ERA5 and PERCCDR showed a high NRMSE (up to 247 %) and Pbias (up to 99 %) for more than 46 % of stations. Similar to the CC, ERA5 and MSWEP outperformed the other datasets for KGE, with higher values for 32 % and 27 % of stations, respectively. The performance of MSWEP and ERA5 is higher in basins of Europe, South America, and Australia compared to Asia and Africa. The median KGE values of ERA5 and MSWEP are 0.33 and 0.32, respectively (Fig. 2). PERCCDR and CPU only demonstrate high KGE for about 9 % of the stations, with median values of 0.10 and 0.13, respectively. Based on the annual CC and KGE, there is no single precipitation dataset that is best everywhere, and even the least-well-performing dataset overall shows better performance in some stations (Fig. 3). Figure 3 summarises the spatial representation of precipitation dataset performance, highlighting the individual datasets exhibiting the highest CC and KGE values at each observation point.
3.2 Performance of the six precipitation datasets for monthly discharge predictions
The six precipitation datasets consistently demonstrate high CC at a monthly scale in large parts of the world, except in some rivers of Canada and Australia (Fig. 4). The monthly CC, similar to the annual CC, shows a relatively better performance of MSWEP with a median CC of 0.76. TERRA is the second best, with a median CC of 0.69. MSWEP and TERRA show a higher CC than other datasets for 35 % and 28 % of the stations, respectively. ERA5 and CHIRPS are ranked as the third and fourth datasets, with a median CC of 0.71 and 0.75, respectively. CPCU and PERCCDR are the least-well-performing datasets, which only show the highest CC for less than 6 % of the stations, with a median CC of 0.67 and 0.56, respectively.
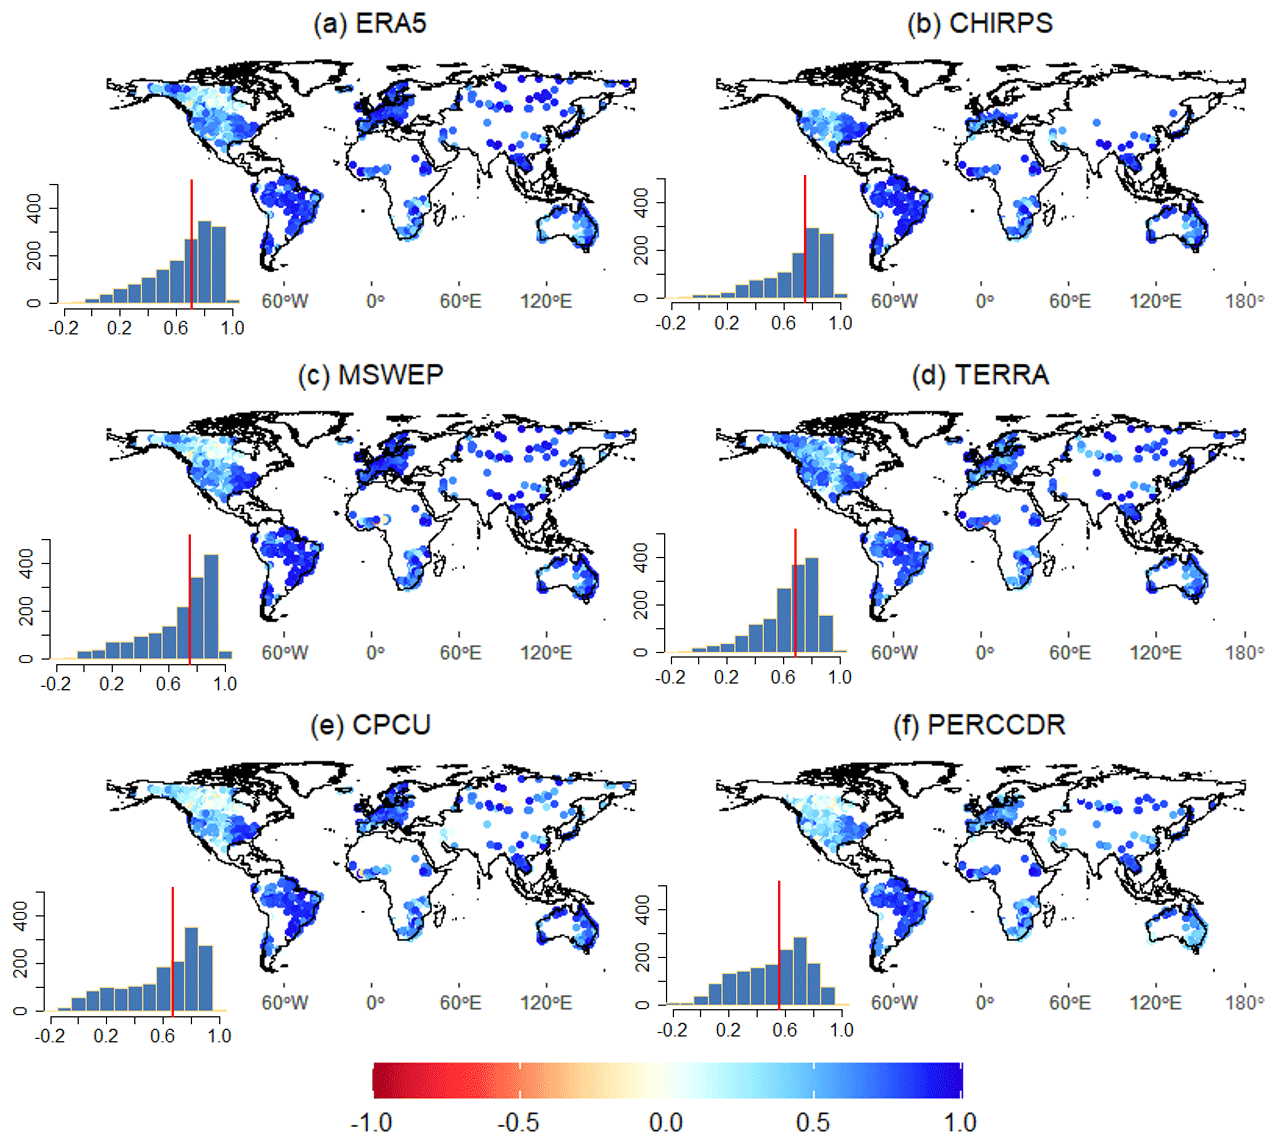
Figure 4Correlation (CC) between monthly observed and modelled streamflow data based on (a) ERA5, (b) CHIRPS, (c) MSWEP, (d) TERRA, (e) CPCU, and (f) PERCCDR precipitation datasets. The inset histograms show the frequency distribution (y axis) of the monthly CC (x axis), with the vertical red line indicating the median value.
The monthly KGE also indicates the better performance of ERA5 and MSWEP for 26 % and 24 % of stations, respectively (Fig. 5). MSWEP showed a lower Pbias and NRMSE than all datasets, except in 5 % of the stations (Figs. S3 and S4). Compared to MSWEP, ERA5 showed a larger Pbias and NRMSE in 15 % and 19 % of the stations. TERRA, the third-best-performing dataset based on KGE (18 % of stations), shows a lower monthly Pbias and RMSE in 85 % of the stations compared to CHIRPS, ERA5, and PERCCDR. Compared to all datasets, PERCCDR showed a higher NRMSE and Pbias in 55 % and 28 % of the stations, respectively.
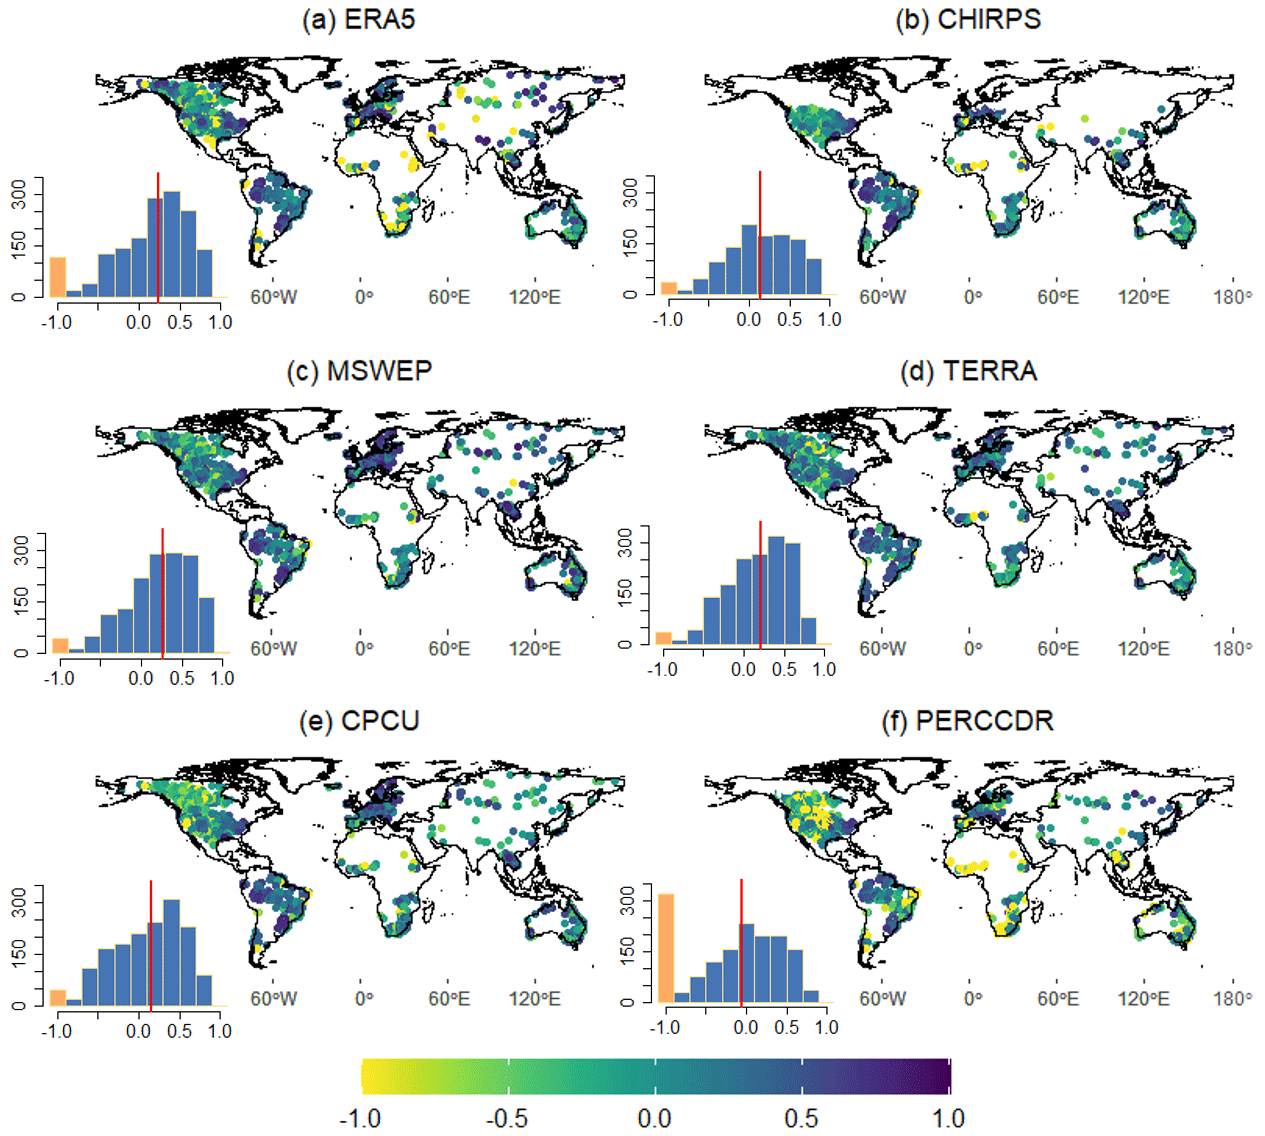
Figure 5Monthly KGE values between observed and modelled streamflow based on ERA5, (b) CHIRPS, (c) MSWEP, (d) TERRA, (e) CPCU, and (f) PERCCDR precipitation datasets. KGE values below −0.41 indicate model performance that is worse than using the observed discharge mean as a predictor. The inset histograms show the frequency distribution (y axis) of the monthly KGE (x axis). KGE values lower than −1 are highlighted in orange, with the vertical red line indicating the median value.
The spatial representation of the six precipitation datasets in the Amazon, Mississippi, Danube, and Orange River basins is summarised in Fig. 6, highlighting the individual datasets exhibiting the highest CC and KGE values at each hydrological station. In the Amazon basin, ERA5 (31 %) and CHIRPS (29 %) emerge as the top performers, while PERCCDR (8 %) and TERRA (5 %) rank lower among the precipitation datasets. In the Mississippi basin, MSWEP leads with a higher CC for 37 % of stations, and ERA5 holds the top products with higher KGE values for 31 % of the stations. Notably, PERCCDR displays higher KGE values than MSWEP, TERRA, CHIRPS, and CPCU for 30 % of Mississippi stations. Across the Danube basin, MSWEP outperforms the other products, with a higher CC in 66 % of stations and KGE for 30 % of the stations, while TERRA and CPCU are the least-well-performing products. Furthermore, CHIRPS, for 52 % of stations based on CC and 37 % based on KGE, outperformed other datasets in the Orange River basin. In Orange, MSWEP ranks second, with higher KGE and CC for about 27 % of stations, while TERRA and PCCSCDR are the least-well-performing datasets.
Table 2KGE of monthly predictions for selected stations in basins of Africa (Niger), Asia (Mekong), South America (Amazon), North America (Mississippi), Australia (northeast coast), and Europe (Danube).
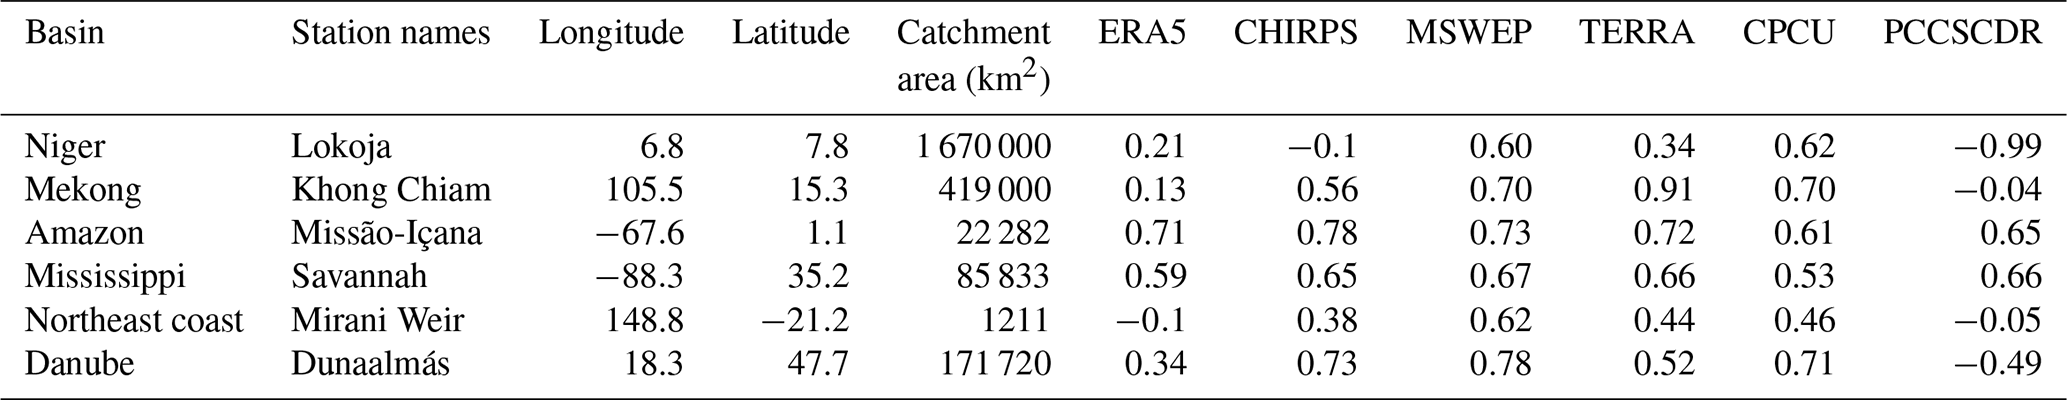
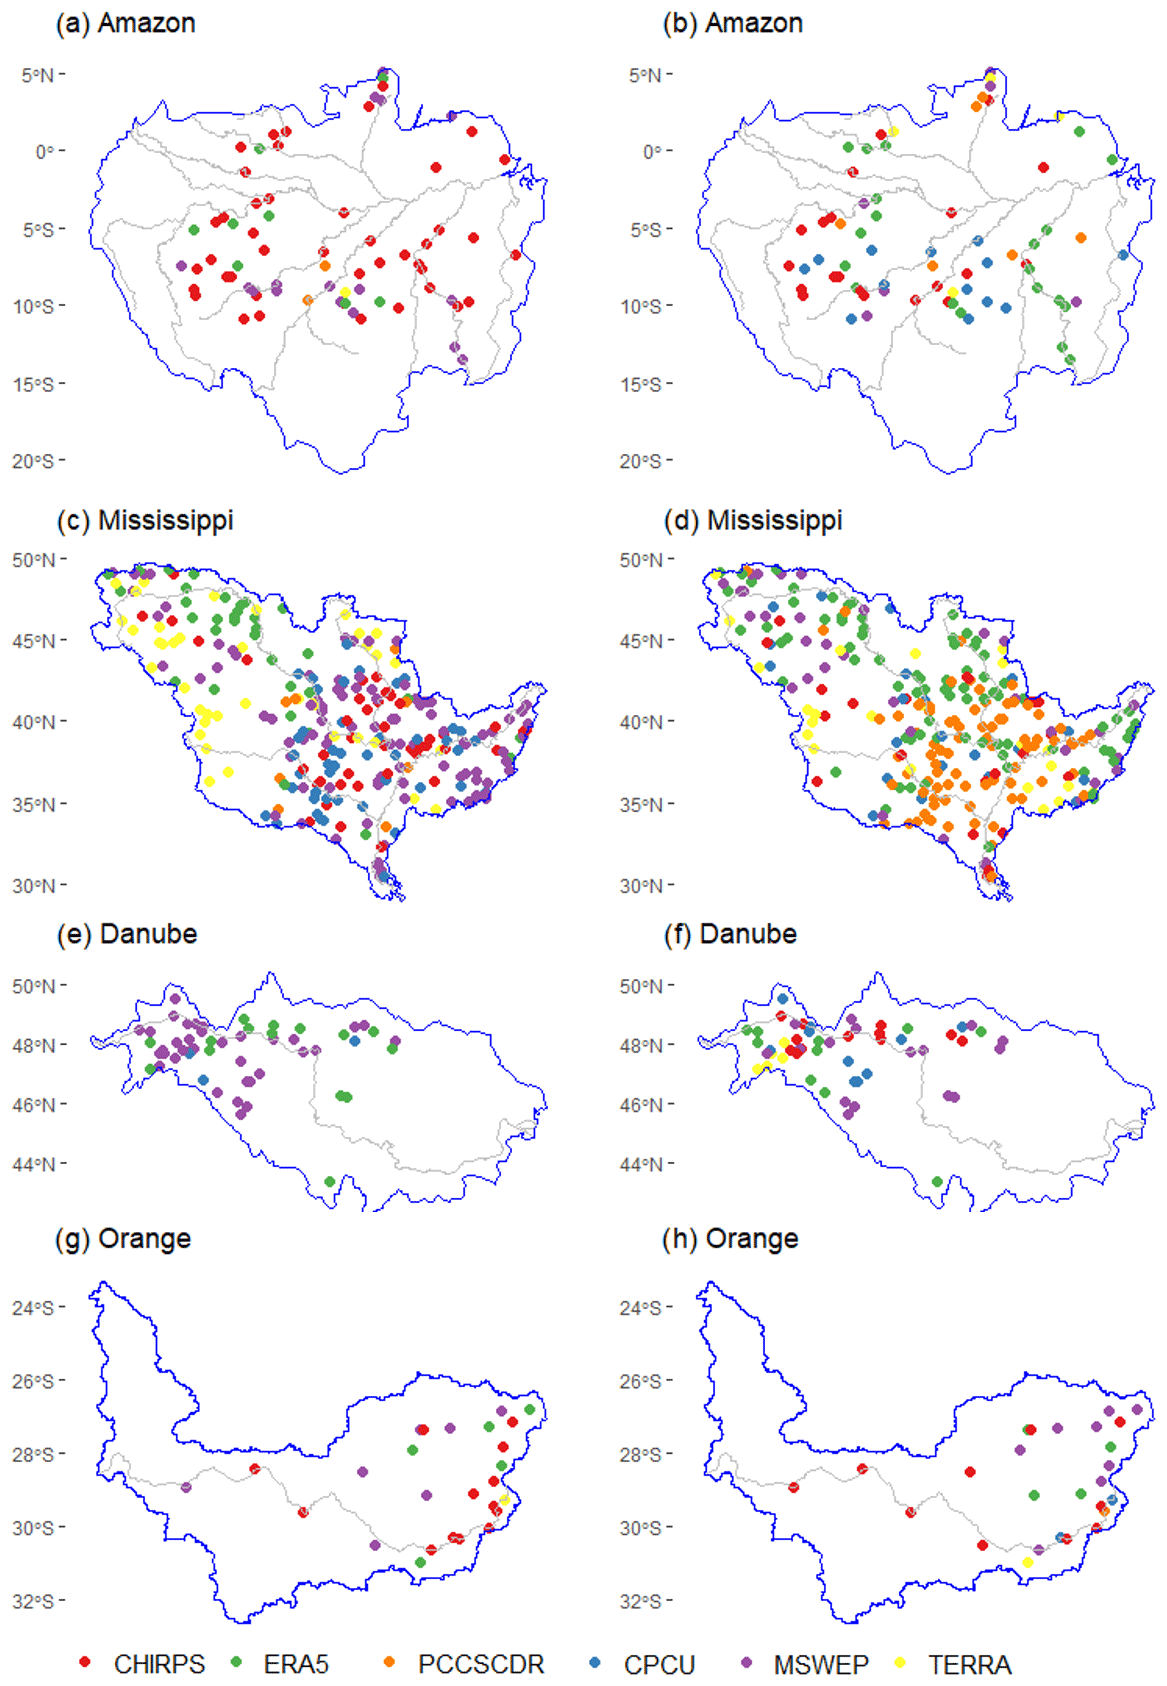
Figure 6Performance of precipitation datasets (ERA5, CHIRPS, MSWEP, TERRA, CPCU, and PERCCDR) at discharge stations in (a) Amazon, (c) Mississippi, (e) Danube, and (g) Orange River basins based on their monthly CC. Performance of the datasets based on KGE for the Amazon, Mississippi, Danube, and Orange River basins is illustrated in panels (b), (d), (f), and (h), respectively.
Table 2 summarises the monthly KGE between observed and modelled streamflow, based on the six precipitation datasets, for selected locations in basins of Africa (Niger, Lokoja), Asia (Mekong, Khong Chiam), South America (Amazon, Missão-Içana), North America (Mississippi, Savannah), Australia (northeast coast, Mirani Weir), and Europe (Danube, Dunaalmás). The basins were chosen to represent a good range of climatic regions and drainage areas where there was availability of a long time series of observed data (Fig. S5). In Niger, the observed monthly flow and variability at Lokoja station are very well reproduced by CHIRPS and TERRA, with a CC of 0.88 and 0.85, respectively (Fig. S5a). Even though CPCU showed a lower CC (0.64) at Lokoja, it showed a higher KGE (0.62) and lower Pbias (0.4 %) compared to the other products. At Lokoja, PERCCDR is the least-well-performing dataset, with the highest RMSE and Pbias and lowest KGE. The monthly variability at the Khong Chiam station is reproduced by all the precipitation products, with a CC of greater than 0.91, with MSWEP and TERRA showing the lowest bias and RMSE. ERA5 and CHIRPS performed well at Missão-Içana station in the Amazon with a CC of 0.9 and RMSE of about 610 m3 s−1. For stations Savannah, Mirani Weir, and Dunaalmás, MSWEP is the best product, with higher CC (>0.72) and KGE (>0.62) and lower Pbias and RMSE (Fig. S5d–f).
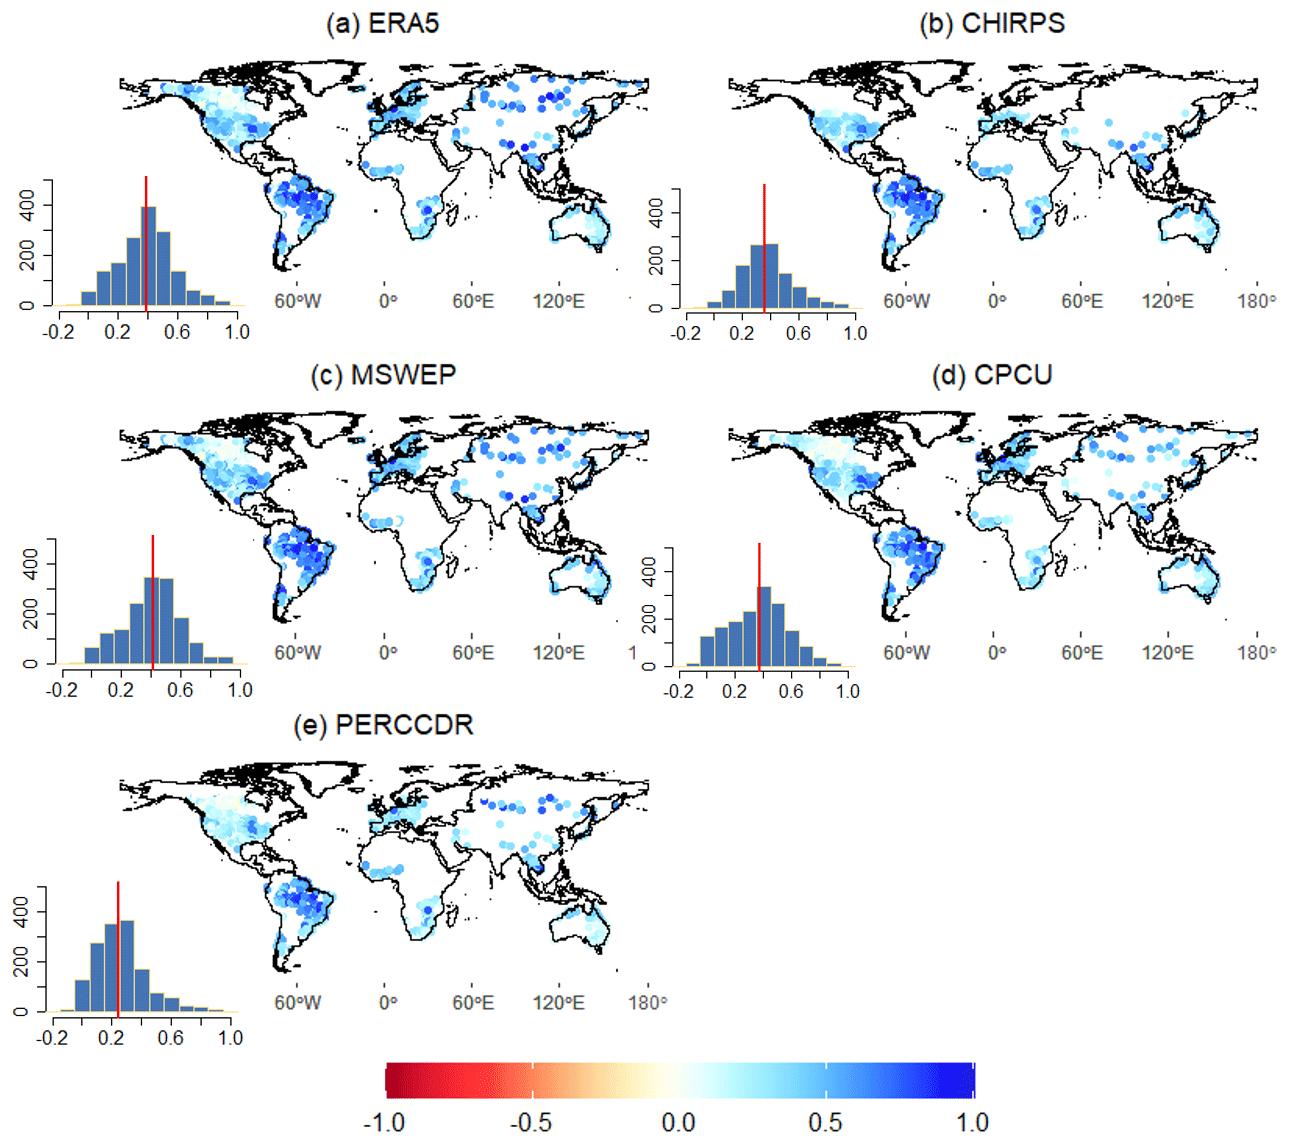
Figure 7Correlation (CC) between daily observed and modelled streamflow data using (a) ERA5, (b) CHIRPS, (c) MSWEP, (d) CPCU, and (e) PERCCDR precipitation datasets. The inset histograms show the frequency distribution (y axis) of the daily CC (x axis), with the vertical red line indicating the median value.
3.3 Performance of the precipitation datasets for daily and daily extreme discharge predictions
Based on the daily evaluation, MSWEP followed by ERA5 showed a higher CC in more than 50 % of the stations, with median values of 0.41 and 0.39, respectively (Fig. 7). ERA5 and MSWEP performed well in 31 % and 31 % of the stations with high KGE values (Fig. 8). Similar to the monthly evaluation, PERCCDR shows poorer performance (lower CC and KGE, higher biases and errors) in almost 95 % of the stations. Even though ERA5 showed a higher CC and KGE in 30 % of the stations, it shows a higher NRMSE (up to 250 %) and Pbias (up to 100 %) in 20 % and 30 % of the stations (Figs. S6 and S7). Overall, MSWEP and CHIRPS showed lower NRMSE and Pbias compared to the other products. The CC and KGE of all the products (except CHIRPS) are lower in North America compared to stations in South America, Europe, and Australia. The spatial representation of precipitation dataset performance, highlighting the individual datasets exhibiting the highest daily CC and KGE values at each observation point, is provided in Fig. S9. Additionally, Fig. S10 depicts the spatial representation of each precipitation dataset for the Amazon, Mississippi, Danube, and Orange River basins. In Mississippi, ERA5 exhibited the highest KGE and CC values, followed by MSWEP and CPCU (Fig. S10). In the Amazon, ERA5 and CHIRPS displayed the highest KGE and CC values compared to the other datasets. For the Danube, CPCU followed by MSWEP emerged as the best precipitation product relative to ERA5, PCCSCDR, and CHIRPS. In the Orange River basin, MSWEP based on CC and CHIRPS based on KGE were the top-performing products, while PCCSCDR performed the least well.
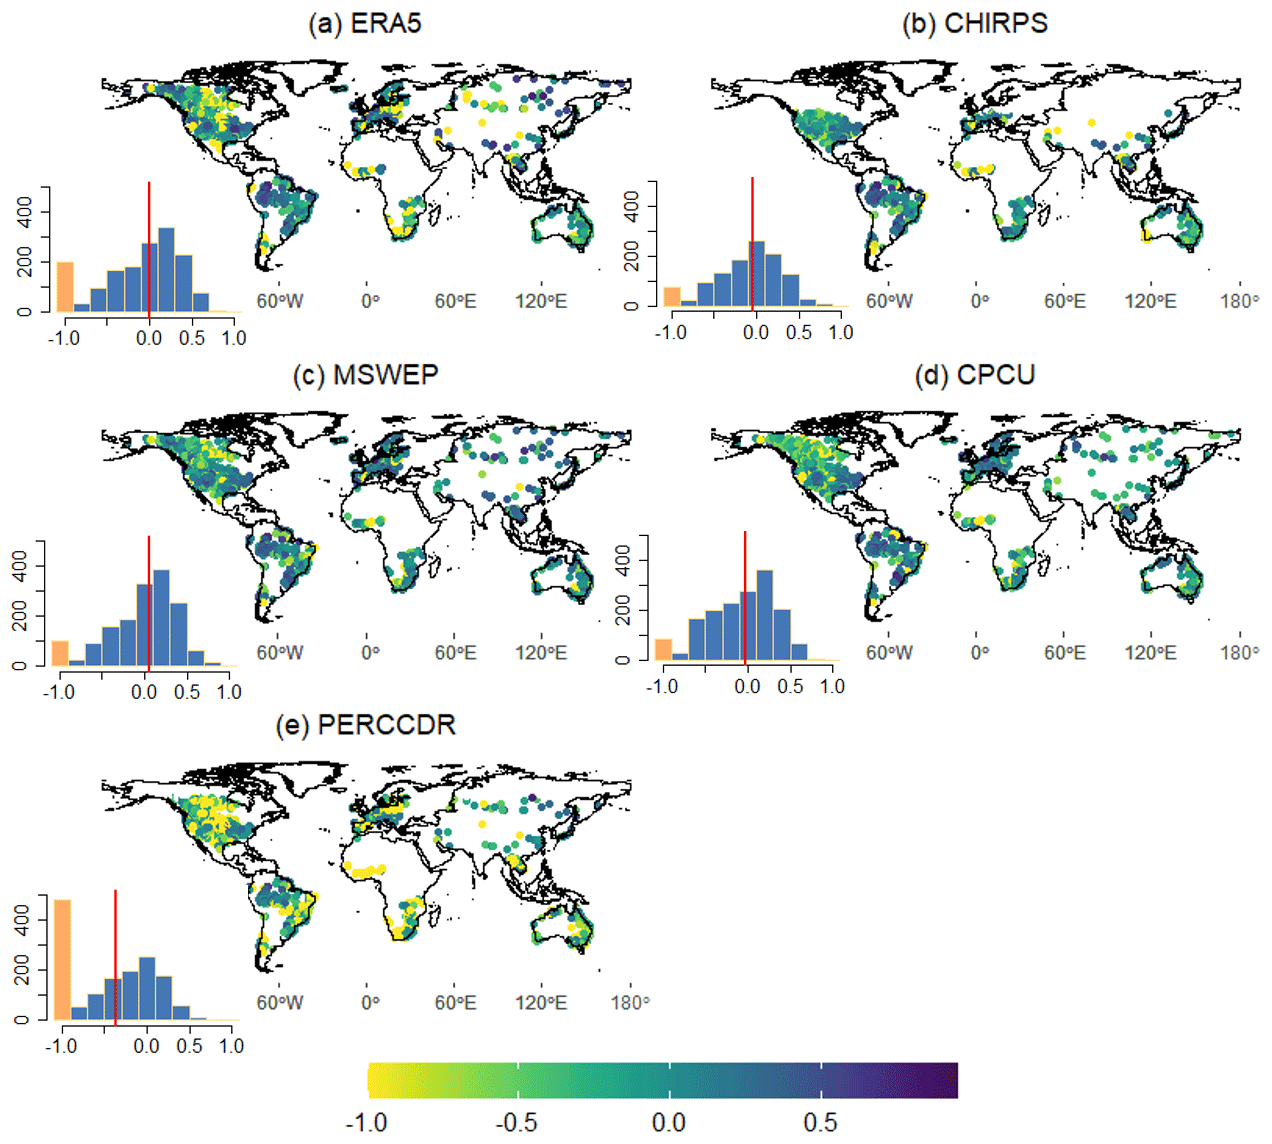
Figure 8Daily KGE values between observed and modelled streamflow based on (a) ERA5, (b) CHIRPS, (c) MSWEP, (d) CPCU and (e) PERCCDR precipitation datasets. KGE values below −0.41 indicate bad model performance than using observed discharge mean as a predictor. The inset histograms show the frequency distribution (y axis) of the daily KGE (y axis). KGE values lower than −1 are highlighted in orange, with the vertical red line indicating the median value.
The performance of the daily precipitation products is also assessed for daily extremes in terms of the Q10 and Q90 values. Based on the CC, MSWEP is the best-performing dataset for Q10 (Fig. 9) and Q90 (Fig. S8). For Q10, MSWEP and CPCU exhibited a higher CC than other datasets at 38 % and 32 % of the stations, respectively. Similarly, for Q90, MSWEP and ERA demonstrated a higher CC compared to other datasets at 35 % and 30 % of the stations. The median CC for Q10 (Q90) is 0.32 (0.41), 0.28 (0.36), 0.27 (0.35), 0.26 (0.38), and 0.16 (0.23) for MSWEP, CPCU, CHIRPS, ERA5, CHIRPS, and PERCCDR, respectively. Similar to the annual, monthly, and daily evaluations, PERCCDR showed poor performance for the two extremes (Q90 and Q10). Overall, the performance of the datasets is lower for extremes compared to the annual, monthly, and daily scales.
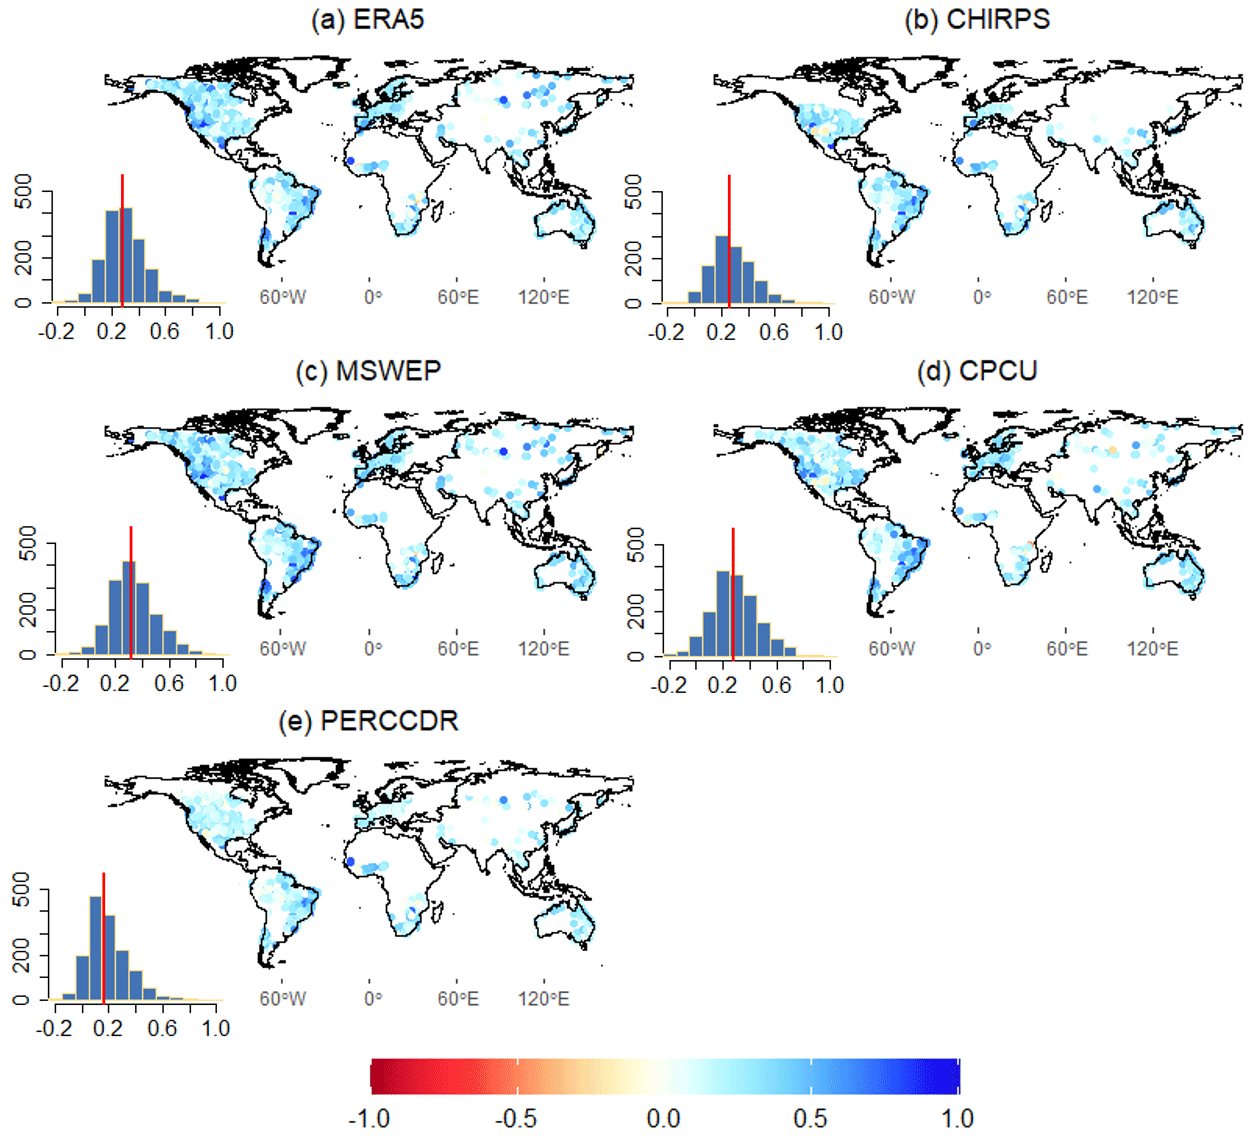
Figure 9Correlation (CC) between observed and modelled daily extremes (Q10, high flow) of streamflow data modelled by (a) ERA5, (b) CHIRPS, (c) MSWEP, (d) CPCU, and (e) PERCCDR precipitation datasets. The inset histograms show the frequency distribution (y axis) of the daily Q10 CC (x axis), with the vertical red line indicating the median value.
Based on the evaluation at annual, monthly, and daily timescales and analysis of daily extremes, no single precipitation dataset consistently exhibits high accuracy across all geographical regions, nor is one consistently better than the other datasets. This finding is in line with previous studies (Beck et al., 2017a; Dembélé et al., 2020). A similar pattern of varied performance (e.g. lower in Africa and the central United States and better in Europe) by different global hydrological models and precipitation datasets has been presented (Beck et al., 2017a; Lin et al., 2019; Harrigan et al., 2020). In addition to the uncertainty in the precipitation datasets, the poorer performance in some regions presented in this and previous studies (Beck et al., 2017a; Lin et al., 2019; Harrigan et al., 2020) can be due to the lack of representation in the hydrological models of anthropogenic influences, such as for agriculture, irrigation, water supply, and energy production.
Comparably, MSWEP and ERA5 consistently exhibited higher CC and KGE values at over 50 % of the stations across annual, monthly, and daily timescales. According to Gu et al. (2023), satellite- and reanalysis-based precipitation datasets, such as MSWEP and ERA5, can provide satisfactory performance for simulating discharge globally. The higher performance of MSWEP indicates the advantage of incorporating a large number of daily observations from field-based meteorological stations, in addition to a large set of satellite and reanalysis datasets (Beck et al., 2017a, 2019a). Other studies have also shown the good performance of MSWEP for hydrological modelling in different parts of the world (Beck et al., 2017a; Lakew, 2020; Li et al., 2022a; Reis et al., 2022; Gu et al., 2023; López López et al., 2017; Satgé et al., 2019; Ibrahim et al., 2022). For example, Satgé et al. (2019) evaluated 12 satellite-based precipitation estimates such as MSWEP, CHIRPS, and PERSIANN-CDR in South America (Lake Titicaca region) and found MSWEP was the best precipitation dataset for realistic simulation of river discharge. MSWEP was also found to be the most reliable precipitation dataset compared to multiple datasets such as CHIRPS and CMORPH for hydrological and climate studies in basins of eastern China (Shaowei et al., 2022; Wu et al., 2018).
Even though ERA5 showed a higher KGE and CC than MSWEP, CHIRPS, and TERRA for about 32 % of the stations, it showed a higher error and biases. Previous studies have revealed bias and errors in ERA5 precipitation (Lavers et al., 2021; Bechtold et al., 2020; AL-Falahi et al., 2020; Jiang et al., 2023; Lavers et al., 2022), which leads to propagated errors and bias in hydrological modelling outputs. Harrigan et al. (2020) also reported large biases in ERA5-driven hydrological simulations in the central United States, South America (e.g. Brazil), and Africa. According to Lavers et al. (2022), ERA5 precipitation is more reliable in extratropical areas compared to tropical areas. Despite CPCU being a gauge-based precipitation dataset, it did not show as good a performance as MSWEP and ERA5 on annual, monthly, and daily timescales. In addition to the lower KGE and CC, CPCU showed higher bias and error, particularly on annual and monthly timescales. The bias and errors in CPCU can be due to the coarse resolution (0.5°) and the limited number of stations used to develop the datasets, particularly in Africa and South America. According to Beck et al. (2017a), CPCU can be used in large river basins with dense meteorological stations but can be disadvantageous in Africa and South America. This highlights the need to expand and maintain the meteorological stations in these regions but also the need to draw from satellite and model data sources. The PERSIANN-CDR is the least-well-performing product with lower KGE and higher errors and biases, which has been highlighted elsewhere in terms of its inability to represent precipitation extremes (Miao et al., 2015; Solakian et al., 2020).
The precipitation datasets show limited skill overall in reproducing daily extremes (high and low flows), relative to the annual and monthly timescales. MSWEP and CPCU have shown a high CC for about 38 % of the stations. This is consistent with the findings of Tang et al. (2019) for the Mekong River basin. CHIRPS and PERSIANN-CDR are the least skilful in capturing extremes, with a very low CC and large positive and negative biases (Araujo Palharini et al., 2021). For instance, numerous precipitation products have been observed to both underestimate and overestimate low and high precipitation values in Brazil (Palharini et al., 2020), consequently resulting in corresponding underestimations and overestimations of low and high streamflows. In general, several studies have concluded that precipitation datasets exhibit a substantial disparity in daily extreme precipitation events (e.g. Araujo Palharini et al., 2021; Jiang et al., 2019; Huang et al., 2022), which can be attributed to factors such as inaccuracies in satellite sensors, retrieval algorithms, temporal sampling, and satellite–observation merging and bias correction procedures used, particularly in gauge-limited regions (Miao et al., 2015; El Kenawy et al., 2015; Shen et al., 2010; Jiang et al., 2019). In addition to the uncertainty of the precipitation datasets, the limited availability of hydrological observations limits the ability to assess these datasets globally, especially for extreme flood and drought events (Brunner et al., 2021).
While our study evaluates six global precipitation datasets for hydrological modelling using WBMsed, which show an R2 of 0.99 in 30-year average prediction against USGS gauge data and global river datasets (Cohen et al., 2022), it is important to acknowledge uncertainties and limitations in both the precipitation data and model parameters. Uncertainties in input data, such as those derived from satellite-based precipitation datasets, including retrieval errors, can propagate through the hydrological model, potentially affecting the accuracy of simulated discharge. Additionally, globally calibrated model parameters may introduce further uncertainty, particularly in regions with limited observational data coverage. Due to the limited availability of observed discharge in Africa and Asia, the evaluation predominantly focuses on North and South America and Europe. Hence, further evaluation in Africa and Asia could be essential to enhance the robustness of global hydrological models.
Overall, the evaluation presented in this paper underlines the importance of selecting high-quality precipitation datasets to drive hydrological models. Since no single precipitation dataset was found to be adequately accurate everywhere, this study can help identify the best precipitation products for any basin or region under consideration. Based on our results, MSWEP is the best overall choice, but there are regions where ERA5, CHIRPS, and CPCU were better overall. All the precipitation datasets, particularly ERA5 and PERCCDR, require bias correction before being used to drive hydrological models in regions like North America, Asia, Africa, and Australia. For data-scarce regions such as Africa and Asia, it is difficult to recommend a precipitation dataset due to the limited number of hydrological stations used in this study. Finally, improving the precipitation datasets by adding more ground observations, for example, and by better representing anthropogenic drivers in hydrological models means considerably improving the potential of global and regional hydrological predictions.
The selected precipitation datasets used in this study are openly accessible to the public. ERA5 is freely available from the Copernicus Climate Data Store (CDS; https://cds.climate.copernicus.eu/cdsapp#!/dataset/reanalysis-era5-land?tab=overview, Muñoz Sabater, 2019). CHIRPS can be obtained from the Climate Hazards Group (CHG; https://www.chc.ucsb.edu/data/chirps/, Funk et al., 2015). Access to the MSWEP precipitation dataset is provided through the GloH2O website (https://www.gloh2o.org/mswep/, Beck et al., 2017b). TERRA is accessible from the Climatology Lab website (https://www.climatologylab.org/, Abatzoglou et al., 2018). CPCU is publicly available through the NOAA Physical Sciences Laboratory (PSL; https://downloads.psl.noaa.gov/Datasets/cpc_global_precip/, Chen et al., 2008), and PERCCDR can be freely accessed through the Center for Hydrometeorology and Remote Sensing (CHRS; https://chrsdata.eng.uci.edu/, Sadeghi et al., 2021).
The supplement related to this article is available online at: https://doi.org/10.5194/hess-28-3099-2024-supplement.
SHG, JL, and SJD: conceptualisation. SHG: methodology and formal analysis, writing (original draft preparation). JL, SJD, and LS: resources. SC: software and data curation. MW, GLB, and RB: investigation, writing (review and editing). PD, HG, and EV: data curation and visualisation. YL, RH, LH, SM, and JN: methodology, visualisation, investigation, writing (review and editing). PJA, HC, AN, AJT, and JS: formal analysis, resources, writing (review and editing). DRP, SJD, and SED: supervision and project administration.
At least one of the (co-)authors is a member of the editorial board of Hydrology and Earth System Sciences. The peer-review process was guided by an independent editor, and the authors also have no other competing interests to declare.
Publisher’s note: Copernicus Publications remains neutral with regard to jurisdictional claims made in the text, published maps, institutional affiliations, or any other geographical representation in this paper. While Copernicus Publications makes every effort to include appropriate place names, the final responsibility lies with the authors.
This work is part of the Evolution of Global Flood Hazard and Risk (EVOFLOOD) project (NE/S015817/1) supported by the Natural Environment Research Council (NERC); the UK Foreign, Commonwealth and Development Office (FCDO) for the benefit of developing countries (programme code 201880); and the UK's Natural Environment Research Council (NERC; NE/S017380/1).
This research has been supported by the Natural Environment Research Council (grant no. NE/S015817/1); the Foreign, Commonwealth and Development Office (grant no. 201880); and the Natural Environment Research Council (grant no. NE/S017380/1).
This paper was edited by Yi He and reviewed by two anonymous referees.
Abatzoglou, J. T., Dobrowski, S. Z., Parks, S. A., and Hegewisch, K. C.: TerraClimate, a high-resolution global dataset of monthly climate and climatic water balance from 1958–2015, Sci. Data, 5, 170191, https://doi.org/10.1038/sdata.2017.191, 2018.
Acharya, S. C., Nathan, R., Wang, Q. J., Su, C.-H., and Eizenberg, N.: An evaluation of daily precipitation from a regional atmospheric reanalysis over Australia, Hydrol. Earth Syst. Sci., 23, 3387–3403, https://doi.org/10.5194/hess-23-3387-2019, 2019.
Ahmed, K., Shahid, S., Wang, X., Nawaz, N., and Khan, N.: Evaluation of Gridded Precipitation Datasets over Arid Regions of Pakistan, Water, 11, 210, https://doi.org/10.3390/w11020210, 2019.
Alazzy, A. A., Lü, H., Chen, R., Ali, A. B., Zhu, Y., and Su, J.: Evaluation of Satellite Precipitation Products and Their Potential Influence on Hydrological Modeling over the Ganzi River Basin of the Tibetan Plateau, Adv. Meteorol., 2017, e3695285, https://doi.org/10.1155/2017/3695285, 2017.
AL-Falahi, A. H., Saddique, N., Spank, U., Gebrechorkos, S. H., and Bernhofer, C.: Evaluation the Performance of Several Gridded Precipitation Products over the Highland Region of Yemen for Water Resources Management, Remote Sens., 12, 2984, https://doi.org/10.3390/rs12182984, 2020.
Araujo Palharini, R. S., Vila, D. A., Rodrigues, D. T., Palharini, R. C., Mattos, E. V., and Pedra, G. U.: Assessment of extreme rainfall estimates from satellite-based: Regional analysis, Remote Sensing Applications: Society and Environment, 23, 100603, https://doi.org/10.1016/j.rsase.2021.100603, 2021.
Bárdossy, A., Kilsby, C., Birkinshaw, S., Wang, N., and Anwar, F.: Is Precipitation Responsible for the Most Hydrological Model Uncertainty?, Front. Water, 4, https://doi.org/10.3389/frwa.2022.836554, 2022.
Bechtold, P., Forbes, R., Sandu, I., Lang, S., and Ahlgrimm, M.: A major moist physics upgrade for the IFS, 24–32, https://www.ecmwf.int/en/newsletter/164/meteorology/major-moist-physics-upgrade-ifs (last access: 19 June 2023), 2020.
Beck, H. E., Vergopolan, N., Pan, M., Levizzani, V., van Dijk, A. I. J. M., Weedon, G. P., Brocca, L., Pappenberger, F., Huffman, G. J., and Wood, E. F.: Global-scale evaluation of 22 precipitation datasets using gauge observations and hydrological modeling, Hydrol. Earth Syst. Sci., 21, 6201–6217, https://doi.org/10.5194/hess-21-6201-2017, 2017a.
Beck, H. E., van Dijk, A. I. J. M., Levizzani, V., Schellekens, J., Miralles, D. G., Martens, B., and de Roo, A.: MSWEP: 3-hourly 0.25° global gridded precipitation (1979–2015) by merging gauge, satellite, and reanalysis data, Hydrol. Earth Syst. Sci., 21, 589–615, https://doi.org/10.5194/hess-21-589-2017, 2017b.
Beck, H. E., Pan, M., Roy, T., Weedon, G. P., Pappenberger, F., van Dijk, A. I. J. M., Huffman, G. J., Adler, R. F., and Wood, E. F.: Daily evaluation of 26 precipitation datasets using Stage-IV gauge-radar data for the CONUS, Hydrol. Earth Syst. Sci., 23, 207–224, https://doi.org/10.5194/hess-23-207-2019, 2019a.
Beck, H. E., Wood, E. F., Pan, M., Fisher, C. K., Miralles, D. G., Dijk, A. I. J. M. van, McVicar, T. R., and Adler, R. F.: MSWEP V2 Global 3-Hourly 0.1° Precipitation: Methodology and Quantitative Assessment, B. Am. Meteorol. Soc., 100, 473–500, https://doi.org/10.1175/BAMS-D-17-0138.1, 2019b.
Brunner, M. I., Slater, L., Tallaksen, L. M., and Clark, M.: Challenges in modeling and predicting floods and droughts: A review, WIREs Water, 8, e1520, https://doi.org/10.1002/wat2.1520, 2021.
Chen, M., Shi, W., Xie, P., Silva, V. B. S., Kousky, V. E., Wayne Higgins, R., and Janowiak, J. E.: Assessing objective techniques for gauge-based analyses of global daily precipitation, J. Geophys. Res.-Atmos., 113, https://doi.org/10.1029/2007JD009132, 2008.
Chen, Y., Hu, D., Duan, X., Zhang, Y., Liu, M., and Shasha, W.: Rainfall-runoff simulation and flood dynamic monitoring based on CHIRPS and MODIS-ET, Int. J. Remote Sens., 41, 4206–4225, https://doi.org/10.1080/01431161.2020.1714779, 2020.
Cohen, S., Kettner, A. J., Syvitski, J. P. M., and Fekete, B. M.: WBMsed, a distributed global-scale riverine sediment flux model: Model description and validation, Comput. Geosci., 53, 80–93, https://doi.org/10.1016/j.cageo.2011.08.011, 2013.
Cohen, S., Kettner, A. J., and Syvitski, J. P. M.: Global suspended sediment and water discharge dynamics between 1960 and 2010: Continental trends and intra-basin sensitivity, Global Planet. Change, 115, 44–58, https://doi.org/10.1016/j.gloplacha.2014.01.011, 2014.
Cohen, S., Syvitski, J., Ashley, T., Lammers, R., Fekete, B., and Li, H.-Y.: Spatial Trends and Drivers of Bedload and Suspended Sediment Fluxes in Global Rivers, Water Resour. Res., 58, e2021WR031583, https://doi.org/10.1029/2021WR031583, 2022.
Day, C. A. and Howarth, D. A.: Modeling Climate Change Impacts on the Water Balance of a Medium-Scale Mixed-Forest Watershed, SE USA, Southeastern Geographer, 59, 110–129, 2019.
Dembélé, M., Schaefli, B., van de Giesen, N., and Mariéthoz, G.: Suitability of 17 gridded rainfall and temperature datasets for large-scale hydrological modelling in West Africa, Hydrol. Earth Syst. Sci., 24, 5379–5406, https://doi.org/10.5194/hess-24-5379-2020, 2020.
Dunn, F. E., Darby, S. E., Nicholls, R. J., Cohen, S., Zarfl, C., and Fekete, B. M.: Projections of declining fluvial sediment delivery to major deltas worldwide in response to climate change and anthropogenic stress, Environ. Res. Lett., 14, 084034, https://doi.org/10.1088/1748-9326/ab304e, 2019.
Eini, M. R., Rahmati, A., and Piniewski, M.: Hydrological application and accuracy evaluation of PERSIANN satellite-based precipitation estimates over a humid continental climate catchment, J. Hydrol., 41, 101109, https://doi.org/10.1016/j.ejrh.2022.101109, 2022.
El Kenawy, A. M., Lopez-Moreno, J. I., McCabe, M. F., and Vicente-Serrano, S. M.: Evaluation of the TMPA-3B42 precipitation product using a high-density rain gauge network over complex terrain in northeastern Iberia, Global Planet. Change, 133, 188–200, https://doi.org/10.1016/j.gloplacha.2015.08.013, 2015.
Fallah, A., Rakhshandehroo, G. R., Berg, P., O, S., and Orth, R.: Evaluation of precipitation datasets against local observations in southwestern Iran, Int. J. Climatol., 40, 4102–4116, https://doi.org/10.1002/joc.6445, 2020.
Funk, C., Peterson, P., Landsfeld, M., Pedreros, D., Verdin, J., Shukla, S., Husak, G., Rowland, J., Harrison, L., Hoell, A., and Michaelsen, J.: The climate hazards infrared precipitation with stations – a new environmental record for monitoring extremes, Sci. Data, 2, 150066, https://doi.org/10.1038/sdata.2015.66, 2015.
Gebrechorkos, S. H., Hülsmann, S., and Bernhofer, C.: Evaluation of multiple climate data sources for managing environmental resources in East Africa, Hydrol. Earth Syst. Sci., 22, 4547–4564, https://doi.org/10.5194/hess-22-4547-2018, 2018.
Gebrechorkos, S. H., Bernhofer, C., and Hülsmann, S.: Impacts of projected change in climate on water balance in basins of East Africa, Sci. Total Environ., 682, 160–170, https://doi.org/10.1016/j.scitotenv.2019.05.053, 2019.
Gebrechorkos, S. H., Bernhofer, C., and Hülsmann, S.: Climate change impact assessment on the hydrology of a large river basin in Ethiopia using a local-scale climate modelling approach, Sci. Total Environ., 742, 140504, https://doi.org/10.1016/j.scitotenv.2020.140504, 2020.
Gebrechorkos, S. H., Leyland, J., Darby, S., and Parsons, D.: High-resolution daily global climate dataset of BCCAQ statistically downscaled CMIP6 models for the EVOFLOOD project, NERC EDS Centre for Environmental Data Analysis, https://catalogue.ceda.ac.uk/uuid/c107618f1db34801bb88a1e92 7b82317, 2022a.
Gebrechorkos, S. H., Pan, M., Beck, H. E., and Sheffield, J.: Performance of State-of-the-Art C3S European Seasonal Climate Forecast Models for Mean and Extreme Precipitation Over Africa, Water Resour. Res., 58, e2021WR031480, https://doi.org/10.1029/2021WR031480, 2022b.
Gebrechorkos, S. H., Pan, M., Lin, P., Anghileri, D., Forsythe, N., Pritchard, D. M. W., Fowler, H. J., Obuobie, E., Darko, D., and Sheffield, J.: Variability and changes in hydrological drought in the Volta Basin, West Africa, J. Hydrol., 42, 101143, https://doi.org/10.1016/j.ejrh.2022.101143, 2022c.
Gebrechorkos, S. H., Peng, J., Dyer, E., Miralles, D. G., Vicente-Serrano, S. M., Funk, C., Beck, H. E., Asfaw, D. T., Singer, M. B., and Dadson, S. J.: Global high-resolution drought indices for 1981–2022, Earth Syst. Sci. Data, 15, 5449–5466, https://doi.org/10.5194/essd-15-5449-2023, 2023.
Geleta, C. D. and Deressa, T. A.: Evaluation of Climate Hazards Group InfraRed Precipitation Station (CHIRPS) satellite-based rainfall estimates over Finchaa and Neshe Watersheds, Ethiopia, Engineering Reports, 3, e12338, https://doi.org/10.1002/eng2.12338, 2021.
GRDC: The Global Runoff Data Centre, 56068 Koblenz, Germany, https://www.bafg.de/GRDC/ (last access: 26 February 2023), 2023.
Grogan, D. S., Zuidema, S., Prusevich, A., Wollheim, W. M., Glidden, S., and Lammers, R. B.: Water balance model (WBM) v.1.0.0: a scalable gridded global hydrologic model with water-tracking functionality, Geosci. Model Dev., 15, 7287–7323, https://doi.org/10.5194/gmd-15-7287-2022, 2022.
Gu, L., Yin, J., Wang, S., Chen, J., Qin, H., Yan, X., He, S., and Zhao, T.: How well do the multi-satellite and atmospheric reanalysis products perform in hydrological modelling, J. Hydrol., 617, 128920, https://doi.org/10.1016/j.jhydrol.2022.128920, 2023.
Guo, B., Zhang, J., Xu, T., Croke, B., Jakeman, A., Song, Y., Yang, Q., Lei, X., and Liao, W.: Applicability Assessment and Uncertainty Analysis of Multi-Precipitation Datasets for the Simulation of Hydrologic Models, Water, 10, 1611, https://doi.org/10.3390/w10111611, 2018.
Gupta, H. V., Kling, H., Yilmaz, K. K., and Martinez, G. F.: Decomposition of the mean squared error and NSE performance criteria: Implications for improving hydrological modelling, J. Hydrol., 377, 80–91, https://doi.org/10.1016/j.jhydrol.2009.08.003, 2009.
Hafizi, H. and Sorman, A. A.: Assessment of 13 Gridded Precipitation Datasets for Hydrological Modeling in a Mountainous Basin, Atmosphere, 13, 143, https://doi.org/10.3390/atmos13010143, 2022.
Harrigan, S., Zsoter, E., Alfieri, L., Prudhomme, C., Salamon, P., Wetterhall, F., Barnard, C., Cloke, H., and Pappenberger, F.: GloFAS-ERA5 operational global river discharge reanalysis 1979–present, Earth Syst. Sci. Data, 12, 2043–2060, https://doi.org/10.5194/essd-12-2043-2020, 2020.
He, Q., Shen, Z., Wan, M., and Li, L.: Precipitable Water Vapor Converted from GNSS-ZTD and ERA5 Datasets for the Monitoring of Tropical Cyclones, IEEE Access, 8, 87275–87290, https://doi.org/10.1109/ACCESS.2020.2991094, 2020.
Her, Y., Yoo, S.-H., Cho, J., Hwang, S., Jeong, J., and Seong, C.: Uncertainty in hydrological analysis of climate change: multi-parameter vs. multi-GCM ensemble predictions, Sci. Rep., 9, 4974, https://doi.org/10.1038/s41598-019-41334-7, 2019.
Hersbach, H., Bell, B., Berrisford, P., Hirahara, S., Horányi, A., Muñoz-Sabater, J., Nicolas, J., Peubey, C., Radu, R., Schepers, D., Simmons, A., Soci, C., Abdalla, S., Abellan, X., Balsamo, G., Bechtold, P., Biavati, G., Bidlot, J., Bonavita, M., De Chiara, G., Dahlgren, P., Dee, D., Diamantakis, M., Dragani, R., Flemming, J., Forbes, R., Fuentes, M., Geer, A., Haimberger, L., Healy, S., Hogan, R. J., Hólm, E., Janisková, M., Keeley, S., Laloyaux, P., Lopez, P., Lupu, C., Radnoti, G., de Rosnay, P., Rozum, I., Vamborg, F., Villaume, S., and Thépaut, J.-N.: The ERA5 global reanalysis, Q. J. Roy. Meteor. Soc., 146, 1999–2049, https://doi.org/10.1002/qj.3803, 2020.
Hong, Y., Xuan Do, H., Kessler, J., Fry, L., Read, L., Rafieei Nasab, A., Gronewold, A. D., Mason, L., and Anderson, E. J.: Evaluation of gridded precipitation datasets over international basins and large lakes, J. Hydrol., 607, 127507, https://doi.org/10.1016/j.jhydrol.2022.127507, 2022.
Hou, D., Charles, M., Luo, Y., Toth, Z., Zhu, Y., Krzysztofowicz, R., Lin, Y., Xie, P., Seo, D.-J., Pena, M., and Cui, B.: Climatology-Calibrated Precipitation Analysis at Fine Scales: Statistical Adjustment of Stage IV toward CPC Gauge-Based Analysis, J. Hydrometeorol., 15, 2542–2557, https://doi.org/10.1175/JHM-D-11-0140.1, 2014.
Huang, Z., Zhang, Y., Xu, J., Fang, X., and Ma, Z.: Can satellite precipitation estimates capture the magnitude of extreme rainfall Events?, Remote Sens. Lett., 13, 1048–1057, https://doi.org/10.1080/2150704X.2022.2123258, 2022.
Ibrahim, A. H., Molla, D. D., and Lohani, T. K.: Performance evaluation of satellite-based rainfall estimates for hydrological modeling over Bilate river basin, Ethiopia, World Journal of Engineering, ahead-of-print, 21, 1–15, https://doi.org/10.1108/WJE-03-2022-0106, 2022.
Jiang, Q., Li, W., Wen, J., Fan, Z., Chen, Y., Scaioni, M., and Wang, J.: Evaluation of satellite-based products for extreme rainfall estimations in the eastern coastal areas of China, J. Integr. Environ. Sci., 16, 191–207, https://doi.org/10.1080/1943815X.2019.1707233, 2019.
Jiang, S., Wei, L., Ren, L., Zhang, L., Wang, M., and Cui, H.: Evaluation of IMERG, TMPA, ERA5, and CPC precipitation products over mainland China: Spatiotemporal patterns and extremes, Water Science and Engineering, 16, 45–56, https://doi.org/10.1016/j.wse.2022.05.001, 2023.
Jiao, D., Xu, N., Yang, F., and Xu, K.: Evaluation of spatial-temporal variation performance of ERA5 precipitation data in China, Sci. Rep., 11, 17956, https://doi.org/10.1038/s41598-021-97432-y, 2021.
Kidd, C. and Levizzani, V.: Status of satellite precipitation retrievals, Hydrol. Earth Syst. Sci., 15, 1109–1116, https://doi.org/10.5194/hess-15-1109-2011, 2011.
Kidd, C., Becker, A., Huffman, G. J., Muller, C. L., Joe, P., Skofronick-Jackson, G., and Kirschbaum, D. B.: So, How Much of the Earth's Surface Is Covered by Rain Gauges?, B. Am. Meteorol. Soc., 98, 69–78, https://doi.org/10.1175/BAMS-D-14-00283.1, 2017.
Knoben, W. J. M., Freer, J. E., and Woods, R. A.: Technical note: Inherent benchmark or not? Comparing Nash–Sutcliffe and Kling–Gupta efficiency scores, Hydrol. Earth Syst. Sci., 23, 4323–4331, https://doi.org/10.5194/hess-23-4323-2019, 2019.
Laiti, L., Mallucci, S., Piccolroaz, S., Bellin, A., Zardi, D., Fiori, A., Nikulin, G., and Majone, B.: Testing the Hydrological Coherence of High-Resolution Gridded Precipitation and Temperature Data Sets, Water Resour. Res., 54, 1999–2016, https://doi.org/10.1002/2017WR021633, 2018.
Lakew, H. B.: Investigating the effectiveness of bias correction and merging MSWEP with gauged rainfall for the hydrological simulation of the upper Blue Nile basin, J. Hydrol., 32, 100741, https://doi.org/10.1016/j.ejrh.2020.100741, 2020.
Lavers, D. A., Harrigan, S., and Prudhomme, C.: Precipitation Biases in the ECMWF Integrated Forecasting System, J. Hydrometeorol., 22, 1187–1198, https://doi.org/10.1175/JHM-D-20-0308.1, 2021.
Lavers, D. A., Simmons, A., Vamborg, F., and Rodwell, M. J.: An evaluation of ERA5 precipitation for climate monitoring, Q. J. Roy. Meteor. Soc., 148, 3152–3165, https://doi.org/10.1002/qj.4351, 2022.
Lehner, B., Verdin, K. L., and Jarvis, A.: New global hydrography derived from spaceborne elevation data, Eos, Transactions, American Geophysical Union, 89, 2, https://doi.org/10.1029/2008EO100001, 2008.
Lehner, B., Liermann, C. R., Revenga, C., Vörösmarty, C., Fekete, B., Crouzet, P., Döll, P., Endejan, M., Frenken, K., Magome, J., Nilsson, C., Robertson, J. C., Rödel, R., Sindorf, N., and Wisser, D.: High-resolution mapping of the world's reservoirs and dams for sustainable river-flow management, Front. Ecol. Environ., 9, 494–502, https://doi.org/10.1890/100125, 2011.
Lin, P., Pan, M., Beck, H. E., Yang, Y., Yamazaki, D., Frasson, R., David, C. H., Durand, M., Pavelsky, T. M., Allen, G. H., Gleason, C. J., and Wood, E. F.: Global Reconstruction of Naturalized River Flows at 2.94 Million Reaches, Water Resour. Res., 55, 6499–6516, https://doi.org/10.1029/2019WR025287, 2019.
Li, L., Wang, Y., Wang, L., Hu, Q., Zhu, Z., Li, L., and Li, C.: Spatio-temporal accuracy evaluation of MSWEP daily precipitation over the Huaihe River Basin, China: A comparison study with representative satellite- and reanalysis-based products, J. Geogr. Sci., 32, 2271–2290, https://doi.org/10.1007/s11442-022-2047-9, 2022a.
Li, M., Lv, X., Zhu, L., Uchenna Ochege, F., and Guo, H.: Evaluation and Application of MSWEP in Drought Monitoring in Central Asia, Atmosphere, 13, 1053, https://doi.org/10.3390/atmos13071053, 2022b.
López López, P., Sutanudjaja, E. H., Schellekens, J., Sterk, G., and Bierkens, M. F. P.: Calibration of a large-scale hydrological model using satellite-based soil moisture and evapotranspiration products, Hydrol. Earth Syst. Sci., 21, 3125–3144, https://doi.org/10.5194/hess-21-3125-2017, 2017.
Luo, X., Wu, W., He, D., Li, Y., and Ji, X.: Hydrological Simulation Using TRMM and CHIRPS Precipitation Estimates in the Lower Lancang-Mekong River Basin, Chin. Geogr. Sci., 29, 13–25, https://doi.org/10.1007/s11769-019-1014-6, 2019.
Maggioni, V. and Massari, C.: On the performance of satellite precipitation products in riverine flood modeling: A review, J. Hydrol., 558, 214–224, https://doi.org/10.1016/j.jhydrol.2018.01.039, 2018.
Mazzoleni, M., Brandimarte, L., and Amaranto, A.: Evaluating precipitation datasets for large-scale distributed hydrological modelling, J. Hydrol., 578, 124076, https://doi.org/10.1016/j.jhydrol.2019.124076, 2019.
Mehran, A. and AghaKouchak, A.: Capabilities of satellite precipitation datasets to estimate heavy precipitation rates at different temporal accumulations, Hydrol. Process., 28, 2262–2270, https://doi.org/10.1002/hyp.9779, 2014.
Menne, M. J., Durre, I., Vose, R. S., Gleason, B. E., and Houston, T. G.: An Overview of the Global Historical Climatology Network-Daily Database, J. Atmos. Ocean. Tech., 29, 897–910, https://doi.org/10.1175/JTECH-D-11-00103.1, 2012.
Mianabadi, A., Salari, K., and Pourmohamad, Y.: Drought monitoring using the long-term CHIRPS precipitation over Southeastern Iran, Appl. Water Sci., 12, 183, https://doi.org/10.1007/s13201-022-01705-4, 2022.
Miao, C., Ashouri, H., Hsu, K.-L., Sorooshian, S., and Duan, Q.: Evaluation of the PERSIANN-CDR Daily Rainfall Estimates in Capturing the Behavior of Extreme Precipitation Events over China, J. Hydrometeorol., 16, 1387–1396, https://doi.org/10.1175/JHM-D-14-0174.1, 2015.
Miao, Q., Pan, B., Wang, H., Hsu, K., and Sorooshian, S.: Improving Monsoon Precipitation Prediction Using Combined Convolutional and Long Short Term Memory Neural Network, Water, 11, 977, https://doi.org/10.3390/w11050977, 2019.
Michaelides, S., Levizzani, V., Anagnostou, E., Bauer, P., Kasparis, T., and Lane, J. E.: Precipitation: Measurement, remote sensing, climatology and modeling, Atmos. Res., 94, 512–533, https://doi.org/10.1016/j.atmosres.2009.08.017, 2009.
Moazami, S., Golian, S., Kavianpour, M. R., and Hong, Y.: Comparison of PERSIANN and V7 TRMM Multi-satellite Precipitation Analysis (TMPA) products with rain gauge data over Iran, Int. J. Remote Sens., 34, 8156–8171, https://doi.org/10.1080/01431161.2013.833360, 2013.
Moragoda, N. and Cohen, S.: Climate-induced trends in global riverine water discharge and suspended sediment dynamics in the 21st century, Global Planet. Change, 191, 103199, https://doi.org/10.1016/j.gloplacha.2020.103199, 2020.
Muñoz Sabater, J.: ERA5-Land hourly data from 1950 to present, Copernicus Climate Change Service (C3S) Climate Data Store (CDS) [data set], https://doi.org/10.24381/cds.e2161bac, 2019.
Nguyen, P., Thorstensen, A., Sorooshian, S., Hsu, K., Aghakouchak, A., Ashouri, H., Tran, H., and Braithwaite, D.: Global Precipitation Trends across Spatial Scales Using Satellite Observations, B. Am. Meteorol. Soc., 99, 689–697, https://doi.org/10.1175/BAMS-D-17-0065.1, 2018.
Opere, A. O., Waswa, R., and Mutua, F. M.: Assessing the Impacts of Climate Change on Surface Water Resources Using WEAP Model in Narok County, Kenya, Frontiers in Water, 3, https://doi.org/10.3389/frwa.2021.789340, 2022.
Palharini, R. S. A., Vila, D. A., Rodrigues, D. T., Quispe, D. P., Palharini, R. C., de Siqueira, R. A., and de Sousa Afonso, J. M.: Assessment of the Extreme Precipitation by Satellite Estimates over South America, Remote Sens., 12, 2085, https://doi.org/10.3390/rs12132085, 2020.
Parker, W. S.: Reanalyses and Observations: What's the Difference?, B. Am. Meteorol. Soc., 97, 1565–1572, https://doi.org/10.1175/BAMS-D-14-00226.1, 2016.
Peng, J., Dadson, S., Hirpa, F., Dyer, E., Lees, T., Miralles, D. G., Vicente-Serrano, S. M., and Funk, C.: A pan-African high-resolution drought index dataset, Earth Syst. Sci. Data, 12, 753–769, https://doi.org/10.5194/essd-12-753-2020, 2020.
Raimonet, M., Oudin, L., Thieu, V., Silvestre, M., Vautard, R., Rabouille, C., and Moigne, P. L.: Evaluation of Gridded Meteorological Datasets for Hydrological Modeling, J. Hydrometeorol., 18, 3027–3041, https://doi.org/10.1175/JHM-D-17-0018.1, 2017.
Reichle, R. H., Koster, R. D., Lannoy, G. J. M. D., Forman, B. A., Liu, Q., Mahanama, S. P. P., and Touré, A.: Assessment and Enhancement of MERRA Land Surface Hydrology Estimates, J. Climate, 24, 6322–6338, https://doi.org/10.1175/JCLI-D-10-05033.1, 2011.
Reis, A. A. dos, Weerts, A., Ramos, M.-H., Wetterhall, F., and Fernandes, W. dos S.: Hydrological data and modeling to combine and validate precipitation datasets relevant to hydrological applications, J. Hydrol., 44, 101200, https://doi.org/10.1016/j.ejrh.2022.101200, 2022.
Sadeghi, M., Nguyen, P., Naeini, M. R., Hsu, K., Braithwaite, D., and Sorooshian, S.: PERSIANN-CCS-CDR, a 3-hourly 0.04° global precipitation climate data record for heavy precipitation studies, Sci. Data, 8, 157, https://doi.org/10.1038/s41597-021-00940-9, 2021.
Salehi, H., Sadeghi, M., Golian, S., Nguyen, P., Murphy, C., and Sorooshian, S.: The Application of PERSIANN Family Datasets for Hydrological Modeling, Remote Sens., 14, 3675, https://doi.org/10.3390/rs14153675, 2022.
Satgé, F., Ruelland, D., Bonnet, M.-P., Molina, J., and Pillco, R.: Consistency of satellite-based precipitation products in space and over time compared with gauge observations and snow- hydrological modelling in the Lake Titicaca region, Hydrol. Earth Syst. Sci., 23, 595–619, https://doi.org/10.5194/hess-23-595-2019, 2019.
Seyyedi, H., Anagnostou, E. N., Beighley, E., and McCollum, J.: Hydrologic evaluation of satellite and reanalysis precipitation datasets over a mid-latitude basin, Atmos. Res., 164–165, 37–48, https://doi.org/10.1016/j.atmosres.2015.03.019, 2015.
Shaowei, N., Jie, W., Juliang, J., Xiaoyan, X., Yuliang, Z., Fan, S., and Linlin, Z.: Comprehensive evaluation of satellite-derived precipitation products considering spatial distribution difference of daily precipitation over eastern China, J. Hydrol., 44, 101242, https://doi.org/10.1016/j.ejrh.2022.101242, 2022.
Sheffield, J., Goteti, G., and Wood, E. F.: Development of a 50-Year High-Resolution Global Dataset of Meteorological Forcings for Land Surface Modeling, J. Climate, 19, 3088–3111, https://doi.org/10.1175/JCLI3790.1, 2006.
Sheffield, J., Wood, E. F., Pan, M., Beck, H., Coccia, G., Serrat-Capdevila, A., and Verbist, K.: Satellite Remote Sensing for Water Resources Management: Potential for Supporting Sustainable Development in Data-Poor Regions, Water Resour. Res., 54, 9724–9758, https://doi.org/10.1029/2017WR022437, 2018.
Shen, Y., Xiong, A., Wang, Y., and Xie, P.: Performance of high-resolution satellite precipitation products over China, J. Geophys. Res.-Atmos., 115, https://doi.org/10.1029/2009JD012097, 2010.
Solakian, J., Maggioni, V., and Godrej, A. N.: On the Performance of Satellite-Based Precipitation Products in Simulating Streamflow and Water Quality During Hydrometeorological Extremes, Frontiers in Environmental Science, 8, https://doi.org/10.3389/fenvs.2020.585451, 2020.
Sun, G., Wei, Y., Wang, G., Shi, R., Chen, H., and Mo, C.: Downscaling Correction and Hydrological Applicability of the Three Latest High-Resolution Satellite Precipitation Products (GPM, GSMAP, and MSWEP) in the Pingtang Catchment, China, Adv. Meteorol., 2022, e6507109, https://doi.org/10.1155/2022/6507109, 2022.
Sun, Q., Miao, C., Duan, Q., Ashouri, H., Sorooshian, S., and Hsu, K.-L.: A Review of Global Precipitation Data Sets: Data Sources, Estimation, and Intercomparisons, Rev. Geophys., 56, 79–107, https://doi.org/10.1002/2017RG000574, 2018.
Tang, X., Zhang, J., Gao, C., Ruben, G. B., and Wang, G.: Assessing the Uncertainties of Four Precipitation Products for Swat Modeling in Mekong River Basin, Remote Sens., 11, 304, https://doi.org/10.3390/rs11030304, 2019.
Ursulak, J. and Coulibaly, P.: Integration of hydrological models with entropy and multi-objective optimization based methods for designing specific needs streamflow monitoring networks, J. Hydrol., 593, 125876, https://doi.org/10.1016/j.jhydrol.2020.125876, 2021.
van Huijgevoort, M. H. J., Hazenberg, P., van Lanen, H. A. J., Teuling, A. J., Clark, D. B., Folwell, S., Gosling, S. N., Hanasaki, N., Heinke, J., Koirala, S., Stacke, T., Voss, F., Sheffield, J., and Uijlenhoet, R.: Global Multimodel Analysis of Drought in Runoff for the Second Half of the Twentieth Century, J. Hydrometeorol., 14, 1535–1552, https://doi.org/10.1175/JHM-D-12-0186.1, 2013.
Voisin, N., Wood, A. W., and Lettenmaier, D. P.: Evaluation of Precipitation Products for Global Hydrological Prediction, J. Hydrometeorol., 9, 388–407, https://doi.org/10.1175/2007JHM938.1, 2008.
Wang, M., Rezaie-Balf, M., Naganna, S. R., and Yaseen, Z. M.: Sourcing CHIRPS precipitation data for streamflow forecasting using intrinsic time-scale decomposition based machine learning models, Hydrolog. Sci. J., 66, 1437–1456, https://doi.org/10.1080/02626667.2021.1928138, 2021.
Wang, N., Liu, W., Sun, F., Yao, Z., Wang, H., and Liu, W.: Evaluating satellite-based and reanalysis precipitation datasets with gauge-observed data and hydrological modeling in the Xihe River Basin, China, Atmos. Res., 234, 104746, https://doi.org/10.1016/j.atmosres.2019.104746, 2020.
Wati, T., Hadi, T. W., Sopaheluwakan, A., and Hutasoit, L. M.: Statistics of the Performance of Gridded Precipitation Datasets in Indonesia, Adv. Meteorol., 2022, e7995761, https://doi.org/10.1155/2022/7995761, 2022.
Wisser, D., Fekete, B. M., Vörösmarty, C. J., and Schumann, A. H.: Reconstructing 20th century global hydrography: a contribution to the Global Terrestrial Network- Hydrology (GTN-H), Hydrol. Earth Syst. Sci., 14, 1–24, https://doi.org/10.5194/hess-14-1-2010, 2010.
Wollheim, W. M., Vörösmarty, C. J., Bouwman, A. F., Green, P., Harrison, J., Linder, E., Peterson, B. J., Seitzinger, S. P., and Syvitski, J. P. M.: Global N removal by freshwater aquatic systems using a spatially distributed, within-basin approach, Global Biogeochem. Cy., 22, https://doi.org/10.1029/2007GB002963, 2008.
Wu, Z., Xu, Z., Wang, F., He, H., Zhou, J., Wu, X., and Liu, Z.: Hydrologic Evaluation of Multi-Source Satellite Precipitation Products for the Upper Huaihe River Basin, China, Remote Sens., 10, 840, https://doi.org/10.3390/rs10060840, 2018.
Xiang, Y., Chen, J., Li, L., Peng, T., and Yin, Z.: Evaluation of Eight Global Precipitation Datasets in Hydrological Modeling, Remote Sens., 13, 2831, https://doi.org/10.3390/rs13142831, 2021.
Zambrano-Bigiarini, M., Nauditt, A., Birkel, C., Verbist, K., and Ribbe, L.: Temporal and spatial evaluation of satellite-based rainfall estimates across the complex topographical and climatic gradients of Chile, Hydrol. Earth Syst. Sci., 21, 1295–1320, https://doi.org/10.5194/hess-21-1295-2017, 2017.
Zhu, D., Ilyas, A. M., Wang, G., and Zeng, B.: Long-term hydrological assessment of remote sensing precipitation from multiple sources over the lower Yangtze River basin, China, Meteorol. Appl., 28, e1991, https://doi.org/10.1002/met.1991, 2021.
Zhu, H., Li, Y., Huang, Y., Li, Y., Hou, C., and Shi, X.: Evaluation and hydrological application of satellite-based precipitation datasets in driving hydrological models over the Huifa river basin in Northeast China, Atmos. Res., 207, 28–41, https://doi.org/10.1016/j.atmosres.2018.02.022, 2018.