the Creative Commons Attribution 4.0 License.
the Creative Commons Attribution 4.0 License.
 | 06 May 2024
A high-resolution perspective of extreme rainfall and river flow under extreme climate change in Southeast Asia
Mugni Hadi Hariadi
Gerard van der Schrier
Gert-Jan Steeneveld
Samuel J. Sutanto
Edwin Sutanudjaja
Dian Nur Ratri
Ardhasena Sopaheluwakan
Albert Klein Tank
This article provides high-resolution information on the projected changes in annual extreme rainfall and high- and low-streamflow events over Southeast Asia under extreme climate change. The analysis was performed using the bias-corrected result of the High-Resolution Model Intercomparison Project (HighResMIP) multi-model experiment for the period 1971–2050. Eleven rainfall indices were calculated, along with streamflow simulation using the PCR-GLOBWB hydrological model. The historical period 1981–2010 and the near-future period 2021–2050 were considered for this analysis. Results indicate that, over former mainland Southeast Asia, Myanmar will face more challenges in the near future. The east coast of Myanmar will experience more extreme high-rainfall conditions, while northern Myanmar will have longer dry spells. Over the Indonesian maritime continent, Sumatra and Java will suffer from an increase in dry-spell length of up to 40 %, while the increase in extreme high rainfall will occur over Borneo and mountainous areas in Papua. Based on the streamflow analysis, the impact of climate change is more prominent in a low-flow event than in a high-flow event. The majority of rivers in the central Mekong catchment, Sumatra, Peninsular Malaysia, Borneo, and Java will experience more extreme low-flow events. More extreme dry conditions in the near future are also seen from the increasing probability of future low-flow occurrences, which reaches 101 % and 90 %, on average, over Sumatra and Java, respectively. In addition, based on our results over Java and Sumatra, we found that the changes in extreme high- and low-streamflow events are more pronounced in rivers with steep hydrographs (rivers where flash floods are easily triggered), while rivers with flat hydrographs have a higher risk in terms of the probability of low-flow change.
- Article
(15691 KB) - Full-text XML
-
Supplement
(3375 KB) - BibTeX
- EndNote


The Sixth Assessment Report from the Intergovernmental Panel on Climate Change (IPCC AR6) indicates that Southeast Asia (SEA) is one of the regions most vulnerable to climatic changes and thus is highly exposed to the impacts of climate change (IPCC, 2021). Smit and Wandel (2006) explained that vulnerability is usually considered to be the product of three elements: exposure, sensitivity, and adaptive capacity. One of the challenges SEA faces is that climate change leads to increasing extreme rainfall, and this condition is aggravated by the low resilience and adaptive capacity of most developing countries in SEA (Hijioka et al., 2014). Beyond extreme rainfall events, climate change in SEA manifests in various detrimental forms, including sea level rise; drought; high temperatures; and the resulting increasing scarcity of freshwater, biodiversity loss, and other facets of environmental degradation, all of which exert negative impacts on Southeast Asian economies and societies (Jasparro and Taylor, 2008). The climate change vulnerability mapping for SEA has been documented by Yusuf and Francisco (2009). Those extreme events, especially extreme rainfall, are projected to intensify in the future under climate warming (Ali and Mishra, 2017).
Several previous studies documented the observed changes in climate in the SEA region (Supari et al., 2017; Siswanto et al., 2016; Suhaila et al., 2010; Cinco et al., 2014). Supari et al. (2017) found a tendency towards wetter conditions by looking at the simple daily precipitation intensity (SDII), a significantly increasing trend in the annual highest daily rainfall amount (RX1day), and the rainfall amount contributed by the extremely very wet days (R99p). In addition, Siswanto et al. (2016) observed trends in extreme rainfall over Jakarta, Indonesia, and found that the number of days with rainfall exceeding 50 and 100 mm d−1 shows a statistically significant increase from 1961 to 2010. They added that the trends in extremes are strongest during the wet season compared to during the dry season. For Peninsular Malaysia, Suhaila et al. (2010) studied trend patterns during the wet and dry seasons, and they found a decrease (increase) in total rainfall and a significant decrease (increase) in the frequency of wet days, leading to a significant increase in rainfall intensity during the southwest (northeast) monsoon over most of the region. Moreover, In Thailand, Limsakul et al. (2010) revealed changes in extreme rainfall events along Thailand's coastal zones in recent decades, as observed by three different stations: the Andaman Sea coast, the Gulf of Thailand's western coast, and the Gulf of Thailand's eastern coast. These authors found an overall decrease in total rainfall amounts, accompanied by a coherent reduction in heavy and intense rainfall events along the Andaman Sea coast and more intense daily rainfall associated with a significant decrease in the number of rainy days along the Gulf of Thailand's western coast. However, in the Gulf of Thailand's eastern coast, the changes in extreme precipitation were relatively mixed between significant positive and negative trends. In addition, Cinco et al. (2014) observed an increase in extreme events over 34 synoptic weather stations in the Philippines for the period 1951–2010 compared to the normal mean values for the period 1961–1990.
The variations and changes in precipitation extremes in SEA become a crucial factor for several sectors of life, e.g., the agricultural sector when addressing food security issues (Knox et al., 2012; Lin et al., 2022; Redfern et al., 2012), economics (Asian Development Bank, 2009), and the hydrological sector (Hoang et al., 2016). Hydrology plays an important role in meeting the grand challenges of many sectors, such as the availability of freshwater, food security, the supply of water to hydropower facilities, the vitality of ecosystems, sanitation, and sustainable development (Singh and Xiaosheng, 2019). A state-of-the-art hydrological model becomes an essential tool for the effective planning and management of water resources, and, recently, research has broadened to include sustainable water in relation to climate-change-induced changing patterns of streamflow. A decrease in streamflow for such a long period may cause drought that can trigger impacts on the water supply, energy, water-borne transportation, and ecosystems (Stahl et al., 2016). Studying this can help decision-makers in managing the river basin as a key factor affecting the volume of water required to cope with the increasing demands of the population and of several specific activities such as agriculture, energy, and tourism, which directly depend on water resources (Mair and Fares, 2010).
Given that precipitation is the key factor influencing streamflow and hydrological response in catchments (Lobligeois et al., 2014), an approach centered on assessing changes in both precipitation and hydrology becomes imperative. Climate indices are simple diagnostic quantities that can be used to describe the state changes in the climate system. The examples are the many impact-relevant indices to measure precipitation changes and variation from the Expert Team on Climate Change Detection Indices (ETCCDI) (Klein Tank et al., 2009). For scientific and operational purposes, exploring the space–time variability of hydrologic extremes in relation to climate is important (Renard and Thyer, 2019). The study of Renard and Thyer (2019) shows that climate indices have frequently been used as predictors to describe hydrologic extremes.
Although the impact of climate change on rainfall and hydroclimatic extremes in SEA has been extensively studied, most of these studies have relied on data from the previous version of the climate model, in this case, the Coupled Model Intercomparison Project Phase 5 (CMIP5). The regional climate model (RCM) output based on CMIP5 (CORDEX-SEA) has been used in prior research, revealing an increasing risk of droughts and extreme rainfall events across SEA (Ngai et al., 2020a, b; Nguyen-Ngoc-Bich et al., 2021; Supari et al., 2020; Tangang et al., 2018, 2019; Trinh-Tuan et al., 2019). Some studies within this dataset have focused on specific rivers in Malaysia to show the impact of climate change on hydro-meteorological droughts (Tan et al., 2019, 2020). The limited use of the latest version of high-resolution CMIP (CMIP6) in studying this subject is attributed to the unavailability of high-resolution data from CMIP6 RCM for SEA at the current time. This presents a challenge, particularly considering the fact that the CMIP6 model has been demonstrated to offer a superior representation of many processes (physical, chemical, and biological) compared to the CMIP5 model (Li et al., 2021; Zhu and Yang, 2020). Previous studies have indicated that, over SEA, the CMIP6 High-Resolution Model Intercomparison Project (HighResMIP) (Haarsma et al., 2016) closely simulated monsoon characteristics (Hariadi et al., 2021) and rainfall indices (Hariadi et al., 2022) compared to observations, outperforming CORDEX-SEA. Furthermore, Hariadi et al. (2021) observed that the atmospheric-only experiment of HighResMIP successfully replicated deviations in monsoon characteristics observed during El Niño years. Thus, we have relatively high confidence in the HighResMIP model results.
Therefore, this study aims to quantify the change in river flow under changing extreme rainfall conditions due to the near-future climate change over SEA, using HighResMIP model results (Haarsma et al., 2016) as the meteorological driver. A bias-corrected version of the HighResMIP is constructed to document the changes in the rainfall-related climate indices, in this case rainfall indices, and to investigate the changes in and the trends of the indices. This dataset is then used to simulate the river streamflow over four domains in the SEA region: the Mekong Basin (MEB), the Sumatra–Peninsular Malaysia domain (SMB), the island of Java, and Borneo. Furthermore, the changes in streamflow values during low-flow and high-flow events and their probability in the near future are investigated.
Section 2 (Materials and methods) of this study describes the study area; the climate and streamflow data used; and the methods, including climate indices, the bias correction method, and the statistical methods for the high- and low-flow indices. Furthermore, in Sect. 3 (Results), we present the change in climate indices and streamflow over SEA in the near-future period (2021–2050) compared to the historical period (1981–2010). Section 4 (Discussion) compares our findings to previous studies on the change of climate indices. In addition, we also discuss the impact of the change in climate indices, the impact of catchment properties on the hydrological extremes, and the source of uncertainty related to the results. We conclude our findings in Sect. 5.
2.1 Description of the study area
The Southeast Asia domain (SEA) used in this study is located between 14.8° S–34° N and 89.5–146.5° E. This includes the Indonesia maritime region in the south, the Philippines maritime region in the east, and mainland Southeast Asia (MSA; southern China, Myanmar, Thailand, Laos, Cambodia, Vietnam, and Peninsular Malaysia) in the northwest. This domain covers the Mekong Basin in northern SEA (Fig. 1). The mountain region over southern China to northern Laos is part of the upstream part of the Mekong rivers. On the maritime continents, mountain ranges are spread from the Philippines to islands in Indonesia, such as Sumatra, Java, Sulawesi, and Papua. These mountains specify the streamflow characteristics in the regions.
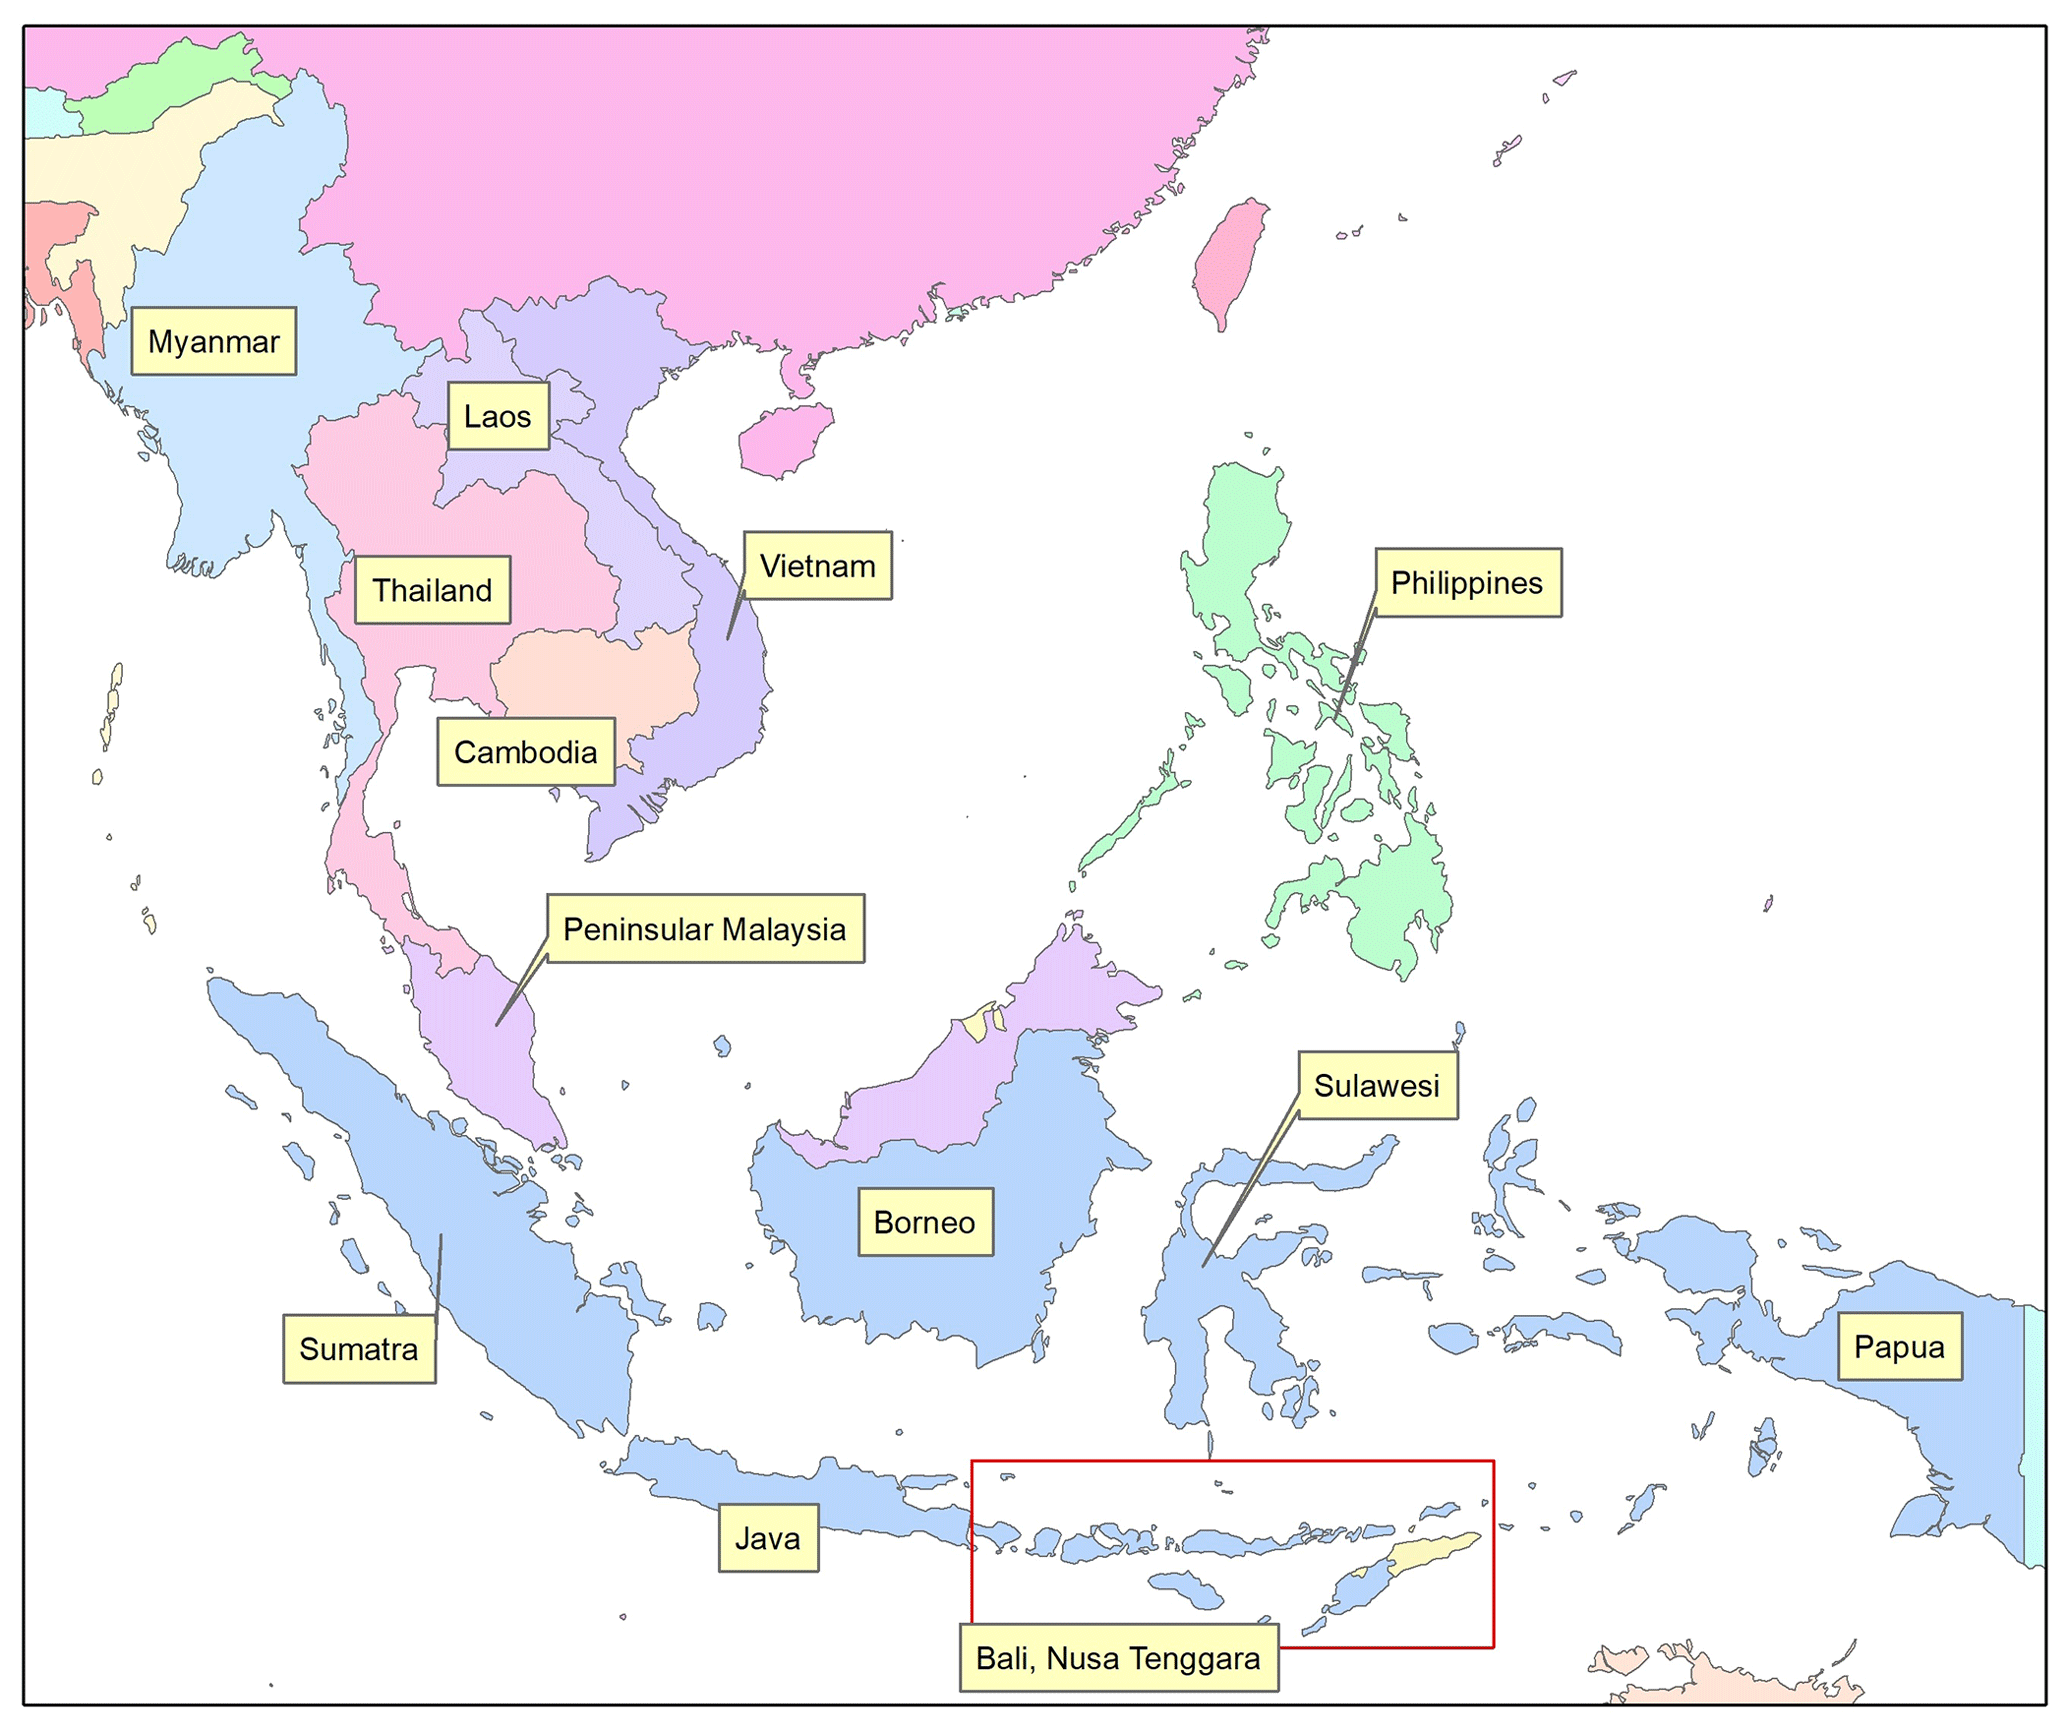
Figure 1The Southeast Asia domain in this study.
The rainfall in these regions is dominated by the monsoon season which starts from northern SEA in May and moves to southern SEA in November (Aldrian and Susanto, 2003; Hamada et al., 2002; Hariadi et al., 2021; Moron et al., 2009). Some areas in SEA, such as Myanmar (Li et al., 2013), Vietnam (Nguyen-Thi et al., 2012; Luu et al., 2021), and the Philippines (Corporal-Lodangco and Leslie, 2017), are affected by tropical cyclones, which lead to high extreme precipitation.
2.2 Data
2.2.1 Climate data
Our study uses the climate model output from the High-Resolution Model Intercomparison Project (HighResMIP) (Haarsma et al., 2016) that is available from the H2020-funded PRIMAVERA project (Roberts et al., 2020). This model has a spatial resolution (25–50 km spatial resolution) comparable to the downscaled output of the regional climate model (RCM) (25 km spatial resolution) which is based on CMIP5 over SEA (CORDEX-SEA). Previous studies show that the HighResMIP has a better simulation of the monsoon characteristics (Hariadi et al., 2021) and extreme precipitation (Hariadi et al., 2022) than the CORDEX simulations over SEA when compared against the observational SA-OBS (Van den Besselaar et al., 2017), APHRODITE (Yatagai et al., 2012), and CHIRPS (Funk et al., 2015) observational datasets. We use the coupled atmospheric–ocean model historic runs of the HighResMIP for the historical period 1950–2014 (hist-1950) and the future period 2014–2050 (highres-future). Compared to the historically forced atmosphere run with the prescribed sea surface temperature (SST) version of HighResMIP (HighResSST), the hist-1950 version shows similar performance in simulating the monsoon characteristics (Hariadi et al., 2021) and the extreme precipitation (Hariadi et al., 2022) over SEA, which shows the skill of the ocean model in the coupled models. We used five models that are available from the hist-1950, which are the CMCC (Cherchi et al., 2019), CNRM (Voldoire et al., 2019), EC-Earth (Haarsma et al., 2020), HadGEM (Roberts et al., 2019), and MPI (Müller et al., 2018). Only one member is available for the CMCC, CNRM, and MPI model simulations, while EC-Earth and HadGEM have four and three members available.
2.2.2 Streamflow data
Global hydrological models (GHMs) have been developed over the last decade and have become essential tools in quantifying the global water cycle. The GHMs simulate distributed hydrological responses to climate and weather variations at a higher resolution than in general circulation models (GCMs). One of the recently developed GHMs is a grid-based global hydrological model called PCR-GLOBWB (PCRaster Global Water Balance) (Van Beek et al., 2011; van Beek et al., 2012). PCR-GLOBWB describes the terrestrial part of the hydrological cycle that focuses on global water availability issues (Van Beek et al., 2011; van Beek et al., 2012). Sutanudjaja et al. (2018) added more advanced runoff processes, river routing, and groundwater components to this model, i.e., PCR-GLOBWB 2.0, and extensively evaluated its performance.
We used the PCR-GLOBWB 2.0 (Sutanudjaja et al., 2018) in this study to simulate historical and future streamflows. PCR-GLOBWB is essentially a leaky-bucket type of model applied on a cell-by-cell basis. For each grid cell, PCR-GLOBWB calculates the daily water storage in two vertically stacked soil layers (max. depth 0.3 and 1.2 m) and an underlying groundwater layer, as well as the water exchange between the layers and between the top layer and the atmosphere (rainfall, evaporation, and snow melt) (Van Beek and Bierkens, 2009). The modeled terrestrial water balance then provides the runoff which is used for the streamflow modeling. Sutanudjaja et al. (2018) described the parameters, the standard input data, and the parameterization of PCR-GLOBWB 2.0, which is mostly the same as the one for the preceding version, PCR-GLOBWB 1.0 (Bierkens and Van Beek, 2009). There are five modules in the PCR-GLOBWB 2.0: the meteorological forcing, the land surface, the groundwater, the surface water routing, and the irrigation and water use that are calculated at a daily time step (Ruijsch et al., 2021). In this study, we use the same configuration as in Sutanudjaja et al. (2018). The difference is that, in our study, we exclude the “water used” factor and focus more on meteorological exposure. The motivation is that it is beyond the scope of this paper to assess and include future changes in water use. The model runs in 5 arcmin spatial resolution, which is about 10 km×10 km at the Equator. We simulated daily water discharge for the period of 1971–2050 based on bias-corrected model data using the PCR-GLOBWB hydrological model. The first-order conservative remapping method was used to interpolate the bias-corrected climate data models into 5 arcmin spatial resolution. Rainfall and the air temperature were used as input, while the potential evapotranspiration was estimated using the Hamon method (Hamon, 1961), which is available in the PCR-GLOBWB. To simulate a better fluctuation of daily streamflow, we selected the kinematic wave for the routing method, which allows flow and area to vary both spatially and temporally within a conduit. Thus, PCR-GLOBWB simulates the river discharge in cubic meters per second (m3 s−1) for all river networks.
The simulation was run for four domains: they are the Mekong Basin (MEB), the Sumatra–Malaysia Basin (SMB), and the islands of Java and Borneo. Sutanudjaja et al. (2018) validated the PCR-GLOBWB 2.0 simulation with streamflow data from the Global Runoff Data Centre (GRDC). The forcing dataset for the simulation is based on time series of monthly precipitation, temperature, and reference evaporation from the CRU TS 3.2 (Harris et al., 2014) downscaled to daily values with ERA40 (1958–1978) (Uppala et al., 2005) and ERA-Interim (1979–2015) (Dee et al., 2011). Their result shows that the model correlation and Kling–Gupta Efficiency coefficient or KGE (Gupta et al., 2009) values range from 0.21 to 0.98 and from −6.49 to 0.87 for the MEB (137 observation sites), 0.29 to 0.70 and −2.51 to 0.41 for the SMB (14 observation sites), 0.16 to 0.80 and −1.98 to 0.34 for Java (10 observation sites), and 0.36 to 0.70 and 0.07 to 0.34 for Borneo (5 observation sites). This indicates that the model performs well enough to simulate the observed streamflow in many river basins across SEA. In addition, the PCR-GLOBWB model is proven to be reliable for studies on extreme streamflow (Van der Wiel et al., 2019; Candogan Yossef et al., 2012). In their study, Van der Wiel et al. (2019) utilize the PCR-GLOBWB hydrological model and the EC-Earth global climate model as input. They assess the return period of an extreme hydrological event by conducting a 2000-year simulation of global hydrology under both present-day and 2 °C warmer climate conditions. Furthermore, Meng et al. (2020) utilize PCR-GLOBWB to analyze future hydropower production under 1.5 and 2 °C warmer climate scenarios over Sumatra.
2.3 Methods
2.3.1 Climate indices
In this study, we used 11 rainfall-related climate indices, which were used earlier to assess the realism of model simulations (Hariadi et al., 2022). The indices were calculated using the package developed by Schulzweida and Quast (2015), which is part of the climate data operator (CDO) suite of routines (Schulzweida et al., 2006). Nine indices were adopted from the Expert Team on Climate Change Detection Indices (ETCCDI) (Klein Tank et al., 2009). In addition, we also calculated the number of consecutive dry-day (CDD) periods and consecutive wet-day (CWD) periods exceeding 5 d (CDD5D and CWD5D) that are available in the package (Schulzweida and Quast, 2015). The indices are aggregated to the annual level. The percentile value for the rainfall fraction due to very wet days (exceeding the 95th percentile) (R95pTOT) is calculated based on the 1971–2050 period. Table 1 lists names and definitions of the rainfall-related climate indices computed in this study.
Table 1List of rainfall-related extreme climate indices computed in this study. The indices are calculated annually.
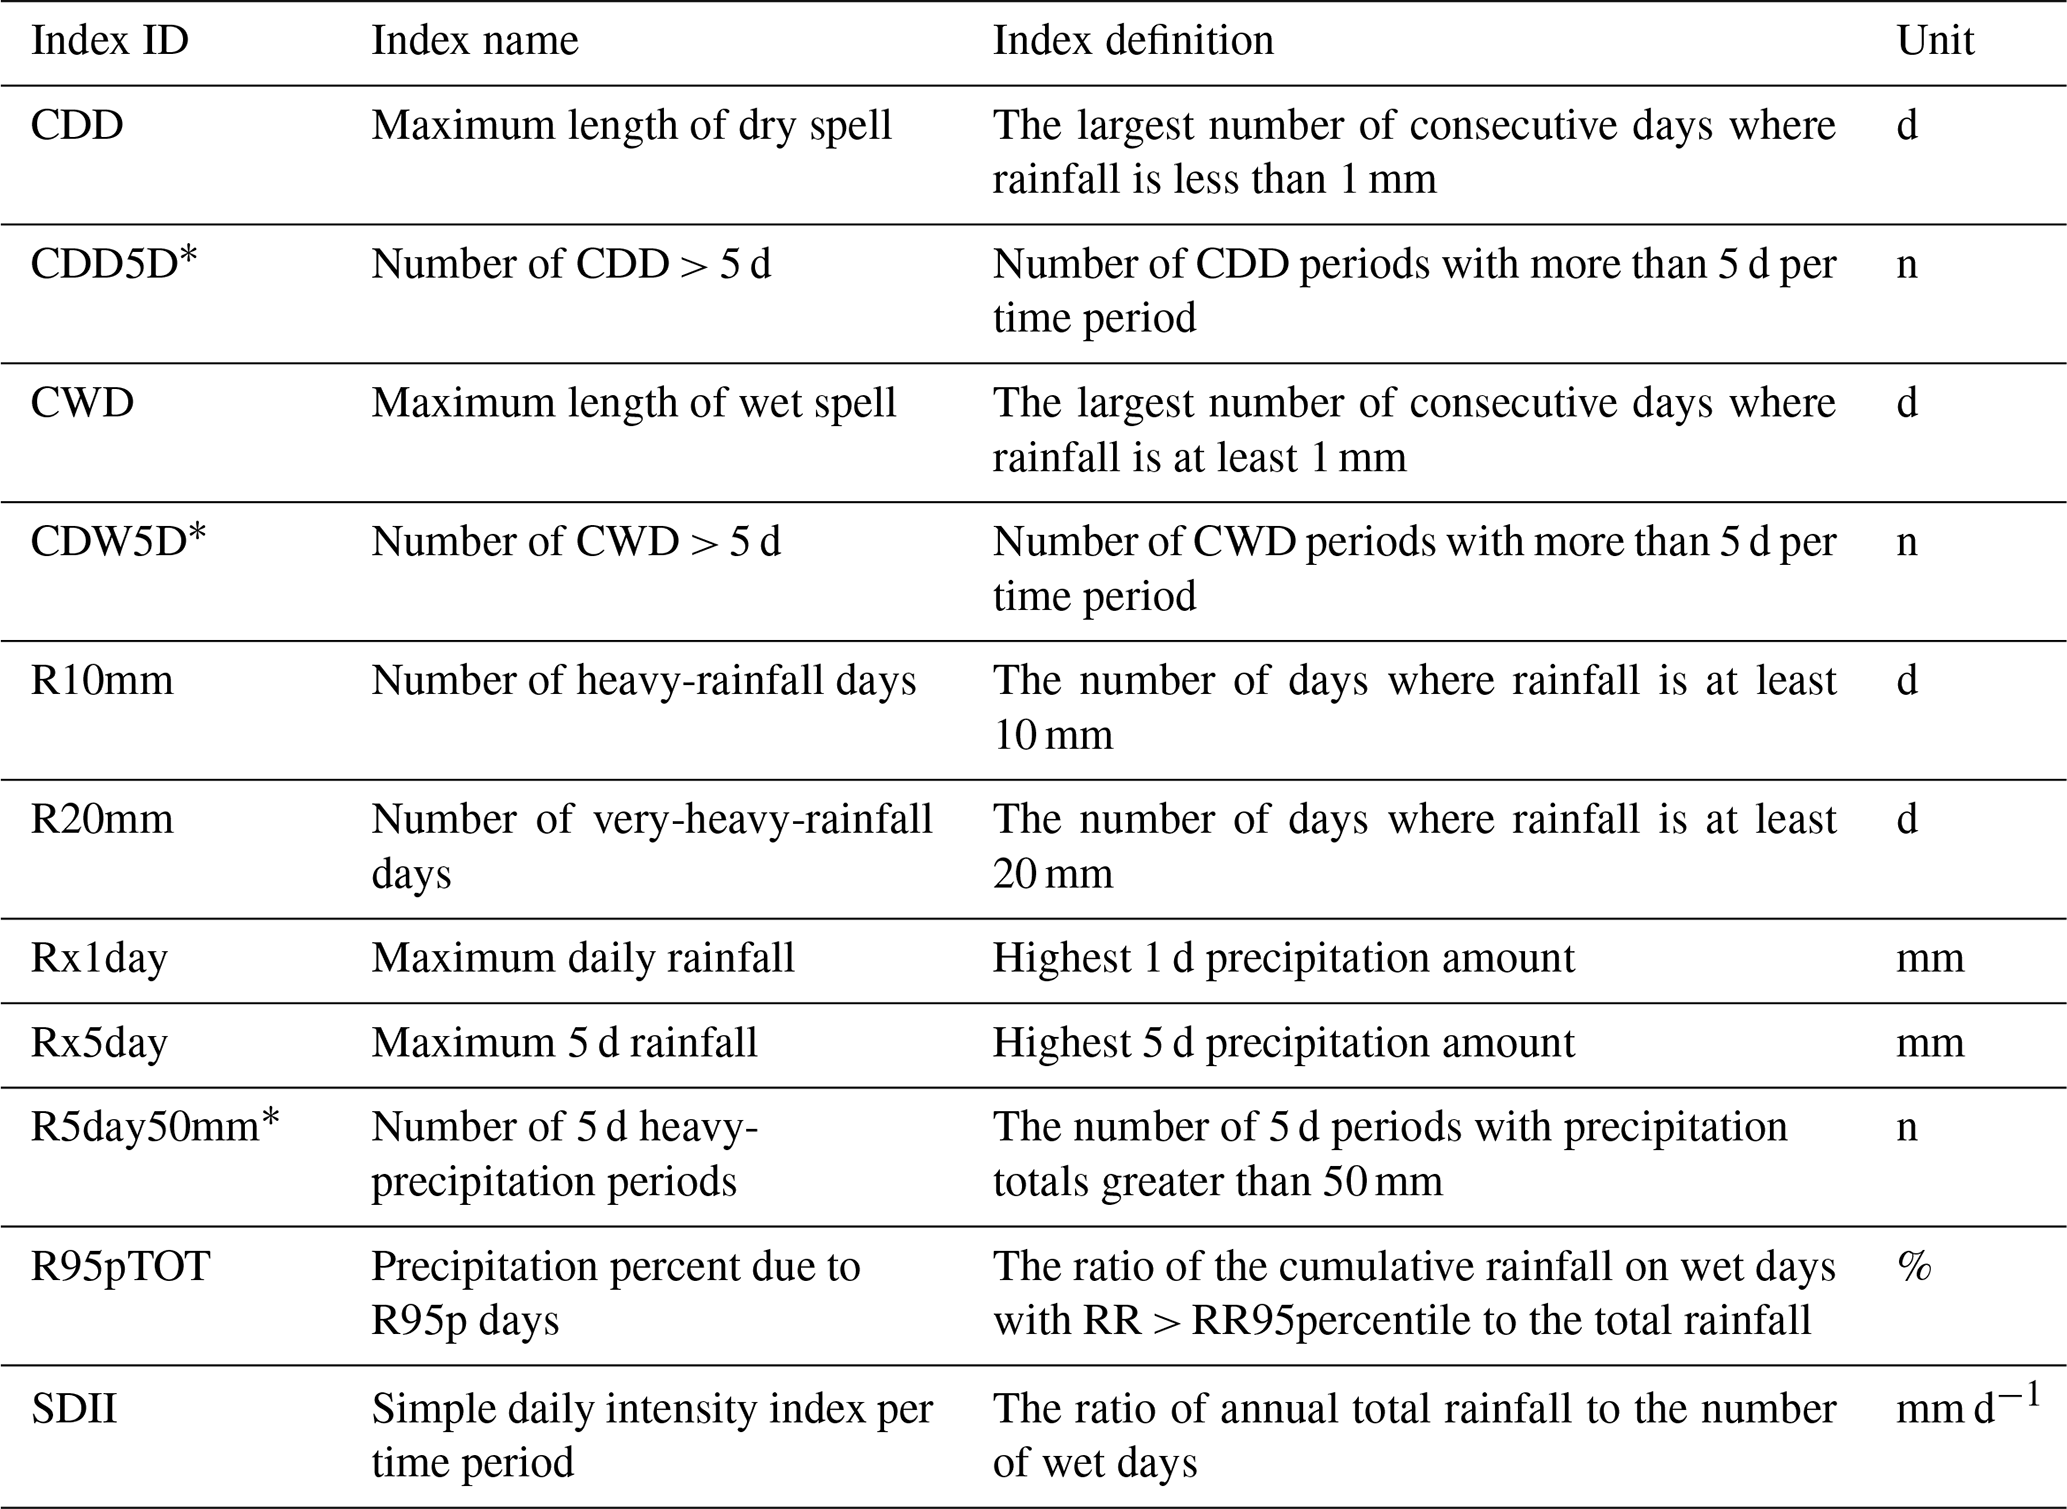
* Not derived from the ETCCDI climate indices.
2.3.2 Bias correction
The global circulation model is handicapped by biases to the degree that prevents their direct use for hydrological purposes (Ehret et al., 2012). Earlier studies discussed the biases in the CMIP5 model simulation (e.g., Taylor et al., 2012), where the bias is worse for precipitation simulation over regions with complex topography (Mehran et al., 2014). Ngai et al. (2017) discussed the need for bias correction in precipitation and temperature simulations of regional climate models over SEA.
Empirical quantile mapping (EQM) is one of the bias correction methods that is widely used. The number of quantiles in this method is a free parameter (Piani et al., 2010). Previous studies used the EQM as a quantile–quantile calibration method based on a nonparametric function that corrects biases in the cumulative distribution functions (CDFs) of climatic variables (Boé et al., 2007; Amengual et al., 2012). Recently, Fang et al. (2015) compared bias correction methods in downscaling meteorological variables for a hydrologic impact study in China; Ratri et al. (2019) used EQM to bias correct ECMWF SEAS5 over Java, Indonesia; and Hariadi (2017), Ngai et al. (2017) and Amsal et al. (2019) used quantile mapping to bias-corrected RCM simulations over SEA. A recent study by Ngai et al. (2022) also used quantile mapping (QM) to explore the possible ranges of future rainfall and extreme index changes over SEA. They noted that the QM method modifies the climate change signal by expanding the range of change when correcting for biases in future projections even though the impact of the QM bias correction is different for RCMs with different indices. Overall, the QM bias correction slightly increases the magnitude of projection change, and the strongest effects (either magnification or reduction) mostly happened in MSA (Ngai et al., 2022). For example, during December–February (DJF), the effects on the magnitude of change correspond well to the mean rainfall distribution in SEA. During June–August (JJA), the effects can be found in both MSA and the maritime continent in the ensemble mean and in some models, especially for the changes in seasonal rainfall over Java, Indonesia, and the southern region (Ngai et al., 2022; Tangang et al., 2020). They also showed that the values of high-rainfall change increased slightly, mostly in the northern part and in the MSA mainland. Moreover, it is possible that the direction of rainfall changes after QM bias correction.
EQM works with empirical probability density functions (PDFs) or CDFs for forecasts and observations. This method attempts to correct the distribution of the GCM and RCM simulated data so that they match the distribution of the observational dataset (Déqué et al., 2007; Block et al., 2009). EQM estimates quantiles for the forecast and the observation dataset and forms a transfer function by using corresponding quantile values. Then, each predicted quantile is substituted by the corresponding observed quantile using their empirical CDFs (ECDFs). The transfer function is then applied to the forecast data as follows:
where Yf is the raw precipitation forecast, and Yf(bc) is the bias-corrected precipitation re-forecast. ECDFo is the inverse ECDF of the observations, and ECDFf is the ECDF of the forecast values.
We used the rainfall and temperature gridded dataset obtained from the APHRODITE (Yatagai et al., 2012) as the observation (reference data) in the bias correction. The reference period for the bias correction is 1971–2010. For rainfall, the APHRODITE V1101 for the period of 1971–2006 was combined with the APHRODITE V1101 EXR1 for the period of 2007–2010. On the other hand, for the temperature, we use APHRODITE V1808. Limited gauge density and availability of long-term climatological data make the development of a dataset for daily precipitation amounts based on in situ measurements challenging (Van den Besselaar et al., 2017; Singh and Xiaosheng, 2019). The Southeast Asia Observation dataset (SA-OBS) (Van den Besselaar et al., 2017) developed especially for SEA has the highest density of gauges compared to other datasets available. However, limited coverage of SA-OBS does not cover the entire Mekong Basin. This is the reason we used APHRODITE for this study. Hariadi et al. (2022) found that both APHRODITE and SA-OBS, developed from gauge data, have more in common with each other than either dataset has with the Climate Hazards Group Infrared Precipitation with Stations v2.0 (CHIRPS; Funk et al., 2015), which is based on satellite data.
Figures 2 and S1 in the Supplement show the results from the two-sample Kolmogorov–Smirnov test (K–S) of the original and bias-corrected model. It shows that the K–S statistic is lower for the bias-corrected simulation compared to the original (uncorrected) model. This indicates that the probability distribution of the bias-corrected model is closer to the observations compared to the uncorrected model for simulating these climate indices. More improvements are shown in the model simulation of climate indices that are directly related to rainfall intensity (R10mm, R20mm, Rx1day, Rx5day, R5day50mm, and SDII) than other indices that are more climatological (CDD, CDD5D, CWD, CWD5D, and R95pTOT). Hariadi et al. (2022) also found that the model poorly simulates climate indices that are directly related to rainfall intensity. Based on the K–S value, we find a significant improvement in the model simulation of these climate indices after the bias correction was performed. Here, we show the importance of the bias correction process for model simulation of climate indices. This study, therefore, uses the bias-corrected dataset for further analysis.

Figure 2The Kolmogorov–Smirnov statistic value between the original model dataset and bias-corrected model dataset. Distance value (D) on the vertical axis shows the distance between the cumulative distribution of the observation and the model. The D value was calculated for simulating (a) CDD, (b) R20mm, (c) Rx1day, (d) R95pTOT, and (e) SDII.
2.3.3 High- and low-flow indices
The high- and low-flow indices were identified using the threshold-based approach. This approach applies the theory of runs and is developed based on a pre-defined threshold level for each index (Yevjevich, 1967; Hisdal et al., 2004; Sutanto and Van Lanen, 2021). Thresholds in this study were derived from the 10th and the 95th percentiles of the daily streamflow (Q10 and Q95 of flow duration curve), which are the flows that are either equal to or lower than the threshold 10 % of the time or that exceed the threshold 95 % of the time. We calculated both the 10th and the 95th percentiles of the daily discharge for the combined historical and near-future periods. The 10th percentile represents low-flow discharge (LFD) (Tallaksen et al., 1997; Wong et al., 2011), while the 95th percentile identifies high-flow discharge (HFD) (van Vliet et al., 2013a; Asadieh and Krakauer, 2017). We investigate the change in LFD and HFD in the near-future period (2021–2050) compared to the historical period (1981–2010). A decrease in LFD indicates that the driest 10 % of daily discharges are drier than those for the historical period, whereas an increase in HFD indicates more severity of the 5 % most extreme high-discharge events. Using the 10th and 95th percentiles of the historical period as a reference of extreme events, we calculate the probability change of the extremely low and extremely high events in the near future. The probability change is calculated based on the change in the number of events that exceeded extremely low and extremely high reference values in the future compared to in the historical period. For example, if the occurrence of a future extreme is doubled compared to the historical period then the probability increase is 100 %. The increase in the probability indicates that events considered to be extreme in the historical period will occur more frequently in the near future.
3.1 Change in climate indices over Southeast Asia
Climate indices (Table 1) for the period 1971–2050, derived from the bias-corrected models, were calculated to show the change in extreme rainfall. We calculated the change in climate indices between the near-future period (NF, 2021–2050) and the historical period (hist, 1981–2010). In addition, we also calculated the trend over the period 1971–2050, including the Sen slope significance test with a 95 % confidence level (Sen, 1968). The final change in the climate index values is based on the model mean. Acknowledging uncertainties, where extreme values from certain models are included in the averaging process, a trend significance test was also performed. This test is based on the model agreement and remains unaffected by extreme values as they are excluded from the trend analysis. A trend is considered to be significant when three or more out of five models (60 %) show a significant result. For EC-Earth and HadGEM, which have four and three members, respectively, the trend is considered to be significant when at least three and two members show a significant trend.
Figure 3a shows increasing CDD over some areas in the Philippines, the northern part of Myanmar, the southern part of Vietnam and Thailand, Cambodia, and the center of Peninsular Malaysia. Over the Indonesian region, an increase of between 20 % to 40 % is seen in the southern part of Sumatra. The increase in CDD is also found in Java, Bali, Nusa Tenggara, the southern part of Borneo, and the northern part of Sulawesi. Similarly to the change in MSA and the Philippines, the increase is less than 20 % in most of these areas. In addition, there is also a decrease in CDD in the mountain region of Papua of up to 15 %. We found a robust signal of increasing CDD over the northern part of Myanmar, the southern part of Sumatra, and some areas in Java, which not only show the increasing change of CDD value but also show a significant trend up to 3 d per decade (Fig. 3a). The drier condition in the near future over the southern part of Sumatra is also shown by the increasing CDD5D over the region, with a significant increasing trend of CDD5D (Fig. S2). Most of the areas that may experience higher CDD and CDD5D in SEA also show a decrease in CWD and CWD5D (Figs. S3 and S4).
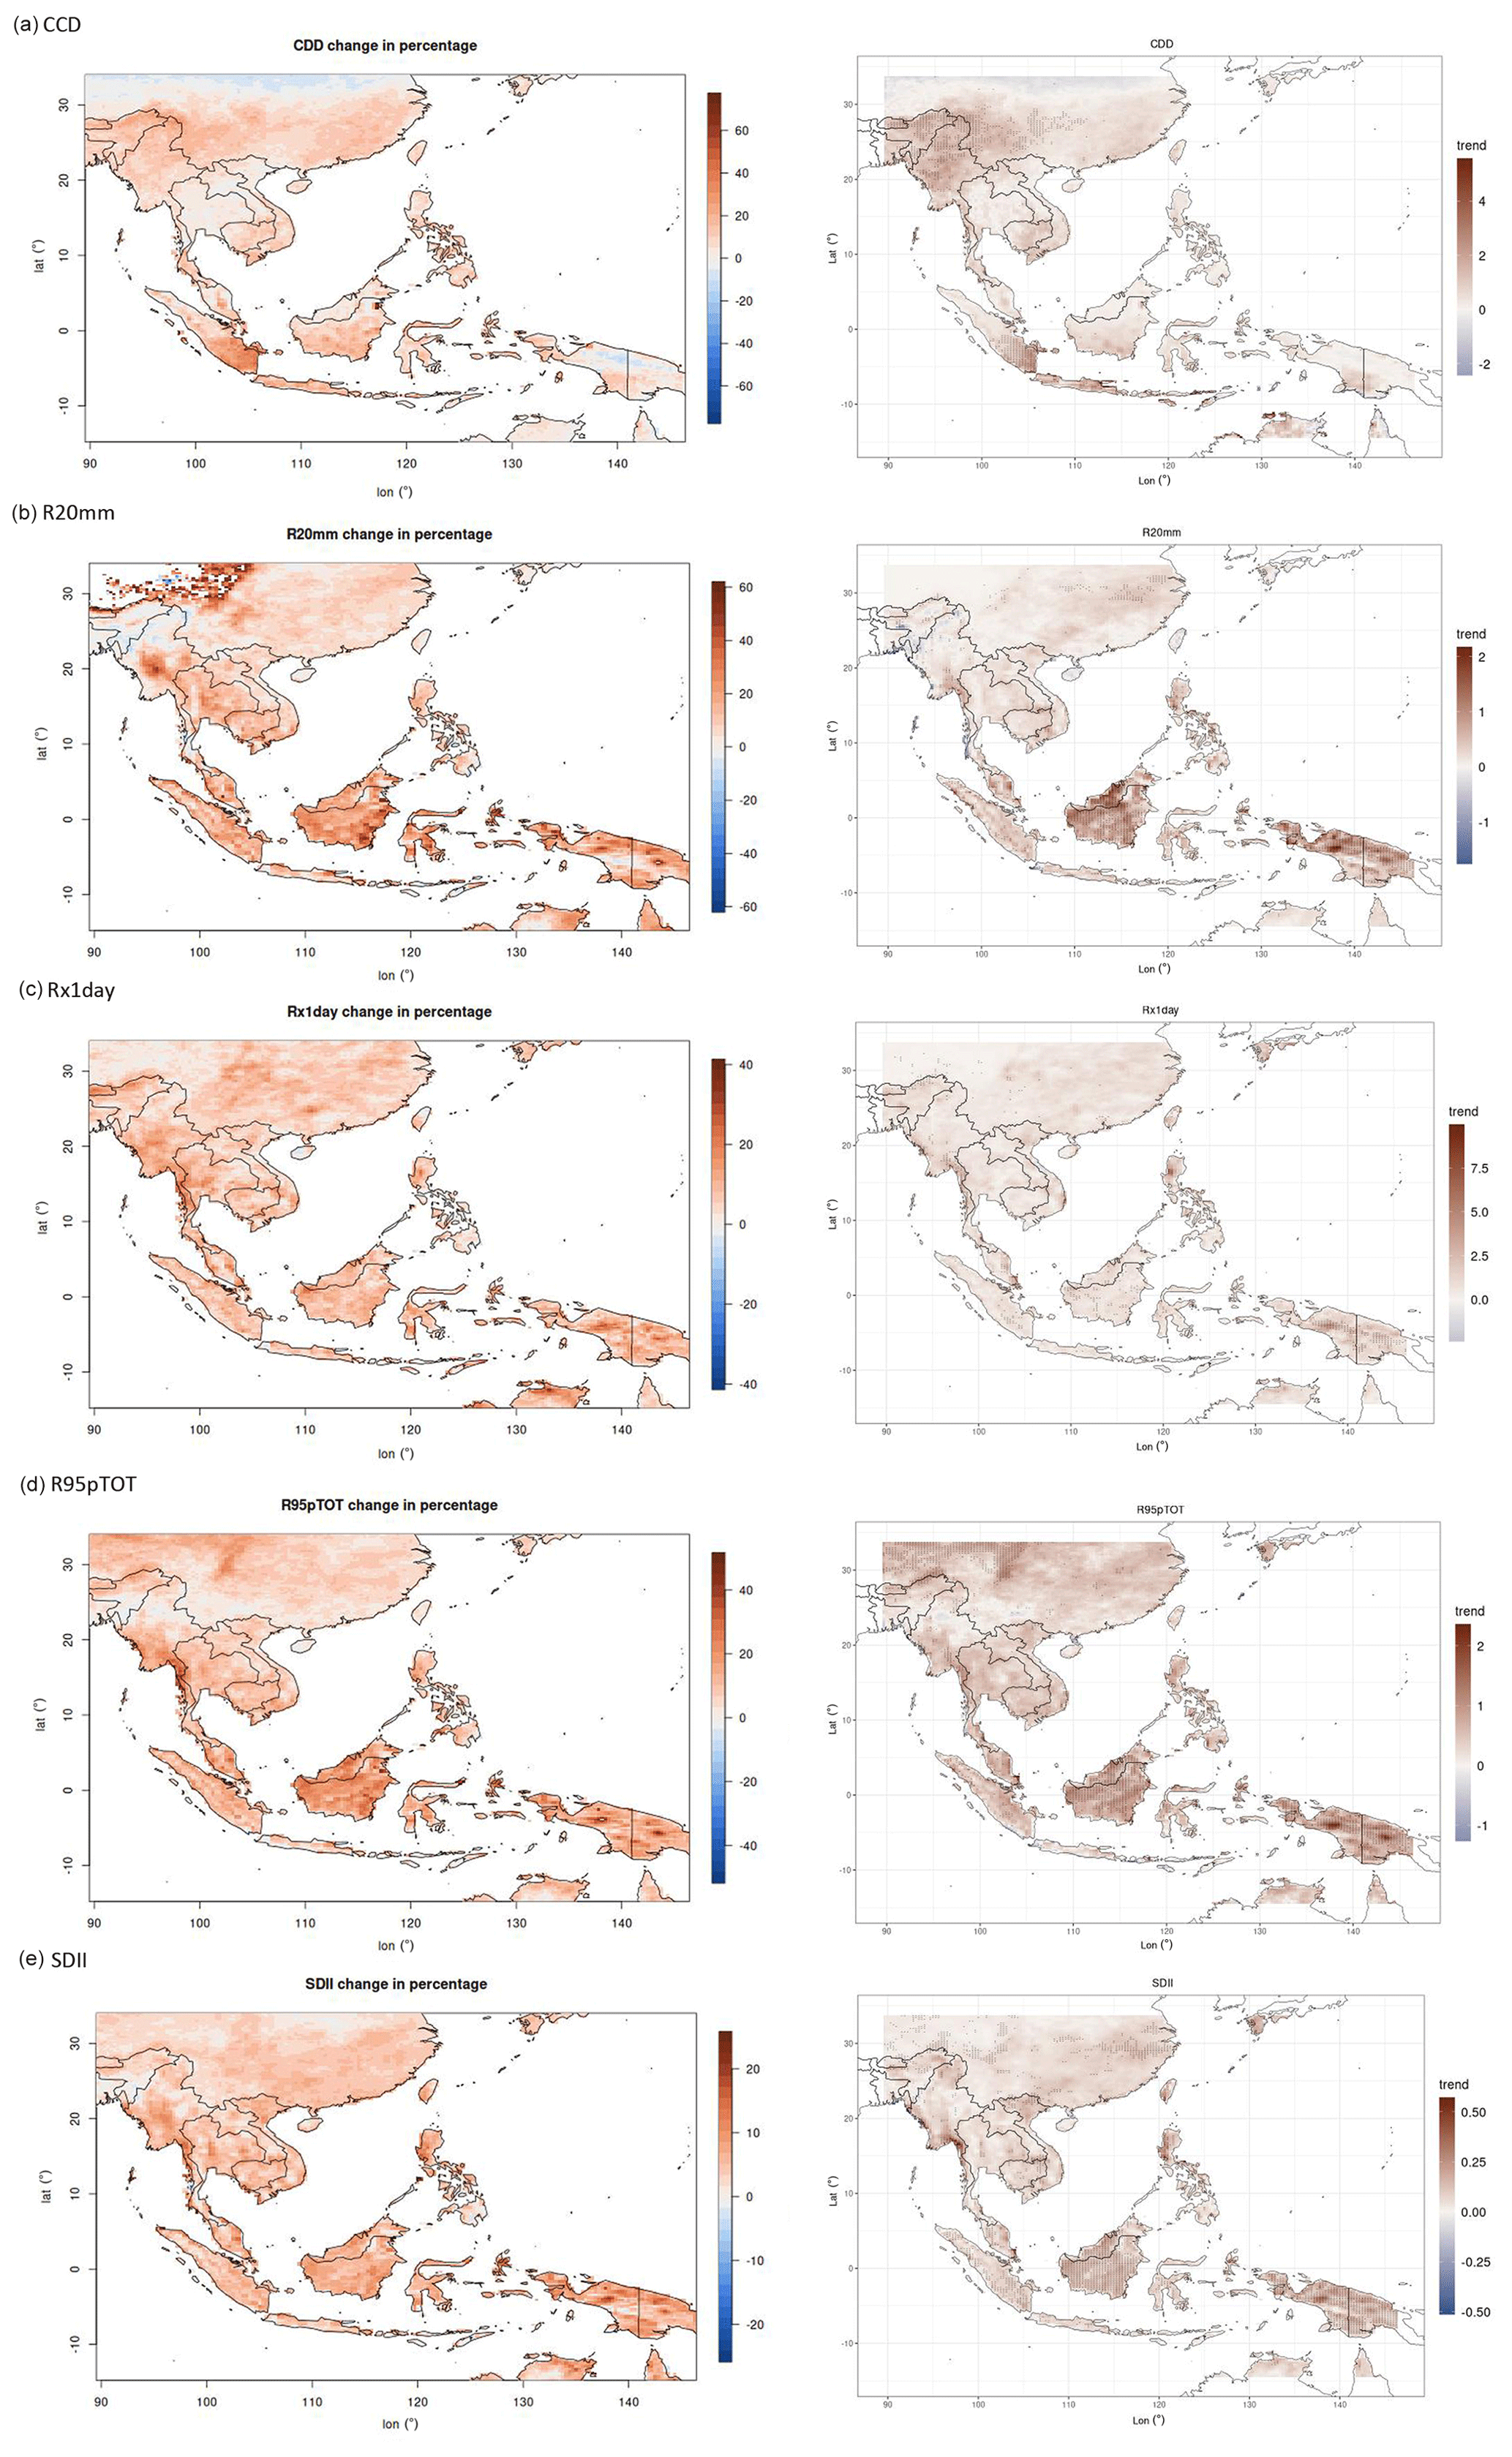
Figure 3The change in percentage of the near future (2021–2050) compared to the historical period (1981–2010) (left panels) and the trend period 1971–2050 (right panels) for annual (a) maximum length of a dry spell (CDD), (b) number of very heavy rainfall (R20mm), (c) maximum daily rainfall (Rx1day), (d) precipitation percent due to R95p days (R95pTOT), and (e) simple daily intensity index (SDII). The dashes in the trend map indicate model agreement in the trends, significant at 60 % level agreement.
The change in frequency of heavy-rainfall events (precipitation events with daily amounts greater than or equal to 20 mm (R20mm)) in the near future compared to the historical period is also apparent in our results (Fig. 3a). Northwestern MSA and several islands in the maritime continents, such as Sumatra, Borneo, Sulawesi, and Papua, are projected to have an increase of R20mm. A high increase (>40 %) of R20mm is found over some areas in the eastern part of Borneo and mountainous areas in the northern part of Papua. Based on model agreement, a significant increasing trend for both R20mm and R10mm also appears over Borneo and the mountainous area in northern Papua (Figs. 3b and S5b). This clearly indicates a robust signal of increasing heavy- and very-heavy-rainfall events over those regions.
The change in intensity of yearly maximum 1 d precipitation (Rx1day) is depicted in Fig. 3c. Rx1day shows an increasing intensity scattered over mainland Southeast Asia, especially in the west coast and the northern part of Myanmar, the west and east coast of Peninsular Malaysia, and some areas in Thailand, Cambodia, and the southern part of Vietnam. Over the Indonesian region, Rx1day increases over Borneo, Sumatra, Sulawesi, and mountainous areas over Papua. A similar pattern is also found for the maximum 5 d precipitation (Rx5day), as shown in Fig. S6a. Although Rx1day and Rx5day exhibit increasing trends spreading over SEA, the trends are stronger over the western coast of Myanmar and the mountainous area of Papua (Figs. 3c and S6b).
The change in the rainfall fraction due to extremely wet days (exceeding the 95th percentile) (R95pTOT) is shown in Fig. 3d. The figures clearly indicate an increase in R95pTOT across SEA. In the near future, large percentages of areas with an increase in R95pTOT are found over western, northwestern, and central MSA; Peninsular Malaysia; Sumatra; Borneo; Sulawesi; and Papua. Especially over the western coast of Myanmar, Borneo, and Papua, there is a large increase in R95pTOT (>20 %). In terms of the model agreement on the trend significance, a significant increase in trend is found over west northern MSA, Borneo, and the mountainous region in Papua.
Regarding the simple daily intensity index (SDII), Fig. 3e shows an increase in SDII (>10 %) over the western part of Myanmar, the east coast of Peninsular Malaysia, the northern Philippines, Borneo, and Papua. A significant increasing trend of SDII is seen over the northern Philippines, southern Sumatra, Sulawesi, Borneo, Papua, and some areas in MSA. Over Peninsular Malaysia, a significant positive trend is found over the west coast of the Malaysian peninsula instead of the east coast of the region, which has a higher increasing value of SDII.
Mean and extreme rainfall exhibit seasonally dependent patterns. Figures S8–S11 present the seasonal changes in rainfall indices (CDD, R20mm, Rx1day and R95pTOT). The analysis considers four seasonal periods: December to February (DJF), March to May (MAM), June to August (JJA), and September to November (SON). Results indicate that the projected increase in CDD in the near future is more pronounced during the periods of JJA and SON. This is particularly evident over the southern part of Sumatra, the southern part of Borneo, and the northern part of Myanmar (Fig. S8).

Figure 4Seasonal simple daily intensity index (SDII) change in percentage in the near future (2021–2050) compared to the historical period (1981–2010).
Figure 4 illustrates the seasonal changes in SDII in the near future. Results indicate an increase in SDII during DJF and MAM in the Indonesia region, suggesting an increase in rainfall intensity during the peak (DJF) and the end phase (MAM) of the monsoonal season. On the contrary, decreasing intensity (SDII) is observed over MSA and the Philippines for these periods, especially for MAM, whereas, during JJA and SON, most of SEA shows an increase in SDII, except for the southern part of Indonesia. Moreover, we also found a substantial increase in SDII over Vietnam during SON. This condition aligns with the patterns observed in R20mm, which shows a similar pattern (Fig. S9). Over the southern part of Indonesia (Java, Bali, and Nusa Tenggara), R20mm increases during DJF and MAM. In contrast, increasing SDII is noted over the MSA region for SON and JJA. In addition, over the equatorial region (Sumatra, Borneo, and Papua), an increase in R20mm is observed for all periods. Similar conditions are also seen in Rx1day and R95pTOT (Figs. S10 and S11).
3.2 Change in streamflow over Southeast Asia
Streamflow is the volumetric flow rate of water per unit of time that is transported through a given river cross-section. Figure 5a and b indicate the percentage of LFD change and the percentage of change in the probability of extremely low flow over the MEB. Figure 5c and d show the percentage of HFD change and the percentage of change in the probability of extremely high flow over the MEB. The decrease (increase) in LFD (HFD) indicates the more extreme condition of low- (high-) flow events in the near future. Figure 5a and b show that future low flows will be more severe and that the probability for low flows increases; these conditions are more general over the central and southern parts than over the northern part of MEB. Over 76 % of the area of the MEB will face a decrease in the magnitude of LFD (16 % decrease on average), with 15 % of this area showing a further reduction of more than 25% in discharge in the LFD events. In terms of low-flow events, the largest part of the region (82 %) shows an increasing probability for a low-flow discharge, with a 66 % increase (on average). Significantly decreasing LFD and increasing probability of low-flow events appear in the center part of the MEB (25–17° N), with 23 % and 104 % on average.
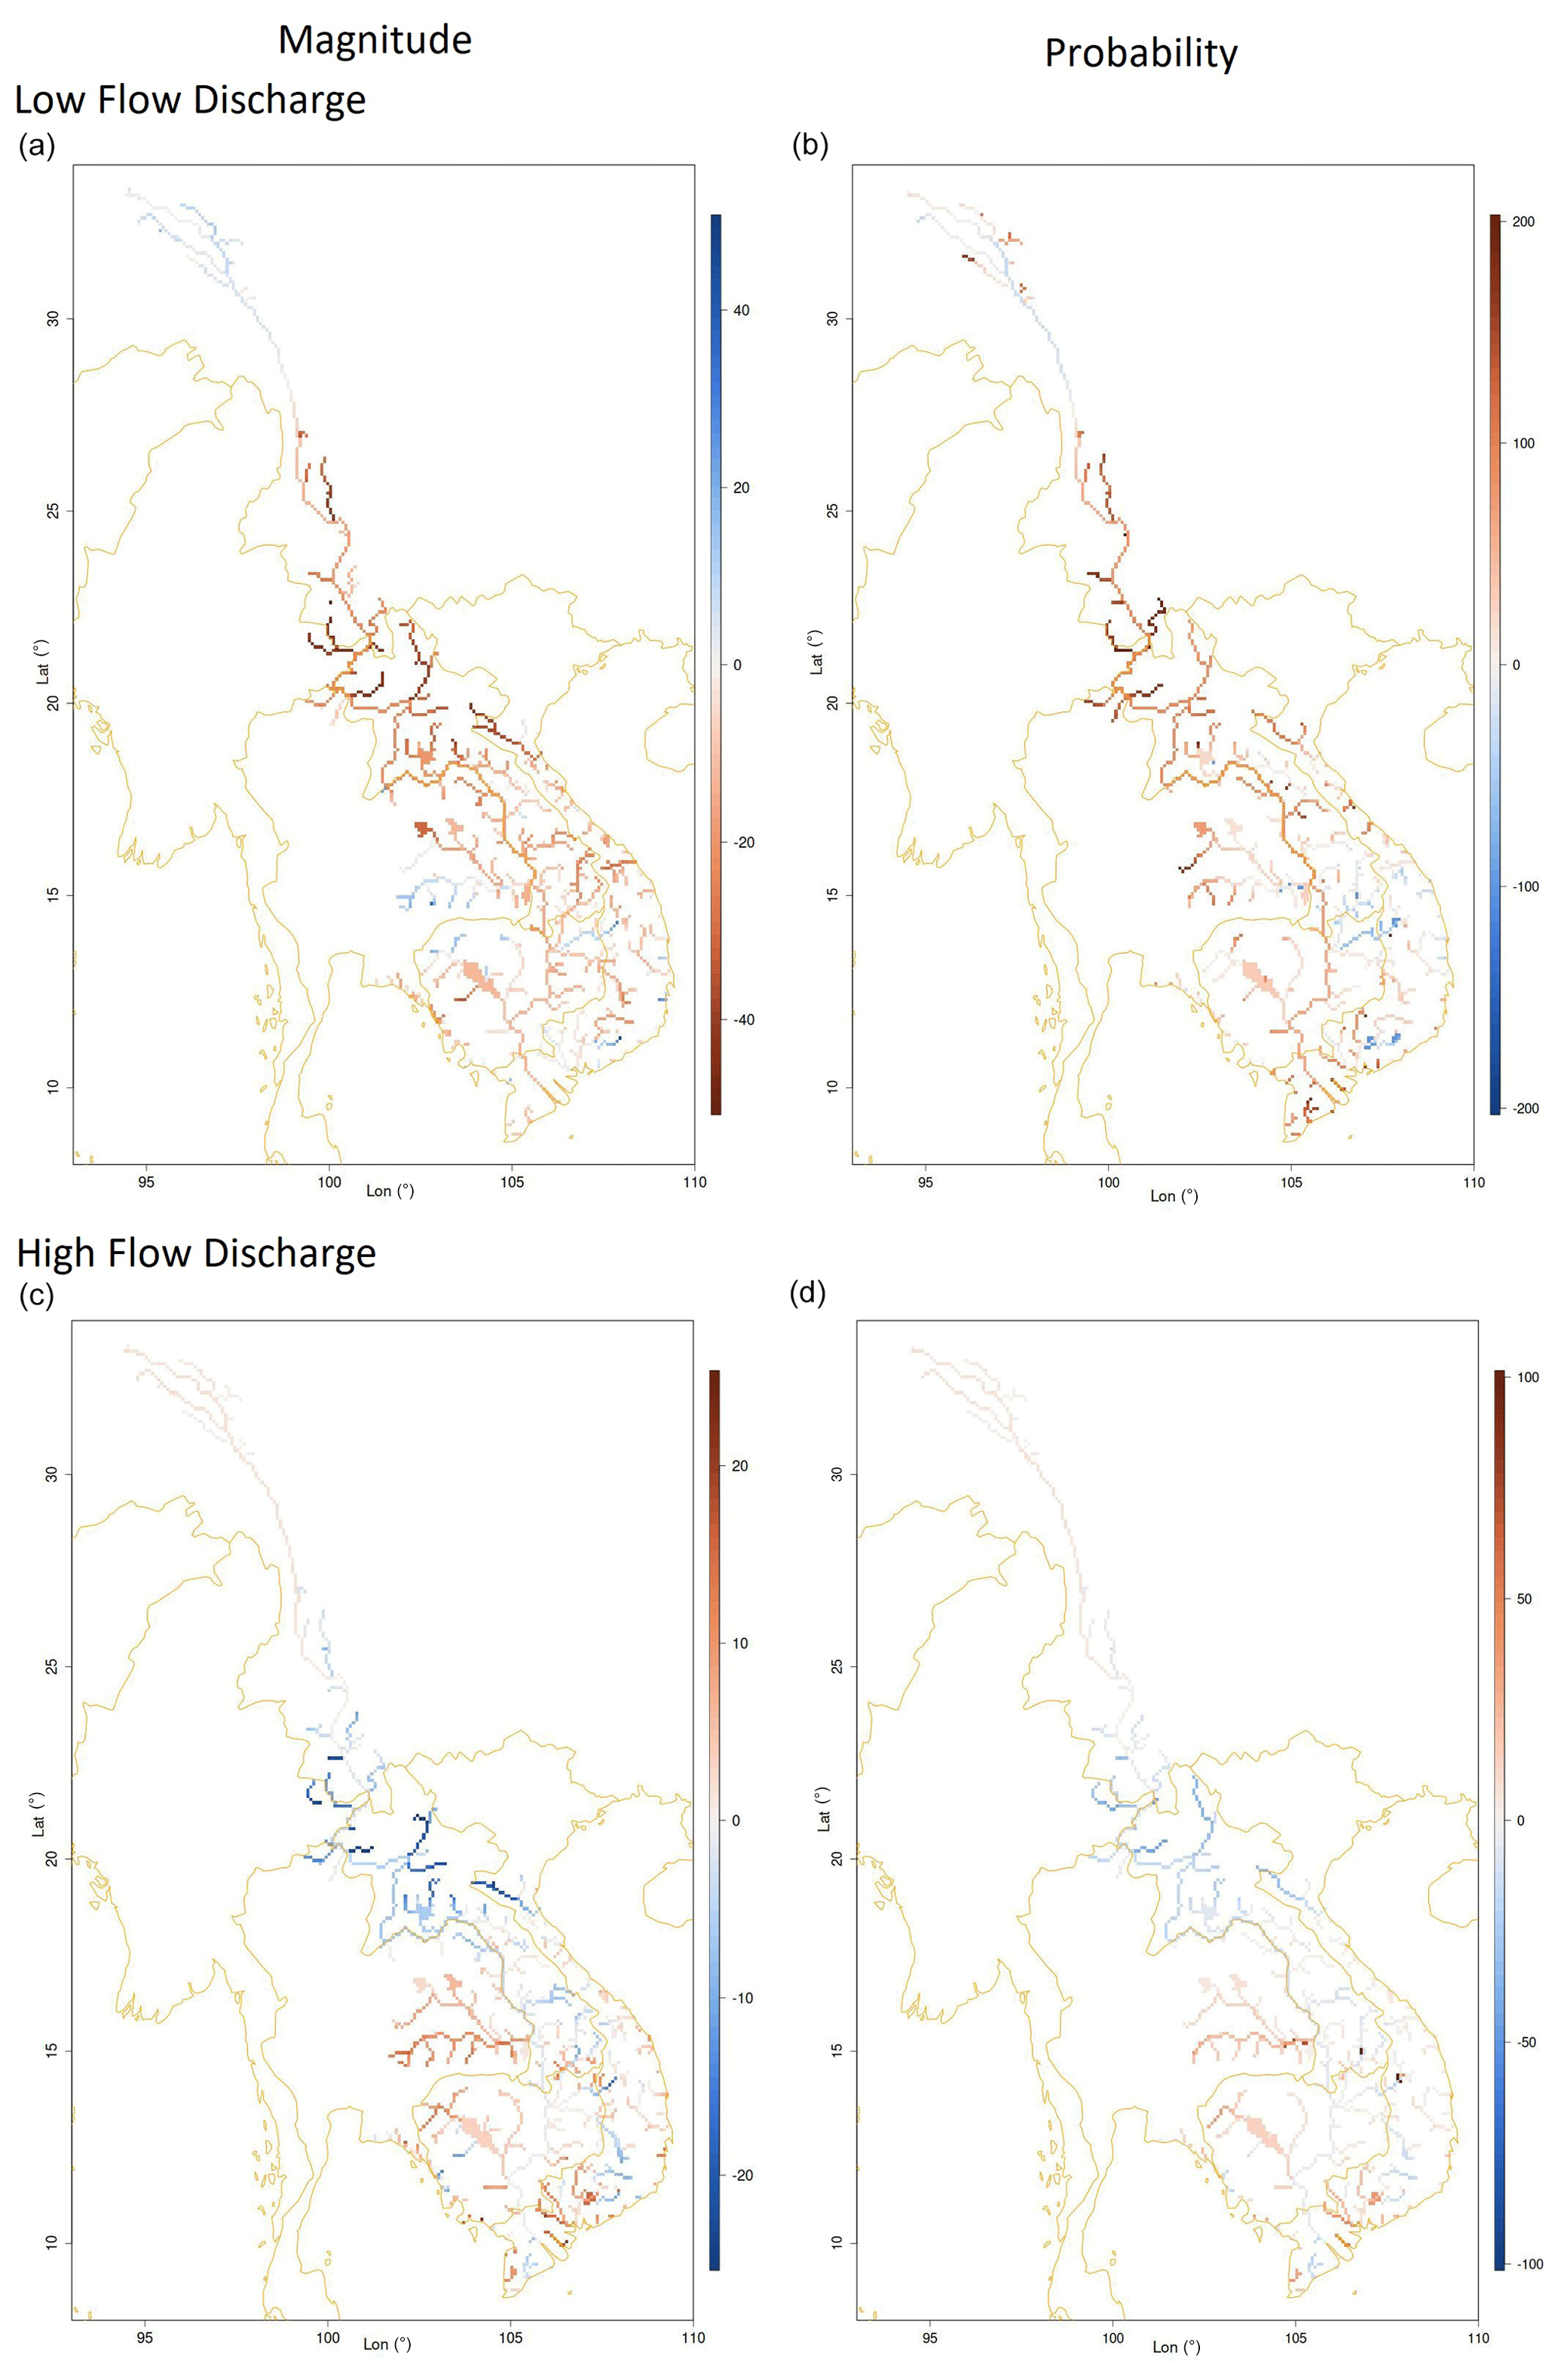
Figure 5The change of extremely low (percentile 10) and extremely high (percentile 95) water discharge in the near future (2021–2050) compared to the historical period (1981–2010) over the Mekong region. (a) Low-flow magnitude change (%), (b) low-flow probability change (%), (c) high-flow magnitude change (%), and (d) high-flow probability change (%).
In terms of high discharge, half of the region shows an increase in the magnitude of HFD events (50 % area) (Fig. 5c) and in the probability of high-flow events (49 % area) (Fig. 5d) in the near future. However, the magnitude for both indices is relatively low, with only a 5 % and 12 % increase on average, respectively, for HFD and the probability of high-flow events. Slightly in contrast to the low flows, more extreme conditions of high flow are found over the northern part of the region.
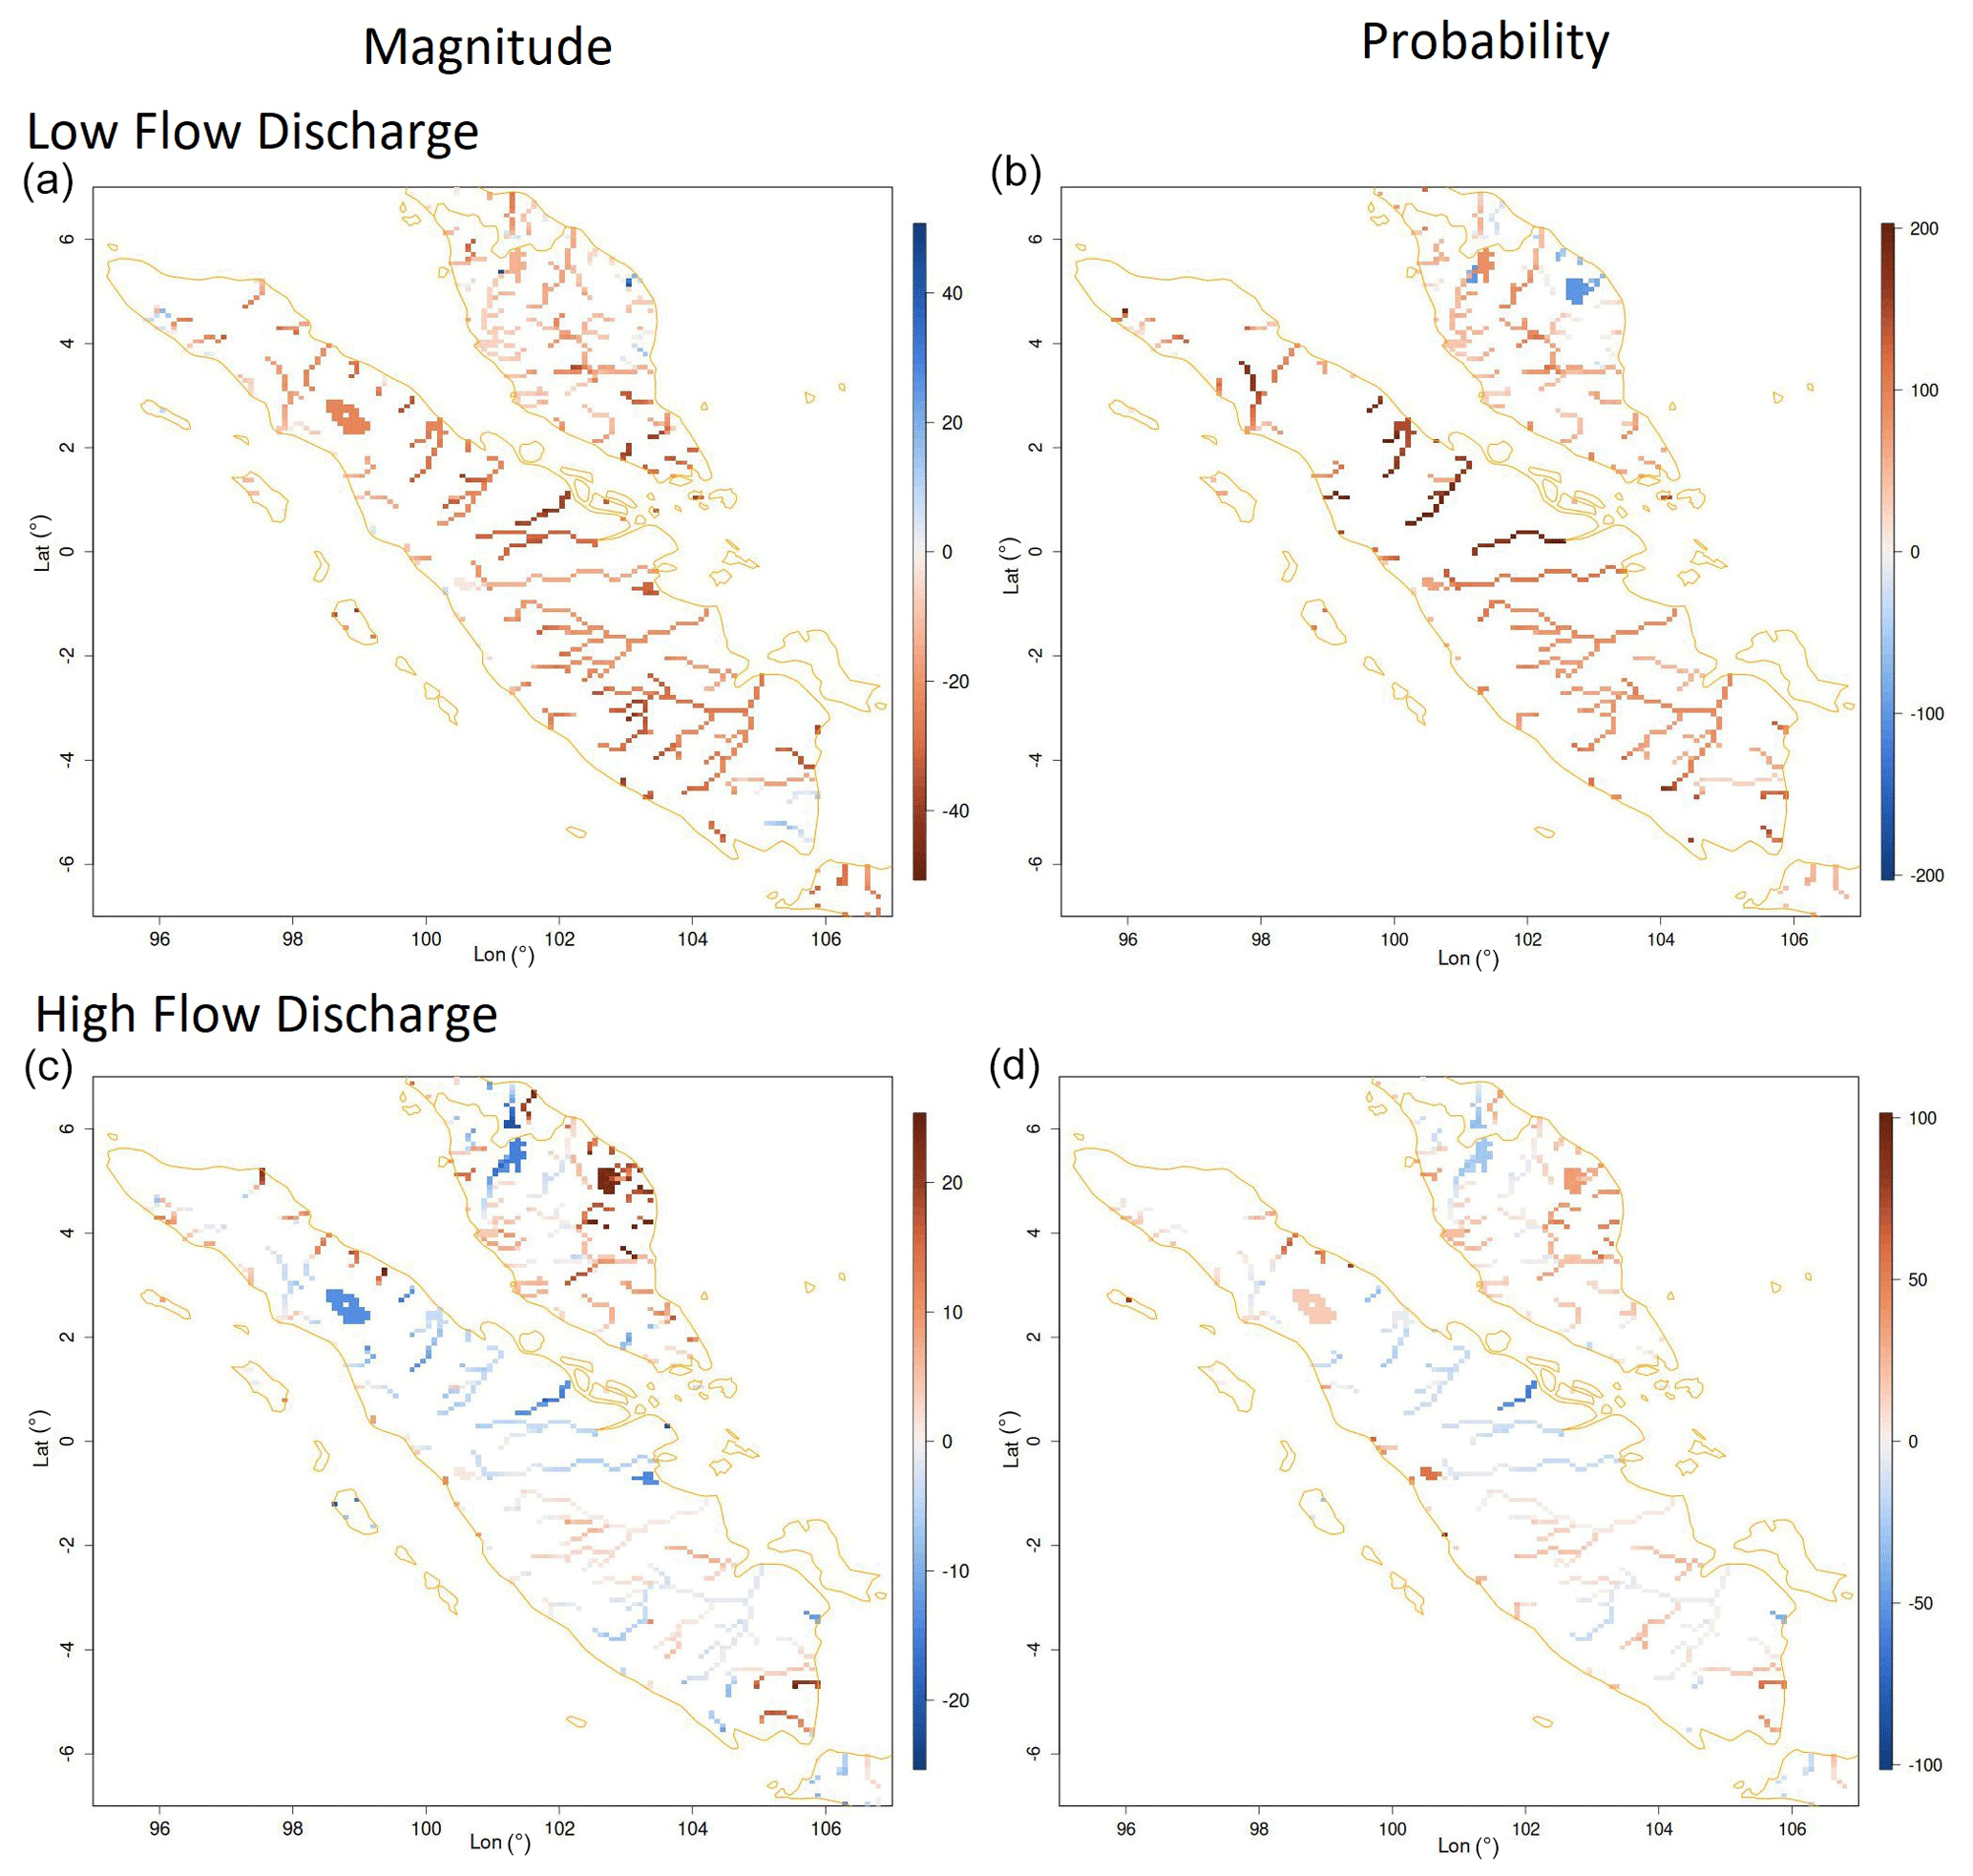
Figure 6Similar to Fig. 5 but now for Sumatra and Peninsular Malaysia regions.
The percentage of LFD and HFD change and the probability change in extremely low and high flows in the SMB are shown in Fig. 6. Figure 6a and b show that future low flows will be more severe and that the probability of low flows increases. Over 91 % of the SMB will see further reductions in flow with (on average) 19% but peaking at average decreases of 22 %–24 % for the central (2° S–2° N) and southern (below 2° S) parts of Sumatra. These are higher than the northern part of Sumatra and Peninsular Malaysia, with (on average) 17 % and 15 % decreases. Furthermore, the probability of extreme low-flow events will increase over 94 % of the SMB (101 % on average), with 95 % of these areas experiencing an increase in the probability of more than 25 % compared to the historical period (Fig. 6b). Over Sumatra, all parts of the island show increasing probability, with (on average) 146 %, 127 %, and 76 % increases for the northern, central, and southern parts, respectively. On the other hand, in Peninsular Malaysia, the average increase in the probability of extreme low flow-events reaches 73 %.
In contrast to the low flows, the high flows will get less extreme (Fig. 6c), and the probability of high flows insignificantly increases (Fig. 6d) over the SMB region. In terms of high flow, 49 % of the SMB region shows increasing HFD in the near future. On average, the increase in HFD magnitude occurs only over 7 % across the SMB. Compared to other areas in the region, the increasing high discharge is more prominent in Peninsular Malaysia, with 70 % of this region showing a 10 % higher HFD on average compared to in the past. In terms of high-flow events, 59 % of the region shows an increased probability of the events, with a 19 % increase on average.
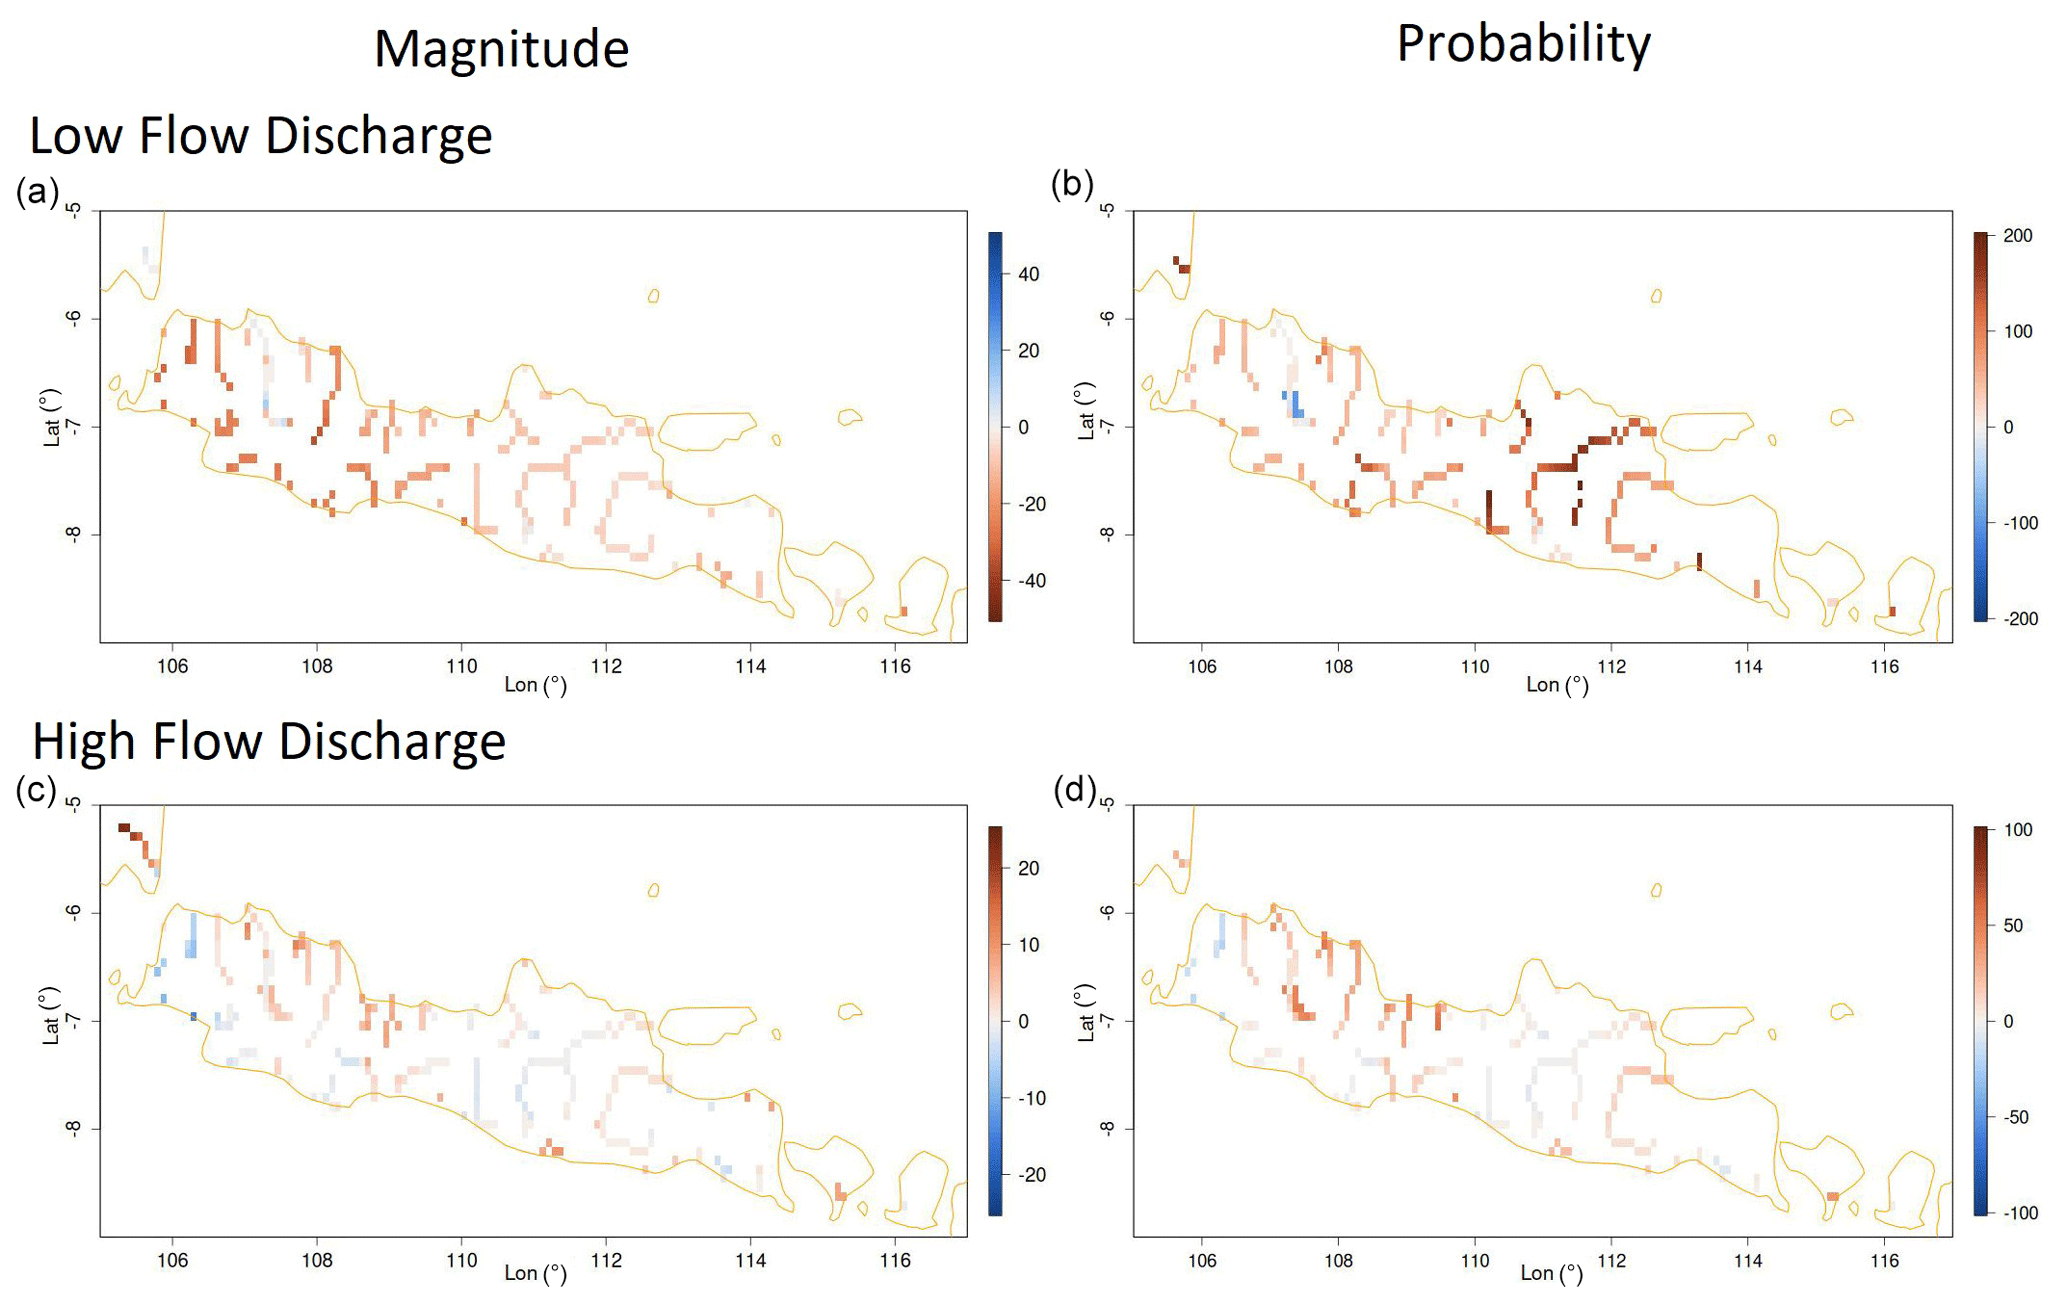
Figure 7Similar to Fig. 5 but now for Java.
On Java (Fig. 7), the increasing severity during low-flow events in the near future is higher than the increasing severity during high-flow events. The decreasing LFD magnitude will occur over a large area of Java (85 %) (Fig. 7a). The average value of the decrease in LFD magnitude is 13 %. Although the percentage area that shows decreasing LFD over the western part (79 %) is less compared to the eastern part (96 %) of Java, the magnitude of the decreasing LFD is higher for the western part. The average decreasing LFDs for the western and eastern parts of Java are 19 % and 8 %, respectively. A slightly different condition is shown in the probability of extreme low-flow events compared to the low-streamflow magnitude change over Java. The increasing probability of extreme low-flow events is more pronounced in the eastern region compared to in the western region. In the eastern region, 98 % of the areas show an increasing probability, with an average increase of 126 %. Meanwhile, in the western region, 90 % of the areas show an increasing probability, with an average increase of 52 %. Overall, 95 % of Java shows an increased probability of low-flow events, with a 90 % increase on average (Fig. 7b). The increase in high-flow magnitude over Java is lower than the corresponding change in low-flow magnitude; 58 % of Java shows an increasing HFD magnitude in the near future (Fig. 7c). However, the maximum increase in HFD in the Java is only 11 %, with 3 % as an average. In general, the increasing HFD magnitude is relatively low in Java, unlike other locations in SEA. The increase in the probability of extreme high-flow events is more significant compared to the increase in HFD (Fig. 7d). A large part of Java (75 %) will experience an increase in probability, with 25 % of these areas indicating a higher probability of >25 % in the future. The average increase in probability is 16 % across Java.
In Borneo, both high- and low-flow events are projected to increase in the near future, especially in terms of the probability of change in extreme events. Here, even though it is projected that 91 % of the area will experience lower LFD in the near future, the magnitude is relatively low, with only a 10 % decrease in LFD on average (Fig. 8a). The decreasing LFD over the southwestern part of Borneo is more than in the other parts of the island. On the contrary, with the relatively low decrease in low streamflow, the increase in the probability of extremely low events over Borneo is fairly significant. Figure 8b shows that the increase in the probability of low-flow events will occur in 94 % of Borneo, with 74 % of these areas experiencing a higher probability of >25 %. In addition, the entire southern part of Borneo will experience an increasing probability of low-flow events, which is divided into the southwestern part (67 % increase on average) and the southeastern part (59 % increase on average).
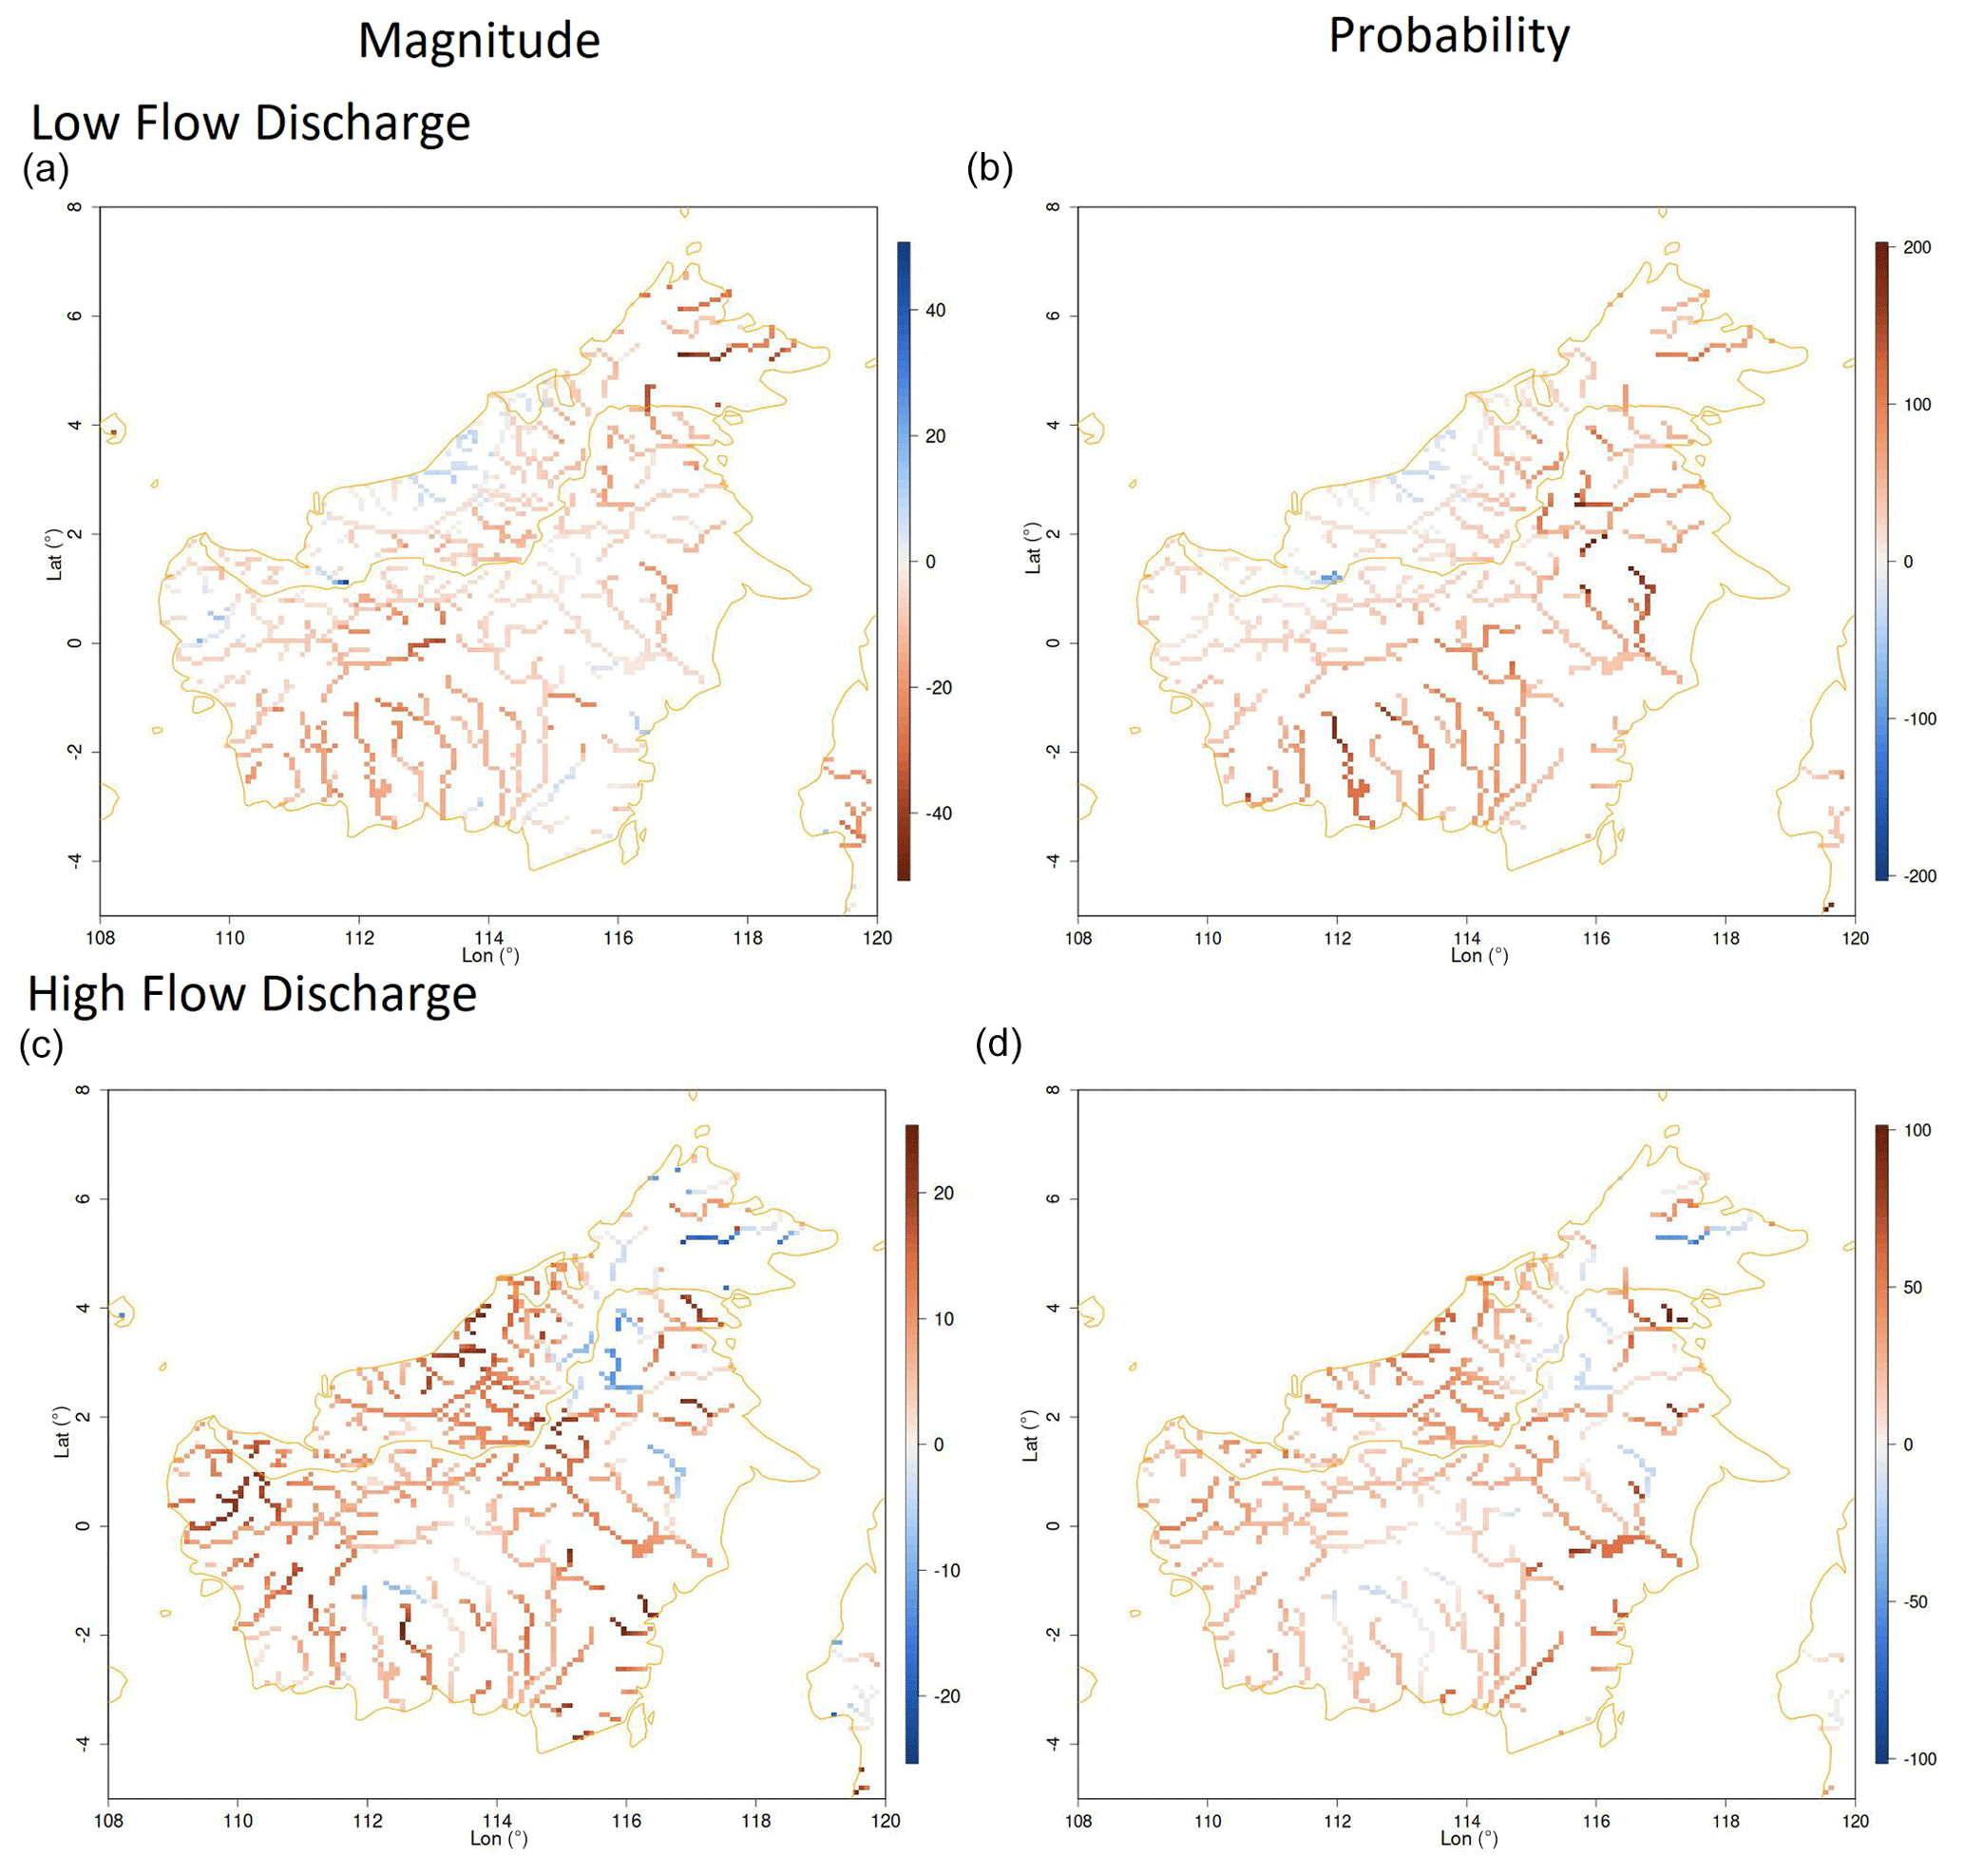
Figure 8Similar to Fig. 5 but now for Borneo.
Figure 8c shows a percentage of HFD changes in Borneo. It shows that most of the region (89 %) will experience increasing HFD, spreading more from the northwest to the southeast. However, the increasing HFD is relatively low, with an average of 8 %. Figure 8d demonstrates that the increase in the probability of extreme high-flow events occurs over 90 % of Borneo, spreading more from the northwest to the southeast. The average increase in probability is 28 %, with almost half of the increased probability being >25 % in the near future.
4.1 Extreme climatic changes
To understand past, present, and future climate changes, the Southeast Asia Regional Climate Downscaling/Coordinated Regional Climate Downscaling Experiment (SEACLID/CORDEX–SEA) (http://www.ukm.edu.my/seaclid-cordex, last access: 29 April 2024) group has conducted dynamic downscaling of a multi-model dataset from CMIP5 into a high-resolution dataset (Cruz et al., 2017; Tangang et al., 2020). In this sub-section, we compare our findings with previous studies from CORDEX-SEA. This study utilizes the HighResMIP model, which shares a similar resolution with the CORDEX-SEA but is based on the latest version of GCM (CMIP6). Furthermore, HighResMIP was globally run at a high resolution, while CORDEX-SEA resulted from a regional climate model. The use of HighResMIP in the study is expected to yield less uncertainty in the results compared to CORDEX-SEA (Hariadi et al., 2021, 2022; Tian-Jun et al., 2019).
Compared with CORDEX-SEA, we found some similarities and some differences in our results. Tangang et al. (2018) found that Myanmar will have more consequences in the form of extreme events due to global warming than other regions in MSA. Northern Myanmar will experience more severe extremely dry and wet conditions in the future under the 2 °C global warming scenario. This is confirmed in our results, where we found that the northern part of this region shows an increasing dry-spell length (CDD), and the models show an agreement on the increasing trend of CDD in the near future, indicating that this increase is a robust signal. In addition, the western coast of this region will also experience higher precipitation extremes, as indicated by some indices, such as Rx1day, Rx5day, R95pTOT, and SDII. The contrasting behavior between longer dry periods and more intense rainfall is a trend that is observed globally as well (Benestad et al., 2022). Tangang et al. (2019) found that Thailand will experience wetter conditions over the northern–central–eastern parts and drier conditions over the southern part. A similar pattern of index changes was also found in this study. However, based on the model agreement, we found no significant trend in these wet and dry conditions. Nguyen-Ngoc-Bich et al. (2021) found that, based on the Palmer drought severity index, substantial increases in drought duration, severity, and intensity appear over northern parts of the north–central sub-region, over parts of the central highlands, and over southern Vietnam. In our study, we could only confirm that longer dry spells (CDDs) appear over the eastern coast of the southern part of Vietnam, but there is no model agreement on the trend significance.
Ngai et al. (2020a) demonstrated that rainfall extremes are likely to decrease (increase) over Peninsular Malaysia (Malaysian Borneo) by the end of the century. However, our result is contradictory in the sense that an increase in extreme rainfall is seen over Peninsular Malaysia, although the increase is less than in Malaysian Borneo. Some decreases in the number of heavy-precipitation days (R10mm) are projected over some areas in Peninsular Malaysia, but this decrease is not clear for other extreme rainfall indices. In addition, Ngai et al. (2020b) found large increases in R20mm, RX1day, R95pTOT, and R99pTOT and also small increases in SDII and CDD over the Malaysia region. Our study yields similar conditions for those parameters, except for SDII, which shows a large increase. The increase in SDII spreads over the region and shows a significant trend over the western part of Peninsular Malaysia and the majority of Malaysian Borneo.
A previous study by Supari et al. (2020) found that the increase in CDD is higher than the increase in Rx1day and the frequency of extremely heavy rainfall (>50 mm) (R50mm), especially over the Indonesian region. Accordingly, Tangang et al. (2018) also simulated a robust increase in CDD, which indicates drier conditions over Indonesia in the future. The almost similar conditions between CDD and Rx1day are found in our study. Although the increase in Rx1day is scattered over SEA, the increasing CDD is more prominent than Rx1day, especially in the Indonesian region. In our study, we also calculated R20mm instead of R50mm, which shows a slightly different result. The increase in R20mm is more prominent than CDD. Over the Indonesia region, a significant increasing trend of R20mm appears over Borneo and the mountainous region in Papua. The CDD, on the other hand, has a significant positive trend over southern Sumatra and in Java. Moreover, the increase in CDD in Indonesia is higher than in other regions in SEA. This indicates that a tendency toward dryer conditions is higher in the Indonesia region than in other regions in SEA.
4.2 The impact of changes in climate indices on the hydrological extremes
In their investigation of climate change impacts on global streamflow, Van Vliet et al. (2013b) observed changes in seasonal flow amplitudes, magnitude, and timing of high- and low-flow events. They projected that the mean flow and low flow will decline over SEA in the future. This is supported by other previous studies showing the streamflow change over the Johor (Tan et al., 2019) and Kelantan (Tan et al., 2020) river basins in Malaysia. In addition, they projected that the meteorological drought is likely to become longer at the end of the 21st century. However, it is still not clear whether the hydrological drought will have a longer duration. Although results from a study on meteorological drought – focusing on short-term precipitation shortage – do not necessarily coincide with hydrological drought, low flow will most likely occur during an extreme drought event (Sutanto and Van Lanen, 2021). Similarly to the global study conducted by Van Vliet et al. (2013b), our research is in agreement with their findings by concluding that, over SEA, the impact of extreme climate change in the near future is more prominent for the low-flow conditions than for the high-flow conditions, especially in Indonesia.
The impact of changes in climate indices in SEA also affects the changes in hydrological extremes. The increase in CDD over the northern MEB (northern 24° N) results in declining LFD over the central part of the MEB, especially over northern Laos. Our results also show that the increase in Rx1day and R95pTOT over the northern MEB does not significantly affect the HFD over the northern and central parts of the MEB. However, the increase in Rx1day, R95pTOT, and SDII over the southern MEB yields higher HFD and a higher probability of high-flow events over Thailand and Cambodia.
In the southern part of Sumatra and in the center of Peninsular Malaysia, the CDD will increase in the near future, reducing the LFD across the region. This might be caused by the increase in CDD5D that spreads more than CDD. The increase in SDII over the southern part of Sumatra and the eastern part of Peninsular Malaysia results in higher streamflow and the probability of HFD in some rivers in these regions.
The increasing CDD that spreads in the majority of areas of Java makes most rivers on the island show a decrease in LFD. Increasing Rx1day, R95pTOT, and SDII over the northern coast of the western part of the island lead to higher HFD and an increase in the probability of high-flow events.
In Borneo, the increase in CDD in the southern part and in CDD5D in most areas of the island decreases the LFD and increases the probability of low-flow events. Although the increasing Rx1day is visible only in some areas in Borneo, most areas show higher R95pTOT and SDII. As a result, most of the rivers in Borneo have a higher HFD and probability of high-flow events.
Multiple sectors can be affected by the change in magnitude and probability of LFD. The likely impact of decreasing LFD over SEA will pose a challenge to some sectors, such as agriculture, hydropower, industry, and public water supply. As mentioned by Horton et al. (2022), the decreasing flow in the early wet season in the future over the Cambodian Mekong floodplain will affect rice production. In addition, in Laos, hydropower will face challenges due to a 22 % decrease in LFD and an 85 % increase in the probability of low-flow events in the central part of the MEB. Meanwhile, over Sumatra, two big hydro-powered rivers will also face issues with decreasing LFD. The two hydropower sectors are as follows: firstly, the Siguragura hydropower, located in the northern part of Sumatra, which will face a 15 % LFD decrease and an 88 % increase in the probability of low-flow events in the Asahan River, and secondly, in the western part, the Musi Bengkulu hydropower, which will face a 23% LFD decrease and a 75 % increase in the probability of low-flow events in the Musi River. On another island of Indonesia, Java, the Mrica hydropower on the Serayu River in the central part of the island will face a 17 % LFD decrease and a 68 % increase in the probability of a low-flow event. Over Borneo, the Kayan River will face an 8 % LFD decrease and an 80 % increase in the probability of low-flow events; this condition needs to be considered for the planning of the Kayan hydropower project, which will be one of the biggest hydropower plants in SEA and will provide electricity for the new capital of Indonesia (Ibu Kota Nusantara – IKN). The increase in extremely dry rainfall conditions will decrease the LFD, resulting in a low water table in the soil. In Borneo, these conditions will decrease the peatland's water table, which will increase the risk of forest fires in that area and, for similar reasons, over Sumatra (Taufik et al., 2017).
4.3 Impact of catchment properties on hydrological extremes
The impact of climate change varies between rivers depending on the catchment characteristics. This also applies to extreme events, such as floods, droughts, high flows, and low flows, as shown in our study. Previous studies on drought demonstrated that hydrological extremes are influenced not only by climate but also by the catchment properties (Van Lanen et al., 2013; Van Loon and Laaha, 2015; Sutanto and Van Lanen, 2022). In our study, the role of the physical characteristics of the river can be clearly seen in the low-flow analysis. To investigate the impact of catchment characteristics on the low flow, we calculated the river recession constant (C) (Gustard and Demuth, 2009). The C value shows the overall recession rate in days, in which the small (high) C indicates a steep (flat) hydrograph of the river (Gustard and Demuth, 2009). One should note that the recession constant (C) is not the same as the recession coefficient (RC). A steep hydrograph indicates that the river has a high risk of a flash flood, while a flat hydrograph shows a low risk of a flash flood. A description of how to calculate C and the plots over four selected domains are available in Fig. S12.
In the MEB, increasing CDD over the northern part of the region has more of an impact on LFD over the central part of the basin. A similar result was also found in Java, where increasing CDD across the island has more of an impact on LFD for rivers flowing in the western part of the island. The C analysis shows that these rivers have relatively small C. We found that rivers with small C (steep hydrograph) are more susceptible to LFD changes than rivers with high C (flat hydrograph), associated with catchment properties. Some interesting results are also found over Sumatra and Java regarding increasing the probability of low-flow events. Although it did not show a relatively high decreasing LFD compared to other rivers in each domain, rivers in the northern part of Sumatra, the eastern part of Java, the southern part of Borneo, and also the eastern part of Borneo show a significant increase in the probability of lo-flow events. Those rivers are found to have a relatively high C value.
Next, we discuss the relation between the change in low flow and catchment properties denoted by C by plotting the density of the streamflow over three rivers for historical and near-future periods. The plot of the density of the discharge over three rivers is available in Fig. S13. The Solo River located in the eastern part of Java and the Kampar River located in the northern part of Sumatra are rivers that have high C values. We compared those rivers with the Batang Hari River, situated in the southern part of Sumatra, which has a small C value. Here, we found that rivers with high C values have a more narrow streamflow distribution than rivers with small C values. This is due to the more steady and less flashy streamflow characteristic of high-C-value rivers triggers a higher probability of low-flow change than for small C value rivers.
4.4 Sources of uncertainty
There are three sources of uncertainty related to the results, which are climate-forcing inputs, hydrological model structure, and hydrological model parameters. In terms of climate forcing, this study used one Representative Concentration Pathway (RCP) climate scenario (RCP8.5), which is the projection based on a high-future-emissions scenario for temperature and greenhouse gases (global warming scenario). The use of this single scenario becomes one of the sources of uncertainty in the results as it makes the results describe only one climate change scenario. However, the IPCC (2021) reports relatively small differences among RCP scenarios in the near-future (until 2050) climate projection. In addition, Lehner et al. (2020) reported that major uncertainty for the near-future rainfall projection comes from the model spread instead of the RCP scenario itself. This indicates that the uncertainty of using one RCP scenario is low. Moreover, the RCP8.5 scenario has covered the extreme spectrum of climate projection. In order to reduce the uncertainty coming from the model spread, we employed five high-resolution GCMs (10 members in total).
The second source of uncertainty comes from the hydrological model structure. In this study, we applied only one hydrological model (PCR-GLOBWB), which is a limitation of this study. This study, however, focuses on the impacts of extreme climates on future high and low flows. The PCR-GLOBWB model is one of the global hydrological models that is run at a high resolution globally, and it has been proven to be reliable for extreme studies (Van der Wiel et al., 2019; Candogan Yossef et al., 2012). In addition, the hydrological model simulation does not consider changes in water demand by agriculture or human consumption. This is also one of the limitations of the near-future flow analysis. The purpose of this setting is that we want to focus only on climate exposure on extreme streamflows.
The third source of uncertainty comes from the PCR-GLOBWB parameterization. One aspect of uncertainty is that the PCR-GLOBWB uses the Hamon method (Hamon, 1961) for the potential evaporation estimation. Temperature is the only input for the method, and this might amplify the effect of changing temperature on the results. However, the actual evapotranspiration is limited by the availability of water in water-stressed conditions, which will make this effect smaller. In addition, parameterization of deep groundwater, soil layer, and land cover also contributes to the uncertainty of the simulated flow. Nevertheless, Sutanudjaja et al. (2018) show that the streamflow simulation is reliable for our study regions.
The SEA region will experience an increase in both dry and wet extremes in the near future. Myanmar and Peninsular Malaysia will face more challenges due to climate change compared to other areas in the MSA region as the changes are the strongest in these regions. The northern part of Myanmar will experience an increase in dry-spell length (CDD), while the west coast of Myanmar will experience more extreme rainfall (in terms of the wettest day of the year, Rx1day; the wettest 5 d spell of the year, Rx5day; and the number of very wet days, R95pTOT). Peninsular Malaysia will also experience increasingly long dry spells (CDD, CDD5D) and wet spells with excessive amounts of rain (Rx5day50mm) and an increase in the intensity of rainfall (SDII). The amount of rainfall due to very wet days in Malaysia (R95pTOT) will increase in the near future. Furthermore, increasing dry-spell length (CDD) is also found in the central part of the Philippines, along with an increase in rainfall intensity in the northern Philippines. Over the Indonesian maritime continents, Sumatra and Borneo will experience more extreme conditions of dry and wet events in the near future. The southern part of Sumatra and Java will be affected by the highest increase in dry-spell length (CDD), up to 40 % in SEA. In addition, Sumatra, Borneo, and Papua will experience increasingly intense rainfall (SDII) and stronger rainfall extremes (R10mm, R20mm, Rx1day, R95pTOT).
As a result of changing rainfall, we found decreasing and increasing low flow (LFD) and high flow (HFD), respectively, along with the increasing probability of low-flow and high-flow events in the near future. A drier condition during the low-flow event is more prominent compared to a wetter condition during the high-flow event. In the Mekong Basin, the decrease in streamflow and the increase in the probability of low-flow events are found in the central and southern parts of the basin, with a higher change in the central part. In contrast, increasing discharge and probability of high-flow events are projected in the southern part of the basin, especially in Thailand and Cambodia. Drier conditions during the low-flow event and the increase in the probability of low-flow events were simulated in most of the rivers located in Peninsular Malaysia, Sumatra, Borneo, and Java. The increasing probability of future low-flow events reaches 101 % and 90 %, on average, over Sumatra and Java, respectively. The increase in high flow and its probability is found in some rivers situated in Peninsular Malaysia, western Java, and the majority of rivers in Borneo. In general, rivers in Borneo will experience more severe conditions during both low-flow and high-flow events.
Our study also concluded that rivers in Sumatra and Java that have a less steady and more variable or “flashy” streamflow (quantified as steep hydrographs) are likely to experience more decreasing low flow in the future than rivers with a flat hydrograph. However, these latter rivers will have a greater risk of increasing the probability of low-flow events than the rivers with steep hydrographs. This is associated with the characteristic of flat-hydrograph rivers that generate a narrow discharge distribution. Our study reveals that the changes in low-flow events and their probabilities are not only influenced by extremely dry climates but also by the catchment characteristics.
The PCR-GLOBWB model is available at https://github.com/UU-Hydro/PCR-GLOBWB_model (Earth Surface Hydrology Group, 2024).
The climate model output from the High-Resolution Model Intercomparison Project (HighResMIP) is available from the H2020-funded PRIMAVERA project (https://www.primavera-h2020.eu/ , PRIMAVERA, 2024), and the APHRODITE gridded precipitation and temperature datasets are available at http://aphrodite.st.hirosaki-u.ac.jp/products.html (APHRODITE'S Water Resources, 2024).
The supplement related to this article is available online at: https://doi.org/10.5194/hess-28-1935-2024-supplement.
GvdS: conceptualization, resources, supervision, review. GJS: supervision, review. SJS: conceptualization, supervision, review. ES: software. DNR: writing and editing. AS: supervision. AKT: supervision, project administration.
The contact author has declared that none of the authors has any competing interests.
Publisher's note: Copernicus Publications remains neutral with regard to jurisdictional claims made in the text, published maps, institutional affiliations, or any other geographical representation in this paper. While Copernicus Publications makes every effort to include appropriate place names, the final responsibility lies with the authors.
Mugni Hadi Hariadi received funding from the Indonesia Endowment Fund for Education (LPDP) (grant no. S-353/LPDP.3/2019) for his PhD program. Gerard van der Schrier acknowledges the support of the Royal Netherlands Embassy in Jakarta, Indonesia, through a Joint Cooperation Programme between Dutch and Indonesian research institutes. The HighResMIP simulations have been made available through the PRIMAVERA project, which received funding from the European Union's Horizon 2020 Research and Innovation program under grant agreement no. 641727. This PRIMAVERA data are part of the IS-ENES3 project that has received funding from the European Union's Horizon 2020 Research and Innovation program under grant agreement no. 824084.
This research has been supported by the Indonesia Endowment Fund for Education (LPDP) (grant no. S-353/LPDP.3/2019).
This paper was edited by Yi He and reviewed by three anonymous referees.
Aldrian, E. and Susanto, D.: Identification of three dominant rainfall regions within Indonesia and their relationship to sea surface temperature, Int. J. Climatol., 23, 1435–1454, https://doi.org/10.1002/joc.950, 2003. a
Ali, H. and Mishra, V.: Contrasting response of rainfall extremes to increase in surface air and dewpoint temperatures at urban locations in India, Sci. Rep., 7, 1–15, https://doi.org/10.1038/s41598-017-01306-1, 2017. a
Amengual, A., Homar, V., Romero, R., Alonso, S., and Ramis, C.: A statistical adjustment of regional climate model outputs to local scales: application to Platja de Palma, Spain, J. Climate, 25, 939–957, https://doi.org/10.1175/JCLI-D-10-05024.1, 2012. a
Amsal, F., Harsa, H., Sopaheluwakan, A., Linarka, U., Pradana, R., and Satyaningsih, R.: Bias correction of daily precipitation from downscaled CMIP5 climate projections over the Indonesian region, IOP Conf. Ser., 303, 012046, https://doi.org/10.1088/1755-1315/303/1/012046, 2019. a
APHRODITE'S Water Resources: Release of the APHRODITE-2 products, APHRODITE'S Water Resources [data set], http://aphrodite.st.hirosaki-u.ac.jp/products.html (last access: 29 April 2024), 2024. a
Asadieh, B. and Krakauer, N. Y.: Global change in streamflow extremes under climate change over the 21st century, Hydrol. Earth Syst. Sci., 21, 5863–5874, https://doi.org/10.5194/hess-21-5863-2017, 2017. a
Asian Development Bank: The economics of climate change in Southeast Asia: a regional review, Asian Development Bank, https://www.adb.org/sites/default/files/publication/29657/economics-climate-change-se-asia.pdf (last access: 30 April 2024), 2009. a
Benestad, R. E., Lussana, C., Lutz, J., Dobler, A., Landgren, O., Haugen, J. E., Mezghani, A., Casati, B., and Parding, K. M.: Global hydro-climatological indicators and changes in the global hydrological cycle and rainfall patterns, PLOS Climate, 1, e0000029, https://doi.org/10.1371/journal.pclm.0000029, 2022. a
Bierkens, M. and Van Beek, L.: Seasonal predictability of European discharge: NAO and hydrological response time, J. Hydrometeorol., 10, 953–968, https://doi.org/10.1175/2009JHM1034.1, 2009. a
Block, P. J., Souza Filho, F. A., Sun, L., and Kwon, H.-H.: A streamflow forecasting framework using multiple climate and hydrological models 1, J. Am. Water Resour. Assoc., 45, 828–843, 2009. a
Boé, J., Terray, L., Habets, F., and Martin, E.: Statistical and dynamical downscaling of the Seine basin climate for hydro-meteorological studies, Int. J. Climatol., 27, 1643–1655, 2007. a
Candogan Yossef, N., van Beek, L. P. H., Kwadijk, J. C. J., and Bierkens, M. F. P.: Assessment of the potential forecasting skill of a global hydrological model in reproducing the occurrence of monthly flow extremes, Hydrol. Earth Syst. Sci., 16, 4233–4246, https://doi.org/10.5194/hess-16-4233-2012, 2012. a, b
Cherchi, A., Fogli, P. G., Lovato, T., Peano, D., Iovino, D., Gualdi, S., Masina, S., Scoccimarro, E., Materia, S., Bellucci, A., and Navarra, A.: Global mean climate and main patterns of variability in the CMCC-CM2 coupled model, J. Adv. Model. Earth Syst., 11, 185–209, https://doi.org/10.1029/2018MS001369, 2019. a
Cinco, T. A., de Guzman, R. G., Hilario, F. D., and Wilson, D. M.: Long-term trends and extremes in observed daily precipitation and near surface air temperature in the Philippines for the period 1951–2010, Atmos. Res., 145, 12–26, 2014. a, b
Corporal-Lodangco, I. L. and Leslie, L. M.: Climatology of Philippine tropical cyclone activity: 1945–2011, Int. J. Climatol., 37, 3525–3539, 2017. a
Cruz, F., Narisma, G., Dado, J., Singhruck, P., Tangang, F., Linarka, U., Wati, T., Juneng, L., Phan-Van, T., Ngo-Duc, T., Santisirisomboon, J., Gunawan, D., and Aldrian, E.: Sensitivity of temperature to physical parameterization schemes of RegCM4 over the CORDEX-Southeast Asia region, Int. J. Climatol, 37, 5139–5153, https://doi.org/10.1002/joc.5151, 2017. a
Dee, D. P., Uppala, S. M., Simmons, A. J., Berrisford, P., Poli, P., Kobayashi, S., Andrae, U., Balmaseda, M., Balsamo, G., Bauer, d. P., Bechtold, P., Beljaars, A., van de Berg, L., Bidlot, J., Bormann, N., Delsol, C., Dragani, R., Fuentes, M., Geer, A., Haimberger, L., Healy, S., Hersbach, H., Hólm, E., Isaksen, L., Kållberg, P., Köhler, M., Matricardi, M., McNally, A., Monge-Sanz, B., Morcrette, J.-J., Park, B.-K., Peubey, C., de Rosnay, P., Tavolato, C., Thépaut, J.-N., and Vitart, F.: The ERA-Interim reanalysis: Configuration and performance of the data assimilation system, Q. J. Roy. Meteorol. Soc., 137, 553–597, 2011. a
Déqué, M., Rowell, D. P., Lüthi, D., Giorgi, F., Christensen, J., Rockel, B., Jacob, D., Kjellström, E., De Castro, M., and van den Hurk, B.: An intercomparison of regional climate simulations for Europe: assessing uncertainties in model projections, Climatic Change, 81, 53–70, 2007. a
Earth Surface Hydrology Group: UU-Hydro/PCR-GLOBWB_model, GitHub [code], https://github.com/UU-Hydro/PCR-GLOBWB_model (last access: 29 April 2024), 2024. a
Ehret, U., Zehe, E., Wulfmeyer, V., Warrach-Sagi, K., and Liebert, J.: HESS Opinions “Should we apply bias correction to global and regional climate model data?”, Hydrol. Earth Syst. Sci., 16, 3391–3404, https://doi.org/10.5194/hess-16-3391-2012, 2012. a
Fang, G. H., Yang, J., Chen, Y. N., and Zammit, C.: Comparing bias correction methods in downscaling meteorological variables for a hydrologic impact study in an arid area in China, Hydrol. Earth Syst. Sci., 19, 2547–2559, https://doi.org/10.5194/hess-19-2547-2015, 2015. a
Funk, C., Peterson, P., Landsfeld, M., Pedreros, D., Verdin, J., Shukla, S., Husak, G., Rowland, J., Harrison, L., Hoell, A., and Michaelsen, J.: The climate hazards infrared precipitation with stations – a new environmental record for monitoring extremes, Sci. Data, 2, 150066, https://doi.org/10.1038/sdata.2015.66, 2015. a, b
Gupta, H. V., Kling, H., Yilmaz, K. K., and Martinez, G. F.: Decomposition of the mean squared error and NSE performance criteria: Implications for improving hydrological modelling, J. Hydrol., 377, 80–91, 2009. a
Gustard, A. and Demuth, S.: Manual on low-flow estimation and prediction. Operational hydrology report, No. 50 WMO-No. 1029, World Meteorological Organization, Geneva, Switzerland, 136 pp., https://library.wmo.int/viewer/32176/?offset=#page=1&viewer=picture&o=bookmarks&n=0&q= (last access: 29 April 2024), 2009. a, b
Haarsma, R., Acosta, M., Bakhshi, R., Bretonnière, P.-A., Caron, L.-P., Castrillo, M., Corti, S., Davini, P., Exarchou, E., Fabiano, F., Fladrich, U., Fuentes Franco, R., García-Serrano, J., von Hardenberg, J., Koenigk, T., Levine, X., Meccia, V. L., van Noije, T., van den Oord, G., Palmeiro, F. M., Rodrigo, M., Ruprich-Robert, Y., Le Sager, P., Tourigny, E., Wang, S., van Weele, M., and Wyser, K.: HighResMIP versions of EC-Earth: EC-Earth3P and EC-Earth3P-HR – description, model computational performance and basic validation, Geosci. Model Dev., 13, 3507–3527, https://doi.org/10.5194/gmd-13-3507-2020, 2020. a
Haarsma, R. J., Roberts, M. J., Vidale, P. L., Senior, C. A., Bellucci, A., Bao, Q., Chang, P., Corti, S., Fučkar, N. S., Guemas, V., von Hardenberg, J., Hazeleger, W., Kodama, C., Koenigk, T., Leung, L. R., Lu, J., Luo, J. J., Mao, J., Mizielinski, M. S., Mizuta, R., Nobre, P., Satoh, M., Scoccimarro, E., Semmler, T., Small, J., and von Storch, J. S.: High Resolution Model Intercomparison Project (HighResMIP v1.0) for CMIP6, Geosci. Model Dev., 9, 4185–4208, https://doi.org/10.5194/gmd-9-4185-2016, 2016. a, b, c
Hamada, J.-I., D Yamanaka, M., Matsumoto, J., Fukao, S., Winarso, P. A., and Sribimawati, T.: Spatial and temporal variations of the rainy season over Indonesia and their link to ENSO, J. Meteorol. Soc. Jpn. Ser. II, 80, 285–310, https://doi.org/10.2151/jmsj.80.285, 2002. a
Hamon, W. R.: Estimating potential evapotranspiration, J. Hydraul. Div., 87, 107–120, 1961. a, b
Hariadi, M., van der Schrier, G., Steeneveld, G.-J., Ratri, D., Sopaheluwakan, A., Tank, A., Aldrian, E., Gunawan, D., Moine, M.-P., Bellucci, A., Senan, R., Tourigny, E., Putrasahan, D., and Linarko, A.: Evaluation of extrem precipitation over Southeast Asia in the CMIP5 regional climate model results and HighResMIP global climate models, Int. J. Climatol., 43, 1639–1659, https://doi.org/10.1002/joc.7938, 2022. a, b, c, d, e, f, g
Hariadi, M. H.: Projected drought severity changes in Southeast Asia under medium and extreme climate change, MS thesis, Wageningen University and Research, https://edepot.wur.nl/420042 (last access:29 April 2024), 2017. a
Hariadi, M. H., van der Schrier, G., Steeneveld, G. J., Sopaheluwakan, A., Klein Tank, A. M. G., Roberts, M. J., Moine, M. P., Bellucci, A., Senan, R., Tourigny, E., and Putrasahan, D.: Evaluation of onset, cessation and seasonal precipitation of the Southeast Asia rainy season in CMIP5 regional climate models and HighResMIP global climate models, Int. J. Climatol., 42, 3007–3024, https://doi.org/10.1002/joc.7404, 2021. a, b, c, d, e, f
Harris, I., Jones, P. D., Osborn, T. J., and Lister, D. H.: Updated high-resolution grids of monthly climatic observations – the CRU TS3.10 Dataset, Int. J. Climatol., 34, 623–642, 2014. a
Hijioka, Y., Lin, E., Pereira, J. J., Corlett, R. T., Cui, X., Insarov, G. E., Lasco, R. D., Lindgren, E., and Surjan, A.: Asia, in: Climate Change 2014: Impacts, Adaptation, and Vulnerability, Part B: Regional Aspects, Contribution of Working Group II to the Fifth Assessment Report of the Intergovernmental Panel on Climate Change, edited by: Barros, V. R., Field, C. B., Dokken, D. J., Mastrandrea, M. D., Mach, K. J., Bilir, T. E., Chatterjee, M., Ebi, K. L., Estrada, Y. O., Genova, R. C., Girma, B., Kissel, E. S., Levy, A. N., MacCracken, S., Mastrandrea, P. R., and White, L. L., Cambridge University Press, Cambridge, UK and New York, NY, USA, 1327–1370, ISBN 978-1-107-05816-3 (Hardback), ISBN 978-1-107-68386-0 (Paperback), 2014. a
Hisdal, H., Tallaksen, L. M., Clausen, B., Peters, E., and Gustard, A.: A. Hydrological Drought Characteristics, in: Hydrological Drought, Processes and Estimation Methods for Streamflow and Groundwater, vol. Development in Water Science 48, Tallaksen, L. M. and Van Lanen, H. A. J., Elsevier Science B.V., https://doi.org/10.1016/B978-0-12-819082-1.00006-0, 2004. a
Hoang, L. P., Lauri, H., Kummu, M., Koponen, J., van Vliet, M. T. H., Supit, I., Leemans, R., Kabat, P., and Ludwig, F.: Mekong River flow and hydrological extremes under climate change, Hydrol. Earth Syst. Sci., 20, 3027–3041, https://doi.org/10.5194/hess-20-3027-2016, 2016. a
Horton, A. J., Triet, N. V. K., Hoang, L. P., Heng, S., Hok, P., Chung, S., Koponen, J., and Kummu, M.: The Cambodian Mekong floodplain under future development plans and climate change, Nat. Hazards Earth Syst. Sci., 22, 967–983, https://doi.org/10.5194/nhess-22-967-2022, 2022. a
IPCC: Climate Change 2021: the Physical Science Basis, in: Contribution of Working Group I to the Sixth Assessment Report of the Intergovernmental Panel on Climate Change, edited by: Masson-Delmotte, V., Zhai, P., Pirani, A., Connors, S. L., Péan, C., Berger, S., Caud, N., Chen, Y., Goldfarb, L., Gomis, M. I., Huang, M., Leitzell, K., Lonnoy, E., Matthews, J. B. R., Maycock, T. K., Waterfield, T., Yelekçi, O., Yu, R., and Zhou, B., Cambridge University Press, https://doi.org/10.1017/9781009157896, 2021. a, b
Jasparro, C. and Taylor, J.: Climate change and regional vulnerability to transnational security threats in Southeast Asia, Geopolitics, 13, 232–256, 2008. a
Klein Tank, A. M. G., Zwiers, F. W., and Zhang, X.: Guidelines on analysis of extremes in a changing climate in support of informed decisions for adaptation, wCDMP-No. 72, WMO-TD No. 1500:56, World Meteorological Organization, http://202.90.199.118/ID/documents/WCDMP_72_TD_1500_en_1.pdf (last access: 29 April 2024), 2009. a, b
Knox, J., Hess, T., Daccache, A., and Wheeler, T.: Climate change impacts on crop productivity in Africa and South Asia, Environ. Res. Lett., 7, 034032, https://doi.org/10.1088/1748-9326/7/3/034032, 2012. a
Lehner, F., Deser, C., Maher, N., Marotzke, J., Fischer, E. M., Brunner, L., Knutti, R., and Hawkins, E.: Partitioning climate projection uncertainty with multiple large ensembles and CMIP5/6, Earth Syst. Dynam., 11, 491–508, https://doi.org/10.5194/esd-11-491-2020, 2020. a
Li, Y., Yan, D., Peng, H., and Xiao, S.: Evaluation of precipitation in CMIP6 over the Yangtze River Basin, Atmos. Res., 253, 105406, https://doi.org/10.1016/j.atmosres.2020.105406, 2021. a
Li, Z., Yu, W., Li, T., Murty, V., and Tangang, F.: Bimodal character of cyclone climatology in the Bay of Bengal modulated by monsoon seasonal cycle, J. Climate, 26, 1033–1046, https://doi.org/10.1175/JCLI-D-11-00627.1, 2013. a
Limsakul, A., Limjirakan, S., and Sriburi, T.: Observed changes in daily rainfall extreme along Thailand's Coastal Zones, Appl. Environ. Res., 32, 49–68, 2010. a
Lin, H.-I., Yu, Y.-Y., Wen, F.-I., and Liu, P.-T.: Status of Food Security in East and Southeast Asia and Challenges of Climate Change, Climate, 10, 40, https://doi.org/10.3390/cli10030040, 2022. a
Lobligeois, F., Andréassian, V., Perrin, C., Tabary, P., and Loumagne, C.: When does higher spatial resolution rainfall information improve streamflow simulation? An evaluation using 3620 flood events, Hydrol. Earth Syst. Sci., 18, 575–594, https://doi.org/10.5194/hess-18-575-2014, 2014. a
Luu, L. N., Scussolini, P., Kew, S., Philip, S., Hariadi, M. H., Vautard, R., Mai, K. V., Vu, T. V., Truong, K. B., Otto, F., van der Schrier, G., van Aalst, M. K., and van Oldenborgh, G. J.: Attribution of typhoons-induced torrential precipitation in Central Vietnam, October 2020, Climatic Change, 169, 1–22, https://doi.org/10.1007/s10584-021-03261-3, 2021. a
Mair, A. and Fares, A.: Influence of groundwater pumping and rainfall spatio-temporal variation on streamflow, J. Hydrol., 393, 287–308, https://doi.org/10.1016/j.jhydrol.2010.08.026, 2010. a
Mehran, A., AghaKouchak, A., and Phillips, T. J.: Evaluation of CMIP5 continental precipitation simulations relative to satellite-based gauge-adjusted observations, J. Geophys. Res.-Atmos., 119, 1695–1707, 2014. a
Meng, Y., Liu, J., Leduc, S., Mesfun, S., Kraxner, F., Mao, G., Qi, W., and Wang, Z.: Hydropower production benefits more from 1.5 °C than 2 °C climate scenario, Water Resour. Res., 56, e2019WR025519, https://doi.org/10.1029/2019WR025519, 2020. a
Moron, V., Robertson, A. W., and Boer, R.: Spatial coherence and seasonal predictability of monsoon onset over Indonesia, J. Climate, 22, 840–850, https://doi.org/10.1175/2008JCLI2435.1, 2009. a
Müller, W. A., Jungclaus, J. H., Mauritsen, T., Baehr, J., Bittner, M., Budich, R., Bunzel, F., Esch, M., Ghosh, R., Haak, H., Ilmmarlyyina, T., Kleine, T., Kornblueh, L., Li, H., Modali, K., Notz, D., Pohlmann, H., Roeckner, E., Stemmler, I., Tian, F., and Marotzke, J.: A Higher-resolution Version of the Max Planck Institute Earth System Model (MPI-ESM1.2-HR), J. Adv. Model. Earth Syt., 10, 1383–1413, 2018. a
Ngai, S. T., Tangang, F., and Juneng, L.: Bias correction of global and regional simulated daily precipitation and surface mean temperature over Southeast Asia using quantile mapping method, Global Planet. Change, 149, 79–90, 2017. a, b
Ngai, S. T., Juneng, L., Tangang, F., Chung, J. X., Salimun, E., Tan, M. L., and Amalia, S.: Future projections of Malaysia daily precipitation characteristics using bias correction technique, Atmos. Res., 240, 104926, https://doi.org/10.1016/j.atmosres.2020.104926, 2020a. a, b
Ngai, S. T., Sasaki, H., Murata, A., Nosaka, M., Chung, J. X., Juneng, L., Salimun, E., and Tangang, F.: Extreme rainfall projections for Malaysia at the end of 21st century using the high resolution non-hydrostatic regional climate model (NHRCM), SOLA, 16, 132–139, https://doi.org/10.2151/sola.2020-023, 2020b. a, b
Ngai, S. T., Juneng, L., Tangang, F., Chung, J. X., Supari, S., Salimun, E., Cruz, F., Ngo-Duc, T., Phan-Van, T., Santisirisomboon, J., and Gunawan, D.: Projected mean and extreme precipitation based on bias-corrected simulation outputs of CORDEX Southeast Asia, Weather Clim. Extrem., 37, 100484, https://doi.org/10.1016/j.wace.2022.100484, 2022. a, b, c
Nguyen-Ngoc-Bich, P., Phan-Van, T., Ngo-Duc, T., Vu-Minh, T., Trinh-Tuan, L., Tangang, F. T., Juneng, L., Cruz, F., Santisirisomboon, J., Narisma, G., and Aldrian, E.: Projected evolution of drought characteristics in Vietnam based on CORDEX-SEA downscaled CMIP5 data, Int. J. Climatol., 41, 5733–5751, 2021. a, b
Nguyen-Thi, H. A., Matsumoto, J., Ngo-Duc, T., and Endo, N.: A climatological study of tropical cyclone rainfall in Vietnam, SOLA, 8, 41–44, 2012. a
Piani, C., Weedon, G., Best, M., Gomes, S., Viterbo, P., Hagemann, S., and Haerter, J.: Statistical bias correction of global simulated daily precipitation and temperature for the application of hydrological models, J. Hydrol., 395, 199–215, 2010. a
PRIMAVERA: The User Interface Platform, https://www.primavera-h2020.eu/ (last access: 29 April 2024), 2024. a
Ratri, D. N., Whan, K., and Schmeits, M.: A comparative verification of raw and bias-corrected ECMWF seasonal ensemble precipitation reforecasts in Java (Indonesia), J. Appl. Meteorol. Clim., 58, 1709–1723, 2019. a
Redfern, S. K., Azzu, N., and Binamira, J. S.: Rice in Southeast Asia: facing risks and vulnerabilities to respond to climate change, Build Resil. Adapt. Clim. Change Agr. Sect., 23, 1–14, 2012. a
Renard, B. and Thyer, M.: Revealing hidden climate indices from the occurrence of hydrologic extremes, Water Resour. Res., 55, 7662–7681, 2019. a, b
Roberts, M. J., Baker, A., Blockley, E. W., Calvert, D., Coward, A., Hewitt, H. T., Jackson, L. C., Kuhlbrodt, T., Mathiot, P., Roberts, C. D., Schiemann, R., Seddon, J., Vannière, B., and Vidale, P. L.: Description of the resolution hierarchy of the global coupled HadGEM3-GC3.1 model as used in CMIP6 HighResMIP experiments, Geosci. Model Dev., 12, 4999–5028, d https://doi.org/10.5194/gmd-12-4999-2019, 2019. a
Roberts, M. J., Camp, J., Seddon, J., Vidale, P. L., Hodges, K., Vannière, B., Mecking, J., Haarsma, R., Bellucci, A., Scoccimarro, E., Caron, L. P., Chauvin, F., Terray, L., Valcke, S., Moine, M. P., Putrasahan, D., Roberts, C. D., Senan, R ana Zarzycki, C., Ullrich, P., Yamada, Y., Mizuta, R., Kodama, C., Fu, D., Zhang, Q., Danabasoglu, G., Rosenbloom, N., Wang, H., and Wu, L.: Projected future changes in tropical cyclones using the CMIP6 HighResMIP multimodel ensemble, Geophys. Res. Lett., 47, e2020GL088662, https://doi.org/10.1029/2020GL088662, 2020. a
Ruijsch, J., Verstegen, J. A., Sutanudjaja, E. H., and Karssenberg, D.: Systemic change in the Rhine-Meuse basin: Quantifying and explaining parameters trends in the PCR-GLOBWB global hydrological model, Adv. Water Resour., 155, 104013, https://doi.org/10.1016/j.advwatres.2021.104013, 2021. a
Schulzweida, U. and Quast, R.: Climate indices with CDO, http://earth.bsc.es/gitlab/ces/cdo/raw/b4f0edf2d5c87630ed4c5ddee5a4992e3e08b06a/doc/cdo_eca.pdf (last access: 30 April 2024), 2015. a, b
Schulzweida, U., Kornblueh, L., and Quast, R.: CDO user's guide, Climate Data Operators, Version 1, 205–209, https://users.rcc.uchicago.edu/~davidkelly999/cdo.pdf (last access: 30 April 2024), 2006. a
Sen, P. K.: Estimates of the regression coefficient based on Kendall's tau, J. Am. Stat. Assoc., 63, 1379–1389, 1968. a
Singh, V. and Xiaosheng, Q.: Data assimilation for constructing long-term gridded daily rainfall time series over Southeast Asia, Clim. Dynam., 53, 3289–3313, 2019. a, b
Siswanto, S., van Oldenborgh, G. J., van der Schrier, G., Jilderda, R., and van den Hurk, B.: Temperature, extreme precipitation, and diurnal rainfall changes in the urbanized Jakarta city during the past 130 years, Int. J. Climatol., 36, 3207–3225, https://doi.org/10.1002/joc.4548, 2016. a, b
Smit, B. and Wandel, J.: Adaptation, adaptive capacity and vulnerability, Global Environ. Change, 16, 282–292, https://doi.org/10.1016/j.gloenvcha.2006.03.008, 2006. a
Stahl, K., Kohn, I., Blauhut, V., Urquijo, J., De Stefano, L., Acacio, V., Dias, S., Stagge, J. H., Tallaksen, L. M., Kampragou, E., Van Loon, A. F., Barker, L. J., Melsen, L. A., Bifulco, C., Musolino, D., de Carli, A., Massarutto, A., Assimacopoulos, D., and Van Lanen, H. A. J.: Impacts of European drought events: insights from an international database of text-based reports, Nat. Hazards Earth Syst. Sci., 16, 801–819, https://doi.org/10.5194/nhess-16-801-2016, 2016. a
Suhaila, J., Deni, S. M., Wan Zin, W. Z., and Jemain, A. A.: Spatial patterns and trends of daily rainfall regime in Peninsular Malaysia during the southwest and northeast monsoons: 1975–2004, Meteorol. Atmos. Phys., 110, 1–18, 2010. a, b
Supari, F. T., Juneng, L., and Aldrian, E.: Observed changes in extreme temperature and precipitation over Indonesia, Int. J. Climatol., 37, 1979–1997, 2017. a, b
Supari, F. T., Juneng, L., Faye, C., Jing Xiang, C., Sheau Tieh, N., Ester, S., Mohd, S. F. M., Jerasorn, S., Patama, S., Tan, P., Ngo-Duc, T., Gemma, N., Edvin, A., Dodo, G., and Ardhasena, S.: Multi-model projections of precipitation extremes in Southeast Asia based on CORDEX-Southeast Asia simulations, Environ. Rese., 184, 109350, https://doi.org/10.1016/j.envres.2020.109350, 2020. a, b
Sutanto, S. J. and Van Lanen, H. A. J.: Streamflow drought: implication of drought definitions and its application for drought forecasting, Hydrol. Earth Syst. Sci., 25, 3991–4023, https://doi.org/10.5194/hess-25-3991-2021, 2021. a, b
Sutanto, S. J. and Van Lanen, H. A. J.: Catchment memory explains hydrological drought forecast performance, Sci. Rep., 12, 2689, https://doi.org/10.1038/s41598-022-06553-5, 2022. a
Sutanudjaja, E. H., van Beek, R., Wanders, N., Wada, Y., Bosmans, J. H. C., Drost, N., van der Ent, R. J., de Graaf, I. E. M., Hoch, J. M., de Jong, K., Karssenberg, D., López López, P., Peßenteiner, S., Schmitz, O., Straatsma, M. W., Vannametee, E., Wisser, D., and Bierkens, M. F. P.: PCR-GLOBWB 2: a 5 arcmin global hydrological and water resources model, Geosci. Model Dev., 11, 2429–2453, https://doi.org/10.5194/gmd-11-2429-2018, 2018. a, b, c, d, e, f
Tallaksen, L. M., Madsen, H., and Clausen, B.: On the definition and modeling of streamflow drought duration and deficit volume, Hydrolog. Sci. J., 42, 15–33, https://doi.org/10.1080/02626669709492003, 1997. a
Tan, M. L., Juneng, L., Tangang, F. T., Chan, N. W., and Ngai, S. T.: Future hydro-meteorological drought of the Johor river basin, Malaysia, based on CORDEX-SEA projections, Hydrolog. Sci. J., 64, 921–933, 2019. a, b
Tan, M. L., Juneng, L., Tangang, F. T., Samat, N., Chan, N. W., Yusop, Z., and Ngai, S. T.: SouthEast Asia HydrO-meteorological droughT (SEA-HOT) framework: A case study in the Kelantan river basin, Malaysia, Atmos. Res., 246, 105155, https://doi.org/10.1016/j.atmosres.2020.105155, 2020. a, b
Tangang, F., Supari, S., Chung, J. X., Cruz, F., Salimun, E., Ngai, S. T., Juneng, L., Santisirisomboon, J., Santisirisomboon, J., Ngo-Duc, T., Phan-Van, T., Narisma, G., Singhruck, P., Gunawan, D., Aldrian, E., Sopaheluwakan, A., Nikulin, G., Yang, H., Remedio, A. R. C., Sein, D., and Hein-Griggs, D.: Future changes in annual precipitation extremes over Southeast Asia under global warming of 2 °C, APN Sci. Bull., 8, 3–8, https://doi.org/10.30852/sb.2018.436, 2018. a, b, c
Tangang, F., Santisirisomboon, J., Juneng, L., Salimun, E., Chung, J., Supari, S., Cruz, F., Ngai, S. T., Ngo-Duc, T., Singhruck, P., Narisma, G., Santisirisomboon, J., Wongsaree, W., Promjirapawat, K., Sukamongkol, Y., Srisawadwong, R., Setsirichok, D., Phan-Van, T., Aldrian, E., Gunawan, D., Nikulin, G., and Yang, H.: Projected future changes in mean precipitation over Thailand based on multi-model regional climate simulations of CORDEX Southeast Asia, Int. J. Climatol., 39, 5413–5436, 2019. a, b
Tangang, F., Chung, J. X., Juneng, L., Supari, Salimun, E., Ngai, S. T., Jamaluddin, A. F., Mohd, M. F. S., Cruz, F., Narisma, G., Santisirisomboon, J., Ngo-Duc, T., Tan, P. V., Singhruck, P., Gunawan, D., Aldrian, E., Sopaheluwakan, A., Grigory, N., Remedio, A. R. C., Sein, D. V., Hein-Griggs, D., McGregor, J. L., Yang, H., Sasaki, H., and Kumar, P.: Projected future changes in rainfall in Southeast Asia based on CORDEX–SEA multi-model simulations, Clim. Dynam., 55, 1247–1267, https://doi.org/10.1007/s00382-020-05322-2, 2020. a, b
Taufik, M., Torfs, P. J., Uijlenhoet, R., Jones, P. D., Murdiyarso, D., and Van Lanen, H. A.: Amplification of wildfire area burnt by hydrological drought in the humid tropics, Nat. Clim. Change, 7, 428–431, 2017. a
Taylor, K. E., Stouffer, R. J., and Meehl, G. A.: An overview of CMIP5 and the experiment design, B. Am. Meteorol. Soc., 93, 485–498, 2012. a
Tian-Jun, Z., Li-Wei, Z., and Xiao-Long, C.: Commentary on the coupled model intercomparison project phase 6 (CMIP6), Adv. Clim. Change Res., 15, 445–456, https://doi.org/10.12006/j.issn.1673-1719.2019.193, 2019. a
Trinh-Tuan, L., Matsumoto, J., Tangang, F. T., Juneng, L., Cruz, F., Narisma, G., Santisirisomboon, J., Phan-Van, T., Gunawan, D., Aldrian, E., and Ngo-Duc, T.: Application of quantile mapping bias correction for mid-future precipitation projections over Vietnam, SOLA, 15, 1–6, https://doi.org/10.2151/sola.2019-001, 2019. a
Uppala, S. M., Kållberg, P., Simmons, A. J., Andrae, U., Bechtold, V. D. C., Fiorino, M., Gibson, J., Haseler, J., Hernandez, A., Kelly, G., Li, X., Onogi, K., Saarinen, S., Sokka, N., Allan, R., Andersson, E., Arpe, K., Balmaseda, M., Beljaars, A., Van De Berg, L., Bidlot, J., Bormann, N., Caires, S., Chevallier, F., Dethof, A., Dragosavac, M., Fisher, M., Fuentes, M., Hagemann, S., Hólm, E., Hoskins, B., Isaksen, L., Janssen, P., Jenne, R., Mcnally, A., Mahfouf, J.-F., Morcrette, J.-J., Rayner, N., Raunders, R., Simon, P., Sterl, A., Trenberth, K., Untch, A., Vasiljevic, D., Viterbo, P., and Woollen, J.: The ERA-40 re-analysis, Q. J. Roy. Meteorol. Soc., 131, 2961–3012, 2005. a
Van Beek, L. and Bierkens, M.: The global hydrological model PCR-GLOBWB: conceptualization, parameterization and verification, Utrecht University, Utrecht, the Netherlands, 25–26, https://vanbeek.geo.uu.nl/suppinfo/vanbeekbierkens2009.pdf (last access: 30 April 2024), 2009. a
Van Beek, L., Wada, Y., and Bierkens, M. F.: Global monthly water stress: 1. Water balance and water availability, Water Resour. Res., 47, W07517, the https://doi.org/10.1029/2010WR009791, 2011. a, b
van Beek, L. P., Eikelboom, T., van Vliet, M. T., and Bierkens, M. F.: A physically based model of global freshwater surface temperature, Water Resour. Res., 48, W09530, https://doi.org/10.1029/2012WR011819, 2012. a, b
Van den Besselaar, E. J., van der Schrier, G., Cornes, R. C., Iqbal, A. S., and Klein Tank, A. M.: SA-OBS: a daily gridded surface temperature and precipitation dataset for Southeast Asia, J. Climate, 30, 5151–5165, https://doi.org/10.1175/JCLI-D-16-0575.1, 2017. a, b, c
Van der Wiel, K., Wanders, N., Selten, F., and Bierkens, M.: Added value of large ensemble simulations for assessing extreme river discharge in a 2 °C warmer world, Geophys. Res. Lett., 46, 2093–2102, 2019. a, b, c
Van Lanen, H. A. J., Wanders, N., Tallaksen, L. M., and Van Loon, A. F.: Hydrological drought across the world: impact of climate and physical catchment structure, Hydrol. Earth Syst. Sci., 17, 1715–1732, https://doi.org/10.5194/hess-17-1715-2013, 2013. a
Van Loon, A. F. and Laaha, G.: Hydrological drought severity explained by climate and catchment characteristics, J. Hydrol., 526, 3–14, https://doi.org/10.1016/j.jhydrol.2014.10.059, 2015. a
van Vliet, M. T., Franssen, W. H., Yearsley, J. R., Ludwig, F., Haddeland, I., Lettenmaier, D. P., and Kabat, P.: Global river discharge and water temperature under climate change, Global Environ. Change, 23, 459–464, https://doi.org/10.1016/j.gloenvcha.2012.11.002, 2013a. a
Van Vliet, M. T., Ludwig, F., and Kabat, P.: Global streamflow and thermal habitats of freshwater fishes under climate change, Climatic Change, 121, 739–754, 2013b. a, b
Voldoire, A., Saint-Martin, D., Sénési, S., Decharme, B., Alias, A., Chevallier, M., Colin, J., Guérémy, J.-F., Michou, M., Moine, M.-P., Nabat, P., Roehrig, R., Mélia, D .S., Séférian, R., Valcke, S., Beau, I., Belamari, S., Berthet, S., Cassou, C., Cattiaux, J., Deshayes, J., Douville, H., Ethé, C., Franchistéguy, L., Geoffroy, O., Lévy, C., Madec, G., Meurdesoif, Y., Msadek, R., Ribes, A., Sanchez-Gomez E., Terray, L., and Waldman, R.: Evaluation of CMIP6 DECK experiments with CNRM-CM6-1, J. Adv. Model. Earth Syt., 11, 2177–2213, https://doi.org/10.1029/2019MS001683, 2019. a
Wong, W. K., Beldring, S., Engen-Skaugen, T., Haddeland, I., and Hisdal, H.: Climate Change Effects on Spatiotemporal Patterns of Hydroclimatological Summer Droughts in Norway, J. Hydrometeorol., 12, 1205–1220, https://doi.org/10.1175/2011JHM1357.1, 2011. a
Yatagai, A., Kamiguchi, K., Arakawa, O., Hamada, A., Yasutomi, N., and Kitoh, A.: APHRODITE: constructing a long-term daily gridded precipitation dataset for Asia based on a dense network of rain gauges, B. Am. Meteorol. Soc, 93, 1401–1415, https://doi.org/10.1175/BAMS-D-11-00122.1, 2012. a, b
Yevjevich, V.: An objective approach to definition and investigations of continental hydrologic droughts, Hydrology Papers 23, https://api.mountainscholar.org/server/api/core/bitstreams/5f26da05-d712-49bc-acc0-397ec0f70fef/content (last access: 30 April 2024), 1967. a
Yusuf, A. A. and Francisco, H.: Climate change vulnerability mapping for Southeast Asia, https://idl-bnc-idrc.dspacedirect.org/server/api/core/bitstreams/4863e9aa-1bef-47ae-86d4-82d81e2a3b6e/content (last access: 30 April 2024), 2009. a
Zhu, Y.-Y. and Yang, S.: Evaluation of CMIP6 for historical temperature and precipitation over the Tibetan Plateau and its comparison with CMIP5, Adv. Clim. Change Res., 11, 239–251, 2020. a