the Creative Commons Attribution 4.0 License.
the Creative Commons Attribution 4.0 License.
 | 19 Jan 2023
Estimating karst groundwater recharge from soil moisture observations – a new method tested at the Swabian Alb, southwest Germany
Romane Berthelin
Tunde Olarinoye
Michael Rinderer
Matías Mudarra
Dominic Demand
Mirjam Scheller
Andreas Hartmann
Understanding groundwater recharge processes is important for sustainable water resource management. Experimental approaches to study recharge in karst areas often focus on analysing the aquifer response using a disintegration of its outlet signals, but only a few approaches directly investigate the recharge processes that occur at the surface of the system. Soil moisture measurements have a high potential to investigate water infiltration to deeper soil depth or epikarst with an easy and not too intrusive installation. They can yield long-term measurements with high temporal resolution. Using these advantages, we developed and tested a method to estimate recharge based on soil moisture measurements. The method consists of the extraction of linked events in rainfall, soil moisture, and discharge time series, as well as a subsequent fitting of the parameters of a simple drainage model to calculate karst recharge from soil moisture metrics of individual events. The fitted parameters could be interpreted in physically meaningful terms and were related to the properties of the karstic system. The model was tested and validated in a karst catchment located in southwest Germany with hourly precipitation, soil moisture, and discharge data of 8 years duration. The soil moisture measurements were distributed among grassland (n = 8) and woodland areas (n = 7) at 20 cm depth. A threshold of about 35 % (± 8 %) of volumetric water content was necessary to initiate effective infiltration. Soil moisture averaged during the wetting period of each event was the best metric for the prediction of recharge. The model performed reasonably well, estimating recharge during single rainfall events. It was also capable of simulating 88 % of the average annual recharge volume despite considerable differences in the performance between years. The event-based approach is potentially applicable to other karstic systems where soil moisture and precipitation measurements are available to predict karst groundwater recharge.
- Article
(3708 KB) - Full-text XML
- BibTeX
- EndNote


Karst aquifers provide a significant portion of the resources used for drinking-water supply in many regions of the world. In regions where alternative sources of drinking water exist, karst water resources are often avoided due to unstable discharge regimes and high vulnerability to pollution (Stevanović, 2019). In other regions where no alternatives exist, pressures on karst groundwater resources increase, and this raises the need for improving protective measures and water management to avoid the depletion of carbonate aquifers (Xu et al., 2018), especially under the climate change context. Groundwater recharge process understanding is therefore important for sustainable water resource management and governance. Experimental methods to evaluate recharge in karst areas often focus on analysing the aquifer response using a disintegration of its outlet signals measured at the karstic spring (Goldscheider and Drew, 2007). Discharge and physicochemical measurements, as well as natural or artificial tracers, can provide a lot of information concerning the hydrological functioning of the system and consequently concerning its recharge processes. For example, spring hydrographs and hydrochemical signal monitoring provide information about the subsurface structure and dynamics of karst aquifers (Jeannin et al., 2007; Mudarra and Andreo, 2011; Perrin et al., 2003). Natural tracers such as water isotopes can be used to understand the transit times and dispersion of water entering the entire catchment (Aquilina et al., 2005; Maloszewski et al., 2002) and to help with estimating mean recharge altitude of each sub-catchment (Sappa et al., 2018). In addition, dye tracer tests are a powerful tool to investigate flow paths and times through karst systems (Goldscheider et al., 2008; Mudarra et al., 2014). Furthermore, modelling applied to predict recharge is usually also evaluated with observations at the system outlet (Chen et al., 2017; Mudarra et al., 2019; Ollivier et al., 2020). In other cases, geographic information system (GIS)-based methods that use spatial information about geology, soil types, vegetation, mean annual precipitation, etc., are often used to derive time-averaged spatial distributions of karst recharge (Andreo et al., 2008; Radulovic et al., 2011; Allocca et al., 2014). Other experimental methods conducted at the surface of karst systems, such as geophysical approaches, allow for the investigation of the soil and rock hydraulic properties with influence on recharge mechanisms. For example, different geophysics methods were used to highlight the role of the porous rock matrix that can act as a seasonally varying storage in the unsaturated zone (Carrière et al., 2016). However, most of these methods are time-consuming and/or expensive to apply.
Despite the important role of the surface heterogeneity and its processes on recharge (Williams, 2008), this heterogeneity makes it difficult to assess and predict groundwater recharge from the earth's surface. Although progress in the understanding of subsurface heterogeneity in karst media has been made in the last years, few studies have yet applied experimental approaches to characterize karst recharge mechanisms with observations collected directly at the shallow subsurface. This includes the soil and the epikarst, which is the superficial weathered rock. Tobin et al. (2021) developed a conceptual model of the hydrological processes occurring at two different epikarst zones based on the study of its hydraulic and hydrochemical responses to different storm events. Precipitation amount, intensity, and seasonality were the main factors impacting the outflow response for both independent sites in this study. However, they also mention that soil and vegetation have an important influence on recharge mechanisms and advise further investigation of subsurface processes to understand their effect on the aquifer as a whole.
Various subsurface flow pathways and subsequent groundwater recharge were found to be depending on changes in shallow soil moisture conditions (Perrin et al., 2003). Using lysimeters to analyse the hydrochemical signal of water from the soil, an influence of preferential flow pathways in soil on karst recharge processes was confirmed (Tooth and Fairchild, 2003). Ries et al. (2015) measured shallow soil moisture at a Mediterranean karst site and used these data in a model to simulate percolation towards the saturated zone. They concluded that simulated fluxes from a plot-scale measurement are not directly transferable to a larger scale, but they may help to understand processes influencing temporal and spatial groundwater recharge such as the fast infiltration of water during heavy precipitation events. In other studies, soil moisture data and simulation tools were jointly applied in order to assess recharge in karst terrains (Sarrazin et al., 2018; Ireson and Butler, 2011), but similar to Ries et al. (2015), transferability of results to larger scales such as the entire karst system remained uncertain due to (1) a low number of locations where soil moisture was observed and (2) the lack of evaluation with independent recharge observations at the aquifer scale. Messerschmid et al. (2020) did manage to simulate recharge coefficient only based on limited locations of soil moisture observation in an ungauged Mediterranean karst basin. This was possible because of long-term observations and well-chosen representative locations for specific formations, allowing their transferability to comparable catchments.
In other non-karstic geological settings, soil moisture measurements conducted at a high temporal resolution have been used in a few studies to investigate infiltration-related processes (Demand et al., 2019; Martini et al., 2015). Schaffitel et al. (2021) developed a data-driven water-balancing framework to derive water fluxes from meteorological data and soil moisture measurements. One of the steps of this framework was the calculation of the soil water balance, which included the fitting of a drainage model that could be used to predict drainage from soil moisture measurements. The promising results of these studies allow for assuming that shallow soil moisture measurements might be informative for estimating subsurface flow and groundwater recharge in karst systems. In fact, as infiltration and recharge are less delayed in karst aquifers compared to other geological settings, one could assume to find an even stronger relation between soil moisture and karst spring discharge.
Therefore, in this study, we developed and tested a new methodology to estimate karst aquifer recharge from shallow soil moisture measurements. In particular, we (1) extracted and attributed precipitation events, soil moisture events, and recharge events to each other and (2) conducted statistical analyses to study the relationship between soil moisture and recharge, and we applied a drainage model to simulate recharge. The parameters of the empirical relations that we derived can be interpreted in physical meaningful terms and are useful to characterize karst system properties. As groundwater recharge mainly takes place during and shortly after rainfall events, we follow an event-based approach. For a proof of concept, we applied the method to a collection of soil moisture measurements and discharge over 8 years at the karstified region of the Swabian Alb in southwest Germany.
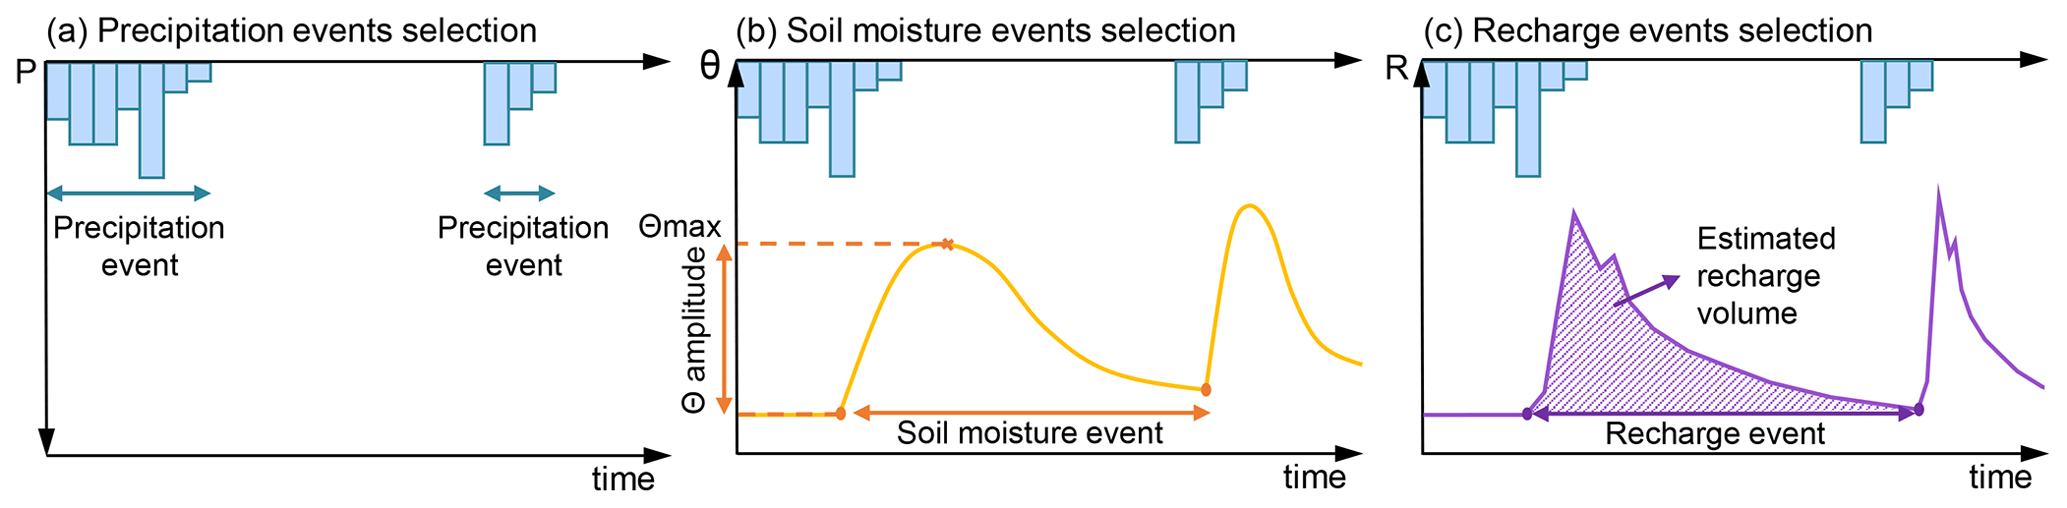
Figure 1Event selection method applied in this study exemplified for two precipitation (a), soil moisture (b) and recharge (c) events.
To investigate the link between soil moisture and groundwater recharge, an event-scale approach was applied. First, precipitation events, soil moisture events, and recharge events were identified and extracted subsequently from continuous time series of precipitation, soil moisture, and discharge. In a second step, the precipitation events were attributed to the corresponding soil moisture events and to the corresponding recharge events while accounting for temporal delays between the three time series with a simple temporal buffer determined by cross-correlation analysis. That way, our event-scale approach avoided the complexity of considering the timescales of water movement through the soil and groundwater aquifer; therefore, this allows us to focus on the volumetric relationships of rainfall, soil moisture, and recharge.
Combinations of precipitation events that produced one clearly identifiable and causally linked soil moisture event and one recharge event were selected for statistical analysis to study the relationship between different soil moisture and recharge metrics such as the average soil moisture during an event and the recharge volume. In addition, the parameters of a drainage model, based on the unit gradient approach (Yeh, 1989; Hillel, 1998), were fitted to the data to describe the relation between soil moisture and groundwater recharge. Finally, the drainage model was evaluated by calculating recharge volumes for all soil moisture events over the 8 years of the study period and by comparing them to recharge volumes inferred from discharge measurements. Our approach is exemplified with an experimental dataset collected at the Swabian Alb in southwest Germany.
2.1 Event selection
2.1.1 Precipitation, soil moisture, and recharge events selection
In a first step, precipitation, soil moisture, and recharge events were extracted based on different thresholds from the observed precipitation, soil moisture, and stream discharge time series independently. The event selection criteria were as follows: (1) Similar to Demand et al. (2019), a precipitation event was defined to have at least 1 mm of total rainfall. Rainfall events were separated if there was at least 24 h of no rainfall between the events (Fig. 1a). (2) The start of a soil moisture event was defined as an increase in volumetric water content of at least 1 %, which corresponds to the accuracy of the probes. The end of the event was set to the start of the following event (Fig. 1b). (3) We use discharge as a proxy for groundwater recharge at the event timescale (see elaboration below). The start of a recharge event was defined by the time when the 3 d running average of the observed slope of the discharge time series changed from negative to positive values. Similar to the selection of soil moisture events, the end of the recharge event was considered the start of the following recharge event (Fig. 1c).

Figure 2Event attribution method applied in this study for the attribution of precipitation events to soil moisture events (a), for the attribution of precipitation events to recharge events (b), and for the attribution of soil moisture events to recharge events (c). (P: precipitation, R: recharge, Θ: soil moisture).
From the selected rainfall events, different metrics were extracted: the total volume of rainfall, the duration of the event, and its mean intensity. From the selected soil moisture events, antecedent soil moisture (which is defined as the volumetric water content at the time of the start of the soil moisture response), soil moisture maximum, soil moisture response amplitude, and mean soil moisture during the event were extracted. In addition, the so-called “wetting period” was defined as the time between the start of the soil moisture response and the end of the precipitation event, which is the time during which one expects groundwater recharge. For this period, the mean soil moisture during the wetting period was extracted. From the selected recharge events, the volume of recharge and the recharge rate were derived. The volume of recharge during each event was estimated by assuming that the stream discharge of a karst spring is a good proxy for recharge. This is plausible as karst systems are highly responsive to precipitation. Due to preferential pathways, water transfer through the vadose zone is usually quick (Hartmann et al., 2021), and surface runoff is usually marginal (Hartmann et al., 2012; Worthington et al., 2016). In addition, an event-scale approach allows for the evaporation to be assumed low as the observation time is limited. For these reasons, it is assumed that all water that does not evaporate or remains in the soil will contribute to recharge. A simple approach based on available groundwater storage at the beginning and the end of each event was used to estimate the per-event discharge volume. Firstly, the recession events were extracted from the discharge time series using the extraction procedure of Vogel and Kroll (1996), after which the recession constant, k, was estimated using a linear storage-discharge function. Then, the total volume, VT, of water for each event cycle (from the first positive slope change to the next) was calculated using the integral area approach. The volume of groundwater, V0, stored at the beginning of the event was calculated by dividing the discharge, Q0, corresponding to the start of the event by the recession constant, k. If we assume that there is no recharge event, the theoretical decrease of Q0 until the end of the event cycle can be estimated by linear extrapolation. This way, the theoretical discharge, Qth, that would be reached at the end of the event cycle; the groundwater volume, Vi, that would be discharged; and the volume, Vth, that would be stored were all calculated. The change in groundwater storage was estimated by the difference between volume, V0, stored at the beginning of the event and the theoretical volume, Vth, stored at the end. The event recharge is then given by the difference between the total volume, VT; theoretical discharge volume, Vi; and change in groundwater storage. The total volume of recharge divided by the wetting period yielded the recharge produced during the event. The recharge rate corresponded to recharge volume divided by the precipitation volume.
2.1.2 Attribution of precipitation, soil moisture, and recharge events to each other
As rainfall, soil moisture, and discharge typically respond delayed relative to each other, a procedure to link them was necessary. Not all precipitation events initiate a soil moisture event or a recharge event. For that reason, we attributed a precipitation event to a soil moisture event when it occurred within the period between the start and the peak of a soil moisture event. To account for natural delays between precipitation and soil moisture, we allowed for an additional temporal buffer that was determined by the cross-correlation between the precipitation and the soil moisture time series (for details see Delbart et al., 2014). Basically, the response time estimated by the cross-correlation between precipitation and discharge is the average response time of the karst aquifer to a precipitation event (Mangin, 1984). We adapted this method to estimate our temporal buffer between precipitation, soil moisture, and discharge. If the precipitation event happened during the recession of the soil moisture event, it was counted as a precipitation event that did not produce a soil moisture response (Fig. 2a). The same approach was applied to link precipitation event with recharge events (Fig. 2b) and soil moisture events with recharge events (Fig. 2c). If a soil moisture or a recharge event was not linked to a precipitation event, it was excluded from the analysis based on the assumption that a soil moisture or recharge event cannot be produced without precipitation.
The number of events selected was counted for each soil profile, as well as for the entire catchment. One event was counted for the entire catchment as an event happening at least at one location.
2.2 Quantitative linkages between soil moisture characteristics and recharge
2.2.1 Correlation analysis between precipitation, soil moisture, and discharge
In order to find a link between soil moisture and recharge, the correlation between different soil moisture metrics and recharge volumes was calculated. As soil moisture metrics, we used the soil moisture value at the beginning of the event (antecedent soil moisture), the maximum value of soil moisture reached during the event (soil moisture peak), the median value of soil moisture during the event (soil moisture median), the soil moisture response amplitude (soil moisture amplitude), the averaged soil moisture during the event (soil moisture mean), and the average value of soil moisture during the wetting period (mean soil moisture during wet). We assume that these metrics capture important aspects of the soil hydrological dynamics. Only combinations of at least one rainfall event causing one soil moisture event and one discharge event were considered in the following statistical analysis and for the model calibration. This selection of single causal events allowed for a more reliable calibration by avoiding the potential interferences of multiple soil moisture events on recharge. The relation between these different soil moisture metrics and recharge volume, as well as the recharge rate, was explored. In order to detect non-linear relationships, a Spearman rank correlation was applied. The closer the Spearman's rank correlation coefficient (ρ) is to +1 or −1, the stronger the relation between the two tested variables is. Its significance is evaluated using the probability value (p value). In this study, we considered the results statistically significantly correlated if p value < 0.01.
2.2.2 Drainage model based on the unit gradient approach
In addition to the correlation analysis, we used a more physically oriented approach to describe the relation between soil moisture and recharge. We fitted the unit gradient model (Hillel, 1998) with its two parameters (B and ks) (Schaffitel et al., 2021). Vertical water flow, considered here as a proxy for groundwater recharge, is defined as
Here, ks [mm d−1] and B [–] are calibration parameters representing saturated hydraulic conductivity and the pore size distribution index, respectively. Θr [vol %] and Θs [vol %] correspond to the residual water content and the saturated water content. In this study, the soil moisture minimum and maximum measured during soil moisture time series were used, as in Schaffitel et al. (2021). The relationship is based on the Burdine–Brooks–Corey parametrization of hydraulic conductivity (Brooks and Corey, 1964). The soil water storage term in the water balance equation is substituted by a soil moisture term. By this, the vertical water flow (or groundwater recharge Q [mm d−1]) can be expressed as a function of soil moisture that is similar to soil water storage. When multiplied by the duration of the event, we can obtain the recharge volume [mm] for each individual event.
To calibrate the model, a Monte Carlo approach was applied. The ks parameter was sampled between 0 and 50 [mm d−1] with a step resolution of 0.1 [mm d−1]. These ranges correspond to the hydraulic conductivity for clayey and silt-sandy soils. The dimensionless parameter B, which represents the pore size distribution, was sampled between 0 and 5 with a step resolution of 0.05. The best model parameters were selected by minimizing the root-mean-square error (RMSE) of the model. Uncertainty in identifying the best parameters was accounted for by also selecting the 10 % best simulations (with the 10 % lowest RMSE).
For validation of the model, annual recharge was calculated using the best overall parameter set and compared with the observed annual recharge volume. To compute the annual recharge using the drainage model, all soil moisture events detected with the selection method were kept for each hydrological year (beginning of October to end of September). For each soil moisture event, the groundwater recharge Q [mm d−1] was computed using the mean soil moisture during the wetting period (O), which is the best soil metric identified during the correlation analysis described in the Sect. 2.2.1 (see results in Table 2). The result obtained for each event was then multiplied by the corresponding wetting period in order to get the recharge volume [mm] for each event. Finally, annual modelled recharge estimates were compared to the annual observations of recharge obtained as explained in Sect. 2.1.1. Acceptable agreement would indicate that the event-based method could be applied to longer time series of soil moisture measurements to predict karst groundwater recharge.
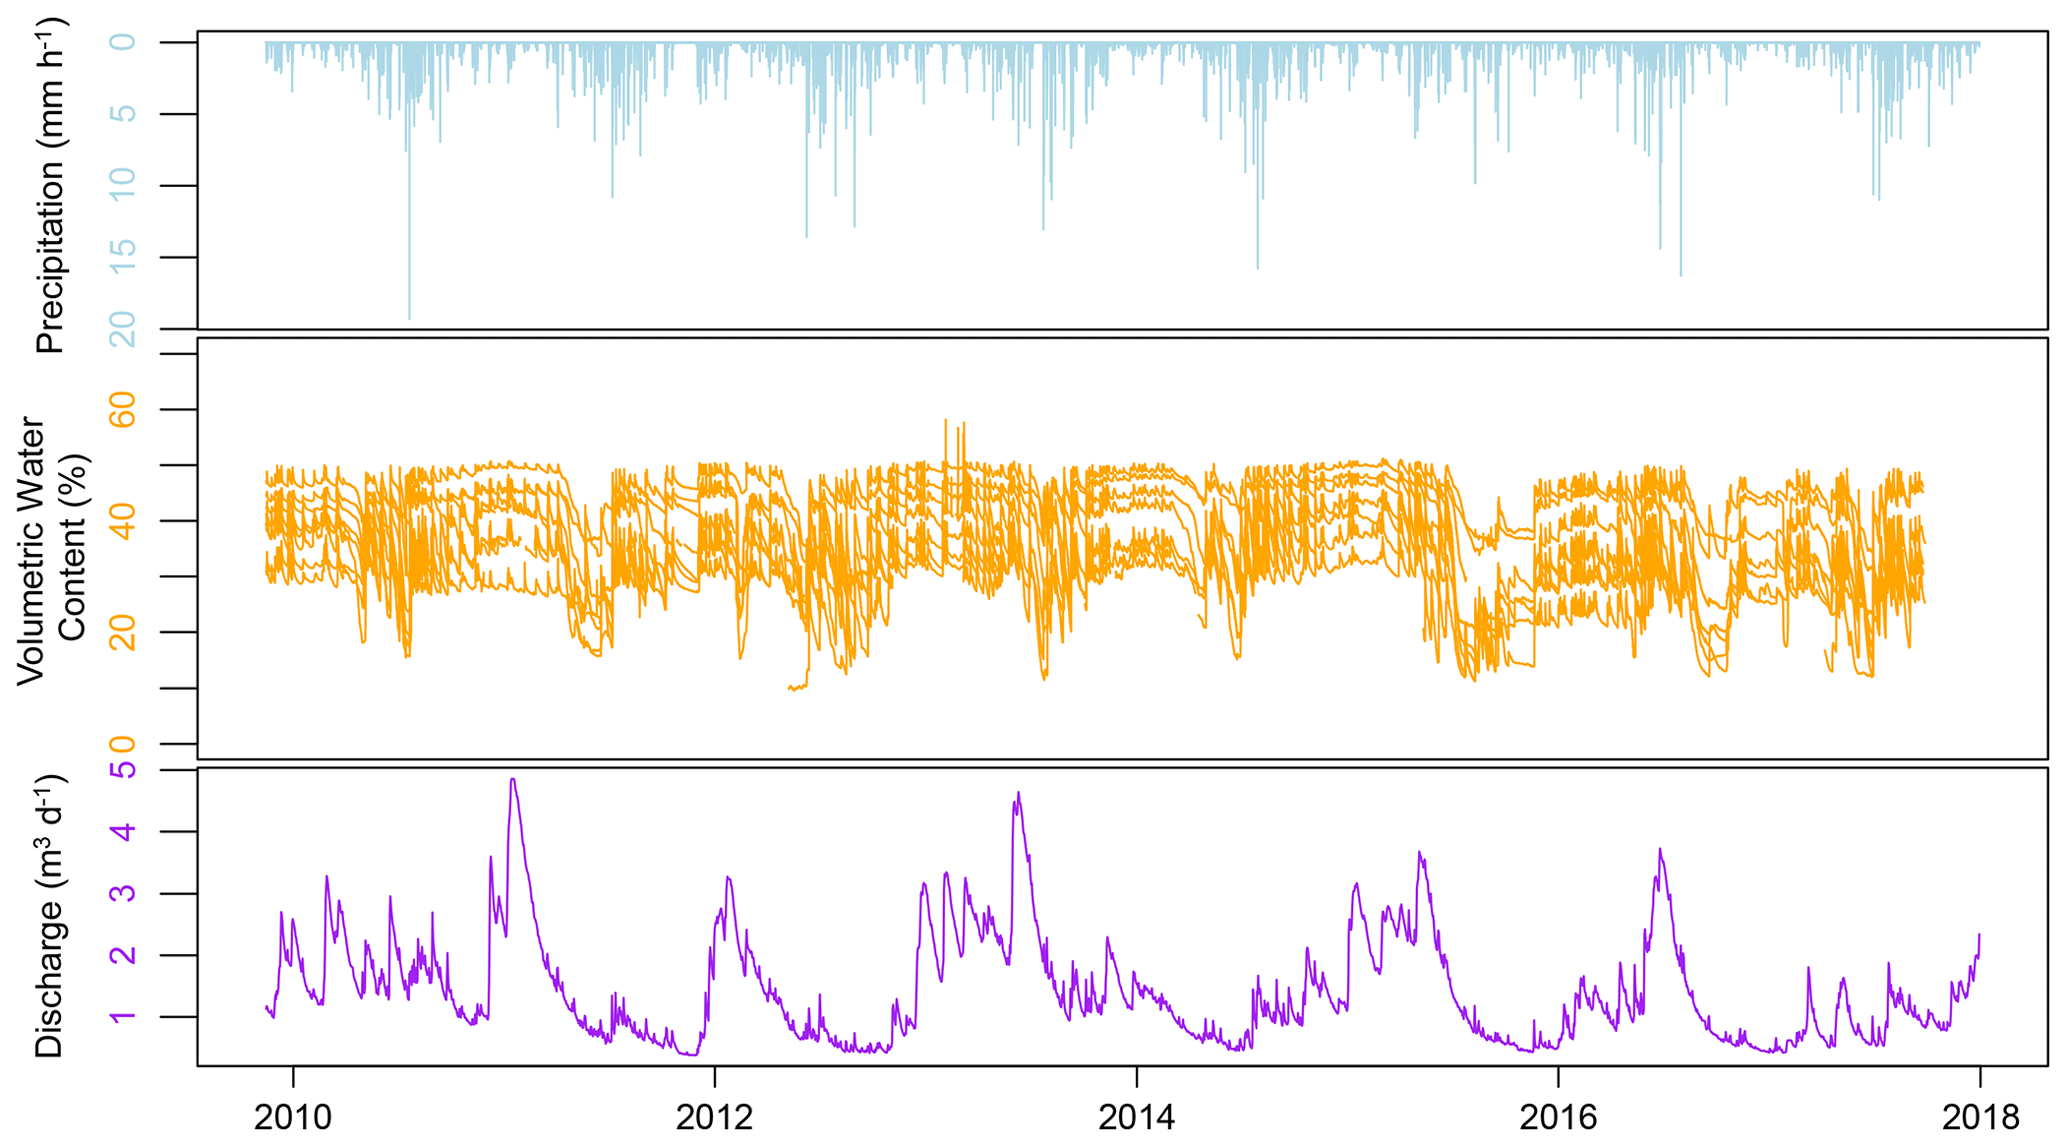
Figure 3Time series of precipitation, soil moisture in grassland, and discharge data collected at the study site.

Figure 4Map of the Große Lauter catchment with the location of the soil moisture profiles, the discharge gauging station, and the four climate stations. (Land cover: Corine Land Cover CLC (2018) modified. Karst aquifers: Chen et al., 2017).
2.3 Study site and data description
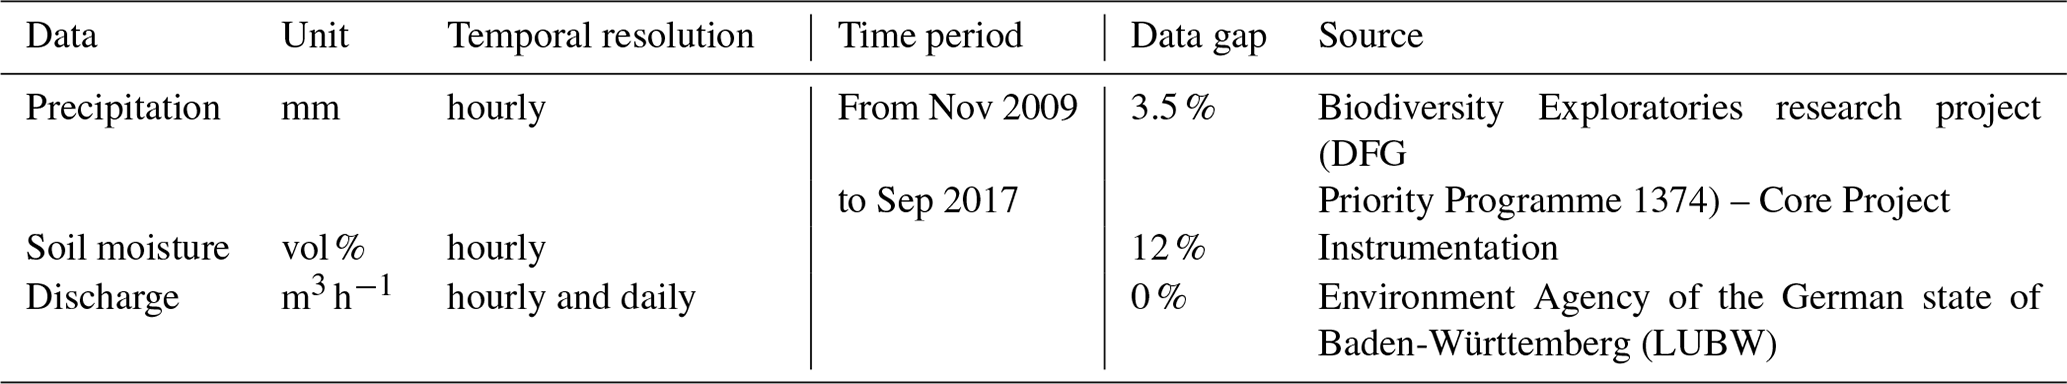
To exemplify the applicability of our approach, we used an experimental dataset collected within the catchment of the Große Lauter river in the Swabian Alb, southwest Germany (Figs. 3 and 4), provided by the Biodiversity Exploratories research project (Table 1). According to the description made by Goldscheider (2005), the geology in the Swabian Alb is composed of 300 to 400 m thick karstified carbonate rocks from the Upper Jurassic. This formation is covered in parts by Molasse sediments and glacial deposits. The soil is shallow (25 to 32 cm) with a silty clay texture (Gimbel et al., 2016). The Große Lauter surface catchment size is 325 km2 with an altitude between 504 and 896 m above sea level. Using long-term estimates of water balance components from the water and soil atlas of the state of Baden-Württemberg (WaBoA, 2012), we estimated the size of the subsurface catchment to be 170 km2 . Assuming that there is no surface runoff due to the karstic properties of the system, we use the size of the subsurface catchment for our further analysis.
Discharge data of the Große Lauter river were available daily and hourly. The mean annual discharge of the river is 1.38 m3 s−1 with a minimum of 0.45 m3 s−1 and a maximum of 3.48 m3 s−1 for the control period (from November 2009 to September 2017). Mean annual precipitation and mean annual air temperature of the site are 940 mm and 6.5 ∘C, respectively (Gimbel et al., 2016), with some snowfall during the winter season. In total, four climate stations are located in the studied catchment, which measure precipitation on an hourly time interval. Thiessen polygons were used to compute an interpolated precipitation dataset for the catchment. Snowmelt was considered using a degree-day approach (Lindström et al., 1997). A detailed description of the routine is provided in Parajka et al. (2007). The snowmelt parameters were adapted from Schulla (1997) and Hartmann et al. (2013), who applied the same routine at nearby sites. The hourly sum of liquid precipitation and snowmelt was used as input to the karst system in the following analyses.
The soil moisture measurements were collected with Decagon 5TM probes (frequency-domain reflectometry) installed at 20 cm depth. They were used to measure soil water content at an hourly resolution. For our analysis, we used 15 soil moisture measurement locations covering a period of 8 years from 2009 to 2017 that were distributed between the two types of vegetation: seven in woodland and eight in grassland (Fig. 4). The woodland areas on the catchment represent 58 % of the cover, while the open areas correspond to 42 %.
Two spatially averaged soil moisture time series were calculated: one from all grassland (G) time series and one from all woodland (W) time series. These two time series reflect the average soil moisture dynamics of the grassland and the woodland sites in the catchment and are less affected by sites-specific heterogeneity than the time series of individual sites. In a same way, a catchment-average soil moisture time series was calculated as the average of the grassland and woodland time series weighted by the percentage of land cover of the catchment. This combined time series reflects the catchment-average soil moisture dynamics. These three average time series were used for the analysis in this study. In addition, a time series of standard deviations for each average time series was computed to quantify the spatial variability of soil moisture measurements among the profiles in grassland, woodland areas, and over the entire catchment at each time step. Consequently, the spatial variability was considered by investigating the infiltration processes over the different land covers of the catchment. For the percolation processes in the unsaturated zone and for groundwater dynamics, we assumed the typical behaviour of a karstified carbonate rock system. As hypothesized in Sect. 2.1.1, our event-scale approach removes the corresponding difference of timing of infiltration and groundwater recharge. It therefore allows for considering extracted discharge volume as a proxy for recharge. Models to estimate recharge by considering only climate data and shallow subsurface information were already used in karst environments (Andreo et al., 2008; Hartmann et al., 2017; Xu and Chen, 2005).
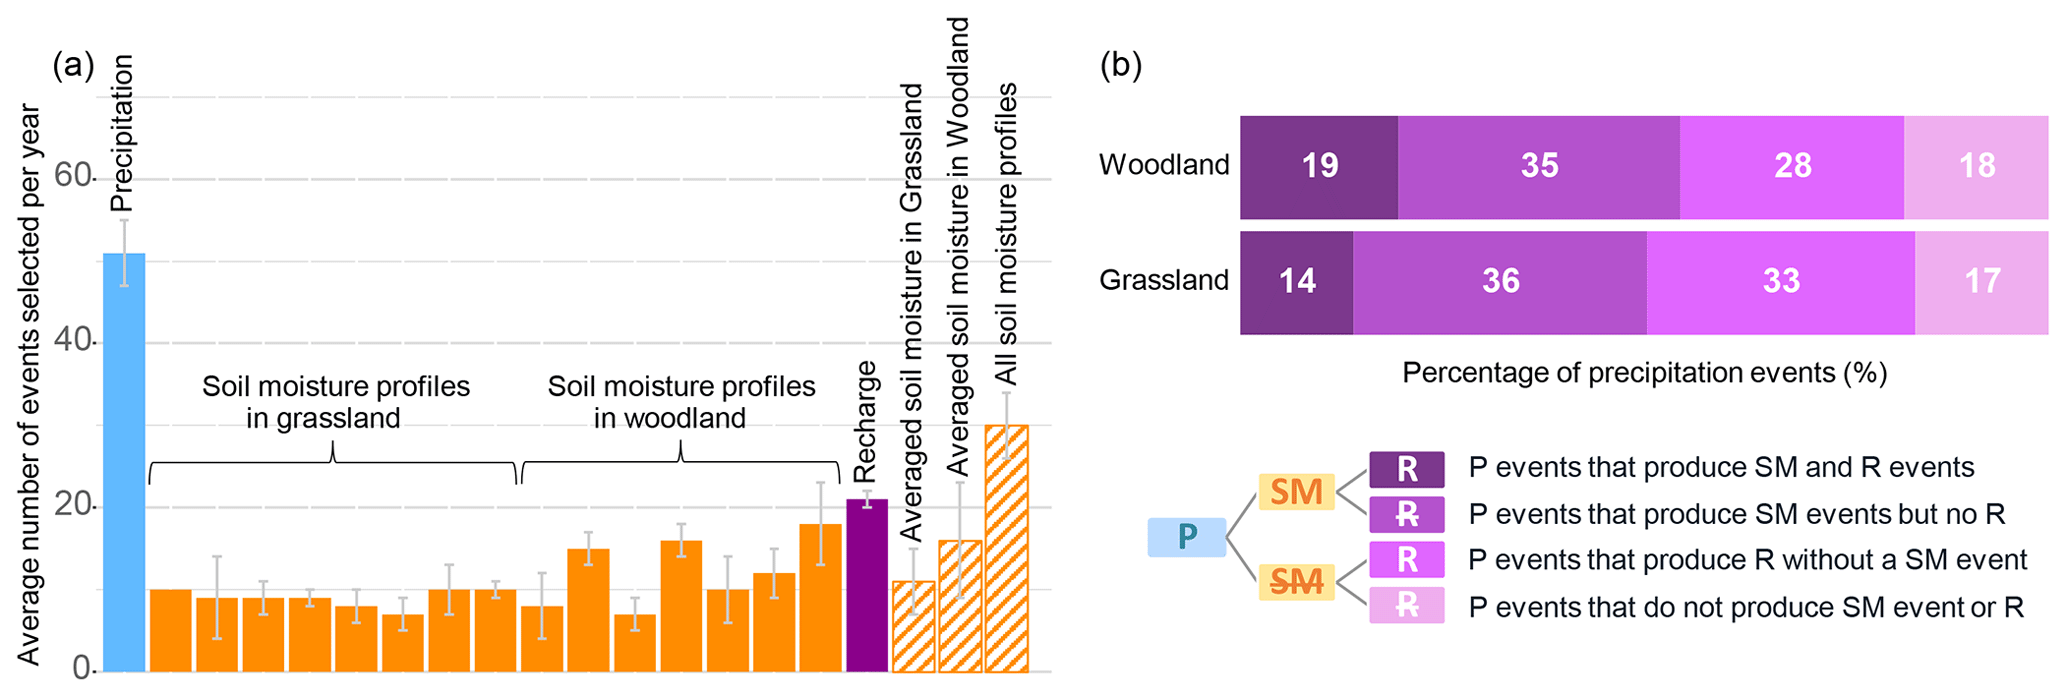
Figure 5(a) Average number of precipitation (P) events, soil moisture (SM) events, and recharge (R) events selected for each hydrological year. Each orange bar corresponds to one soil profile. (b) Percentage of precipitation events attributed to soil moisture and recharge events with the attribution method (number total of precipitation events = 455).
3.1 Event selection
Events were extracted from the precipitation, soil moisture, and discharge time series. In total 455 precipitation events and 266 soil moisture responses from at least one of the soil moisture probes on the catchment were identified. For the analysis, 97 soil moisture events from the grassland time series, 143 soil moisture events from the woodland time series, and 190 recharge events were selected (Fig. 5a). On average per year, the number of precipitation events was about 50. The number of recharge events per year was about 20. For the entire catchment, the number of soil moisture events was about 30 per year. In grassland, the average number of soil moisture events per year was slightly above 10, while in woodland the number was about 15. The heterogeneities in the number of events detected for each profile were also higher in woodland than in grassland.
The percentage of precipitation events that caused both soil moisture and recharge events was 14 % in grassland and 19 % in woodland (Fig. 5b). The percentage of precipitation events that caused soil moisture events but not recharge events was 36 % for grassland and 35 % for woodland. In total, a higher percentage of precipitation events that caused any type of soil moisture response was found in woodland compared to grassland. The fraction of precipitation events that were attributed to recharge but not linked to a soil moisture response was 33 % in grassland and 28 % in woodland; 17 % and 18 % of all precipitation events in grassland and woodland caused neither soil moisture nor recharge to respond.
In order to study the link between soil moisture and recharge, only the combinations of precipitation events that were attributed to one soil moisture event and also one recharge event were used for the following empirical analysis and for the model calibration procedure. For calculating the recharge volume over the 8-year study period, all events were used.
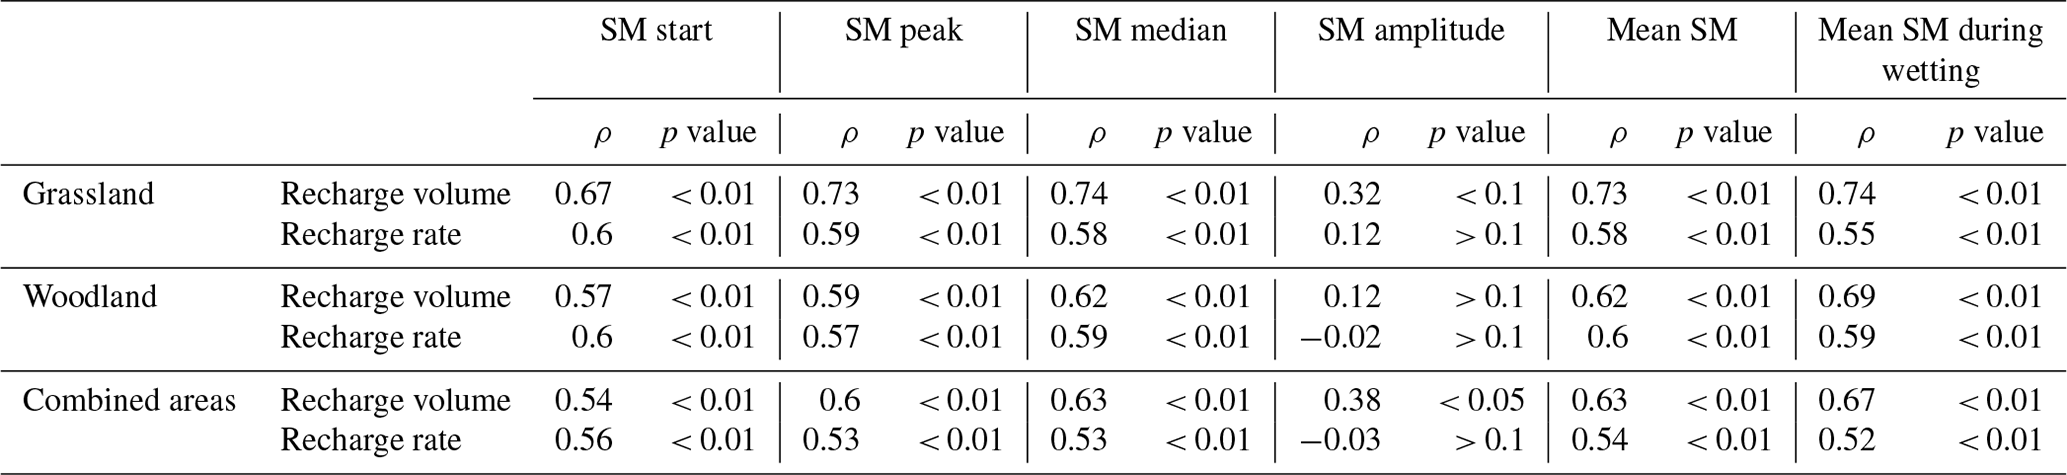
Table 2Spearman rank correlation (ρ) between soil moisture (SM) metrics and recharge descriptors for grassland, woodland, and the combined areas.
3.2 Correlation analysis between soil moisture and discharge
For those rainfall events that produced both a single soil moisture and a recharge response, spearman rank correlations (ρ) between soil moisture metrics and recharge metrics (recharge volume and recharge rate) of the corresponding events were calculated. Results are shown in Table 2. The highest correlation coefficients were found between the recharge volume and soil moisture metrics from grassland areas (ρ up to 0.74), while those for woodland areas (ρ up to 0.69) and the combined areas (ρ up to 0.67) were slightly smaller but still significant. From all soil moisture metrics, mean soil moisture during the wetting period showed the highest correlation with the recharge volume for all three groups (grassland, forest, and combined areas), but also the soil moisture mean and median yielded comparably high correlations. Only the metric soil moisture amplitude was not significantly correlated with recharge volume and recharge rate. The soil moisture amplitude showed a low correlation with the recharge volume and with the recharge rate for all grassland, woodland, and the combined areas. All other soil moisture metrics were statistically significantly correlated (ρ > 0.5; p value < 0.01) with recharge volume and recharge rate with slightly higher correlation coefficients for recharge volume than recharge rate.
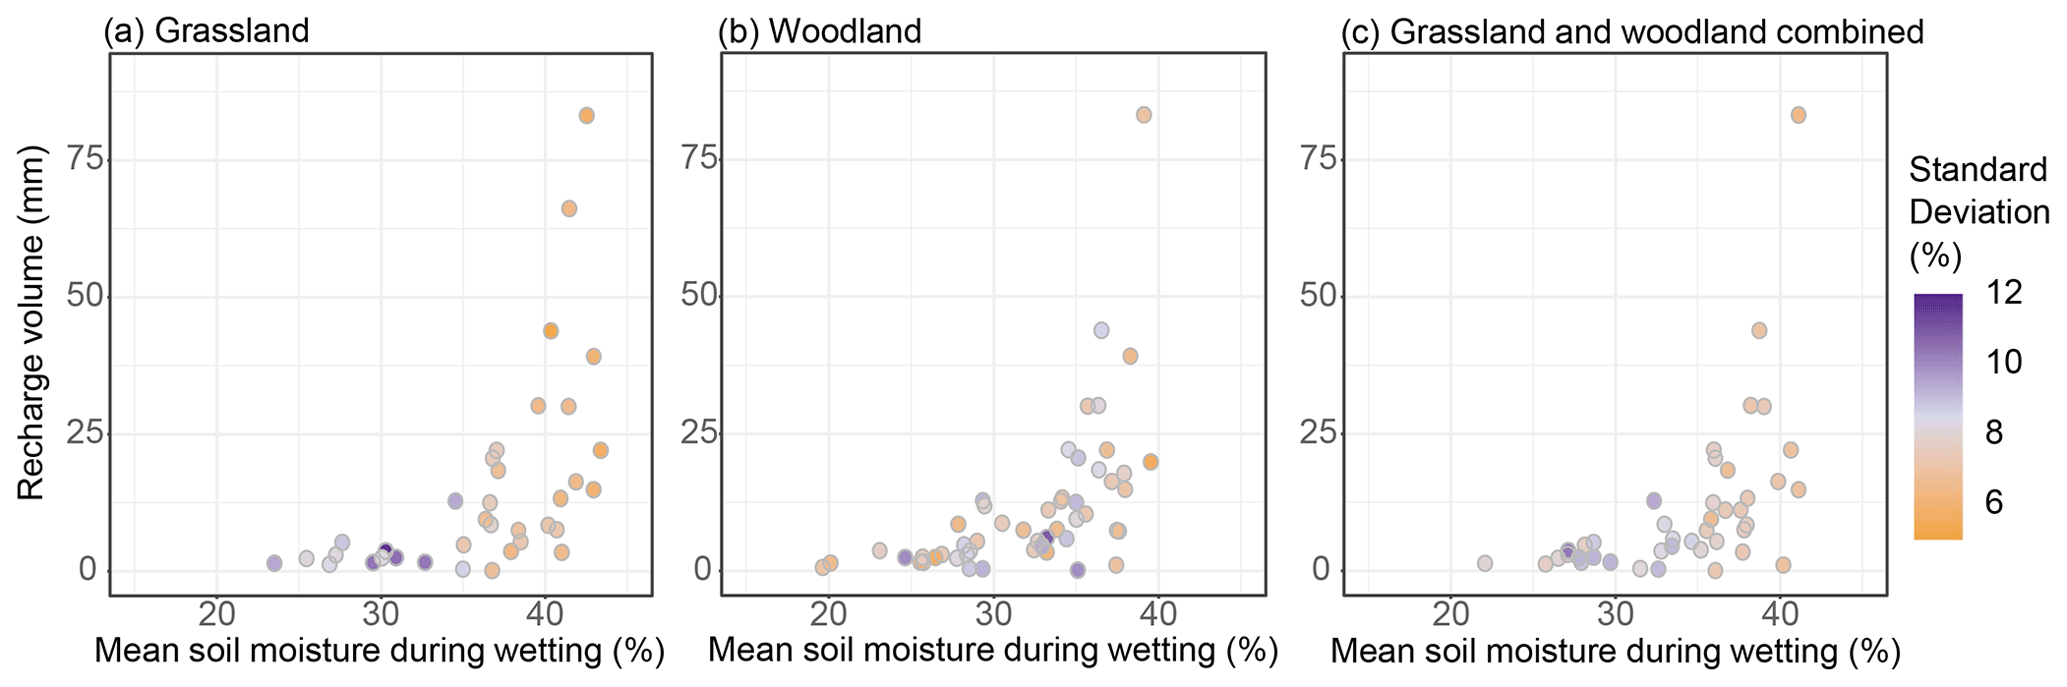
Figure 6Relationship between recharge and mean soil moisture during the wetting period. Each data point corresponds to one selected event; the colour indicates the standard deviation of mean soil moisture during the wetting period caused by the variability within the grassland (a), woodland (b), and the combined areas (c).
As mean soil moisture during the wetting period had the highest correlation with recharge volume for all three groups, this combination was used for the subsequent analyses. Figure 6 shows the relationship between the mean soil moisture during the wetting period and the recharge volume for each event selected for the grassland, woodland, and the combined areas. The standard deviation of the mean soil moisture during the wetting period caused by averaging across all grassland, all woodland, and all monitoring sites of the catchment is shown using a colour scale. It allows for the assessment of the spatial variability of soil moisture response due to site specificities of individual profiles.
The visual analysis clearly indicates an exponential relationship between the recharge volume and mean soil moisture during the wetting period. The maximum soil moisture values in the grassland reached almost 45 %, while values remained below 40 % in woodland. It seems that when the soil moisture reached the threshold of about 35 %, the recharge volume started to increase for all three datasets. In grassland areas, the standard deviation of the mean soil moisture during the wetting period got lower with increasing soil wetness, especially when exceeding the 35 % threshold. Under these conditions, the soil moisture measured at the different profiles across the grassland sites was getting more consistent. This is not observed for the profiles in woodland areas, where the measurements were more disparate. The results using the combined areas of grassland and woodland sites showed an average behaviour of the one observed in the two respective areas. The exponential shape of the distribution of the data points was similar to the one for woodland, and the standard deviation of the mean soil moisture during the wetting period got lower with increasing soil wetness, as observed for grassland but in an attenuated way.
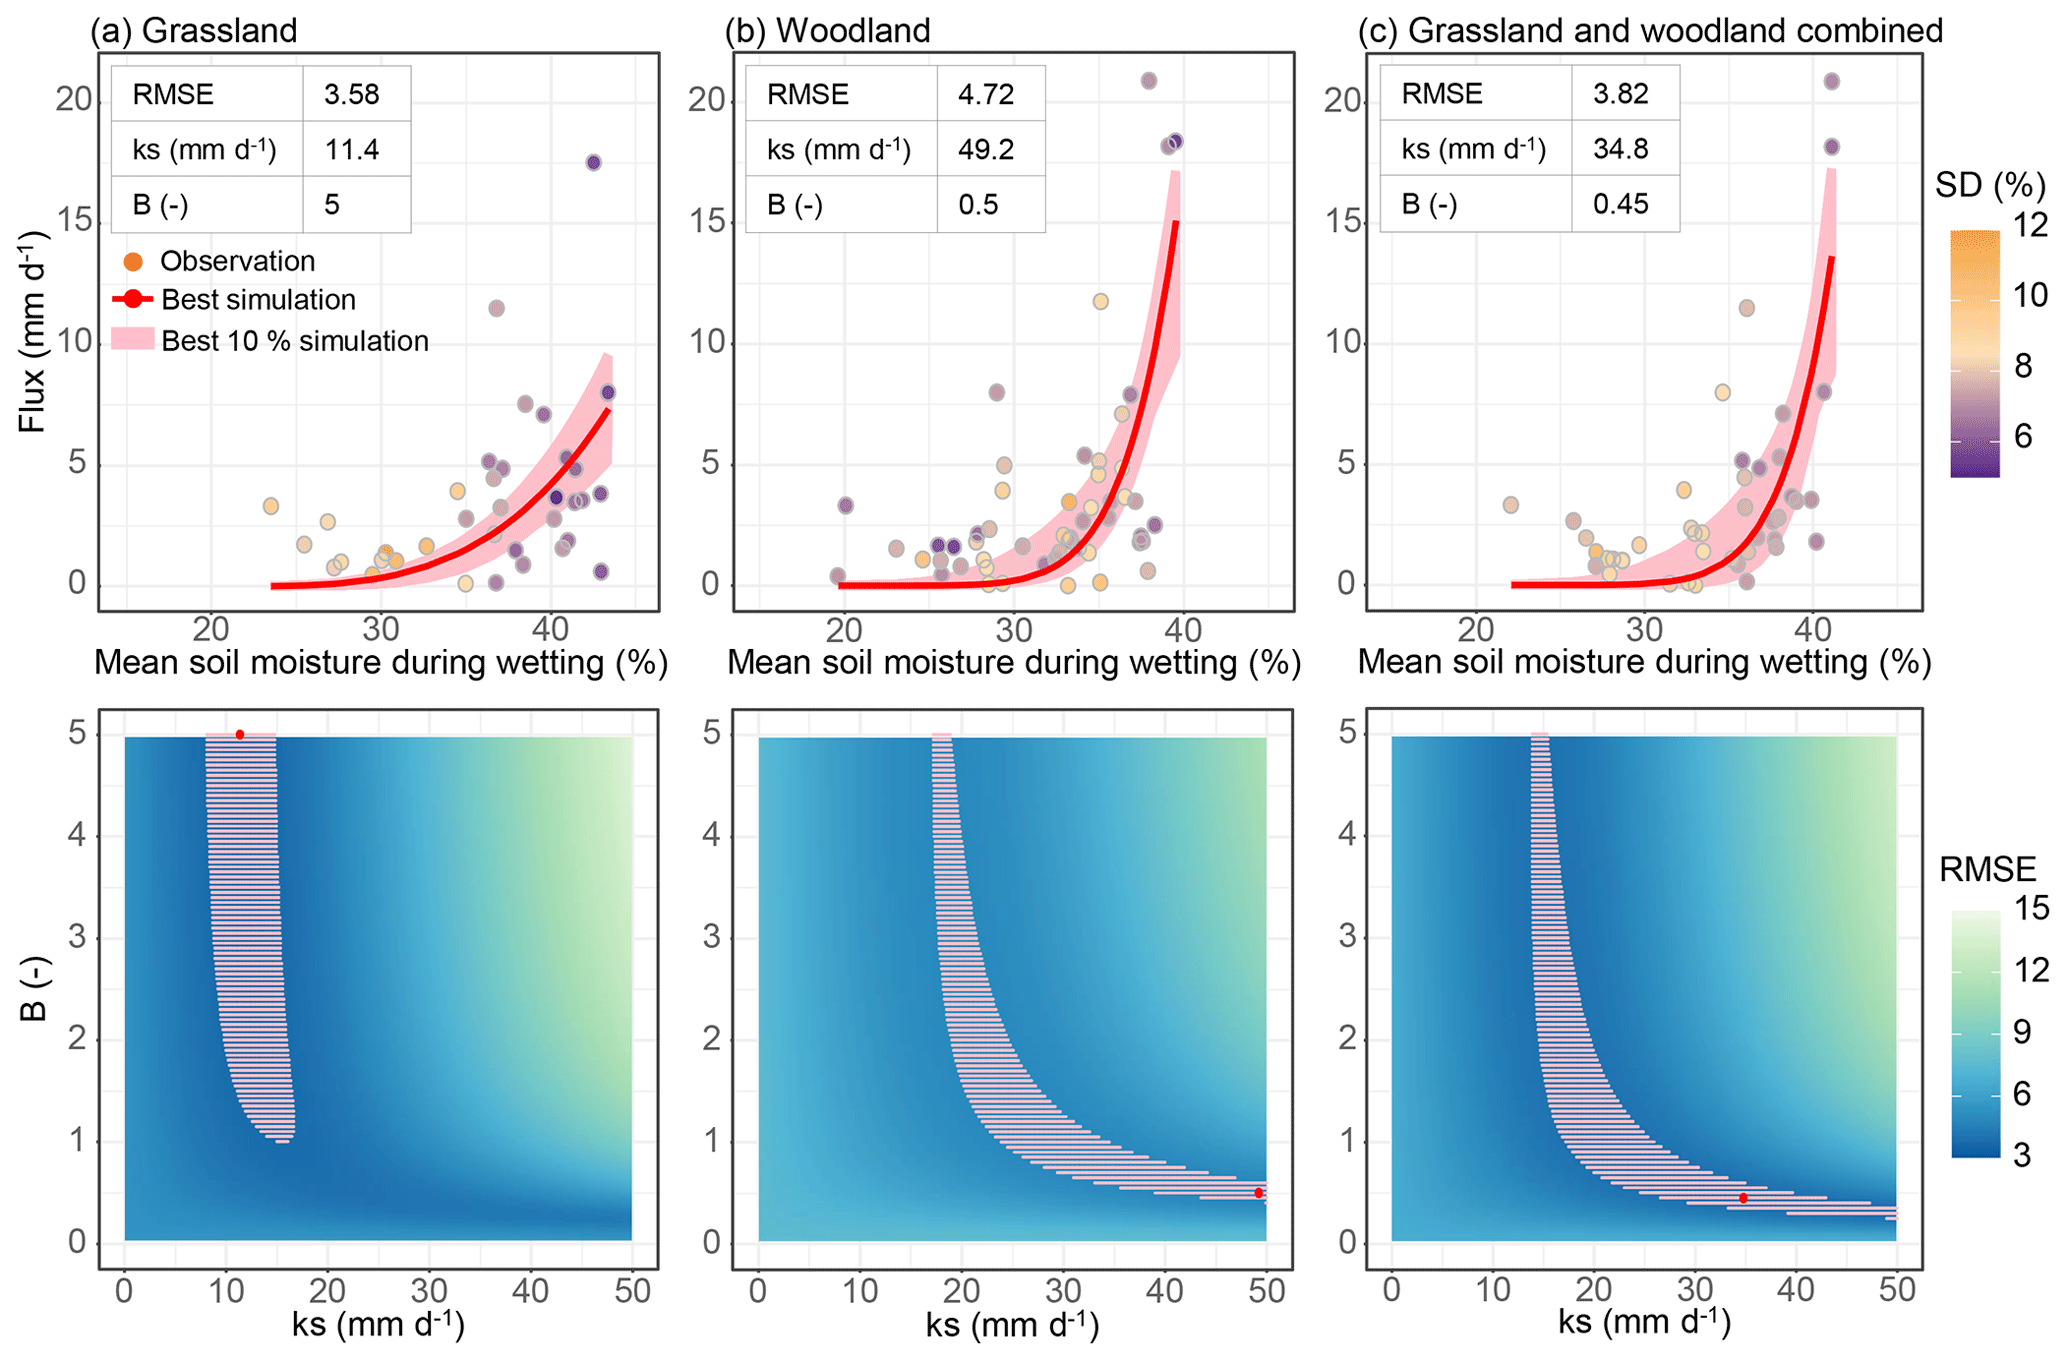
Figure 7Results of the Monte Carlo parameter calibration of the drainage model for grassland (a), woodland (b), and the combined areas (c). The best simulation is the one presenting the lowest RMSE. Upper panels: the observed fluxes as a function of the soil moisture during the wetting period for each event (points) coloured by the standard deviation of mean soil moisture during the wetting period (SD) and the simulated fluxes (red line) using the drainage model with the fitted parameters. Lower panels: the RMSE of the drainage model for different combinations of ks and B parameters tested in the Monte Carlo calibration procedure, the 10 % lowest RMSE (dashed pink), and the ks and B parameters with the lowest RMSE (red point).
3.3 Drainage model based on the unit gradient approach
The exponential relationship between the recharge volume and the soil moisture during the wetting period, already indicated that the drainage model, was an adequate choice, as it is based on an exponential function. Figure 7 shows the results of the model calibration. The simulated flux using the drainage model was in millimetres per day; it had to be multiplied by the duration of events to obtain the recharge in millimetres as described in Sect. 2.2.2. In grassland, compared to woodland or the combined areas, the model seemed to present more difficulties to simulate the highest values of recharge.
In grassland, ks was estimated to be 11.4 mm d−1 and B to be 5 for an RMSE of 3.58. In woodland, the ks was estimated higher at 49.2 mm d−1, and B was estimated lower at 0.5 for an RMSE of 4.72. With the combined areas, the RMSE was 3.82, with ks estimated at 34.8 and B at 0.45. The 10 % best simulations (with the 10 % lowest RMSE) were also applied and are represented in Fig. 7. In grassland, the ks was estimated between 8.1 and 16.7 mm d−1 with a B between 1 and 5. In woodland, the ks was estimated between 17.2 and 50 mm d−1 with a B between 0.40 and 5. For the combined areas, the ks was estimated between 13.9 and 50 mm d−1 with a B between 0.25 and 5.
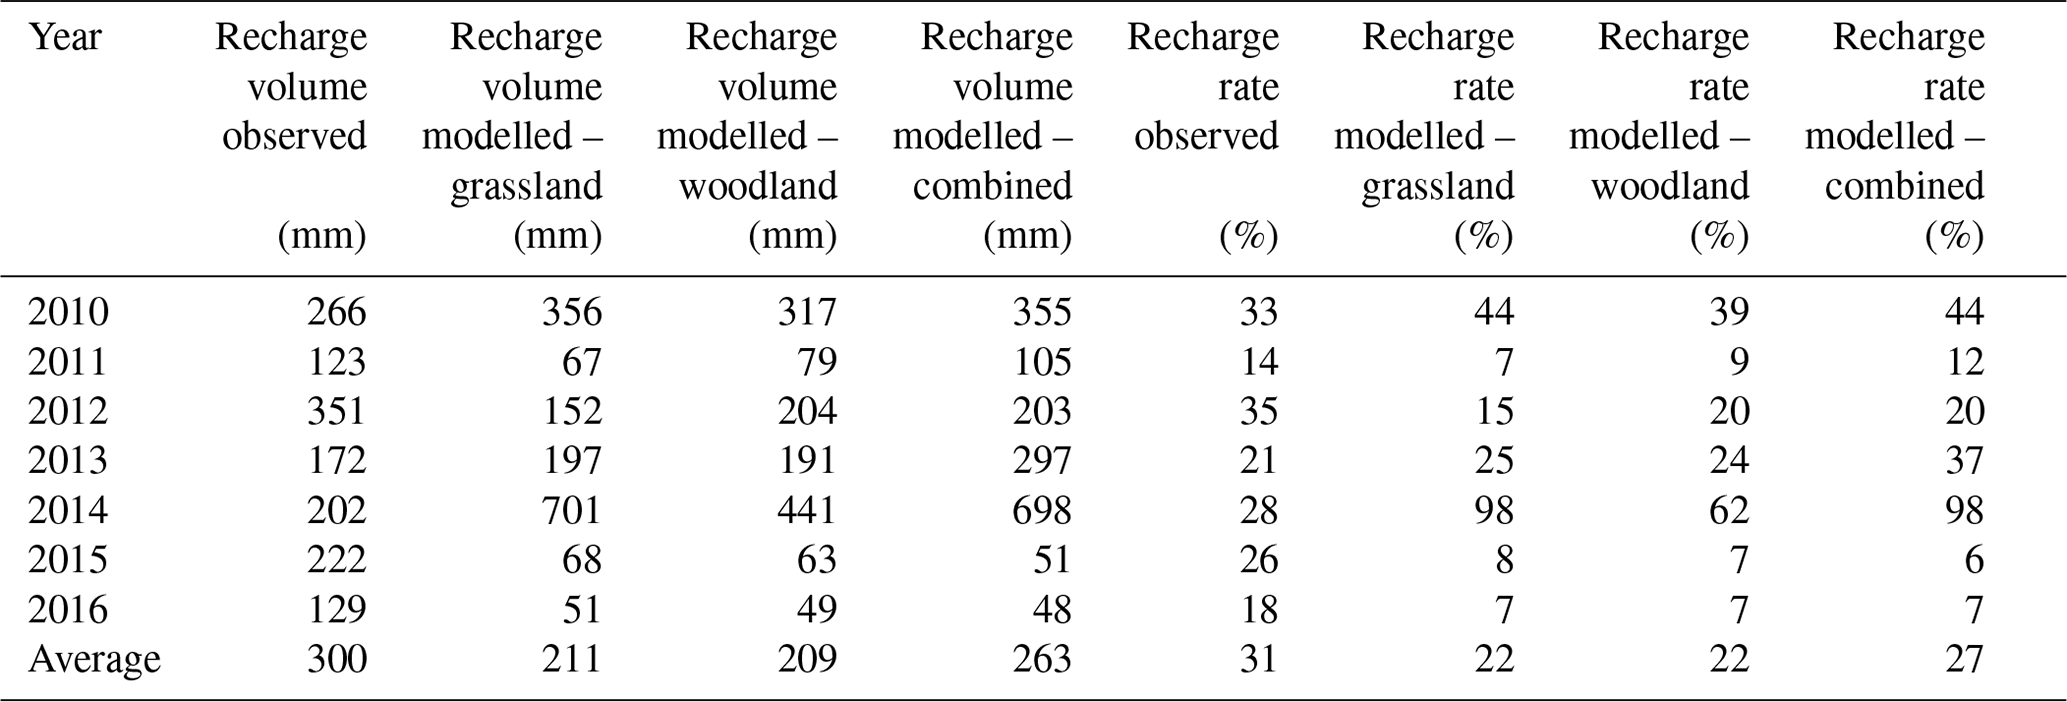
The drainage model with its fitted ks and B parameters was used to estimate recharge volumes for each hydrological year of the study period (Table 3). All soil moisture events selected for each year and each grassland, woodland, and the combined areas was considered for this analysis. On average, the model was capable of predicting 88 % of the observed recharge volume calculated from measurements using the combined areas. This number was about 70 % when calculating the annual recharge volume only based on the grassland or the woodland data. The results were, however, disparate depending on the studied year. For example, in 2010 the drainage model yielded between 119 % and 134 % of the observed annual recharge volume, while in 2012 the drainage model yielded between 42 % and 57 % of the annual recharge volume. In 2015 and 2016, the drainage model yielded between 30 % and 40 % of the observed annual recharge volume, and in 2014 between 218 % and 348 % for the observed annual recharge volume. The results for the recharge rates presented similar patterns. For example, in 2010, the model yielded a recharge rate between 39 % and 44 % compared to the observed recharge rate of 33 %. Again, in 2014 the drainage model yielded the largest deviation (between 62 % and 98 % of recharge rate) from the observed recharge rate of 28 %. In general, the combined grassland and woodland data lead to better results.
4.1 Precipitation, soil moisture, and recharge event statistics
4.1.1 Number of selected events
The fact that there are more precipitation events than soil moisture events and more soil moisture events than recharge events is coherent with our expectations, as only parts of the precipitation events yield enough rainfall to cause a soil moisture response at 20 cm soil depth. Similarly, only a part of the water at 20 cm depths will contribute to recharge as parts are stored in the soil matrix or evaporated from the soil. However, another reason for precipitation events not resulting in a soil moisture event is likely due to the spatiotemporal heterogeneity of precipitation over our study area, heterogeneities induced by throughfall in forest, and the distribution of soil profiles over the catchment. This probably distorts the link between the precipitation signal and soil moisture or recharge.
Table 3Annual recharge volume and annual recharge rate calculated from measurements and simulated using the fitted drainage model for the grassland, woodland, and combined areas.
From the total number of identified precipitation events, the portion of precipitation events leading to soil moisture events was slightly higher in woodland compared to grassland, and the portion of precipitation events that caused a soil moisture and a recharge response was higher in woodland compared to grassland. This is surprising as interception losses on forested sites would suggest that less rainfall is infiltrating into the soil and less is reaching the ground because of the water consumption by vegetation with deeper roots (Carriere et al., 2020). On the other hand, Heilman et al. (2014) indicate that forest does not necessarily induce a higher water consumption, especially with shallow soils with limited storage capacity. The denser root system in forest sites is likely an explanation for the higher number of soil moisture events in woodland compared to grassland (Bargués-Tobella et al., 2014), with a higher soil heterogeneity in woodland and a higher hydraulic conductivity (e.g. by macropores) through the soil. This explanation goes well with the observation that, in total, more soil moisture events in woodland sites caused a recharge response than in grassland sites. However, the threshold percentage of soil moisture leading to recharge is similar for both grassland and woodland.
The portion of precipitation events linked to recharge events but not to soil moisture events can likely be explained by the limited number of soil moisture monitoring sites relative to the size of the catchment. But this could also be explained by the exclusion of soil moisture events that were not linked to precipitation during the method's attribution step. In that case, the problem might be due to the cross-correlogram analyses that we used to estimate the attribution period between precipitation and soil moisture, which was applied and validated by Delbart et al. (2014) only to the estimation of the water transit time between precipitation and recharge and not for soil moisture.
4.1.2 Soil moisture and recharge correlation
A range of soil moisture metrics was used for the correlation analysis: the antecedent conditions, the maximum reached value, the average, and the response amplitude of each event. Acceptable correlations were found between all soil moisture metrics and recharge, except for the amplitude of the soil response. As shown in Fu et al. (2015), the soil wetting conditions before the recharge event have an important influence on karst recharge processes. This might explain why the soil response amplitude did not present a good correlation with effective infiltration: the antecedent conditions would be more important. The best and most consistent correlation among grassland, forest, and their combination was found for the average moisture during the wetting period. This metric comprises the soil moisture conditions from the start of response (to the peak) and thus better characterizes the soil moisture response. It turned out to be a better metric than the average soil moisture calculated for the entire event, which is typically biased towards the conditions during the long recession of the event. Its correlation results together with its above-mentioned characteristics made the average soil moisture during the wetting period the best metric to characterize recharge in this study.
The mean soil moisture during wetting plotted against the recharge volume showed an exponential relationship. A soil moisture threshold seemed to have to be reached to activate the recharge; it was around 35 % (± 8) of volumetric water content. The concept of such thresholds is common in karst modelling (Baker et al., 2020; Chen et al., 2017). Common soils over carbonate rock present porosities between 35 % and 65 % (Blume et al., 2010; Kirn et al., 2017). As the matrix potential is getting lower while soil moisture and the unsaturated hydraulic conductivity increase to initiate gravity driven processes, we can make the approximation that these soils are getting close to saturation when porosities of 35 %–65 % are reached to initiate percolation (Saxton et al., 1986). In our case, this threshold was between 35 % and 45 % of the volumetric water content, so this result was coherent with the type of soil at the studied catchment (silty clay). The standard deviation values of the soil moisture measurements over the catchment decreased during periods of high soil moisture, and these were the periods when recharge was observed. This link was, however, stronger at the grassland sites compared to the woodland sites. This is consistent with the fact that the soil moisture measurements in forests are more heterogeneous, in particular because of the trees, their distribution, their roots, and their transpiration (see above).
4.2 Reliability of the event-based selection
As discussed above, the total number of precipitation, soil moisture, and recharge events selected with this approach is coherent with percolation, infiltration, and evaporation processes.
The results of our study are based on a reliable extraction of rainfall events, soil moisture events, and recharge events. The necessary thresholds were chosen according to previous studies and refined by different tests. The precipitation event selection threshold was set to 1 mm for each event, as in the approach used in Demand et al. (2019), inspired by Graham and Lin (2011) and Wiekenkamp et al. (2016). To end a precipitation event, a second threshold of 24 h without precipitation was applied. This one was chosen after testing thresholds of 6, 12, 24, and 48 h. In the case of our study, the 24 h threshold was the one presenting the most coherent results: a shorter period was creating too many precipitation events linked to individual soil moisture reaction, while a longer period was selecting nonrealistic precipitation events. The soil moisture event selection threshold was set 1 % of the previous volumetric water content measurement, which corresponds to the accuracy of the probes. In a second step, soil moisture event attribution to precipitation event allowed us to find the selected soil moisture events but not linked to precipitation. Those events were removed, based on the fact that a soil moisture response could not occur without precipitation (Fig. 2). This step allowed us to reduce errors that the event selection based only on threshold could create. This is especially true for the soil moisture event extraction, which relies only on the accuracy of the probes. The recharge event selection threshold relied on the 3 d running average of the observed slope of the discharge time series. Other event selection criteria might have resulted in a different set of recharge events. However, the selected recharge events represented 90 % of the total discharge volume observed in the catchments; therefore, the method seemed appropriate for the purpose of this study.
4.3 Modelling of recharge based on soil moisture
The use of the drainage model based on the unit gradient approach allowed us to estimate the recharge fluxes from soil moisture measurements. The two calibration parameters ks and B could be linked to the properties of the soil. This feature theoretically allows for applying the approach to karst sites with similar soil properties. In our case the fitted model parameter ks was in the range of saturated hydraulic conductivity values corresponding to the soil found on the experimental catchment (silty clay) (Saxton et al., 1986). However, ks and B are effective model parameters and therefore cannot necessarily be derived from soil physical analysis. Given the simple approach, ks is expected to be higher/lower in sites where the saturated hydraulic conductivity is also higher/lower. And the pore size distribution index B is expected to be smaller, the wider the range of pore sizes is (Cary and Hayden, 1973). In our case, the B value was higher for the grassland data. When calibrating the model parameters using the entire dataset (grassland and woodland sites), the effective parameters were between those determined for grassland and woodland sites with more similarity with the woodland sites. Still, the calibrated values and even the ks values for the 10 % best model fits were in the range of saturated hydraulic conductivity values common for silty clay soil. By considering the 15 % best model fits, the resulting ks values overlapped with those values fitted to only the grassland sites or the woodland sites. This suggests that common values of ks and B can be used for a successful simulation of recharge when a differentiation between grassland and woodland sites is not possible (Fig. 7). Larger saturated hydraulic conductivities going along with smaller B values < 1, which results in low recharge at low saturation and very high recharge at or close to saturation, is in accordance with successful model representations of the soil/epikarst in previous modelling studies. These models use a simple overflow bucket model that simulates zero recharge when below saturation and large volumes of recharge when saturated (Fleury et al., 2007).
When applying the event-based approach to estimate the sum of recharge volume of all events of a year, we noticed considerable differences between simulated and observed recharge volumes from year to year. One possible reason could be that our model was calibrated using events for which a precipitation event could be linked clearly to both a soil moisture event and a recharge event. As Fig. 5a shows, only a small portion of events fulfilled this criterion. From that point of view, it is intuitive that the model did not perform particularly well. This was especially true for the year 2014 when two events were highly overestimated compared to the others. They had the particularity to be attributed to a long wetting period, which led to large volumes of simulated recharge.
The evaluation results are, however, acceptable on average over the entire studied period, with 88 % of recharge volume simulated using the combined areas. In general, the model's results were better with the combined areas data. As the combined areas soil moisture time series was the result of the average of the grassland and woodland data, we expected results in between the ones from grassland and woodland. However, it seemed that the ks and B calibration was more influenced by the woodland data. The woodland covering the catchment is in a higher proportion (58 %); this could explain its influence on the combined areas data. Also, the soil moisture measurement profiles that presented more events per year on average were located in woodland (Fig. 5a), and the proportion of precipitation events resulting in soil moisture or recharge events was higher in woodland than in grassland sites (Fig. 5b). While there is certainly the potential to improve the model or calibrate it to more complex events, the simulated recharge for individual events and the average recharge over a longer period of several years are promising given the simplicity of the model and the uncertainty of the model calibration procedure.
4.4 Transferability of the method
The methodology presented in this study was developed with the aim to also be applicable at other karstified sites. Our calibration required precipitation, soil moisture, and discharge data representative of groundwater recharge. It was also conducted based on long time series with a relatively low number of data gaps. A catchment with several outlets or a large portion of direct recharge through sinkholes, for example, would bring problems of representativeness of discharge and bias the link between soil moisture and recharge. In addition, the size of the catchment was required to estimate the volume of recharge. If applied to a catchment without catchment size information, this would allow for the simulation of recharge event occurrence but not their volume estimation.
Soil moisture data are available at various karst systems (Berthelin et al., 2020; Dorigo et al., 2021). However, recharge data are not always fully available for the calibration. The parameter uncertainty analyses showed that the B parameter tended to fall below 1 when the ks parameter was getting high (up to 30 mm d−1). Since karst areas usually have very high permeabilities (Worthington et al., 2016), it is valid to assume high vertical saturated hydraulic conductivity (ks even larger than 50 mm d−1) when estimating catchment-scale groundwater recharge. Consequently, parameter B would assume values < 1, resulting in the behaviour we found for the woodland and combined areas (Fig. 7b and c). These ks and B values could be a good first guess for the model parameters, with possible in situ ks measurements for refinement. In addition, even if recharge time series are not fully available, a few observations such as shorter time series of discharge measurements conducted at a spring or other proxies for recharge such as groundwater heads measurements, conductivity, or water drops in a cave could be used for evaluation.
Our calibration also showed that fitted parameters were not very sensitive to the simulated recharge at the catchment scale. A distinction between grassland and woodland within the catchment was not necessary to obtain reasonable recharge rates. The method can be applied to a single soil moisture profile but should be repeated at various locations on a catchment for better representativeness, especially in forest areas where the soil heterogeneities are larger. One single soil moisture monitoring site would be limited in terms of being representative of the conditions across an entire catchment. The number and distribution of profiles to be installed would also depend on the variability of the soil over the catchment. The probes should be installed in the deepest possible depth to avoid the evapotranspiration effect. Also, the locations of the precipitation measurements need to be considered with care. Radar-based precipitation data could be an option to test in further studies.
A method to estimate karst recharge using soil moisture measurements was developed and tested at a karst system in southwest Germany. Based on precipitation, soil moisture, and discharge measurements, the method allowed for the extraction of triplet combinations of single rainfall–soil-moisture–recharge events. These combinations were then used to calibrate a drainage model that allowed for deriving recharge fluxes and subsequent recharge volumes from soil moisture measurements. The application of the method to the test site showed the dominant influence of soil moisture measurements conducted in woodland areas. This is the land cover where the highest number of soil moisture events was found, as well as the highest percentage of precipitation events creating soil moisture and recharge events. However, the usage of a combined time series of woodland and grassland soil moisture measurements allowed for the best estimation of catchment recharge using the maximum available data and variability. The soil moisture averaged during the wetting period of each event was found to be the best indicator for estimating recharge. The relationship between soil moisture and recharge was exponential, with a threshold of about 35 % of volumetric water content to initiate substantial recharge. The applied calibrated model allowed for a reliable recharge volume estimation at the event scale. Adding up the event-scale recharge and comparing it to long-term observations, the model yielded 88 % of the observed recharge volume. The model calibration based on discharge measurements and converted into recharge volume leads to soil-saturated hydraulic conductivity values coherent with the type of soil found at the test site and in accordance with existing recharge modelling concepts for karst systems. This means that the approach might be applicable to different karst sites presenting different conditions using soil-type characterization for a priori estimation of the model parameters, i.e. without discharge data for calibration. The event approach also allows for a semi-quantitative comparison of recharge from different time periods, climates, or locations where soil moisture and precipitation time series are available. The soil moisture probes used in this study are capable of direct measurements at a high temporal resolution and for a long period. In the future, the approach should be tested at different karst sites to explore the ranges of its applicability to different catchment sizes, with different climate conditions, and different vegetation covers and soils. Other technical aspects, such as the number of soil profiles for measurements, could be explored in order to reproduce the method with optimum efficiency.
Soil moisture and climate data were provided by the Biodiversity Exploratories research project (DFG Priority Programme 1374) – Core Project Instrumentation. Streamflow data were provided by the Environment Agency of the German state of Baden-Württemberg (https://udo.lubw.baden-wuerttemberg.de, LUBW, 2023).
The paper was conceived by RB under the supervision of AH, MM, and MR. RB, AH, MR, DD, and TO developed the methodology. RB conducted the formal analysis, with software support from TO, DD, and MS. TO developed the methodology and conducted the analysis of the recharge event's volume computation. All authors participated in the writing, review, and editing processes.
The contact author has declared that none of the authors has any competing interests.
Publisher's note: Copernicus Publications remains neutral with regard to jurisdictional claims in published maps and institutional affiliations.
We thank the instrumentation and remote sensing team of Thomas Nauss from Philipps University of Marburg for providing soil temperature and moisture data. We thank the managers (who are all former managers) of the three Biodiversity Exploratories regions for their work in maintaining the plot and project infrastructure: Kirsten Reichel-Jung, Iris Steitz, and Sandra Weithmannand (Swabian Alb); Katrin Lorenzen and Juliane Vogt (Hainich); and Miriam Teuscher (Schorfheide). We also thank Christiane Fischer for giving support through the central office; Andreas Ostrowski for managing the central database; and Markus Fischer, Eduard Linsenmair, Dominik Hessenmöller, Daniel Prati, Ingo Schöning, François Buscot, Ernst-Detlef Schulze, Wolfgang W. Weisser, and the late Elisabeth Kalko for their role in setting up the Biodiversity Exploratories project. The work has been funded by the DFG Priority Programme 1374 “Infrastructure Biodiversity-Exploratories”. RB, TO, MR, MS, and AH were supported by the Emmy Noether Programme of the German Research Foundation (DFG, grant no. HA 8113/1-1). MM was supported by the project PID2019-111759RB-I00 funded by the Spanish Research Agency, and this work is a contribution to the Research Group RNM-308 of Junta de Andalucía.
This research has been supported by the Deutsche Forschungsgemeinschaft (grant no. HA 8113/1-1).
This open-access publication was funded by the University of Freiburg.
This paper was edited by Nadia Ursino and reviewed by Michael Stewart and one anonymous referee.
Allocca, V., Manna, F., and De Vita, P.: Estimating annual groundwater recharge coefficient for karst aquifers of the southern Apennines (Italy), Hydrol. Earth Syst. Sci., 18, 803–817, https://doi.org/10.5194/hess-18-803-2014, 2014.
Andreo, B., Vías, J., Durán, J. J., Jiménez, P., López-Geta, J. A., and Carrasco, F.: Methodology for groundwater recharge assessment in carbonate aquifers: Application to pilot sites in southern Spain, Hydrogeol. J., 16, 911–925, https://doi.org/10.1007/s10040-008-0274-5, 2008.
Aquilina, L., Ladouche, B., and Dörfliger, N.: Recharge processes in karstic systems investigated through the correlation of chemical and isotopic composition of rain and spring-waters, Appl. Geochem., 20, 2189–2206, https://doi.org/10.1016/j.apgeochem.2005.07.011, 2005.
Baker, A., Berthelin, R., Cuthbert, M. O., Treble, P. C., Hartmann, A., and the KSS Cave Studies Team: Rainfall recharge thresholds in a subtropical climate determined using a regional cave drip water monitoring network, J. Hydrol., 587, https://doi.org/10.1016/j.jhydrol.2020.125001, 2020.
Bargués Tobella, A., Reese, H., Almaw, A., Bayala, J., Malmer, A., Laudon, H., and Ilstedt, U.: The effect of trees on preferential flow and soil infiltrability in an agroforestry parkland in semiarid Burkina Faso, Water Resour. Res., 50, 3342–3354, https://doi.org/10.1002/2013WR015197, 2014.
Berthelin, R., Rinderer, M., Andreo, B., Baker, A., Kilian, D., Leonhardt, G., Lotz, A., Lichtenwoehrer, K., Mudarra, M., Padilla, I. Y., Pantoja Agreda, F., Rosolem, R., Vale, A., and Hartmann, A.: A soil moisture monitoring network to characterize karstic recharge and evapotranspiration at five representative sites across the globe, Geosci. Instrum. Method. Data Syst., 9, 11–23, https://doi.org/10.5194/gi-9-11-2020, 2020.
Blume, H. P., Brümmer, G. W., Horn, R., Kandeler, E., Kögel-Knabner, I., Kretzschmar, R., Stahr, K., Wilke, B. M., Thiele-Bruhn, S., and Welp, G.: Scheffer/Schachtschabel: Lehrbuch der Bodenkunde, Spektrum Akademischer Verlag Heidelberg, 570 pp., ISBN 978-3-662-49959-7, 2010.
Brooks, R. H. and Corey, A. T.: Hydraulic properties of porous media, Hydrology Papers Colorado State University: Fort Collins, CO, USA, 1964.
Carrière, S. D., Chalikakis, K., Danquigny, C., Davi, H., Mazzilli, N., Ollivier, C., and Emblanch, C.: Le rôle de la matrice poreuse dans la régulation des flux d'eau dans la zone non saturée du karst: une approche hydrogéophysique intégrée, Hydrogeol. J., 24, 1905–1918, https://doi.org/10.1007/s10040-016-1425-8, 2016.
Carriere, S., Martin St-Paul, N. K., Belmys Cakpo, C., Patris, N., Gillon, M., Chalikakis, K., Doussan, C., Olioso, A., Babic, M., and Jouineau, A.: The role of deep vadose zone water in tree transpiration during drought periods in karst settings – Insights from isotopic tracing and leaf water potential, Sci. Total Environ., 699, 134332, https://doi.org/10.1016/j.scitotenv.2019.134332, 2020.
Cary, J. W. and Hayden, C. W.: An index for soil pore size disctribution, Geoderma, 9, https://doi.org/10.1016/0016-7061(73)90026-8, 249–256, 1973.
Chen, Z., Auler, A. S., Bakalowicz, M., Drew, D., Griger, F., Hartmann, J., Jiang, G., Moosdorf, N., Richts, A., Stevanovic, Z., Veni, G., and Goldscheider, N.: Le programme de la Carte Mondiale des Aquifères Karstiques: concept, procédure de cartographie et carte de l'Europe, Hydrogeol. J., 25, 771–785, https://doi.org/10.1007/s10040-016-1519-3, 2017.
Delbart, C., Valdes, D., Barbecot, F., Tognelli, A., Richon, P., and Couchoux, L.: Temporal variability of karst aquifer response time established by the sliding-windows cross-correlation method, J. Hydrol., 511, 580–588, https://doi.org/10.1016/j.jhydrol.2014.02.008, 2014.
Demand, D., Blume, T., and Weiler, M.: Spatio-temporal relevance and controls of preferential flow at the landscape scale, Hydrol. Earth Syst. Sci., 23, 4869–4889, https://doi.org/10.5194/hess-23-4869-2019, 2019.
Dorigo, W., Himmelbauer, I., Aberer, D., Schremmer, L., Petrakovic, I., Zappa, L., Preimesberger, W., Xaver, A., Annor, F., Ardö, J., Baldocchi, D., Bitelli, M., Blöschl, G., Bogena, H., Brocca, L., Calvet, J.-C., Camarero, J. J., Capello, G., Choi, M., Cosh, M. C., van de Giesen, N., Hajdu, I., Ikonen, J., Jensen, K. H., Kanniah, K. D., de Kat, I., Kirchengast, G., Kumar Rai, P., Kyrouac, J., Larson, K., Liu, S., Loew, A., Moghaddam, M., Martínez Fernández, J., Mattar Bader, C., Morbidelli, R., Musial, J. P., Osenga, E., Palecki, M. A., Pellarin, T., Petropoulos, G. P., Pfeil, I., Powers, J., Robock, A., Rüdiger, C., Rummel, U., Strobel, M., Su, Z., Sullivan, R., Tagesson, T., Varlagin, A., Vreugdenhil, M., Walker, J., Wen, J., Wenger, F., Wigneron, J. P., Woods, M., Yang, K., Zeng, Y., Zhang, X., Zreda, M., Dietrich, S., Gruber, A., van Oevelen, P., Wagner, W., Scipal, K., Drusch, M., and Sabia, R.: The International Soil Moisture Network: serving Earth system science for over a decade, Hydrol. Earth Syst. Sci., 25, 5749–5804, https://doi.org/10.5194/hess-25-5749-2021, 2021.
Fleury, P., Plagnes, V., and Bakalowicz, M.: Modelling of the functioning of karst aquifers with a reservoir model: Application to Fontaine de Vaucluse (South of France), J. Hydrol., 345, 38–49, https://doi.org/10.1016/j.jhydrol.2007.07.014, 2007.
Fu, Z. Y., Chen, H. S., Zhang, W., Xu, Q. X., Wang, S., and Wang, K. L.: Subsurface flow in a soil-mantled subtropical dolomite karst slope: A field rainfall simulation study, Geomorphology, 250, 1–14, https://doi.org/10.1016/j.geomorph.2015.08.012, 2015.
Graham, C. B. and Lin, H. S.: Controls and Frequency of Preferential Flow Occurrence: A 175-Event Analysis, Vadose Zone J., 10, 816–831, https://doi.org/10.2136/vzj2010.0119, 2011.
Gimbel, K. F., Puhlmann, H., and Weiler, M.: Does drought alter hydrological functions in forest soils?, Hydrol. Earth Syst. Sci., 20, 1301–1317, https://doi.org/10.5194/hess-20-1301-2016, 2016.
Goldscheider, N.: Karst groundwater vulnerability mapping: Application of a new method in the Swabian Alb, Germany, Hydrogeol. J., 13, 555–564, https://doi.org/10.1007/s10040-003-0291-3, 2005.
Goldscheider, N. and Drew, D. (Eds.): Methods in Karst Hydrogeology, Taylor and Francis/Balkema, London, ISBN 978-0-415-42873-6, 2007.
Goldscheider, N., Meiman, J., Pronk, M., and Smart, C.: Tracer tests in karst hydrogeology and speleology, Int. J. Speleol., 37, 27–40, https://doi.org/10.5038/1827-806X.37.1.3, 2008.
Hartmann, A., Lange, J., Vivó Aguado, À., Mizyed, N., Smiatek, G., and Kunstmann, H.: A multi-model approach for improved simulations of future water availability at a large Eastern Mediterranean karst spring, J. Hydrol., 468–469, 130–138, https://doi.org/10.1016/j.jhydrol.2012.08.024, 2012.
Hartmann, A., Weiler, M., Wagener, T., Lange, J., Kralik, M., Humer, F., Mizyed, N., Rimmer, A., Barberá, J. A., Andreo, B., Butscher, C., and Huggenberger, P.: Process-based karst modelling to relate hydrodynamic and hydrochemical characteristics to system properties, Hydrol. Earth Syst. Sci., 17, 3305–3321, https://doi.org/10.5194/hess-17-3305-2013, 2013.
Hartmann, A., Gleeson, T., Wada, Y., and Wagener, T.: Enhanced groundwater recharge rates and altered recharge sensitivity to climate variability through subsurface heterogeneity, P. Natl. Acad. Sci. USA, 114, 2842–2847, https://doi.org/10.1073/pnas.1614941114, 2017.
Hartmann, A., Jasechko, S., Gleeson, T., Wada, Y., Andreo, B., Barberá, J. A., Brielmann, H., Bouchaou, L., Charlier, J.-B., Darling, W. G., Filippini, M., Garvelmann, J., Goldscheider, N., Kralik, M., Kunstmann, H., Ladouche, B., Lange, J., Lucianetti, G., Martín, J. F., Mudarra, M., Sánchez, D., Stumpp, C., Zagana, E., and Wagener, T.: Risk of groundwater contamination widely underestimated because of fast flow into aquifers, P. Natl. Acad. Sci. USA, 118, 20, https://doi.org/10.1073/PNAS.2024492118, 2021.
Heilman, J. L., Litvak, M. E., Mcinnes, K. J., Kjelgaard, J. F., Kamps, R. H., and Schwinning, S.: Water-storage capacity controls energy partitioning and water use in karst ecosystems on the Edwards Plateau, Texas, Ecohydrology, 7, 127–138, https://doi.org/10.1002/eco.1327, 2014.
Hillel, D.: Environmental soil physics: fundamentals, applications, and environmental considerations, Academic Press, 800 pp., ISBN 9780080544151, 1998.
Ireson, A. M. and Butler, A. P.: Controls on preferential recharge to Chalk aquifers, J. Hydrol., 398, 109–123, https://doi.org/10.1016/j.jhydrol.2010.12.015, 2011.
Jeannin, P.-Y., Groves, C., and Häuselmann, P.: Speleological investigations, in: Methods in karst hydrogeology. International Contribution to Hydrogeology, IAH, vol. 26, edited by: Goldscheider, N. and Drew, D., Taylor and Francis/Balkema, London, ISBN 978-0-415-42873-6, 25–44, 2007.
Kirn, L., Mudarra, M., Marín, A., Andreo, B., and Hartmann, A.: Improved Assessment of Groundwater Recharge in a Mediterranean Karst Region: Andalusia, Spain, Advances in Karst Science, 117–125, https://doi.org/10.1007/978-3-319-45465-8_13, 2017.
Lindström, G., Johansson, B., Persson, M., Gardelin, M., and Bergström, S.: Development and test of the distributed HBV-96 hydrological model, J. Hydrol., https://doi.org/10.1016/S0022-1694(97)00041-3, 272–288, 1997.
LUBW Landesanstalt für Umwelt: Daten aus dem Umweltinformationssystem (UIS) der LUBW Landesanstalt für Umwelt Baden-Württemberg, https://udo.lubw.baden-wuerttemberg.de, last access: 11 January 2023.
Maloszewski, P., Stichler, W., Zuber, A., and Rank, D.: Identifying the fow systems in a karstic-fissured-porous aquifer, the Schneealpe, Austria, by modelling of environmental 18O and 3H isotopes, J. Hydrol., 256, 48–59, https://doi.org/10.1016/S0022-1694(01)00526-1, 2002.
Mangin, A.: Pour une meilleure connaissance des systèmes hydrologiques à partir des analyses corrélatoire et spectrale, J. Hydrol., 67, 25–43, https://doi.org/10.1016/0022-1694(84)90230-0, 1984.
Martini, E., Wollschläger, U., Kögler, S., Behrens, T., Dietrich, P., Reinstorf, F., Schmidt, K., Weiler, M., Werban, U., and Zacharias, S.: Spatial and Temporal Dynamics of Hillslope-Scale Soil Moisture Patterns: Characteristic States and Transition Mechanisms, Vadose Zone J., 14, vzj2014.10.0150, https://doi.org/10.2136/vzj2014.10.0150, 2015.
Messerschmid, C., Sauter, M., and Lange, J.: Field-based estimation and modelling of distributed groundwater recharge in a Mediterranean karst catchment, Wadi Natuf, West Bank, Hydrol. Earth Syst. Sci., 24, 887–917, https://doi.org/10.5194/hess-24-887-2020, 2020.
Mudarra, M. and Andreo, B.: Relative importance of the saturated and the unsaturated zones in the hydrogeological functioning of karst aquifers: The case of Alta Cadena (Southern Spain), J. Hydrol., 397, 263–280, https://doi.org/10.1016/j.jhydrol.2010.12.005, 2011.
Mudarra, M., Andreo, B., Marín, A. I., Vadillo, I., and Barberá, J. A.: Combined use of natural and artificial tracers to determine the hydrogeological functioning of a karst aquifer: the Villanueva del Rosario system (Andalusia, southern Spain), Hydrogeol. J., 22, 1027–1039, https://doi.org/10.1007/s10040-014-1117-1, 2014.
Mudarra, M., Hartmann, A., and Andreo, B.: Combining Experimental Methods and Modeling to Quantify the Complex Recharge Behavior of Karst Aquifers, Water Resour. Res., 55, 1384–1404, https://doi.org/10.1029/2017WR021819, 2019.
Ollivier, C., Mazzilli, N., Olioso, A., Chalikakis, K., Carrière, S. D., Danquigny, C., and Emblanch, C.: Karst recharge-discharge semi distributed model to assess spatial variability of flows, Sci. Total Environ., 703, 134368, https://doi.org/10.1016/j.scitotenv.2019.134368, 2020.
Parajka, J., Blöschl, G., and Merz, R.: Regional calibration of catchment models: Potential for ungauged catchments, Water Resour. Res., 43, W06406, https://doi.org/10.1029/2006WR005271, 2007.
Perrin, J., Jeannin, P. Y., and Zwahlen, F.: Epikarst storage in a karst aquifer: A conceptual model based on isotopic data, Milandre test site, Switzerland, J. Hydrol., 279, 106–124, https://doi.org/10.1016/S0022-1694(03)00171-9, 2003.
Radulovic, M., Stevanovic, Z., and Radulovic, M.: A new approach in assessing recharge of highly karstified terrains-Montenegro case studies, Environ. Earth Sci., 65, 2221–2230, https://doi.org/10.1007/s12665-011-1378-0, 2011.
Ries, F., Lange, J., Schmidt, S., Puhlmann, H., and Sauter, M.: Recharge estimation and soil moisture dynamics in a Mediterranean, semi-arid karst region, Hydrol. Earth Syst. Sci., 19, 1439–1456, https://doi.org/10.5194/hess-19-1439-2015, 2015.
Sappa, G., Vitale, S., and Ferranti, F.: Identifying karst aquifer recharge areas using environmental isotopes: A case study in central Italy, Geosciences (Switzerland), Geosci. J., 8, 351, https://doi.org/10.3390/geosciences8090351, 2018.
Sarrazin, F., Hartmann, A., Pianosi, F., Rosolem, R., and Wagener, T.: V2Karst V1.1: a parsimonious large-scale integrated vegetation–recharge model to simulate the impact of climate and land cover change in karst regions, Geosci. Model Dev., 11, 4933–4964, https://doi.org/10.5194/gmd-11-4933-2018, 2018.
Saxton, K. E., Rawls, W. J., Romberger, J. S., and Papendick, R. I.: Estimating Generalized Soil-water Characteristics from Texture, Soil. Sci. Soc. Am. J., 50, 1031–1036, https://doi.org/10.2136/sssaj1986.03615995005000040039x, 1986.
Schaffitel, A., Schuetz, T., and Weiler, M.: Fluxes from soil moisture measurements (FluSM v1.0): a data-driven water balance framework for permeable pavements, Geosci. Model Dev., 14, 2127–2142, https://doi.org/10.5194/gmd-14-2127-2021, 2021.
Schulla, J.: Hydrologische Modellierung von Flussgebieten zur Abschätzung der Folgen von Klimaäderungen, Geographisches Institut ETH Zürich, Zürich, Switzerland, 161 pp., 1997.
Stevanović, Z.: Karst waters in potable water supply: a global scale overview, Environ. Earth Sci., 78, 662, https://doi.org/10.1007/s12665-019-8670-9, 2019.
Tobin, B. W., Polk, J. S., Arpin, S. M., Shelley, A., and Taylor, C.: A conceptual model of epikarst processes across sites, seasons, and storm events, J. Hydrol., 596, 125692, https://doi.org/10.1016/j.jhydrol.2020.125692, 2021.
Tooth, A. F. and Fairchild, I. J.: Soil and karst aquifer hydrological controls on the geochemical evolution of speleothem-forming drip waters, Crag Cave, southwest Ireland, J. Hydrol., 273, 51–68, 2003.
Union européenne – SOeS, CORINE Land Cover, last access: 11 January 2023, 2006.
Vogel, R. M. and Kroll, C. N.: Estimation of baseflow recession constants. Water Resour. Manage., 10, 303–320, https://doi.org/10.1007/BF00508898, 1996.
WaBoA (Ed.): Wasser und Boden Atlas (WaBoA) von Baden-Wuerttemberg [Water and Soil Atlas of Baden-Wuerttemberg], Publication Umweltverwaltung Baden-Württemberg, http://www.hydrology.uni-freiburg.de/forsch/waboa/waboa2004/pages/03home/fs_home.htm (last access: 11 January 2023), 2012.
Wiekenkamp, I., Huisman, J. A., Bogena, H. R., Lin, H. S., and Vereecken, H.: Spatial and temporal occurrence of preferential flow in a forested headwater catchment, J. Hydrol., 534, 139–149, https://doi.org/10.1016/j.jhydrol.2015.12.050, 2016.
Williams, P. W.: The role of the epikarst in karst and cave hydrogeology: a review, Int. J. Speleol., 37, 1–10, https://doi.org/10.5038/1827-806X.37.1.1, 2008.
Worthington, S. R. H., Davies, G. J., and Alexander, E. C.: Enhancement of bedrock permeability by weathering, Earth. Sci. Rev., 160, 188–202, https://doi.org/10.1016/j.earscirev.2016.07.002, 2016.
Xu, C.-Y. and Chen, D.: Comparison of seven models for estimation of evapotranspiration and groundwater recharge using lysimeter measurement data in Germany, Hydrol. Process., 19, 3717–3734. https://doi.org/10.1002/hyp.5853, 2005.
Xu, Z., Massei, N., Padilla, I., Hartmann, A., and Hu, B.: Characterization, modeling, and remediation of karst in a changing environment, Environ. Earth Sci., 77, 476, https://doi.org/10.1007/s12665-018-7660-7, 2018.
Yeh, J.: One-Dimensional Steady State Infiltration in Heterogeneous Soils, Water Resour. Res., 2149–2158, https://doi.org/10.1029/WR025i010p02149, 1989.