the Creative Commons Attribution 4.0 License.
the Creative Commons Attribution 4.0 License.
 | 19 Jul 2023
Data worth analysis within a model-free data assimilation framework for soil moisture flow
Yakun Wang
Xiaolong Hu
Lijun Wang
Jinmin Li
Lin Lin
Kai Huang
Liangsheng Shi
Conventional data worth (DW) analysis for soil water problems depends on physical dynamic models. The widespread occurrence of model structural errors and the strong nonlinearity of soil water flow may lead to biased or wrong worth assessment. By introducing the nonparametric data worth analysis (NP-DWA) framework coupled with the ensemble Kalman filter (EnKF), this real-world case study attempts to assess the worth of potential soil moisture observations regarding the reconstruction of fully data-driven soil water flow models prior to data gathering. The DW of real-time soil moisture observations after Gaussian process training and Kalman update was quantified with three representative information metrics, including the trace, Shannon entropy difference and relative entropy. The sequential NP-DWA framework was examined by a number of cases in terms of the variable of interest, spatial location, observation error, and prior data content. Our results indicated that, similarly to the traditional DW analysis based on physical models, the overall increasing trend of the DW from the sequential augmentation of additional observations within the NP-DWA framework was also susceptible to interruptions by localized surges due to never-experienced atmospheric conditions (i.e., rainfall events). The difference is that this biased DW in the former is caused by model structural errors triggered by contrasting scenarios, which is difficult to be compensated for by assimilating more prior data, while this performance degradation in the NP-DWA can be effectively alleviated by enriching training scenarios or the appropriate amplification of observational noise under extreme meteorological conditions. Nevertheless, a substantial expansion of the prior data content may cause an unexpected increase in the DW of future potential observations due to the possible introduction of ensuing observation noises. Hence, high-quality and representative small data may be a better choice than unfiltered big data. Compared with the observations in the surface layer with the strongest time variability, the soil water content in the middle layer robustly exhibited remarkable superiority in the construction of model-free soil moisture models. We also demonstrated that the DW assessment performance was jointly determined by 3C, i.e., the capacity of potential observation realizations to capture actual observations, the correlation of potential observations with the variables of interest and the choice of DW indicators. Direct mapping from regular meteorological data to soil water content within the NP-DWA mitigated the adverse effects of nonlinearity-related interference, which thus facilitated the identification of the soil moisture covariance matrix, especially the cross-covariance.
- Article
(12450 KB) - Full-text XML
-
Supplement
(585 KB) - BibTeX
- EndNote


As one of the few directly observable hydrological variables, soil water content (SWC) exhibits critical importance in optimal water resource management, irrigation and drainage schemes, fertilizer application, and crop production in agriculture (Liu et al., 2011; Akhtar et al., 2019; Dobriyal et al., 2012; Gu et al., 2021). Various data assimilation (DA) approaches (Dunne and Entekhabi, 2005; Li and Ren, 2011; Reichle et al., 2008; Song et al., 2014) have been established to reconstruct the spatiotemporal dynamics of SWC from noisy or partial observations. The core of these traditional parametric filters is their reliance on repeated forward integrations of an explicitly known physical model of unsaturated flow, such as the HYDRUS (Šimùnek et al., 2006), Soil and Water Assessment Tool (SWAT) (van Dam and Feddes, 2000), and Ross models (Ross, 2003; Zha et al., 2013).
Currently, the ever-increasing availability of multi-source data from remote sensing (Montzka et al., 2011; Shi et al., 2011), ground-based measurements (Li et al., 2018; Shuwen et al., 2005; Yang et al., 2000) and numerical modeling has paved the way for the development of fully data-driven techniques within the DA framework. In particular, recent advances in machine-learning-based DA schemes (Brajard et al., 2020, 2021; Yamanaka et al., 2019) offer exciting new opportunities for extracting patterns and insights of soil moisture dynamics from data (Ju et al., 2018; Li et al., 2020; Liu et al., 2020; Wang et al., 2021a). For instance, Kashif Gill et al. (2007) proposed a hybrid DA methodology that combined support vector machines and the ensemble Kalman filter (EnKF) for soil moisture dynamics. Li et al. (2020) compared the performance of a physical-based model with DA and machine learning methods in terms of the simulation of soil water dynamics under synthetic and real-world conditions. Wang et al. (2021a, b) further attempted to learn unknown relationships between SWC, as well as its spatio-temporal gradients and highly accessible data, via the Gaussian process (GP) regression.
Notwithstanding the success of these model-free DA schemes built on machine learning for unsaturated flow, essential caveats and limitations have hampered their further adoption and impact. First, the amount of data required to infer nonlinear relationships in unsaturated flow problems may be overwhelming (Hughes, 1968), thus greatly increasing the data collection budget. Subsequently, addressing the abovementioned explosive data growth is also a challenging and time-demanding task requiring an extensive computational infrastructure. Second, the performance and quality of the knowledge extracted by machine learning algorithms are highly dependent on the quality and suitability of data (García-Gil et al., 2019). Unfortunately, data gathering is rarely perfect, and data corruption often occurs (Wang et al., 2018). The identification of the multi-source SWC data quality or measurement error is not an easy task. This limitation can instead create extra uncertainties in DA systems (Kisekka et al., 2015). Third, it is the diversity of scenarios contained in prior data rather than its volume that is more decisive for the generalization ability of machine learning methods (Wang et al., 2020). Direct data fusion without screening may instead induce accidental correlations in learning algorithms, thereby diminishing their generalization ability (García et al., 2016). To avoid the overloaded monitoring cost due to redundant data, it is essential to develop a framework to assess the worth of alternative sampling strategies prior to data collection.
The data worth, sometimes called the data information content or data impact, of a design is often defined as its individual capacity to reduce uncertainty associated with a prediction goal or to maximize some related measure of data utility. Over the past decades, two main types of sophisticated DW analysis frameworks have been proposed to identify the most informative monitoring strategy in hydrology, namely, one type based on sensitivity analysis (Dausman et al., 2010; Fienen et al., 2010; Hill and Tiedeman, 2006) and the other within a fully Bayesian framework (Dai et al., 2016; Neuman et al., 2012; Nowak et al., 2012). The former approaches are computationally fast, but these methods require model calibration and assume linear models (Finsterle, 2015). The latter methods are derived based on the law of the total possibility without assumptions of the model and of the distributions of observations and model parameters. Nevertheless, both well-established frameworks are predicated on the availability of the underlying physical models. For example, Man et al. (2016) evaluated the expected value of alternative SWC sampling strategies with respect to the estimation of soil hydraulic parameters in the HYDRUS-1D model, while Finsterle (2015) examined the worth of datasets potentially applicable to the calibration of geothermal reservoir models. Within such parametric data worth analysis frameworks, however, the strong nonlinearity of soil water problems (Lannoy et al., 2006; Leube et al., 2012; Yeh et al., 1985) and the prevalence of model structural errors (Zhang et al., 2019) are highly likely to lead to biased data worth (Wang et al., 2018, 2020). Ultimately the reliability of the optimal design of monitoring networks based on such evaluations is greatly compromised.
Fortunately, the superiority of data-driven algorithms in handling nonlinearities and structural errors in unsaturated flow has been well demonstrated in our previous studies (Wang et al., 2021a, b). With the explosive growth of big data, how to evaluate the worth of multi-source data in this new data-mining approach is becoming a critical issue. Several recent works in the field of statistical learning have bloomed in identifying and removing irrelevant and redundant information from big data, such as feature selection (Chandrashekar and Sahin, 2014; Hall, 1999) and instance reduction (Amro et al., 2021; Olvera-López et al., 2010). To the best of our knowledge, few studies have systematically evaluated the worth of future observations regarding the construction of fully data-driven models prior to data gathering. As a follow-up study to Wang et al. (2018, 2020), one major contribution of this study is the first embedding of a purely data-driven model into the Bayesian data worth analysis framework, referred to as the nonparametric data worth analysis (NP-DWA). Similarly to traditional DW analysis, the proposed NP-DWA consists of prior, posterior and pre-posterior stages (Dai et al., 2016). The pre-posterior analysis evaluates the anticipated worth of future observations regarding the construction of purely data-driven models, for which possible distributions are predicted in advance by conditioning on prior data.
There is a consensus in the field of statistics that “the highest accuracy results that an inductive learning system can achieve depend on the quality of data and the appropriate selection of a learning algorithm for the data” (Pechenizkiy et al., 2006). In other words, once the algorithm is specified, the significance of data noise to learning accuracy as almost the only factor should not be overlooked. Considering the powerful ability of dealing with observational noises of the ensemble Kalman filter (EnKF) (Hamilton et al., 2017; Li et al., 2018), another innovation of this study is the introduction of EnKF into our NP-DWA framework. In conventional DW analysis, the worth of data is primarily embodied in its ability to be utilized or calibrated to adjust physical parameters (Dai et al., 2016; Finsterle, 2015; Man et al., 2016). In the proposed NP-DWA, nevertheless, future observations are first used to construct data-driven models in the forecast step and then are sequentially assimilated with the Kalman update in the analysis step. Ultimately, its combined capacity to reduce system uncertainties in these two ways is defined as its worth. Furthermore, as a typical sequential DA scheme, the EnKF facilitates the dynamic models and also its hyperparameters to be updated in real time so the data utility in relation to the modeling system can be detected instantaneously. Eventually, the sampling scheme can be dynamically adjusted to save the monitoring and analysis costs.
Most previous studies are based on synthetic cases, and data worth analysis in the context of dynamically evolving soil moisture profiles was still poorly studied in a real-world case. For nonlinear problems, nevertheless, the estimation variance and more sophisticated measures of data utility depend on the actual values of measurements, which are still unknown prior to collection (Leube et al., 2012). It will be more convincing to investigate the data worth regarding the reconstruction of fully data-driven models under real-world cases for unsaturated flow. With the aid of observed data retrieved from three typical stations with different climate regimes, we aim to shed light on the following questions: (1) as opposed to the traditional way of utilizing data (to calibrate physical parameters), is the worth of observations capable of being accurately quantified by NP-DWA in this new, purely data-driven approach? (2) Given multiple prediction objectives, how does the DW (in the form of various indices) evolve under different hydrometeorological conditions in the determination of fully data-driven soil moisture dynamics? (3) How does the proposed NP-DWA respond to the presence of multiple levels of data noise? We intend for this study to provide guidance in the design of future monitoring strategies within the fully data-driven soil water flow models for real-world problems.
The remainder of this paper is organized as follows: Sect. 2 first summarizes the experimental data and methods. Thereinto, the principles of Bayesian DW analysis, nonparametric DA and the hybrid framework are detailed. Section 3 presents the results, and a discussion is contained in Sect. 4. Finally, conclusions are outlined in Sect. 5.
In Wang et al. (2021a), a nonparametric sequential data assimilation scheme (Kalman-GP) has been proposed based on the filtering equations of EnKF and data-driven modeling with GP. On top of that, this paper further develops a nonparametric data worth analysis framework to assess the potential worth of future observations in the reconstruction of dynamical soil water flow models prior to data collection. In our proposed NP-DWA framework, the mapping from the input vector x and state variable of interest y is approximated by the GP regression model. In this study, the target output y is the soil moisture, while the entries of x include the corresponding observation time, depth, daily precipitation and air temperature. Thus, here, the dimension of input x is d=4. Similarly to the Kalman-GP in Wang et al. (2021a), EnKF is implemented to update the forecast yield by GP models by assimilating real-time observations of soil moisture. On the one hand, this fusion can effectively reduce the risk of unreasonable spatio-temporal interpolation in GP models, ultimately enhancing the robustness of such purely data-driven models. On the other hand, by combining with the Kalman update, the forecast cross-covariance between the state and the predictions corresponding to available observations constrained the otherwise high error covariances of state variables at unobserved locations, which resulted in a significantly reduced uncertainty for this hybrid method relative to GP alone. More details can be found in Wang et al. (2021a). In addition, to demonstrate the generalizability of the NP-DWA, other machine learning algorithms (including support vector machine and random forest) and DA schemes (i.e., particle filter) are also employed to replace GP and EnKF, respectively. The specific details of these algorithms are not presented here, but the corresponding results are provided in the Supplement.
2.1 Construction of GP dynamic models
As stated in Wang et al. (2021a), N GP models are constructed independently at each time step in a sequential manner as new data are recorded. N is the ensemble size. Thereinto, the observed time series is corrupted by the prescribed observation noises satisfying Gaussian distribution to obtain N sets of training data. Here, we only take the procedure of building the mth GP model at any time t=k as an example, i.e., (m=1, 2, …, N). The superscript m will be omitted below for ease of expression.
At t=k, the input and output of training data in GPk can be expressed as follows:
where and denote a collection of all available x and y from t=1 to (k−1), respectively; qp denotes the number of available observations at t=p (p=1, 2, …, k−1). In this paper we assume that the number of available observations at each time step is identical, i.e., . Hence the dimensions of matrix Xk−1 and vector yk−1 are and q(k−1), respectively.
As defined in Rasmussen (2004) and Rasmussen and Williams (2006), a GP model can be fully specified by a mean function μ(x) and covariance function , i.e., . In this study, a linear mean function and an anisotropic squared exponential covariance function are specified (Zhang et al., 2019) as follows:
where β is a vector containing d linear coefficients, i.e., . σ2 controls the marginal variance in the output, and determines the dependence strength in each of the component directions of x.
Then, the hyperparameters of the GPk, , can be inferred from the training datasets via log marginal likelihood maximization:
where μ denotes the prior mean vector with the dimension of q(k−1), and Σ denotes the covariance matrix whose elements in the ith row and jth column constitute (i=1, 2, …, q(k−1); j=1, 2, …, q(k−1)). The GPML MATLAB toolbox (version 4.2), as documented in Rasmussen and Williams (2006), was adopted for GP inference in this study (http://www.gaussianprocess.org/gpml/code/matlab/doc/, last access: 15 July 2023).
In this study, the entire soil moisture profile at t=k is expected to be forecasted. Assuming that the total number of nodes of the vertical one-dimensional soil profile is Nn, then the input at the current time step is with the dimension of Nn×d. The corresponding output vector with the dimension of Nn can be calculated as follows:
where μ* denotes the prior mean of with the dimension of Nn, and Σ∗ is calculated as (i=1, 2, …, Nn; j=1, 2, …, q(k−1)).
As a collection of from N GP models, the resultant forecasted state vector at t=k can be represented as follows:
where denotes the forecasted state vector of interest for (m=1, 2, …, N); the dimension of is N×Nn; the superscript “f” denotes forecast.
2.2 The Kalman update in a nonparametric data assimilation scheme
In the analysis step of the EnKF, for any ensemble member m at t=k, the state vector can be updated by combing GP model predictions and observations :
where denotes the improved estimates for realization m by conditioning on the observed information at t=k; H is the observation operator with the dimension of q×Nn, which represents the relationship between the state and observation vectors; the superscript “a” indicates analysis, and with the dimension of q denotes the observation vector at t=k for the mth ensemble member of . It should be emphasized that the relationship between observations at t=k, and their true values can be expressed as follows:
where εk with the dimension of N×q represents the measurement error vector which is assumed to be zero-mean Gaussian with Rk; Rk denotes the error covariance matrix of the observations with the dimension of q×q.
The Kalman gain at t=k, Kk, with the dimension of Nn×q can be defined as follows:
where with the dimension of Nn×Nn is the covariance matrix of the state vector at t=k, which can be approximated as follows:
where denotes the ensemble mean of .
2.3 Nonparametric data worth analysis framework
Following the methodologies of Neuman et al. (2012) and Dai et al. (2016), data worth analysis of future monitoring networks within the aforementioned NP-DWA framework also consists of three stages. The whole workflow of the NP-DWA framework is depicted in Fig. 1.
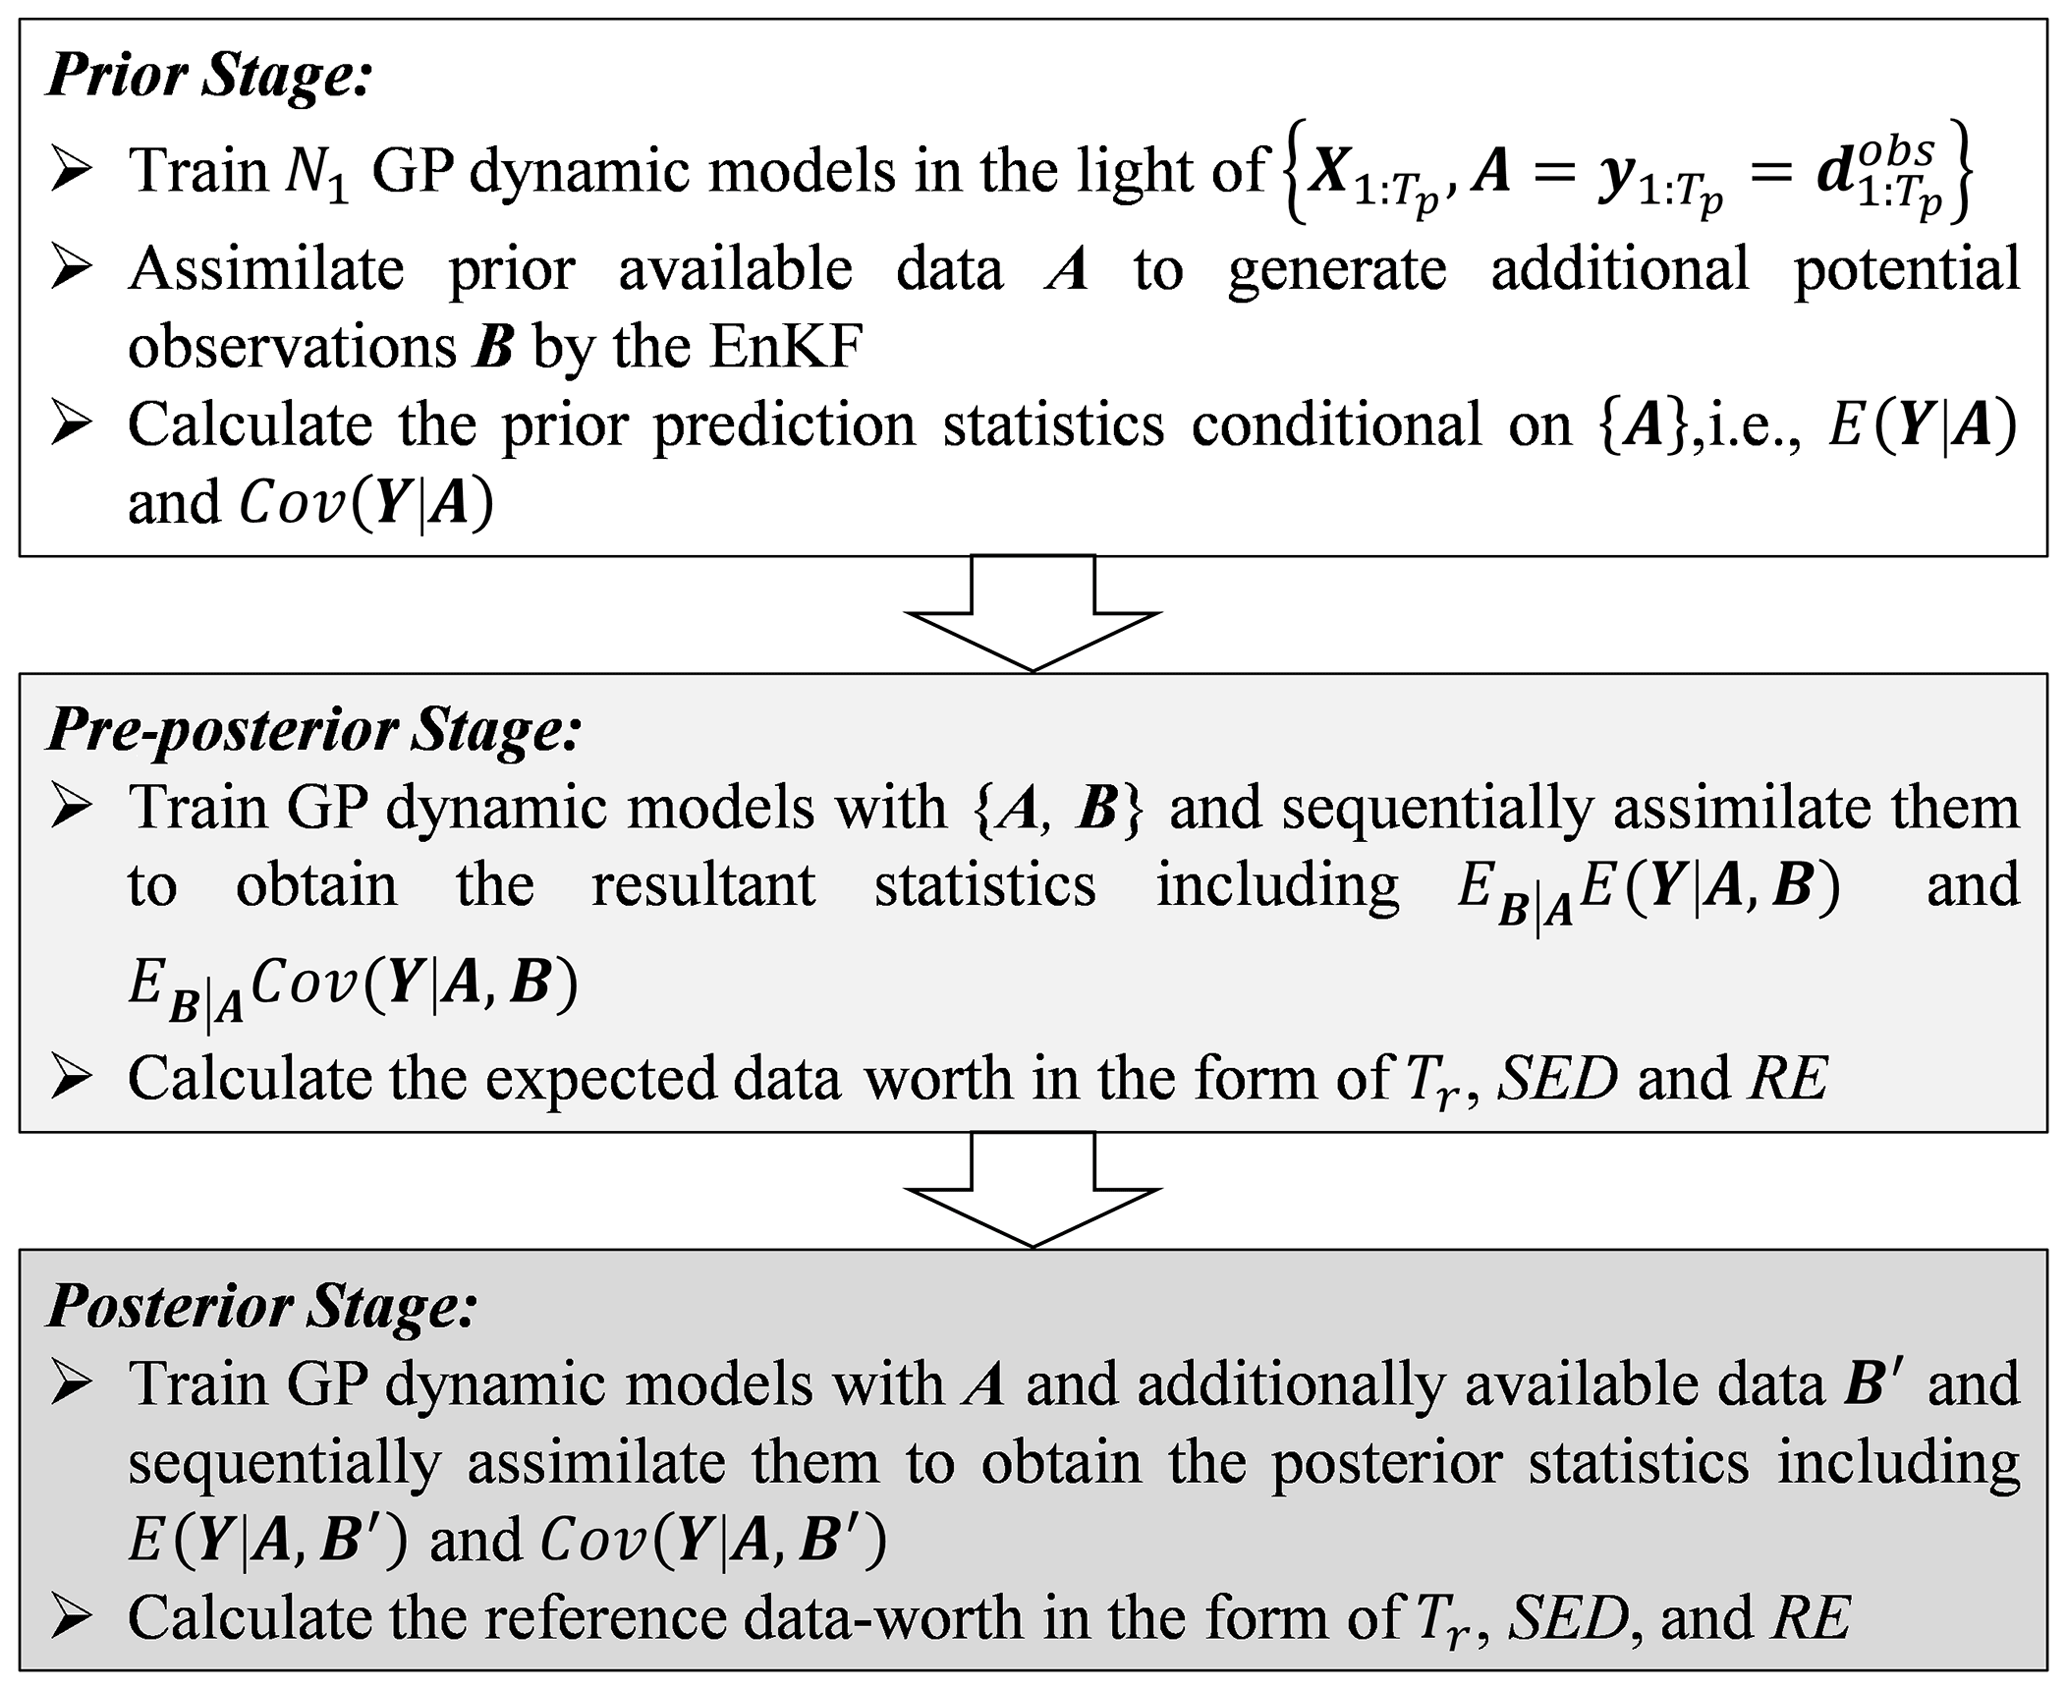
Figure 1The workflow of nonparametric data worth analysis framework coupled with ensemble Kalman filter (EnKF).
2.3.1 Prior stage
At the prior stage (), the integration of GP dynamic models and EnKF with an ensemble size of N=N1 is implemented to sequentially train and assimilate the prior data via Eqs. (1)–(11). Here, all available prior datasets from t=0 to t=Tp are denoted as vector with the dimension of qTp, while the corresponding GP input is denoted as matrix with the dimension of qTp×d. Then, a set of N1 hypothetical observations can be generated, denoted as (; i=1, 2, …, N1), via Eq. (6). Tt is the total simulation time. Moreover, prior prediction statistics (mean and covariance) of the posterior vector Yk, i.e., E(Y|A) and Cov(Y|A), can be yielded conditional on {A}, which can be denoted as E1 and C1, respectively, for the sake of simplicity.
2.3.2 Pre-posterior stage
At the pre-posterior stage (), for each possible data Bk,i at t=k, N2 realizations satisfying a Gaussian distribution are further generated. The ensemble mean is the value of Bk,i, while the variance is the measurement error. Since this method is recursive, the time index k is omitted in the following equations. Then, the integration of GP models and EnKF is again implemented through a set of N2 Monte Carlo realizations for each of the N1 hypothetical observations. This allows us to calculate prediction statistics of the posterior state vector Yij (i=1, 2, …, N1; j=1, 2, …, N2), i.e., E(Yi|A, Bi) and Cov(Yi|A, Bi), conditional on {A, Bi}. Finally, quantities EB|AE(Y|A, B), EB|ACov(Y|A, B) and CovB|AE(Y|A, B) can be yielded by averaging over the collection of N1×N2 realizations. It should be emphasized that EB|AE(Y|A, B) and EB|ACov(Y|A, B) represent the pre-posterior prediction mean and uncertainty after the addition of future possible data B, which can be denoted as E2 and C2, respectively.
To quantify the expected data worth of potential measurements, three commonly considered information metrics, namely the trace (Tr), Shannon entropy difference (SED) and relative entropy (RE), are introduced in this study. Tr and SED offer scalar indices to measure the decrease in variance and covariance, respectively, while the RE comprehensively quantifies both mean and covariance effects.
(1) Trace
As a scalar indicator (Dai et al., 2016), Tr quantifies the DW in terms of variance reduction as follows:
where Tr(*) denotes the trace (sum of the diagonal entries) of a matrix.
(2) Shannon entropy difference
According to Shannon (1949), the Shannon entropy (SE) of PDF p(x) can be defined as follows:
The SED between the prior and pre-posterior PDFs can also be considered to quantify the information content extracted from additional observations. Assuming that these two PDFs are both Gaussian in the EnKF model, the SED can be expressed in terms of covariance reduction (Xu, 2007) as follows:
where det(*) is the determinant of a matrix.
(3) Relative entropy
Similar to the SED, the RE also provides a measure of the information content of the pre-posterior PDF with respect to the prior PDF. In addition to uncertainty reduction, the influence of future data on the mean behavior of PDFs is considered (Singh et al., 2013; Zhang et al., 2015). Considering that the prior and pre-posterior PDFs are n-dimensional Gaussian functions, the RE can be defined as follows:
Finally, the expected DW of Bk can be estimated in the form of the above three indices prior to data gathering. Similar procedures are repeated until the final time t=Tt is reached.
2.3.3 Posterior stage
At the posterior stage (), the available actual dataset B′ is incorporated into the GP training datasets and assimilated in a sequential manner. The actual mean and covariance of posterior state vector Y, i.e., and , respectively, are obtained conditional on . The reference data worth in the form of the various indices can be calculated via Eqs. (12)–(15), where E2 and C2 are replaced with and , respectively.
3.1 Data sources and site description
Three typical sites, namely Falkenberg (52.1669∘ N, 14.1241∘ E), Cape_Charles_5_ENE (37.2907∘ N, 75.9270∘ W – hereafter referred to as Cape), and DAHRA (15.4035∘ N, 15.4320∘ W), were selected from the International Soil Moisture Network (ISMN, 2023) to evaluate the performance of the proposed NP-DWA framework under different soil types and climatic regimes. According to the dominant fraction of clay, silt and sand for two layers (topsoil: 0.0–0.3 m, subsoil: 0.3–1.0 m) provided by the ISMN, we use the United States Department of Agriculture (USDA) soil texture classification and classified the soil at three sites. The soil at Falkenberg is sandy loam, and the DAHRA soil is loamy sand. The topsoil and subsoil at Cape are clay loam and loamy clay, respectively. At these three sites, the in situ volumetric SWC was operationally measured with the TRIME-EZ (IMKO), the Stevens Hydraprobe II SDI-12 (Stevens Water Inc.) and the ThetaProbe ML2X (Delta-T Devices) instruments, respectively. The measurement depths were (1) 0.08, 0.15, 0.30, 0.45, 0.60 and 0.90 m at the Falkenberg site; (2) 0.05, 0.10, 0.20, 0.50 and 1.00 m at the Cape site; and (3) 0.05, 0.10, 0.50 and 1.00 m at the DAHRA site. The measurement error was artificially specified to be 0.02 cm3 cm−3 unless otherwise specified.
Apart from soil water measurements at different depths, the daily precipitation and air temperature at the height of 2 m were obtained from the ISMN. At each site, 200 d time series (from 15 January and 2 August 2005 at the Falkenberg site, from 24 April to 9 November 2004 at the Cape site and from 9 April to 25 October 2011 at the DAHRA site) were collected in this study, as shown in Fig. 2. Having a continental climate, the Falkenberg receives frequent but less intense precipitation during the simulation period. The Cape has a humid subtropical climate with the highest rates of rainfall among the three sites, and there were a few rainstorm events during the study period (e.g., up to 150 mm d−1 on 8 September 2014). The region of DAHRA has a tropical climate with well-defined dry and humid seasons. The early stage of the simulation is in its dry season, with little to no rainfall. The late stage is in its humid season when frequent but less intense rainfall events occur and the daily average air temperature is about 30 ∘C.
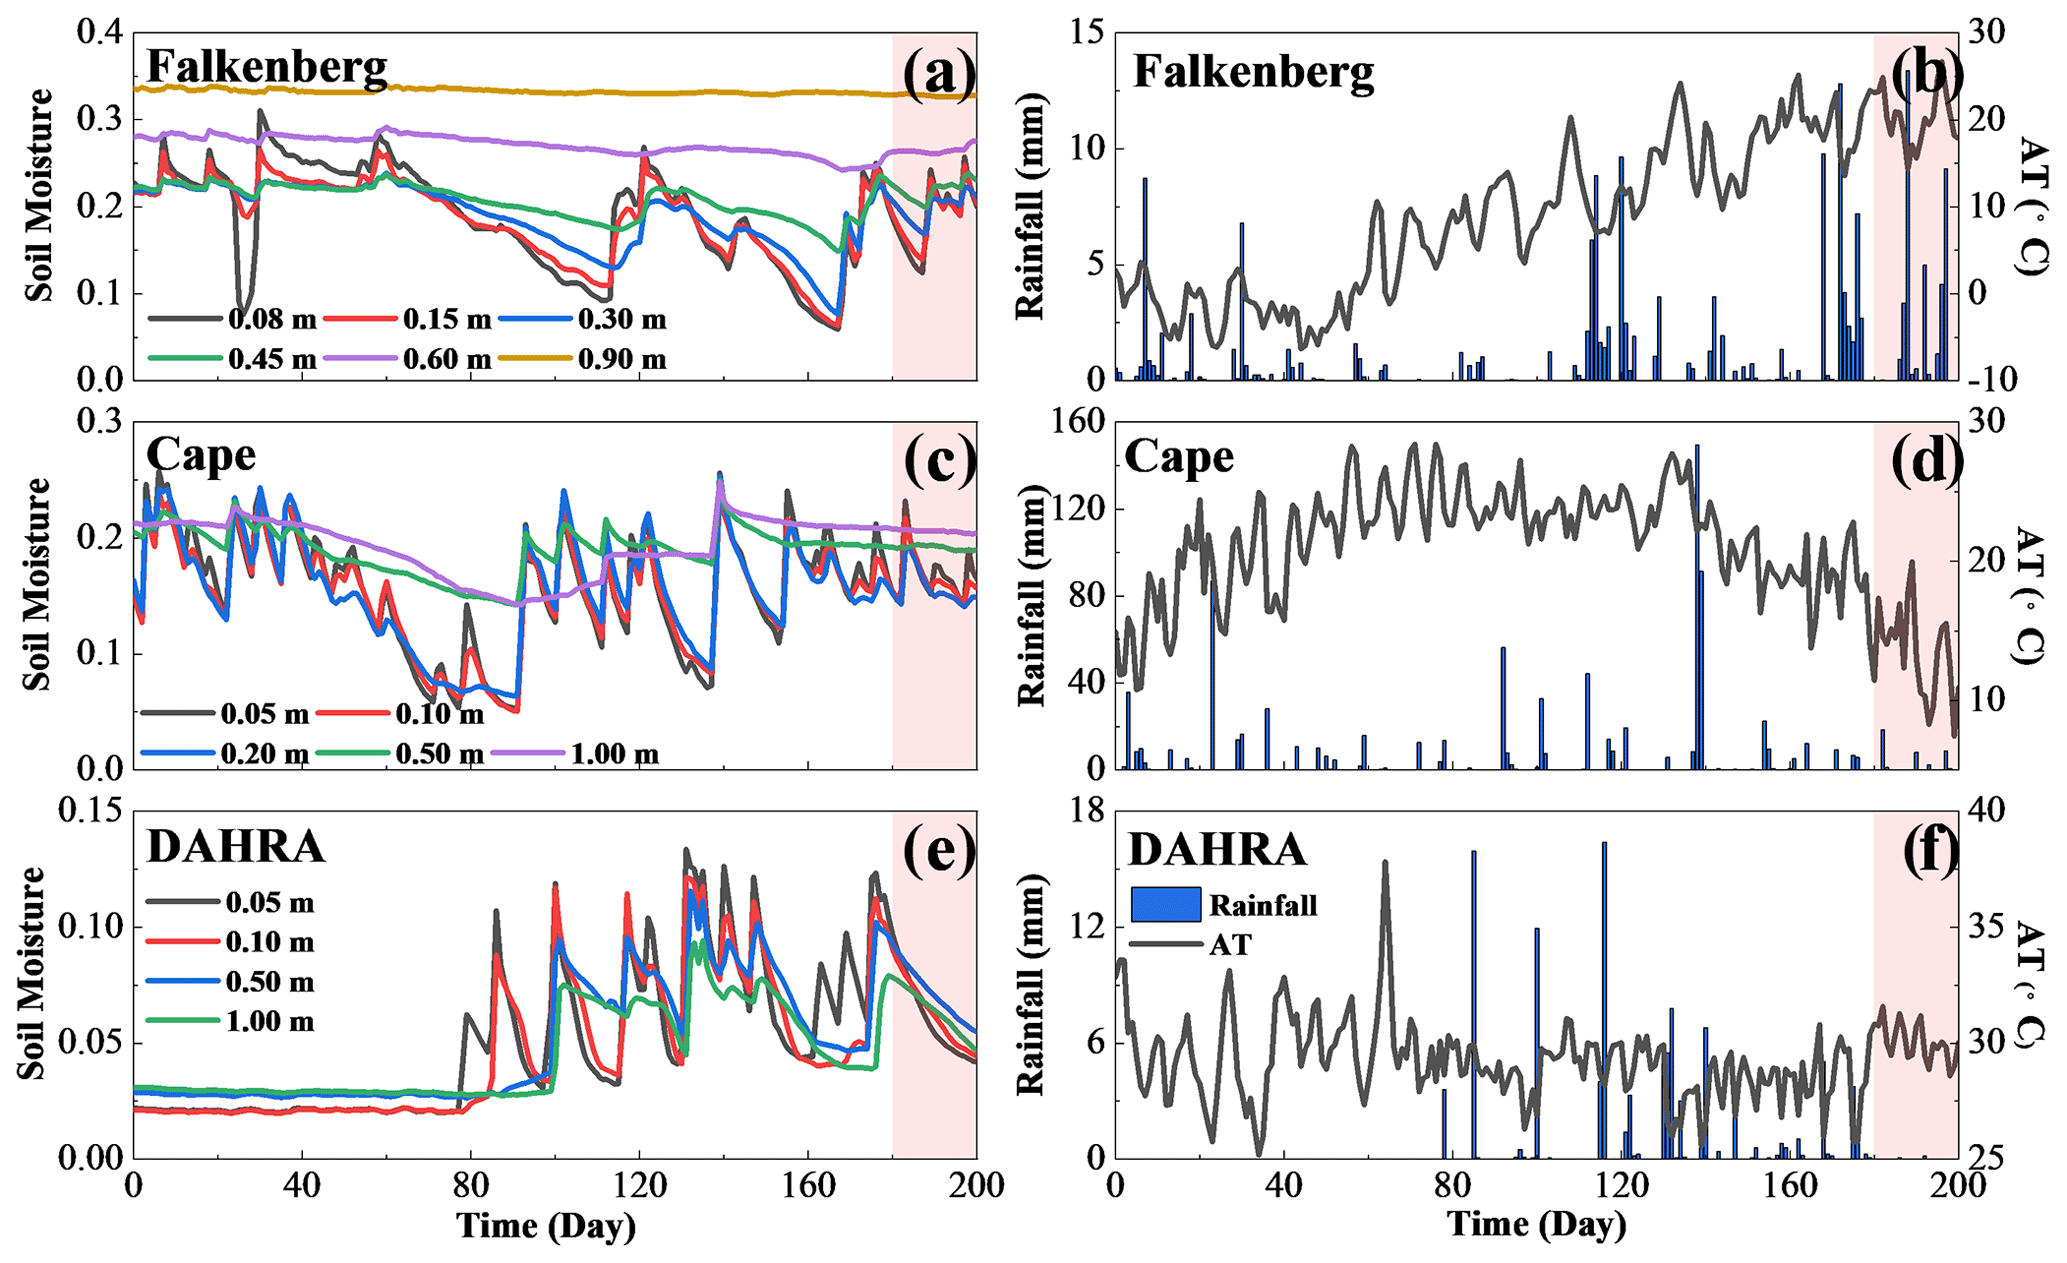
Figure 2The temporal evolutions of soil moisture at various depths, daily rainfall and mean daily air temperature (AT) at 2 m height at Falkenberg, Cape and DAHRA, respectively. Note that the red area indicates the pre-posterior or posterior stage.
3.2 Model simulation setup and case design
The key parameters of this study are summarized in Table 1. Each site is represented by a one-dimensional soil column with a height of 1 m, which is discretized into 2 cm grids with the local refinement of 1 cm monitoring-depth intervals, i.e., z=0.15 m and 0.45 m at the Falkenberg site and z=0.05 m at the Cape and DAHRA sites. At each time step, N1=50 GP-based dynamic models of unsaturated flow are constructed. The GP model input x includes the observation time, depth, daily precipitation and air temperature, while the output is the corresponding soil moisture. The state vector y comprises the soil moisture for all nodes at each site, and the trained and assimilated observations dobs refer to the available soil moisture at all observed depths (as described in Sect. 3.1).
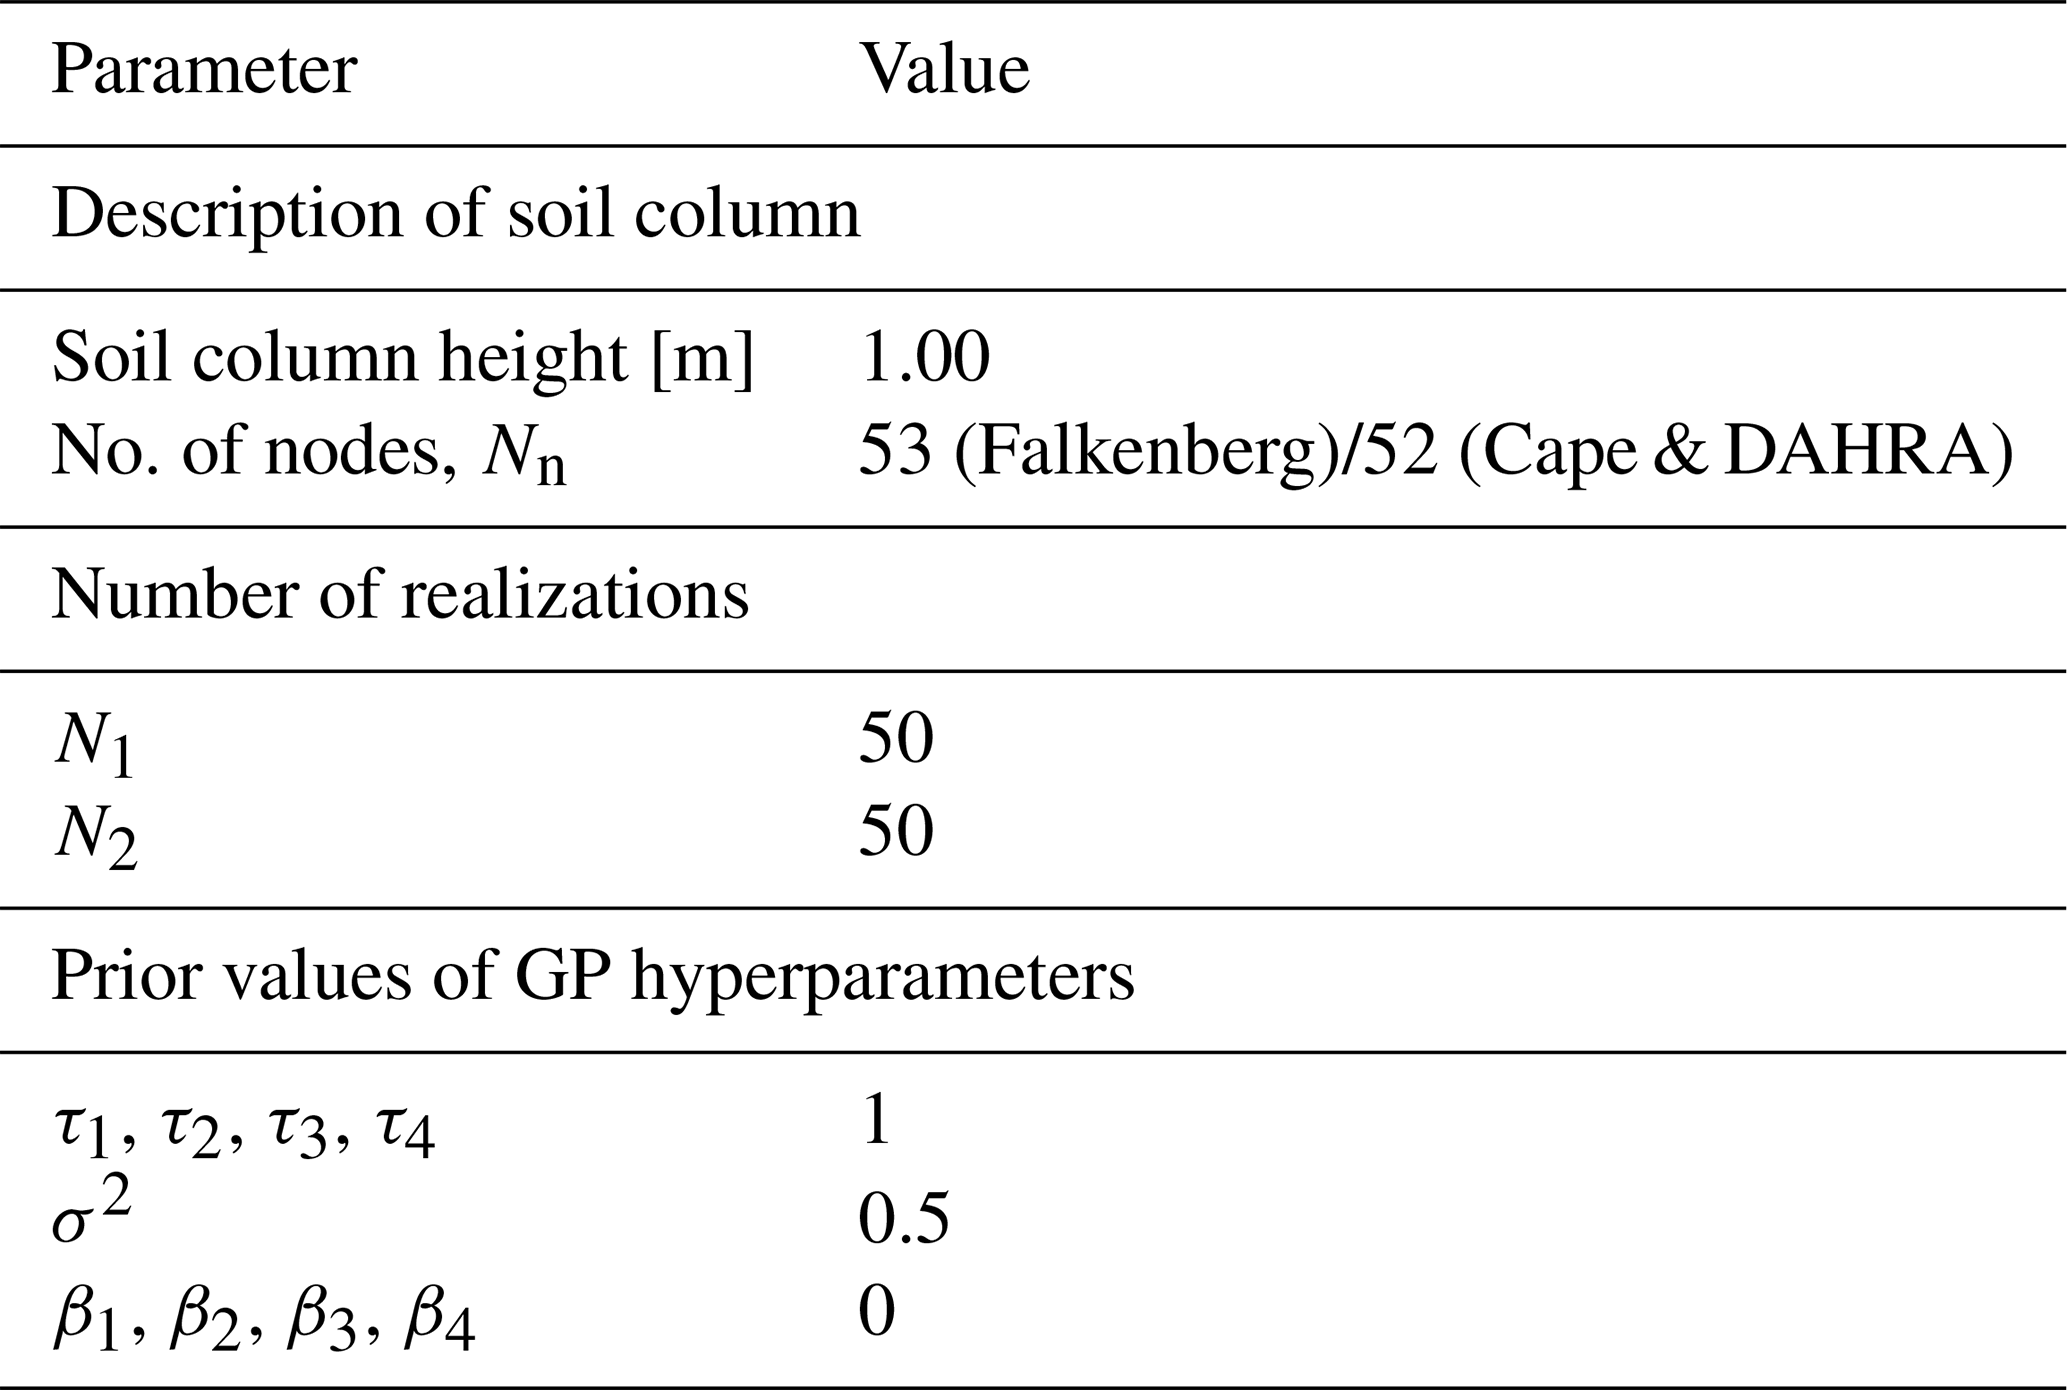
Table 2The summary of designed test cases and main characteristics.
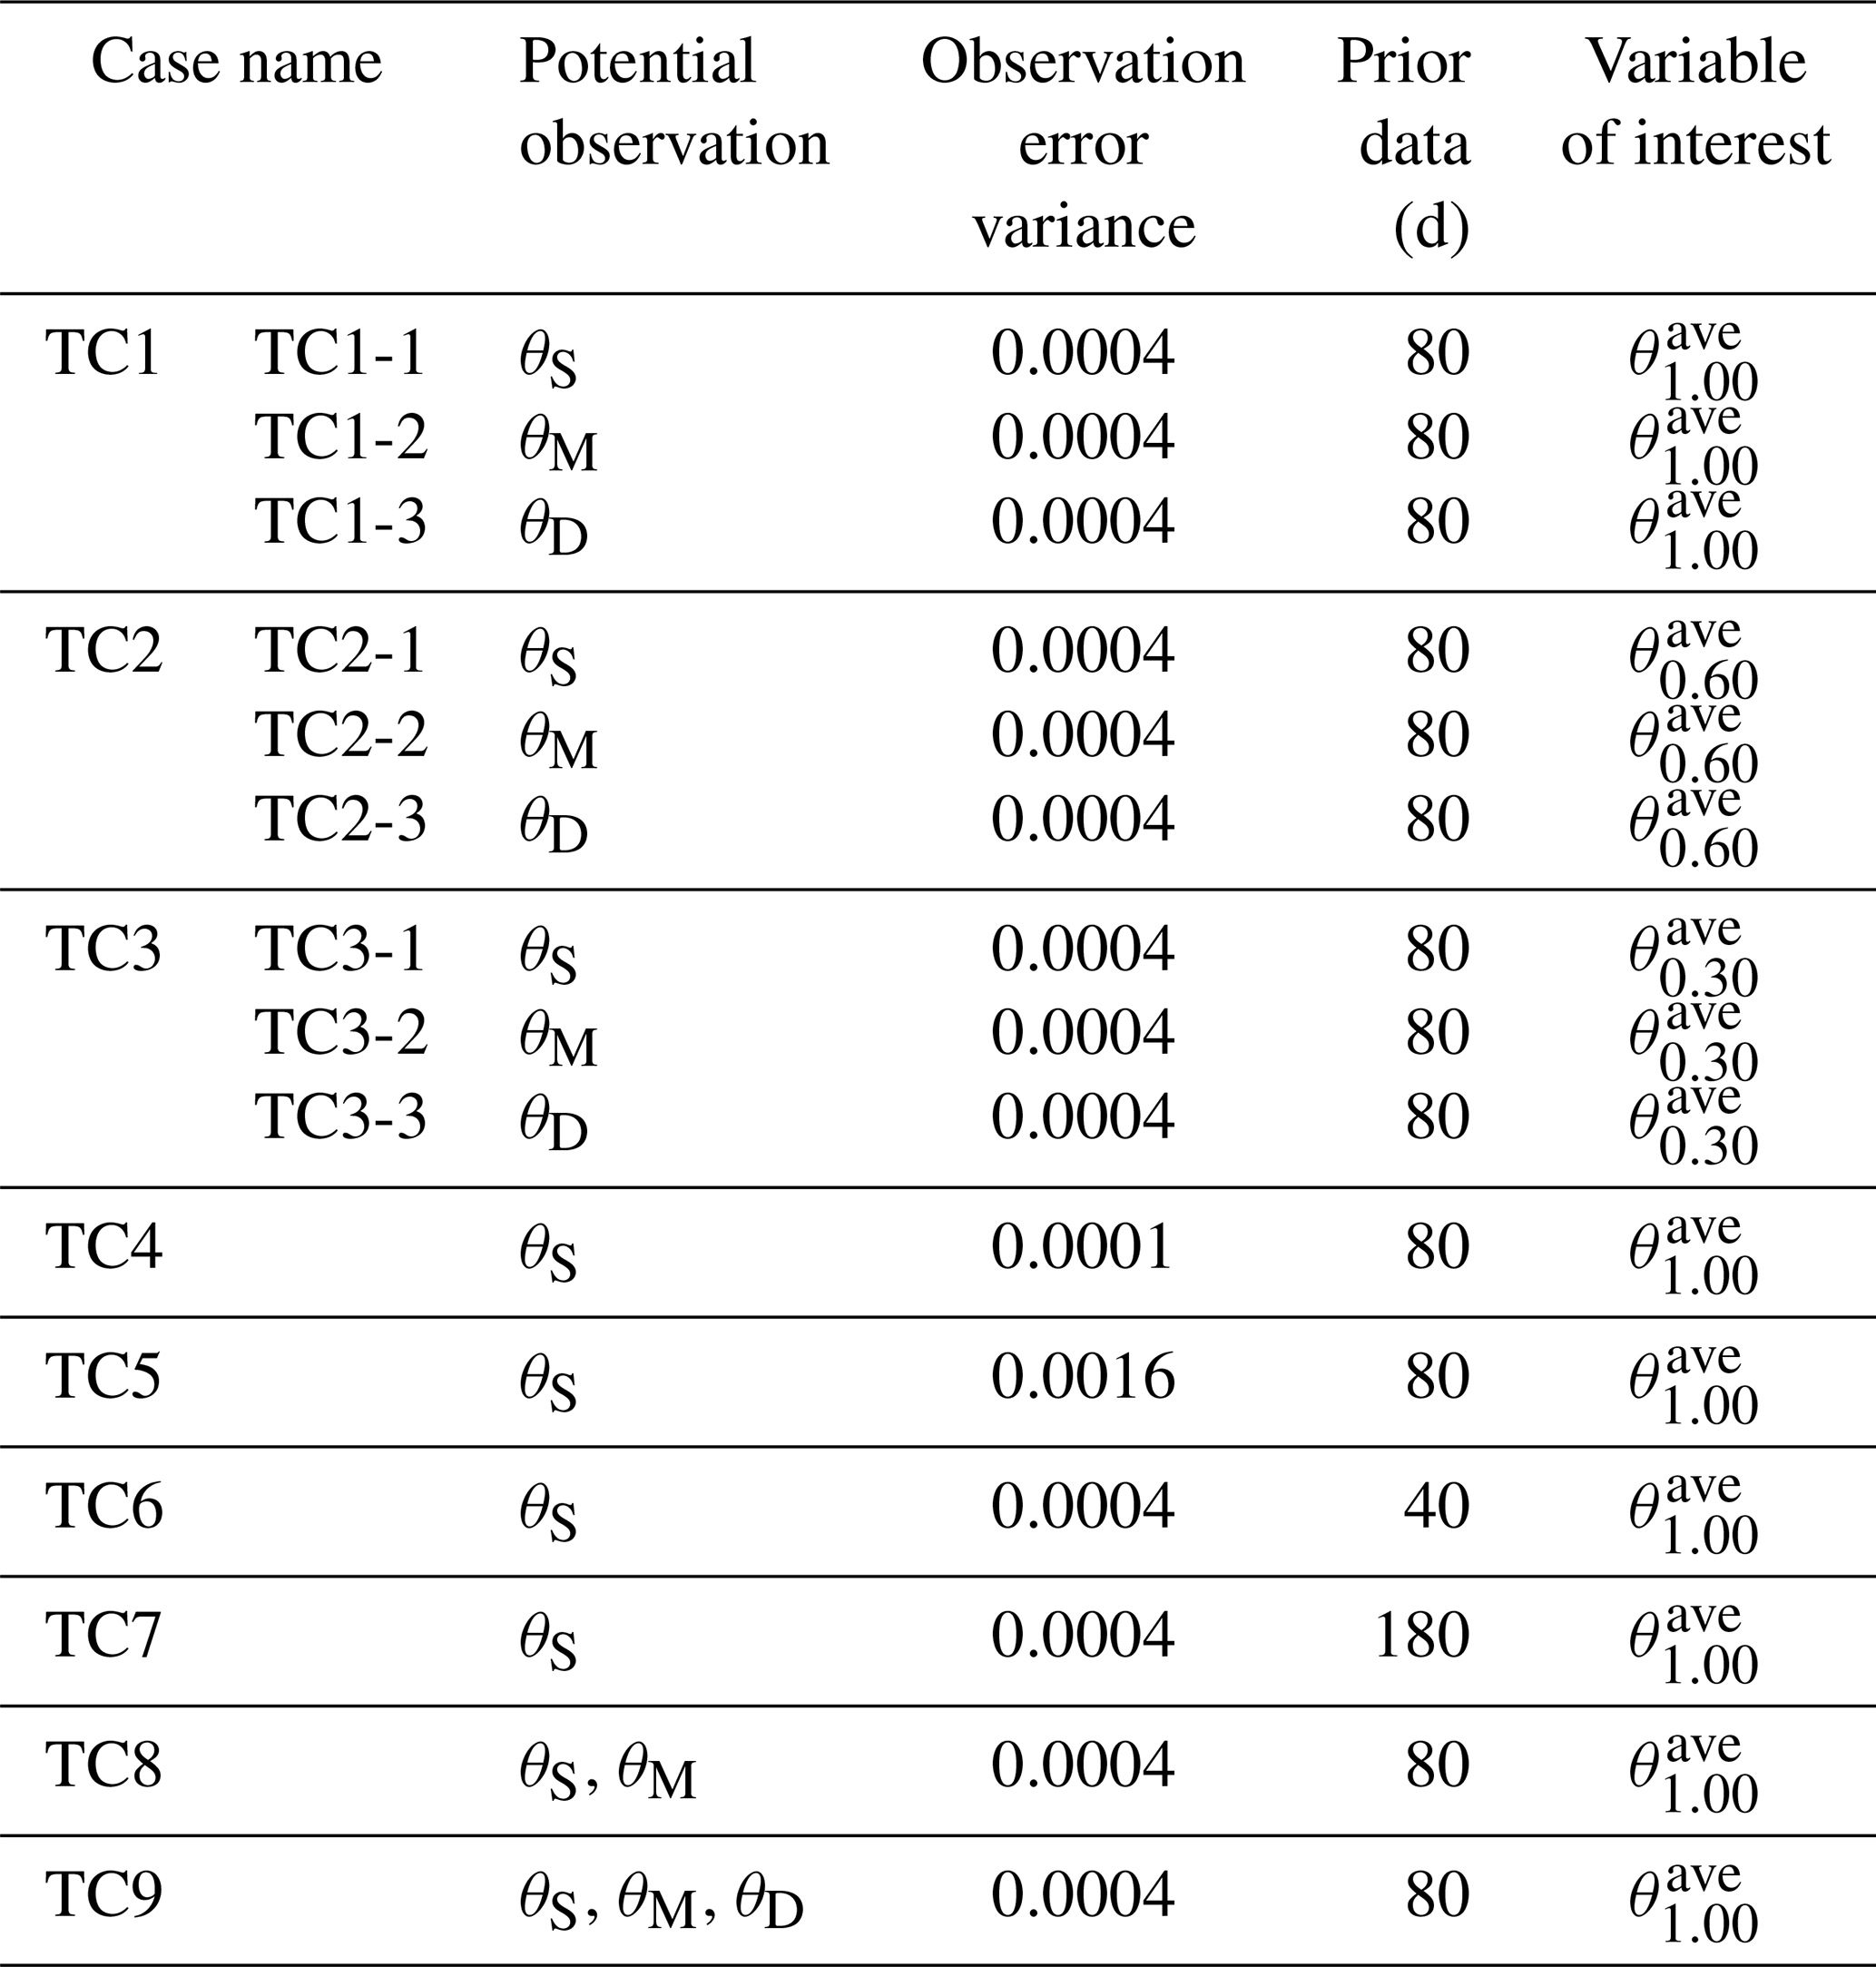
We illustrate our approach based on a set of real-world test cases, as listed in Table 2. The performances of the three indices, namely, Tr, SED and RE, in data worth quantification are compared at all three sites. In all test cases of this study, prior data for training GP includes the soil water content at all observed depths during the prior stage (from t=1 to t=Tp), i.e., z=0.08, 0.15, 0.30, 0.45, 0.60 and 0.90 m at Falkenberg; z=0.05, 0.10, 0.20, 0.50 and 1.00 m at Cape; and z=0.05, 0.10, 0.50 and 1.00 m at the DAHRA. At the pre-posterior or posterior stage in the NP-DWA, the worth of potential observations regarding the retrieval of three quantities of interest, including , and , is evaluated. Here, , and represent the average soil moisture in the top 1.00, 0.60 and 0.30 m, respectively. A comparison among cases TC1, TC2 and TC3 is designed to investigate the data worth response of surface (θS), middle (θM) and deep (θD) SWC regarding the above different prediction objectives. Specifically, θS refers to soil moisture at z=0.08 m at Falkenberg and at z=0.05 m at Cape and DAHRA, respectively. θM refers to soil moisture at z=0.45 m at Falkenberg and at z=0.50 m at Cape and DAHRA, respectively. θD refers to soil moisture at z=0.90 m at Falkenberg and at z=1.00 m at Cape and DAHRA, respectively. The prior datasets entering these cases comprise SWC, daily precipitation and air temperature over the first 80 d, as shown in the gray areas of Fig. 2. The subsequent 20 d data (red areas in Fig. 2) are augmented as additional data for reference DW assessment in the posterior stage.
As stated in Pechenizkiy et al. (2006) and Zhu and Wu (2004), the maximum accuracy of statistical learning algorithms mainly depends on the quality of training data in addition to the inherent bias in the algorithm itself. In other words, the magnitude and accuracy of the expected worth of driving data in machine-learning-based DA may be closely related to the noise level. Thus, two additional test cases (TC4 and TC5) are considered to evaluate the performance of the proposed NP-DWA framework under different measurement errors. The soil moisture measurement error variance values of 0.012 and 0.042 are artificially specified in TC4 and TC5, respectively, to be compared to a value of 0.022 in TC1-1.
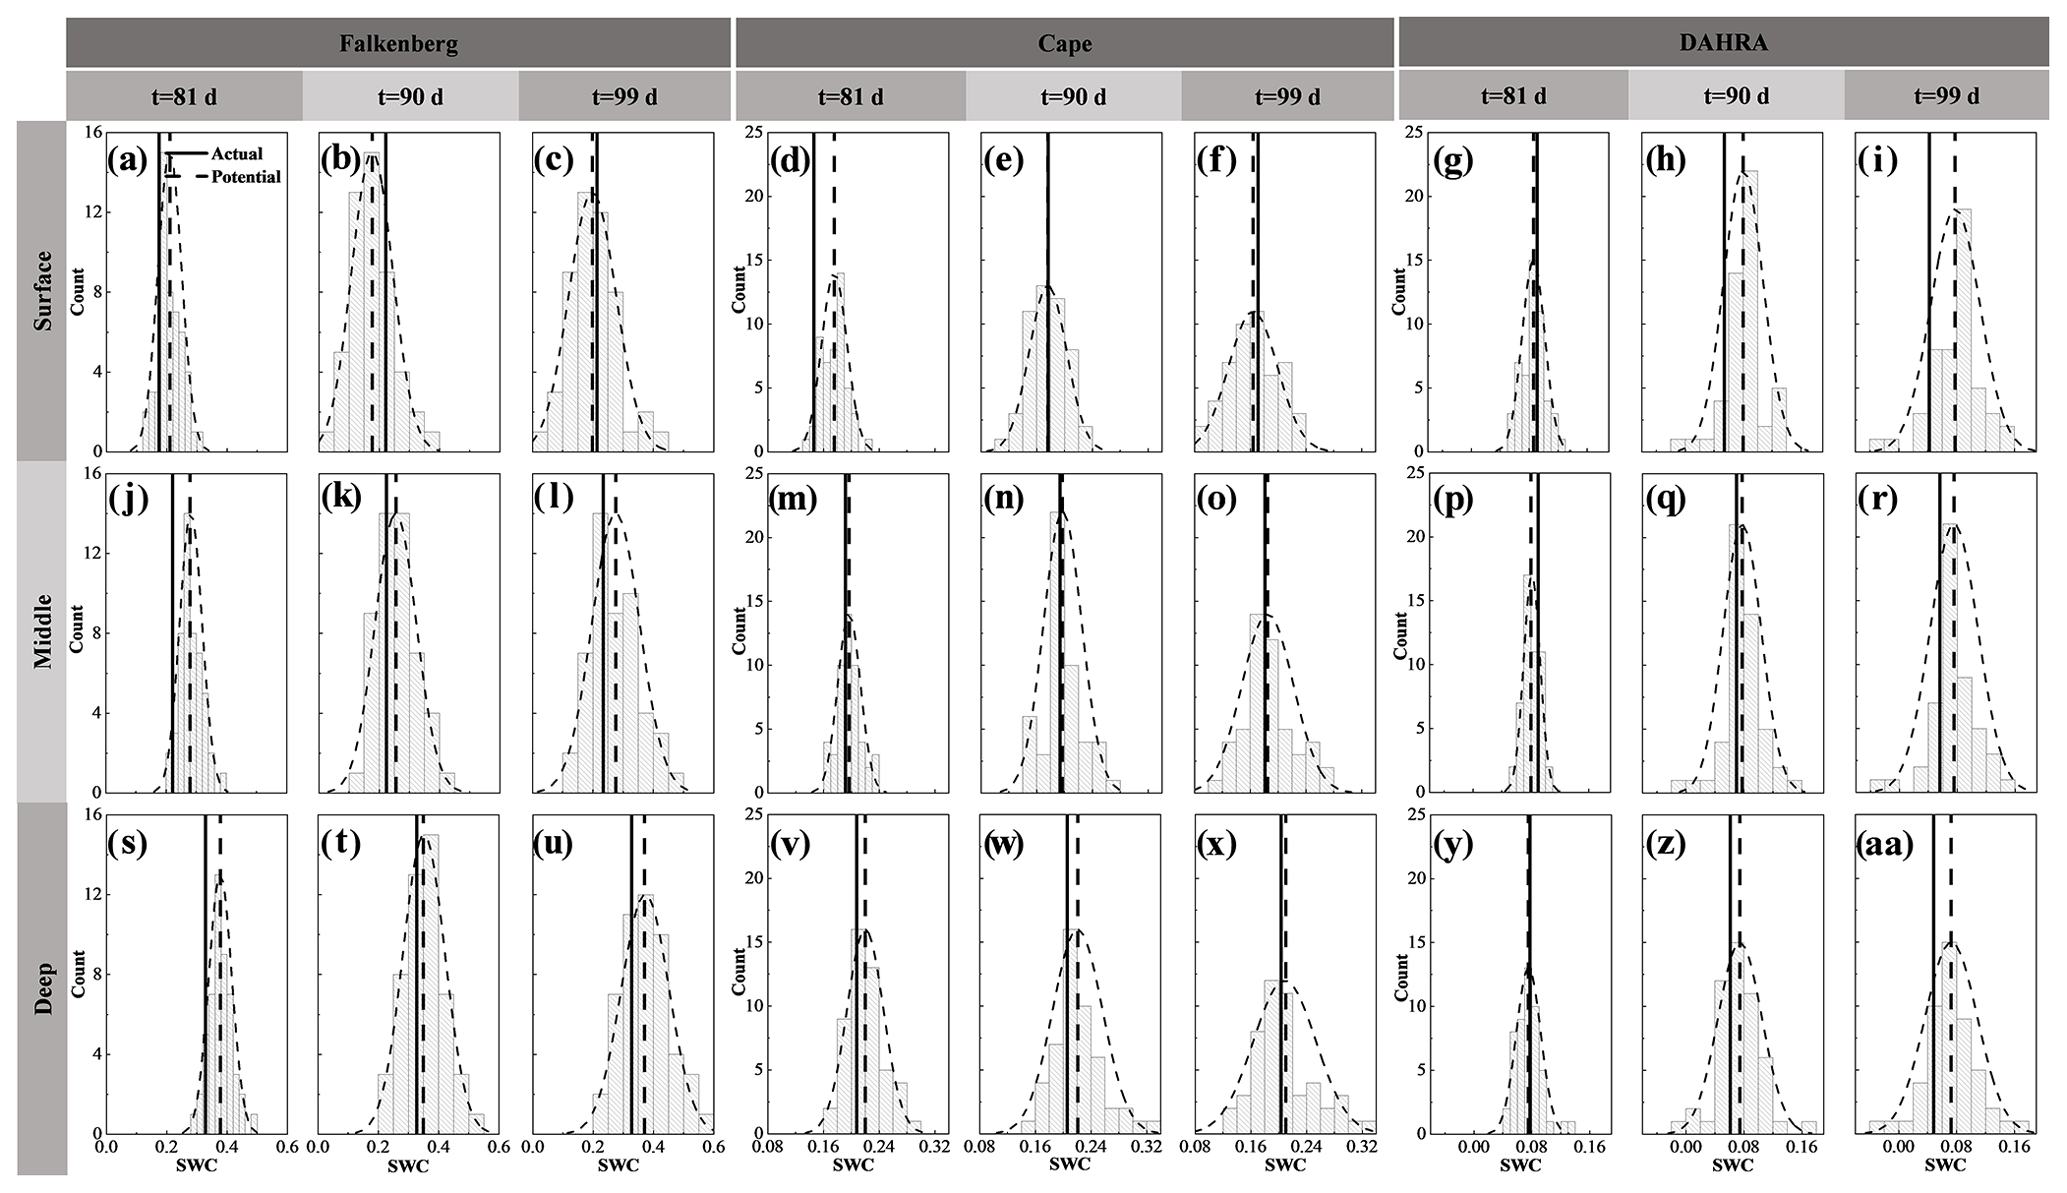
Figure 3The probability distributions (dotted curved line) of potential observation realizations, as well as their mean (dotted vertical line) and the corresponding actual soil water content (SWC) observation (solid line) in the surface, middle and deep layers on the 81st, 90th and 99th days at Falkenberg, Cape and DAHRA, respectively.
Moreover, test cases TC6 and TC7 differ from test case TC1-1. These test cases are designed to investigate the influence of the prior data content on data worth analysis, which facilitates the determination of the required prior information content to ensure the accuracy of data worth assessment. The 80 d prior data in test case TC1-1 are reduced backward in time to 40 d in test case TC6 and augmented forward to 180 d in test case TC7. In addition, test cases TC1-1, TC8 and TC9 consider the composite DW of different combinations of monitoring schemes. The comprehensive contributions of the surface SWC jointly with the middle and/or deep ones are compared with its individual contribution.
3.3 Evaluation setup
To compare the relative differences in data worth estimation accuracy under the various test scenarios, the mean absolute percentage error (MAPE) between the expected and reference data worth in the form of Tr, SED and RE is defined as follows:
where and denote the expected and reference DW values, respectively, at time step t=k.
4.1 Optimal monitoring location for the multiple predictive objectives (TC1,TC2 and TC3)
Figure 3 shows the probability distributions of the generated potential observation realizations, as well as their ensemble mean and the corresponding actual observations of the surface (θS), middle (θM) and deep (θD) soil moisture at three sites. Only the results on the 81st, 90th and 99th days are presented here. Overall, the N1=50 potential realizations could capture the actual SWC observations with acceptable accuracy. Specifically, the forecasted middle SWC exhibited a considerably more robust capturing performance with sustained better proximity of potential and actual θM throughout the simulation period. This occurred especially pronouncedly at the Cape site. For example, both surface and deep layers at Cape may be at risk of a poor fit of potential observations to measurements (Fig. 3d and w), while the generated middle SWC is always fairly well approximated to the corresponding actual values in Fig. 3m–o.
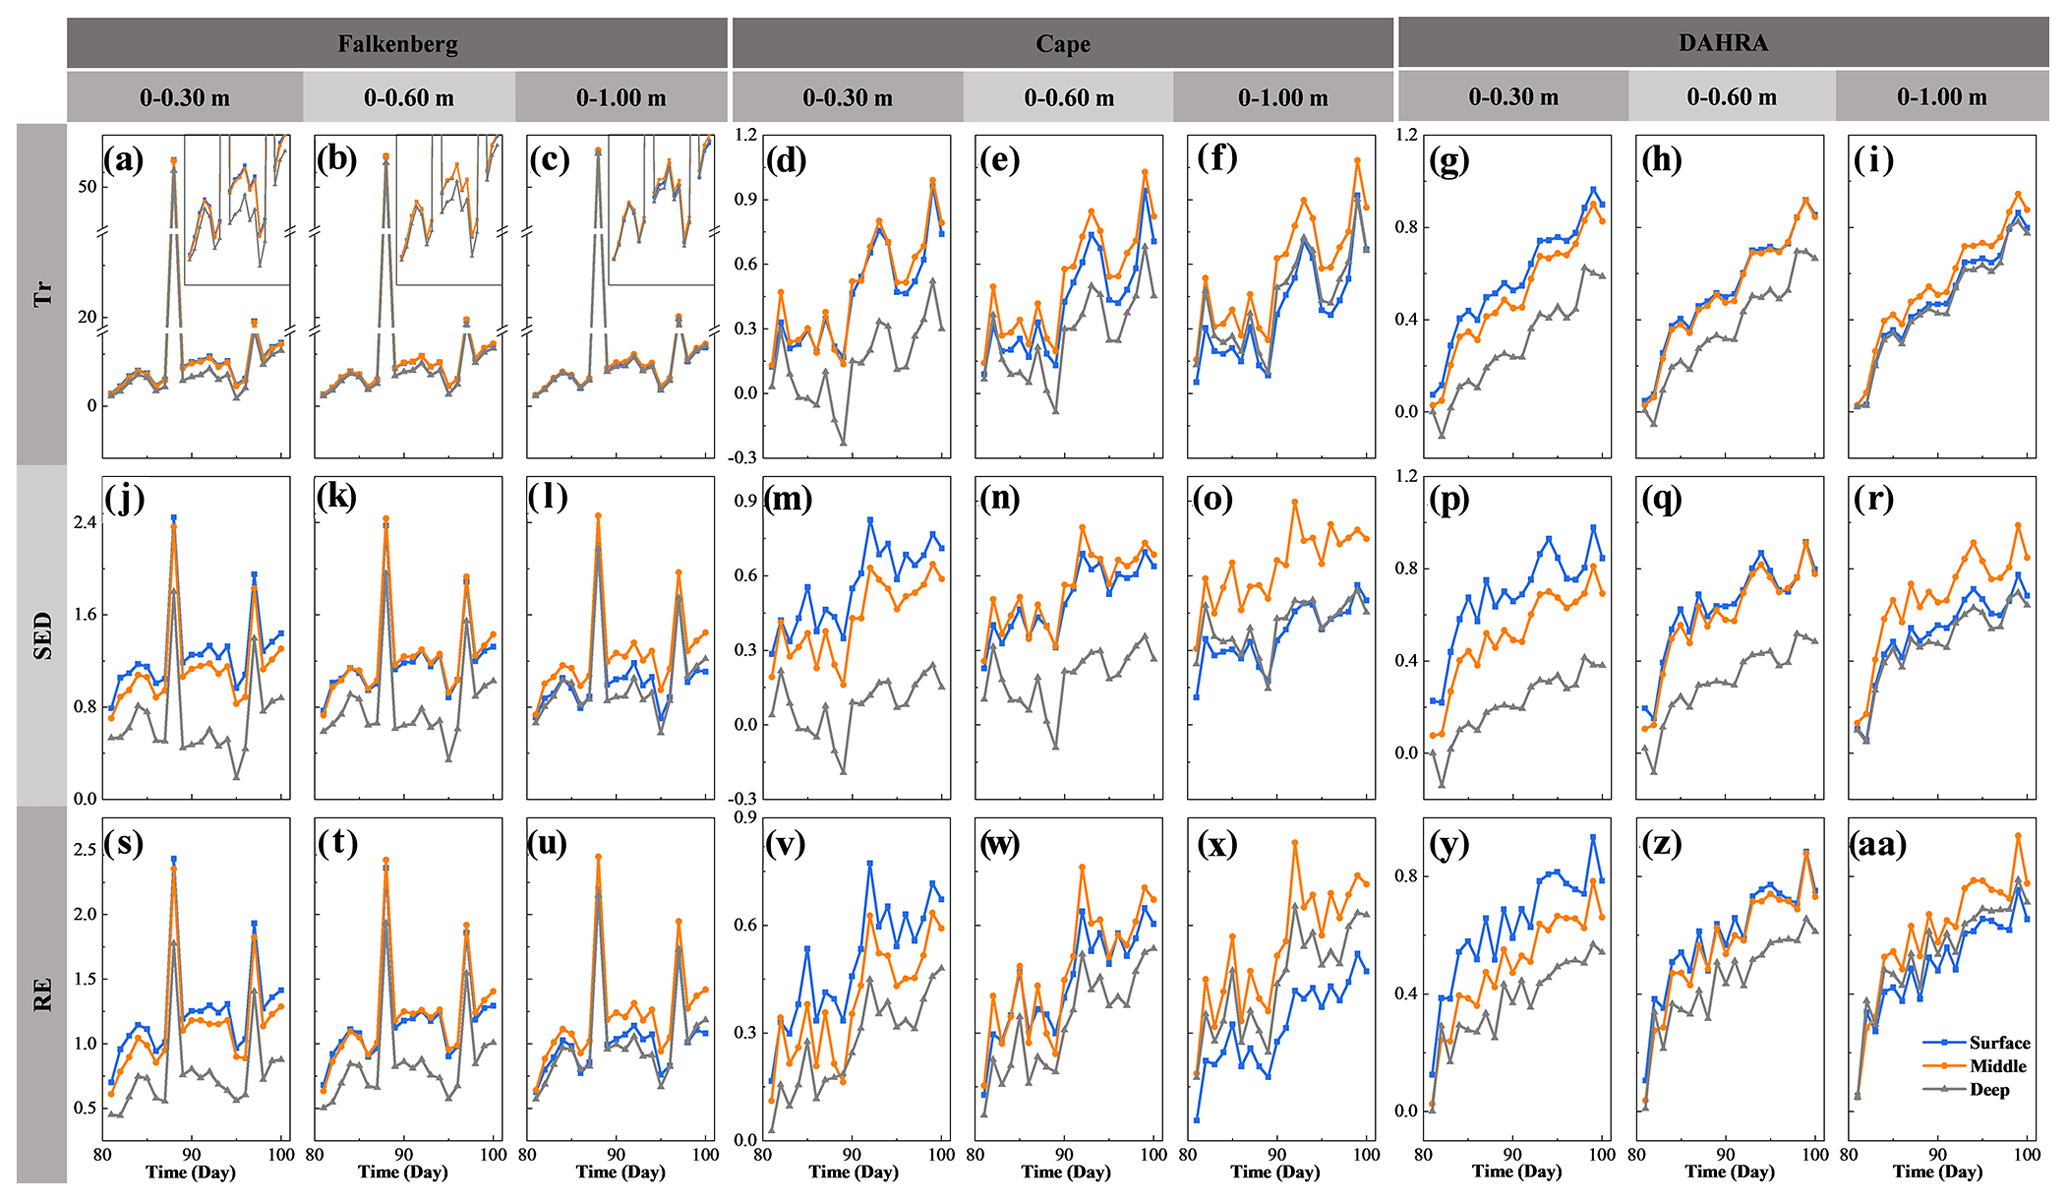
Figure 4The expected data worth of potential soil moisture observations in the surface, middle and deep layers in the form of trace (Tr), Shannon entropy difference (SED) and relative entropy (RE), respectively, regarding the retrieval of average soil moisture in the top 0.30, 0.60 and 1.00 m at three sites.
Based on the above potential observations, their expected data worth regarding the retrieval of , and can be quantified in the form of Tr, SED and RE, as depicted in Fig. 4. Meanwhile, for ease of analysis, Fig. 5 compares the covariance matrices of entire soil moisture profiles in the prior stage, pre-posterior stage, and posterior stage. Only the results from the 81st to the 90th day at Falkenberg are revealed here. It can be observed that, despite an overall increasing trend over time, the values of expected DW were prone to local spikes due to changes in the atmospheric boundary conditions such as rainfall. First of all, this general trend of increase should be attributed to the sequential augmentation of potential observations based on existing prior data, resulting in the cumulative values of DW over time. However, abrupt changes in external forcing, such as unexperienced rainfall events on the 88th day at the Falkenberg, could trigger temporal extrapolation of statistical learning (Li et al., 2020; Minns and Hall, 1996; Xu and Valocchi, 2015), which in turn led to a surge in prior predictive uncertainty, i.e., C1=Cov(Y|A) (the first column of Fig. 5). Fortunately, joint GP training and sequential assimilation of real-time potential observations can effectively lower the risk of such irrational extrapolation (Wang et al., 2021a, b), allowing these temporal mutations to be substantially attenuated at the pre-posterior stage (i.e., ) (the second to the fourth column of Fig. 5). This uncertainty reduction brought about the fusion of additional data became significantly larger when external forcing encountered mutations, which ultimately led to the localized surge in DW during rainfall events. We recall that such DW surges induced by contrasting scenarios also occurred in traditional DW analysis based on physically motivated models. As stated in Wang et al. (2018), “If one model undergoes different and contrasting scenarios, the model structural error is likely to appear since model parameters updated or calibrated under one scenario have not been examined under another scenario”. Although in different ways, the expected DW of future monitoring strategies within both the traditional parametric and proposed nonparametric DA frameworks heavily depends on the coverage of additional data by available prior scenarios (Li et al., 2020).
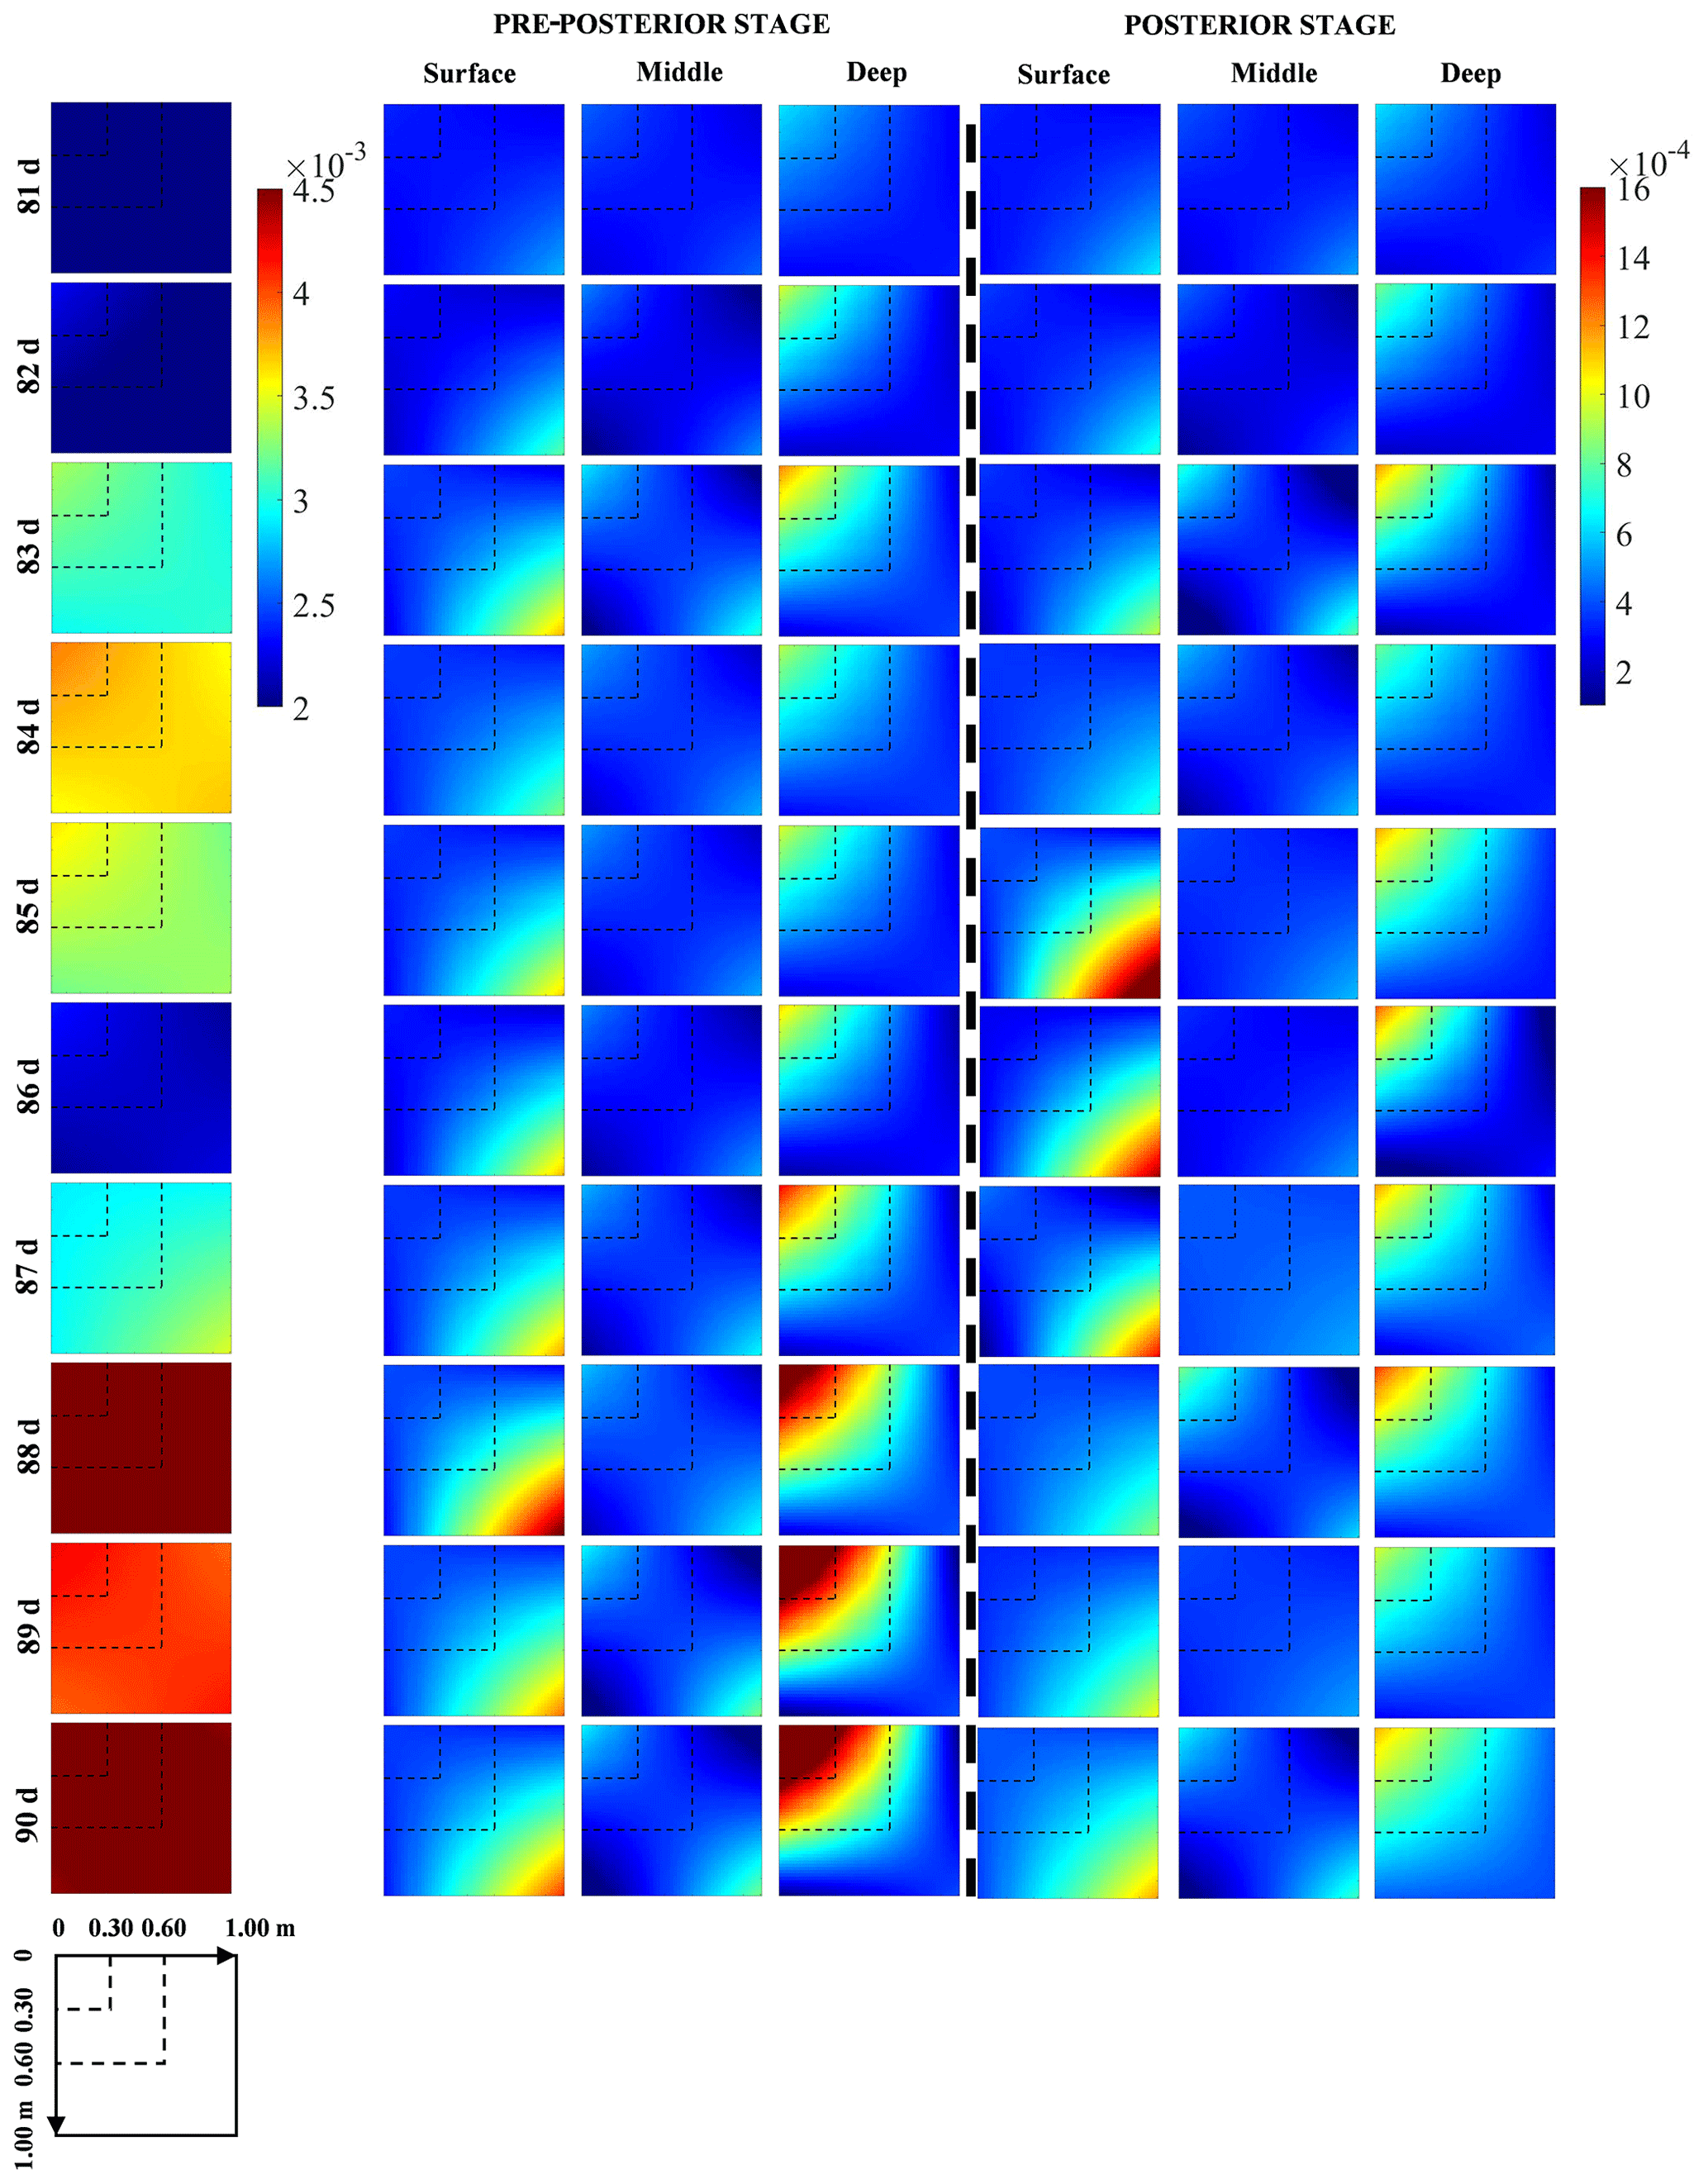
Figure 5The covariance matrices of soil moisture profiles from the 81st to the 90th day at Falkenberg before (column 1) and after potential (columns 2–4) and corresponding actual (columns 5–7) soil moisture observations in the surface, middle and deep layers were fused, respectively.
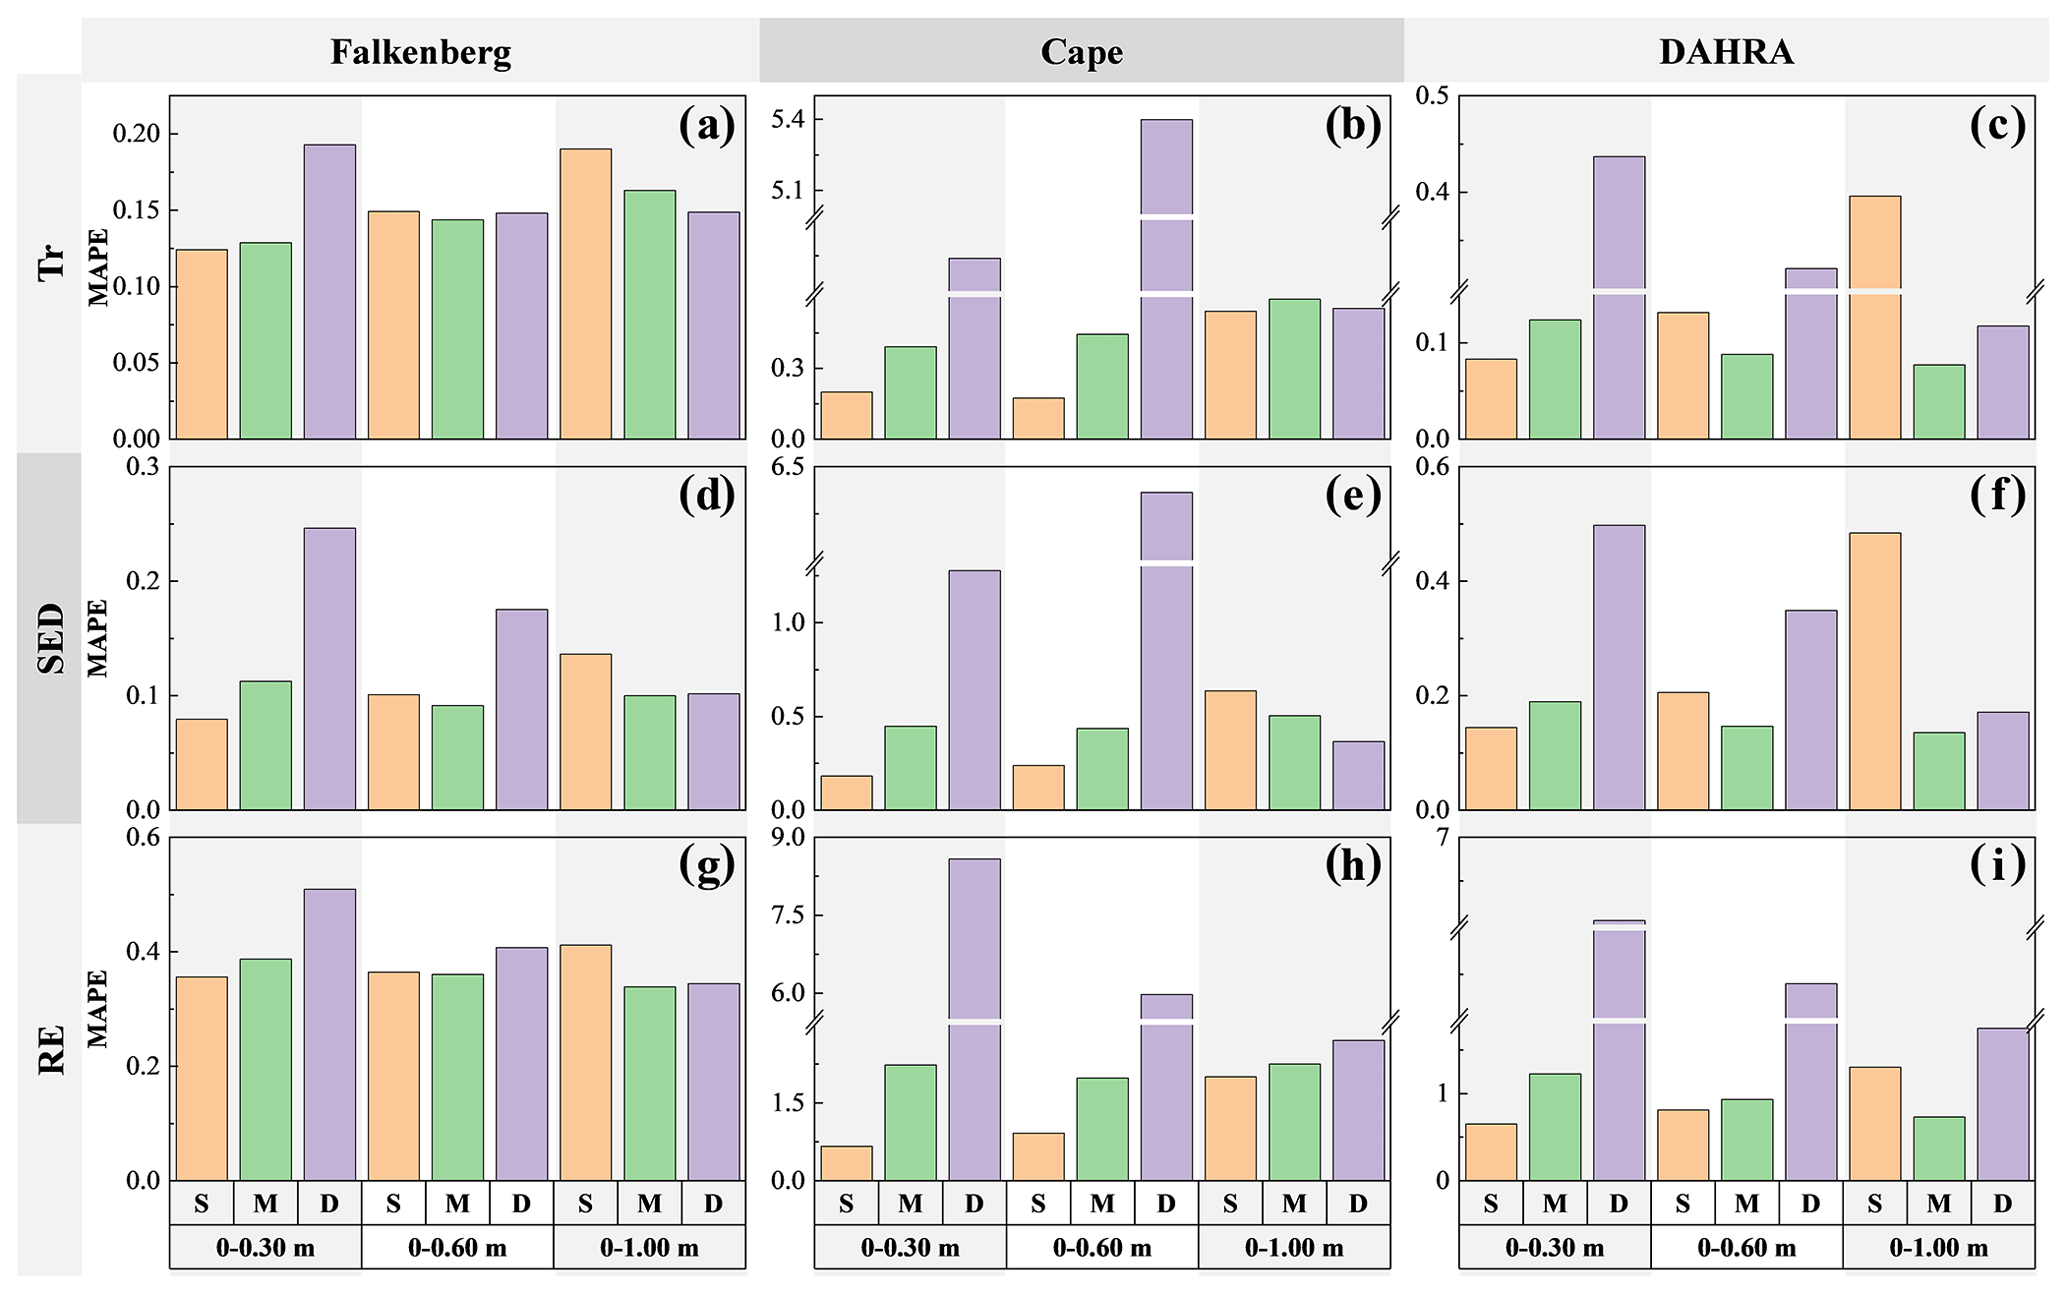
Figure 6The MAPEs between expected and reference data worth in the form of Tr, SED and RE of potential soil moisture observations in the surface (S), middle (M) and deep (D) layers, respectively, regarding the retrieval of average soil moisture in the top 0.30, 0.60 and 1.00 m at three sites.
Moreover, Fig. 4 also suggests that the optimal observation depth shifted as the prediction target changed. As expected, the surface SWC θS produced higher Tr, SED and RE values regarding the estimation of . As the depth range of the average SWC to be estimated was extended downward, the data worth advantages of θM and θD began to emerge. Surprisingly, the potential middle SWC still exhibited a considerably higher superiority even in estimation. In other words, the soil moisture in the middle layer has the most robust advantage in data worth. This may be due to the fact that the integration of surface or deep SWC only reduced the uncertainty within the corresponding depth ranges (the second and fourth columns of Fig. 5), whereas the augmentation of θM significantly decreased the covariance matrices of the entirety of the SWC profiles (the third column of Fig. 5). This selection result of the optimal monitoring location seemingly contradicts previous findings within the traditional parametric DW analysis where the surface observations with the largest temporal variation always produced the greatest data worth, as reported in Dai et al. (2016) and Wang et al. (2018). This discrepancy is likely to depend on the different mechanisms that characterize soil moisture dynamics in the vertical direction between the two approaches. The traditional parametric unsaturated-flow model follows the law-of-mass-conservation-based physical governing equations (i.e., the Richardson–Richards equation, Richards, 1931; Richardson, 1922), as well as their physical properties, to simulate the soil water infiltration process. The strongest time-varying nature of surface SWC was conducive to the effective updating of the physical parameters in EnKF, eventually generating the maximum data worth (Wang et al., 2018). However, the spatial prediction performance of data-driven methods substantially hinged on the similarity of data between different depths. Theoretically, there occurs an inherent delayed response of soil moisture profiles to rainfall events, which has been well-documented experimentally (Wierenga et al., 1986; Bresler et al., 1971; Vauclin et al., 1979). This causes the temporal changes in surface and deep SWC to be naturally asynchronous, thus rendering their representativeness in characterizing the whole soil moisture profile somewhat limited. Ultimately, the complete reliance on statistical and information-theoretic measures allowed the most representative middle SWC to establish the most robust superiority in DW.
It can also be seen from Fig. 4 that, when using different information indices (i.e., Tr, SED and RE) to quantify the data worth, the optimal observation location selected is identical regardless of soil textures and climatic regimes. This conclusion is generally in line with Wang et al. (2018) and Man et al. (2016). Furthermore, to quantify the data worth assessment accuracy, Fig. 6 depicts the MAPE between the expected and reference data worth in the form of Tr, SED and RE of alternative monitoring schemes at different depths. It can be observed that the surface SWC yielded the smallest MAPE when retrieving regardless of the metric type. Nevertheless, during the estimation of and , the expected data worth of θM more accurately and robustly approached the reference counterparts with overall smaller MAPEs. We recall that this ranking of DW estimation accuracy was exactly in line with the ranking of the magnitude of their expected DW in Fig. 4. To be specific, a comparison of Figs. 4 and 6 reveals that potential observations with a larger expected DW are prone to a higher DW estimation accuracy due to its more robust ability to imitate the actual observations (Fig. 3).
4.2 Effects of observation noise (TC1-1, TC4 and TC5)
Figure 7 shows the probability distributions of the potential observation ensemble, as well as their mean and the corresponding actual observations of the surface SWC under different SWC noise levels. Similarly, only the results of the 81st, 90th and 99th days are displayed. It can be observed that a higher noise level was not always detrimental but rather expanded the distribution width along the SWC axis and produced a flatter curve. The risk of failure in the generated realizations capturing the real observations was thus reduced. Even on the 81st day at Falkenberg, for example, the increase in SWC error variance from 0.012 to 0.042 facilitated a better agreement between the potential and actual surface soil moisture, as revealed in Fig. 7a, j and s. Similar phenomena can also be found via a comparison of Fig. 7e and n.
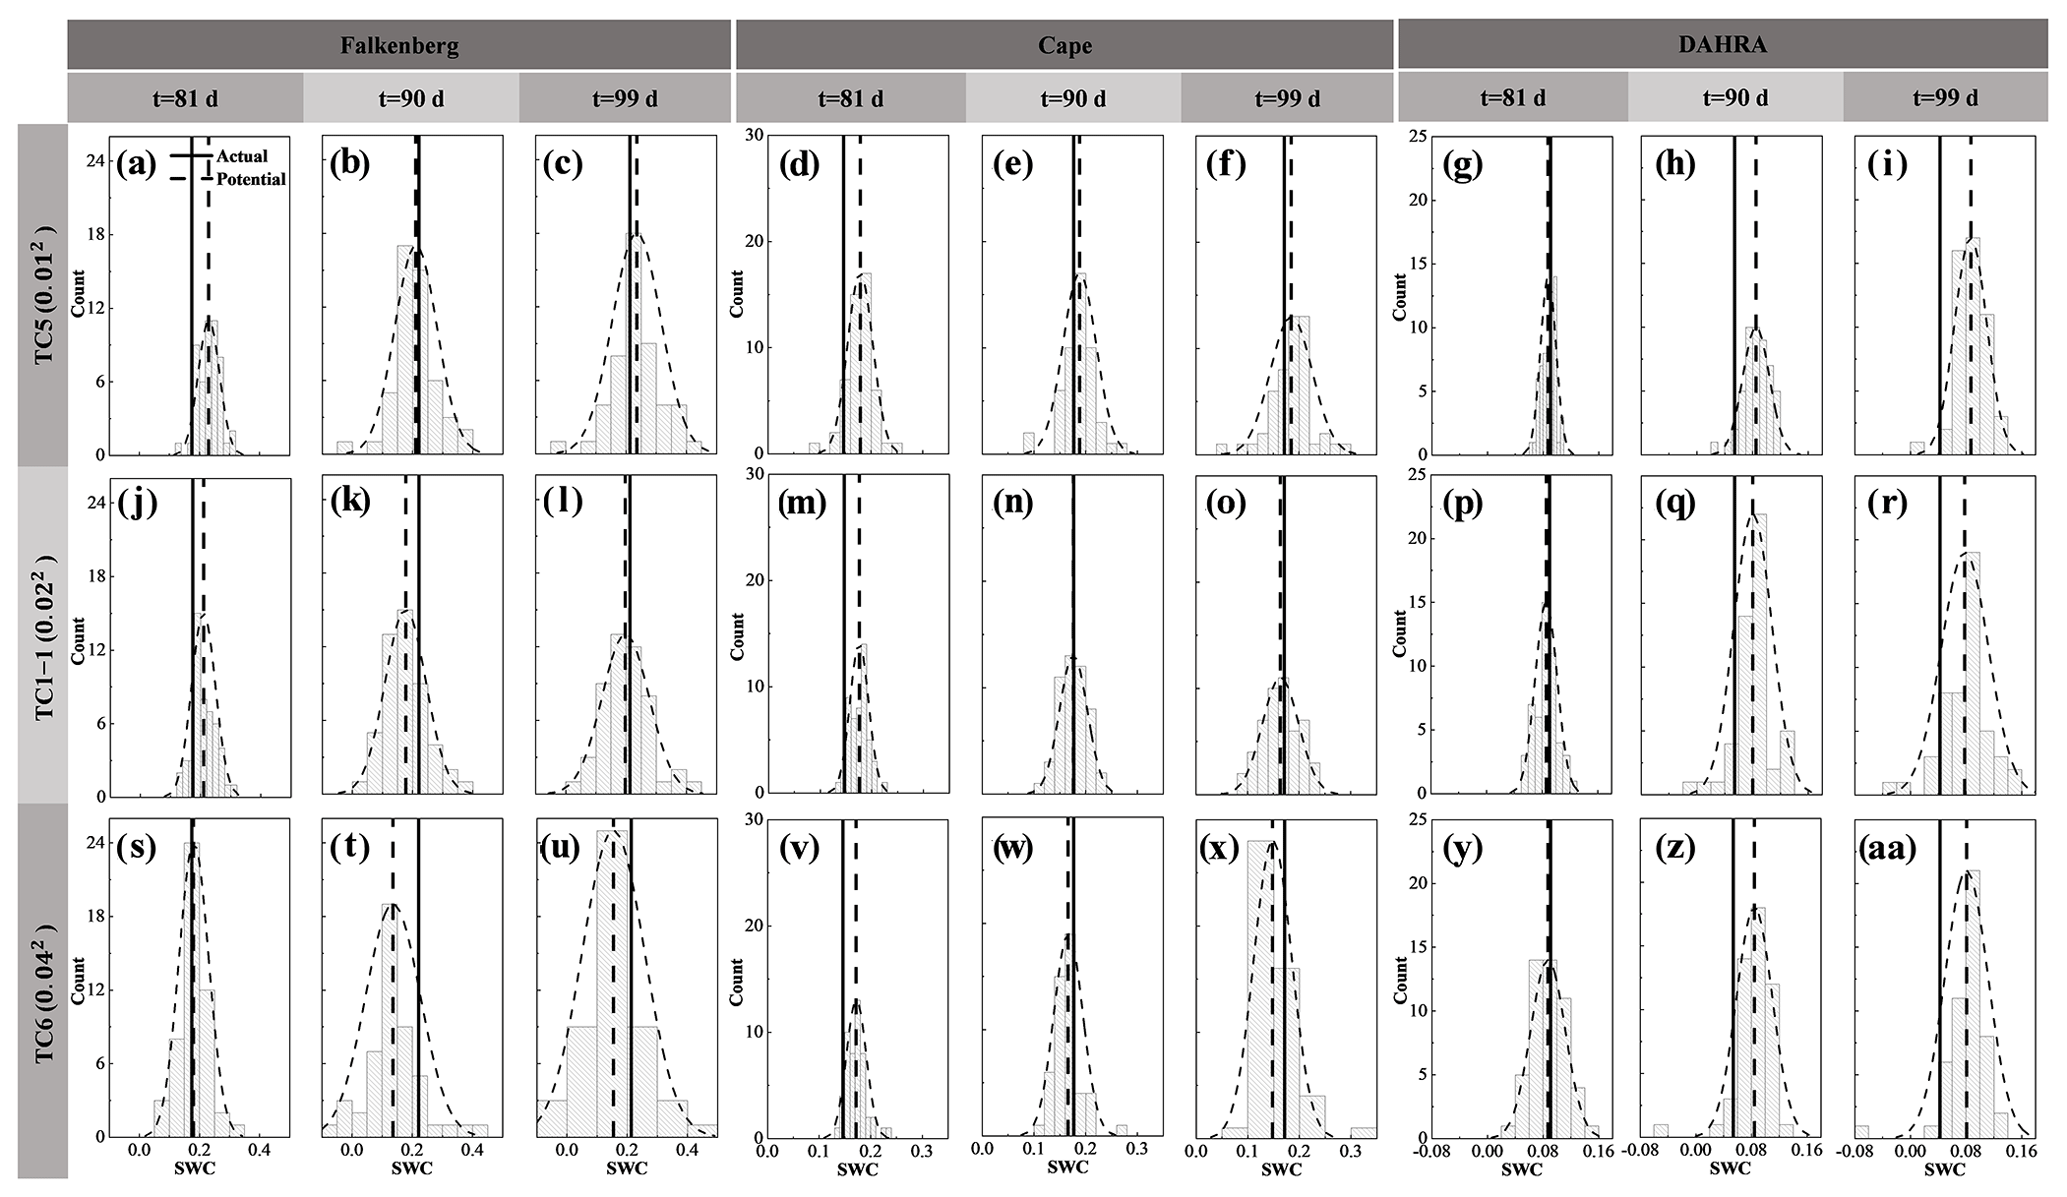
Figure 7The probability distributions (dotted curved line) of potential observation realizations, as well as their mean (dotted vertical line) and the corresponding actual soil water content (SWC) observations (solid line) in the surface layer on the 81st, 90th and 99th days at three sites under different measurement error variances, these being 0.012 (TC4), 0.022 (TC1-1) and 0.042 (TC5), respectively.
Figure 8 shows the temporal evolution and time-averaged MAPE of the expected and reference data worth in the form of three information indices under various noise levels. Some interesting findings can be obtained. (1) Overall, the potential SWC data corrupted by a lower noise level yielded larger data worth with higher accuracy. (2) Nevertheless, the occurrence of rainfall events triggered a futile DW increase while also rendering the potential observations with appropriately magnified observation errors more valuable. For instance, a properly inflated observation error of 0.022 on the 88th day at the Falkenberg site resulted in a notably higher data worth than that of 0.012, as highlighted by the dashed ellipse boxes in Fig. 8a and d. Furthermore, this increase in data worth resulting from noise amplification was particularly evident in the form of Tr over the other two metrics, as depicted in Fig. 8a–c and d–i. At DAHRA, potential observations with an observation error of 0.022 even produced a significantly higher Tr value than that of 0.012 throughout almost the entire simulation period (Fig. 8c). (3) As opposed to Tr and SED indices focusing only on the system uncertainty (variance or covariance), the expected RE, as a comprehensive mean-covariance-type metric, was often more challenging to approach its reference counterparts with the largest MAPE at all sites, as shown in Fig. 8j–l.
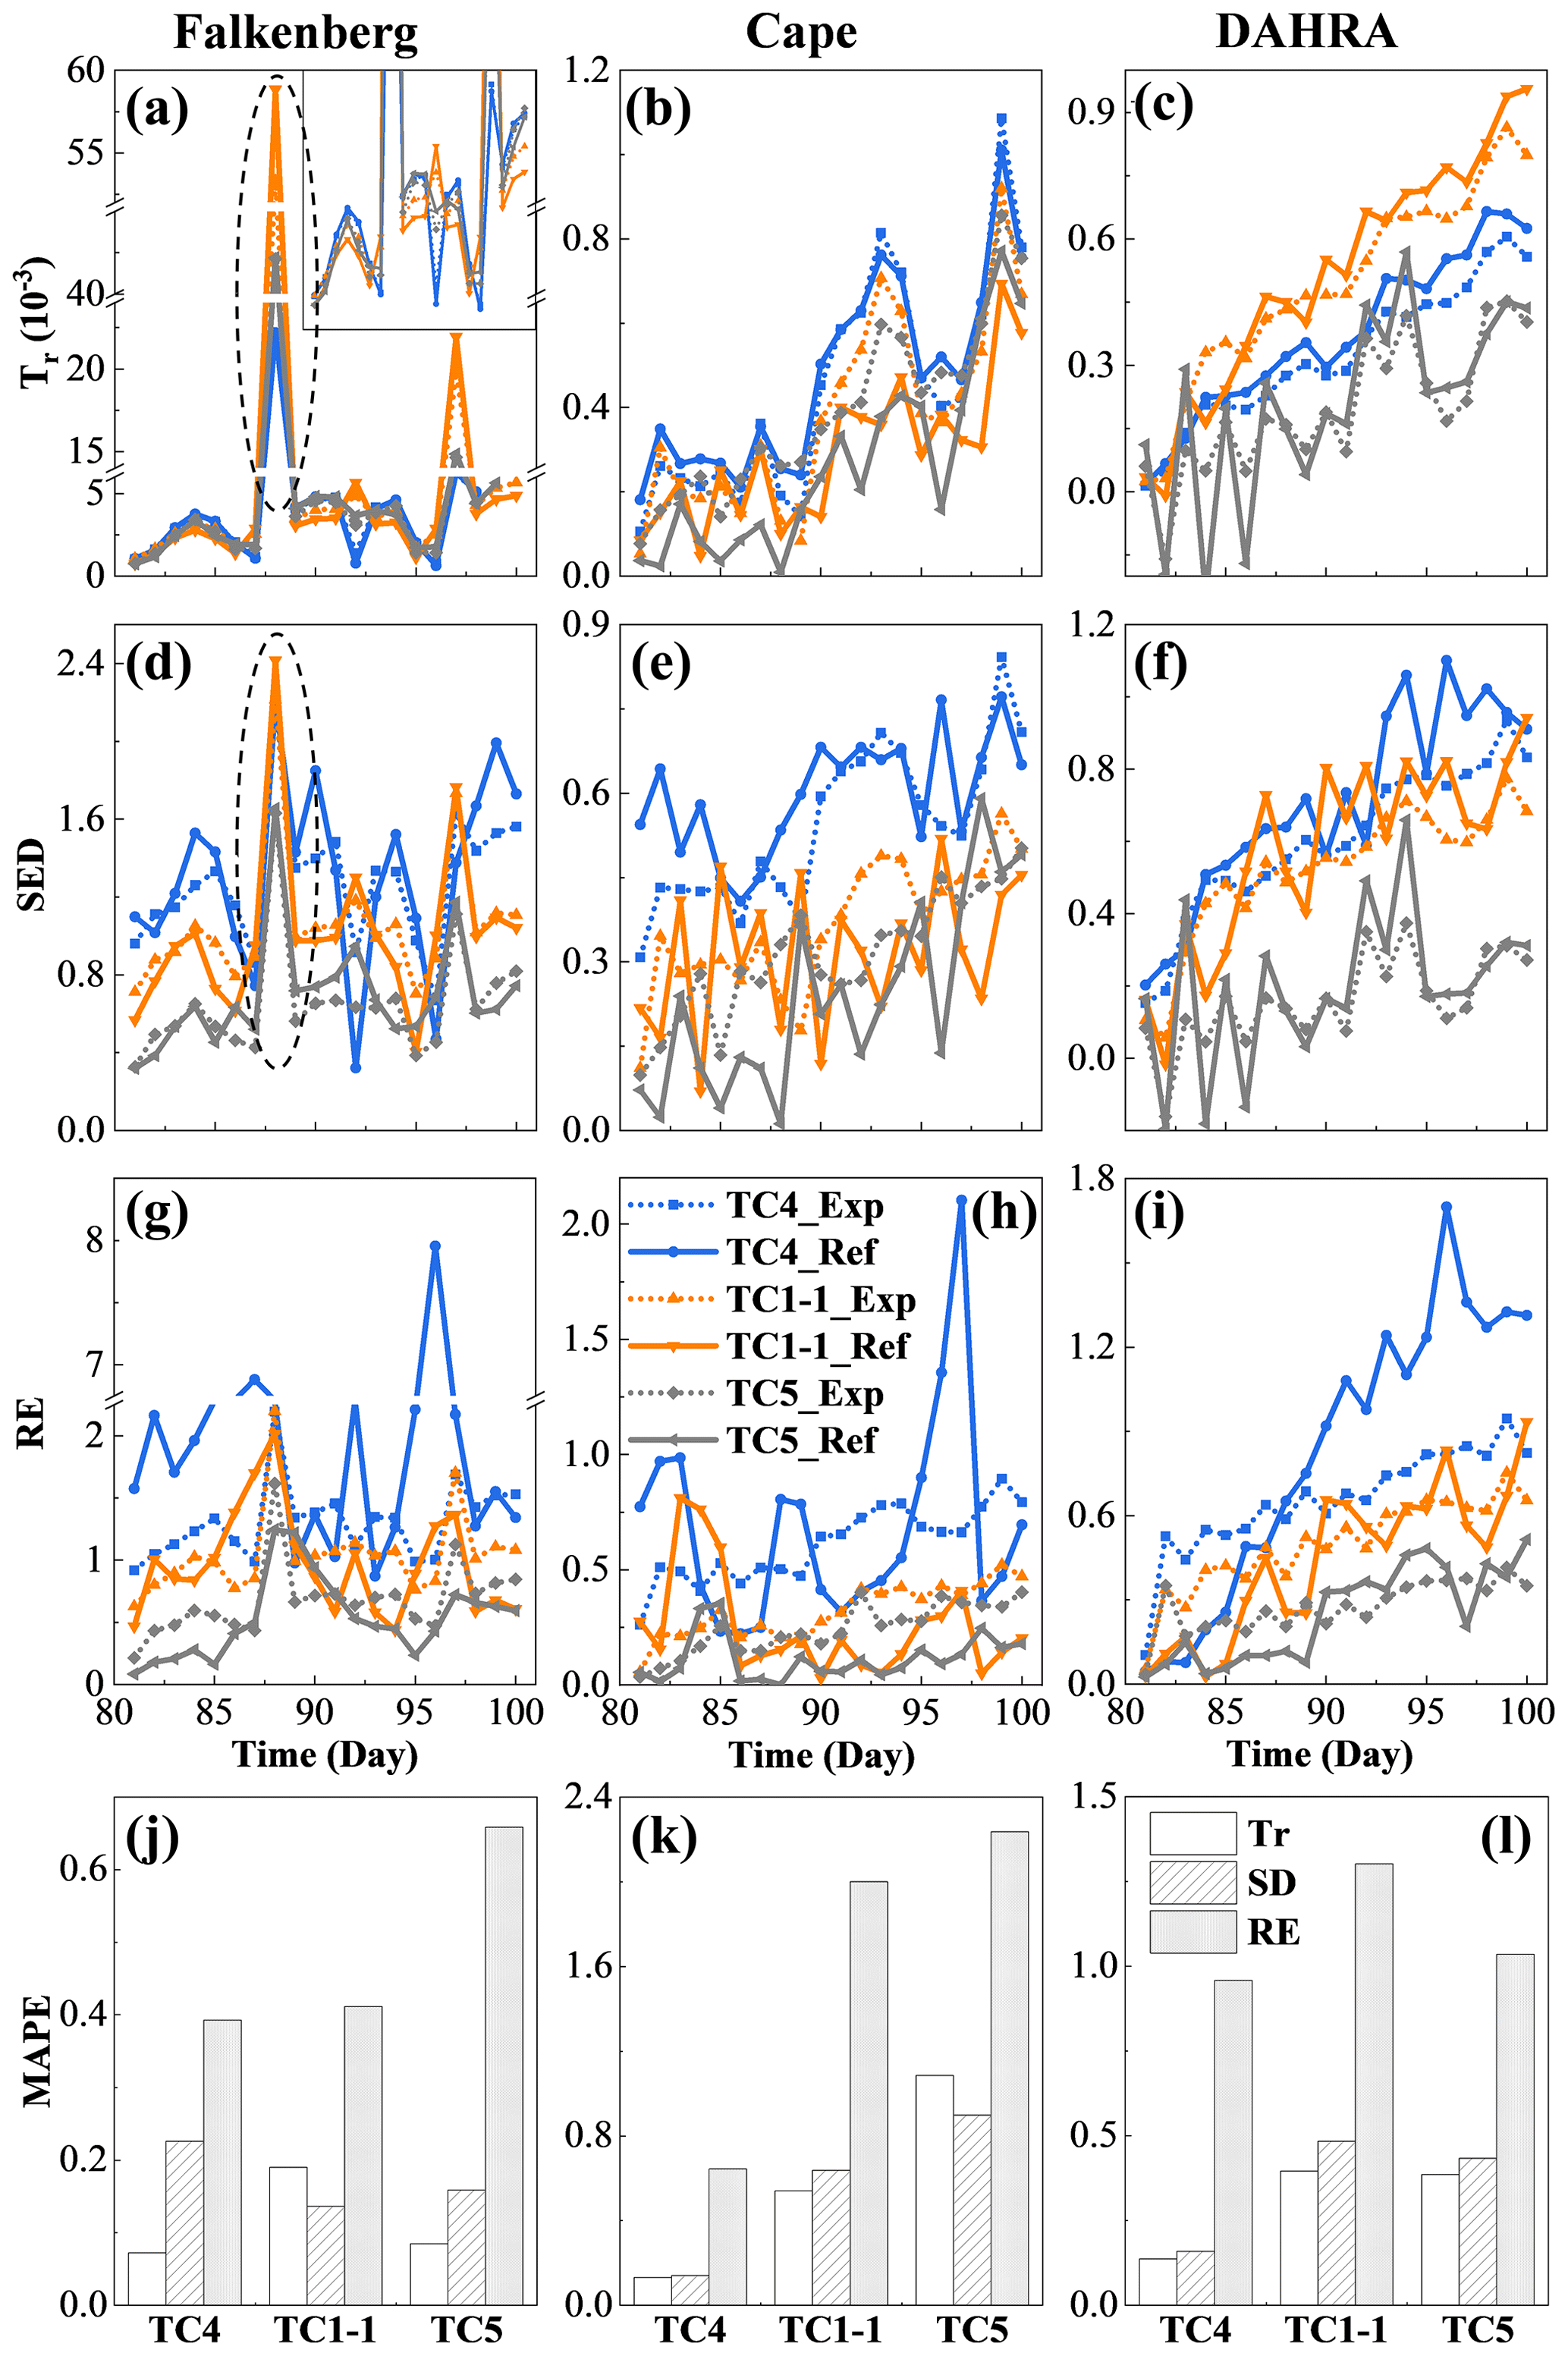
Figure 8The temporal evolution (a–i) and time-averaged MAPEs (j–l) of the expected and reference data worth in the form of Tr, SED and RE at three sites, respectively, under different measurement error variances, these being 0.012 (TC4), 0.022 (TC1-1) and 0.042 (TC5), respectively.
4.3 Effects of prior data content (TC1-1, TC6 and TC7)
Figure 9a–i depicts the temporal evolution of the expected and reference data worth of the surface SWC in cases TC6, TC1-1 and TC7 with the 40, 80 and 180 d prior data content, respectively. Under normal circumstances, an increase in the available prior data content inevitably entails a shrinkage in the DW of subsequent data due to the possibility of information redundancy. However, this seems to be valid only for a modest increase in prior data (from 40 to 80 d) within our NP-DWA framework. The substantial augmentation in available data content from 80 to 180 d instead resulted in a notably higher DW of the additional data (Fig. 9). Even more unexpectedly, this DW growth was prevalent across sites, regardless of the soil types and climatic regimes. To clarify this anomaly, Fig. 10 further shows the predicted covariance matrices of soil moisture profiles conditional on {A} in the prior stage and {A, B} in the pre-posterior stage in cases TC6, TC1-1 and TC7, respectively. Only the results from the 81st to the 90th day at Falkenberg are presented here. Our previous studies have demonstrated that, although the mean values of potential samples can approach actual observations well in fully (Wang et al., 2021a) or partially (Zhang et al., 2019) data-driven dynamical systems, their ensemble was apt to suffer from considerable uncertainty (Wang et al., 2021b). Unfortunately, augmented prior data, despite its potential to enrich available GP training scenarios, failed to prevent the non-convergence of Ne=50 GP samples. In contrast, the additional noise associated with prior data supplementation could exacerbate the increase in the prior prediction uncertainty (i.e., C1), as illustrated by a comparison between the first three columns of Fig. 10. It should be highlighted that the fusion of B enabled a notable reduction in the pre-posterior uncertainties (i.e., C2) in the data assimilation system to a comparable level (the last three columns of Fig. 10), even with different prior data content. The gradual widening of the gap between C1 and C2 eventually yielded the highest data worth with the maximum amount of prior data in test case TC7 (Fig. 9). This seems to warn us that uncontrolled expansion of big data within fully data-driven systems may not be beneficial. The adverse effects of extra noise may overshadow its original superiority in generalization capability. Access to high-quality and representative small data may constitute the key to the successful application of fully data-driven algorithms for reshaping soil moisture dynamics.
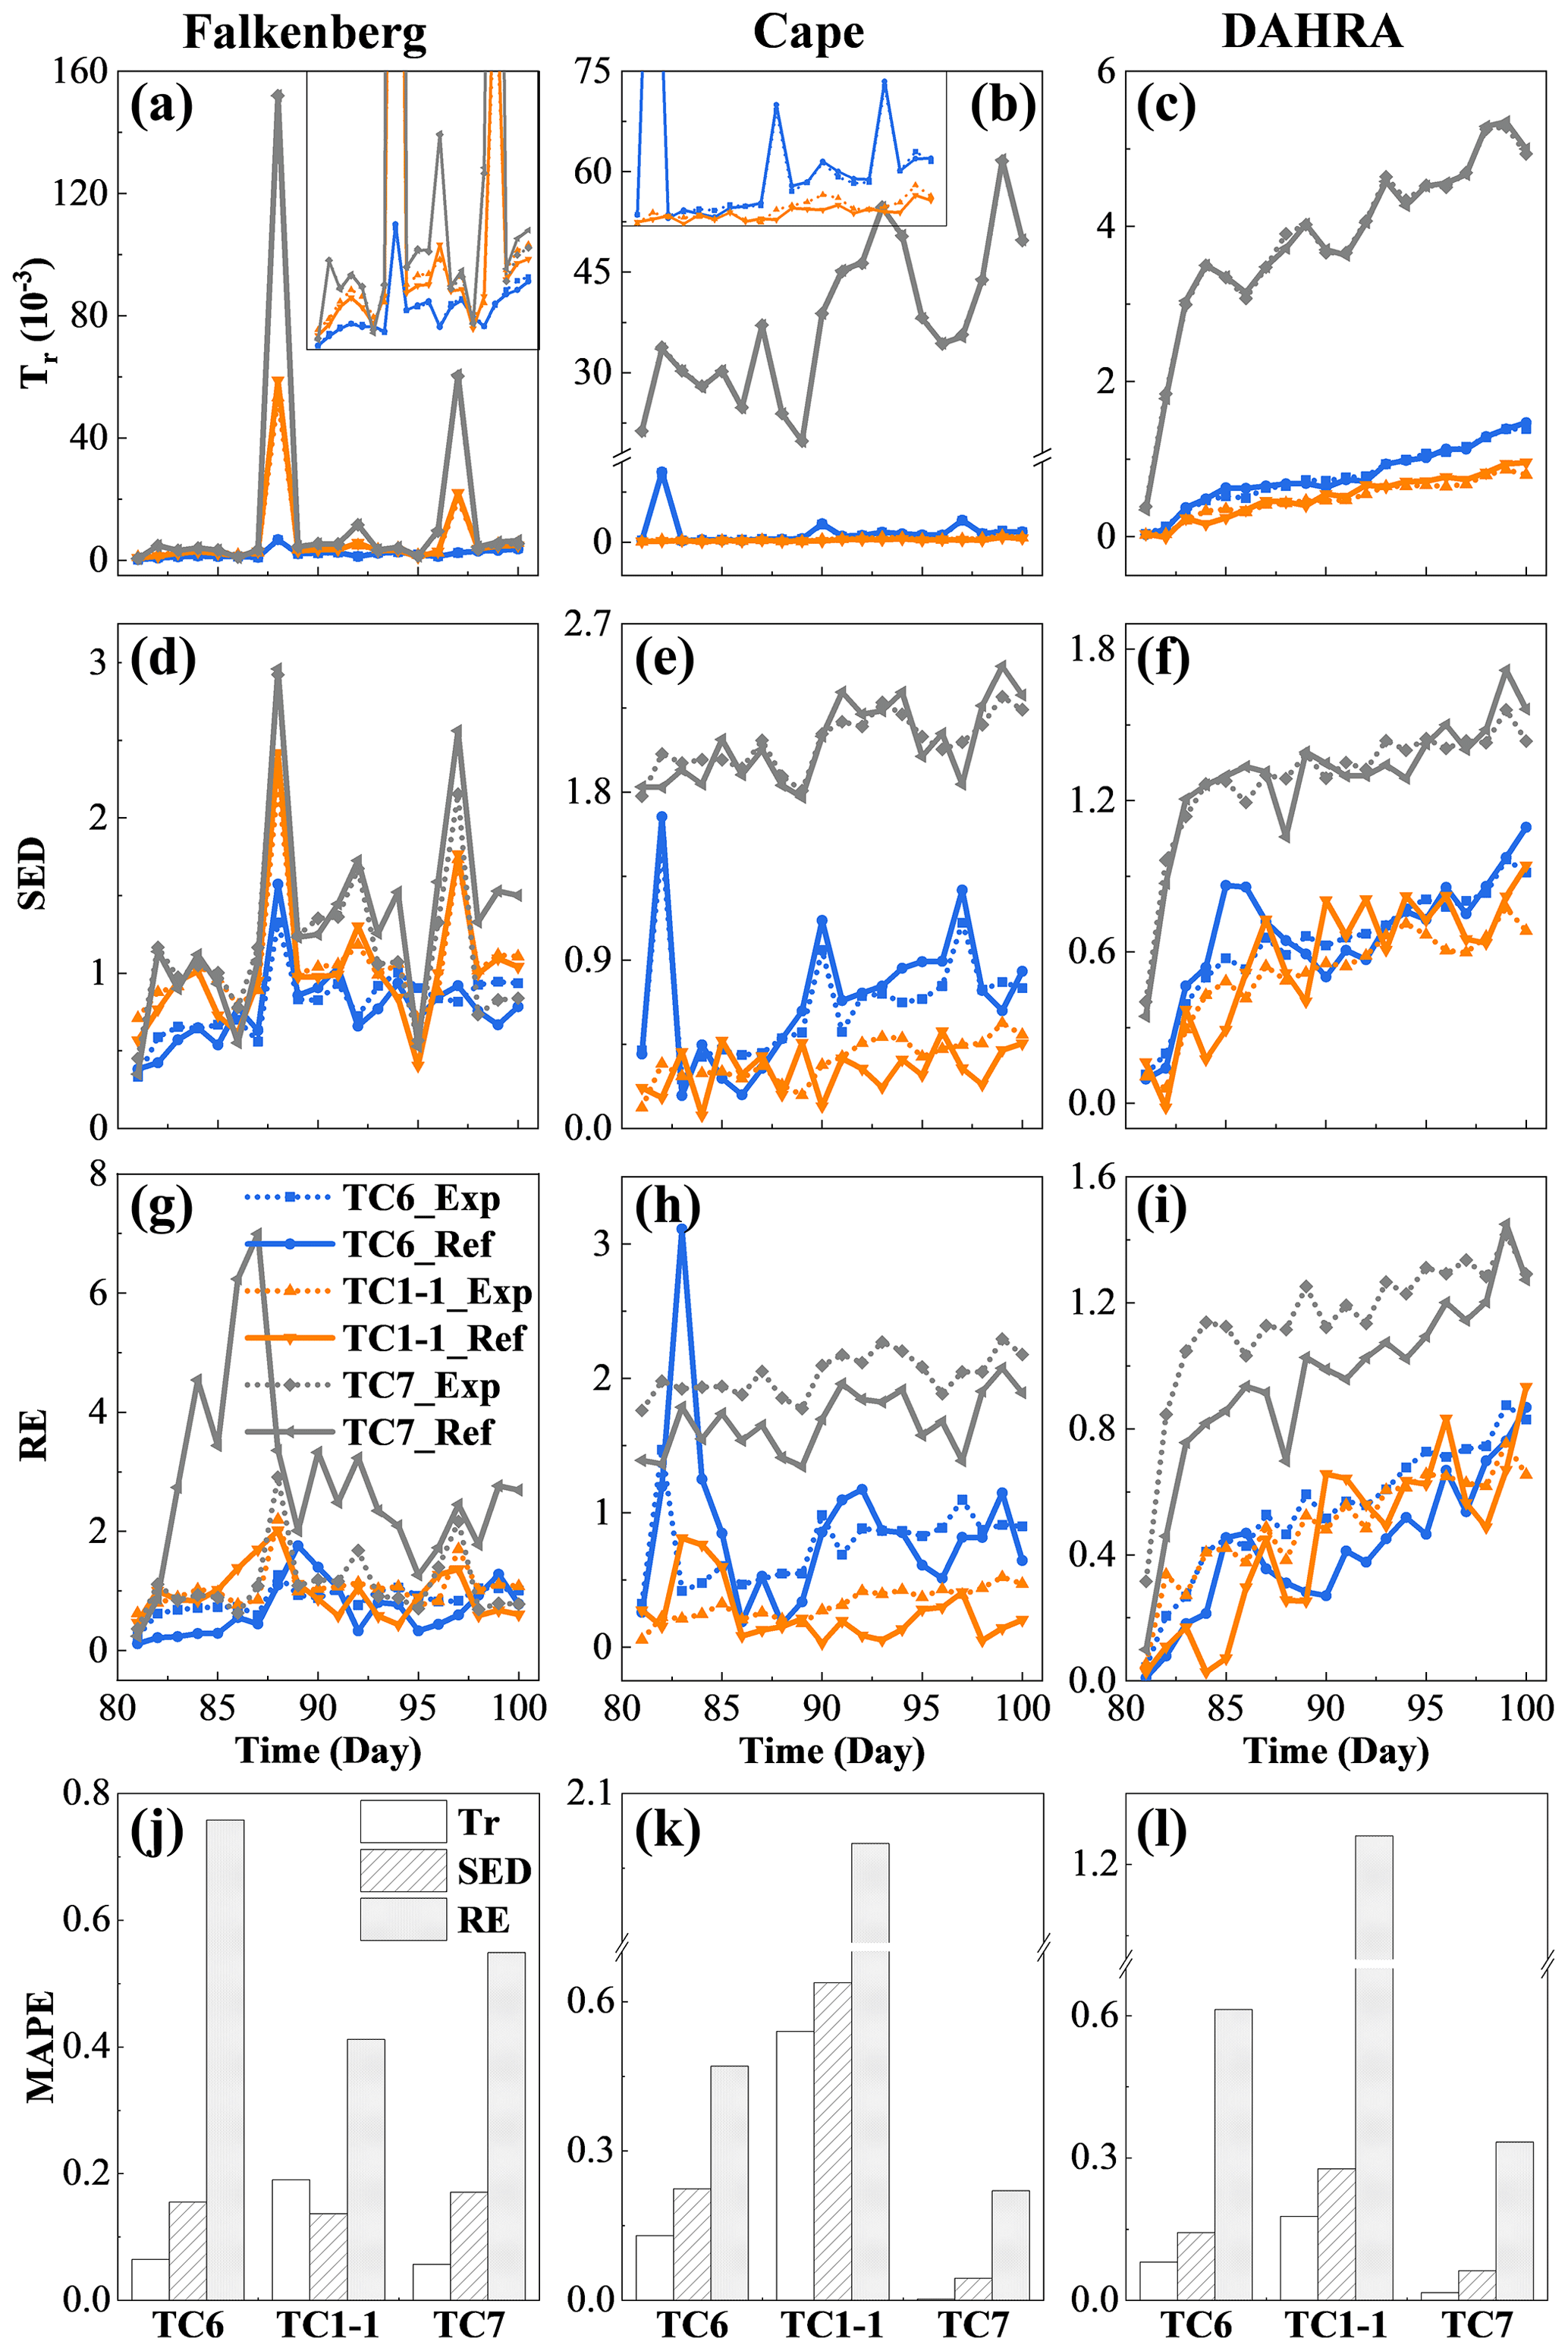
Figure 9The temporal evolution (a–i) and time-averaged MAPEs (j–l) of the expected and reference data worth in the form of Tr, SED and RE at three sites for cases TC6, TC1-1 and TC7 with 40, 80 and 180 d prior data content, respectively.
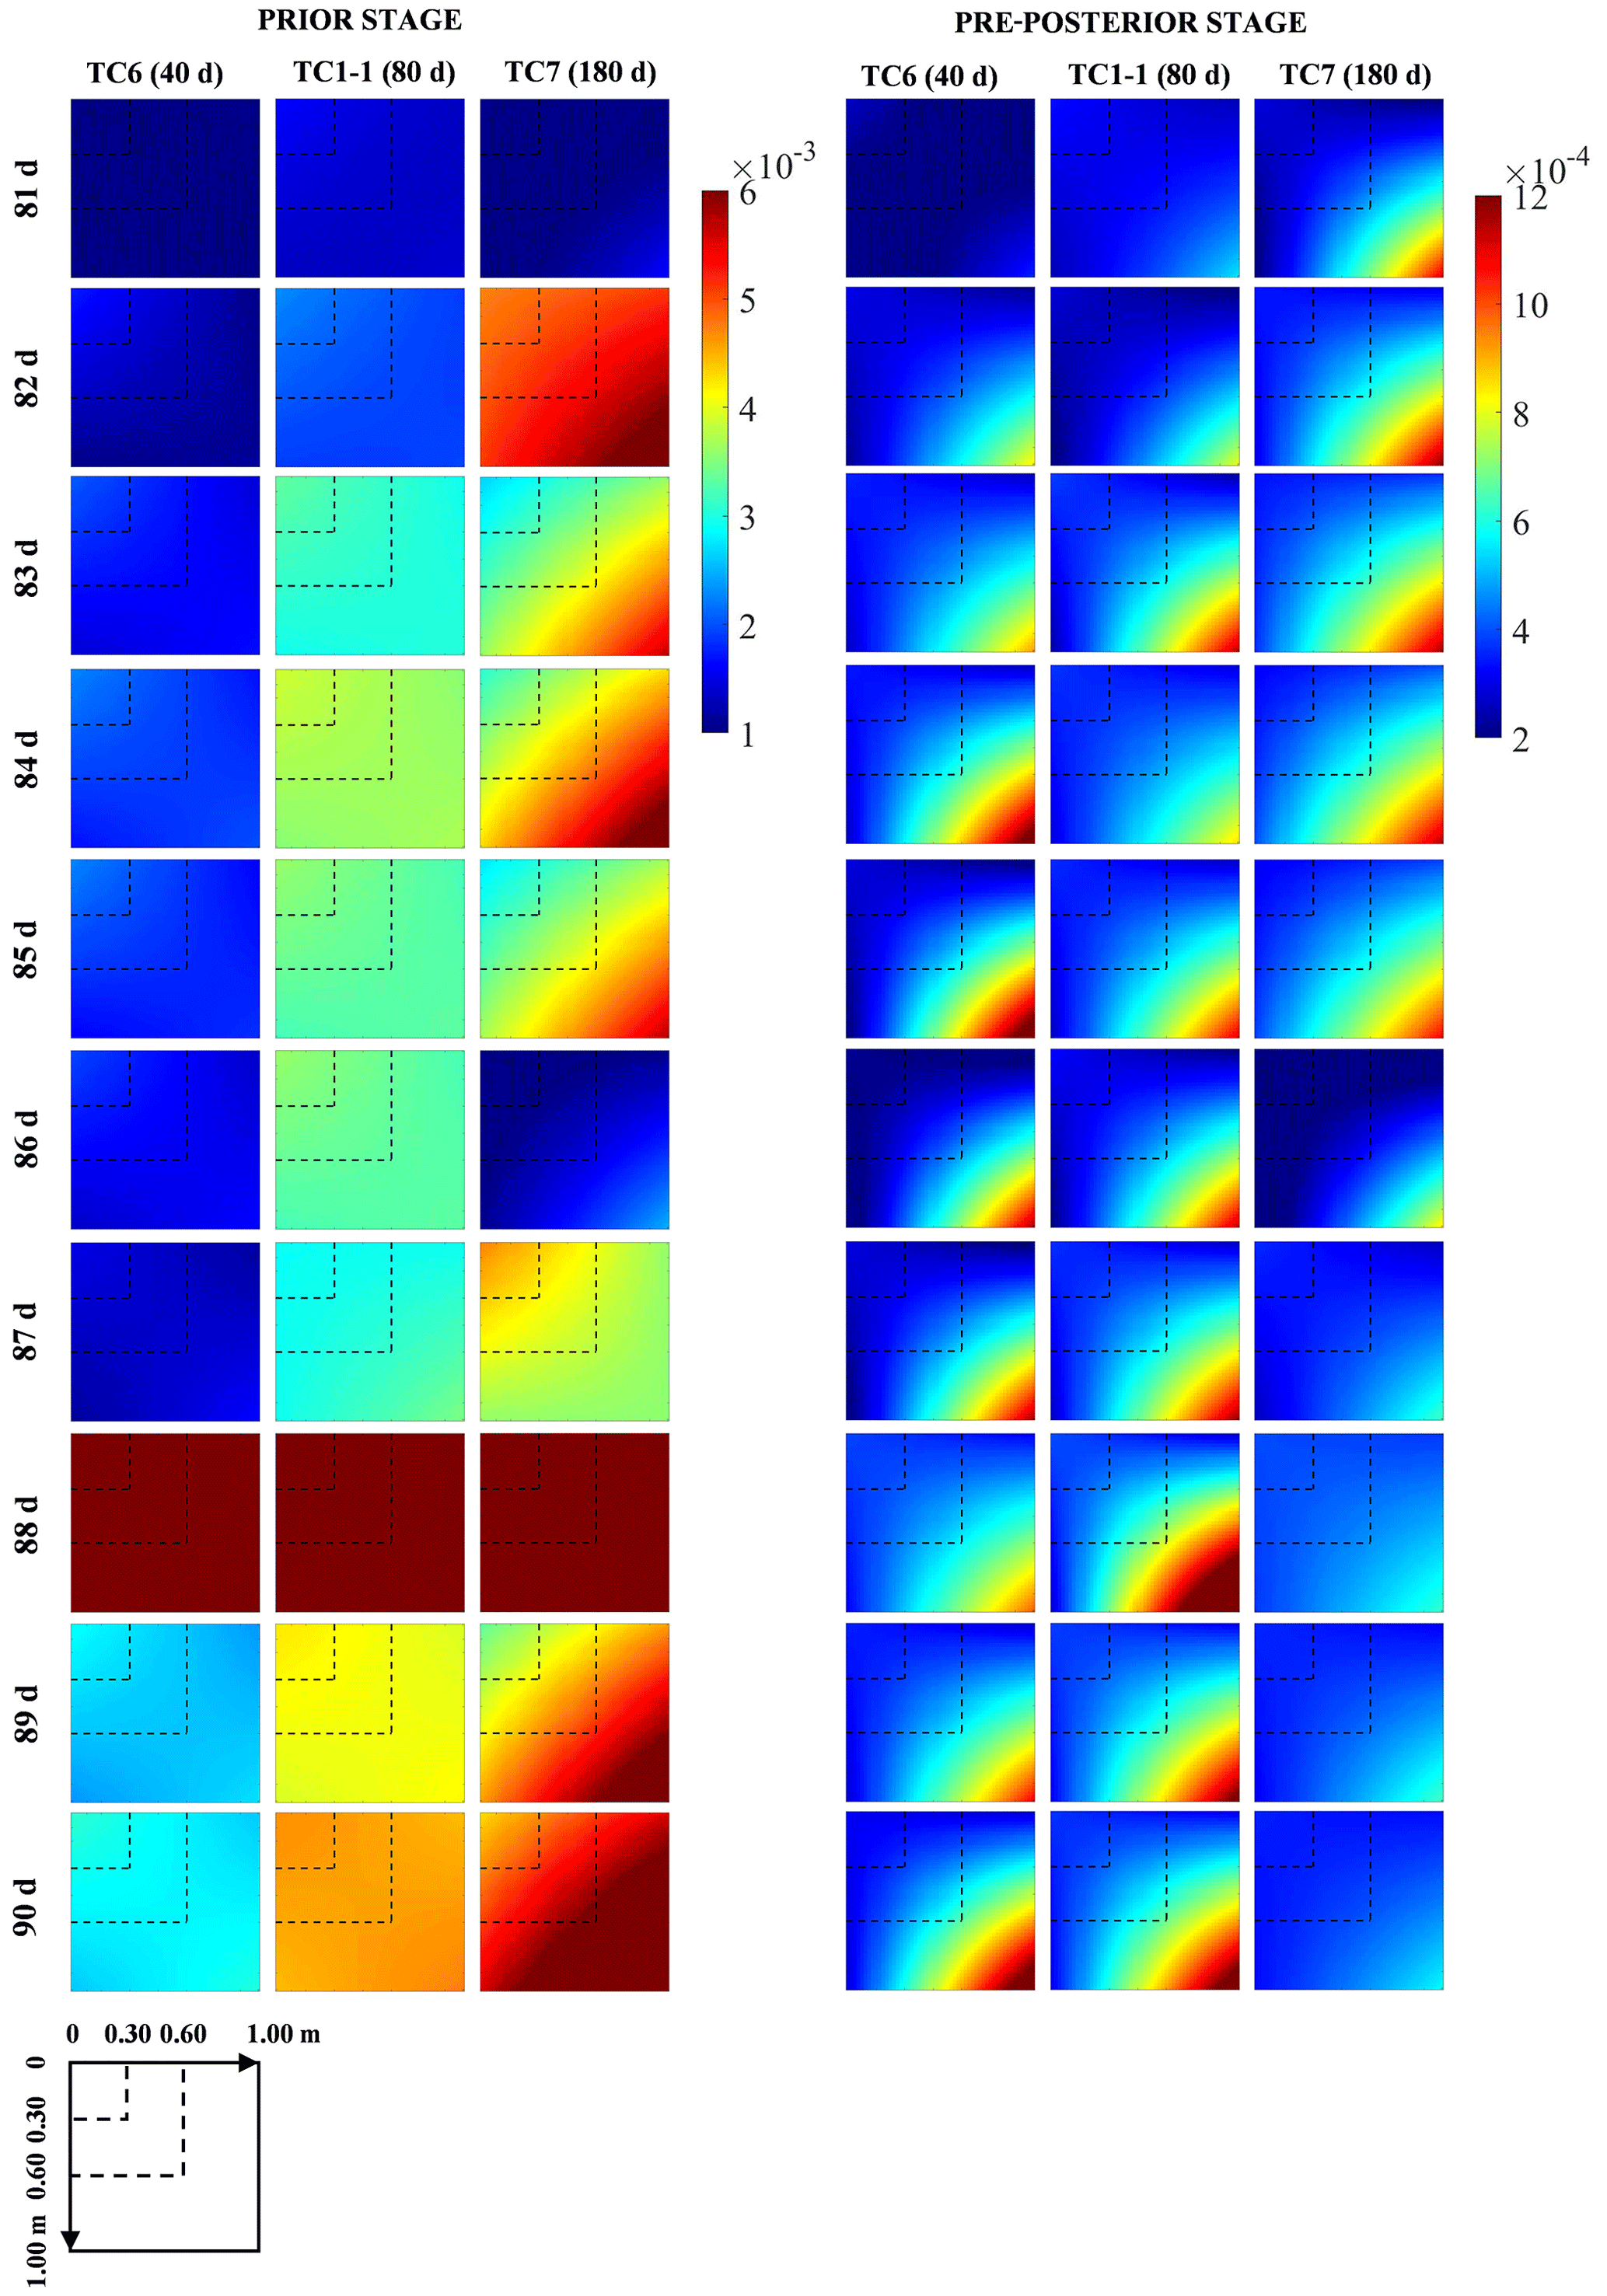
Figure 10The covariance matrices of soil moisture profiles from the 81st to the 90th day at Falkenberg in the prior and pre-posterior stages for cases TC6, TC1-1 and TC7 with 40, 80 and 180 d prior data content, respectively.
Furthermore, Fig. 9j–l depicts the time-averaged MAPE in the expected and reference data worth in cases TC6, TC1-1 and TC7, respectively. A comparison of Fig. 9a–i and j–l reveals some interesting findings: (1) similarly to the results in Sect. 4.1, the potential measurements with the largest expected (or reference) data worth in TC7 are apt to possess the highest estimation accuracy of data worth. (2) Local variations in data worth at different sites respond slightly differently to the augmentation of prior data content. For instance, even with 180 d of available historical data, the DW spike induced by the unexperienced rainfall event on the 88th day at the Falkenberg has not been eliminated or diminished (Fig. 9a, d and g). However, similar DW surges on the 82nd day at Cape were successfully mitigated as the amount of prior data content increased from 40 d (TC6) to 80 d (TC1-1) (Fig. 9e and h). This is because the prior data at Falkenberg, even if augmented to 180 day, did not cover the rainfall event on the 88th day (Fig. 2b), whereas the 80 d training data at Cape already included the scenario on the 82nd (Fig. 2d). These results agree with the conclusions reported in Wang et al. (2020) that the diversity of scenarios in the training data is more decisive than the data volume regarding the performance of data-driven methods. However, it is worth noting that the response of our nonparametric framework to the prior data augmentation is not in line with that of the physical-model-based DW analysis framework (Wang et al., 2018). In the latter, insufficient prior scenarios within the traditional framework may trigger unresolved model structural errors. When these lead to a deteriorating DW assessment performance, this cannot be compensated for by assimilating more prior data. In contrast, the elimination of dependence on physical governing equations shields our model-free DA schemes from model structural errors. Continuous enrichment of prior scenarios in the NP-DWA directly assures effective coverage of potential future scenarios, yielding the mitigation of DW local surges and an improved DW estimation accuracy. (3) Although inferior to Tr and SED, the estimation accuracy of RE is generally acceptable, especially when prior data is expanded to 180 d. This is certainly a remarkable improvement over the rather poor performance of RE in traditional parametric data worth analysis (Wang et al., 2018, 2020). This progress should be attributed to the radical abandonment of physical models in the NP-DWA, which prevented adverse effects of the high nonlinearity of soil water flow in the propagation of uncertainties from input to output (i.e., soil moisture in this study). Direct mapping from regular meteorological data to SWC facilitated the identification of the soil moisture covariance matrix from potential observations.
4.4 Effects of potential observational combinations (TC1-1, TC8 and TC9)
Figure 11a–i compares the expected (and reference) data worth of three combinations of potential observations at different depths at the three sites. It can be seen that the composite data worth of the alternative monitoring schemes exhibited an increasing pattern as the depth range of the observed SWC continued to expand downward. Nevertheless, the response of the different data worth indicators and study sites to this vertical expansion of potential observations varied slightly. Further integration of θD in TC9 did not cause a marked increase in Tr but yielded notably greater SED and RE values, especially at the DAHRA site (Fig. 11c, f and d). This is undoubtedly due to the extra consideration of the latter two indicators for the non-diagonal elements of the covariance matrix or/and the behavior of the mean. Moreover, the joint fusion of potential θS and θM failed to result in a sustained increase in Tr and RE at DAHRA while creating a significant increase in composite DW at the other two sites. This could be attributed to the sandy soil texture at DAHRA (with the fraction of sand up to 90 % and Ks=3.22 m d−1), resulting in the almost synchronous responses of the SWC at z=0.05 m and 0.50 m to the atmospheric boundary conditions (Fig. 2e) and thus triggering possible data redundancy.
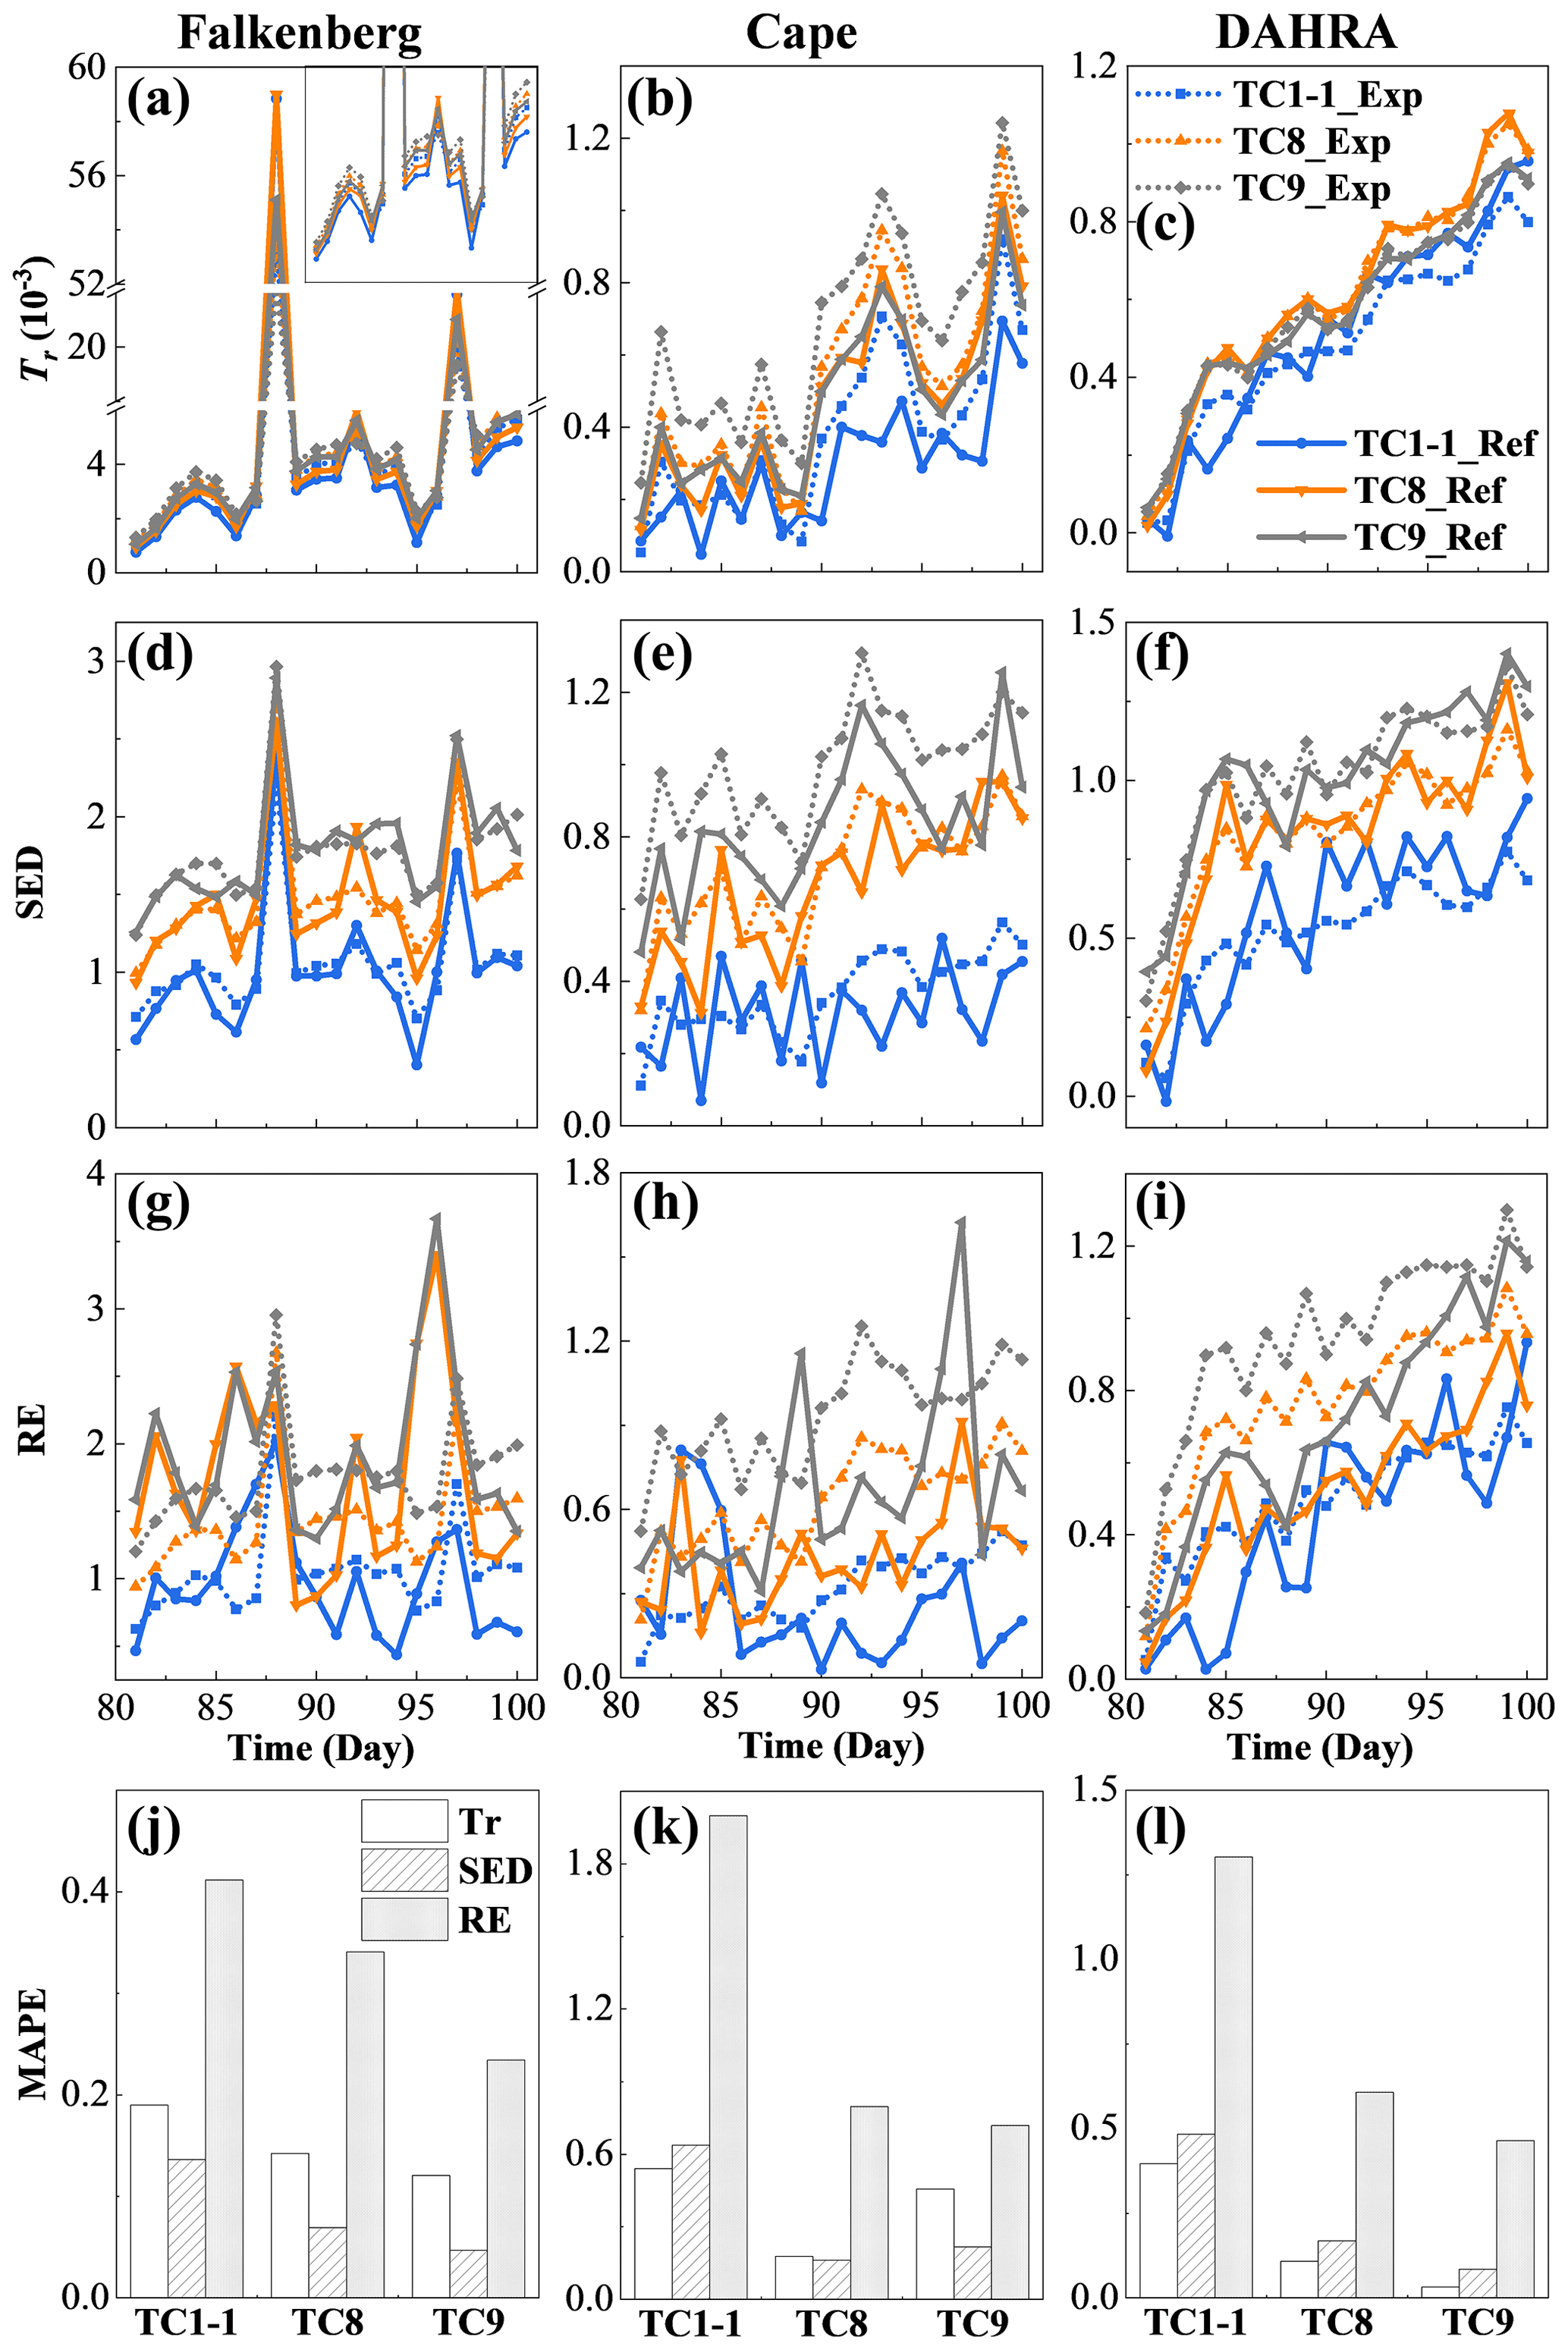
Figure 11The temporal evolution (a–i) and time-averaged MAPEs (j–l) of the expected and reference data worth in the form of Tr, SED and RE at three sites for cases TC1-1 (surface soil moisture), TC8 (surface and middle soil moisture) and TC9 (surface, middle and deep soil moisture), respectively.
Figure 11j–l further show the estimation accuracy of expected data worth for the above three potential observation combinations. Surprisingly, the increase in the number of potential observations, while making it more difficult to capture actual SWC data, ends up significantly improving the accuracy of the data worth assessment. As shown in Fig. 11j–l, as more potential observations along the vertical direction were evaluated, the MAPEs between expected data worth and its reference counterparts decreased continuously. This phenomenon actually breaks the misconceptions about the data worth assessment accuracy in previous studies, i.e., that an excellent fit of potential observations is equivalent to high-precision estimates of the corresponding data worth. For the sake of explanation, Fig. 12 shows the predicted covariance matrices of soil moisture profiles in cases TC1-1, TC8 and TC9 from the 81st to the 90th day at Falkenberg conditional on {At}, {A, B} and , respectively. It can be found that, compared to TC1-1, which only reduces the uncertainties in the surface SWC, the integration of observations at multiple depths clearly reduces the uncertainties in the entirety of the SWC profiles to a considerably lower level. This ultimately facilitates better proximity between expected and reference covariance matrices, as revealed in the fourth and seventh columns in Fig. 12. The above results suggest that the accuracy of data worth assessment of potential observations does not only depend on their capacity to capture actual measurements but is also closely related to their correlation with the variable of interest. We recall that similar phenomena also exist in the preceding test cases. For example, the weaker correlation between surface SWC observations and led to deterioration in the DW estimation performance with the largest MAPE values (Fig. 6a, d and g) even if the actual surface observations could be suitably reproduced (Fig. 3a–c). Therefore, to enhance the reliability of data worth assessment, a strategy wherein potential observations at multiple depths were simultaneously incorporated into existing DA systems was recommended in this study.
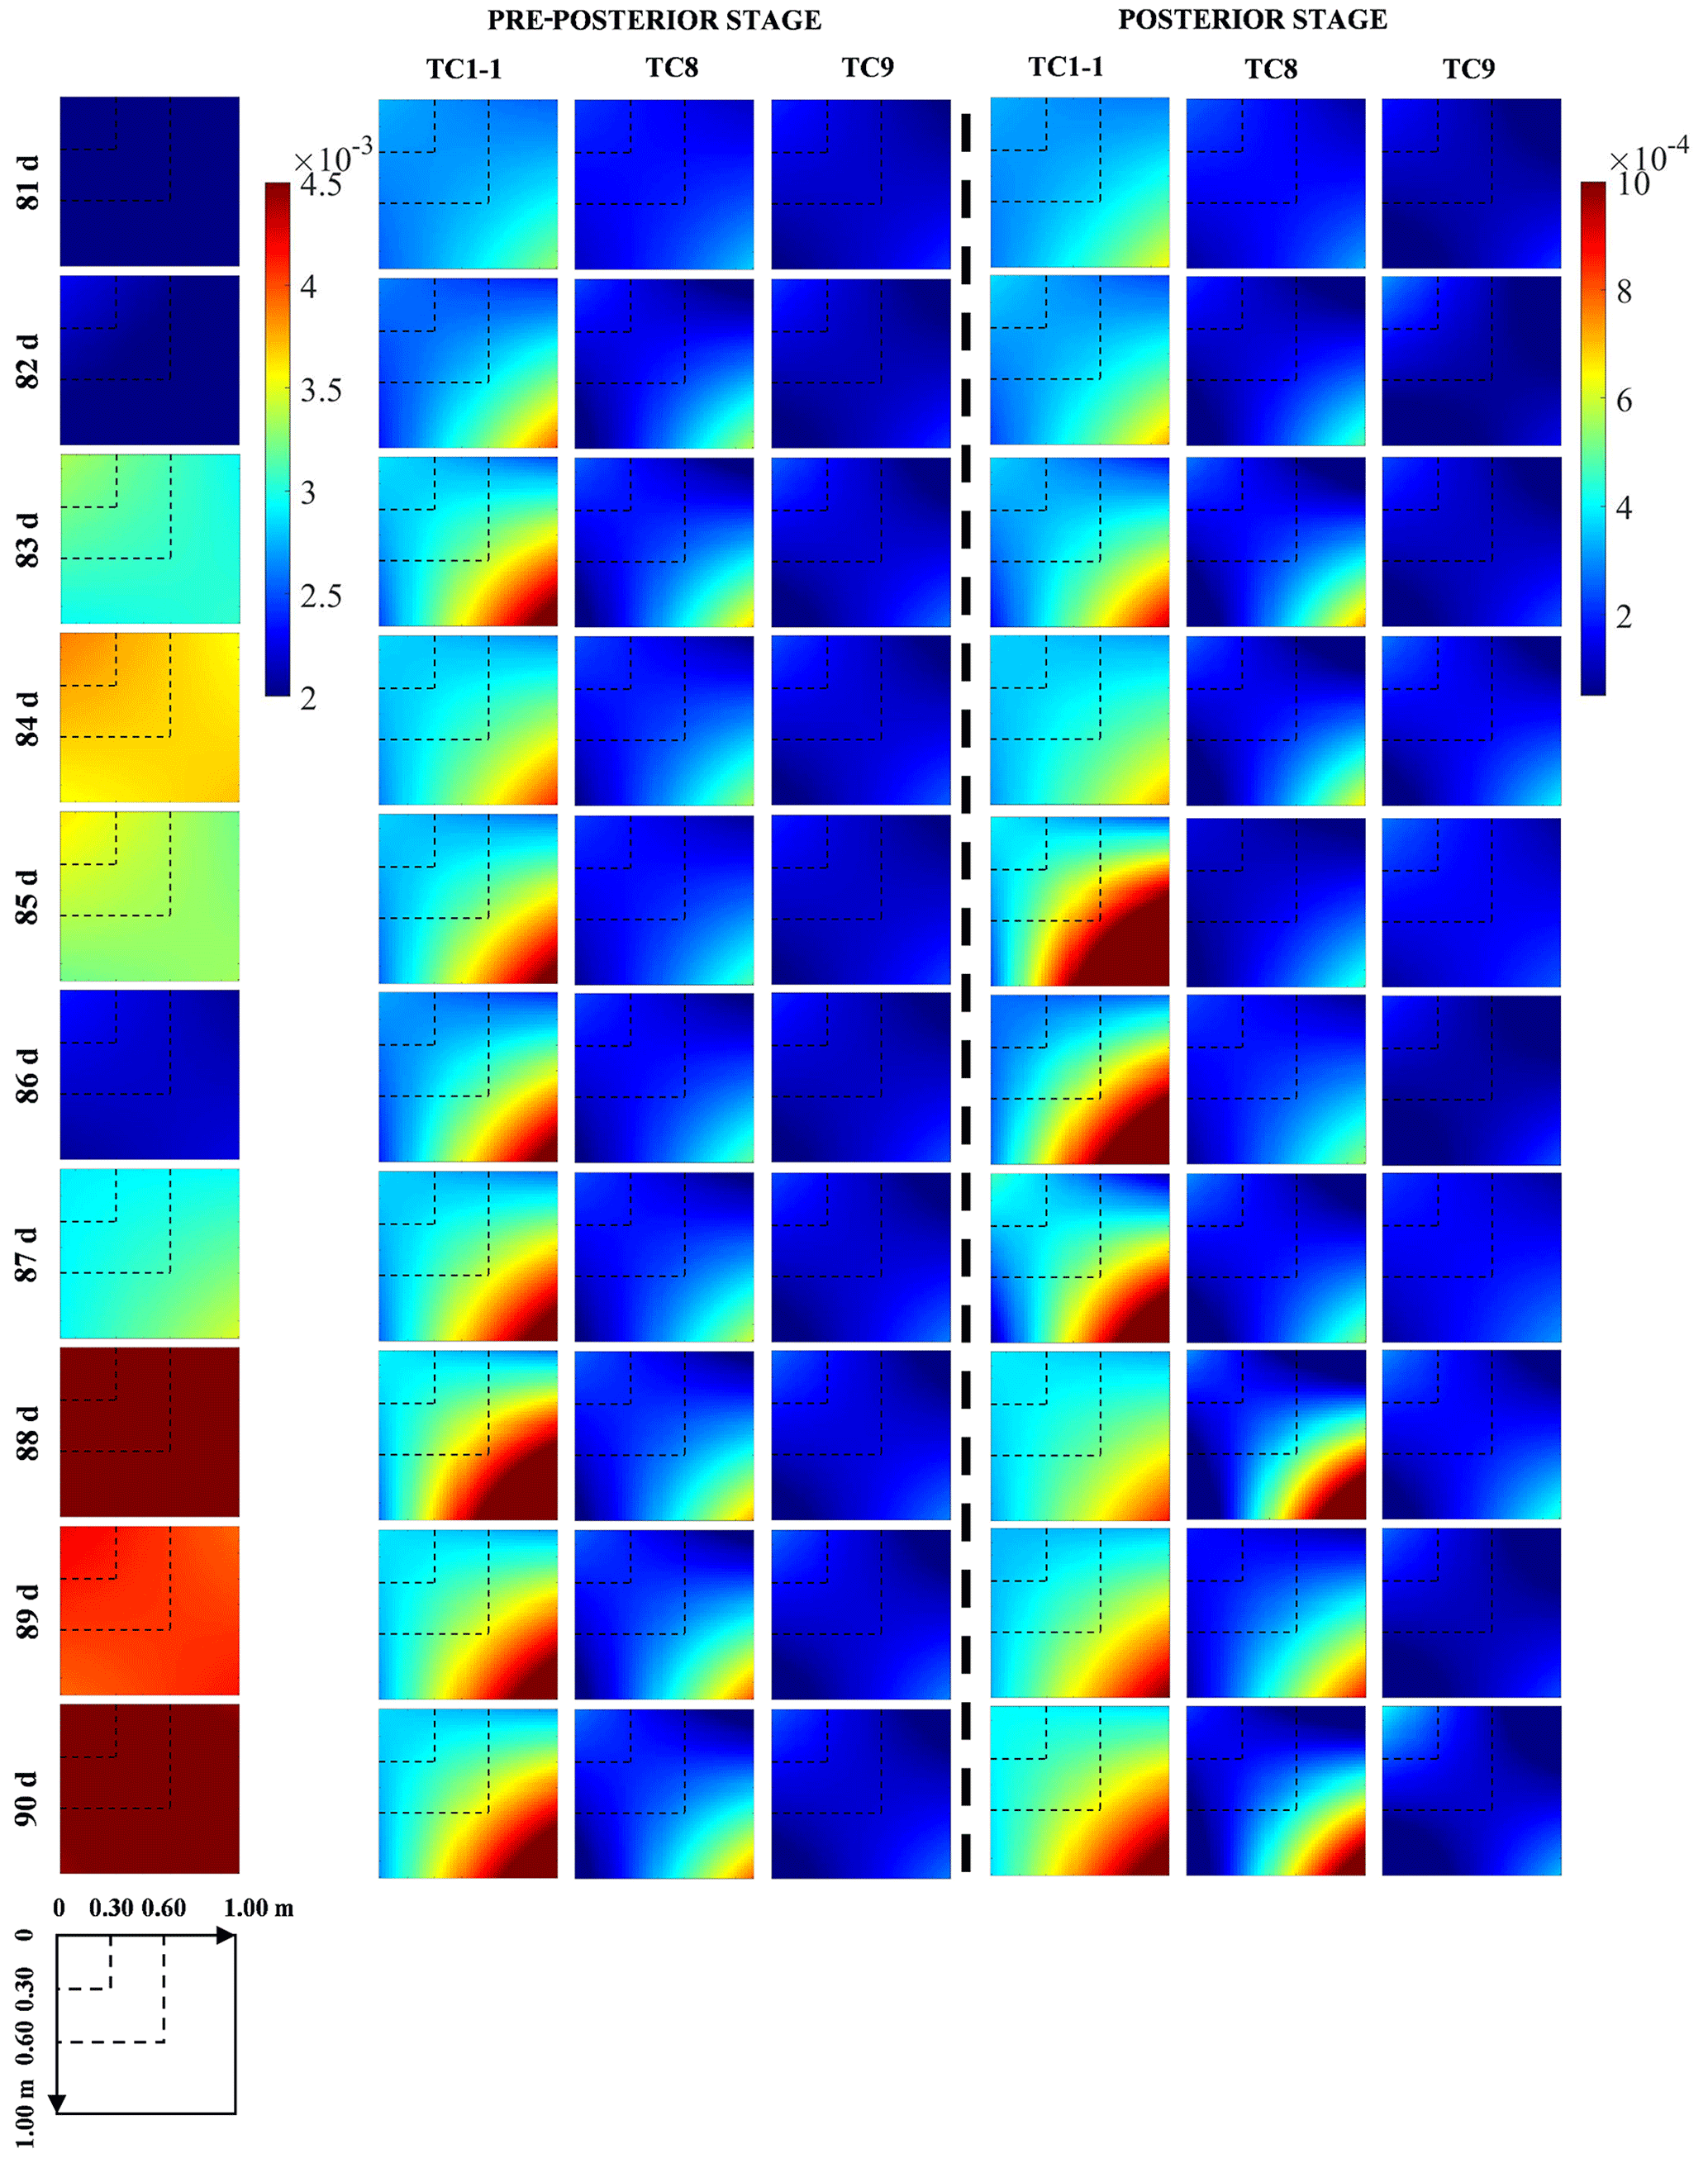
Figure 12The covariance matrices of soil moisture profiles from the 81st to the 90th day at Falkenberg before (column 1) and after potential (columns 2–4) and actual observations (columns 5–7) for cases TC1-1 (surface soil moisture), TC8 (surface and middle soil moisture) and TC9 (surface, middle and deep soil moisture) were fused, respectively.
Conventional data worth analysis for soil water problems depends on physical dynamic models. Due to the widespread occurrence of model structural errors, it may lead to biased or wrong worth assessment. The strong nonlinearity of unsaturated flow further deteriorates the DW assessment performance in the retrieval of soil moisture profiles. This study proposed a nonparametric data worth analysis method within a fully data-driven modeling framework. The information extracted from real-time soil moisture data after GP training and Kalman update was quantified with three representative types of indicators, i.e., variance- (Tr), covariance- (SED) and mean-covariance-type (RE) indicators. With the aid of a series of real-world cases, the ability and challenge of the NP-DWA in terms of the variables of interest, spatial location, observation error and prior data content were assessed. The following conclusions were drawn:
-
The proposed NP-DWA framework enabled an accurate assessment of the data worth of potential observations regarding the reconstruction of purely data-driven soil water flow models prior to data collection. Similarly to traditional DW analysis based on physical models, the overall increasing trend of the DW from the sequential augmentation of additional observations within the proposed NP-DWA framework was also susceptible to interruptions by localized surges due to never-experienced atmospheric conditions. The difference is that this biased DW in the traditional parametric method is caused by model structural errors triggered by contrasting scenarios, which is difficult to be compensated for by assimilating more prior data, while the adverse effects of anomalous GP extrapolation in our NP-DWA could be suitably avoided by the enrichment of training scenarios in prior data. Moreover, the appropriate amplification of observational noise under extreme meteorological conditions also facilitated the alleviation of these biased estimates by enhancing the generalization capacity of dynamic models.
-
The optimal observation depth shifted as the prediction target varied. In contrast to the notably higher DW of surface SWC observations within the conventional DW analysis framework based on physical models, middle SWC observations tended to exhibit considerably higher robustness in the construction of model-free soil moisture dynamic models. This should be attributed to the ability of the SWC in the middle layer to effectively reduce the predictive uncertainty of the entirety of the soil moisture profiles due to its optimal representativeness. The inherent delayed response of soil moisture profiles to rainfall events allowed this advantage of middle SWC prevalent across sites, even becoming increasingly pronounced with increasing delay effect.
-
Although the addition of prior data content could greatly improve the estimation accuracy of the expected DW, the ensuing observation noise could substantially increase the uncertainty in a purely data-driven DA system, leading to potentially higher data worth of subsequent observations. Hence, high-quality and representative small data may be regarded as a better choice than unfiltered big data.
-
The performance of data worth assessment was jointly determined by the 3Cs, i.e., the capacity of potential observation realizations to capture actual observations, the correlation of potential observations with the predicted variables of interest, and the choice of DW quantitative indicators. Furthermore, the direct mapping from regular meteorological data to SWC in our nonparametric method facilitated the identification of the soil moisture covariance matrix (especially the cross-covariance) due to its alleviation of the high nonlinearity of soil water flow problems. Hence, satisfactory estimation accuracy could also be achieved even with covariance-related data worth metrics (i.e., the SED and RE).
The code and data that support the findings of this study are available from the corresponding author upon reasonable request.
The supplement related to this article is available online at: https://doi.org/10.5194/hess-27-2661-2023-supplement.
YW: conceptualization, methodology, software, writing – original draft. XH: conceptualization, software. LW: methodology. JL: data curation, methodology. LL: supervision. KH: data curation. LS: writing – review and editing, supervision.
The contact author has declared that none of the authors has any competing interests.
Publisher's note: Copernicus Publications remains neutral with regard to jurisdictional claims in published maps and institutional affiliations.
The authors acknowledge ISMN for data support and Carl Edward Rasmussen and Christopher K. I. Williams for GP code support.
This research has been supported by the National Natural Science Foundation of China (grant nos. U2243235 and 51979200) and the Open Research Fund of Guangxi Key 60 Laboratory of Water Engineering Materials and Structures (grant no. GXHRI-WEMS-2020-06).
This paper was edited by Gerrit H. de Rooij and reviewed by two anonymous referees.
Akhtar, K., Wang, W., Khan, A., Ren, G., Afridi, M. Z., Feng, Y., and Yang, G.: Wheat straw mulching offset soil moisture deficient for improving physiological and growth performance of summer sown soybean, Agric. Water Manage., 211, 16–25, https://doi.org/10.1016/j.agwat.2018.09.031, 2019.
Amro, A., Al-Akhras, M., Hindi, K. E., Habib, M., and Shawar, B. A.: Instance Reduction for Avoiding Overfitting in Decision Trees, J. Intell. Syst., 30, 438–459, https://doi.org/10.1515/jisys-2020-0061, 2021.
Brajard, J., Carrassi, A., Bocquet, M., and Bertino, L.: Combining data assimilation and machine learning to emulate a dynamical model from sparse and noisy observations: A case study with the Lorenz 96 model, J. Comput. Sci., 44, 101171, https://doi.org/10.1016/j.jocs.2020.101171, 2020.
Brajard, J., Carrassi, A., Bocquet, M., and Bertino, L.: Combining data assimilation and machine learning to infer unresolved scale parametrization, Philos. T. Roy. Soc. A, 379, 20200086, https://doi.org/10.1098/rsta.2020.0086, 2021.
Bresler, E., Heller, J., Diner, N., Ben-Asher, I., Brandt, A., and Goldberg, D.: Infiltration from a Trickle Source: II. Experimental Data and Theoretical Predictions, Soil Sci. Soc. Am. J., 35, 683–689, https://doi.org/10.2136/sssaj1971.03615995003500050019x, 1971.
Chandrashekar, G. and Sahin, F.: A survey on feature selection methods, Comput. Electr. Eng., 40, 16–28, https://doi.org/10.1016/j.compeleceng.2013.11.024, 2014.
Dai, C., Xue, L., Zhang, D., and Guadagnini, A.: Data-worth analysis through probabilistic collocation-based Ensemble Kalman Filter, J. Hydrol., 540, 488–503, https://doi.org/10.1016/j.jhydrol.2016.06.037, 2016.
Dausman, A. M., Doherty, J., Langevin, C. D., and Sukop, M. C.: Quantifying Data Worth Toward Reducing Predictive Uncertainty, Groundwater, 48, 729–740, https://doi.org/10.1111/j.1745-6584.2010.00679.x, 2010.
Dobriyal, P., Qureshi, A., Badola, R., and Hussain, S. A.: A review of the methods available for estimating soil moisture and its implications for water resource management, J. Hydrol., 458–459, 110–117, https://doi.org/10.1016/j.jhydrol.2012.06.021, 2012.
Dunne, S. and Entekhabi, D.: An ensemble-based reanalysis approach to land data assimilation, Water Resour. Res., 41, W02013, https://doi.org/10.1029/2004WR003449, 2005.
Fienen, M. N., Doherty, J. E., Hunt, R. J., and Reeves, H. W.: Using prediction uncertainty analysis to design hydrologic monitoring networks: example applications from the Great Lakes water availability pilot project, US Geological Survey, https://pubs.usgs.gov/sir/2010/5159/ (last access: 15 July 2023), 2010.
Finsterle, S.: Practical notes on local data-worth analysis, Water Resour. Res., 51, 9904–9924, https://doi.org/10.1002/2015WR017445, 2015.
García, S., Ramírez-Gallego, S., Luengo, J., Benítez, J. M., and Herrera, F.: Big data preprocessing: methods and prospects, Big Data Anal., 1, 9, https://doi.org/10.1186/s41044-016-0014-0, 2016.
García-Gil, D., Luengo, J., García, S., and Herrera, F.: Enabling Smart Data: Noise filtering in Big Data classification, Inform. Sci., 479, 135–152, https://doi.org/10.1016/j.ins.2018.12.002, 2019.
Gu, H., Lin, Z., Guo, W., and Deb, S.: Retrieving Surface Soil Water Content Using a Soil Texture Adjusted Vegetation Index and Unmanned Aerial System Images, Remote Sens., 13, 145, https://doi.org/10.3390/rs13010145, 2021.
Hall, M. A.: Correlation-based feature selection for machine learning, The University of Waikato, https://researchcommons.waikato.ac.nz/handle/10289/15043 (last access: 15 July 2023), 1999.
Hamilton, F., Berry, T., and Sauer, T.: Kalman-Takens filtering in the presence of dynamical noise, Eur. Phys. J. Spec. Top., 226, 3239–3250, https://doi.org/10.1140/epjst/e2016-60363-2, 2017.
Hill, M. C. and Tiedeman, C. R.: Effective groundwater model calibration: with analysis of data, sensitivities, predictions, and uncertainty, John Wiley & Sons, https://wwwbrr.cr.usgs.gov/projects/GW_ModUncert/hill_tiedeman_book/exercise-files-UCODE_2005/ExerciseInstructions-mfi05-uc-v17.pdf (last access: 15 July 2023), 2006.
ISMN – International Soil Moisture Network: Welcome to the International Soil Moisture Network, https://ismn.geo.tuwien.ac.at/en/ (last access: 15 July 2023), 2023.
Hughes, G.: On the mean accuracy of statistical pattern recognizers, IEEE T. Inform. Theory, 14, 55–63, https://doi.org/10.1109/TIT.1968.1054102, 1968.
Ju, L., Zhang, J., Meng, L., Wu, L., and Zeng, L.: An adaptive Gaussian process-based iterative ensemble smoother for data assimilation, Adv. Water Resour., 115, 125–135, https://doi.org/10.1016/j.advwatres.2018.03.010, 2018.
Kashif Gill, M., Kemblowski, M. W., and McKee, M.: Soil Moisture Data Assimilation Using Support Vector Machines and Ensemble Kalman Filter1, J. Am. Water Resour. Assoc., 43, 1004–1015, https://doi.org/10.1111/j.1752-1688.2007.00082.x, 2007.
Kisekka, I., Migliaccio, K. W., Muñoz-Carpena, R., Schaffer, B., and Khare, Y.: Modelling soil water dynamics considering measurement uncertainty, Hydrol. Process., 29, 692–711, https://doi.org/10.1002/hyp.10173, 2015.
Lannoy, G. J. M. D., Verhoest, N. E. C., Houser, P. R., Gish, T. J., and Meirvenne, M. V.: Spatial and temporal characteristics of soil moisture in an intensively monitored agricultural field (OPE3), J. Hydrol., 331, 719–730, https://doi.org/10.1016/j.jhydrol.2006.06.016, 2006.
Leube, P. C., Geiges, A., and Nowak, W.: Bayesian assessment of the expected data impact on prediction confidence in optimal sampling design, Water Resour. Res., 48, W02501, https://doi.org/10.1029/2010WR010137, 2012.
Li, C. and Ren, L.: Estimation of Unsaturated Soil Hydraulic Parameters Using the Ensemble Kalman Filter, Vadose Zone J., 10, 1205–1227, https://doi.org/10.2136/vzj2010.0159, 2011.
Li, P., Zha, Y., Shi, L., Tso, C.-H. M., Zhang, Y., and Zeng, W.: Comparison of the use of a physical-based model with data assimilation and machine learning methods for simulating soil water dynamics, J. Hydrol., 584, 124692, https://doi.org/10.1016/j.jhydrol.2020.124692, 2020.
Li, X., Shi, L., Zha, Y., Wang, Y., and Hu, S.: Data assimilation of soil water flow by considering multiple uncertainty sources and spatial–temporal features: a field-scale real case study, Stoch. Environ. Res. Risk A., 32, 2477–2493, https://doi.org/10.1007/s00477-018-1541-1, 2018.
Liu, H. L., Yang, J. Y., Tan, C. S., Drury, C. F., Reynolds, W. D., Zhang, T. Q., Bai, Y. L., Jin, J., He, P., and Hoogenboom, G.: Simulating water content, crop yield and nitrate-N loss under free and controlled tile drainage with subsurface irrigation using the DSSAT model, Agr. Water Manage., 98, 1105–1111, https://doi.org/10.1016/j.agwat.2011.01.017, 2011.
Liu, K., Huang, G., Jiang, Z., Xu, X., Xiong, Y., Huang, Q., and Šimůnek, J.: A gaussian process-based iterative Ensemble Kalman Filter for parameter estimation of unsaturated flow, J. Hydrol., 589, 125210, https://doi.org/10.1016/j.jhydrol.2020.125210, 2020.
Man, J., Zhang, J., Li, W., Zeng, L., and Wu, L.: Sequential ensemble-based optimal design for parameter estimation, Water Resour. Res., 52, 7577–7592, https://doi.org/10.1002/2016WR018736, 2016.
Minns, A. W. and Hall, M. J.: Artificial neural networks as rainfall-runoff models, Hydrolog. Sci. J., 41, 399–417, https://doi.org/10.1080/02626669609491511, 1996.
Montzka, C., Moradkhani, H., Weihermüller, L., Franssen, H.-J. H., Canty, M., and Vereecken, H.: Hydraulic parameter estimation by remotely-sensed top soil moisture observations with the particle filter, J. Hydrol., 399, 410–421, https://doi.org/10.1016/j.jhydrol.2011.01.020, 2011.
Neuman, S. P., Xue, L., Ye, M., and Lu, D.: Bayesian analysis of data-worth considering model and parameter uncertainties, Adv. Water Resour., 36, 75–85, https://doi.org/10.1016/j.advwatres.2011.02.007, 2012.
Nowak, W., Rubin, Y., and de Barros, F. P. J.: A hypothesis-driven approach to optimize field campaigns, Water Resour. Res., 48, W06509, https://doi.org/10.1029/2011WR011016, 2012.
Olvera-López, J. A., Carrasco-Ochoa, J. A., Martínez-Trinidad, J. F., and Kittler, J.: A review of instance selection methods, Artif. Intell. Rev., 34, 133–143, https://doi.org/10.1007/s10462-010-9165-y, 2010.
Pechenizkiy, M., Tsymbal, A., Puuronen, S., and Pechenizkiy, O.: Class Noise and Supervised Learning in Medical Domains: The Effect of Feature Extraction, in: 19th IEEE Symposium on Computer-Based Medical Systems (CBMS'06), 22–23 June 2006, Salt Lake City, UT, USA, 708713, https://doi.org/10.1109/CBMS.2006.65, 2006.
Rasmussen, C. E.: Gaussian Processes in Machine Learning, in: Advanced Lectures on Machine Learning: ML Summer Schools 2003, Canberra, Australia, February 2–14, 2003, Tübingen, Germany, August 4–16, 2003, Revised Lectures, edited by: Bousquet, O., von Luxburg, U., and Rätsch, G., Springer, Berlin, Heidelberg, 63–71, https://doi.org/10.1007/978-3-540-28650-9_4, 2004.
Rasmussen, C. E. and Williams, C. K.: GPML Matlab Code version 4.2, http://www.gaussianprocess.org/gpml/code/matlab/doc/ (last access: 15 July 2023), 2006.
Reichle, R. H., Crow, W. T., and Keppenne, C. L.: An adaptive ensemble Kalman filter for soil moisture data assimilation, Water Resour. Res., 44, W03423, https://doi.org/10.1029/2007WR006357, 2008.
Richards, L. A.: Capillary Conduction Of Liquids Through Porous Mediums, Physics, 1, 318–333, https://doi.org/10.1063/1.1745010, 1931.
Richardson, L. F.: Weather prediction by numerical process, Cambridge University Press, UK, https://doi.org/10.1017/CBO9780511618291, 1922.
Ross, P. J.: Modeling Soil Water and Solute Transport – Fast, Simplified Numerical Solutions, Agron. J., 95, 1352–1361, https://doi.org/10.2134/agronj2003.1352, 2003.
Shannon, C. E.: Communication in the Presence of Noise, Proc. IRE, 37, 10–21, https://doi.org/10.1109/JRPROC.1949.232969, 1949.
Shi, C., Xie, Z., Qian, H., Liang, M., and Yang, X.: China land soil moisture EnKF data assimilation based on satellite remote sensing data, Sci. China Earth Sci., 54, 1430–1440, https://doi.org/10.1007/s11430-010-4160-3, 2011.
Shuwen, Z., Haorui, L., Weidong, Z., Chongjian, Q., and Xin, L.: Estimating the soil moisture profile by assimilating near-surface observations with the ensemble Kaiman filter (EnKF), Adv. Atmos. Sci., 22, 936–945, https://doi.org/10.1007/BF02918692, 2005.
Šimůnek, J., Van Genuchten, M. T., and Šejna, M.: The HYDRUS software package for simulating two-and three-dimensional movement of water, heat, and multiple solutes in variably saturated media, Tech. Man. Version 1, 241 pp., https://www.researchgate.net/profile/Jiri-Jirka-Simunek/publication/236901785_The_HYDRUS-2D_Software_Package_for_Simulating_Water (last access: 15 July 2023), 2006.
Singh, K., Sandu, A., Jardak, M., Bowman, K. W., and Lee, M.: A Practical Method to Estimate Information Content in the Context of 4D-Var Data Assimilation, SIAMASA J. Uncertain. Quantif., 1, 106–138, https://doi.org/10.1137/120884523, 2013.
Song, X., Shi, L., Ye, M., Yang, J., and Navon, I. M.: Numerical Comparison of Iterative Ensemble Kalman Filters for Unsaturated Flow Inverse Modeling, Vadose Zone J., 13, vzj2013.05.0083, https://doi.org/10.2136/vzj2013.05.0083, 2014.
van Dam, J. C. and Feddes, R. A.: Numerical simulation of infiltration, evaporation and shallow groundwater levels with the Richards equation, J. Hydrol., 233, 72–85, https://doi.org/10.1016/S0022-1694(00)00227-4, 2000.
Vauclin, M., Khanji, D., and Vachaud, G.: Experimental and numerical study of a transient, two-dimensional unsaturated-saturated water table recharge problem, Water Resour. Res., 15, 1089–1101, https://doi.org/10.1029/WR015i005p01089, 1979.
Wang, Y., Shi, L., Zha, Y., Li, X., Zhang, Q., and Ye, M.: Sequential data-worth analysis coupled with ensemble Kalman filter for soil water flow: A real-world case study, J. Hydrol., 564, 76–88, https://doi.org/10.1016/j.jhydrol.2018.06.059, 2018.
Wang, Y., Shi, L., Lin, L., Holzman, M., Carmona, F., and Zhang, Q.: A robust data-worth analysis framework for soil moisture flow by hybridizing sequential data assimilation and machine learning, Vadose Zone J., 19, e20026, https://doi.org/10.1002/vzj2.20026, 2020.
Wang, Y., Shi, L., Xu, T., Zhang, Q., Ye, M., and Zha, Y.: A nonparametric sequential data assimilation scheme for soil moisture flow, J. Hydrol., 593, 125865, https://doi.org/10.1016/j.jhydrol.2020.125865, 2021a.
Wang, Y., Shi, L., Zhang, Q., and Qiao, H.: A gradient-enhanced sequential nonparametric data assimilation framework for soil moisture flow, J. Hydrol., 603, 126857, https://doi.org/10.1016/j.jhydrol.2021.126857, 2021b.
Wierenga, P. J., Gelhar, L. W., Simmons, C. S., Gee, G. W., and Nicholson, T. J.: Validation of stochastic flow and transport models for unsaturated soils: a comprehensive field study, United States, OSTI.GOV, https://www.osti.gov/biblio/5367083 (last access: 15 July 2023), 1986.
Xu, Q.: Measuring information content from observations for data assimilation: relative entropy versus shannon entropy difference, Tellus A, 59, 198–209, https://doi.org/10.1111/j.1600-0870.2006.00222.x, 2007.
Xu, T. and Valocchi, A. J.: Data-driven methods to improve baseflow prediction of a regional groundwater model, Comput. Geosci., 85, 124–136, https://doi.org/10.1016/j.cageo.2015.05.016, 2015.
Yamanaka, A., Maeda, Y., and Sasaki, K.: Ensemble Kalman filter-based data assimilation for three-dimensional multi-phase-field model: Estimation of anisotropic grain boundary properties, Mater. Des., 165, 107577, https://doi.org/10.1016/j.matdes.2018.107577, 2019.
Yang, J., Li, B., and Shiping, L.: A large weighing lysimeter for evapotranspiration and soil-water–groundwater exchange studies, Hydrol. Process., 14, 1887–1897, https://doi.org/10.1002/1099-1085(200007)14:10<1887::AID-HYP69>3.0.CO;2-B, 2000.
Yeh, T.-C. J., Gelhar, L. W., and Gutjahr, A. L.: Stochastic Analysis of Unsaturated Flow in Heterogeneous Soils: 1. Statistically Isotropic Media, Water Resour. Res., 21, 447–456, https://doi.org/10.1029/WR021i004p00447, 1985.
Zha, Y., Shi, L., Ye, M., and Yang, J.: A generalized Ross method for two- and three-dimensional variably saturated flow, Adv. Water Resour., 54, 67–77, https://doi.org/10.1016/j.advwatres.2013.01.002, 2013.
Zhang, J., Zeng, L., Chen, C., Chen, D., and Wu, L.: Efficient Bayesian experimental design for contaminant source identification, Water Resour. Res., 51, 576–598, https://doi.org/10.1002/2014WR015740, 2015.
Zhang, Q., Shi, L., Holzman, M., Ye, M., Wang, Y., Carmona, F., and Zha, Y.: A dynamic data-driven method for dealing with model structural error in soil moisture data assimilation, Adv. Water Resour., 132, 103407, https://doi.org/10.1016/j.advwatres.2019.103407, 2019.
Zhu, X. and Wu, X.: Class Noise vs. Attribute Noise: A Quantitative Study, Artif. Intell. Rev., 22, 177–210, https://doi.org/10.1007/s10462-004-0751-8, 2004.