the Creative Commons Attribution 4.0 License.
the Creative Commons Attribution 4.0 License.
 | 14 Jun 2023
Developing a Bayesian network model for understanding river catchment resilience under future change scenarios
Christopher A. J. Macleod
Marc J. Metzger
Nicola Melville
Rachel C. Helliwell
Jim Pritchard
Miriam Glendell
The resilience of river catchments and the vital socio-ecological services they provide are threatened by the cumulative impacts of future climatic and socio-economic change. Stakeholders who manage freshwaters require tools for increasing their understanding of catchment system resilience when making strategic decisions. However, unravelling causes, effects and interactions in complex catchment systems is challenging, typically leading to different system components being considered in isolation.
In this research, we tested a five-stage participatory method for developing a Bayesian network (BN) model to simulate the resilience of the Eden catchment in eastern Scotland to future pressures in a single transdisciplinary holistic framework. The five-stage participatory method involved co-developing a BN model structure by conceptually mapping the catchment system and identifying plausible climatic and socio-economic future scenarios to measure catchment system resilience. Causal relationships between drivers of future change and catchment system nodes were mapped to create the BN model structure. Appropriate baseline data to define and parameterise nodes that represent the catchment system were identified with stakeholders.
The BN model measured the impact of diverse future change scenarios to a 2050 time horizon. We applied continuous nodes within the hybrid equation-based BN model to measure the uncertain impacts of both climatic and socio-economic change. The BN model enabled interactions between future change factors and implications for the state of five capitals (natural, social, manufactured, financial and intellectual) in the system to be considered, providing stakeholders with a holistic catchment-scale approach to measure the resilience of multiple capitals and their associated resources. We created a credible, salient and legitimate BN model tool for understanding the cumulative impacts of both climatic and socio-economic factors on catchment resilience based on stakeholder evaluation. BN model outputs facilitated stakeholder recognition of future risks to their primary sector of interest, alongside their interaction with other sectors and the wider system. Participatory modelling methods improved the structure of the BN through collaborative learning with stakeholders while providing stakeholders with a strategic systems-thinking approach for considering river basin catchment resilience
- Article
(2542 KB) - Full-text XML
-
Supplement
(2512 KB) - BibTeX
- EndNote


Freshwaters are essential for human life through the provision of drinking water and food production, regulation of climate and benefits to culture and well-being. Due to the multiple ecosystem services provided, freshwaters have become an exploited common resource, and human activity threatens their ability to provide these vital services (Dodds et al., 2013; Heathwaite, 2010; Vörösmarty et al., 2010). Driven by both population and economic growth, the availability, quality and biodiversity of freshwaters are in decline, with projected changes in climate, land use, population demographics and societal behaviour expected to accelerate negative trends (Boretti and Rosa, 2019; United Nations, 2015; Wada et al., 2016). With the pressures freshwaters face, stakeholders including governments, environmental protection agencies and businesses must work together to ensure that freshwater resources are resilient to the impacts of environmental change and can continue to provide ecosystem services both now and in the future.
Resilience was first introduced by Holling (1973) as the ability of ecological systems to absorb disturbances and retain their functions in the face of change. Adger (2000) later defined social resilience as the ability of groups and communities to cope with social, political and environmental change. The crossover between social and ecological theories led to the theory of socio-ecological system resilience (Cretney, 2014; Folke, 2006). Decision-makers must be able to understand how a system shifts from one state to another (Renaud et al., 2010) to inform resilient water management and allow freshwater systems to bounce back and adapt to variability, uncertainty and transformation (Brown, 2015). At a catchment scale, stakeholders often have competing demands for access to high-quality water for activities such as food production and drinking water supply, leading to complex interactions in socio-ecological systems. Different water uses within a catchment can lead to compounding negative impacts on freshwater resources (Pahl-Wostl, 2007). For example, in agriculture, the application of fertilisers to grow food is a source of diffuse pollution, while discharge from wastewater treatment systems leads to point source pollution (Crossman et al., 2013). Water is shared between competing stakeholders and aquatic ecosystems that also rely on clean water (Falkenmark, 2003). Hence, to ensure resilient water resources, an understanding of the complexity of socio-ecological systems is required (Pahl-Wostl et al., 2011; Plummer and Baird, 2021).
Consideration of potential future change scenarios adds further complexity when considering the resilience of freshwater resources. Focussed on managing complexity and changes which pose challenges for socio-ecological systems, resilience is understood as the ability to cope with diverse shocks and stressors due to climatic and socio-economic change (Rodina, 2019). The extent of future impacts on water systems is uncertain due to uncertainties in the scale of climatic and socio-economic factors, including population and land-use change (Holman et al., 2016). Harrison et al. (2016) highlighted that climate impact assessments that did not consider the complexities of socio-economic drivers and cross-sectoral interactions could lead to over- or underestimations of future impacts, highlighting the need for stakeholder participation in the consideration of future change impacts.
Participatory modelling approaches improve understanding of socio-ecological systems and environmental problems (Gray et al., 2018). Stakeholder engagement is a key element of participatory modelling, where the involvement of diverse stakeholder groups provides valuable conceptual knowledge of system components and their relationships (Hare, 2011). Stakeholders as components of socio-ecological systems was recognised by Walker et al. (2002), who proposed that stakeholders should lead the development of conceptual system modelling as a first step in analysing resilience.
In a review of participatory modelling methods, Voinov and Bousquet (2010) presented Bayesian networks (BNs) as a participatory modelling approach. BNs are probabilistic graphical models that represent the causal probabilistic relationships between a set of random variables (Barton et al., 2012). A BN consists of two key components; a directed acyclic graph which represents the dependencies between nodes in a system and conditional probabilities which quantify the strength of the dependences between nodes (Kaikkonen et al., 2021; Pearl, 1986). Nodes and their relationships within a system are easily visualised, allowing the network structure to be assessed, modified and discussed by experts and stakeholders who know the system being represented by the BN (Aguilera et al., 2011).
BNs can be used as a resilience analysis tool due to the ability to enable the participation of stakeholders in the development of conceptual system modelling and their application to explore future pathways by analysing “what if?” scenarios (Phan et al., 2019; Moe et al., 2019). The ability of BNs to handle uncertainty and complexity had made them a widely used approach in the field of water resource management (Phan et al., 2016; Castelletti and Soncini-Sessa, 2007). Moe et al. (2021) suggested that BNs can improve environmental risk assessment, which is demonstrated by Wade et al. (2021) who applied a BN model to measure the risks of multiple stressors on water quality and quantity.
Common applications of BN models use discrete variables (Aguilera et al., 2011) involving the division of continuous variables into many distinct states (Mayfield et al., 2020). Discrete BN models face the limitations of discretisation, including a reduction of statistical accuracy and loss of information (Chen and Pollino, 2012; Xue et al., 2017). Hybrid BNs include both discrete and continuous variables to overcome discretisation limitations and make the best use of available environmental data (Aguilera et al., 2013); however, their application in environmental risk assessment is scarce (Moe et al., 2021). Knowledge gaps related to the application of BN models highlighted by Moe et al. (2021) include consideration of cumulative stressors in risk assessment models (Landis, 2021) and the integration of ecological and socio-economic aspects.
Addressing the knowledge gaps described, we tested the ability of a BN model to enable stakeholders to engage with complexity and uncertainty associated with (1) holistic understanding of complex catchment systems and the relationships between natural and social factors and (2) simulating the cumulative impacts of uncertain future climatic and socio-economic change in a single framework, using participatory BN methods.
2.1 Study area: Eden catchment
Our research focused on the river Eden catchment in eastern Scotland, in collaboration with the Scottish Environment Protection Agency (SEPA) – Scotland's environmental regulator – and Scottish Water – a statutory corporation that provides water and sewerage services across Scotland. The river Eden catchment was identified as an appropriate case study due to deteriorating water quality trends which are attributed to the influence of both diffuse and point source pollution from multiple sectors within the catchment.
The Eden catchment (320 km2) is situated in the Fife region in eastern Scotland (Fig. 1). The river Eden originates in the Ochil Hills to the east of the catchment, flowing through predominantly arable agricultural land (51 %; Morton et al., 2020), much of which is high-quality agricultural land on fertile soils (Environmental Change Network, 2021; Macgregor and Warren, 2016). The river Eden then flows east through the urban settlement of Cupar. A further eight tributary water bodies can be found in the catchment.
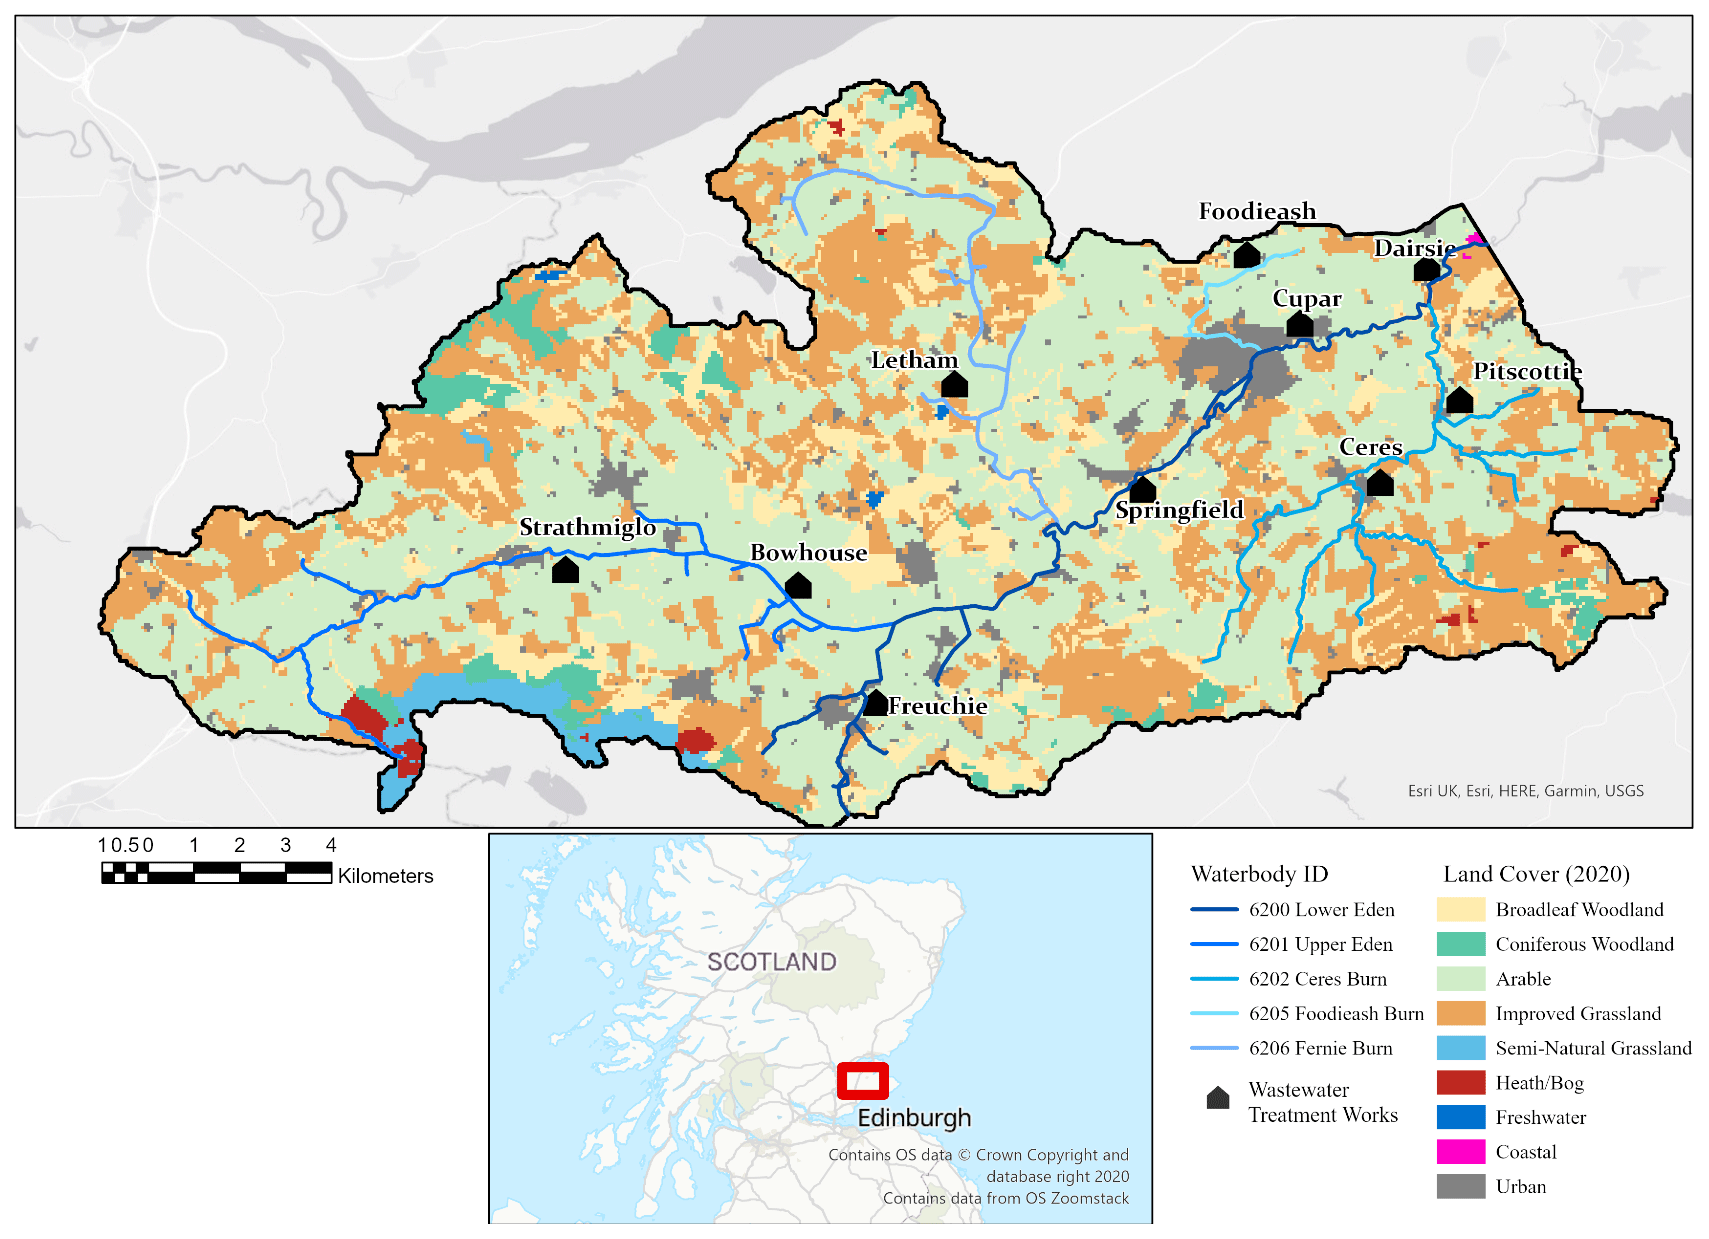
Figure 1The river Eden catchment, Fife, Scotland. Land cover data provided by Morton et al. (2020). Acknowledgements: catchment boundary provided by the National River Flow Archive. River network provided by the EU-Hydro River Network database (Gallaun et al., 2019). Map created in ArcGIS Pro (Esri Inc., 2021).
SEPA continues to monitor the ecological status of water bodies in the catchment as part of the European Union (EU) Water Framework Directive (WFD) obligation to produce River Basin Management Plans (RBMPs). Despite the UK's exit from the EU, the WFD legislation remains in place in Scotland. In 2019, the upper stretch of river Eden was classified as being in poor ecological status and the lower stretch of the river Eden stretch was classified as being in moderate ecological status.
Waterbody reactive phosphorus (RP) concentration is a key parameter that contributes to the poor and moderate classifications. The high RP concentrations are caused by wastewater discharges from Scottish Water wastewater treatment work assets (Fig. 1.), diffuse pollution sources from agriculture, private septic tanks and in-stream phosphorus release from sediments during low flows.
Previous modelling and monitoring carried out in the Eden catchment provide an understanding of the current ecological status of the catchment. The need for a complementary future-focussed, systems-thinking tool to address the water quality and water resource issues in the catchment was identified by SEPA and Scottish Water. The tool would be required to support the trial of a new decision-making method called One Planet Choices1, co-developed by SEPA and Scottish Water, in the Eden catchment (SEPA, 2020). The Eden catchment was selected due to the current complexity of both water quality and quantity issues, with the added complexity of multiple contributing sectors.
The One Planet Choices pilot project aims to deliver a future-focussed, systems-based approach to decision-making to help identify solutions that are resilient to future challenges. The method aims to take account of interdependencies between both natural and human systems to achieve good ecological status and also deliver wider benefits through the identification of both innovative and collaborative management solutions. One Planet Choices takes account of a range of capitals, including natural, social, manufactured, financial and intellectual. Specific resources are considered for each capital. For example, strength of community relationships for social capital, energy and chemical demands for manufactured capital, and monetary costs and benefits for financial capital.
To inform innovative and collaborative management solutions, an understanding of the extent to which water quality and quantity issues will change in the future and the extent to which different sectors will contribute to catchment issues now and in the future is required. Our methods involved stakeholder participation in the mapping of the socio-ecological system and important relationships that currently contribute to the water-related issues in the catchment. We developed plausible climatic and socio-economic future scenario pathways to measure catchment system resilience.
2.2 BN model construction
To construct a BN model to meet the needs of the One Planet Choices framework, we developed a five-stage participatory approach (adapted from Pollino and Henderson, 2010) (described in detail in Sect. 2.2.1 to 2.2.5 and shown in Fig. 2a). Based on the ladder of participation outlined by Basco-Carrera et al. (2017) we identified two stakeholder groups to be involved in the research. As direct research users, One Planet Choices method developers from SEPA and Scottish Water, who participated in co-design and decision-making throughout the research, are referred to as the “project team”. The second group of stakeholders, with direct knowledge of the socio-ecological system in the Eden catchment, are referred to as “catchment stakeholders” who participated at various levels from discussion and consultation.
2.2.1 Stage 1: discuss model aim and objectives
To understand knowledge needs and confirm the appropriateness of a BN model approach, we held six initial engagement meetings with the project team (Fig. 2., panel A). Stakeholder needs were defined within the model aim: to measure the resilience of the catchment system to the impact of future shocks and changes and their influence on key capital resources.
Objectives identified to achieve the model aim were to: (1) ensure systems thinking by mapping the socio-ecological interactions in the catchment; (2) measure the impacts of continuing current practices and trends into the future, called the future Business As Usual (BAU), shocks of extreme events and diverse pathways for future climatic and socio-economic change to a 2050 time horizon; (3) use a holistic capitals approach to measure the current and future health of the catchment; and (4) identify specific aspects of the catchment system that are least resilient to the impacts of future change.
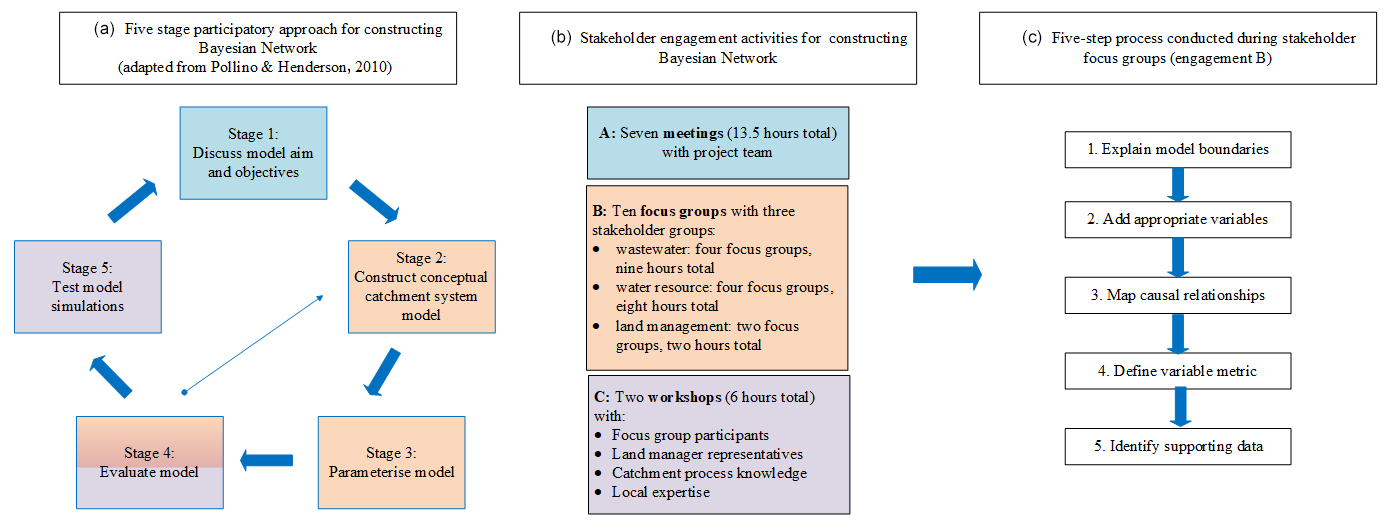
Figure 2Model section headings used to ensure a linear cause-and-effect Bayesian network model structure during participatory methods.
Further discussions involved setting model boundaries (Jakeman et al., 2006). A previous rapid assessment by Scottish Water and SEPA using the One Planet Choices method and water quality source apportionment modelling in GIS identified the need to focus the work on the following five waterbody sub-catchments: lower Eden (6200), upper Eden (6201), Ceres Burn (6202), Foodieash Burn (6205) and Fernie Burn (6206) (see Sect. S1, Fig. S1 of the Supplement for a visual representation). Each waterbody sub-catchment is either not meeting good ecological status currently or is at risk of not achieving good status in the future.
Reactive phosphorus (RP) was identified as the specific parameter to reflect water quality. Wastewater, land management and water resource systems were identified as critical for influencing RP concentrations in the catchment based on previous scoping and dependency mapping exercises during the mentioned rapid assessment. Catchment stakeholders with a knowledge of each of the three critical systems (wastewater, water resource and land management) within both SEPA and Scottish Water were selected to participate in model co-construction.
To give an overall measure of the resilience of the catchment system, the project team required the model to take a holistic approach to investigate current and future impacts on five key capitals and their associated capital resources. Capitals identified by the project team included natural capital and resources related to the quality and quantity of air, water and land. Social capital including the relationships and impacts on local communities. Manufactured capital, specifically the conditions of assets and changes in the use of energy and chemicals. Financial capital, including changes in costs and incomes associated with resource use, asset conditions and changes in environmental conditions. Intellectual capital, focussing on the potential changes in the reputation of sectors within the catchment.
Model section headings (Fig. 3) were agreed upon with the project team at the outset to clarify the modelling purpose with different stakeholder groups and ensure that the elicited cause-and-effect relationships were linear.
2.2.2 Stage 2: construct a conceptual catchment system model
We conducted a series of focus groups (Fig. 2., panel B) to construct the BN model with stakeholders who had knowledge of the three critical systems: wastewater, water resource and land management. A total of 12 stakeholders participated in the focus groups, who were each given a specific identifier code based on their knowledge of the catchment system. Codes and critical system associations for all participants can be found in Sect. S2, Table S1.

Figure 3Five-stage participatory approach used to create the Bayesian network model (a). Stakeholder engagement activities involved in each stage of model construction (b). Five-step process used during stakeholder focus groups (c).
A five-step process (Fig. 2c) was used to construct the BN model with the focus groups. The aims of both the model building and model boundaries were explained to participating stakeholders as a first step. The second step identified appropriate nodes under each boundary heading using the GeNIe modeller (version 2.4.4601.0) (BayesFusion, 2017). Political, economic, social, technological, environmental and legal headings taken from the PESTEL analysis framework (Yüksel, 2012) provided a basis for supporting node selection under the “future change” heading. The “influence on the catchment system” heading was used to support stakeholders in the identification of important nodes that define the system and the potential “consequences of change” that could occur due to the influence of future impacts. Identification of “capital resources” within the catchment was determined by the pre-defined five key capitals – natural, social, manufactured, financial and intellectual – and the important system-specific nodes identified by stakeholders. The key “capitals” were used to summarise the outputs of the model.
In the third step, stakeholders mapped the causal relationships between nodes identified under each heading, representing the direction of cause and effect relationships (Borsuk et al., 2004). In step four, a variable log was used to define each node and the metrics in which they should be measured. The variable log was also used in step five to record the data that stakeholders believed would be relevant for model parameterisation. Data for model parameterisation were collected in collaboration with both stakeholders from the project team and those who participated in the focus groups. During the collection of data, catchment-specific information, such as the specific wastewater treatment works and their locations, were also identified. Data, metrics and catchment-specific information provided by stakeholders for each model variable informed the spatio-temporal resolution of the model.
A model description is presented in Sect. S3, Table S2, which describes all nodes included in the BN model, model equations, discretisation, data used for model parameterisation, justification for node inclusion and all decisions made during model construction and parameterisation. The supporting parameter values for each node in the model are also provided in Sect. S3, Table S3.
2.2.3 Stage 3: parameterise the model
We developed a hybrid BN model based on the modelling aim and the data available. Hybrid BN models include both discrete and continuous nodes, where the relationships between continuous nodes can be represented as equations (Marcot and Penman, 2019). Discrete nodes adopt a set of states which describe different conditions, and continuous nodes adopt a finite number of values presented as statistical distributions (BayesFusion, 2017). Our model contained 417 nodes, 623 arcs and 23 sub-models. Despite not being a spatial model, there are some geographical considerations included to represent five sub-catchments. Across the five sub-catchments the model included 10 wastewater assets, two public water drinking assets, four land-cover types, four crop types and septic tanks. Dividing the model into sub-catchments resulted in repetition of nodes and arcs.
Discrete choice nodes were used to represent and simulate different future pathway scenarios. The model incorporates Representative Concentration Pathways (RCPs) as the basis for measuring changes in climatic factors, using the UK Met Office (United Kingdom) Climate Projections 18 (Lowe et al., 2018). The RCPs were coupled with Shared Socio-economic Pathways (SSPs) to simulate socio-economic factors of change. We used the latest SSP narratives for the UK produced by Pedde et al. (2021) to frame the direction of change for the socio-economic factors such as population and land cover. We coupled three RCPs and SSPs for inclusion in the model as a deterministic choice node to allow for a range of scenarios; RCP2.6 was coupled with the Green Road narrative, RCP6 was coupled with the Middle of the Road narrative and RCP8.5 was coupled with the Fossil-Fuelled Development narrative. We defined the coupled scenarios using the SSPs narrative names (O’Neill et al., 2017), except for the Middle of the Road narrative which was defined as the future Business As Usual (BAU) pathway, based on interpretations made by the stakeholder project team.
Under the model boundary heading “future change”, precipitation change, land-cover change and population change nodes were identified by stakeholders. We used equation-based nodes to quantify the extent of future change and create a relationship with the discrete choice nodes that represent the three different pathway scenarios – Green Road, Business As Usual and Fossil-Fuelled Development – allowing model users to perform varying scenarios of the BN model.
Catchment-specific precipitation anomalies for probabilistic projections from the UK Climate Projections User Interface were used to quantify future precipitation change for each of the RCPs represented in the model (Sect. S4, Table S4). We used the mean annual precipitation rate anomaly to represent precipitation change for annual scenarios. To represent shocks to the system, we used extreme exceedance percentile values for seasonal summer (Q5 exceedance) and winter precipitation (Q95 exceedance) anomalies.
Population projection data provided by an internal Scottish Water Growth model until 2030 were used to quantify likely future population change. The data provided included both the raw and real population equivalents (PEs), which represent the populations that are served by water assets in the catchment. Real PE projections are based on local authority strategic and local development plans. Raw PE projections use likely future population projections supplied by the National Registers of Scotland. Real PE projections are conservative in comparison to raw PE projections. The raw and real PE projections were extrapolated until 2050, using different considerations of how population growth might change until 2050 based on the SSP narratives and input from stakeholders with knowledge of conditions in the catchment. Projected PE change values until 2050 for the differing scenarios in comparison to the average PE 2016–2019 at locations within the Eden catchment are provided in Sect. S4 (Table S5 and Fig. S3).
Land cover change projections until 2050 were quantified using UKCEH land cover vector maps 1990, 2007 and 2015–2019 (Morton et al., 2020) in ArcGIS Pro (version 2.58.0) (Esri Inc., 2021) to analyse current and historic land cover change in the catchment. We applied a story and simulation approach (Alcamo, 2008; Rounsevell and Metzger, 2010) to change the percentage cover of each land cover type in each of the five waterbody sub-catchments. Percentage changes were based on the analysis of land cover trends from 1990–2019, the different SSP narratives and the local knowledge of stakeholders to ensure the total possible land cover for the catchment could not be exceeded and the changes in land cover types were realistic. The percentage cover was converted to hectares (Ha) for each land cover type in each of the waterbody sub-catchments (Sect. S4, Figs. S4–S8). Projected land cover change values in comparison to 2019 land cover for the entire catchment are provided in Sect. S4 Fig. S9. Section S4 includes a detailed description of how land cover values were derived.
A combination of monitoring data, processed-based model outputs and literature were used to represent baseline conditions of system states. Where supporting continuous data were available, we fitted truncated normal prior distributions by calculating the mean and standard deviation from available values. Truncated normal distributions were fitted to avoid negative values, where appropriate. Secondly, where longer data records were available, we used a built-in GeNIe function to fit a custom prior distribution (histogram) to time-series data. Where available data were limited to a single deterministic value and statistical moments could not be calculated, we applied scenario modelling using the diverse coupled future pathways as a best available method for representing uncertainty. Equations linked the chain of cause (parent) and effect (child) relationships from future change nodes to catchment system nodes, to capital resource nodes and, finally, to capital output nodes. The model was updated using the default GeNIe software hybrid forward sampling algorithm. The algorithm computes 10 000 samples from the prior probability distributions of parentless nodes, which it then used to generate samples in child nodes of the prior parent node distribution(s), generating probability distributions. Summary statistics (mean, standard deviation, minimum and maximum) were derived from the probability distributions for each node, which were compared for different current and future pathway scenarios.
Continuous nodes were discretised into four states, resilient, low risk, moderate and high risk, based on the expert knowledge of stakeholders. A manual discretisation method (Beuzen et al., 2018) was used for nodes where state threshold values were defined by stakeholders and documented (e.g. asset and environmental licences). Where defined values were not available, we used a combination of manual and unsupervised equal interval discretisation methods (Aguilera et al., 2011; Beuzen et al., 2018; Chen and Pollino, 2012). Manual methods set the resilient-state threshold value based on current conditions and an upper limit value as an unlikely value to exceed, in most cases, an infinity value. The “uniformize” function in GeNIe allowed for equal widths for low-, moderate- and high-risk-state threshold values. We presented a dual representation of continuous nodes using a discretised child node to support the communication of the results using both summary statistics (median and standard deviation) available in continuous outputs and the probability of model outputs falling into agreed risk classes available in discrete variables
For all capital and many capital resource nodes identified, either no defined metric or supporting data were available. To measure the resilience of capital and capital resource values, we designed a novel approach using nested IF statement equations whereby each discretised state in a parent node, from resilient to high risk, was assigned a value of zero, one, two or three, and the scores for each child node were summed. For example, if a parent node was within a resilient-state threshold, a value of zero was assigned. As multiple parent nodes were associated with capital and capital resource variables, the sum of the IF statement was used to determine their overall state. The IF statement indexing method follows the “one out, all out” approach applied to the evaluation of Good Ecological Status in the EU Water Framework Directive, as described in Carvalho et al. (2019). The one out, all out approach adopts the precautionary principle to prevent masking of undesirable outcomes when averaging scores and provides an easy and transparent way of measuring overall variable states. Discretising and indexing continuous nodes represent the probability of the states for capitals and their associated resource nodes, which can be compared across different future scenarios. A detailed example of the IF statement indexing method is provided in Sect. S5.
2.2.4 Stage 4: evaluate the model
The BN model structure was validated using expert opinion (Marcot et al., 2006) during the engagement focus group sessions (Fig. 2, panel B) with stakeholders from SEPA and Scottish Water. We then presented the BN model to additional stakeholders during two workshops for validation (Fig. 2, panel C). These additional stakeholders were chosen to represent the views of other sectors and provide catchment-specific knowledge and expertise. A total of 10 stakeholders participated across the two workshops, six of whom did not participate in the focus groups (see Sect. S2, Table S1 for additional codes and associations). The first workshop included eight attendees and the second included seven attendees. We used the credibility, salience and legitimacy evaluation criteria (Falconi and Palmer, 2017) to measure the success of the participatory approach at each stage of the BN model construction.
Model performance was evaluated using a goodness-of-fit method (Aguilera et al., 2011) using 52 bi-monthly observed RP concentrations in micrograms per litre (µg L−1) collected in sub-catchment 6200 collected between 2017–2019. We fitted a histogram using the custom function tool in GeNIe to create an “observed phosphorus concentration (µg/l) 6200” variable, which was both parentless and childless. We evaluated sub-catchment 6200, as this is the catchment outlet for all sub-catchments. Computing the Current model scenario, we compared the median, standard deviation and discretised class probabilities – informed by the WFD classification boundaries for the sub-catchment – for both the modelled RP concentrations and observed RP variables to evaluate model goodness of fit.
A bias (%) method (Eq. 1) applied by Glendell et al. (2022), with a departure of ±50 % from observations considered behavioural, was used to further evaluate model performance as
where Xsim is the modelled RP concentration (µg L−1), and Xobs is the observed RP concentration (µg L−1).
A one-at-a-time parameter sensitivity analysis was conducted to determine which input variables contributed the greatest variability to model outputs (Wöhler et al., 2020; Hamby, 1995). We used the target variable RP concentrations (µg L−1) at the 6200 catchment outlet to determine the sensitivity of the model to diffuse pollution phosphorus loads and point source wastewater phosphorus loads. The sensitivity analysis compared the median RP concentration (µg L−1) for the current scenario against the ±20 % difference for diffuse arable, pasture and septic tank P sources and wastewater P sources while holding other input values constant.
2.2.5 Stage 5: test model scenarios
We tested model scenarios by presenting scenario outputs during the second workshop. After presenting model outputs during the series of workshops, the iterative cycle returns to the first stage of discussing the model aim and objectives. A seventh meeting (Fig. 2, panel A) was conducted by the project team to provide a final evaluation of the BN model based on the aims and objectives set out at the beginning of the participatory approach.
3.1 Model structure
Focus groups (Fig. 2, panel B) and workshops (Fig. 2, panel C) provided the opportunity for stakeholders from wider sectors to build and evaluate the graphical BN model structure. An initial conceptual model structure was presented as a system diagram of the key nodes included in the BN model (Fig. 4), with arrows representing cause-and-effect relationships between nodes. Stakeholder feedback on the representativeness of the model structure of the Eden catchment is also presented in Fig. 4. A detailed visualisation of the model is provided in Sect. S3, Fig. S2.
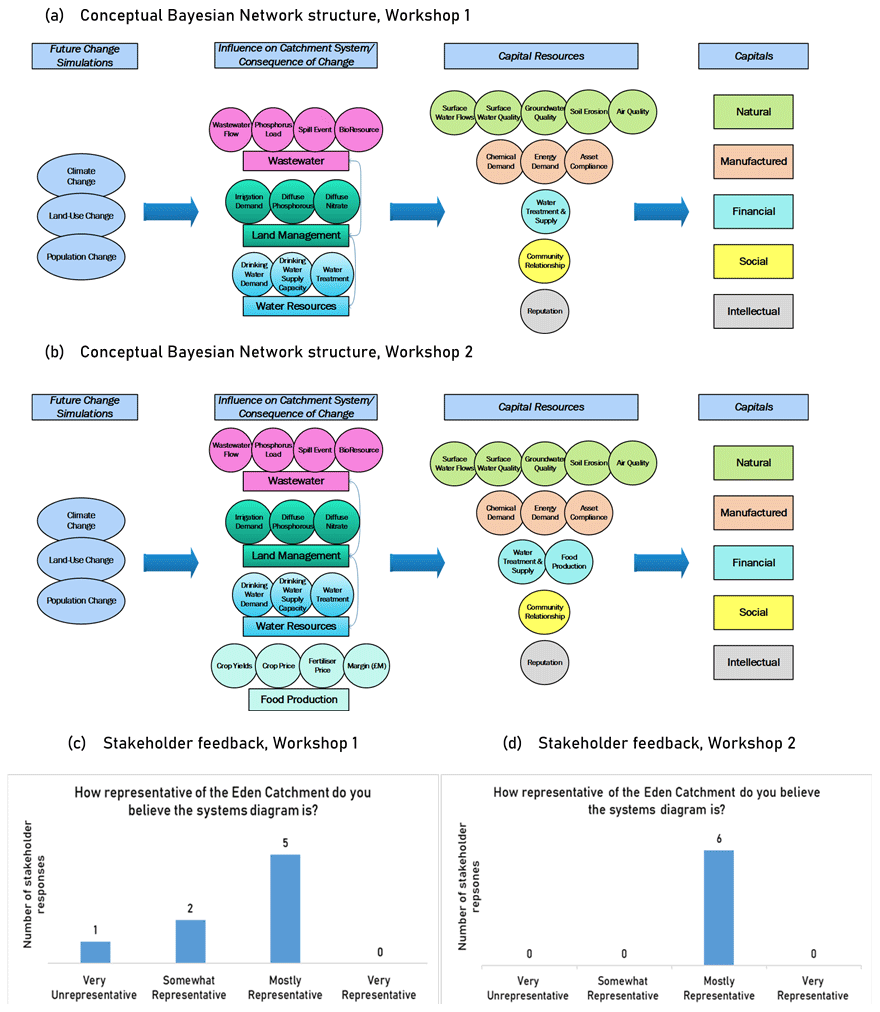
Figure 4Conceptual Bayesian network model structure and feedback on model representativeness of the Eden catchment before (a), and the updated model structure (b) with stakeholder feedback from workshop 1 (c) and workshop 2 (d).
Despite the majority of stakeholders describing the BN model structure as “mostly representative” of the Eden catchment system, other participants were less convinced. To increase consensus, the wider group of stakeholders were taken through stages 1–4 of the participatory approach to discuss what the BN model should aim to achieve and how the model structure could be improved.
Stakeholders highlighted that consideration of the food production system and its resilience to the impacts of future change was excluded from the model, as mentioned by LM6:
Ultimately we've also got to remember the positives of what land managers are doing for the rural countryside and what they bring and the benefits to the countryside, and ultimately they are producing food for a nation. (LM6)
To improve representation, nodes such as crop cover, yields, fertiliser costs and farm margins were added to the model structure. The impacts of future climatic change, such as increased drought and fertiliser price shocks – due to potential future shortages in rock phosphate – were established as factors that could impact the food production system in the catchment.
Phosphate fertiliser is going to be a decreasing resource because there are only 50–100 years of phosphorus rock reserve left in the world. (EP1)
The model structure was adapted and presented back to the wider stakeholder group during a second workshop. Updating the model structure was seen to improve model representation of the Eden catchment system and the influence of future change, as seen in the stakeholder feedback from the second workshop (Fig. 4). Participants highlighted that the model structure helped them to conceptualise the impacts future change might bring to their sector and the catchment.
It is a good way of understanding [the catchment system] and maybe farmers do need to think outside to box a bit more and think of the impact it [agriculture] is having. (LM6)
I think it's also … a first chance that many of us on the call are really having our eyes open to what the next 30 years might look like in terms of political, social and climate changes. (WW1)
3.2 Catchment resilience – capital outputs
After improving the model structure, scenarios were carried out to measure the impact of future change on the catchment system. Model outputs provided an overview of the conditions of the five key capitals represented within the catchment system. Capital outputs for four diverse scenarios – Current conditions, Business As Usual to 2050, Green Road extreme low precipitation (GR ExLP) to 2050 and Fossil-Fuelled Development extreme high precipitation (FFD ExHP) to 2050 – are presented (Fig. 5).
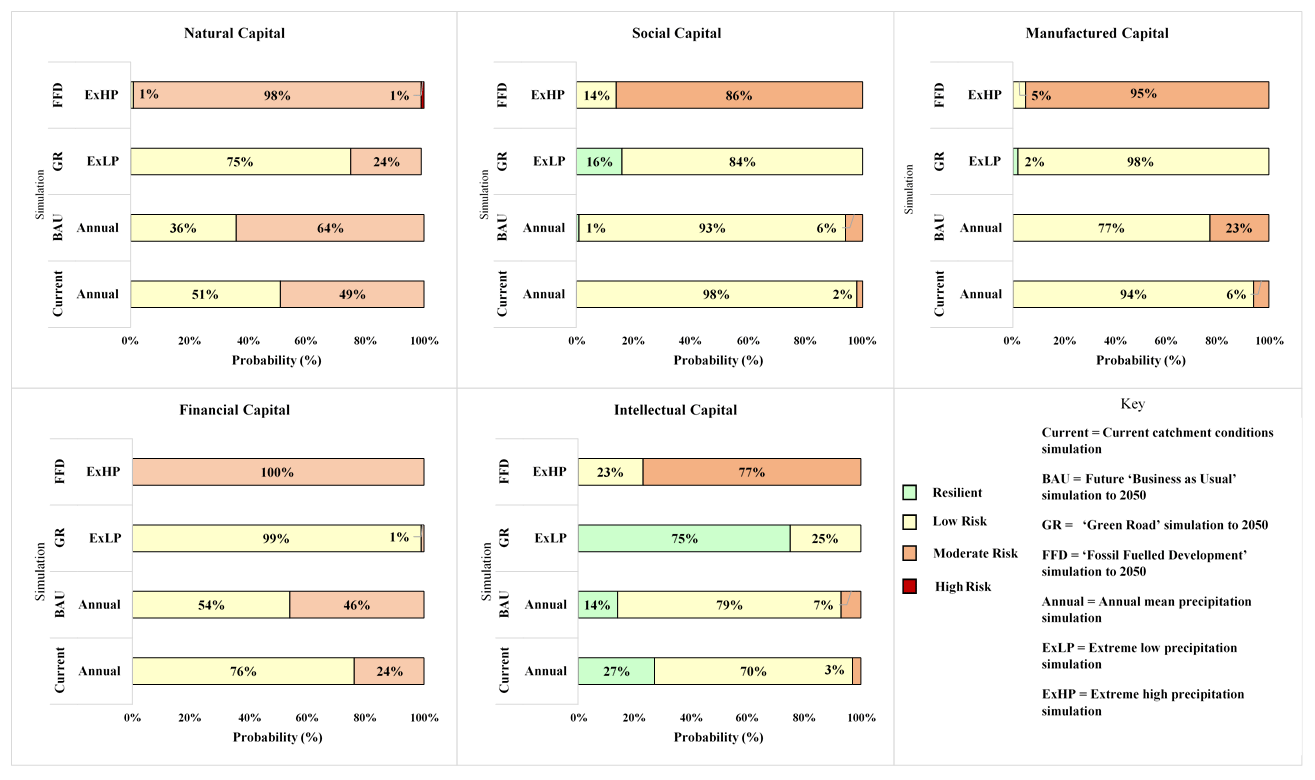
Figure 5Probability of resilient high-risk states for each capital under diverse future pathway scenarios.
We found that under current conditions, all capitals were mainly within a low-risk state. Results can be interpreted as follows: for natural capital, 51 % of the 10 000 BN model scenarios were within a low-risk state, 49 % were within a moderate-risk state and 0 % were within resilient or high-risk states.
In the future BAU scenario – which assumes annual precipitation change rates associated with RCP 6 and a continuation of current trends in population and land cover change until 2050 – risk to natural capital shifts from low to moderate risk, 64 % of simulations were within a moderate-risk state. Social, manufactured, financial and intellectual capitals remained predominantly within low-risk states; however, there was an increase in observations within moderate risk compared to current conditions.
In the GR ExLP scenario – which assumes the Q5 value for summer precipitation anomaly projections associated with RCP 2.6, lower population growth and a reduction in pasture land cover – we observed an increase towards resilience in all capitals. For intellectual capital, the majority of samples were within a resilient state (75 %). For natural and financial capital, there was a shift from moderate to low risk, compared to current conditions. An increase in observations within a resilient state was evident for social and manufactured capitals compared to current conditions.
In the FFD ExHP scenario – which assumed the 95 % exceedance value for winter precipitation anomaly projections associated with RCP 8.5, population growth increased urbanisation and a shift from natural to agricultural land cover – an increase in risk was observed for all capitals. The risk to natural capital shifted predominantly to moderate risk (98 %), with a small proportion of observations within a high-risk state (1 %). Social, manufactured, financial and intellectual capitals all shifted from low to moderate-risk states compared to current conditions.
3.3 Catchment resilience – capital resource outputs
The cause-and-effect structure of the BN model enabled the investigation of catchment resilience beyond the overview of capital states. Further investigation of catchment resilience is achieved using a manual sensitivity analysis to identify parent nodes with the greatest influence on overall capital states. Using the example of natural capital, Fig. 6 presents a visualisation of the state of all natural capital resource nodes. Outputs are presented for the four diverse scenarios of current and future conditions in the catchment.
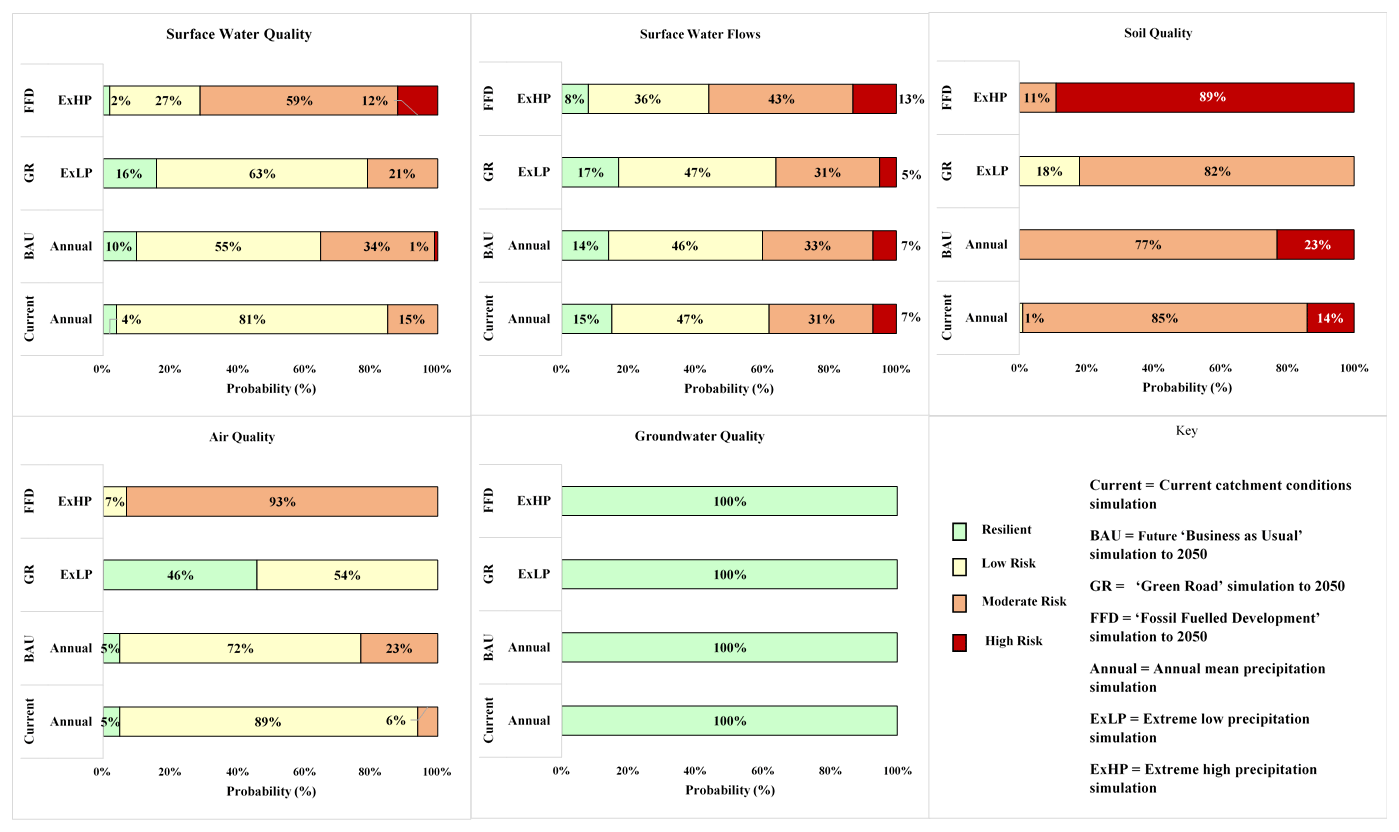
Figure 6Probability of resilient high-risk states for each capital resource under diverse future pathway scenarios.
Under current conditions, surface water quality, surface water flows and air quality were all most likely to be within a low-risk state. Outputs highlighted that 85 % of soil quality observations were within a moderate risk. Groundwater quality is 100 % resilient across all four scenarios.
In the future BAU scenario until 2050, the majority of observations for surface water quality, surface water flows and air quality remained within a low-risk state; however, there was a shift from low to moderate-risk states compared to current conditions. An increase in high-risk observations (23 %) was evident for soil quality, which remained predominately within a moderate-risk state.
An improvement towards resilience was evident for surface water quality, surface water flows and air quality nodes in the GR ExLP scenario until 2050. Soil quality remained mainly within a moderate-risk state, despite a shift from moderate- to low-risk observations in comparison to current conditions.
Increasing risk was evident in the FFD ExHP scenario for surface water quality, surface water flows, air quality and soil quality. Surface water quality, surface water flows and air quality shifted from predominantly low to moderate risk in comparison to current conditions. High-risk observations were evident in both surface water quality (12 %) and surface water flows (13 %). Soil quality conditions shifted to 89 % of observations within a high-risk state
3.4 Sub-catchment system resilience
Capital (Fig. 5) and capital resource (Fig. 6) outputs are representative of the entire catchment condition. A deeper investigation of catchment resilience was achieved through investigation at the sub-catchment scale. A visual representation of surface water quality – specifically for RP concentrations (µg L−1) at the sub-catchment scale – is presented in Fig. 7 using probabilities (%) for discrete resilience/risk states under both current and diverse future scenarios. Median RP concentrations (µg L−1) derived from continuous model outputs are also presented for each of the different sub-catchments for the different future scenarios in Fig. 7.
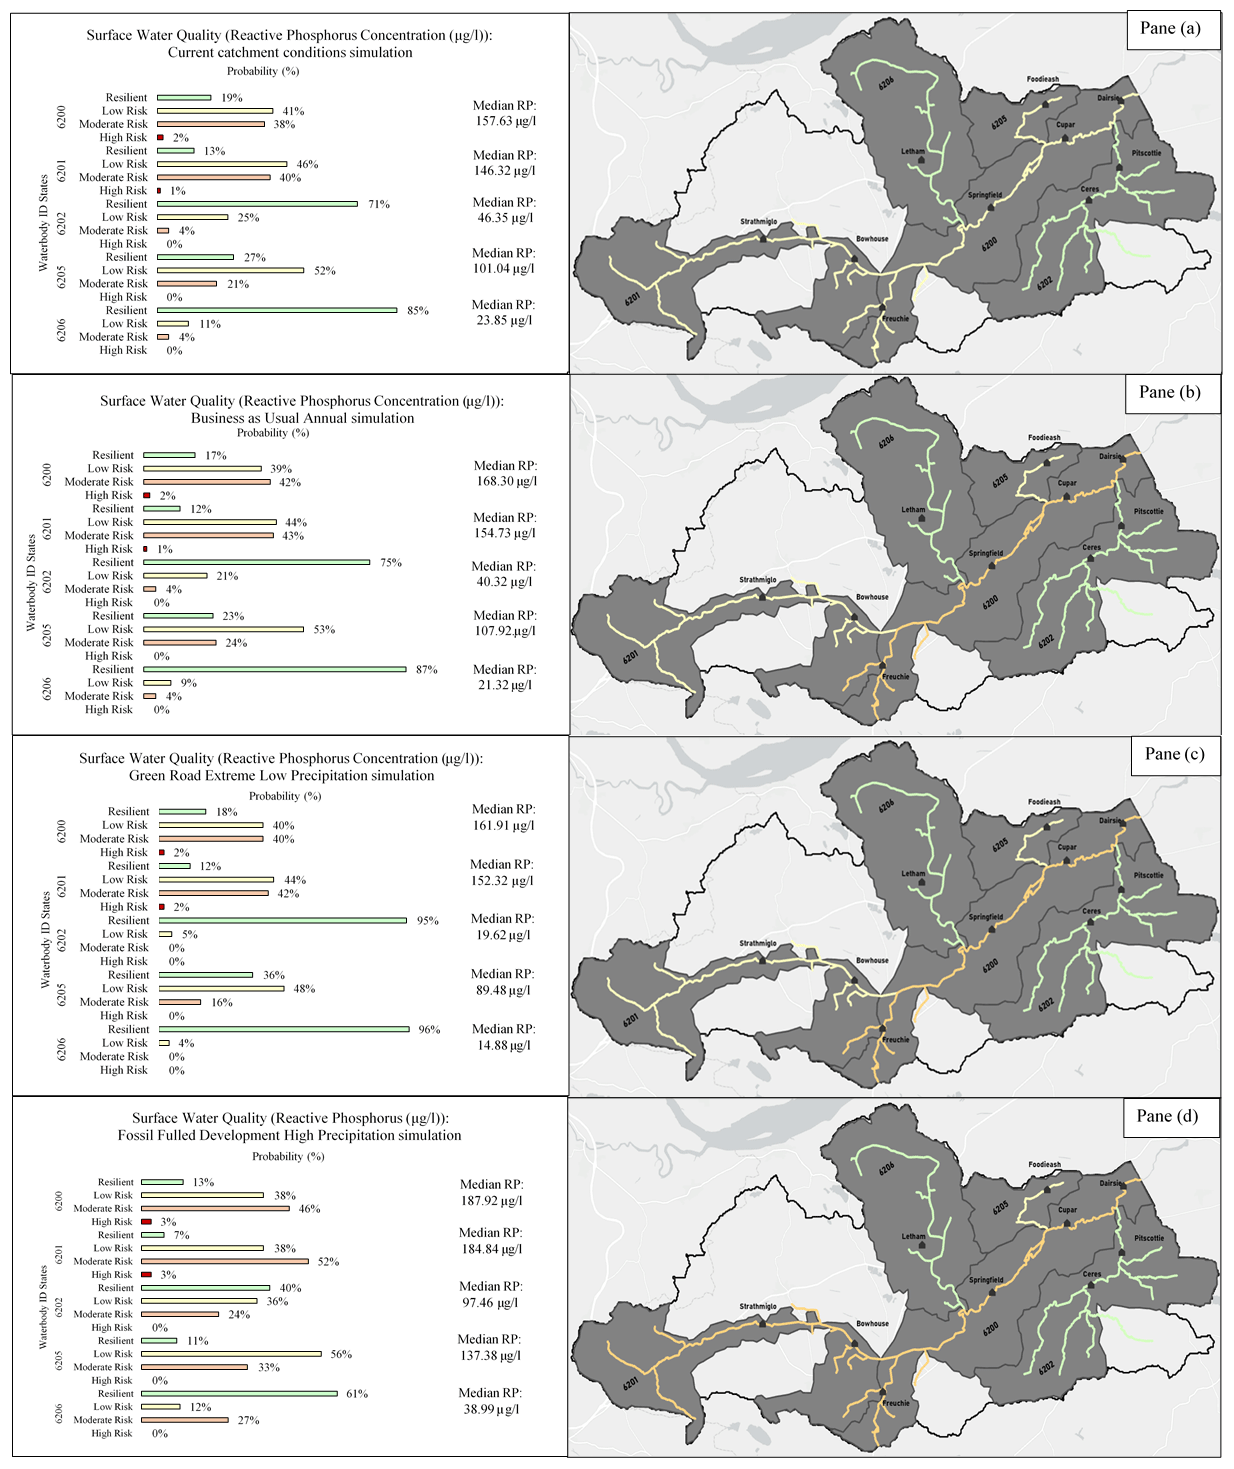
Figure 7Probability of resilient high-risk states and median reactive phosphorus concentrations in micrograms per litre in each waterbody sub-catchment under the (a) Current conditions scenario, (b) future Business as Usual scenario to 2050, (c) future Business as Usual scenario to 2050, (c) Green Road extreme low precipitation scenario to 2050 and (d) Fossil-Fuelled Development extreme high precipitation scenario to 2050. Acknowledgements: catchment boundary provided by the National River Flow Archive. River network provided by the EU-Hydro River Network database (Gallaun et al., 2019). Map created in ArcGIS Pro (Esri Inc., 2021).
Simulating current conditions (Fig. 7a), low risk was the most probable state for RP concentrations in waterbody sub-catchments 6200 (median RP: 157.63 (µg L−1), 41 % low risk), 6201 (median RP: 146.32 (µg L−1), 46 % low risk) and 6205 (median RP: 101.04 (µg L−1), 52 % low risk). Modelled RP concentrations in waterbody sub-catchments 6202 and 6206 were predominately within a resilient state.
As the discretisation of surface water quality at the sub-catchment scale is determined by the WFD high to poor ecological status thresholds for RP, discrete outputs can also be interpreted as follows: in waterbody sub-catchment 6200, the majority of the 10 000 simulations for RP concentrations (µg L−1) were within a low-risk state (41 %) or moderate WFD ecological status boundary (78–191 µg L−1).
In the future BAU scenario (Fig. 7b), surface water quality deteriorated in waterbody sub-catchment 6200, with moderate risk being the most probable state (42 %) compared to current conditions, with an increase in median RP concentrations to 168.30 µg L−1. Despite staying mainly within a low-risk state, a shift towards moderate risk in both waterbodies and increased median RP concentrations were observed in sub-catchments 6201 and 6205. In waterbodies 6202 and 6206, the probability of resilience increased, which was evident in decreased in median RP concentrations in both sub-catchments.
Increased risk was evident for waterbody sub-catchments 6200 and 6201 in the GR ExLP until 2050 (Fig. 7c). There was equal probability of low and moderate risk (40 %) in waterbody sub-catchment 6200. Using a precautionary approach, the waterbody is represented as moderate risk. Waterbody sub-catchment 6201 remained predominantly within a low-risk state (44 %); however, median RP concentrations (152.32 µg L−1) increased compared to current conditions. Improvement towards resilience was evident in waterbody sub-catchment 6205 compared to current conditions, despite a low risk being the most probable state (48 %). Waterbody sub-catchments 6202 and 6206 remained predominantly within a resilient state.
In the FFD ExHP scenario (Fig. 7d), waterbody sub-catchments 6200 and 6201 both shifted from low to mainly moderate-risk states (46 % and 52 %, respectively) compared to current conditions. Waterbody sub-catchment 6205 remained predominantly within a low-risk state (56 %), while waterbody sub-catchments 6202 and 6206 remained predominantly resilient. Increases in median RP concentrations in all waterbodies demonstrated an increase in risk compared to current conditions.
Continuous outputs determined median RP loads (kg d−1) from wastewater effluent and diffuse (arable, pasture, urban and septic tanks) sources at each waterbody sub-catchment (see Sect. S6, Figs. S10–S13). Using the example of waterbody sub-catchment 6200, median RP loads for both current and diverse future pathway scenarios are presented in Fig. 8. Currently, diffuse sources contributed the majority of RP (27.11 kg d−1) in waterbody sub-catchment 6200, compared to wastewater effluent sources (23.26 kg d−1). The total RP load was 50.37 kg d−1.
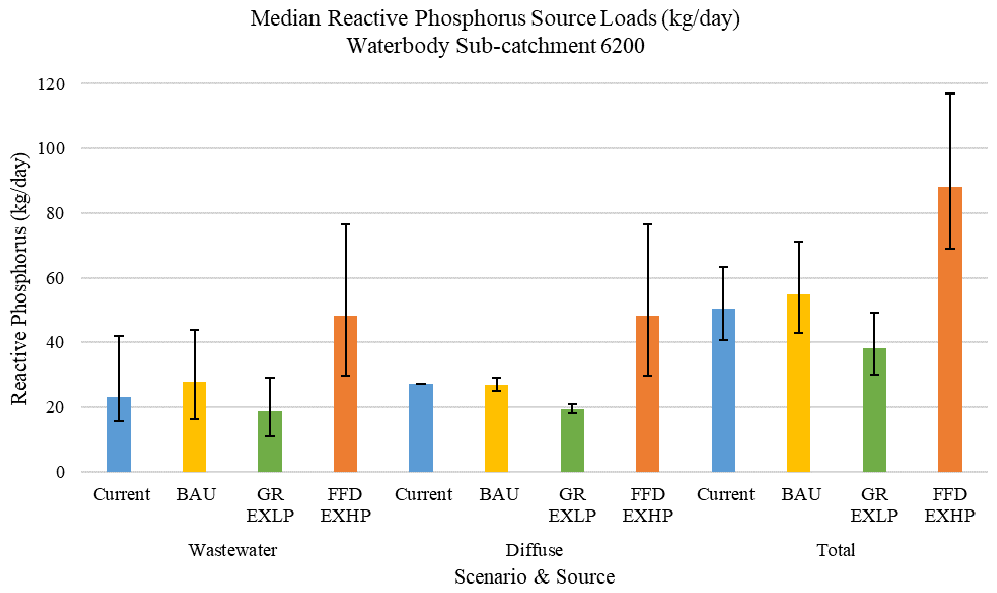
Figure 8Median reactive phosphorus source loads (kg d−1) in waterbody sub-catchment 6200 for Current, future Business as Usual (BAU), Green Road extreme low precipitation (GR ExLP) and Fossil-Fuelled Development extreme high precipitation (FFD ExHP) scenarios.
Source proportions shifted under the future scenarios with wastewater effluent sources being the main contributor in the future BAU and FFD ExHP scenarios. Total median RP loads (kg d−1) increased in the future BAU (54.80 kg d−1) and FFD ExHP (88.22 kg d−1) scenarios compared to current conditions. In the GR ExLP scenario, a reduction in total median RP loads (38.08 kg d−1) was evident, and diffuse sources remained the main source of RP (19.50 kg d−1).
The model structure enabled further investigation of RP sources. Using the example of wastewater effluent loads in waterbody sub-catchment 6200, Fig. 9 presents median RP loads (kg d−1) at Cupar wastewater treatment works (WwTWs) in sub-catchment 6200 for the current and future scenarios. Currently, Cupar WwTW contributed a median RP load of 5.51 kg d−1. An increase in median RP loads was evident in the future BAU (8.93 kg d−1) and FFD ExHP (16.35 kg d−1) scenarios compared to current conditions. In the GR ExLP scenario, RP loads decreased (5.36 kg d−1) compared to current conditions.
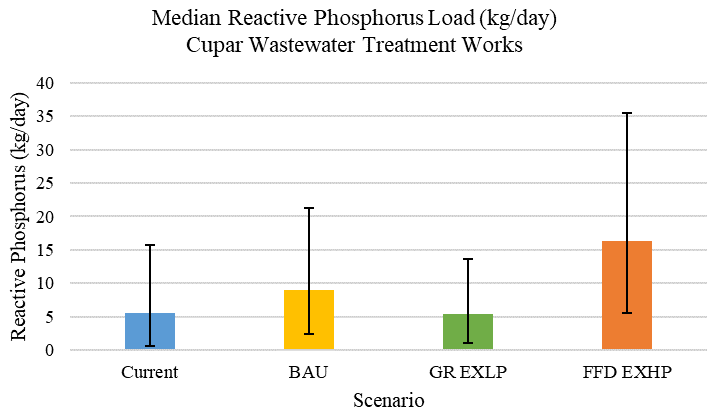
Figure 9Median reactive phosphorus source loads (kg d−1) at Cupar wastewater treatment works for Current, future Business as Usual (BAU), Green Road extreme low precipitation (GR ExLP) and Fossil-Fuelled Development extreme high precipitation (FFD ExHP) scenarios.
3.5 Model evaluation
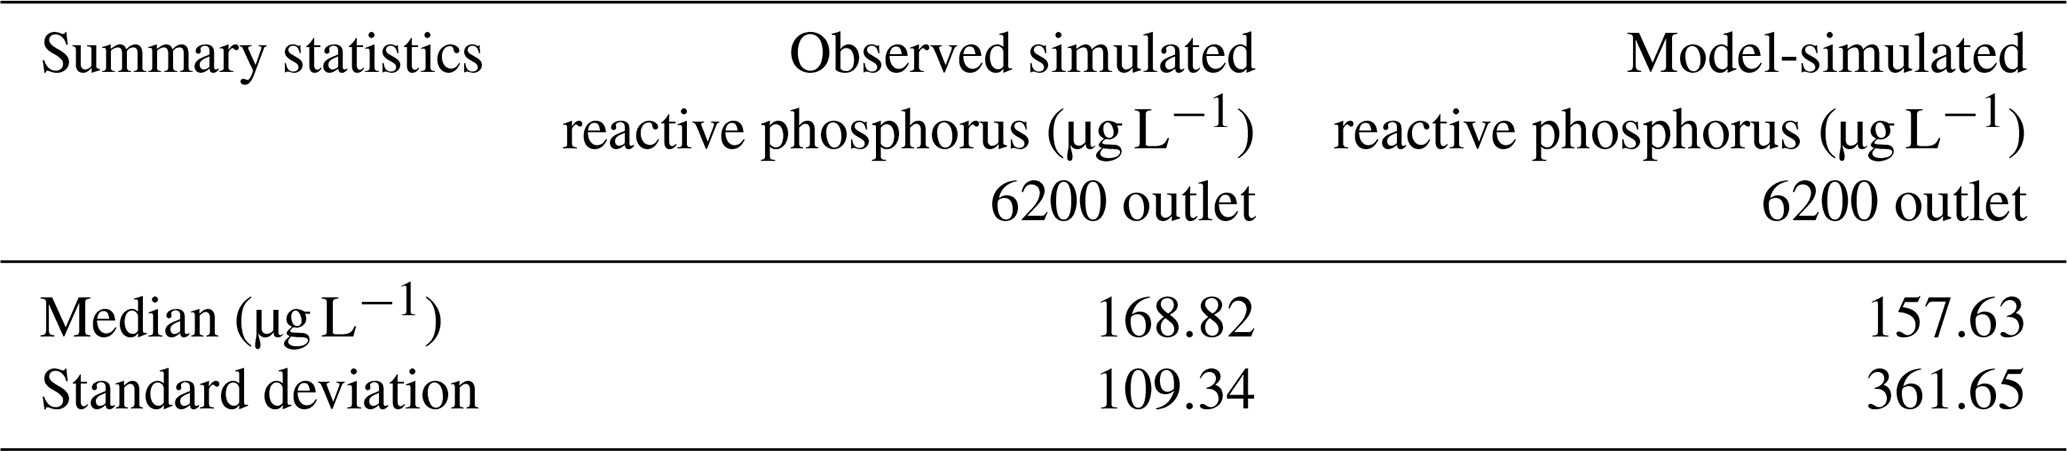
We evaluated the model performance by comparing the modelled current RP concentrations (µg L−1) with a simulation of observed RP concentrations (µg L−1) at the catchment outlet in waterbody sub-catchment 6200 (Table 1). The model underestimated the median RP concentration (157.63 µg L−1) at the catchment outlet compared to the observed simulated median RP concentration (168.82 µg L−1). A greater standard deviation was observed in the model simulation (361.7 µg L−1) compared to the observed simulation (109.3 µg L−1).
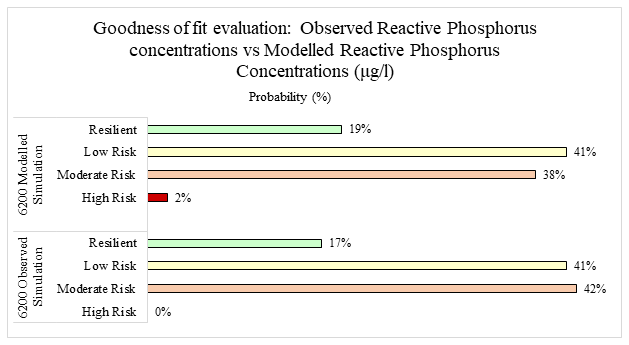
Figure 10Comparison between probabilities of observed and modelled reactive phosphorus concentration in micrograms per litre at Eden catchment outlet in waterbody sub-catchment 6200.
Table 1Summary statistics of observed and modelled current reactive phosphorus concentrations (µg L−1) at the Eden catchment outlet waterbody sub-catchment 6200.
Based on the discrete output (Fig. 10), the model underestimated the RP concentration compared to the observed simulation. The most probable state for RP concentrations in the observed simulation was moderate risk (44 % probability) – or poor WFD status – compared to the modelled scenario which estimated low risk – or moderate ecological status – (41 % probability). The modelled RP concentrations were more widely distributed, which is evident in a 2 % probability of high risk – or bad ecological status – compared with 0 % in the observed simulation.
When evaluating the goodness of fit using the bias (%) correction (Table 2), 43 % of observations were within the ±50 % behavioural threshold, 31 % of simulated values were above the 50 % acceptable threshold and 26 % were below the 50 % acceptable threshold.
The results of the parameter sensitivity analysis are presented in Table 3. Changes in point source RP loads have a greater influence on RP concentrations (µg L−1) compared to diffuse sources in sub-catchment 6200 in the current scenario. A 20 % increase in point source loads resulted in an 8.4 % increase in RP concentrations, while a 20 % reduction resulted in an 8.1 % reduction in concentrations. Of the diffuse sources, arable sources had the greatest influence on RP concentration with a 20 % increase yielding a 4.9 % increase in concentration, while a 20 % reduction resulted in a 6.5 % reduction in concentrations.
Table 2Bias (%) of modelled vs. observed reactive phosphorus concentrations (µg L−1) at the Eden catchment outlet waterbody sub-catchment 6200.
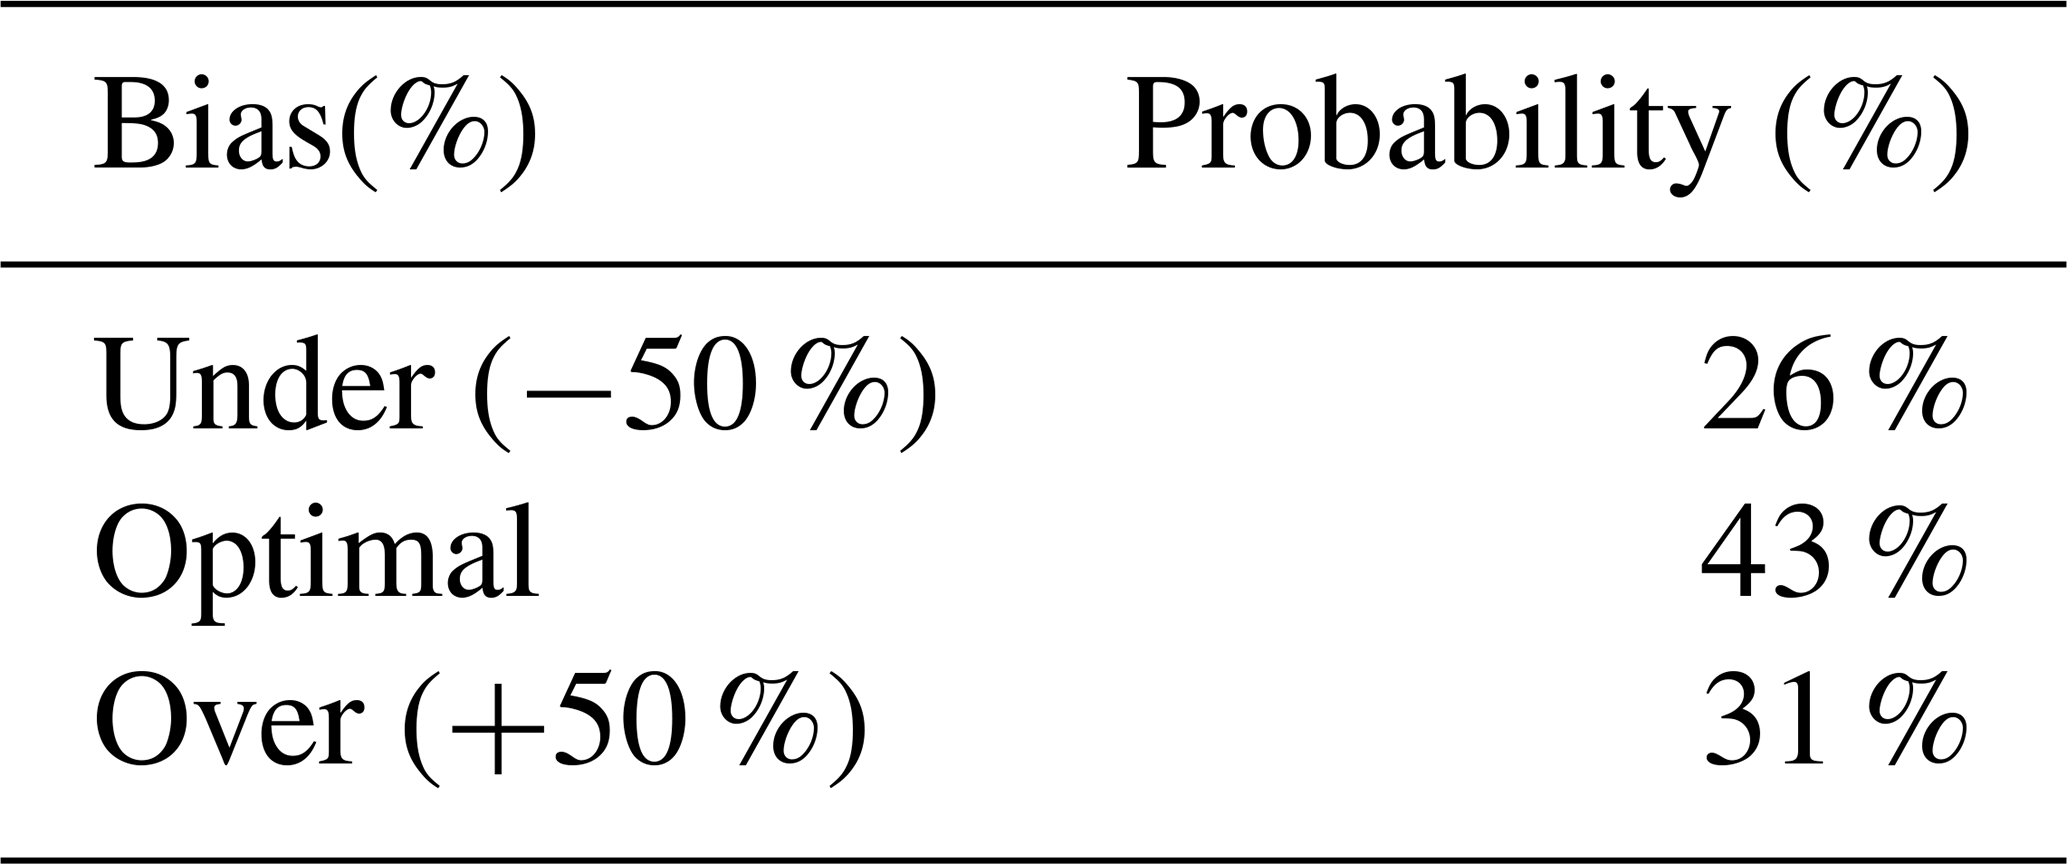
Table 3Sensitivity analysis of selected diffuse and point source input variables and their influence on reactive phosphorus concentrations in sub-catchment 6200.

4.1 Participatory process for BN model construction
Düspohl (2012) highlighted the scarcity of literature evaluating participatory BN modelling processes. To address this gap, we evaluate the ability of our BN model to increase stakeholder understanding of catchment system resilience to the cumulative impacts of future change using the credibility, salience and legitimacy criteria set out by Falconi and Palmer (2017) throughout our discussion.
The first stage of our participatory approach – discussing model aims and objectives – helped understand the knowledge gaps of the One Planet Choices project team, which was critical when developing a credible modelling process. The first knowledge gap identified by the project team required the BN model to provide a systems-thinking approach that mapped the complex socio-ecological interactions within the Eden catchment. Creating and evaluating the conceptual BN model structure in stages 2 and 4 of the participatory process were important in ensuring the perspectives of stakeholders across sectors were considered when mapping the catchment system. Our findings presented in Fig. 4 provide evidence that stakeholders viewed the BN model structure as “mostly representative” of the Eden catchment system. We believe achieving a “very representative” structure was limited by our inability to consider all human and non-human systems in the catchment. The model was strategic in including the critical wastewater, land management and water resource systems within five waterbody sub-catchments. We applied an iterative approach to include the food production system, based on the input of additional stakeholders to improve the model representativeness of the model; however, there were limitations on time and resources to consider all catchment systems. Consulting the needs of the project team as end users of the model helped reach agreement on the model structure and justify that it was fit-for-purpose.
Using a BN model as an appropriate tool for mapping complex socio-ecological systems was validated by the project team when evaluating the aim and objectives of the model at a final project meeting after testing model scenarios in stage 5. Using the iterative five-stage process enabled the aim and objectives of the model to be evaluated by the project team, further ensuring the modelling approach was credible. To achieve legitimacy, participatory modelling should include a process of iteration that allows feedback from participants. The flexibility of BN models allows the model structure to be updated in real time, which was effective during focus group sessions with sub-system stakeholders groups using the GeNIe software. Future regular updating of the model structure and its assumptions should be considered to address the issue of unforeseen future shocks, an example being an abrupt geopolitical shock and its impacts on global food and fertiliser prices.
When presenting the full model, as is in Sect. S3, Fig. S2, it was difficult for stakeholders to follow and comment on important variables and cause-and-effect relationships. We therefore used simplified versions, such as in Fig. 4, to visually represent the model. The simplified models are more effective for eliciting stakeholder opinions on the model structure in a workshop setting, which were used to update the model in GeNIe. Recording and analysing participant feedback during each workshop helped build a greater evidence base that the BN model was effective in mapping the complex socio-ecological catchment system. The example quote by LM6 above demonstrates that the BN model helped participants consider how their sector impacted the system and the need to think beyond their own sector's role within the catchment system. Our findings support Voinov and Bousquet (2010), who considered BN models as a tool for understanding complex systems and facilitating knowledge sharing.
4.2 Measuring catchment-scale resilience
In a review of BN applications in water resource management, Phan et al. (2019) identified the majority of applications solely focussed on water quality management. Few studies consider multiple concerns such as surface water quality, surface water flows, groundwater quality, air quality and soil quality within one model structure. Our findings presented in Figs. 5 and 6 demonstrate the ability to apply a participatory BN model that measures the impacts of both current and future conditions on multiple capitals and their associated resources. Presenting the multiple capital outputs addressed the knowledge needs of stakeholders in providing a holistic catchment-scale approach.
Measuring the cumulative impacts across diverse coupled representative concentration and Shared Socio-economic Pathways to a 2050 time horizon reduced the possibility of over- or underestimation of future impacts on water environments (Holman et al., 2016), addressing a further stakeholder knowledge need (Adams et al., 2022). Moe et al. (2019) is an example where both climatic and socio-economic change is considered for the time-horizon 2050–2070 using a discrete BN model. We build on the application of BN models that investigate the impacts of future climatic and socio-economic change by utilising continuous nodes within the hybrid equation-based BN model structure to measure both climatic and socio-economic stressors, which are rare in the literature (Moe et al., 2021).
Transferring the data and stakeholder knowledge into the hybrid equation-based structure was enabled by the ability of BN models to integrate multiple sources of data (Pham et al., 2021). The capacity of BN models to include continuous nodes is seen as a limitation (Uusitalo, 2007; Sperotto et al., 2017); however, we find the opposite to be true in our study. Despite limited monitoring data available in the Eden catchment, our BN model was able to simulate distributions to quantify nodes using summary statistics from other process-based model outputs. For example, only mean and standard deviation values were available for wastewater flow nodes, equation nodes enabled distributions to be created, providing 10 000 simulated outputs which could be discretised based on flow license information to represent risk. The variable log (Sect. S3, Table S2) was used as a platform to record decisions made and data collected during focus groups and workshops, increasing model salience. Ensuring stakeholders were involved in the process of data identification built end-user trust and increased model credibility.
Investigating the influence of cumulative future change impacts on specific areas of the catchment system assisted stakeholders to engage with the complexity of understanding socio-ecological systems and the impacts of diverse future pathways. Typical methods for identifying nodes that have the greatest influence on model outputs include causal probabilistic inference (Hobbs, 1997; Tang et al., 2016) and sensitivity analysis (Troldborg et al., 2022). Achieving typical methods requires discretisation of continuous nodes in the hybrid BN model network, which leads to imprecision (Borsuk et al., 2012) and loss of information (Barton et al., 2008; Ames et al., 2005). Instead, we devised a manual sensitivity analysis for investigating specific model nodes that had the greatest influence on catchment system resilience, without the need to trigger network discretisation. Our manual approach involved dual representation of continuous nodes, presenting both probability function outputs and creating a discretised child node.
Manual backward investigation of the model created storylines from the capital outputs to specific sub-catchment nodes, an example being our presented results from Figs. 5 to 9. In our experience, we found the combination of both continuous and discrete model outputs to be more meaningful to stakeholders during project meetings and workshops. The ability to discretise surface water quality nodes within each sub-catchment based on specific WFD ecological status threshold values provided users with an improved representation of both current and future uncertainty. Transparency in the selection of discretisation methods and discretisation boundary values is important, as the discretisation of continuous nodes leads to loss of information. To achieve transparency, we applied both manual and unsupervised equal intervals where appropriate to discretise nodes in the BN model (Sect. S3, Table S3). For decision-makers faced with the issues of system complexity and uncertainty, generating useful information that effectively communicates scientific outputs is a challenge (Liu et al., 2008; Callahan et al., 1999). Discretised outputs of continuous nodes provided stakeholders with a way of quantifying both the resilience of the catchment system and the uncertainty in the modelled outputs.
Continuous outputs quantified the impacts of future change on sub-catchment-specific nodes. For example, the ability to quantify RP concentrations (µg L−1) at each sub-catchment waterbody helped stakeholders conceptualise the extent to which water quality in the catchment could be impacted in the future under diverse pathway scenarios. Investigations of future scenarios highlighted that in the future BAU scenario (Fig. 7b) median RP concentrations (µg L−1) increased compared to current conditions in sub-catchments 6200, 6201 and 6205 and decreased in sub-catchments 6202 and 6206. Figure 8 for sub-catchment 6200 (and Figs. S10–S13) shows increases in total RP loads (kg d−1) in sub-catchments 6200, 6201 and 6205, while the total RP loads in sub-catchment 6202 and 6206 decreased, particularly for wastewater sources. The changes in total RP can be seen in the source apportionment between wastewater and diffuse sources, as well as the trends in climate, population and land cover change. Wastewater sources increase in sub-catchments where the population is projected to increase, while diffuse sources are expected to increase in all sub-catchments.
In the Green Road and Fossil-Fuelled Development extreme precipitation scenarios, the influence of precipitation change and catchment processes are evident. Total RP loads (kg d−1) are reduced in all sub-catchments in the GR ExLP scenario due to reductions in diffuse runoff. The lower likelihood of wastewater spills contributing untreated effluent to wastewater source loads are also reduced in the GR ExLP scenario. RP concentrations (µg L−1) were greater in the GR ExLP scenario compared to the current scenarios in sub-catchments 6200 and 6201, despite the reductions in total RP loads in both sub-catchments (Figs. 8 and S10–S13). We believe these concentration increases are due to the reduction in river flow volumes in the extreme low precipitation rate scenario, meaning that regulating diluting functions are absent and RP concentrations increase. We are unable to investigate the influence of flows in the sub-catchments where RP concentrations decreased compared to current conditions (6202, 6205 and 6206), as observed river flow volume data were not available for all sub-catchments (see Table S2 for more information on how surface water quality is measured absence of river flow volume data).
In the FFD ExHP scenario, increases in RP concentrations (µg L−1) compared to current conditions are evident in all sub-catchment waterbodies, which is attributed to increases in total RP loads (kg d−1). Increased precipitation rates increase diffuse runoff, wastewater effluent flows and the likelihood of effluent spills. For sub-catchments 6200 and 6201, despite increases in river flow volumes from increased precipitation, RP source loads into the waterbodies were greater than the dilution capacity.
Despite 46 % of the bias (%) observations falling within the ±50 % acceptable model performance (Table 2), results from the goodness of fit evaluation demonstrate that the model underestimated current median RP concentrations (µg L−1) at the catchment outlet in sub-catchment 6200 and the probable risk class. Simulated concentrations were more widely distributed, as compared to the observed data, as is evident in the 2 % of observations within a high-risk state for simulated concentrations, compared to 0 % for observed concentrations. A wider distribution in simulated RP values using a hybrid BN model was also found by Glendell et al. (2022). We concur with their considerations that both the quality and the low temporal resolutions of observed data may be responsible for this discrepancy.
The BN model was considered an appropriate method for analysing the resilience of freshwater catchments by the project team at the final evaluation meeting. Our participatory process and methods can be replicated to create future BN models that incorporate diverse stakeholder knowledge to address end-user needs and support interdisciplinary resilience assessments. Our findings enabled stakeholders to gain new perspectives on how future scenarios may influence their specific sectors (Fig. 9) and how their sector impacted other sectors and environmental conditions within the catchment system (Fig. 7), promoting social learning as described by Basco-Carrera et al. (2017). Identifying specific aspects of the catchment system that are least resilient to the impacts of future change will allow decision-makers to target both the areas of the catchment where adaptive management is required and the extent of action required in the face of potential future shocks and changes. Recognising the influence that all sectors have on water quality issues in the catchment highlighted the need for collaborative action.
4.3 Limitations and outlook
It is important to highlight that the BN model was effective as a strategic tool to meet the needs of participating stakeholders to investigate the resilience of catchment systems. Compared to other modelling options – such as process-based modelling – BN models could be both a resource- and cost-effective option to conduct resilience assessments. Despite being effective as a strategic resilience tool, the BN model is limited in its ability to provide a detailed resilience assessment due to the lack of both temporal and spatial scales built into the model. For example, in this study, we considered future precipitation change anomalies using the UKCP18 25 km2 grid data which are limited compared to the possible use of UKCP18 2.2 km2 grid precipitation change anomaly data. Temporal and spatial scales could be applied to build on dynamic BN model applications such as in Molina et al. (2013), who assessed the impacts of climatic and land-use change on groundwater systems over 5-year time slices covering 30 years (2070–2100) or spatial BN model applications such as in Troldborg et al. (2022), who applied a spatial BN model to investigate field-level pesticide pollution risk at a small catchment scale. Applying these methods would allow for assessment of their effectiveness compared to process-based modelling to provide a detailed resilience assessment.
Having multiple workshops created difficulties when trying to achieve consistent participant numbers across all workshops. Eliciting formal feedback at the end of each workshop for the catchment stakeholder participants was also challenging. For future improvement, we recommend testing the inclusivity of meetings or further focus groups and workshops, with wider catchment stakeholders, to give structured formal feedback sessions on the model structure and outputs.
Using our findings, we will assess the ability of the BN model to inform the identification of adaptive management options and test their effectiveness in increasing the resilience of the Eden catchment in future research. With the same group of workshop participants, we will use the outputs presented in this study to test if they inform innovative and collaborative management options. The BN model structure will be updated to test the effectiveness of management scenarios in parallel with both the current and future scenarios.
Using the Eden catchment case study, our research applied participatory methods to create a Bayesian network (BN) model that addressed the needs of stakeholders to increase their understanding of catchment-scale resilience to the cumulative impacts of future change. We identified four stakeholder knowledge needs that the BN model would aim to address: (1) ensuring systems-thinking by mapping the socio-ecological interactions in the catchment, (2) measuring the impacts of future Business As Usual (BAU) change and shocks of extreme events and future pathways to a 2050 time horizon, (3) using a holistic capitals approach to measure the overall future catchment health, and (4) identifying specific aspects of the catchment system that are least resilient to the cumulative impacts of future change.
Applying an iterative five-stage participatory process to construct the BN model achieved a systems-based understanding of socio-ecological interactions within the catchment. The model provided an effective tool for understanding system complexity and enabling knowledge sharing between stakeholders. Our hybrid equation-based BN model facilitated investigation of diverse future pathway scenarios, providing stakeholders with a strategic tool to measure the cumulative impacts of both climatic and socio-economic changes until 2050.
Our findings provided a holistic assessment of catchment-scale resilience, demonstrating the possibility to apply a participatory BN model to consider the impacts of both current and future conditions on multiple capitals and their associated resources. The BN model structure enabled identification of specific areas of the catchment which were least resilient to future change pathways, enabling stakeholders to recognise the risks to their individual sectors while also understanding their influence on the wider system and sectors.
We found that a BN model is a credible, salient and legitimate strategic tool for addressing the stakeholder knowledge needs about catchment resource resilience. Improvements to the BN model could involve the addition of spatial and temporal scales to take the tool beyond a strategic resilience tool. Future research will test the ability of the BN model to inform the identification and test the effectiveness of adaptive management options identified by stakeholders.
Access to the Bayesian network model described in this research can be made available by contacting the lead author. Data cannot be made publicly available, however, access may be granted on request to the lead author.
The supplement related to this article is available online at: https://doi.org/10.5194/hess-27-2205-2023-supplement.
KJA, MJM, NM and RCH led conceptualisation; MJM, RCH and KM led funding acquisition; KJA, NM, JP, MJM and RCH led project administration; KJA led model development, supported by MG; KJA led data acquisition, supported by NM and JP; KJA led data visualisation; KJA led method development, supported by KM, MJM, NM, RCH and MG; KJA led paper preparation; and KM, MJM, NM, RCH and MG supported paper review and editing.
The contact author has declared that none of the authors has any competing interests.
Publisher’s note: Copernicus Publications remains neutral with regard to jurisdictional claims in published maps and institutional affiliations.
This article is part of the special issue “Frontiers in the application of Bayesian approaches in water quality modelling”. It is a result of the EGU General Assembly 2020, 3–8 May 2020.
The models described in this paper were created using the GeNIe Modeler, available free of charge for academic research and teaching use from BayesFusion, LLC (https://www.bayesfusion.com/, last access: 28 July 2022). This research is supported and funded by Hydro Nation Scholars Programme and the Scottish Funding Council. The authors would like to give thanks to the stakeholders who kindly shared their valuable knowledge and time participating in project meetings, focus groups and workshops. We thank SEPA and Scottish Water staff for providing expertise, information and data to support this research.
This research has been supported by the Scottish Funding Council (Hydro Nation Scholars Programme). MJM was partly funded by UK Research and Innovation (UKRI) under the UK government’s Horizon Europe funding guarantee grant no. 10040949.
This paper was edited by Ibrahim Alameddine and reviewed by Laura Uusitalo and Ibrahim Alameddine.
Adams, K. J., Metzger, M. J., Macleod, C. J. A., Helliwell, R. C., and Pohle, I.: Understanding knowledge needs for Scotland to become a resilient Hydro Nation: Water stakeholder perspectives, Environ. Sci. Policy, 136, 157–166, https://doi.org/10.1016/j.envsci.2022.06.006, 2022.
Adger, W. N.: Social and ecological resilience: are they related?, Prog. Hum. Geog., 24, 347–364, 2000.
Aguilera, P. A., Fernández, A., Fernández, R., Rumí, R., and Salmerón, A.: Bayesian networks in environmental modelling, Environ. Modell. Softw., 26, 1376–1388, https://doi.org/10.1016/j.envsoft.2011.06.004, 2011.
Aguilera, P. A., Fernández, A., Ropero, R. F., and Molina, L.: Groundwater quality assessment using data clustering based on hybrid Bayesian networks, Stoch. Env. Res. Risk A., 27, 435–447, https://doi.org/10.1007/s00477-012-0676-8, 2013.
Alcamo, J.: Chapter Six The SAS Approach: Combining Qualitative and Quantitative Knowledge in Environmental Scenarios, in: Developments in Integrated Environmental Assessment, edited by: Alcamo, J., Elsevier, 123–150, https://doi.org/10.1016/S1574-101X(08)00406-7, 2008.
Ames, D. P., Neilson, B. T., Stevens, D. K., and Lall, U.: Using Bayesian networks to model watershed management decisions: an East Canyon Creek case study, J. Hydroinform., 7, 267–282, https://doi.org/10.2166/hydro.2005.0023, 2005.
Barton, D. N., Saloranta, T., Moe, S. J., Eggestad, H. O., and Kuikka, S.: Bayesian belief networks as a meta-modelling tool in integrated river basin management – Pros and cons in evaluating nutrient abatement decisions under uncertainty in a Norwegian river basin, Ecol. Econ., 66, 91–104, https://doi.org/10.1016/j.ecolecon.2008.02.012, 2008.
Barton, D. N., Kuikka, S., Varis, O., Uusitalo, L., Henriksen, H. J., Borsuk, M., de la Hera, A., Farmani, R., Johnson, S., and Linnell, J. D.: Bayesian networks in environmental and resource management, Integr. Environ. Asses., 8, 418–429, https://doi.org/10.1002/ieam.1327, 2012.
Basco-Carrera, L., Warren, A., van Beek, E., Jonoski, A., and Giardino, A.: Collaborative modelling or participatory modelling? A framework for water resources management, Environ. Modell. Softw., 91, 95–110, https://doi.org/10.1016/j.envsoft.2017.01.014, 2017.
BayesFusion, L. L. C.: GeNIe Modeler, User Manual, https://support.bayesfusion.com/docs/ (last access: 28 July 2022), 2017.
Beuzen, T., Marshall, L., and Splinter, K. D.: A comparison of methods for discretizing continuous variables in Bayesian Networks, Environ. Modell. Softw., 108, 61–66, https://doi.org/10.1016/j.envsoft.2018.07.007, 2018.
Boretti, A. and Rosa, L.: Reassessing the projections of the World Water Development Report. npj Clean Water, 2, 15, https://doi.org/10.1038/s41545-019-0039-9, 2019.
Borsuk, M. E., Stow, C. A., and Reckhow, K. H.: A Bayesian network of eutrophication models for synthesis, prediction, and uncertainty analysis, Ecol. Model., 173, 219–239, https://doi.org/10.1016/j.ecolmodel.2003.08.020, 2004.
Borsuk, M. E., Schweizer, S. and Reichert, P.: A Bayesian network model for integrative river rehabilitation planning and management, Integr. Environ. Asses., 8, 462–472, https://doi.org/10.1002/ieam.233, 2012.
Brown, K.: Resilience, development and global change, Routledge, ISBN 9780415663472, 2015.
Callahan, B., Miles, E., and Fluharty, D. J. P. S.: Policy implications of climate forecasts for water resources management in the Pacific Northwest, Policy Sci., 32, 269–293, https://doi.org/10.1023/A:1004604805647, 1999.
Carvalho, L., Mackay, E. B., Cardoso, A. C., Baattrup-Pedersen, A., Birk, S., Blackstock, K. L., Borics, G., Borja, A., Feld, C. K., Ferreira, M. T., Globevnik, L., Grizzetti, B., Hnedry, S., Hering, D., Kelly, M., Langaas, S., Meissner, K., Panagopoulos, Y., Penning, E., Rouillard, J., Sabater, S., Schmedtje, U., Spears, B. M., Venhor, M., van de Bund, W., and Solheim, A. L.: Protecting and restoring Europe's waters: An analysis of the future development needs of the Water Framework Directive, Sci. Total Environ., 658, 1228–1238, https://doi.org/10.1016/j.scitotenv.2018.12.255 2019.
Castelletti, A. and Soncini-Sessa, R.: Bayesian Networks and participatory modelling in water resource management, Environ. Modell. Softw., 22, 1075–1088, https://doi.org/10.1016/j.envsoft.2006.06.003, 2007.
Chen, S. H. and Pollino, C. A.: Good practice in Bayesian network modelling, Environ. Modell. Softw., 37, 134–145, https://doi.org/10.1016/j.envsoft.2012.03.012, 2012.
Cretney, R.: Resilience for Whom? Emerging Critical Geographies of Socio-ecological Resilience, Geograpy compass, 8, 627–640, 2014.
Crossman, J., Whitehead, P. G., Futter, M. N., Jin, L., Shahgedanova, M., Castellazzi, M., and Wade, A. J.: The interactive responses of water quality and hydrology to changes in multiple stressors, and implications for the long-term effective management of phosphorus, Sci. Total Environ., 454–455, 230–244, https://doi.org/10.1016/j.scitotenv.2013.02.033, 2013.
Dodds, W. K., Perkin, J. S., and Gerken, J. E.: Human impact on freshwater ecosystem services: a global perspective, Environ. Sci. Technol., 47, 9061–9068, https://doi.org/10.1021/es4021052, 2013.
Düspohl, M.: A Review of Bayesian Networks as a Participatory Modeling Approach in Support of Sustainable Environmental Management, Journal of Sustainable Development, 5, 1–18, https://doi.org/10.5539/jsd.v5n12p1, 2012.
Esri Inc.: ArcGIS Pro (version 2.58.0), https://www.esri.com/en-us/arcgis/products/arcgis-pro/overview (last access: 28 July 2022), 2021.
Falconi, S. M. and Palmer, R. N.: An interdisciplinary framework for participatory modeling design and evaluation – What makes models effective participatory decision tools?, Water Resour. Res., 53, 1625–1645, https://doi.org/10.1002/2016WR019373, 2017.
Falkenmark, M.: Freshwater as shared between society and ecosystems: from divided approaches to integrated challenges, Philos. T. R. Soc. B, 358, 2037–2049, https://doi.org/10.1098/rstb.2003.1386, 2003.
Folke, C.: Resilience: The emergence of a perspective for social–ecological systems analyses, Global Environ. Chang., 16, 253–267, https://doi.org/10.1016/j.gloenvcha.2006.04.002, 2006.
Folke, C.: Resilience (Republished), Ecol. Soc., 21, 44, https://doi.org/10.5751/ES-09088-210444, 2016.
Gallaun, H., Dohr, K., Puhm, M., Stumpf, A., and Huge, J.: EU-Hydro – River Net User Guide 1.3, Copernicus Land Monitoring Service, European Environment Agency, https://land.copernicus.eu/user-corner/technical-library/eu-hydro_user_guide.pdf (last access: 30 April 2021), 2019.
Glendell, M., Gagkas, Z., Stutter, M., Richards, S., Lilly, A., Vinten, A., and Coull, M.: A systems approach to modelling phosphorus pollution risk in Scottish rivers using a spatial Bayesian Belief Network helps targeting effective mitigation measures, Frontiers in Environmental Science, 10, 1825, https://doi.org/10.3389/fenvs.2022.976933 2022.
Gray, S., Voinov, A., Paolisso, M., Jordan, R., Bendor, T., Bommel, P., Glynn, P., Hedelin, B., Hubacek, K., Introne, J., Kolagani, N., Laursen, B., Prell, C., Schmitt Olabisi, L., Singer, A., Sterling, E., and Zellner, M.: Purpose, processes, partnerships, and products: four Ps to advance participatory socio-environmental modeling, Ecol. Appl., 28, 46–61, https://doi.org/10.1002/eap.1627, 2018.
Hamby, D. M.:. A comparison of sensitivity analysis techniques, Health Phys., 68, 195–204, 1995.
Hare, M.: Forms of Participatory Modelling and its Potential for Widespread Adoption in the Water Sector, Environ. Policy Gov., 21, 386–402, https://doi.org/10.1002/eet.590, 2011.
Harrison, P. A., Dunford, R. W., Holman, I. P., and Rounsevell, M. D. A.: Climate change impact modelling needs to include cross-sectoral interactions, Nat. Clim. Change, 6, 885–890, https://doi.org/10.1038/nclimate3039, 2016.
Heathwaite, A. L.: Multiple stressors on water availability at global to catchment scales: understanding human impact on nutrient cycles to protect water quality and water availability in the long term, Freshwater Biol., 55, 241–257, https://doi.org/10.1111/j.1365-2427.2009.02368.x, 2010.
Hobbs, B. F.: Bayesian Methods for Analysing Climate Change and Water Resource Uncertainties, J. Environ. Manage., 49, 53–72, https://doi.org/10.1006/jema.1996.0116, 1997.
Holling, C. S.: Resilience and stability of ecological systems, Annu. Rev. Ecol. Syst., 4, 1–23, 1973.
Holman, I. P., Harrison, P. A., and Metzger, M. J.: Cross-sectoral impacts of climate and socio-economic change in Scotland: implications for adaptation policy, Reg. Environ. Change, 16, 97–109, https://doi.org/10.1007/s10113-014-0679-8, 2016.
Jakeman, A. J., Letcher, R. A., and Norton, J. P.: Ten iterative steps in development and evaluation of environmental models, Environ. Modell. Softw., 21, 602–614, https://doi.org/10.1016/j.envsoft.2006.01.004, 2006.
Kaikkonen, L., Parviainen, T., Rahikainen, M., Uusitalo, L., and Lehikoinen, A.: Bayesian networks in environmental risk assessment: A review, Integr. Environ. Asses., 17, 62–78, https://doi.org/10.1002/ieam.4332, 2021.
Landis, W. G.: The origin, development, application, lessons learned, and future regarding the Bayesian network relative risk model for ecological risk assessment, Integr. Environ. Asses., 17, 79–94, https://doi.org/10.1002/ieam.4351, 2021.
Liu, Y., Gupta, H., Springer, E., and Wagener, T.: Linking science with environmental decision making: Experiences from an integrated modeling approach to supporting sustainable water resources management, Environ. Modell. Softw., 23, 846–858, https://doi.org/10.1016/j.envsoft.2007.10.007, 2008.
Lowe, J. A., Bernie, D., Bett, P., Bricheno, L., Brown, S., Calvert, D., Clark, R., Eagle, K., Edwards, T., Fosser, G, Fung, F., Gohrar, L., Good, P., Gregory, J., Harris, G., Howard, T., Kaye, N., Kendon, E., Krijnen, J., Maisey, P., McDonald, R., McInnes, R., McSweeney, C., Mitchell, J. F. B., Murphy, J., Palmer, M., Roberts, C., Roston, J., Sexton, D., Thornton, H., Tinker, J., Tucker, S., Yamazaki, K., and Belcher, S.: UKCP18 Science Overview Report, Met Office Hadley Centre, Exeter, UK, https://www.metoffice.gov.uk/pub/data/weather/uk/ukcp18/science-reports/UKCP18-Overview-report.pdf (last access: 18 October 2022), 2018.
Macgregor, C. J. and Warren, C. R.: Evaluating the impacts of nitrate vulnerable zones on the environment and farmers' practices: a Scottish case study, Scot. Geogr. J., 132, 1–20, https://doi.org/10.1080/14702541.2015.1034760, 2016.
Marcot, B. G. and Penman, T. D.: Advances in Bayesian network modelling: Integration of modelling technologies, Environ. Model. Softw., 111, 386–393, https://doi.org/10.1016/j.envsoft.2018.09.016, 2019.
Marcot, B. G., Steventon, J. D., Sutherland, G. D., and McCann, R. K.: Guidelines for developing and updating Bayesian belief networks applied to ecological modeling and conservation, Can. J. Forest. Res., 36, 3063–3074, https://doi.org/10.1139/x06-135, 2006.
Mayfield, H. J., Bertone, E., Smith, C., and Sahin, O.: Use of a structure aware discretisation algorithm for Bayesian networks applied to water quality predictions, Math. Comput. Simul., 175, 192–201, https://doi.org/10.1016/j.matcom.2019.07.005, 2020.
Moe, S. J., Couture, R.-M., Haande, S., Lyche Solheim, A., and Jackson-Blake, L.: Predicting Lake Quality for the Next Generation: Impacts of Catchment Management and Climatic Factors in a Probabilistic Model Framework, Water, 11, 1767, https://doi.org/10.3390/w11091767, 2019.
Moe, S. J., Carriger, J. F., and Glendell, M.: Increased Use of Bayesian Network Models Has Improved Environmental Risk Assessments, Integr. Environ. Asses., 17, 53–61, https://doi.org/10.1002/ieam.4369, 2021.
Molina, J.-L., Pulido-Velázquez, D., García-Aróstegui, J. L., and Pulido-Velázquez, M.: Dynamic Bayesian networks as a decision support tool for assessing climate change impacts on highly stressed groundwater systems, J. Hydrol., 479, 113–129, https://doi.org/10.1016/j.jhydrol.2012.11.038, 2013.
Morton, R. D., Marston, C. G., O'Neil, A. W., and Rowland, C. S.: Land Cover Map 2019 (land parcels, GB), NERC Environmental Information Data Centre [data set], https://doi.org/10.5285/44c23778-4a73-4a8f-875f-89b23b91ecf8, 2020.
O'Neill, B. C., Kriegler, E., Ebi, K. L., Kemp-Benedict, E., Riahi, K., Rothman, D. S., Van Ruijven, B. J., Van Vuuren, D. P., Birkmann, J., Kok, K., Levy, M., and Solecki, W.: The roads ahead: Narratives for shared socioeconomic pathways describing world futures in the 21st century, Global Environ. Chang., 42, 169–180, https://doi.org/10.1016/j.gloenvcha.2015.01.004, 2017.
Pahl-Wostl, C.: Transitions towards adaptive management of water facing climate and global change, Water Resour. Manag., 21, 49–62, https://doi.org/10.1007/s11269-006-9040-4, 2007.
Pahl-Wostl, C., Jeffrey, P., Isendahl, N. and Brugnach, M.: Maturing the New Water Management Paradigm: Progressing from Aspiration to Practice, Water Resour. Manag., 25, 837–856, https://doi.org/10.1007/s11269-010-9729-2, 2011.
Pearl, J.: Fusion, propagation, and structuring in belief networks, Artif. Intell., 29, 241–288, https://doi.org/10.1016/0004-3702(86)90072-X, 1986.
Pedde, S., Harrison, P. A., Holman, I. P., Powney, G. D., Lofts, S., Schmucki, R., Gramberger, M., and Bullock, J. M.: Enriching the Shared Socioeconomic Pathways to co-create consistent multi-sector scenarios for the UK, Sci. Total Environ., 756, 143172, https://doi.org/10.1016/j.scitotenv.2020.143172, 2021.
Plummer, R. and Baird, J.: The emergence of water resilience: An introduction, Water Resilience, Springer, https://doi.org/10.1007/978-3-030-48110-0_1, 2021.
Pham, H. V., Sperotto, A., Furlan, E., Torresan, S., Marcomini, A., and Critto, A.: Integrating Bayesian Networks into ecosystem services assessment to support water management at the river basin scale, Ecosyst. Serv., 50, 101300, https://doi.org/10.1016/j.ecoser.2021.101300, 2021.
Phan, T. D., Smart, J. C. R., Capon, S. J., Hadwen, W. L., and Sahin, O.: Applications of Bayesian belief networks in water resource management: A systematic review, Environ. Modell. Softw., 85, 98–111, https://doi.org/10.1016/j.envsoft.2016.08.006, 2016.
Phan, T. D., James, C. R. S., Ben, S.-K., Oz, S., Wade, L. H., Lien, T. D., Iman, T., and Samantha, J. C.: Applications of Bayesian networks as decision support tools for water resource management under climate change and socio-economic stressors: a critical appraisal, Water, 11, 2642, https://doi.org/10.3390/w11122642, 2019.
Pollino, C. A. and Henderson, C.: Bayesian networks: A guide for their application in natural resource management and policy, Landscape Logic, Technical Report, 14, Please include the following link: https://www.utas.edu.au/__data/assets/pdf_file/0009/588474/TR_14_BNs_a_resource_guide.pdf (last access: 22 September 2022), 2010.
Renaud, F. G., Birkmann, J., Damm, M., and Gallopín, G. C.: Understanding multiple thresholds of coupled social–ecological systems exposed to natural hazards as external shocks, Nat. Hazards, 55, 749–763, 2010.
Rodina, L.: Defining “water resilience”: Debates, concepts, approaches, and gaps, WIREs Water, 6, e1334, https://doi.org/10.1002/wat2.1334, 2019.
Rounsevell, M. D. A., and Metzger, M. J.: Developing qualitative scenario storylines for environmental change assessment, WIREs Climate Change, 1, 606–619, https://doi.org/10.1002/wcc.63, 2010.
SEPA: Sustainable Growth Agreement Scottish Water and Scottish Environment Protection Agency Progress Update February, https://www.sepa.org.uk/media/496202/scottish-water-sga-update.pdf (last access: 24 March 2023), 2020.
Sperotto, A., Molina, J.-L., Torresan, S., Critto, A., and Marcomini, A.: Reviewing Bayesian Networks potentials for climate change impacts assessment and management: A multi-risk perspective, J. Environ. Manage., 202, 320–331, https://doi.org/10.1016/j.jenvman.2017.07.044, 2017.
Tang, C., Yi, Y., Yang, Z., and Sun, J.: Risk analysis of emergent water pollution accidents based on a Bayesian Network, J. Environ. Manage., 165, 199–205, https://doi.org/10.1016/j.jenvman.2015.09.024, 2016.
Environmental Change Network: The ECN Data Centre – Site Information: Eden (Fife), http://data.ecn.ac.uk/sites/ecnsites.asp?site=R17 (last access: 6 September 2021), 2021.
Troldborg, M., Gagkas, Z., Vinten, A., Lilly, A., and Glendell, M.: Probabilistic modelling of the inherent field-level pesticide pollution risk in a small drinking water catchment using spatial Bayesian belief networks, Hydrol. Earth Syst. Sci., 26, 1261–1293, https://doi.org/10.5194/hess-26-1261-2022, 2022.
United Nations, U. W.: Wastewater Management – UN-Water Analytical Brief Geneva, Switzerland: World Meteorogical Organisation, https://www.unwater.org/publications/wastewater-management-un-water-analytical-brief (last access: 20 August 2021), 2015.
Uusitalo, L.: Advantages and challenges of Bayesian networks in environmental modelling, Ecol. Model., 203, 312–318, https://doi.org/10.1016/j.ecolmodel.2006.11.033, 2007.
Van Vuuren, D. P., Kriegler, E., O'Neill, B. C., Ebi, K. L., Riahi, K., Carter, T. R., Edmonds, J., Hallegatte, S., Kram, T., and Mathur, R.: A new scenario framework for climate change research: scenario matrix architecture, Climatic Change, 122, 373–386, 2014.
Vörösmarty, C. J., McIntyre, P. B., Gessner, M. O., Dudgeon, D., Prusevich, A., Green, P., Glidden, S., Bunn, S. E., Sullivan, C. A., Liermann, C. R., and Davies, P. M: Global threats to human water security and river biodiversity, Nature, 467, 555–561, https://doi.org/10.1007/s10584-013-0906-1, 2010.
Voinov, A. and Bousquet, F.: Modelling with stakeholders, Environ. Modell. Softw., 25, 1268–1281, https://doi.org/10.1016/j.envsoft.2010.03.007, 2010.
Wada, Y., Flörke, M., Hanasaki, N., Eisner, S., Fischer, G., Tramberend, S., Satoh, Y., van Vliet, M. T. H., Yillia, P., Ringler, C., Burek, P., and Wiberg, D.: Modeling global water use for the 21st century: the Water Futures and Solutions (WFaS) initiative and its approaches, Geosci. Model Dev., 9, 175–222, https://doi.org/10.5194/gmd-9-175-2016, 2016.
Wade, M., O'Brien, G. C., Wepener, V., and Jewitt, G.: Risk Assessment of Water Quantity and Quality Stressors to Balance the Use and Protection of Vulnerable Water Resources, Integr. Environ. Asses., 17, 110–130, https://doi.org/10.1002/ieam.4356, 2021.
Walker, B., Carpenter, S., Anderies, J., Abel, N., Cumming, G., Janssen, M., Lebel, L., Norberg, J., Peterson, G. D., and Pritchard, R.: Resilience Management in Social-ecological Systems a Working Hypothesis for a Participatory Approach, Conserv. Ecol., 6, 1, http://www.consecol.org/vol6/iss1/art14/ (last access: 3 August 2021), 2002.
Wöhler, L., Niebaum, G., Krol, M., and Hoekstra, A.Y.: The grey water footprint of human and veterinary pharmaceuticals, Water Res. X, 7, 100044, https://doi.org/10.1016/j.wroa.2020.100044, 2020.
Xue, J., Gui, D., Lei, J., Sun, H., Zeng, F., and Feng, X.: A hybrid Bayesian network approach for trade-offs between environmental flows and agricultural water using dynamic discretization, Adv. Water Resour., 110, 445–458, https://doi.org/10.1016/j.advwatres.2016.10.022, 2017.
Yüksel, I.: Developing a multi-criteria decision making model for PESTEL analysis, International Journal of Business and Management, 7, 52, https://doi.org/10.5539/ijbm.v7n24p52, 2012.
A visual description of the One Planet Choices approach can be found by following this link https://vimeo.com/804313679/1139d31b45 (last access: 1 May 2023).