the Creative Commons Attribution 4.0 License.
the Creative Commons Attribution 4.0 License.
 | 20 Apr 2023
Methodology for constructing a flood-hazard map for a future climate
Yuki Kimura
Yukiko Hirabayashi
Yuki Kita
Xudong Zhou
Dai Yamazaki
Flooding is a major natural hazard in many parts of the world, and its frequency and magnitude are projected to increase with global warming. With increased concern over ongoing climate change, more detailed and precise information about climate-change risks is required for formulating local-scale countermeasures. However, the impacts of biases in climate-model outputs on river-flood simulation have not been fully evaluated, and thus evaluation of future flood risks using hazard maps (high-resolution spatial-distribution maps of inundation depths) has not been achieved. Therefore, this study examined methods for constructing future-flood-hazard maps and discussed their validity. Specifically, we compared the runoff-correction method that corrects for bias in general-circulation-model (GCM) runoff using the monthly climatology of reanalysis runoff with the lookup method, which uses the GCM simulation results without bias correction to calculate changes in the return period and depends on the reanalysis simulation to determine absolute flood depths. The results imply that the runoff-correction method may produce significantly different hazard maps compared to those based on reanalysis of runoff data. We found that, in some cases, bias correction did not perform as expected for extreme values associated with the hazard map, even under the historical climate, as the bias of extreme values differed from that of the mean value. We found that the change direction of a future hazard (increase or decrease) obtained using the runoff-correction method relative to the reference reanalysis-based hazard map may be inconsistent with changes projected by Catchment-based Macro-scale Floodplain Model (CaMa-Flood) simulations based on GCM runoff input in some cases. On the other hand, the lookup method produced future-hazard maps that are consistent with flood-hazard changes projected by CaMa-Flood simulations obtained using GCM runoff input, indicating the possibility of obtaining a reasonable inundated-area distribution. These results suggest that the lookup method is more suitable for future-flood hazard-map construction than the runoff-correction method. The lookup method also has the advantage of facilitating research on efficient construction of future-climate hazard maps, as it allows for improvement of the reanalysis hazard map through upgrading of the model and separate estimation of changes due to climate change. We discuss future changes at the global scale in inundation areas and the affected population within the inundation area. Using the lookup method, the total population living in modeled inundation areas with flood magnitudes exceeding the 100-year return period under a future climate would be approximately 1.86 billion. In the assessment of future-climate risks, we found that an affected population of approximately 0.2 billion may be missed if the historical-hazard map is used as an alternative to constructing future-hazard maps, and only frequency changes are considered. These results suggest that, in global flood-risk studies, future-hazard maps are important for proper estimation of climate-change risks rather than assessing solely changes in the frequency of occurrence of a given flood intensity.
- Article
(5253 KB) - Full-text XML
-
Supplement
(13547 KB) - BibTeX
- EndNote


Flooding is a common major natural hazard in many parts of the world, and its frequency and magnitude are projected to increase with global warming. The 6th Assessment Report of the Intergovernmental Panel on Climate Change (IPCC) Chapter 11 indicated that the incidence of heavy rainfall has increased in many regions since 1950 (Seneviratne et al., 2021). Hirabayashi et al. (2021) assessed changes in the frequency of flood risk in the future and showed that flood risk will increase in many regions, including South Asia, Southeast Asia, northeastern Eurasia, eastern and low-latitude Africa and South America. According to Dottori et al. (2018), with a temperature increase of 1.5 ∘C, human losses from flooding could rise by 70 %–83 % and direct flood damage by 160 %–240 % in the absence of future adaptation measures. Alfieri et al. (2017) showed that, with 4 ∘C warming, countries representing more than 70 % of the global population and global gross domestic product (GDP) would face increases in flood risk of more than 500 %. While these global-scale studies have projected total future flood losses at the continental, regional or national scales, they do not provide local flood-risk information under future climatic conditions.
Following the increase in concern about ongoing climate change, detailed and high-resolution information about climate-change risk that can be used for local-scale countermeasures is essential. To elucidate the potential impacts of flood disasters, high-resolution inundation-depth maps must be developed, commonly named a hazard map. The Sendai Framework for Disaster Risk Reduction 2015–2030 produced by the United Nations Office for Disaster Risk Reduction (UNISDR, 2015) also highlighted the importance of developing hazard maps to clarify disaster risk. Flood-hazard maps describe the spatial distribution of potential inundation depths for an event of specific occurrence probability to illustrate quantitatively the risk distribution at a local scale.
Local-scale flood-hazard maps have been developed by many research institutes and local governments using historical observation data and flood-inundation models, and these maps are used for various purposes. Governments and municipalities use flood-hazard maps to identify risks and formulate business-continuity plans (BCPs) (De Moel et al., 2009). In the research field, for example, Bates et al. (2023) estimated annual flood damage in the UK and Wing et al. (2022) estimated flood damage in the US by using local-scale flood-hazard maps. In many countries, flood-hazard maps are made available to the public to assist residents in identifying their own risks and to facilitate evacuation activities. The private sector is also making progress in using local-scale flood-hazard maps. For example, the insurance industry uses local-scale hazard maps to set premium rates corresponding to local hazards. The National Flood Insurance Program (NFIP) in the United States uses flood-insurance-rate maps (flood surface elevations for the N-year return period) provided by the Federal Emergency Management Agency (FEMA) to calculate flood-insurance-premium rates (FEMA, 2018). Companies also use local-scale hazard maps to identify flood risks to their own buildings and factories, scrutinize the contents of their insurance policies and formulate BCPs in preparation for a possible disaster (Japan Institute of Country-ology and Engineering 39th report, 2021). However, in many developing countries in Asia and Africa, detailed local-hazard maps are unavailable.
In the research field, large-domain flood-hazard maps have been developed to assess flood risks and their distribution at the global scale. Examples of large-domain flood-hazard maps include maps constructed by Fathom (Sampson et al., 2015), the Joint Research Centre (JRC, 2022), the Global Assessment Report (GAR, 2015) and Aqueduct Floods published by the World Research Institute (WRI) (Aqueduct, 2022). Large-domain flood-hazard maps have been used in many applications such as estimation of the affected population within an inundation area and determination of the impacts of flooding on GDP and urban areas in the current climate (Ward et al., 2020a). Validation of large-domain flood-hazard maps is currently underway. Hirabayashi et al. (2022), Trigg et al. (2016) and Bernhofen et al. (2018) compared multiple global flood models and analyzed the factors contributing to differences in inundation areas and depths. Although their accuracy may be insufficient, large-domain hazard maps for the current climate are now being used for various decision-making purposes. Hirabayashi et al. (2022) provided recommendations for the practical application of large-domain hazard maps in corporate practice.
In addition to flood-hazard maps of the historical period, developing flood-hazard maps for a future period is also essential for assessing climate-change risk quantitatively. Although climatic and meteorological hazards under future climate change (e.g., extreme temperatures, droughts and heavy-rainfall events) have been widely assessed using direct output variables of general circulation models (GCMs), such as precipitation and temperature (Li et al., 2021; Lu et al., 2019), to date, no global high-resolution future flood hazard (i.e., inundation depth) has been sufficiently verified. Some studies have evaluated future flood risks (e.g., affected population and GDP) at the global scale (e.g., Ward et al., 2020b); however, it is important to analyze global future flood hazards (i.e., inundation-depth distribution) and to assess uncertainties such as those caused by various bias-correction methods.
Simulation of inundation areas and depths under a future climate at high resolution is technically possible using the latest global river models together with climate-projection data and downscaling techniques. However, the reliability of future flood-hazard mapping has not been thoroughly assessed, in part because no methodology to correct the bias present in the runoff output from GCMs has been established yet. Climate-projection data contain biases, and the direct use of climate-projection data faces problems, including the inability to estimate the duration of inundation, which is important for estimating indirect damage (Taguchi et al., 2022). While bias-correction methods for precipitation and temperature have been studied in detail (Watanabe et al., 2012; Hempel et al., 2013; Lafond et al., 2014), such methods have not been established for runoff data for use as inputs to global flood models to construct large-domain future flood-hazard maps.
At present, methods for constructing future flood-hazard maps have not been evaluated in detail. Therefore, this study investigated the following points to validate global flood-hazard maps under a future climate constructed using the global river model. We compared two representative methods for generating future flood-hazard maps that handle bias in GCM runoff and investigated which method produces the most reasonable inundation-depth distribution. The causes of differences in the hazard maps constructed using the two methods were investigated, and the most appropriate method for creating future-hazard maps was assessed. In addition, we examined how much the estimated changes in future flood risk differed depending on whether bias correction was implemented and on the method used for future-hazard mapping.
This paper is organized as follows. Section 2 describes the models and bias-correction methods used in this study and the method used to construct future flood-hazard maps. Section 3 explores several methods to construct hazard maps for a future climate, and the cause of differences among hazard maps is constructed using various methods. In Sect. 4, we discuss which method is most appropriate for creating future-hazard maps and how much the estimates of future flood-risk changes differed depending on whether bias correction was implemented and on the method used for future-hazard mapping.
2.1 Model and data
We used the Catchment-based Macro-scale Floodplain Model (CaMa-Flood; Yamazaki et al., 2011) ver. 4.01 (Yamazaki et al., 2021) for global river and inundation simulations. The major advantage of CaMa-Flood is its high computational efficiency. In CaMa-Flood, river channel flow and floodplain inundation can be calculated simultaneously using subgrid topographic parameters. In this model, river flow simulation is conducted on the basis of the unit catchment element, and water level and flood extent are diagnosed from the water volume in each unit catchment using subgrid topographic parameters. The local inertial equation (Yamazaki et al., 2013) is used as the basic flow equation. This equation can represent the backwater effect, which is important for accurate reproduction of inundated areas. A flow scheme for bifurcated channels is included in CaMa-Flood (Yamazaki et al., 2014). Although CaMa-Flood is a global model, it has a characteristic where it represents the physical processes necessary to reproduce floodplain-inundation dynamics.
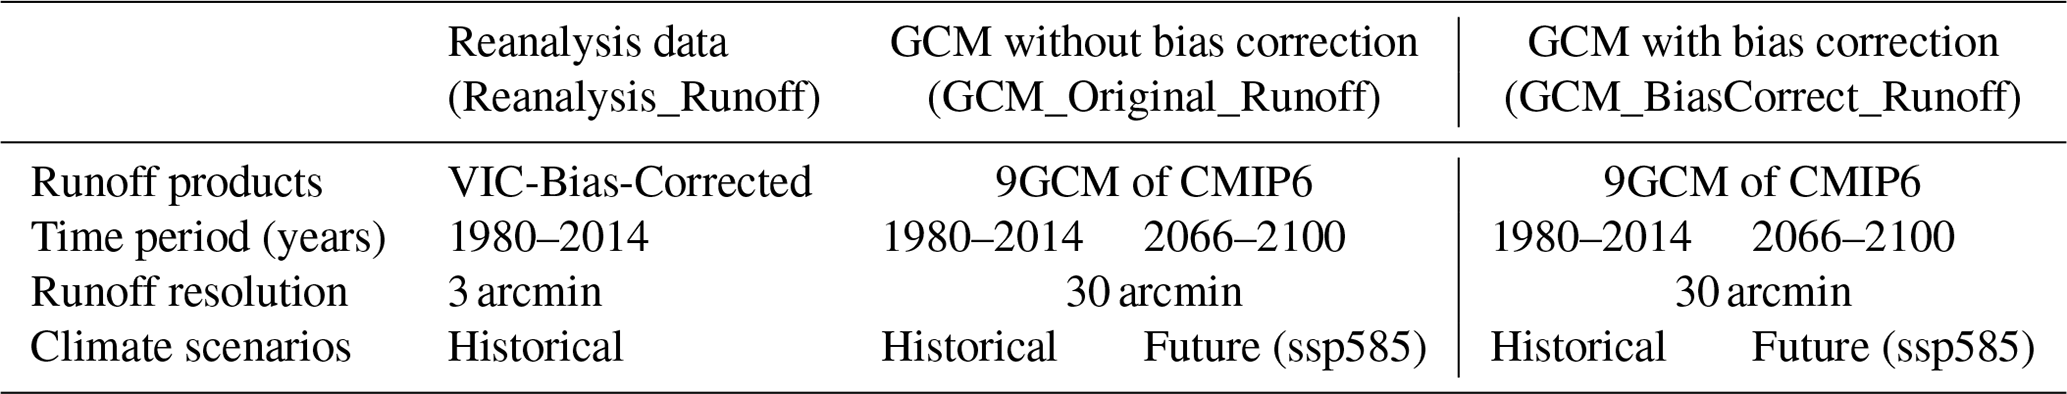
In this study, we simulated global river and inundation dynamics using three types of runoff data to construct flood-hazard maps. The three types of runoff data were reanalysis-based runoff data obtained from past observations (Reanalysis_Runoff), GCM-output runoff without bias correction (GCM_Runoff_Ori) and GCM-output runoff with bias correction (GCM_Runoff_BC). The GCM-output runoff data were analyzed for two periods: historical (1980–2014) and future (2066–2100). The reanalysis runoff data used in this study were VIC-Bias-Corrected (Yang et al., 2021) and are the output of the Variable Infiltration Capacity (VIC) land surface model (Liang et al., 1994, 1996) with bias correction using the Global Streamflow Characteristics Dataset (Beck et al., 2015) as reference data. Yang et al. (2021) compared discharge data based on VIC-Bias-Corrected runoff with observations and found that the VIC-Bias-Corrected model has an excellent ability to estimate discharge and a high reproducibility of extreme values. For VIC-Bias-Corrected runoff data, the original spatial resolution (3 arcmin) was input to CaMa-Flood. For GCM-output runoff (GCM_Runoff_Ori and GCM_Runoff_BC), we used nine GCMs, MIROC6, IPSL-CM6A-LR, GFDL-CM4, NorESM2-MM, ACCESS-CM2, INM-CM5-0, MPI-ESM1-2-HR, MRI-ESM2-0 and EC-Earth3, similar to Hirabayashi et al. (2021). GCM-output runoff was converted from its original spatial resolution to 30 arcmin resolution through bilinear interpolation. We also generated bias-corrected runoff, and the methods used for bias correction are described in detail in Sect. 2.3. The runoff products, resolutions and periods assessed in this study are listed in Table 1.
2.2 Reference historical flood-hazard map generation
Flood-hazard maps were generated through downscaling of river water levels simulated by CaMa-Flood (6 arcmin resolution) to the resolution of elevation data (3 arcsec). The general procedures used for simulation and data processing are summarized in Fig. 1a. First, we conducted a historical river hydrodynamics simulation with a daily time step using observation-based runoff data (Reanalysis_Runoff) as an input to CaMa-Flood (time period: 1980–2014). The CaMa-Flood model produces outputs as daily time series, including river discharge, river water level and flood extent. In this study, the annual maximum river water level was calculated from daily river water level data and used for extreme-value analysis in the following step.
As the second step, river water levels at 6 arcmin resolution corresponding to the targeted return period (RP) were calculated. We fitted the Gumbel distribution (Zhou et al., 2021) to the time series of annual maximum river water levels using the L-moments method (Hosking, 2015) on each of the CaMa-Flood 6 arcmin grids. Due to the relatively small dataset, we used the Gumbel distribution, which provides more robust and stable results from small datasets than other distributions (Hirabayashi et al., 2021; Dankers, 2008). Then, the river water levels corresponding to the targeted RP (e.g., 100 years) for each catchment were calculated from the Gumbel distribution.
We applied a simple postprocessing method to river water levels corresponding to the targeted RP estimated in the previous step to obtain a more reasonable spatial distribution of water levels. Through fitting of individual Gumbel distributions, the upstream water surface elevation can become lower than the downstream level, causing an unrealistic reverse water slope. To avoid this issue, if a reverse water slope was obtained in the water surface elevation distribution, we increased the water surface elevation of upstream catchments to match those of downstream catchments. This reverse-slope revision during the hazard-mapping process is a new method proposed in this paper. If reverse-slope revision is not conducted, the reverse slope produced by fitting the Gumbel distributions remains and the inundation-depth distribution may not be physically reasonable. For this reason, a novel reverse-slope-revision method was applied in this study with the purpose of revising the spatial inconstancy caused by distribution fitting at each unit-catchment scale (grid scale).
The third step is projecting the water levels of the target RP (e.g., 100 years) onto a high-resolution elevation map. Downscaling was performed under the assumption that the water surface elevation is uniform within each 6 min unit catchment, and thus the floodplain water depth is calculated when the terrain elevation of a 3 arcsec pixel is lower than the water surface elevation. The river network map of CaMa-Flood (6 arcmin resolution in this study) was constructed through upscaling of a high-resolution river topographic map (MERIT Hydro; Yamazaki et al., 2019). Through this procedure, correspondence between 3 s resolution pixels and 6 min unit catchments was preserved, allowing the water level simulated at 6 min resolution to be downscaled to match topographic data with 3 s resolution (for details of the upscaling method, see Yamazaki et al., 2011).
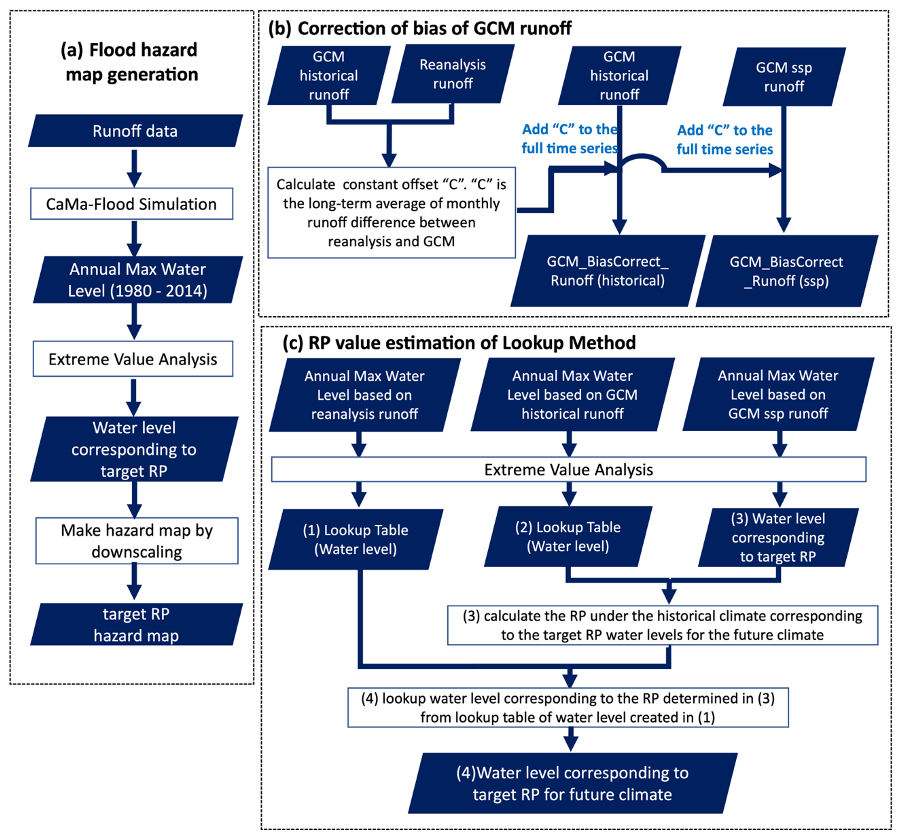
Figure 1Simplified schematic diagrams of (a) flood-hazard map generation, (b) correction of bias of GCM runoff, and (c) RP value estimation via the lookup method.
2.3 Future flood-depth estimation
In this study, two methods of estimating future flood depth were compared. The two methods are summarized in Sect. 2.3.1 and 2.3.2.
2.3.1 Runoff-correction method
The runoff-correction method used bias-corrected GCM runoff for future simulation and calculated future flood depths corresponding to specific return periods through direct application of extreme-value analysis to the simulated flood-depth time series. We investigated whether realistic future-hazard maps could be generated through bias correction of input runoff data for CaMa-Flood. The procedure followed after CaMa-Flood simulation is the same as the reanalysis-based method described in Sect. 2.2. We generated historical-hazard maps using bias-corrected runoff from the historical period to validate the reliability of the runoff-correction method.
Bias correction was applied through additive correction of the monthly mean runoff with runoff from the reanalysis data, which is referred to in Hempel et al. (2013). Figure 1b shows a simplified schematic diagram of the bias-correction process for input runoff data. Specifically, the 35-year (1980–2014) averages of monthly runoff from the reanalysis data and the GCM were calculated (Eq. 1), and a constant offset C, equal to the difference from the long-term average, was set for each month.
where indicates Reanalysis_Runoff and indicates GCM_Runoff_Ori (i and j denote the year and month, respectively). This value was used for full time-series analysis of the GCM under a future climate (Eq. 2).
where and are GCM_Runoff_Ori and GCM_Runoff_BC, respectively.
Alternatives to the additive correction method include the multiplicative correction method, which multiplies the ratio of the GCM to the reanalysis data, and the quantile-based mapping method (Panofsky and Brier, 1968; Watanabe, 2020), which obtains ordinal statistics from the reanalysis data and the GCM and creates an equation relating these statistics. In the future climate, the average monthly runoff may fluctuate significantly due to changes in the humid and arid zones and the timing of the wet and dry seasons caused by increasing temperatures. We selected the additive correction method because it is relatively insensitive to such fluctuations.
2.3.2 Lookup method
In the lookup method, we first calculate the change in flood probability between the historical and future periods using the original GCM runoff simulation (i.e., we estimate the historical RP equivalent to the magnitude of the targeted future RP). Then, the flood depth of the future target RP is estimated based on the flood depth of a historical flood of equivalent magnitude from the reanalysis runoff simulation. Because we use a lookup table to describe the relationship between flood depth and RP in the reanalysis simulation, this method is designated the lookup method. The aim of the lookup method is to use the GCM-based simulation results to calculate the relative change in RP, relying on the higher accuracy of the reanalysis simulation for absolute flood depth. The calculation process is illustrated in Fig. 1c, and the detailed procedures are as follows. (1) The extreme-value analysis described above is applied to the river water levels obtained using Reanalysis_Runoff, and a lookup table is calculated (river water levels corresponding to RPs of 2–1000 years) for each grid. (2) Extreme-value analysis is also applied to the river water levels obtained with GCM_Runoff_Ori under the historical climate, and a lookup table is calculated for each grid. (3) Next, the target RP river water levels under the future climate are calculated by applying extreme-value analysis to the river water levels calculated from GCM_Runoff_Ori under the future climate. Then, with reference to the lookup table of river water levels created in step (2), the RP under the historical climate corresponding to the target RP water levels for the future climate is calculated. (4) Then, for each grid, the water level corresponding to the RP determined in (3) is obtained from the reanalysis lookup table of water levels created in step (1). (5) If a reverse slope is present in the water level distribution created in (4), the reverse slope is revised, downscaling is conducted and the result is used as the target RP hazard map for the future climate.
As noted above, the lookup method uses only the statistical frequency of flooding calculated using the GCMs, and the value calculated from the reanalysis data is used to determine inundation depths corresponding to that frequency. As the lookup method does not use GCM_Runoff_BC and thus avoids the uncertainties associated with bias correction, including questionable results of bias correction for extreme events (Alfieri et al., 2017; Huang et al., 2014), several previous studies have employed this technique (Hirabayashi et al., 2013, 2021). Alfieri et al. (2017) used the lookup method to estimate the future affected population and damage by flood using historical flood-hazard maps coupled with frequency changes under future climate scenarios.
The results obtained using the runoff-correction and lookup methods were compared from the following two perspectives. First, differences between the two methods were analyzed using a single GCM for runoff at the global scale, and the mechanisms underlying the observed differences were examined. Second, we compared the results obtained using multiple GCMs for runoff and assessed the uncertainty and robustness of the two methods.
3.1 Comparison of methods for generating future-hazard maps
We created a global reference historical-hazard map based on reanalysis runoff data and a future-hazard map using the runoff-correction and lookup methods. Figure 2 shows the flood depths at 6 arcmin resolution prior to downscaling for the purpose of visualization. Here, we present the results of the 100-year RP hazard map from IPSL-CM6A-LR, which is the Coupled Model Intercomparison Project Phase 6 (CMIP6, Eyring et al., 2016) GCM that showed the maximum bias relative to reanalysis data among nine GCMs tested. Figure 2b and c show that the direction of change from the reference historical-hazard map was the same as both methods for many rivers. Notable differences were found in the northern parts of the Sahara, parts of North America (around the Mississippi and Missouri rivers) and around the Amazon River, where the two methods showed opposite change trends. Both the runoff-correction and lookup methods used the reanalysis data as reference data to handle errors in GCM-output runoff. Therefore, the change trends from the reference historical-hazard map were expected to be in the same direction. The future-hazard maps produced through the two methods showed opposite trends in changes compared to the reference hazard map, indicating that one of the methods may be unable to account properly for changes in future flood hazards when reanalysis data are used as the historical reference dataset.
For detailed analysis, we created hazard maps that focused on several river basins and examined the validity of the two methods for constructing future-hazard maps. Prior to validating the future-hazard maps, we confirmed the validity of the historical-hazard map through the runoff-correction method. The following two river basins were selected for detailed discussion in this paper: the Mekong River basin (specifically, the Chi-Mun River, a tributary of the Mekong River, Fig. 3), where the two methods showed the same trend under a future climate, and the Amazon River basin (upstream of Manaus, Fig. 4), where the two methods showed opposite trends. In the runoff-correction process, the climatology of the monthly average GCM runoff for each grid was corrected toward the climatology of the monthly average reanalysis runoff; this step reduced the absolute runoff errors in the GCM. Therefore, the historical-hazard map constructed using the runoff-correction method was expected to be similar to the reference historical-hazard map. As shown in Fig. 3a–c, the Chi-Mun River historical-hazard map produced using the runoff-correction method was most similar to the reference hazard map. However, underestimation for the Amazon River relative to the reference hazard map remained after bias correction (Fig. 4a–c). Bias-corrected reanalysis runoff using a monthly climatology produced a significant difference in the hazard map compared to the map based on reanalysis runoff.

Figure 2100-year RP inundation-depth distributions for (a) a global reference historical-hazard map, (b) future-hazard changes obtained using the runoff-correction method (using IPSL-CM6A-LR) relative to (a) and (c) future-hazard changes obtained with the lookup method (using IPSL-CM6A-LR) relative to panel (a).
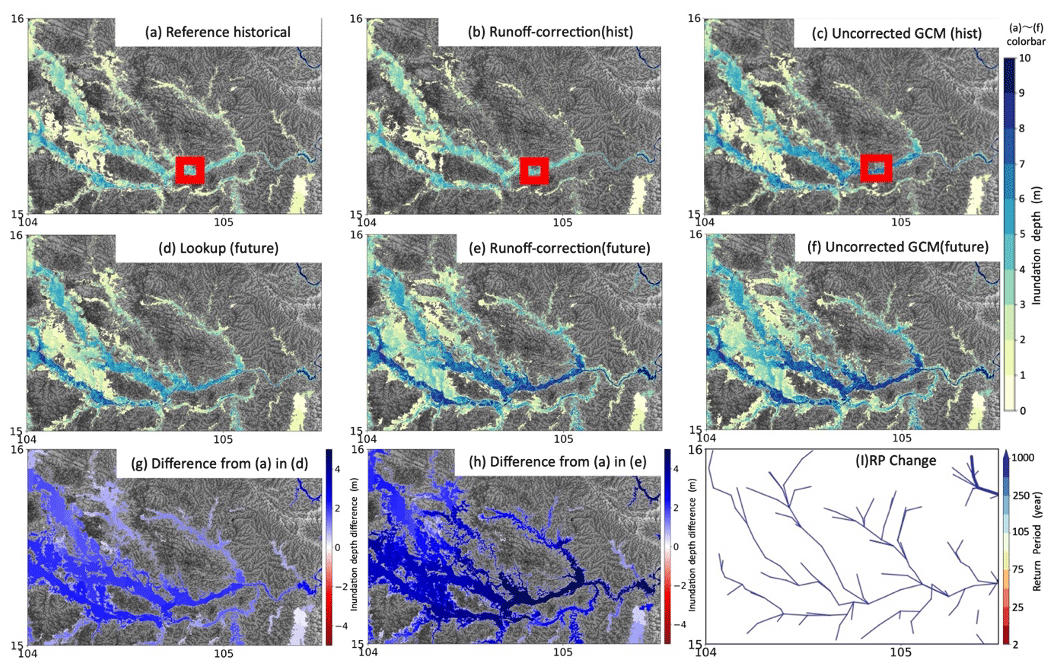
Figure 3100-year RP hazard map for the Chi-Mun River basin (using the IPSL-CM6A-LR CMIP6 GCM). (a) Reference historical-hazard map (based on reanalysis data), (b) hazard map constructed using the runoff-correction method (historical), (c) hazard map based on uncorrected GCM runoff (historical), (d) hazard map constructed using the lookup method, (e) hazard map constructed using the runoff-correction method (future) and (f) hazard map based on uncorrected GCM runoff (future). (g, h) Differences from the reference historical-hazard map in (g) the hazard map obtained with the lookup method and (h) the hazard map obtained using the runoff-correction method (future) and (i) historical RP of river water level corresponding to the 100-year RP in the future. Red boxes in panels (a)–(c) indicate the location of the GRDC Ubon station (104.8617∘ E, 15.2217∘ N).
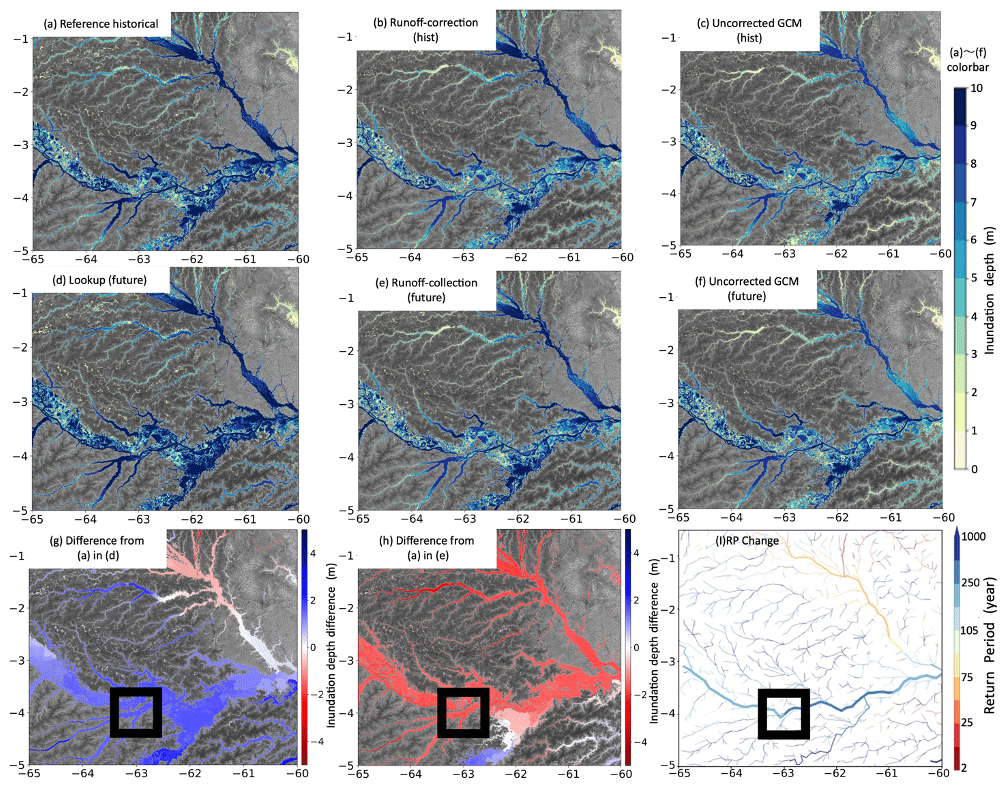
Figure 4100-year RP hazard map in the Amazon River basin (using IPSL-CM6A-LR of the CMIP6 GCM). (a) Reference historical-hazard map (based on reanalysis data), (b) hazard map constructed using the runoff-correction method (historical), (c) hazard map based on uncorrected GCM runoff (historical), (d) hazard map constructed using the lookup method, (e) hazard map constructed using the runoff-correction method (future) and (f) hazard map based on uncorrected GCM runoff (future). (g, h) Differences from the reference historical-hazard map in (g) the hazard map obtained with the lookup method and (h) the hazard map obtained using the runoff-correction method (future) and (i) the historical RP of river water level corresponding to the 100-year RP in the future. Black boxes in panels (g) and (h) indicate the location of the GRDC Itapeua station (63.0278∘ W, 4.0578∘ S).
The results for a future climate were assessed: as the historical climate was not corrected as expected, the future climate might have followed the same trend and failed to meet expectations. For both the Chi-Mun and Amazon rivers, using the GCM without bias correction, the shift from the historical (Figs. 3c and 4c) to future climate (Figs. 3f and 4f) showed that flood hazard would increase in the future. For the Chi-Mun River, as shown in Fig. 3g and h, the future-hazard maps constructed using the runoff-correction method and the lookup method showed increases in the inundation areas and depths compared to the reference historical-hazard map (Fig. 3a). In contrast, for the Amazon River, Fig. 4h shows that the inundation depths on the hazard map obtained using the runoff-correction method were less than the depths on the reference historical-hazard map, implying that the runoff-correction method may be unable to account for the increased hazard of future flooding predicted by the GCM. On the other hand, Fig. 4g shows that inundation depths on the hazard map based on the lookup method were greater than those on the reference historical-hazard map, suggesting that the lookup method was able to produce hazard maps that were consistent with the changes in flood hazard under a future climate projected by CaMa-Flood simulations with GCM runoff input. In the subsequent sections, we explore why bias correction was less effective than expected for the Amazon River.
We investigated the reasons for the differences between the reference historical-hazard map and the historical-hazard map constructed using the runoff-correction method. Figures 5 and 6 show the monthly mean discharge climatology, exceedance probability curve and Gumbel distributions for the annual maximum river water levels based on CaMa-Flood simulation results using each runoff type as input values. For reference, we show the cumulative distribution function for annual maximum river water levels based on the lookup method in Fig. 5c and d and Fig. 6c and d. The comparison sites were Global Runoff Data Centre (GRDC) observation sites, specifically the Ubon station (104.8617∘ E, 15.2217∘ N) in the Mekong River basin and the Itapeua station (63.0278∘ W, 4.0578∘ S) in the Amazon River basin. The climatology of the monthly average GCM runoff for each grid was corrected toward the climatology of the reanalysis dataset. Therefore, monthly average discharge data were expected to be similar to the reanalysis data. In addition, the annual maximum river water levels were corrected, which was necessary for application of extreme-value analysis of the annual maximum river water levels when constructing the hazard maps. For these reasons, we drew an exceedance probability curve and the Gumbel distribution for the annual maximum river water levels and checked whether the values were corrected to the same scale as the reanalysis data (Fig. 5b). Prior to analysis of the Amazon River, where bias correction did not perform as expected, the Chi-Mun River was assessed. As shown in Fig. 5a–d, the uncorrected GCM (historical data; green dotted line) showed different behavior from the reanalysis data (black line), but the bias-corrected GCM (green line) data were similar to the reanalysis data, as expected.
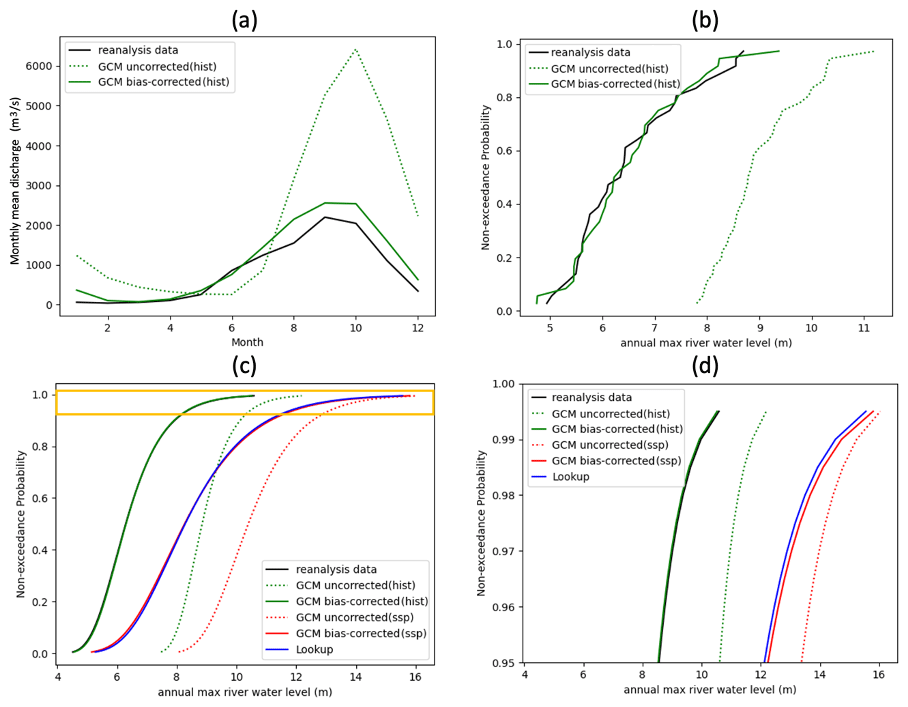
Figure 5Comparison of reanalysis data, uncorrected GCM, bias-corrected GCM, and the lookup method at the GRDC Ubon station (104.8617∘ E, 15.2217∘ N). (a) Climatology of monthly mean discharge, (b) exceedance probability curve of the annual maximum river water levels from 1980 to 2014, (c) Gumbel distribution of annual maximum river water levels, and (d) enlarged view of the orange square in panel (c).
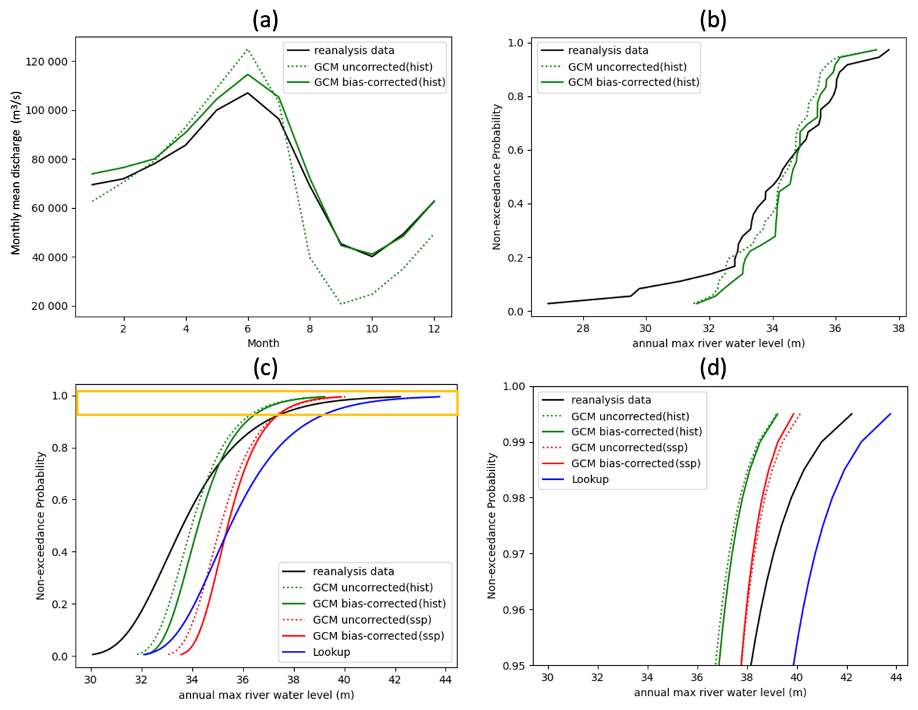
Figure 6Comparison of reanalysis data, uncorrected GCM, bias-corrected GCM, and the lookup method at the GRDC Itapeua station (63.0278∘ W, 4.0578∘ S). (a) Climatology of monthly mean discharge, (b) exceedance probability curve of annual maximum river water levels from 1980 to 2014, (c) Gumbel distribution of annual maximum river water levels, and (d) enlarged view of the orange square in panel (c).
Following analysis of the Chi-Mun River, a similar comparison was conducted for the Amazon River. Figure 6a shows that the climatology of monthly mean discharge of the bias-corrected GCM (historical) was similar to the reanalysis data, which was also as expected. On the other hand, the exceedance probability curve and Gumbel distribution of the annual maximum river water levels (Fig. 6b–d) changed little with bias correction. The tail portion of the bias-corrected GCM (historical) was undervalued compared to the reanalysis data, implying that bias correction did not function as expected for extreme values associated with the hazard map, even under the historical climate. The runoff-correction method was corrected for bias in GCM runoff data using a monthly climatology based on reanalysis runoff values. However, as demonstrated by the Gumbel distributions in Fig. 6c, the bias of the GCM differed with the return period, indicating that the bias of extreme values was not the same as that of the mean value. If the bias differs sharply among return periods, the runoff-correction method may not perform as expected for extreme values. The tail portion of the bias-corrected GCM (future) was also smaller than the tail for reanalysis data (Fig. 6d), indicating that the directions of the change in the future hazard obtained using the runoff-correction method relative to the reference reanalysis-based hazard map were inconsistent with the change projected by CaMa-Flood simulations with GCM runoff input. On the other hand, as shown in Fig. 6c and d, the lookup method accounted for changes in flood hazard under the future climate projected by CaMa-Flood simulations with GCM runoff input. As described in Sect. 2.3.2, the lookup method uses the relative change in RPs among GCMs and can modify extreme values accordingly.
We recognized that bias correction of runoff using a monthly climatology based on reanalysis runoff data produced large differences in the hazard map compared to the map based on reanalysis runoff. These differences arose because the bias of extreme values differed from that of the mean value, suggesting that this bias-correction procedure may not be suitable for extreme values on the hazard map. For extreme values of GCM runoff and river water levels, the results were not reliable even after bias correction, and such values may not be suitable for constructing hazard maps.
3.2 Analysis of hazard maps generated with multiple GCM runoff datasets
In this section, we compare the inundation areas of future-hazard maps constructed using two methods with nine GCMs of CMIP6. The target area was the Chao Phraya River basin and surrounding rivers (98 to 103∘ E, 12 to 18∘ N). As shown in Fig. 2, the change direction from the reference historical-hazard map was the same for both methods in the Chao Phraya River basin and surrounding rivers when IPSL-CM6A-LR was used. In this section, we used other GCM models to test whether the two methods could produce hazard maps consistent with the future changes in flood hazards predicted using the uncorrected GCM. Here, we compare the inundation areas of the 100-year RP hazard map among nine CMIP6 GCMs (Fig. 7).
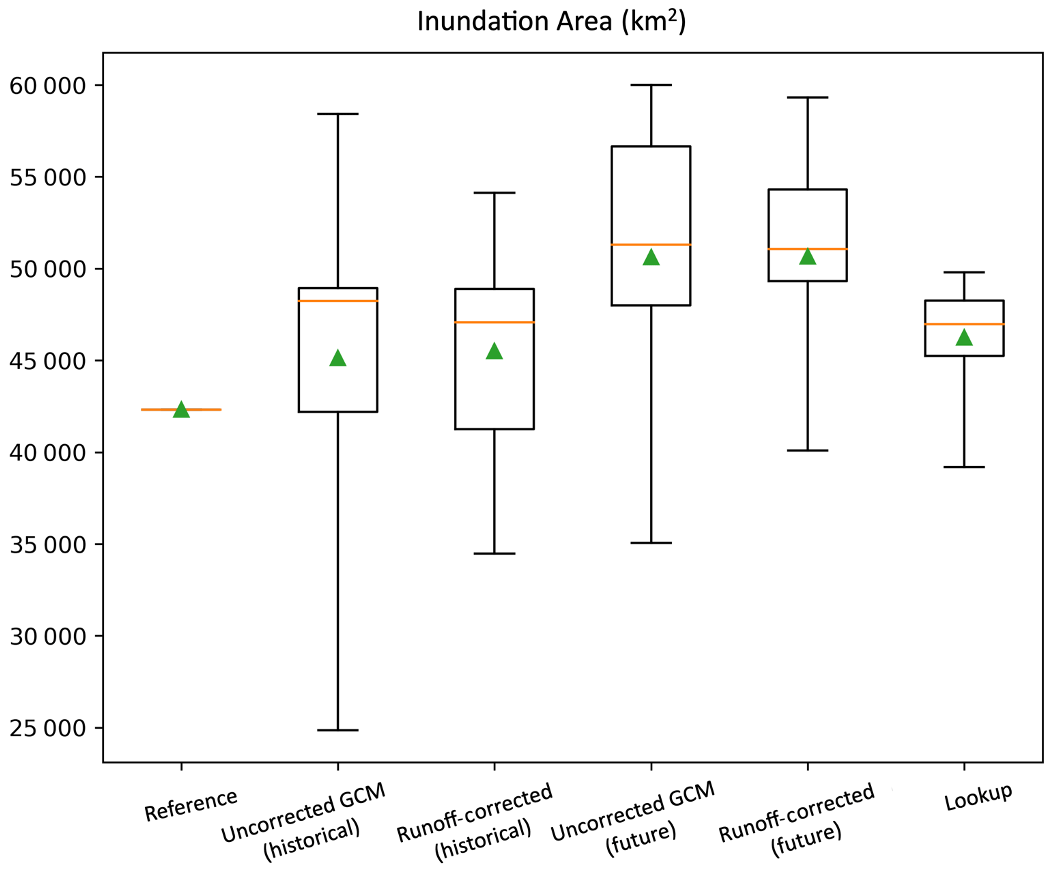
Figure 7Box plot of inundated-area (km2) estimates near the Chao Phraya River obtained using the runoff-correction method and lookup method. Whiskers show minimum and maximum values, boxes show 25th and 75th percentile values, orange lines show the median (50th percentile) value, and green triangles show the average value.
First, we examined whether the runoff-correction method for the historical period provided results similar to the reference reanalysis-based historical-hazard map. The multimodel average inundated area for the nine models shown in Fig. 7 indicates that the inundated area for the historical period was corrected from 45 124 to 45 508 km2 using the runoff-correction method and thus remained almost unchanged. Comparing the effects of bias correction for each model (Table S1 and Fig. S1), we observed that MPI-ESM1-2 became closer to the reference historical-hazard map than the uncorrected GCM when the runoff-correction method was used, while MIROC6 and GFDL-CM were corrected away from the reference values. These results suggest that the inundation areas under the historical climate were not corrected as expected by the runoff-correction method for most GCMs. One reason for this finding is that, as noted above for the Amazon River (Fig. 6), the bias-correction process did not properly correct for the Gumbel distribution of river water levels because the bias of the extreme values was not the same as that of the mean values, and therefore bias correction did not address the extreme values on the hazard map. As shown in Fig. 7 and Table S1, for the Chao Phraya River basin and surrounding rivers, the effect of bias correction was also small under the future climate in many models (using the runoff-correction method, the inundated areas for nine GCMs were corrected from 35 054–60 000 to 40 085–59 320 km2). For example, as shown in Table S1, when using MPI-ESM1-2-HR, despite the increase in inundation area from the historical to future periods for the uncorrected GCM, the inundation area of 40 085 km2 obtained with the runoff-correction method was smaller than the corresponding area on the reference historical-hazard map (42 321 km2), suggesting that bias correction did not improve the GCM hazard map as expected.
The results of the lookup method were also examined. The lookup method is relatively unaffected by bias in the GCM, as the rate of change from the historical period to the future period is the key factor. If an inundated area increases from the historical climate to the future climate based on the uncorrected GCM, the inundated area should be larger on a hazard map produced using the lookup method than on the reference historical-hazard map. Table S1 shows that the inundation areas obtained using the lookup method were consistent with the historical and future inundation changes in the uncorrected GCM. For example, using INM-CM5, the inundation area decreased between the historical and future periods based on the uncorrected GCM, indicating a decrease in future flood hazard. As shown in Table S1 and Fig. S2, the inundation area was smaller for INM-CM5 using the lookup method than on the reference historical-hazard map, indicating that the changes in future flood hazard predicted by the GCMs were properly considered.
The results from multiple GCMs implied the following points of discussion. For most of the nine GCM models, the runoff-correction method did not correct the 100-year RP inundation areas under the historical climate as expected, and some GCMs were corrected away from the reanalysis data. Therefore, GCM-specific biases are unlikely to have been corrected on these hazard maps for the future climate. For example, the results from MPI-ESM1-2-HR suggested that the runoff-correction method may not account for future flood hazards projected by CaMa-Flood simulations with GCM runoff input in terms of the change direction from the reference historical-hazard map. On the other hand, the lookup method did produce hazard maps consistent with the changes in flood hazard under the future climate projected by CaMa-Flood simulations with GCM runoff input. Regarding the uncertainties in future flood-hazard predictions, the divergence of the runoff-correction method includes the divergence of multiple GCMs in the future as well as the divergence associated with the bias of extreme values relative to that of the mean value in each model. The latter divergence reflects the model structure, specifically the systematic bias within each model. The lookup method removes this bias, and therefore it is expected to have smaller uncertainties than the runoff-correction method.
4.1 Which method is more reasonable for generating future-hazard maps?
In this study, we compared the runoff-correction and lookup methods and investigated the causes of differences in hazard maps constructed using the two methods. Based on the results, we suggest using the lookup method with reanalysis data as a reference for the following three reasons.
First, using a hazard map based on reanalysis runoff data as a reference is reasonable. Reanalysis runoff values are based on historical weather observations, and thus a hazard map created using reanalysis runoff is expected to show good consistency with actual flood hazard. The performance of global river model simulations using reanalysis runoff values has been evaluated through comparison with observed data (e.g., time series of discharge, water level, and inundation extent; Yamazaki et al., 2011, 2014). Hazard maps generated through global river model simulations with reanalysis runoff have been validated in numerous studies. Bernhofen et al. (2018) validated several global flood models, including CaMa-Flood, which was used in this study. The accuracy of hazard maps produced using global flood models has been validated through comparisons with existing flood-hazard maps (e.g., CaMa-Flood results in Japan were validated by Kita et al., 2022, and GloFAS model results were validated in Europe and the Mediterranean by Dottori et al., 2022).
Second, the lookup method can produce hazard maps that are consistent with projected changes in future flood hazard based on CaMa-Flood simulations with GCM runoff input, as demonstrated by the results of this study and discussed in Sect. 3. On the other hand, the direction of the change in future hazards (increase or decrease) obtained using the runoff-correction method relative to the reference reanalysis-based hazard map may be inconsistent with the changes projected by CaMa-Flood simulations using GCM runoff input, as described for the Amazon River in Sect. 3. This result suggests that simple bias-correction techniques of GCM data, i.e., additive correction to monthly mean runoff, may not be suitable for use in flood-hazard estimation and that various other bias-correction techniques that focus on extreme values should be tested. The lookup method also facilitates research on the efficient construction of future-climate hazard maps because historical-hazard maps can be prepared separately from the estimation of future frequency change. This is beneficial for two aspects: (1) it allows for improvement of the reanalysis hazard map by upgrading the model, and (2) it allows for use of multiple reference hazard maps by using different reanalysis-based simulations.
Third, the use of GCM historical climate simulations as reference data introduces problems. As noted in Sect. 3.2, for most of the nine GCM models, the runoff-correction method did not correct the 100-year RP inundation area as expected based on the historical climate, and some GCMs were corrected away from the reanalysis data, indicating that the accuracy of bias-corrected GCM historical climate data is poor.
For these reasons, we consider the lookup method with reanalysis data as reference data to be the most reasonable method of creating future-hazard maps for flood-risk assessment.
4.2 Validity of reverse-slope revision
As noted in Sect. 2.2, we revised the reverse slope during the process of hazard map generation in this study. For actual physical processes, if slope reversal occurs, the backwater effect causes the downstream water level to propagate upstream (backflow), which increases the flood hazard. A reverse slope is a technical problem in extreme-value analysis. In the process of calculating the water levels for the targeted return period, we fitted a Gumbel distribution on each CaMa-Flood 6 arcmin grid, allowing the upstream water surface elevation to be lower than the downstream elevation, resulting in an unrealistic reverse water slope. If such a reverse slope is not revised and the backwater effect is not considered, the inundation-depth distribution may not be physically reasonable and flood hazard may be underestimated.
Therefore, we analyzed the effect of revising the reverse slope and present our findings in this section (reverse-slope revision is referred to as Backwater_Modification in this section). Prior to analysis of the Backwater_Modification effect, the occurrence of slope reversal was checked using the water surface elevation distributions from the reanalysis data (without Backwater_Modification) and the lookup method (without Backwater_Modification). The water surface elevation distribution obtained through application of extreme-value analysis to each grid's water level showed that many reverse slopes occurred, although the majority were small (with 6 arcmin global resolution, 30 000 grids for the reanalysis data and 37 000 grids for the lookup method). Reverse-slope grids occurred frequently at confluences, where the backwater effect can occur, and thus reverse-slope revision is physically reasonable.
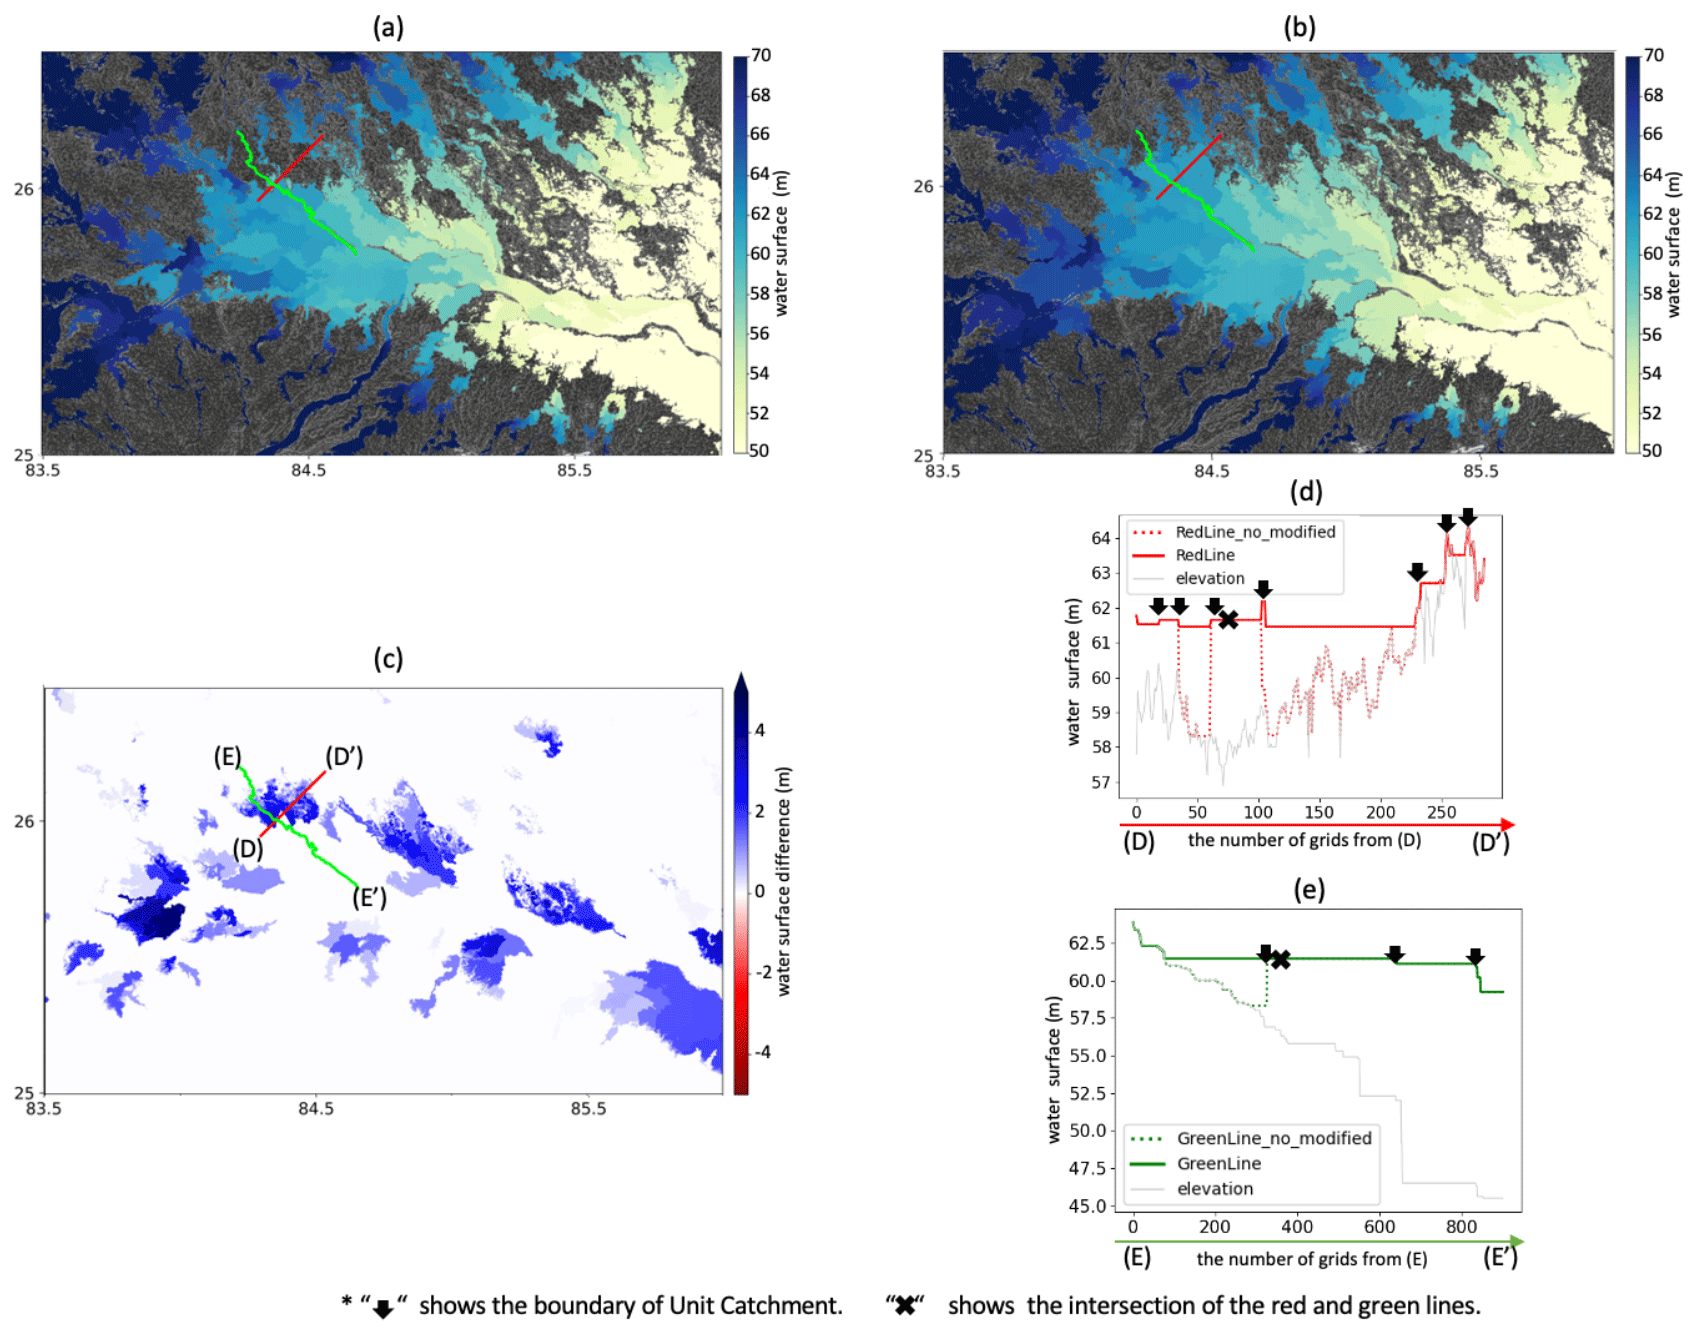
Figure 8(a) Water surface distribution obtained using the lookup method without Backwater_Modification. (b) Water surface distribution obtained using the lookup method with Backwater_Modification. (c) Difference in water surface level between panels (a) and (b). (d) Water surface profiles along the red transects (river cross section). (e) Water surface profiles along the green transects (section along the flow direction from upstream to downstream).
We applied Backwater_Modification to the water surface elevation and assessed the impact of this modification. The area of 83.5 to 86∘ E and 25 to 26.5∘ N, where many reverse slopes are shown in Fig. S3b, was the target area for this process. The water surface distribution was created by adding elevation to the 100-year RP inundation-depth distribution. As shown in Fig. 8a and b, the reverse slope was eliminated by Backwater_Modification. In addition to checking the water surface distribution, we drew the water surface on a cross section of the river and a section from upstream to downstream (red and green lines in Fig. 8) to check whether the water surface was smoothly revised. Figure 8d shows that the water surface in the cross section of the river tended to change significantly at the boundary of the unit catchment without Backwater_Modification; however, with Backwater_Modification, the water surface distribution was smooth. In addition, as shown in Fig. 8e, for the water surface section from upstream to downstream, the reverse-slope condition was resolved, leading to a water surface distribution that was physically reasonable.
Please note that it is possible that the water surface would be overestimated by applying Backwater_Modification because it performs corrections at all reverse-slope occurrence points. Reversed water surface slopes can occur in conventional flood-hazard maps, given that these maps are not always constructed by a single flood simulation. Therefore, we conducted additional validation to investigate whether Backwater_Modification should be applied. As shown in Sect. S1, additional validation of Backwater_Modification was conducted. Specifically, we compared the CaMa-Flood hazard maps obtained using Backwater_Modification with hazard maps published in Japan containing information about inundation depths. The comparison results (Table S2 and Fig. S4) showed that the inundation area was more realistic with Backwater_Modification than without it. As noted above, if a reverse slope is present in the water surface level, revision using the method proposed in this study (Backwater_Modification) would be appropriate.
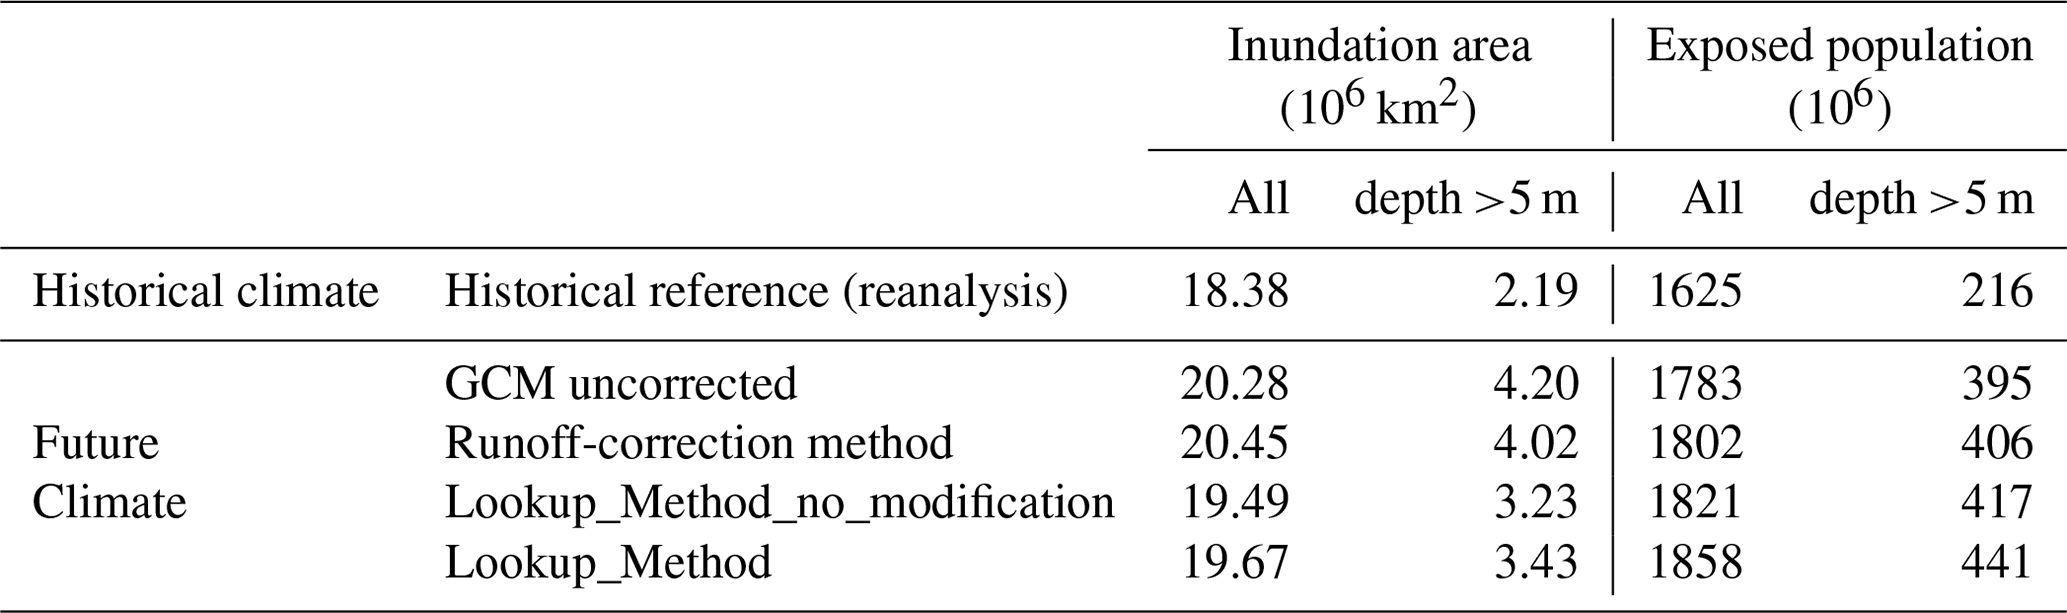
Table 2Inundation area of the 100-year RP hazard maps and affected population from the 100-year RP hazard maps constructed using various methods; “_no_modification” indicates a map constructed without Backwater_Modification. These results were obtained using IPSL-CM6A-LR.
4.3 Future changes in inundation area and the population affected within the inundation area
We analyzed the extent of differences in the estimates of future flood-risk changes, specifically inundation area and the affected population within the inundation area depending on the implementation of bias correction or Backwater_Modification and the method used to construct the hazard map. The flood-exposed population was estimated based on the inundation map and the 2020 population-density map (Gridded Population of the World; CIESIN, 2018). This map has 30 arcsec resolution, and therefore the 3 arcsec inundation map was aggregated to 30 arcsec resolution. Here, as in Sect. 3, we present the results from the 100-year RP hazard map of IPSL-CM6A-LR, which is one of the nine CMIP6 GCM models. Based on the inundation area in Table 2, we found that the 100-year RP inundation area was 18.4×10⁶ km2 based on reanalysis runoff and 20.3×10⁶ km2 based on uncorrected GCM runoff (future), indicating an increase of approximately 10 % compared to the historical climate. On the other hand, the 100-year RP inundation area reached 20.5×10⁶ km2 using the runoff-correction method (relative to historical climate: +11 %) and 19.7×10⁶ km2 using the lookup method (relative to historical climate: +7 %); thus, the difference in future flood-risk estimates was up to 4 %, depending on whether bias correction was applied and on the construction method. Inundation areas with a particularly high risk of inundation depths of 5 m or greater covered 2.2 km2 in the historical reference period and ranged from 3.4 to 4.2 km2 under the future climate (relative to historical climate: +57 %–92 %) for various methods, indicating a difference in future flood-risk estimates of up to 35 %, especially in high-risk areas.
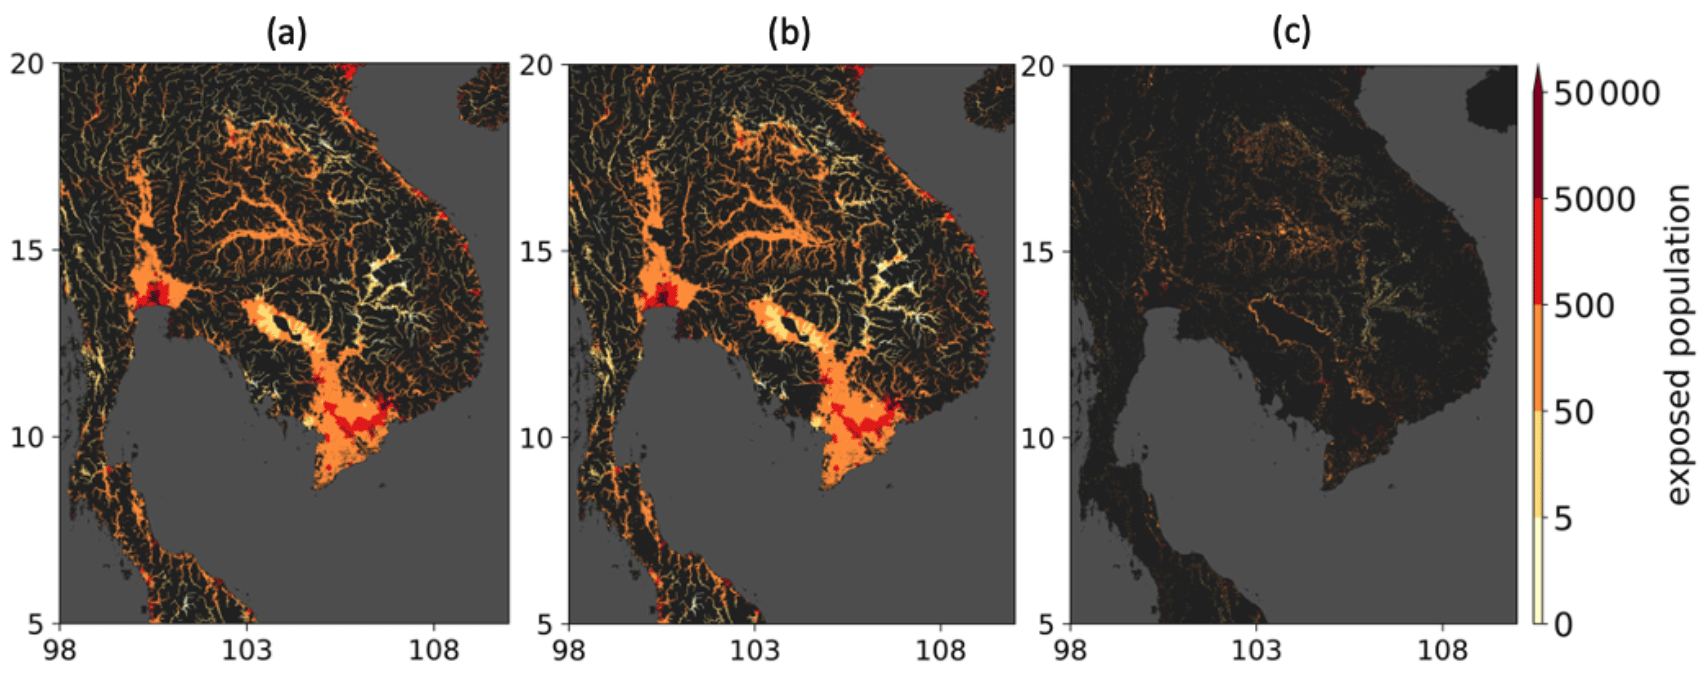
Figure 9Affected population in the Chao Phraya River and Mekong River areas based on the 100-year RP hazard map (obtained using IPSL-CM6A-LR). (a) Reference historical-hazard map. (b) Future-hazard map constructed using the lookup method. (c) Difference of (b, a), representing the population not currently affected by flooding that may be affected under the future climate.
To evaluate the sensitivity of the inundation area and the affected population with and without Backwater_Modification, we examined the effects of Backwater_Modification. As shown in Table 2, it increased the inundation area from 19.49 to 19.67×10⁶ km2 for the lookup method, an increase of about 0.18×10⁶ km2. Focusing on high-risk areas, the inundation area based on the lookup method increased from 3.23 to 3.43×10⁶ km2 with Backwater_Modification, an increase of approximately 0.20×10⁶ km2 in high-risk areas. Based on these results, applying Backwater_Modification led to the creation of a physically reasonable hazard map as shown in Sect. 4.2 and corrected high-risk areas. We conclude that Backwater_Modification is a necessary revision.
As discussed by Zhou et al. (2021), the spatial resolution of a flood-hazard map is a particularly important determinant of its value for impact assessment. Smith et al. (2019) evaluated the population exposure to a 1-in-100-year flood in 18 developing countries and found that decreasing the spatial resolution of the flood-hazard map from 90 to 900 m increased the exposure by 51 %–94 % for different population products. Although there is uncertainty involved in the choice of the spatial resolution of the flood-hazard map, we selected 30 arcsec resolution instead of 3 arcsec resolution to compare future flood-hazard map construction methods on a global scale since 30 arcsec was computationally convenient.
An alternative method for risk assessment under a future climate in areas where future-hazard maps have not been created is the use of hazard maps for historical climates to estimate future damage. We considered a method of future risk assessment that does not use future-hazard maps, i.e., the use of hazard maps created for historical climates and calculation of the exposed population based solely on future frequency changes. As shown in Table 2, the areas inundated by a 100-year RP flood in the future climate will differ from those inundated under the historical climate. Therefore, properly assessing flood risk under a future climate is not possible if the hazard map is fixed and only changes in frequency are considered. Table 2 indicates the total population living in the inundation areas modeled for the reference historical-hazard map to be around 1.63 billion. Using the fixed-hazard map method, the affected population in the future climate would also be 1.63 billion. However, population estimates of 1.80 billion with the runoff-correction method and 1.86 billion with the lookup method were obtained in this study, implying that an affected population of around 0.2 billion may be overlooked if the hazard map is fixed and only changes in frequency are considered. As a specific example, we identified the affected population in the Chao Phraya River and Mekong River areas, and Fig. 9 shows the affected population in that area based on the 100-year RP hazard map. In that area, the total affected population based on the reference historical-hazard map is 75 million and the population obtained for the future-hazard map using the lookup method is 82 million, indicating underestimation by approximately 7 million if the hazard map is fixed and only frequency change is considered (Fig. 9c).
We explored several methods for constructing hazard maps under a future climate, including bias correction, and investigated which of these methods could produce a reasonable inundation-depth distribution. The results suggest that bias correction of runoff using monthly climatological data based on reanalysis runoff values produced a significant difference in the hazard map compared to the map based directly on reanalysis runoff values, as the bias of extreme values was not the same as that of the mean value. In addition, we found that the direction of the change in future hazard (increase or decrease) obtained using the runoff-correction method relative to the reference reanalysis-based hazard map may be inconsistent with the changes projected by CaMa-Flood simulations with GCM runoff input. This result suggests that simple bias correction of GCM data using the additive correction method to correct monthly mean runoff may be unsuitable for flood-hazard estimation and that alternative bias-correction techniques should be tested (i.e., more focused on extreme values). On the other hand, we confirmed that the lookup method, which uses the statistical frequency of flooding calculated by the GCMs and the reanalysis data for inundation depths corresponding to that frequency, produced hazard maps that were consistent with the flood-hazard changes projected by CaMa-Flood simulations with GCM runoff input, indicating the possibility of obtaining a reasonable inundation-area distribution. Thus, combining accurate historical-hazard maps with information on future flood-frequency changes may be optimal in general for generating future-hazard maps. Please note that the historical flood-hazard maps are not required to apply reanalysis-based simulations using a global flood model; the proposed method is also applicable to a gauge-based or machine-learning-based historical-hazard map.
In addition, we discussed which method is more reasonable for generating future-hazard maps in terms of ease of use. It is reasonable to use a hazard map based on reanalysis runoff data as a reference. Reanalysis runoff values are based on historical weather observations; therefore, a hazard map created using reanalysis runoff data is expected to show good consistency with an actual flood-hazard distribution. Regarding the uncertainties in future trends, as described in Sect. 3.2, the lookup method removed the systematic bias in the distribution of annual maximum water levels within each model and therefore is expected to have smaller uncertainties than the runoff-correction method. The lookup method also has the advantage of facilitating efficient construction of future-climate hazard maps, as it allows for separate consideration of reanalysis hazard map improvement through upgrading of the model and estimation of changes associated with climate change. Our results indicate that hazard maps could be made more realistic by applying the proposed method to revise water-slope reversal. Based on these findings, we suggest the use of the lookup method with reanalysis data as a reference.
In addition, this study examined the extent to which estimates of future flood-risk changes differed depending on whether bias correction was implemented and on the method used for future-hazard mapping. Our assessment of inundation areas and the future population affected by flooding showed that the variation in future-flood high-risk-area estimates due to bias correction and the method of model construction was up to 35 %. Using the lookup method, the total population living in the modeled inundation areas where the flood magnitude exceeded the 100-year RP under a future climate was estimated to be around 1.86 billion. In addition, our risk assessment under a future climate showed an underestimation of around 0.2 billion for the affected population when the historical-hazard map was used as an alternative to future-hazard maps, and only the change in frequency was considered. These results suggest that global flood-risk studies require future-hazard maps, i.e., inundation-depth distributions at high resolution, for proper estimation of climate-change risk, and that discussing only changes in the frequency of a given flood intensity is insufficient.
The global hydrodynamic model CaMa-Flood (v4.01) is available from https://doi.org/10.5281/zenodo.4659583 (Yamazaki et al., 2021).
The MERIT Hydro topography data are available from http://hydro.iis.u-tokyo.ac.jp/~yamadai/MERIT_Hydro/ (Yamazaki, 2023). VIC-Bias-Corrected runoff is available from https://www.reachhydro.org/home/records/grfr (Reachhydro.org, 2023). The CMIP6 data are available from the Earth System Grid Federation (ESGF) data platform (https://esgf-node.llnl.gov/search/cmip6/, Earth System Grid Foundation, 2023).
The supplement related to this article is available online at: https://doi.org/10.5194/hess-27-1627-2023-supplement.
YKim, YH and DY conceived the study and contributed to the development and design of the methodology. YKim performed simulation and analysis. XZ developed a code for extreme-value analysis. YKim and DY prepared the manuscript with review from YH, XZ and YKit.
The contact author has declared that none of the authors has any competing interests.
Publisher’s note: Copernicus Publications remains neutral with regard to jurisdictional claims in published maps and institutional affiliations.
This research is the outcome of the LaRC-Flood project under the collaboration among The University of Tokyo, Shibaura Institute of Technology, and MS&AD Insurance Group. The authors would like to thank Jeff Neal and Francesco Dottori for their constructive review comments to improve the manuscript.
This research has been supported by NEDO (grant no. JP21500379).
This paper was edited by Albrecht Weerts and reviewed by Jeffrey Neal and Francesco Dottori.
Alfieri, L., Bisselink, B., Dottori, F., Naumann, G., de Roo, A., Salamon, P., Wyser K, and Feyen, L.: Global projections of river flood risk in a warmer world, Earth's Future, 5, 171–182. https://doi.org/10.1002/2016EF000485, 2017.
Aqueduct Floods Hazard Maps: https://www.wri.org/aqueduct/data, last access: 25 October 2022.
Bates, P. D., Savage, J., Wing, O., Quinn, N., Sampson, C., Neal, J., and Smith, A.: A climate-conditioned catastrophe risk model for UK flooding, Nat. Hazards Earth Syst. Sci., 23, 891–908, https://doi.org/10.5194/nhess-23-891-2023, 2023.
Beck, H. E., De Roo, A., and van Dijk, A. I.: Global maps of streamflow characteristics based on observations from several thousand catchments, J. Hydrometeorol., 16, 1478–1501, https://doi.org/10.1175/JHM-D-14-0155.1, 2015.
Bernhofen, M. V., Whyman, C., Trigg, M. A., Sleigh, P. A., Smith, A. M., Sampson, C. C., Yamazaki, D., Ward, J. P., and Winsemius, H. C.: A first collective validation of global fluvial flood models for major floods in Nigeria and Mozambique, Environ. Res. Lett., 13, 104007, https://doi.org/10.1088/1748-9326/aae014, 2018.
Center for International Earth Science Information Network (CIESIN), Columbia University: Documentation for the Gridded Population of the World, Version 4 (GPWv4), Revision 11 Data Sets, NASA Socioeconomic Data and Applications Center (SEDAC) [data set], Palisades, NY, https://doi.org/10.7927/H45Q4T5F, 2018.
Dankers, R. and Feyen, L.: Climate change impact on flood hazard in Europe: An assessment based on high-resolution climate simulations, J. Geophys. Res.-Atmos., 113, D19105, https://doi.org/10.1029/2007JD009719, 2008.
de Moel, H., van Alphen, J., and Aerts, J. C. J. H.: Flood maps in Europe – methods, availability and use, Nat. Hazards Earth Syst. Sci., 9, 289–301, https://doi.org/10.5194/nhess-9-289-2009, 2009.
Dottori, F., Szewczyk, W., Ciscar, J. C., Zhao, F., Alfieri, L., Hirabayashi, Y., Bianchi, A., Mongelli, I., Frieler, K., Betts, R. A., and Feyen, L.: Increased human and economic losses from river flooding with anthropogenic warming, Nat. Clim. Change, 8, 781–786, https://doi.org/10.1038/s41558-018-0257-z, 2018.
Dottori, F., Alfieri, L., Bianchi, A., Skoien, J., and Salamon, P.: A new dataset of river flood hazard maps for Europe and the Mediterranean Basin, Earth Syst. Sci. Data, 14, 1549–1569, https://doi.org/10.5194/essd-14-1549-2022, 2022.
Earth System Grid Federation: CMIP6 Data Search, https://esgf-node.llnl.gov/search/cmip6/, last access: 14 April 2023.
Eyring, V., Bony, S., Meehl, G. A., Senior, C. A., Stevens, B., Stouffer, R. J., and Taylor, K. E.: Overview of the Coupled Model Intercomparison Project Phase 6 (CMIP6) experimental design and organization, Geosci. Model Dev., 9, 1937–1958, https://doi.org/10.5194/gmd-9-1937-2016, 2016.
Federal Emergency Management Agency (FEMA): Flood Maps and Zones Explained, https://www.fema.gov/blog/fema-flood-maps-and-zones-explained (last access: 16 October 2022), 2018 (last updated 17 March 2021).
Global Assessment Report 2015 (GAR 2015): Global Risk Data Platform, https://preview.grid.unep.ch/ (last access 16 October 2022), 2015.
Hempel, S., Frieler, K., Warszawski, L., Schewe, J., and Piontek, F.: A trend-preserving bias correction – the ISI-MIP approach, Earth Syst. Dynam., 4, 219–236, https://doi.org/10.5194/esd-4-219-2013, 2013.
Hirabayashi, Y., Mahendran, R., Koirala, S., Konoshima, L., Yamazaki, D., Watanabe, S., Kim, H., and Kanae, S.: Global flood risk under climate change, Nat. Clim. Change, 3, 816–821, https://doi.org/10.1038/NCLIMATE19, 2013.
Hirabayashi, Y., Tanoue, M., Sasaki, O., Zhou, X., and Yamazaki, D.: Global exposure to flooding from the new CMIP6 climate model projections, Sci. Rep., 11, 1–7, https://doi.org/10.1038/s41598-021-83279-w, 2021.
Hirabayashi, Y., Yamada, K., Yamazaki, D., Ishikawa, Y., Arai, M., Inuzuka, T., Hisamatsu, R., and Ogawada, D.: Comparative Evaluation of Global Flood Hazard Maps and Recommendations for Corporate Practice, Journal of Japan Society of Hydrology and Water Resources, 35, 175–191, https://doi.org/10.3178/jjshwr.35.175, 2022.
Hosking, J. R. M.: L-Moments, in: Wiley StatsRef: Statistics Reference Online, John Wiley and Sons, Ltd., Hoboken, USA, 1–8, https://doi.org/10.1002/9781118445112.stat00570.pub2, 2015.
Huang, S., Krysanova, V., and Hattermann, F. F.: Does bias correction increase reliability of flood projections under climate change? A case study of large rivers in Germany, Int. J. Climatol., 34, 3780–3800, https://doi.org/10.1002/joc.3945, 2014.
Japan Institute of Country-ology and Engineering 39th report, https://www.jice.or.jp/tech/reports/detail/16/43 (last access: 16 October 2022), 2021.
Joint Research Centre (JRC): River Flood Hazard Maps at European and Global Scale, https://data.jrc.ec.europa.eu/collection/id-0054, last access: 16 October 2022.
Kita, Y. and Yamazaki, D.: Verification of the Usability of Global River Inundation Model Output for Hazard Maps in Japan, Journal of Japan Society of Hydrology and Water Resources, 35, 267–278, https://doi.org/10.3178/jjshwr.35.1743, 2022.
LaFond, K. M., Griffis, V. W., and Spellman, P.: Forcing hydrologic models with GCM output: Bias correction vs. the “delta change” method, American Society of Civil Engineers, https://doi.org/10.1061/9780784413548.214, 2014
Li, C., Zwiers, F., Zhang, X., Li, G., Sun, Y., and Wehner, M.: Changes in annual extremes of daily temperature and precipitation in CMIP6 models, J. Climate, 34, 3441–3460, https://doi.org/10.1175/JCLI-D-19-1013.1, 2021.
Liang, X., Lettenmaier, D. P., Wood, E. F., and Burges, S. J.: A simple hydrologically based model of land surface water and energy fluxes for general circulation models, J. Geophys. Res.-Atmos., 99, 14415–14428, https://doi.org/10.1029/94JD00483, 1994.
Liang, X., Wood, E. F., and Lettenmaier, D. P.: Surface soil moisture parameterization of the VIC-2L model: Evaluation and modification, Global Planet. Change, 13, 195–206, https://doi.org/10.1016/0921-8181(95)00046-1, 1996.
Lu, J., Carbone, G. J., and Crego, J. M.: Uncertainty and hotspots in 21st century projections of agricultural drought from CMIP5 models, Sci. Rep., 9, 4922, https://doi.org/10.1038/s41598-019-41196-z, 2019.
Panofsky, H. A. and Brier, G. W.: Some applications of statistics to meteorology, The Pennsylvania State University Press, 224 pp., 1968.
Reachhydro.org: Global Reach-level Flood Reanalysis, https://www.reachhydro.org/home/records/grfr, last access: 14 April 2023.
Sampson, C. C., Smith, A. M., Bates, P. D., Neal, J. C., Alfieri, L., and Freer, J. E.: A high-resolution global flood hazard model, Water Resour. Res., 51, 7358–7381, https://doi.org/10.1002/2015WR016954, 2015.
Seneviratne, S. I., Zhang, X., Adnan, M., Badi, W., Dereczynski, C., Di Luca, A., Ghosh, S., Iskandar, I., Kossin, J., Lewis, S., Otto, F., Pinto, I., Satoh, M., Vicente-Serrano, S. M., Wehner, M., and Zhou, B.: Weather and Climate Extreme Events in a Changing Climate, in: Climate Change 2021: The Physical Science Basis. Contribution of Working Group I to the Sixth Assessment Report of the Intergovernmental Panel on Climate Change, edited by: MassonDelmotte, V., Zhai, P., Pirani, A., Connors, S. L., Péan, C., Berger, S., Caud, N., Chen, Y., Goldfarb, L., Gomis, M. I., Huang, M., Leitzell, K., Lonnoy, E., Matthews, J. B. R., Maycock, T. K., Waterfield, T., Yelekçi, O., Yu, R., and Zhou, B., Cambridge University Press, Cambridge, United Kingdom and New York, NY, USA, 1513–1766, https://www.ipcc.ch/report/ar6/wg1/chapter/chapter-11/ (last access: 14 April 2023), 2021.
Smith, A., Bates, P. D., Wing, O., Sampson, C., Quinn, N., and Neal, J.: New estimates of flood exposure in developing countries using high-resolution population data, Nat. Commun., 10, 1–7, https://doi.org/10.1038/s41467-019-09282-y, 2019.
Taguchi, R., Tanoue, M., Yamazaki, D., and Hirabayashi, Y.: Global-Scale Assessment of Economic Losses Caused by Flood-Related Business Interruption, Water, 14, 967, https://doi.org/10.3390/w14060967, 2022.
Trigg, M. A., Birch, C. E., Neal, J. C., Bates, P. D., Smith, A., Sampson, C. C., Yamazaki, D., Hirabayashi, Y., Pappenberger, F., Dutra, E., Ward, P. J., Winsemius, H. C., Salamon, P., Dottori, F., Rudari, R., Kappes, M. S., Simpson, A. L., Hadzilacos, G., and Fewtrell, T. J.: The credibility challenge for global fluvial flood risk analysis, Environ. Res. Lett., 11, 094014, https://doi.org/10.1088/1748-9326/11/9/094014, 2016.
United Nations Office for Disaster Risk Reduction (UNISDR): Sendai Framework for Disaster Risk Reduction 2015–2030, United Nations, http://www.unisdr.org/files/43291_sendaiframeworkfordrren.pdf (last access: 17 October 2022), 2015.
Watanabe, S., Kanae, S., Seto, S., Yeh, P. J. F., Hirabayashi, Y., and Oki, T.: Intercomparison of bias-correction methods for monthly temperature and precipitation simulated by multiple climate models, J. Geophys. Res.-Atmos., 117, D23114, https://doi.org/10.1029/2012JD018192, 2012.
Watanabe, S.: Bias correction of climate model output values (1) Organizing feature-based methods, Journal of Japan Society of Hydrology and Water Resources, 33, 243–262, https://doi.org/10.3178/jjshwr.33.243, 2020.
Ward, P. J., Winsemius, H. C., Kuzma, S., Bierkens, M. F. P., Bouwman, A., Moel, H. D. E., and Luo, T.: Aqueduct floods methodology, World Resources Institute, 1–28, https://www.wri.org/research/aqueduct-floods-methodology (last access: 17 October 2022), 2020a.
Ward, P. J., Blauhut, V., Bloemendaal, N., Daniell, J. E., de Ruiter, M. C., Duncan, M. J., Emberson, R., Jenkins, S. F., Kirschbaum, D., Kunz, M., Mohr, S., Muis, S., Riddell, G. A., Schäfer, A., Stanley, T., Veldkamp, T. I. E., and Winsemius, H. C.: Review article: Natural hazard risk assessments at the global scale, Nat. Hazards Earth Syst. Sci., 20, 1069–1096, https://doi.org/10.5194/nhess-20-1069-2020, 2020b.
Wing, O. E., Lehman, W., Bates, P. D., Sampson, C. C., Quinn, N., Smith, A. M., Neal, J. C, Porter, J. R., and Kousky, C.: Inequitable patterns of US flood risk in the Anthropocene, Nat. Clim. Change, 12, 156–162, https://doi.org/10.1038/s41558-021-01265-6, 2022.
Yamazaki, D.: MERIT Hydro: global hydrography datasets, http://hydro.iis.u-tokyo.ac.jp/~yamadai/MERIT_Hydro/, last access 14 April 2023.
Yamazaki, D., Kanae, S., Kim, H., and Oki, T.: A physically based description of floodplain inundation dynamics in a global river routing model, Water Resour. Res., 47, W04501, https://doi.org/10.1029/2010WR009726, 2011.
Yamazaki, D., de Almeida, G. A., and Bates, P. D.: Improving computational efficiency in global river models by implementing the local inertial flow equation and a vector-based river network map, Water Resour. Res., 49, 7221–7235, https://doi.org/10.1002/wrcr.20552, 2013.
Yamazaki, D., Sato, T., Kanae, S., Hirabayashi, Y., and Bates, P. D.: Regional flood dynamics in a bifurcating mega delta simulated in a global river model, Geophys. Res. Lett., 41, 3127–3135, https://doi.org/10.1002/2014GL059744, 2014.
Yamazaki, D., Ikeshima, D., Sosa, J., Bates, P. D., Allen, G. H., and Pavelsky, T. M.: MERIT Hydro: A high-resolution global hydrography map based on latest topography dataset, Water Resour. Res., 55, 5053–5073, https://doi.org/10.1029/2019WR024873, 2019.
Yamazaki, D., Revel, M., Hanazaki, R., Zhou, X., and Nitta, T.: global-hydrodynamics/CaMa-Flood_v4, CaMa-Flood (v4.01), Zenodo [code], https://doi.org/10.5281/zenodo.4659583, 2021.
Yang, Y., Pan, M., Lin, P., Beck, H. E., Zeng, Z., Yamazaki, D., David, C.H., Lu, H. Yang, K., Hong, Y., and Wood, E. F.: Global Reach-Level 3-Hourly River Flood Reanalysis (1980–2019), B. Am. Meteorol. Soc., 102, E2086–E2105, https://doi.org/10.1175/BAMS-D-20-0057.1, 2021.
Zhou, X., Ma, W., Echizenya, W., and Yamazaki, D.: The uncertainty of flood frequency analyses in hydrodynamic model simulations, Nat. Hazards Earth Syst. Sci., 21, 1071–1085, https://doi.org/10.5194/nhess-21-1071-2021, 2021.