the Creative Commons Attribution 4.0 License.
the Creative Commons Attribution 4.0 License.
 | 06 Oct 2022
Socio-hydrological modeling of the tradeoff between flood control and hydropower provided by the Columbia River Treaty
Felipe Augusto Arguello Souza
Samuel Park
Charlotte Cherry
Margaret Garcia
David J. Yu
Eduardo Mario Mendiondo
The Columbia River Treaty (CRT) signed between the United States and Canada in 1961 is known as one of the most successful transboundary water treaties. Under continued cooperation, both countries equitably share collective responsibilities of reservoir operations and flood control and hydropower benefits from treaty dams. As the balance of benefits is the key factor of cooperation, future cooperation could be challenged by external social and environmental factors which were not originally anticipated or change in the social preferences of the two actors. To understand the robustness of cooperation dynamics, we address two research questions. (i) How does social and environmental change influence cooperation dynamics? (ii) How do social preferences influence the probability of cooperation for both actors? We analyzed infrastructural, hydrological, economic, social, and environmental data to inform the development of a socio-hydrological system dynamics model. The model simulates the dynamics of flood control and hydropower benefit sharing as a function of the probability to cooperate, which in turn is affected by the share of benefits. The model is used to evaluate scenarios that represent environmental and institutional change and changes in political characteristics based on social preferences. Our findings show that stronger institutional capacity ensures equitable sharing of benefits over the long term. Under the current CRT, the utility of cooperation is always higher for Canada than non-cooperation, which is in contrast to the United States. The probability to cooperate for each country is lowest when they are self-interested but fluctuates in other social preference scenarios.
- Article
(4862 KB) - Full-text XML
-
Supplement
(3244 KB) - BibTeX
- EndNote


The Columbia River Treaty (CRT) was signed in 1961 to manage shared waters between the United States and Canada. Under the treaty, both countries share collective responsibilities of reservoir operations and benefit from flood control and hydropower production from the treaty dams equitably. The CRT is known as one of the most successful transboundary water treaties in the world, as evidenced by continued cooperation and equitable benefit sharing (Hyde, 2010). However, since the CRT was established, external social and environmental factors not originally anticipated, such as the degradation of valued fish species, have affected the balance of benefits each country receives (Bowerman et al., 2021; Trebitz and Wulfhorst, 2021). In competition and cooperation, actors' decisions are guided by their social preferences (also referred to as “other-regarding” preferences). Fehr and Fischbacher (2002) and Kertzer and Rathbun (2015) suggest that decision makers have social preferences that motivate their decisions, which means that such actors care about gain (here, material payoff) not just for themselves but also for others. The perceived fairness of allocated material resources or balance of benefits, in concert with the social preferences of each actor, can significantly affect the stability of cooperation over time (Abraham and Ramachandran, 2021; Hirshleifer, 1978; Kertzer and Rathbun, 2015; Rivera-Torres and Gerlak, 2021; Sadoff and Grey, 2002; UNESCO, 2021). Understanding these social preferences between the United States and Canada helps us to understand the interplay of competition, cooperation, or conflict. The United States and Canada are currently renegotiating the CRT beyond 2024, with the aim of maintaining cooperation in a changing environment. This ongoing renegotiation motivates and raises two research questions. (1) How does social and environmental change influence cooperation dynamics? (2) How do social preferences influence the probability of cooperation for both actors?
Successful management of transboundary river basins depends not only on understanding the hydrology, but also consideration of economic needs and political dynamics of the upstream and downstream riparian states; those political dynamics are shaped by social comparison in which actors compare their position, benefit, or risks with other actors (Gain et al., 2021; Gober and Wheater, 2014). Research in behavioral economics by Frey and Meier (2004) has shown that actors tends to be cooperative if they know many others are contributing too, which could be key to successful management in transboundary river basins. Transboundary rivers are managed by multiple heterogeneous stakeholders with different sovereignty, governance structures, and economic conditions, while diverse, basin populations may be interdependent not just hydrologically but also economically and socially (FAO, 2022; Rawlins, 2019). Social factors that can explain cooperation and conflict dynamics include asymmetric access to water resources due to upstream–downstream locations and varying levels of dependence on different uses of the river (Warner and Zawahri, 2012).
Globally, 310 international transboundary river basins cover almost 47.1 % of the Earth's land surface, which includes 52 % of the global population and are the source of 60 % of freshwater supplies (McCracken and Wolf, 2019; UN-Water, 2015; United Nations, 2022). Transboundary water management compounds the challenges of managing water between competing users because the river is managed between different jurisdictions and under different policy structures (Bernauer and Böhmelt, 2020). Transboundary water management has been studied through different disciplines. Kliot et al. (2001) reviewed the institutional evolution of water management in 12 transboundary river basins, identifying legal principles that organize transboundary water management and discussing their characteristics and shortcomings. The authors discuss that the key challenges in transboundary water management arise from water scarcity, maldistribution, over-utilization, and misuse of shared resources. Odom and Wolf (2011) examined the 1994 Israel–Jordan Treaty of Peace where climate extremes and drought created conflicts on water sharing and hydropower agreements, but the modified institutional arrangements mitigated conflicts and vulnerabilities in transboundary water management under climate change. Madani et al. (2014) applied bankruptcy resolution methods to the challenge of water allocation in transboundary river basins. This quantitative approach is rooted in the economic literature and offers insight into efficient and stable allocation schemes. Pohl and Swain (2017) posit that transboundary waters create economic, social, and environmental interdependencies that can be leveraged to either promote cooperation or intensify conflict. They highlight that this creates the potential for broader peace dividends when negotiating transboundary water management and present strategies for diplomats to engage constructively. Islam and Susskind (2018) presented the Water Diplomacy Framework, which draws on the concepts of complexity science (e.g., interconnectedness, uncertainty, and feedbacks), and negotiation theory (e.g., stakeholder identification, engagement at multiple levels, and value creation for benefit sharing), to understand and resolve transboundary water issues and cooperative decision making. Koebele (2021) takes a policy process approach to understand collaborative governance in transboundary water management of Colorado River between the United States and Mexico, where over-allocation of water led to environmental problems and water scarcity downstream. The author applies the Multiple Streams Framework, used to explain decision making in a range of policy contexts, to examine the case of transnational policymaking in the Colorado River Delta. External factors such as climate change affect the sustainable transboundary water management.
Development in transboundary river basins can result in conflict or cooperation (Bernauer and Böhmelt, 2020). For example, the construction of dams upstream in the Lancang–Mekong River basin has affected the environmental conditions and livelihood opportunities of downstream countries (Lu et al., 2021). Further, the ability to sustain cooperation can be critically affected by how benefits (e.g., water supply and hydropower) and risks (e.g., floods, droughts) are shared under changing conditions (Wolf, 2007; Zeitoun et al., 2013). The Nile River basin is an example of inequitable benefit sharing where Egypt and Sudan hold absolute rights to use, motivating conflict and international deliberation (Kameri-Mbote, 2007; Wiebe, 2001). Understanding the history of such transboundary river basins where conflicts prevailed more than cooperation showed that there is an inequitable distribution of benefits and risks among actors. In the absence of cooperation, the benefits and risks are usually distributed, with advantage to actors with higher political and economic power or following geographic advantages (Dombrowsky, 2009). Prevalence of such imbalance in benefits and risks could further diminish the likelihood of successfully negotiating any agreement to cooperatively manage water resources (Espey and Towfique, 2004; Song and Whittington, 2004). In the case of cooperative transboundary river management, actors mutually achieve several benefits, including (1) benefits to the river, (2) benefits from the river, (3) the reduction of costs because of the river, and (4) benefits beyond the river (Sadoff and Grey, 2002, 2005). Examples of these benefits include flood and drought mitigation, improved environmental conditions, and economic benefits from hydropower or agriculture (Qaddumi, 2008).
In the case of the Columbia River, the upstream actor (Canada) operates its dams in a way that provides a greater benefit to the downstream actor (the United States) in the form of flood protection because the benefit sharing provision of the CRT ensures that Canada receives a share of those benefits in return. The United States operates its dams to maximize hydropower production and, in exchange, compensates Canada for half of the estimated increase in hydropower benefit generated by the treaty, which provides an economic incentive to cooperate. This is consistent with the theory that countries tend to cooperate when the net economic and political benefits of cooperation are greater than the benefits from unilateral action and when the generated benefits are shared in a way that is perceived to be “fair” by both parties (Grey et al., 2016; Jägerskog and Zeitoun, 2009; Qaddumi, 2008). The CRT was established on these grounds, as both actors agreed that the greatest benefit of the Columbia River could be secured through cooperative management (BC Ministry of Energy and Mines, 2013; Yu, 2008). This agreement focuses on the equitable sharing of benefits created from cooperation, rather than on water allocation itself, which is a key provision of some of the world's most successful water agreements (Giordano and Wolf, 2003).
The fairness consideration behind the CRT is consistent with the now well-established behavioral insight that most human actors are not selfish rational actors that seek to maximize short-term material benefits with complete information (Henrich et al., 2005). Rather, there is overwhelming empirical evidence that humans are learning and norm-adopting actors, whose decisions are sensitive to contextual conditions, including those of how material benefits are relatively distributed between oneself and others (Fehr and Schmidt, 1999; Gintis et al., 2003). Among several social science theories that have emerged to explain this empirical regularity about human behavior (note that, as explained by Sanderson et al., 2017, the social sciences are characterized by theoretical pluralism and that there is no single universal theory about human behavior), perhaps the most rigorous theory is that of social preference which is also referred to as prosocial preference or other-regarding preference (Fehr and Fischbacher, 2002; Kertzer and Rathbun, 2015). This theory assumes that humans not only care about their own material benefits, but also about the material benefits received by others and that this intrinsic nature is consistent with why many people (but not all) exercise social norms such as inequality aversion and conditional cooperation. In line with this theory, the utility of individual and organizational actors can be formalized and categorized into four general types of social preferences: preference for having the benefits among all actors to be equal (inequality aversion), preference for maximizing group- or societal-level benefits (social welfare consideration), preference for rational self-interest maximization (homo economicus), and preference for having their own benefits to be higher than those of others (competitiveness) (Charness and Rabin, 2002). Among these four types, particularly relevant to transboundary river management is that human actors have a strong social preference for inequality aversion at both individual and organizational level and that this preference is often a key to why cooperation emerges and is sustained among unrelated parties (Choshen-Hillel and Yaniv, 2011; Kertzer and Rathbun, 2015). Thus, the decisions of organizational actors and their reciprocal interactions over time in the context of the CRT can be described and plausibly explained by inequality aversion. Understanding the social preferences between organizational actors (here the United States and Canada) can capture how their cooperation behavior may evolve over time and shape the robustness of CRT.
Traditional water resource management assumes values and preferences to be exogenous to the water resource systems, but values and preferences can co-evolve with natural systems (Caldas et al., 2015; Sivapalan and Blöschl, 2015). Socio-hydrology, the study of coupled human–water systems, fills this need by providing tools to represent dynamic feedback between the hydrological and social systems (Sivapalan et al., 2012; Troy et al., 2015). Socio-hydrological studies have explored a variety of emergent phenomena that result from such feedback, including the levee effect, the irrigation efficiency paradox, and the pendulum swing between human and environmental water uses (Khan et al., 2017). In the study of transboundary rivers, socio-hydrology allows for the explicit inclusion of changing values or preferences and enables assessment of cooperation and conflict as values and preferences shift (Sivapalan and Blöschl, 2015). Thus, we develop a socio-hydrological system dynamics model motivated by the experience of the Columbia River to answer the research questions defined above. This research builds upon the work of Lu et al. (2021), where the authors applied socio-hydrological modeling to the case of the transboundary Lancang–Mekong River, by assessing how preferences and attitudes toward cooperation affect their probability of adhering to the agreement. Extending the work by Lu et al. (2021), we apply behavioral economics to incorporate the role of social preferences between actors to quantify the probability of cooperation for each actor. Furthermore, the power dynamics between actors is very different in the Columbia River basin than in the Lancang–Mekong River basin. The objective of this study is to quantify the balance of benefits under cooperative reservoir operations to assess the impact of changing social and environmental conditions as well as shifts in the social preferences of the United States and Canada. While the study does not aim to provide specific recommendations for treaty re-negotiations, it explores the role that changes in environmental priorities play in cooperation and presents scenarios to inform future renegotiations of the CRT.
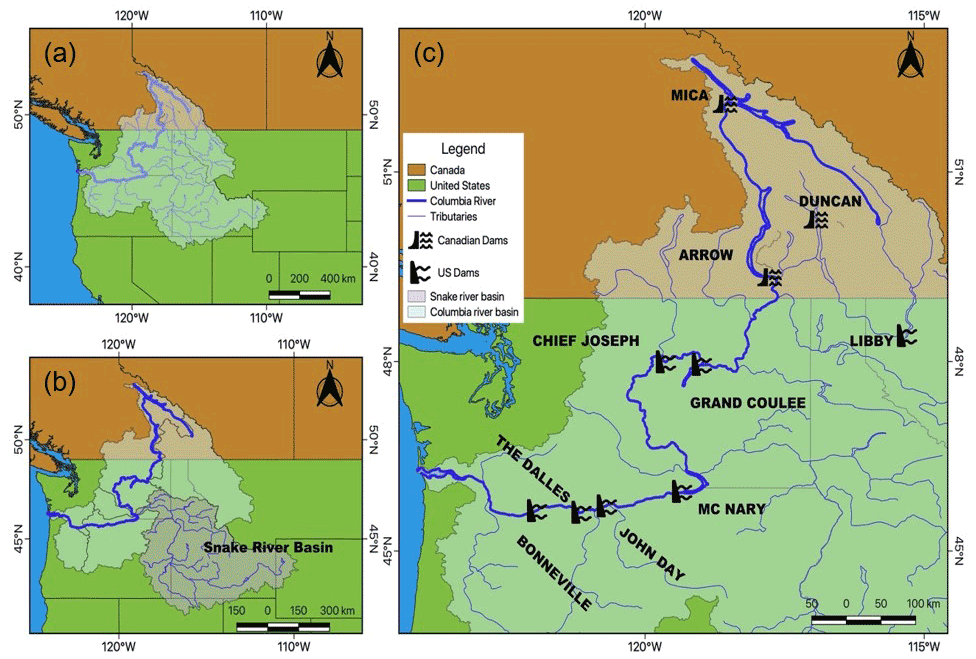
Figure 1Map showing (a) the Columbia River basin across Canada and the United States, (b) the Snake River basin and its tributaries within the Columbia River basin, and (c) location of treaty dams along Canada and the United States which are also included in the socio-hydrological system dynamics model.
This article is organized as follows. Section 2 provides a general background of the Columbia River system and treaty dams. Section 3 discusses the conceptualization and formulation of the socio-hydrological model. Four scenarios based on environmental and institutional change and four scenarios based on behavioral economics using social preferences are presented here. Section 4 explains the model testing and scenario analysis. Section 5 discusses the findings of this study, draws out major conclusions gained through this study, and identifies remaining questions for future research.
The Columbia River, as depicted in Fig. 1, with its headwaters located in the mountains of British Columbia, has a basin that extends 670 807 km2 into seven US states – Washington, Oregon, Idaho, Montana, Nevada, Utah, and Wyoming – before reaching the Pacific Ocean in Oregon (Cosens, 2012). Figure 1 also shows the location of the treaty dams along the Columbia River. While only 15 % of the river's length flows through Canada, 38 % of the average annual flow originates there (Cosens, 2012). By volume, it is the fourth largest river in North America, producing 40 % of all US hydropower (HP), and millions of people in the Pacific Northwest (including 8 million people in the Columbia Basin; Lower Columbia Estuary Partnership, 2022) rely on the river for hydropower, fishing, irrigation, recreation, navigation, and other environmental services (White et al., 2021).
Table 1List of dams represented by the model. Projects that do not present usable storage capacity are run-of-the-river dams. Treaty storage commitment refers to the room available to accommodate glacier waters under the CRT.
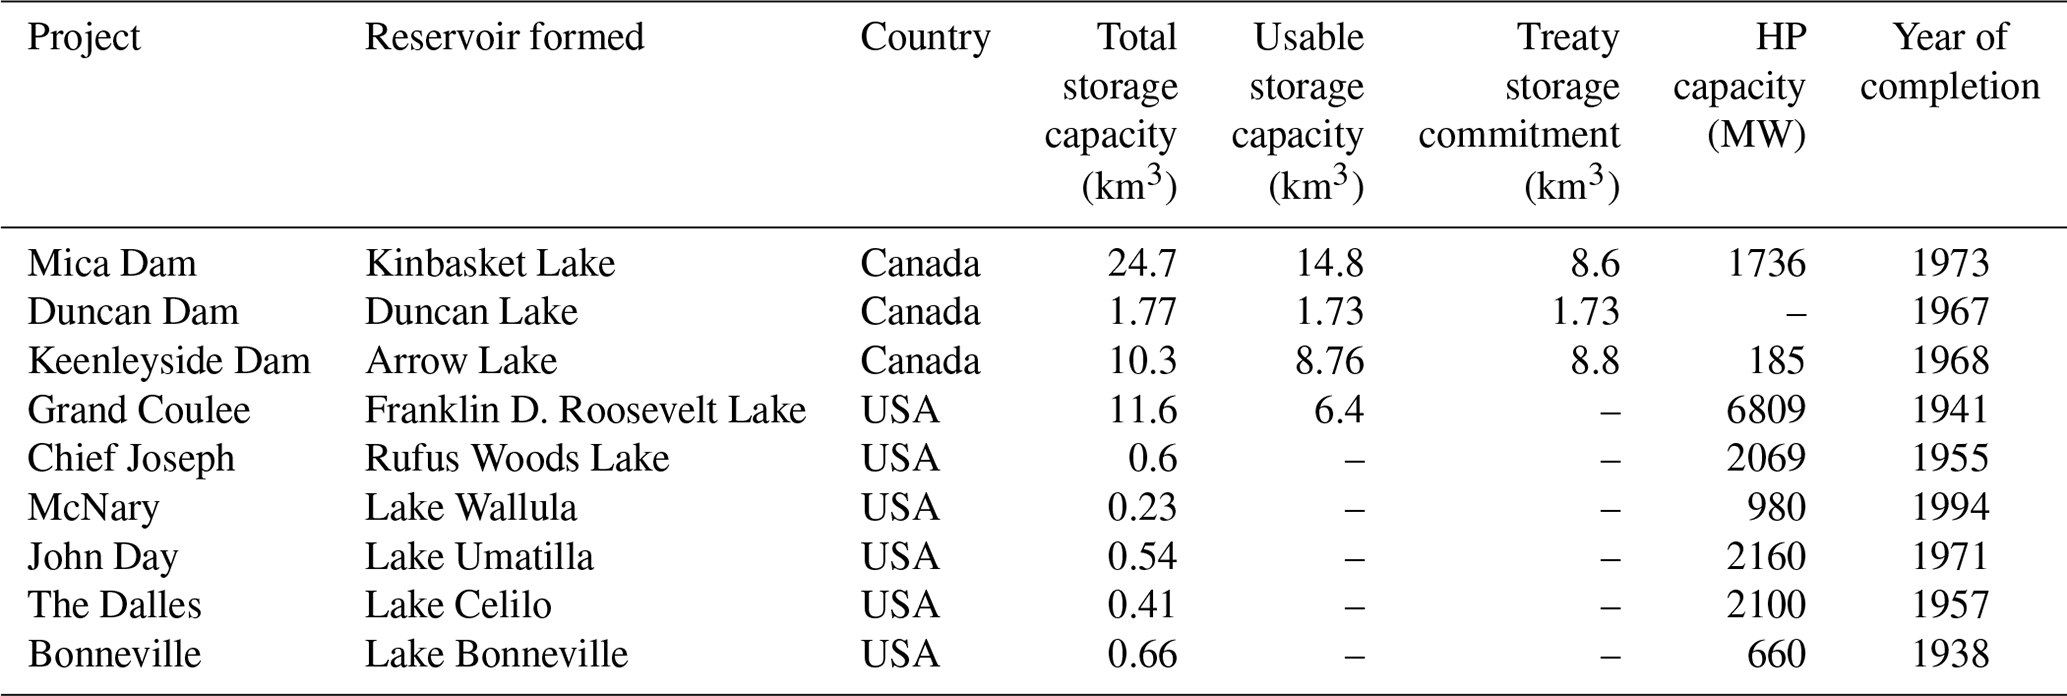
Hydropower development started in the Pacific Northwest in 1933 and expanded after the CRT was established. Between 1938 and 1972, 11 dams were built on the US portion of the Columbia River, which generates over 20 000 MW of power (BC Ministry of Energy and Mines, 2013). In total, there are 31 federal dams in the Columbia River basin that are owned and operated by the U.S. Army Corps of Engineers (USACE) and the U.S. Bureau of Reclamation, which produce around 40 % of electricity for the Pacific Northwest (Bonneville Power Administration, 2001; Northwest Power and Conservation Council, 2020c, d; Stern, 2018). Dams along the Canadian side of the Columbia River produce around half of the province's hydropower generation (Government of British Columbia, 2019). Figure 1c shows the locations of major CRT dams considered in the system dynamics model. The reservoir capacity of Canadian treaty dams is 36 810×106 m3, of which 28 387×106 m3 is allocated for flood protection in the United States, and the capacity of the US treaty dams is 11 577×106 m3. Grand Coulee is the largest and furthest upstream dam on the US side. Thus, inflow to the Grand Coulee includes the outflow from the Canadian dams and external tributaries that intersect with the river. Flooding has been the major concern in the downstream portion of the Columbia River. For example, the flood in Vanport, Oregon, in 1948 motivated the construction of additional storage dams along the river (Sopinka and Pitt, 2014). This flood was the impetus for the United States to seek cooperation with Canada because it was not possible to build sufficient storage along the downstream portion of the river to ensure protection from large floods. The summary of dams along the Columbia River is given is Table 1.
The original agreement during 1960s prioritized flood control and hydropower, but emerging social and environmental concerns have shifted the way that reservoirs are operated within the Columbia River basin. Dam construction altered the hydrology significantly by moderating the strong seasonal flow variability, impacting ecosystem health. For example, changes to salmon spawning habitat elevated smolt and adult migration mortality and led to declines in the salmon population (Kareiva et al., 2000; Karpouzoglou et al., 2019; Natural Resource Council, 1996; Northwest Power Planning Council, 1986; Williams et al., 2005). After the 1970s, mounting social pressure to protect the aquatic environment resulted in changes in dam operations that shifted the economic benefits that the countries receive from cooperation (Bonneville Power Administration, 2013; Leonard et al., 2015; Northwest Power and Conservation Council, 2020b, a). This increased prioritization of ecosystem health is also seen in other transboundary river basins (Giordano et al., 2014). With changing priorities and operations affecting both actors' share of benefits, incentives to cooperate are shifting.
In this section we present the conceptual model of Columbia River system under CRT, the formulation of a system dynamics model, model calibration and validation, and scenario analysis. To incorporate the transboundary dynamics and feedback between the hydrological and social systems, we simplify the representation of the hydrology and reservoir operations by aggregating the CRT treaty dams for Canada and the United States. To understand the long-term dynamics of cooperation and robustness of the cooperation under change, four scenarios based on plausible cases of environmental and institutional change and four scenarios based on social preferences were developed and tested as discussed below.
3.1 Socio-hydrological system dynamics model
Under the cooperative regime, both Canada and the United States operate their dams to fulfill the requirements of the CRT. This means that Canada operates to maximize flood control, while the United States operates to maximize hydropower, and the benefits are shared between both countries. As discussed in the literature (BC Ministry of Energy and Mines, 2013; Giordano and Wolf, 2003; Grey et al., 2016; Jägerskog and Zeitoun, 2009; Qaddumi, 2008; Yu, 2008), countries are expected to continue cooperating if they perceive the benefits to be shared equitably. On the other hand, under the non-cooperative regime, the balance of benefits is not perceived to be equitable; thus, the countries would operate their reservoirs for their own benefit. Reservoir operation to maximize flood control and to maximize hydropower production are in opposition for Canada and the United States. This is because operation for maximizing flood control requires drawdown of reservoir storage to provide space for incoming high flows, while operation for maximizing hydropower production requires reservoir storage to be maintained at higher levels to achieve the highest hydraulic head possible. In a non-cooperative regime, Canada would likely switch operations to maximize hydropower production, while the United States would have to decrease storage or water level to provide flood control, at the detriment of US hydropower production. The basis of the model is that each country has responsibility over operating its own dams.
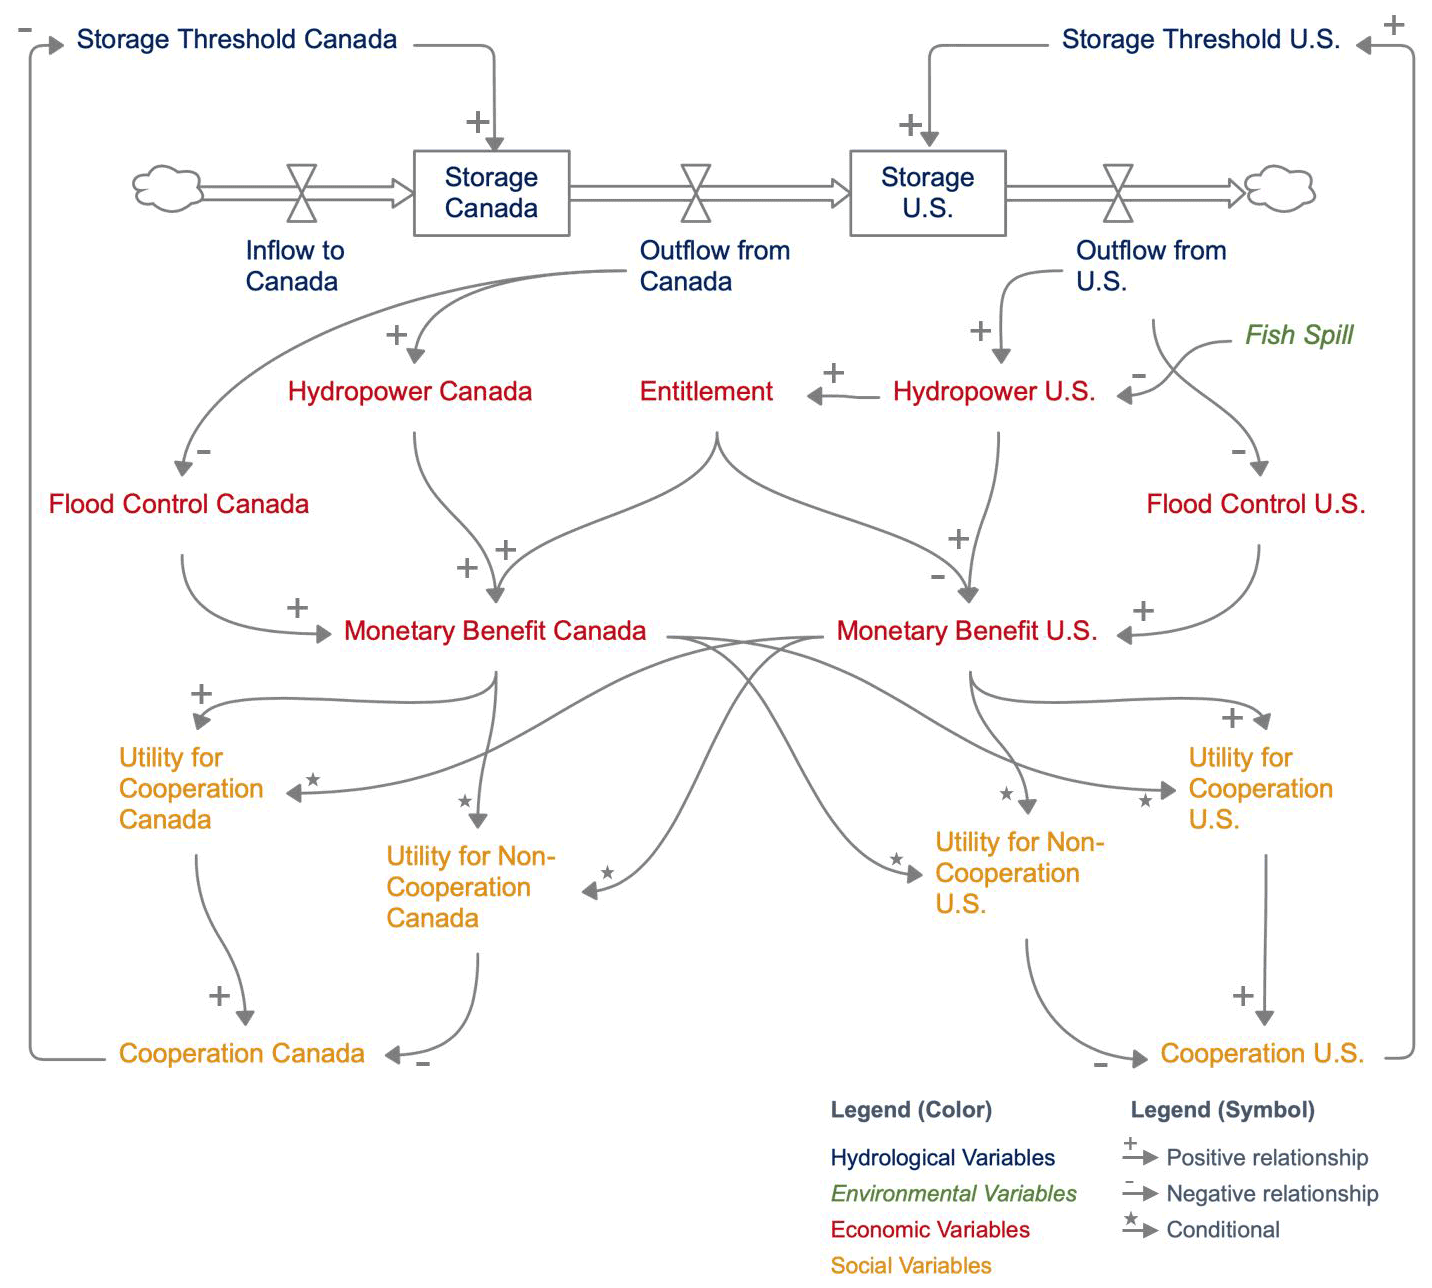
Figure 2The causal loop diagram presents the hydrological and cooperation feedbacks between the Canada and the United States. Different colors shows the hydrological, environmental, economic, and social variables.
The modeling framework is illustrated with a causal loop (CL) diagram in Fig. 2. The CL diagram illustrates all the key hydrological, environmental, economic, and social variables, relationships, direction of those relationships, and feedback.
The storage capacity of Canada (upstream) and the United States (downstream) are two important state (hydrological) variables which represent the aggregated storage of the treaty dams (Fig. 2), the operation of which is determined by the storage thresholds. The increase in a storage threshold results in an increase in the storage level. Three Canadian dams, namely Mica, Duncan, and Arrow/Keenleyside, are lumped into a single storage as all three dams are multifunctional for flood control and hydropower production. However, it should also be noted that Mica and Arrow dams are the major dams in Canada contributing to flood control as those are along the primary stream order of Columbia River and Duncan Dam is in the small tributary (Fig. 1). In terms of storage volume Mica, Arrow and Duncan dams are 24.7, 10.3, and 1.77 km3, or 67 %, 28 %, and 5 % of total storage, respectively (Table 1). In the United States, the Grand Coulee dam is the only multifunctional dam with useable storage for flood control. Given that the Grand Coulee is the only dam with storage in the US system, we have only lumped the reservoirs for hydropower generation, not flood control. We used the lumped reservoir approach to simplify the system process required to investigate our research questions. The lumped approach is particularly appropriate because all the treaty dams work in coordination to achieve either the hydropower benefits (by US dams) or the flood control (by Canadian dams). The schematic of the lumped system is also shown in Fig. S18 and Sect. S4 in the Supplement. In lumping the system, we have considered external input variables such as tributaries and added to the outflow from the Canadian reservoir or inflow to the US reservoir. These dams along the Columbia River either have significant flood control capacity or significant hydropower production capacity (Table 1). Thus, the simplified reservoir operation described below in Sect. 3.2.1 was implemented in the lumped storages on each side of the border, which represent collective operation of all the treaty dams within each country. Other hydrological variables in the model (i.e., flows in the CL diagram) are inflow into Canadian storage, outflow from Canadian storage plus intermediate tributaries, inflow into the US storage, and outflow from the US storage. The higher the outflow from the dams, the lower the flood control as flood damages increase. A portion of the reservoir outflow passes through hydroelectric turbines; thus more outflow yields higher hydropower benefit. However, the need for flood control is intermittent depending on the seasonal high flows. Thus, Canada does not reduce the storage level throughout the year but just before the incoming higher flows. Reservoir levels in the United States (under CRT) are kept as high as feasible to maximize hydropower generation. Each country's reservoir outflow is used to calculate flood control and hydropower production (Fig. 2, economic variables), which is converted into monetary units as shown in the CL diagram. Fish spill is included as an environmental variable as the reduced salmon migration causes depletion of the salmon population in Columbia River. Thus, a countermeasure, increase in fish spill, is in place. However, the increase in fish spill has a tradeoff in hydropower production as less water flows through the turbine. The United States provides additional benefits to Canada through the Canadian Entitlement, a payment equal to half of the expected additional hydropower generated due to cooperative management of the CRT dams. The collective monetary benefit from flood control and hydropower among countries determines the utility of cooperation and non-cooperation (economic variables) for each country as described in Sect. 3.2.2. The social preferences in different scenarios determine different values for utility of cooperation and non-cooperation depending on the actor's social preference. Thus, the directions of these relationships are conditional (Fig. 2). Having higher utility for cooperation under CRT results in a higher probability of cooperation. However, under changing social preferences, if the utility of non-cooperation is higher, the probability of cooperation decreases. In sum, increase in cooperation for Canada results in decrease of dynamic storage threshold, so Canada operates their reservoirs for downstream flood control. Similarly, increase in cooperation for the United States results in increase of the dynamic storage threshold, so the United States operates for maximum hydropower generation, thus creating two similar feedback loops for Canada and the United States (Fig. 2).
3.2 Equations and parameters
Equations describing the links between stocks and flow variables as shown in the CL diagram (Fig. 2) are categorized into reservoir operation, cooperation dynamics, economic benefits, and environmental spills. These equations mathematically describe hydrological processes, as well as feedback from social and economic variables. The following sections describe the formulation of equations for each part of the system in greater detail. The inflow, outflow, water level, and storage data obtained from the Environment Canada (2022), USACE (2013), USACE (2022) and USGS (2022) are presented in Figs. S2–S10.
3.2.1 Reservoir operation
The change in Canadian and US storage (m3 d−1) as the function of inflow and outflow is given in Eqs. (1) and (2).
The Canadian inflow () corresponds to the streamflow observed upstream of Mica and Duncan dams and the difference between Mica outflow and Arrow inflow (i.e., flow from intermediate tributaries). The data were retrieved from the Bonneville Power Administration (Bonneville Power Administration, 2020). The US inflow () is equal to the outflow from Canadian storage () plus the tributaries between the outlet of Duncan and Arrow dams and inlet of the Grand Coulee reservoir. The flow from tributaries on the Canadian side was calculated as the difference between the streamflow at the International Border and outflow from Duncan and Arrow dams, while the tributaries between the International Border and the Grand Coulee reservoir were estimated by a linear regression (Fig. S12).
The regulated Canadian () and US () outflows were simulated using Eqs. (3) and (4).
where I1 is the condition when , and nCA parameter maintains the dynamic storage threshold required for flood control.
where I2 is the condition when .
Outflow was computed as a dependent variable of the following:
- a.
inflows ( and ),
- b.
maximum outflows observed in the Canadian side (Arrow and Duncan dams – ) and in the US side (Grand Coulee – ),
- c.
the maximum storage capacity of Canadian lumped dam () and the Grand Coulee dam (),
- d.
the updated storage stage at each time step in the lumped Canadian reservoir and the Grand Coulee reservoir (SCA, SUS) and
- e.
the dynamic storage threshold for each side (, ).
The dynamic storage threshold (m3) variable, mentioned in Eqs. (3) and (4), was estimated according to the simplified reservoir operation given by Eqs. (5) and (6) and is schematically represented by Fig. 3. It determines the operational level of the reservoirs based on the probability of cooperation (i.e., the higher the cooperation, the higher the coherence with the CRT agreement).

Figure 3Schematic representation of the dynamic storage threshold (Sthreshold), represented by the green line. Sthreshold can range between the blue line, which represents the target storage to optimize hydropower production (), and the red line, which represents the target storage to avoid flood damages downstream of the dam ().
As explained above, we consider two operation schemes for each country: (1) operate to maximize for flood control or (2) operate to maximize for hydropower production. Depending on the state of cooperation, the choice will change. In most cases, the system will depend on what Canada chooses, and the United States will have to alter its operations in response. Therefore, when the Canadian probability to cooperate parameter (CCA) approaches 1, Canada is fully cooperating. Under cooperation, we assume that Canada operates to maximize flood control, and the United States operates to maximize hydropower. Conversely, when CCA approaches zero, this would indicate lack of cooperation. Under non-cooperation, the Canadian side does not provide flood storage to the United States, and, after a few simulation time steps where the United States endures higher flood damages, the United States switches from the hydropower production regime () to the flood control regime to optimize its benefits (). The target flood control storage in Canada () was determined based on average historical storage in the three treaty reservoirs, while the hypothetical hydropower scheme was assumed as the dams operating at 95 % of their full production capacity. The US monthly target storage under the hydropower scheme () was determined based on the historical monthly average, while the hypothetical target storage to provide themselves protection against floods was calculated as the additional room that Canada would not provide in case of switching to the hydropower scheme , as presented in Eqs. (5) and (6). Therefore, the storage will be dependent on cooperation. The probability-to-cooperate variables CCA and CUS are described in Sect. 3.2.2.
3.2.2 Cooperation dynamics
Cooperation amongst the two actors both impacts and is impacted by reservoir operations and benefit sharing. Unequal distribution of benefits alters the sense of fairness and reciprocity, two behavioral traits that are known to be widespread (Fehr and Fischbacher, 2002). To conceptualize and understand the cooperation dynamics between two actors in the context of CRT, the theory of social preferences is drawn from the field of behavioral economics. Social preferences – which means that actors care not only on their own material benefits, but also about the material benefits of other actors – have been widely observed in behavioral studies and are consistent with the empirical pattern that many people have aversion to inequality and cooperate only when their initial cooperation is reciprocated by others (Fehr and Fischbacher, 2002). Generally, the “actors” could be individuals or groups of individuals occupying positions ranging from household members to decision makers in multiple levels of government. In line with Charness and Rabin (2002), these preferences can be formalized as a general utility function ui, given by Eq. (7):
where ui is actor i's net utility, wi is actor i's material payoff, and wj is actor j's material payoff. Depending on how the signs of α and β are set, the four general types of social preferences described in Sect. 1 can be captured. Note that a positive value of α represents actor i's disutility from having more than the other actor (the guilt coefficient), and a positive value of β represents actor i's disutility from having less than the other actor (the jealousy coefficient). Thus, positive α and β values mean that actor i has inequality aversion.
The general utility function of Eq. (7) can be applied to the context of CRT by structuring the utility function U of each country as shown in Eqs. (8)–(11):
where w of each country is the utility from monetary benefits, HP of each country is the hydropower benefit, FC of each country is the benefit from flood prevention, E is the Canadian Entitlement, and ω is the coefficient that can convert the monetary values to utility. The subscripts CA and US refer to Canada and the United States, respectively. Here, α and β values are set to be positive to capture inequality aversion for the behavioral model of Canada and the United States. This is because the balance of benefits (Bankes, 2017; Shurts and Paisley, 2013) between these two countries is believed to be a key factor to explain the level of cooperation.
We use logit dynamics functions to capture the rate of change in the cooperation probability of the two state actors (Iwasa et al., 2010). We chose to use logit dynamics (Hofbauer and Sigmund, 2003) over replicator dynamics (Taylon and Jonker, 1978) because the former enables us to incorporate actors' innate social preferences, i.e., each actor internally compares two choices (e.g., cooperation vs. defection) in terms of net utilities that reflect their social preferences and then makes a probabilistic choice. In comparison, replicator dynamics are based on social comparisons of externally observable material payoffs and social imitation; i.e., each actor sees externally observable material payoffs of other actors following a particular strategy, compares that strategy's payoff to the material payoff of his or her current strategy, and then deterministically chooses the better strategy. Because logit dynamics is more compatible with representation of social preferences, and because of its stochastic best response nature, we chose logit dynamics. Equations (12) and (13) represent the rate of change in the cooperation probability of the two state actors based on logit dynamics:
where CCA and CUS represent the probability of each country to cooperate (ranging from 0 for non-cooperation to 1 for full cooperation), and the parameter χ represents the probability that each actor engages in internal comparison of two choices and updates their probability to cooperate per time step. A small value implies the conservativeness of each actor. E[…] stands for an expected value. The parameter γ controls the stochasticity of the choice of strategy. A small value indicates that the choice is nearly random, whereas a very large value means a nearly deterministic choice. We assumed γ to be large and constant as both actors aim for higher expected utility. For probability to cooperate, if CCA equals 0.9, that means there is 90 % likelihood that Canada will cooperate with the United States and 10 % likelihood it will not cooperate.
Table 2The payoff matrix of the mixed-strategy prisoner's dilemma between Canada and United States showing monetary benefit for Canada (wCA_) and the United States (wUS_) in four conditions: CC – the US and Canada both cooperate, CN – the United States cooperates and Canada does not, NC – the United States does not cooperate and Canada does, and NN – the United States and Canada both do not cooperate.

It is commonly observed that actors cooperate if they expect others will do the same (Fehr and Fischbacher, 2002). In line with this notion, a mixed-strategy prisoner's dilemma is used to calculate the expected monetary payoffs, E[w], according to the combination of strategic decisions across countries (Table 2). For example, is the monetary benefit of Canada when the United States chooses to cooperate, and Canada chooses not to cooperate. The expected monetary payoff of Canada is calculated as shown in Eq. (14) (although not shown here, an equation with the same structure was used for the expected utility of the United States). The expected net utility of Canada that reflects its inequality aversion is derived using Eqs. (15) and (16) (although not shown, equations with the same structure were used for the United States).
3.2.3 Economic benefit equations
The model simulates the benefits that both countries receive from the river. The default operation assumes that the countries cooperate to maximize benefits across the whole system, while in the counter case, benefits are based on operation of each side individually. The economic benefits related to flood control are accounted as the damages prevented by the reservoir storage operations. Although the U.S. Corps of Engineers reports that flood damages in Trail, British Columbia, a city near the International Border, occur when streamflow exceeds 6371 m3 s−1 (225 000 cfs) (USACE, 2003), we did not find details about the damages related to the seasonal flows in Canada. Therefore, the associated economic benefit due to the damages prevented for the Canadian side due to reservoir operation was assumed to be negligible.
In the United States, significant damages occur when streamflow exceeds 12 742 m3 s−1 at Dalles, Oregon, and major damages are caused when flows reach 16 990 m3 s−1 (Bankes, 2012). Therefore, when they are operating jointly, Canada must draw down storage reservoirs before 1 April to accommodate spring runoff and avoid peak flows downstream. Otherwise, we assume that the United States must switch to a flood control scheme. Flood damages prevented because of reservoir management under CRT were explored by Sopinka and Pitt (2014). They compared the maximum annual daily peak flows at Dalles after the implementation of the CRT and the corresponding monetary damages they could have caused without flood control storage provided. The results of their study were fitted to an exponential curve using Eq. (17), which gives economic benefit in the United States due to flood control:
which presented a R-squared value equal to 0.76. This function was used to estimate the value of flood protection. More details on flood control benefit are presented in Fig. S11–S13.
The economic benefit in the United States due to flood damages avoided (FCUS) is based on inflow (m3 s−1) into the Dalles dam (QDalles). Thereafter, we found the correlation between the Dalles' inflow and the combined outflow of Grand Coulee (QGrand Coulee) and the Snake River (QSnake River) (Eq. 18).
The Snake River discharge was included in this analysis because its basin is the major tributary to the Columbia River, contributing to flow at the Dalles.
The other economic benefit resulting from management of the Columbia River is the electricity produced by the hydropower facilities installed in the dams listed in Table 1. Although other dams on the Canadian side of the Columbia Basin have capacity to generate hydropower, the model only considers those three that are part of the CRT. Similarly, we only consider the six federal dams on the US side whose surplus production contributes to the determination of the Canadian Entitlement. Since all six dams produce energy, but only the Grand Coulee operations were modeled, we split the economic benefit from hydropower generation into two parts. Equation (19) resulted from the regression performed between the product of the forebay level (h) times Grand Coulee's daily average outflow (Qout) versus the daily historical hydropower produced by Grand Coulee (HPGrand Coulee) (MWh), which resulted in an R-squared value equal to 0.84.
In addition, we calculated the daily electricity produced by the other five dams in Eq. (20):
where HP5 dams is the hydropower in megawatt hours (MWh) produced by Chief Joseph, McNary, John Day, the Dalles, and Bonneville dams. The variable Qout is Grand Coulee's daily outflow, and Wfish is the weighting factor that considers the operations to meet environmental demands, which is detailed in Sect. 3.2.4. The correlation for the first and second conditions in Eq. (20) presented R-squared values equal to 0.99 and 0.94, respectively. Correlation to predict hydropower generation from outflows and forebay levels is presented in Figs. S14 and S15. In Eq. (21) we calculate the total economic benefit due to hydropower production (HPUS) in United States dollars (USD):
where HPUSD is the average energy price of Oregon and Washington states according to the U.S. Energy Information Administration (2022).
For the Canadian dams, historical data on hydropower production are not available. Therefore, Eq. (22) estimates the economic benefit due to electricity produced in Canada (HPCA) in USD based on the generation flow capacity (Qturb), the maximum hydraulic head (H), the hydropower facility efficiency (μ), the specific water weight (γ), and the electricity price in British Columbia according to BC Hydro (2020) converted to USD equivalent.
Since this equation is based on the Mica dam, and, in the model, the three Canadian dams are modeled together, the Qturb and H were interpolated according to the actual and maximum recorded Canadian outflow and Canadian storage, respectively.
The last economic benefit modeled in this study is the entitlement that United States returns to Canada as a payment for increased hydropower generation due to the collaboration between both countries. The Canadian Entitlement (E), simulated in USD, is a function of the actual entitlement in MWh provided by the United States, the κ parameter, which corresponds to a dimensionless correction factor of the total energy produced by the United States, and the average energy price HPUSD of Oregon and Washington states (Eq. 23).
3.2.4 Impact of environmental spills
The Fish Operation Plan (FOP) details the spills dams must release to meet biological requirements. Fish passage facilities have decreased hydropower generation. The Bonneville Power Administration, which operates the US treaty dams, estimates that losses due to forgone revenue and power purchases are about USD 27 million to USD 595 million per year (Northwest Power and Conservation Council, 2019). Although the historical data between 1985 and 2018 of hydropower generated by the six US dams listed in Table 1 reveal hydropower production increased after the FOP implementation, when normalized as the ratio of hydropower production to inflows, there is in fact a decrease in production after FOP is implemented.
In order to address the impact of biological spills on hydropower production, we created a weighting factor in the hydropower benefit equation for the United States, which is detailed in Eq. (24).
This weighting factor (Wfish) accounts for the fraction of flow () that no longer goes through the hydropower turbines between April and August because it is released through a spillway or a regulating outlet to meet the biological demands. We calculated the average monthly fraction for each of the i dams downstream of Grand Coulee and multiplied it by the maximum hydropower produced by each dam (MaxHPi) to address individual contributions and the particular effect of FOPs at treaty dams.
3.3 Model setup and testing
The equations described above are formulated into the system dynamics model and implemented in R, a statistical programming environment. In this study we used the library package deSolve, version 1.28 (Soetaert et al., 2010, 2020), to solve the initial value problem of ordinary differential equations (ODEs), differential algebraic equations, and partial differential equations. The ordinary differential equations wrapper (i.e., lsoda) that uses variable-step, variable-order backward differentiation formulae to solve stiff problems or Adams methods to solve non-stiff problems (Soetaert et al., 2010) was used to compute dynamic behavior of the lumped reservoir system and to assess how the reservoir level and operation rules change as a function of time and different variables. The model was simulated using daily time steps, and the outputs are extracted and presented at monthly scale. Sensitivity analysis was conducted to test the sensitivity of the parameters and identify the parameters that are most important. However, all unknown parameters were used in calibration due to the limited computational cost. The details of the sensitivity analysis are presented in Sect. S3.
Calibration and validation
The calibration and selection of appropriate parameter values are essential to accurately reproduce the system's behavior. The calibration parameters can be found in Fig. 4. These parameters are related to both the hydrological and socio-economic components of the system. A genetic algorithm (GA) (Scrucca, 2021) was used to optimize the system dynamics model, using observation for the period from 1 January 1990 to 31 December 2005. The methodological framework for model calibration is presented in Fig. 4. A single objective function was defined as minimizing the average root mean square error of reservoir water levels in Canada and the United States (Z), which is given by Eq. (25).
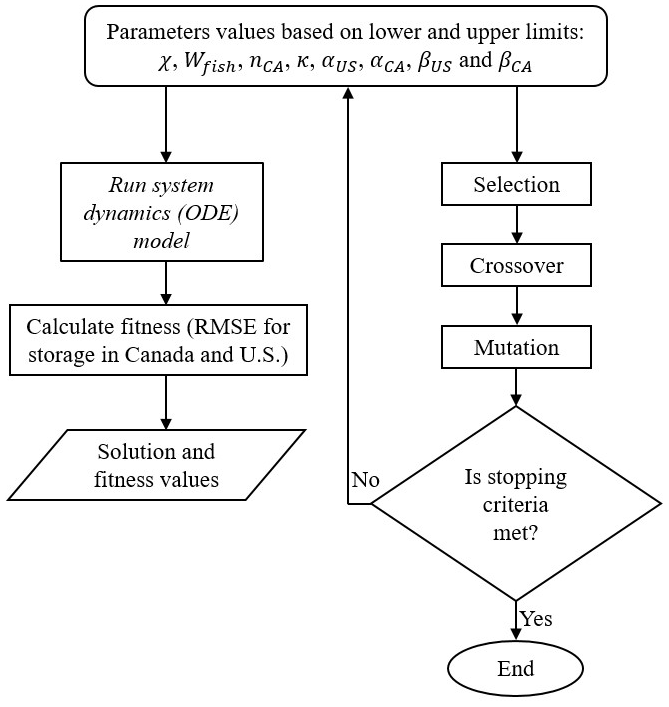
Figure 4Overview of calibration process to optimize parameter values using the genetic algorithm. The stopping criteria include either the maximum iteration for the algorithm to run, which is set at 200 generations, or the number of iterations before the algorithm stops, in case no further optimal fitness value can be found, which is set at 70 generations.
A maximum of 200 iterations and a population size of 200 were used to run the algorithm with a stopping criterion of 70 iterations before the algorithm stops when no further improvement can be found. The selected larger population size and iterations, for eight parameters, ensure that search space is not restricted. The range of parameter values assigned was 0.01 to 0.8 for χ, 0.95 to 1.05 for Wfish, 0.1 to 0.5 for nCA, 0.95 to 1.05 for κ, 0 to 1.3 for αUS and αCA, and −4 to −0.01 for βUS and βCA. The model was calibrated using daily time series data from 1990 to 2005, and fitted parameters were used to validate the model using data from 2006 to 2017.
The model assessment for the goodness of fit between modeled and observed values was done using four goodness-of-fit metrics, including root mean square error (RMSE), percent bias (PBIAS), volumetric efficiency (VE), and relative index of agreement (rd). RMSE gives the standard deviation of the model prediction error, with lower RMSE indicating better fitness. PBIAS measures average tendency of the simulated values to be higher or lower than the observed data, which range from −∞ to +∞, and its optimal value is 0. VE is a modified form of mean absolute error in which absolute deviation is normalized by the total sum of observed data, which could range from 0 to 1, with 1 indicating better agreement. Lastly, rd measures the agreement between simulated and observed data, with its values ranging from 0 to 1 and 1 indicating better fit. For mathematical expressions of these metrics, readers are referred to Zambrano-Bigiarini (2020).
3.4 Scenario analysis
Scenario analysis explores dynamics within cooperation and benefit sharing as a result of external environmental factors, institutional capacity, and social and behavioral preferences.
3.4.1 Scenarios based on environmental and institutional change
The CRT's success has been based on benefit sharing between the two countries (Hyde, 2010). However, due to increased environmental flows in the United States, some parties feel benefits are no longer equitable. Based on these issues, four scenarios were developed to represent the changes in institutional capacity and environmental factors that could affect the probability of cooperation. The model was used to simulate the probability of cooperation under these scenarios for 28 years between 1990 to 2017, which was compared with the baseline scenario that represents the existing system obtained from the calibrated model. These scenarios are as follows:
- i.
Chi (χ) decreases. The calibrated value of 0.5 decreases to 0.05. χ represents the institutional capacity which determines the growth potential of the probability of cooperation. This type of condition could occur due to a more tense relationship between the United States and Canada that could arise due to lack of cooperation in other areas or weaker institutions.
- ii.
Chi (χ) increases. The calibrated value of 0.5 increases to 0.7. This scenario represents the strengthening of institutions. Note that the selection of χ values for scenarios “Chi (χ) increases” and “Chi (χ) decreases” was done based on experimentation, where drastic change in CCA and CUS is observed at both ends of increasing and decreasing χ from the calibrated value.
- iii.
High fish spills. Environmental concerns result in prioritization of spills for fish passage. Water for fish spills increases by 40 % from April through August.
- iv.
Chi (χ) decreases and high fish spills. Chi (χ) decreases to 0.05, and fish spills increase by 40 %. It represents the scenario when environmental pressure is high, and institutions are weaker.
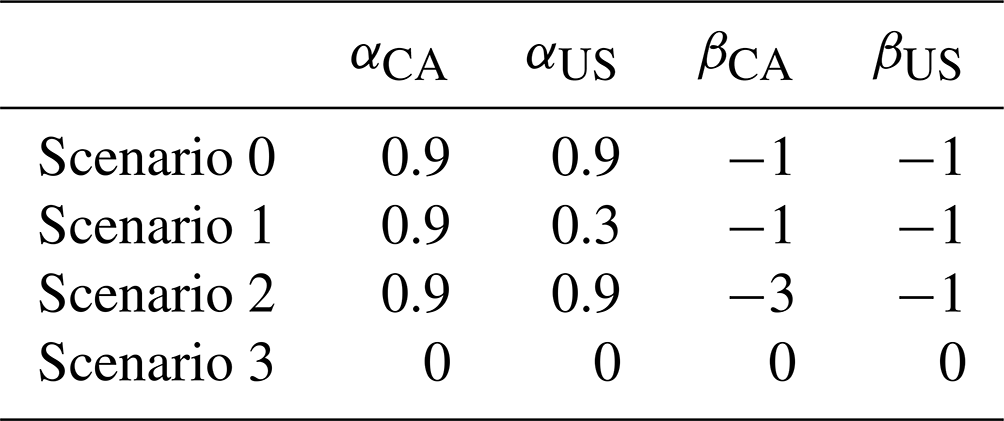
Table 3The configuration of different other-regarding preferences of Canada and the United States for scenario analysis. In Scenario 0, both countries have the same level of inequality aversion, while in Scenario 1, the United States has less guilt than Scenario 0, in Scenario 2, Canada is more jealous than in Scenario 0, and in Scenario 3, both countries are only concerned with their own utility.
3.4.2 Scenarios based on social preferences
As discussed by Fehr and Fischbacher (2002) and Kertzer and Rathbun (2015), consideration of social preferences is required to understand mechanisms of cooperation and the effect of material or benefit payoffs. The key assumption in economic science that economic reasoning is mostly based on self-interest or that all actors are exclusively motivated by their material self-interest is invalid as this assumption rules out the heterogeneity arising from social preferences which substantial fraction of people exhibit (Fehr and Fischbacher, 2002). To explore the effect of inequality aversion of each country on the cooperation dynamics, we develop four scenarios with different configuration of α and β values for Canada and the United States (shown in Table 3). Theoretically, the value of the two coefficients should range from β < 0 < α ≤ 1, and jealousy is more likely than guilt (|β| > |α|) (Fehr and Schmidt, 1999). The four scenarios are the following:
- i.
Scenario 0. We posit that both Canada and the United States have the same inequality aversion (αCA=αUS = 0.9, βCA=βUS = −1). The same inequality aversion means that the actors prefer the benefits to be equally distributed; i.e., each actor wants to increase/decrease their benefits up to the equitable benchmark when there is imbalance in benefits. This scenario is not the same as the “baseline” scenario discussed above in Sect. 3.4.1, where four scenarios based on environmental and institutional change are compared.
- ii.
Scenario 1. The United States has less guilt than Canada (αCA = 0.9, αUS = 0.3, βCA=βUS = −1). That means the United States is willing to have more benefits than Canada.
- iii.
Scenario 2. Canada has more jealousy than the United States (αCA=αUS = 0.9, βCA = −3, βUS = −1). This means Canada is unwilling to have fewer benefits than the United States.
- iv.
Scenario 3. We assume that the both countries have no social preferences ( = 0), which signifies self-interest or selfishness. In this scenario, each country is only concerned with its own utility and indifferent to the utility of the other.
We did not include the change of the jealousy of the United States or the guilt of Canada in the scenario analysis. This choice is justified because the net monetary benefit of the United States is always higher than that of Canada, so the United States never feels jealousy, nor does Canada feel guilt. In each scenario, we impose a small amount of white noise to each country's α and β values, which introduces an element of stochasticity.
This section presents results of model parameterization using the genetic algorithm, including results from the scenario analysis.
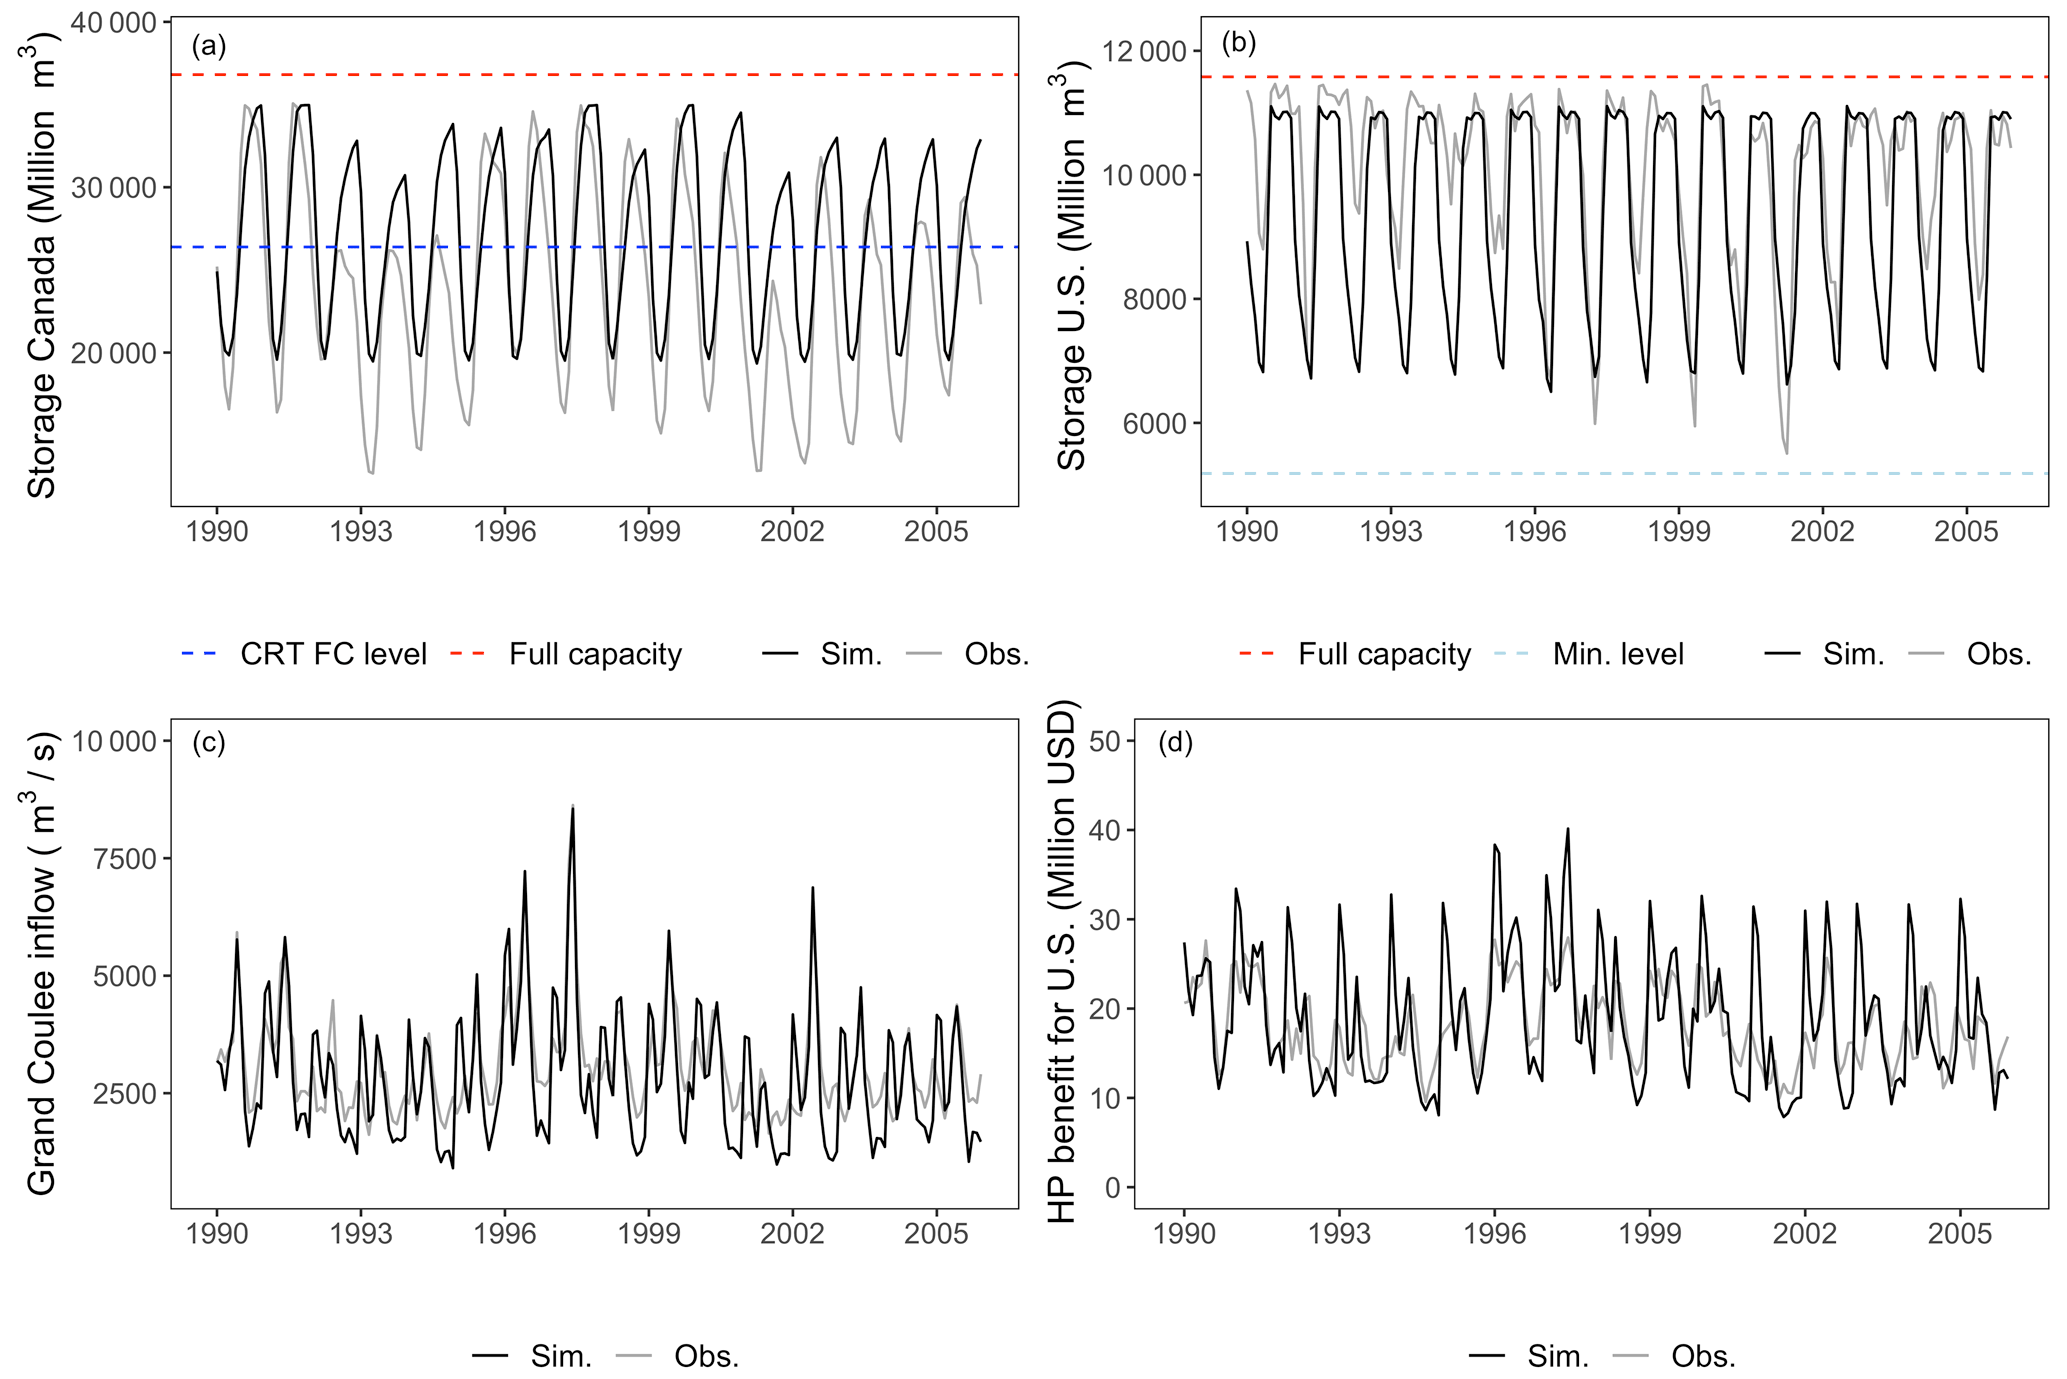
Figure 5Calibration result from 1990–2005 showing (a) Canadian storage, (b) US storage, (c) Grand Coulee inflow, and (d) hydropower benefit for the United States. Note that sim. – simulated, obs. – observed, full capacity – maximum capacity, CRT FC level – CRT flood protection target level, and min. level – minimum capacity for the US dams.
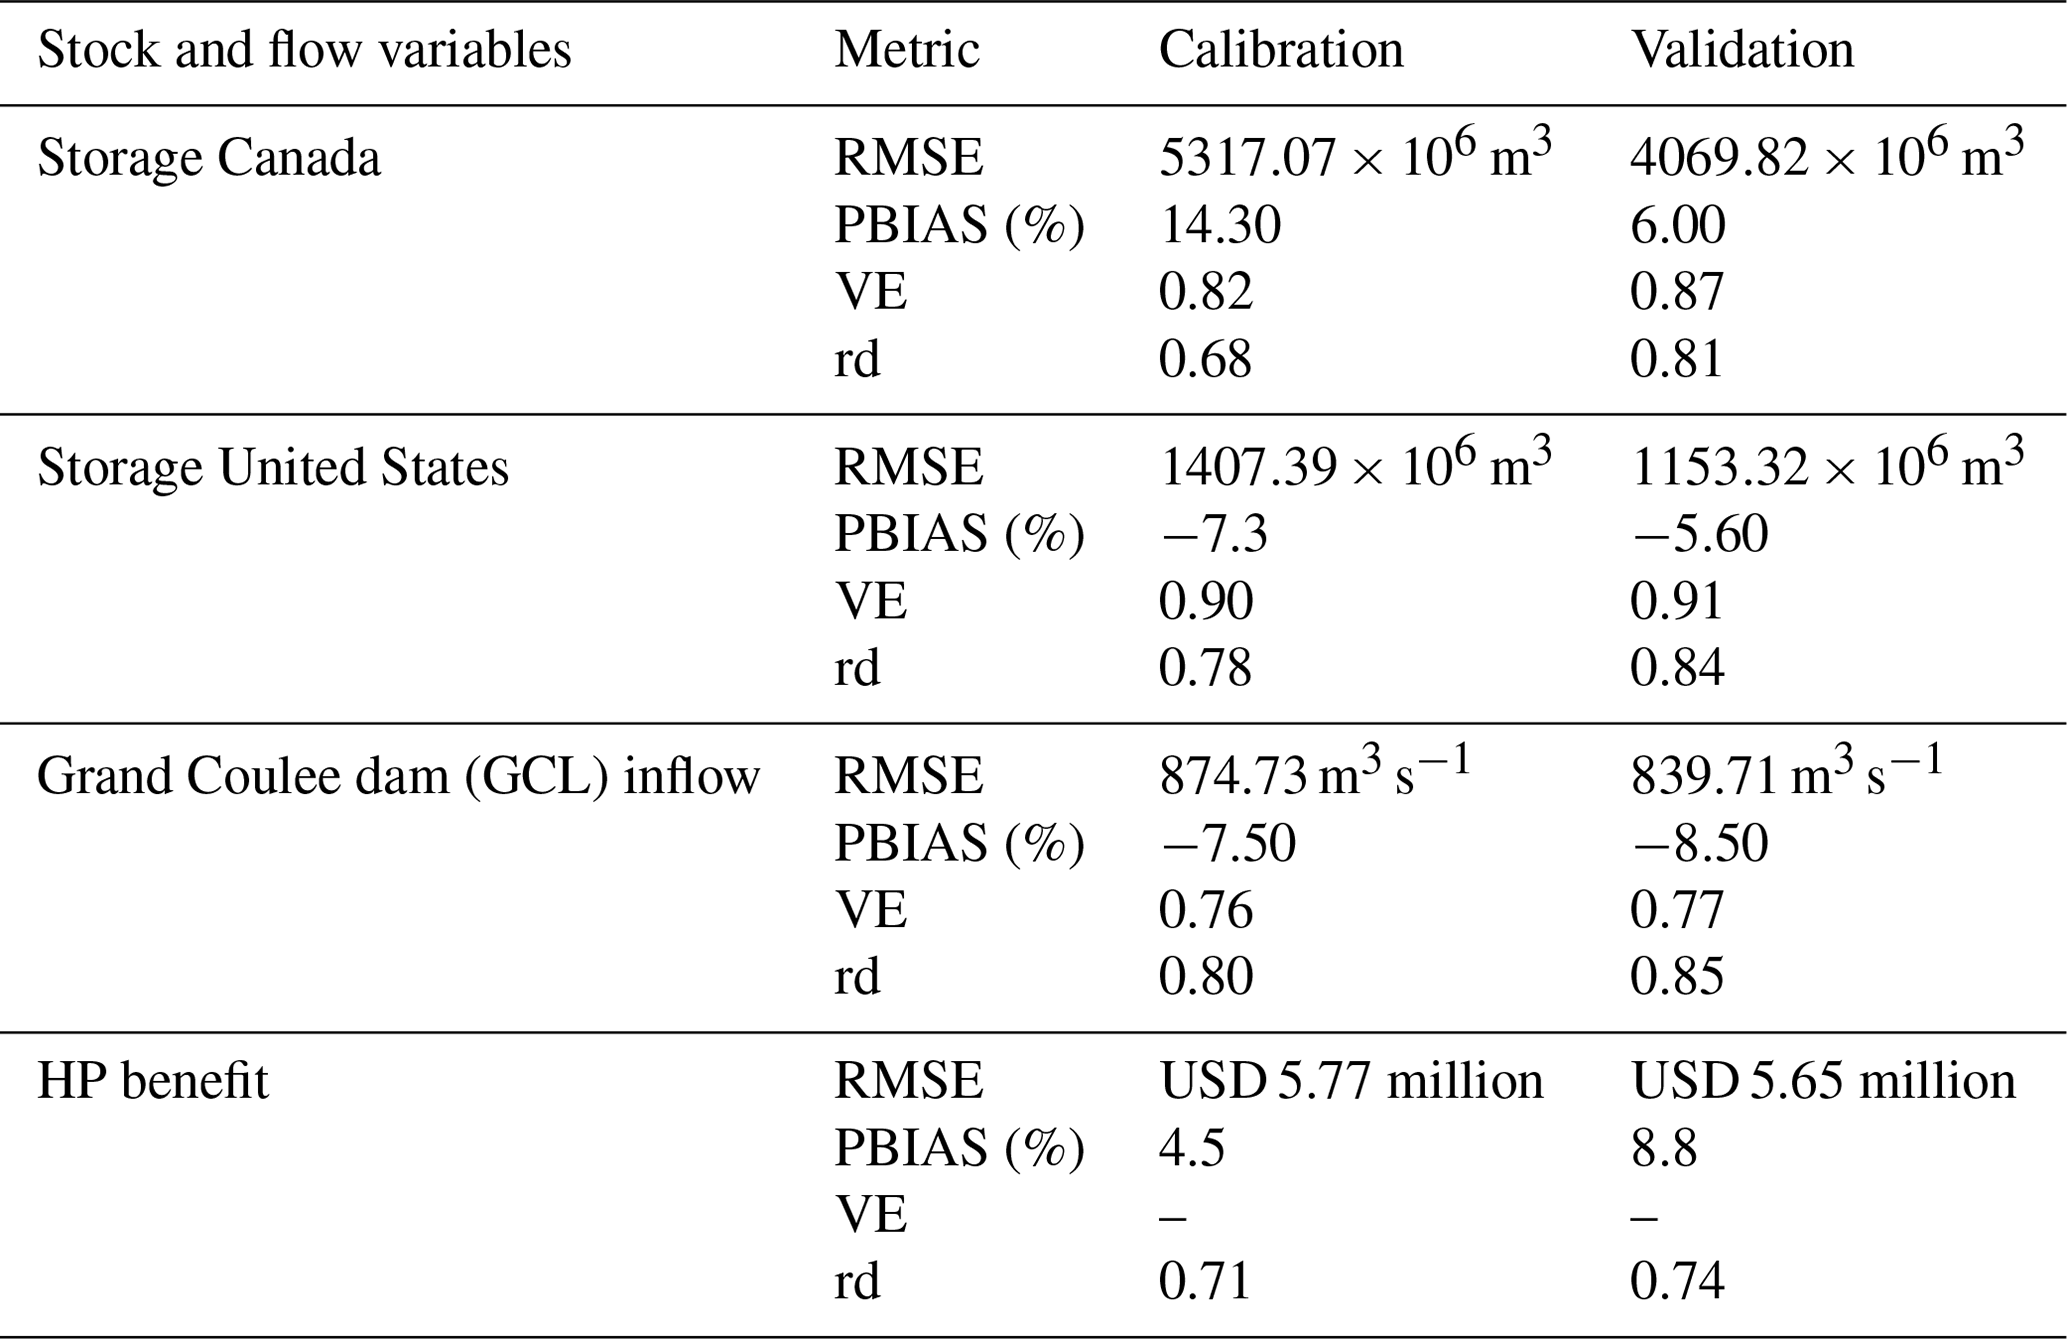
Table 4Calibration (1990–2005) and validation (2006–2017) result.
4.1 System dynamics model parameterization and testing
During the calibration period from 1990 to 2005 (and to the present) Canada and the United States have conformed to the treaty, irrespective of changes in benefit sharing and probability to cooperate. The selection of these social, economic, and behavioral parameters therefore represents conditions of cooperation regime. Based on the objective function, the goal was to calibrate the model to simulate reservoir levels that match past observations. Figure 5a–d show the simulated and observed time series, during 1990 to 2005, of the stock (storages) and flow (outflow) variables, along with the economic variable of hydropower benefits for the United States. The model performance metrics for the calibration period are shown in Table 4. The metrics show good calibration results with respect to all four metrics. The root mean square error and percent bias are minimal, and volumetric efficiency is higher, for both stock and flow variables. Although the magnitude of the RMSE is large, it is considered a good fit when compared proportionally with reservoir volumes, streamflow, and benefits.
As seen in Fig. 5a and b, the total reservoir capacity in the Canadian treaty dams far exceeds the capacity of the US treaty dams, and it is to be noted that the treaty flood control (FC) level in the Canadian dams is 28 387×106 m3 (equivalent to the 8.95×10⁶ AF (acre-feet) flood storage requested by the United States). Grand Coulee inflow is the primary input to the US storage. Thus, the observed and computed inflows are compared to ensure accurate model behavior (Fig. 5c). The hydropower benefit for Canada depends on US hydropower production due to the Canadian Entitlement; thus, only the benefit of the United States was selected for assessing the calibration results, as estimating hydropower benefit of the United States correctly is an important process in the model (Fig. 5d). Here, the Canadian Entitlement provided in terms of energy supply is converted into monetary units to compare hydropower with other benefits. The simulated hydropower production for the United States is compared to the observed cumulative energy production data retrieved from the U.S. Army Corps of Engineers database. The benefit in terms of the monetary value is obtained by multiplying the average unit cost (USD MWh−1) of energy by the hydropower quantity (MWh).
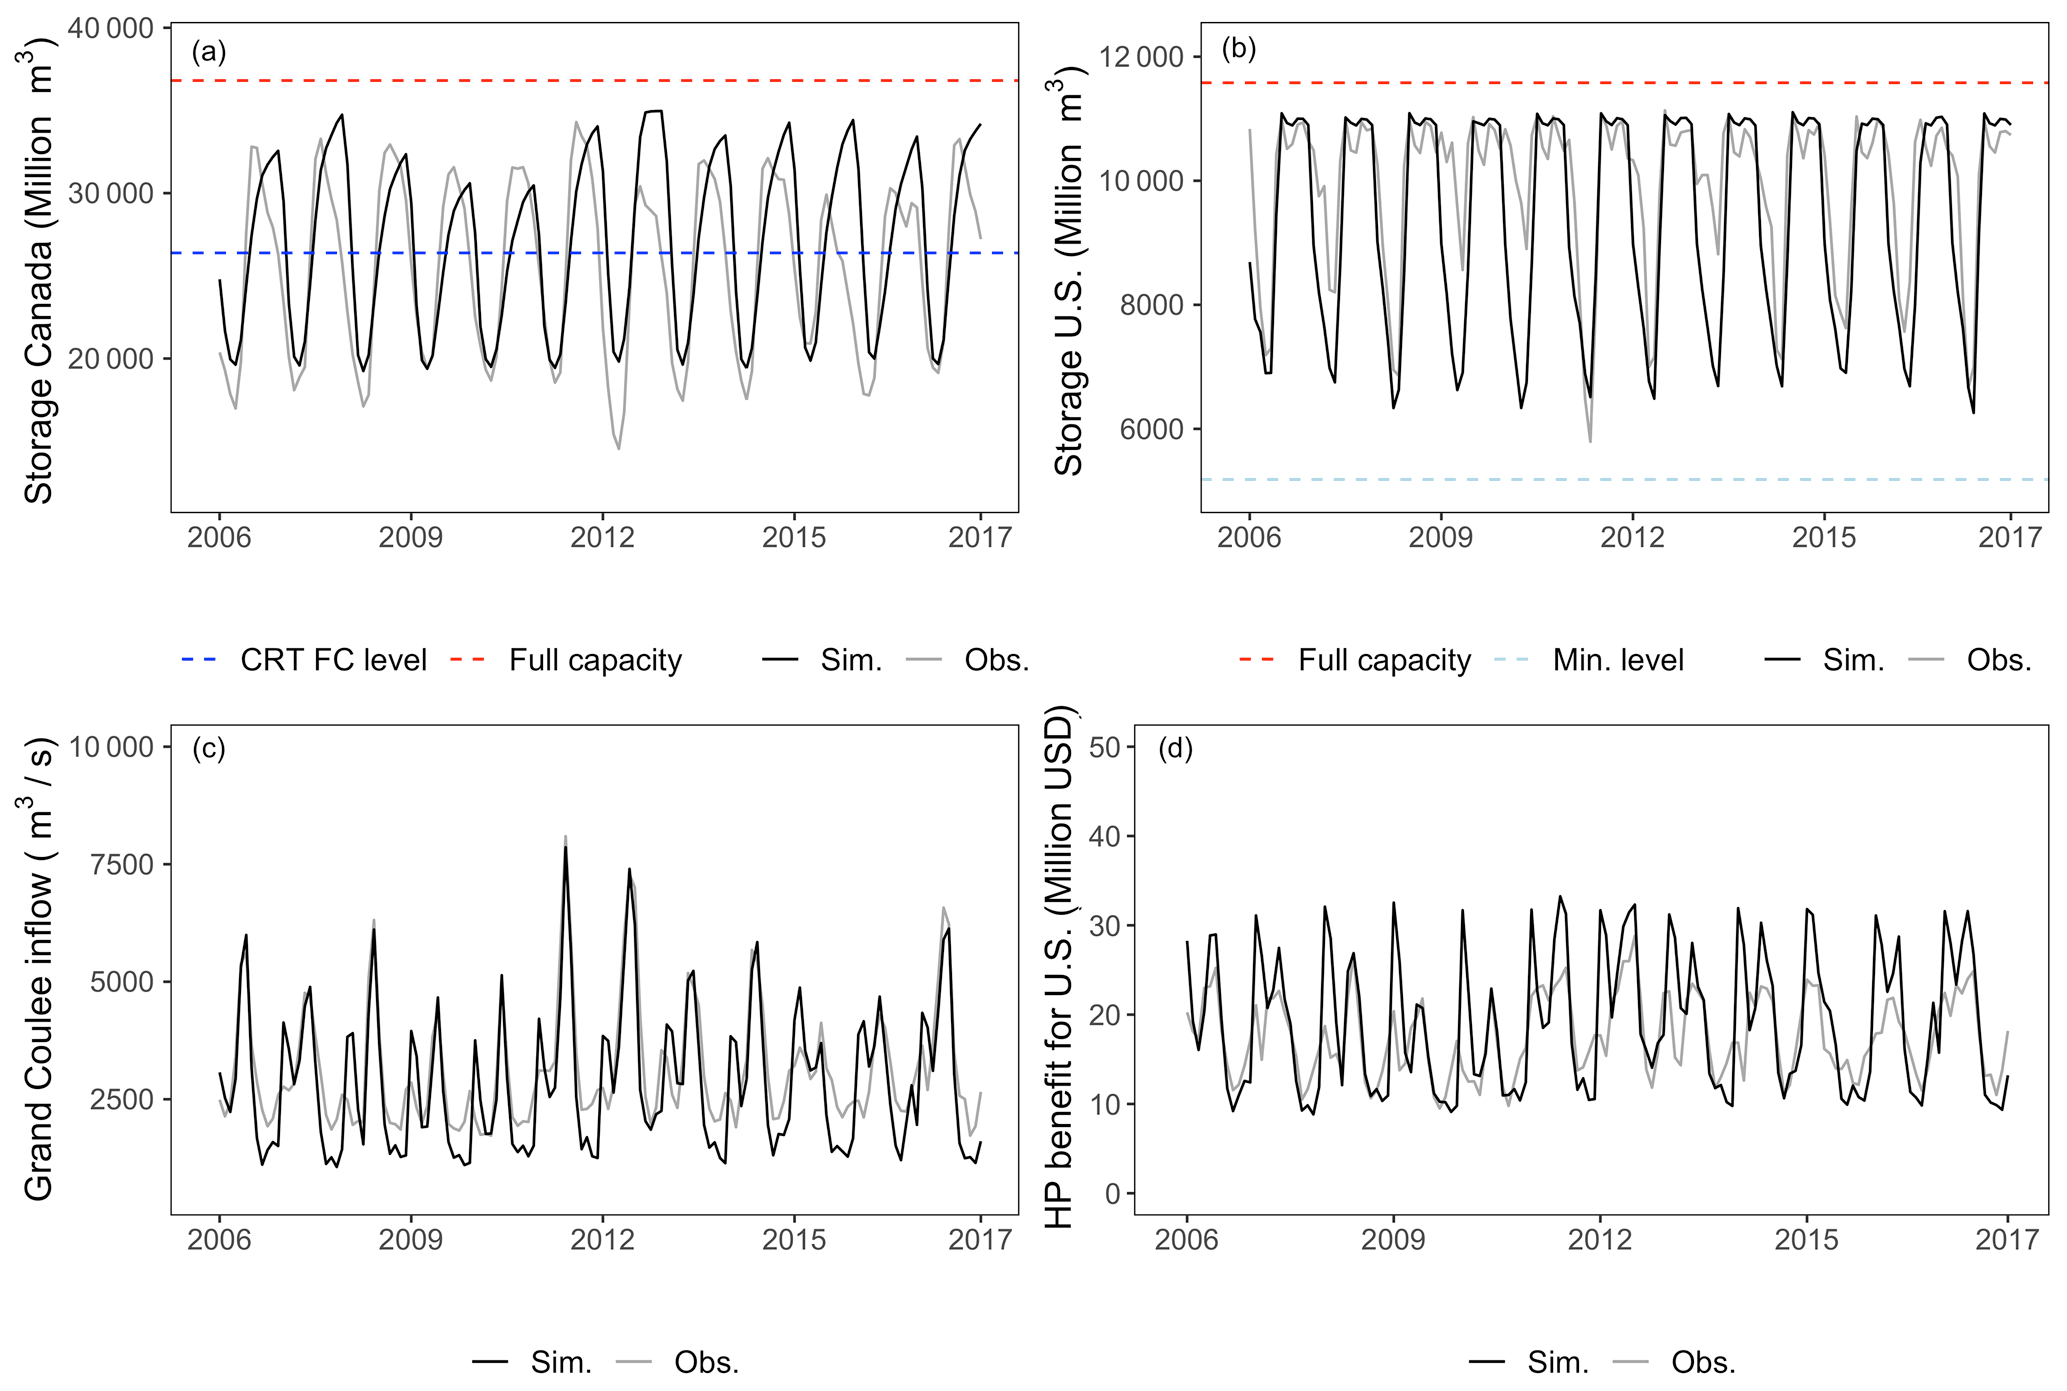
Figure 6Validation result 2006–2017 showing (a) Canadian storage, (b) US storage, (c) Grand Coulee inflow, and (d) hydropower benefit for the United States. Note that sim. – simulated, obs. – observed, full capacity – maximum capacity, CRT FC level – CRT flood protection target level, and min. level – minimum capacity for the US dams.
The model validation period was 12 years from 2006–2017 (Fig. 6a–d). Compared to calibration results, model validation presented slightly better results in terms of RMSE and PBIAS (Table 4). The simulated behavior of the reservoir level in Canada and the United States during calibration and validation is quite similar (Fig. 6a and b). In Canadian reservoirs, the model accurately simulates the maximum peaks, but the simulated low reservoir level is higher than the observed (Figs. 5a and 6a). Meanwhile, for the US reservoirs, the simulated lower reservoir level is lower than observed (Figs. 5b and 6b). It is to be noted that the actual operating rules for these dams are dynamic, based on seasonal changes and weather forecasts. In practice, they may change suddenly from the predetermined plan given unforeseen circumstances. Therefore, it is impossible to capture the exact behavior in a lumped model of this kind. The validation result for Grand Coulee inflow (Fig. 6c) and hydropower benefit for the United States (Fig. 6d) showed similar performance as the calibration period with the ability to simulate accurate model outputs.
PBIAS for both calibration and validation showed that the result is close to optimal, and Grand Coulee inflow showed the best fit with the PBIAS value that is closest to 0. VE is only applied to the reservoir volumes and streamflow, as per the suitability of the metric. VE values are greater than 0.72, suggesting a good fit. Similarly, agreement index or rd values indicated better performance for all the comparisons, except for Canadian storage. The result of these metrics show that the model is able to replicate and predict the desired behavior.
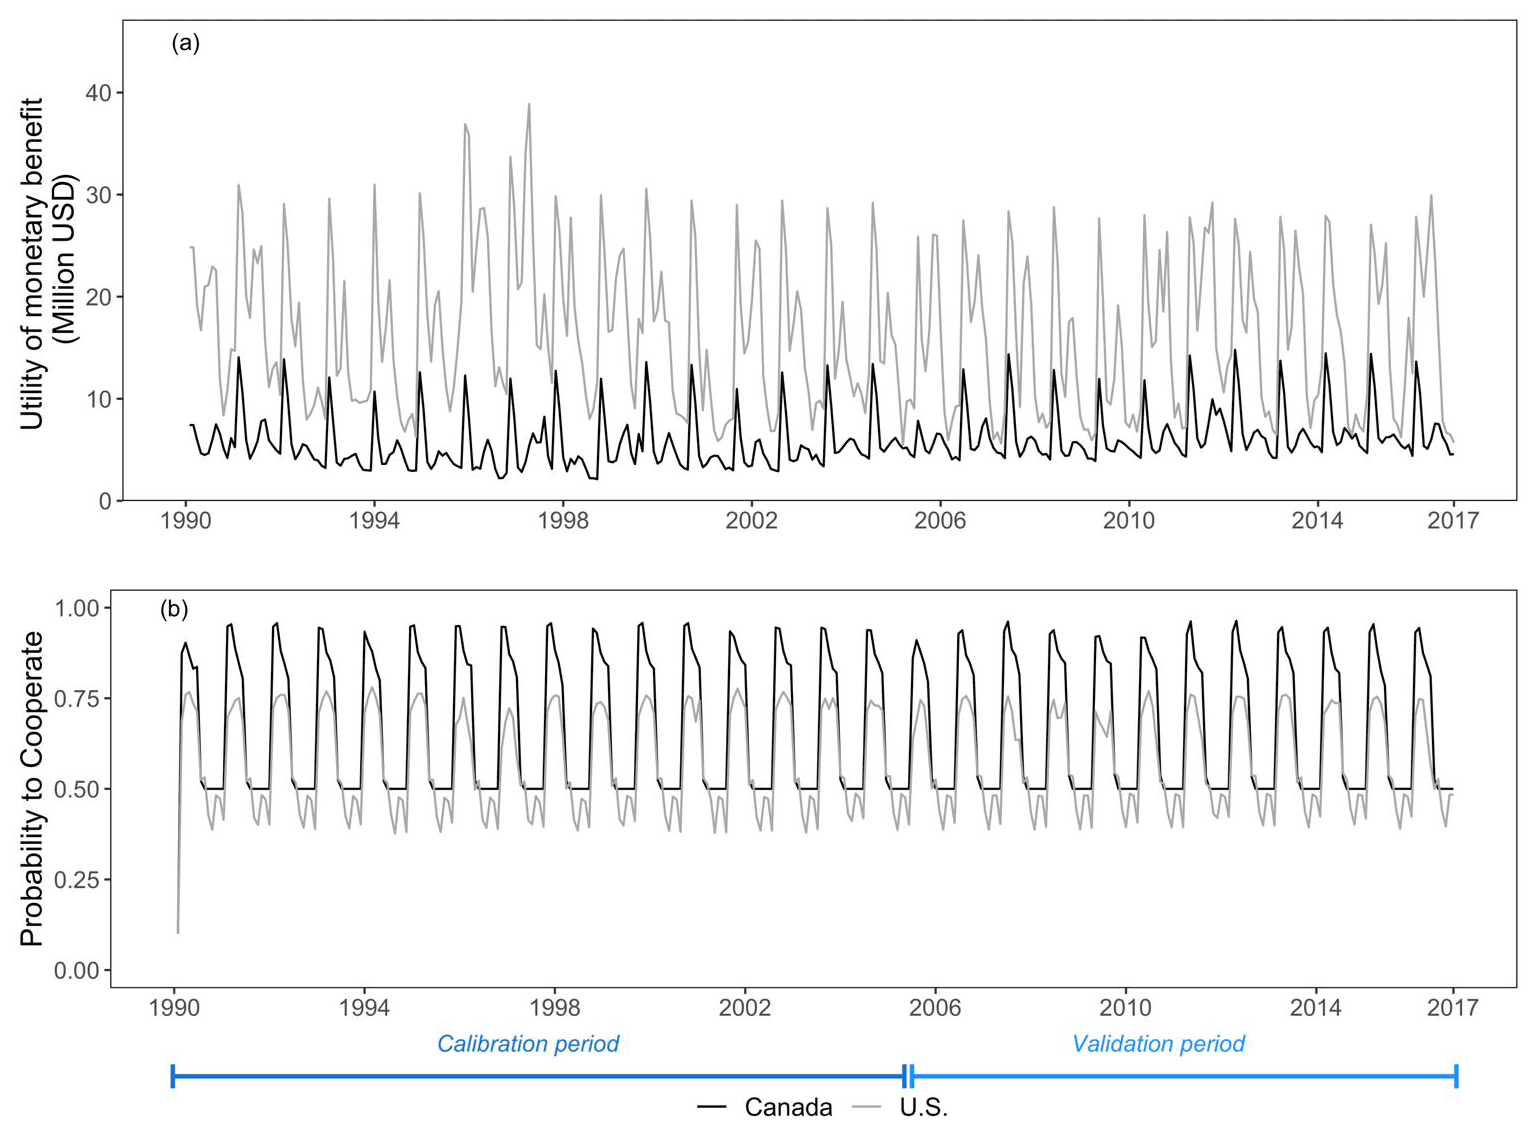
Figure 7Change in (a) the utility of monetary benefit and (b) probability to cooperate during calibration and validation period for Canada and the United States. Note that the lower initial probability to cooperate during 1990 is only due to the warmup period of model simulations.
Figure 7a and b show the utility of monetary benefit and dynamics of the probability to cooperate for the United States and Canada during the calibration and validation periods. This model simulation with calibrated parameters over 1990 to 2017 is also referred to as baseline in the next section. The share of benefits that the United States receives is higher than the benefit in Canada, relatively, despite the Canadian Entitlement (Fig. 7a). The minimum probabilities to cooperate for the Canada converge at 0.5 and for the United States at 0.4, while peak amplitude for cooperation dynamics is higher for Canada compared to the United States (Fig. 7b). During each time step, the probability to cooperation changes, as shown in Eqs. (12) and (13). The periodicity in the probability to cooperation is due to the seasonality in the streamflow pattern. It is to be noted that for the key decisions regarding the reservoir operations, the peak amplitude is the deciding criterion.
4.2 Scenario analysis
The scenario analysis results presented below are based on environmental and institutional change and social preferences. The scenario analysis covers the same time period from 1990 to 2017, utilizing observed inflow, tributary streamflow, and storages, and the same initial conditions as these simulations are not for projection but rather to gain a deeper understanding of dynamics in the socio-hydrological system.
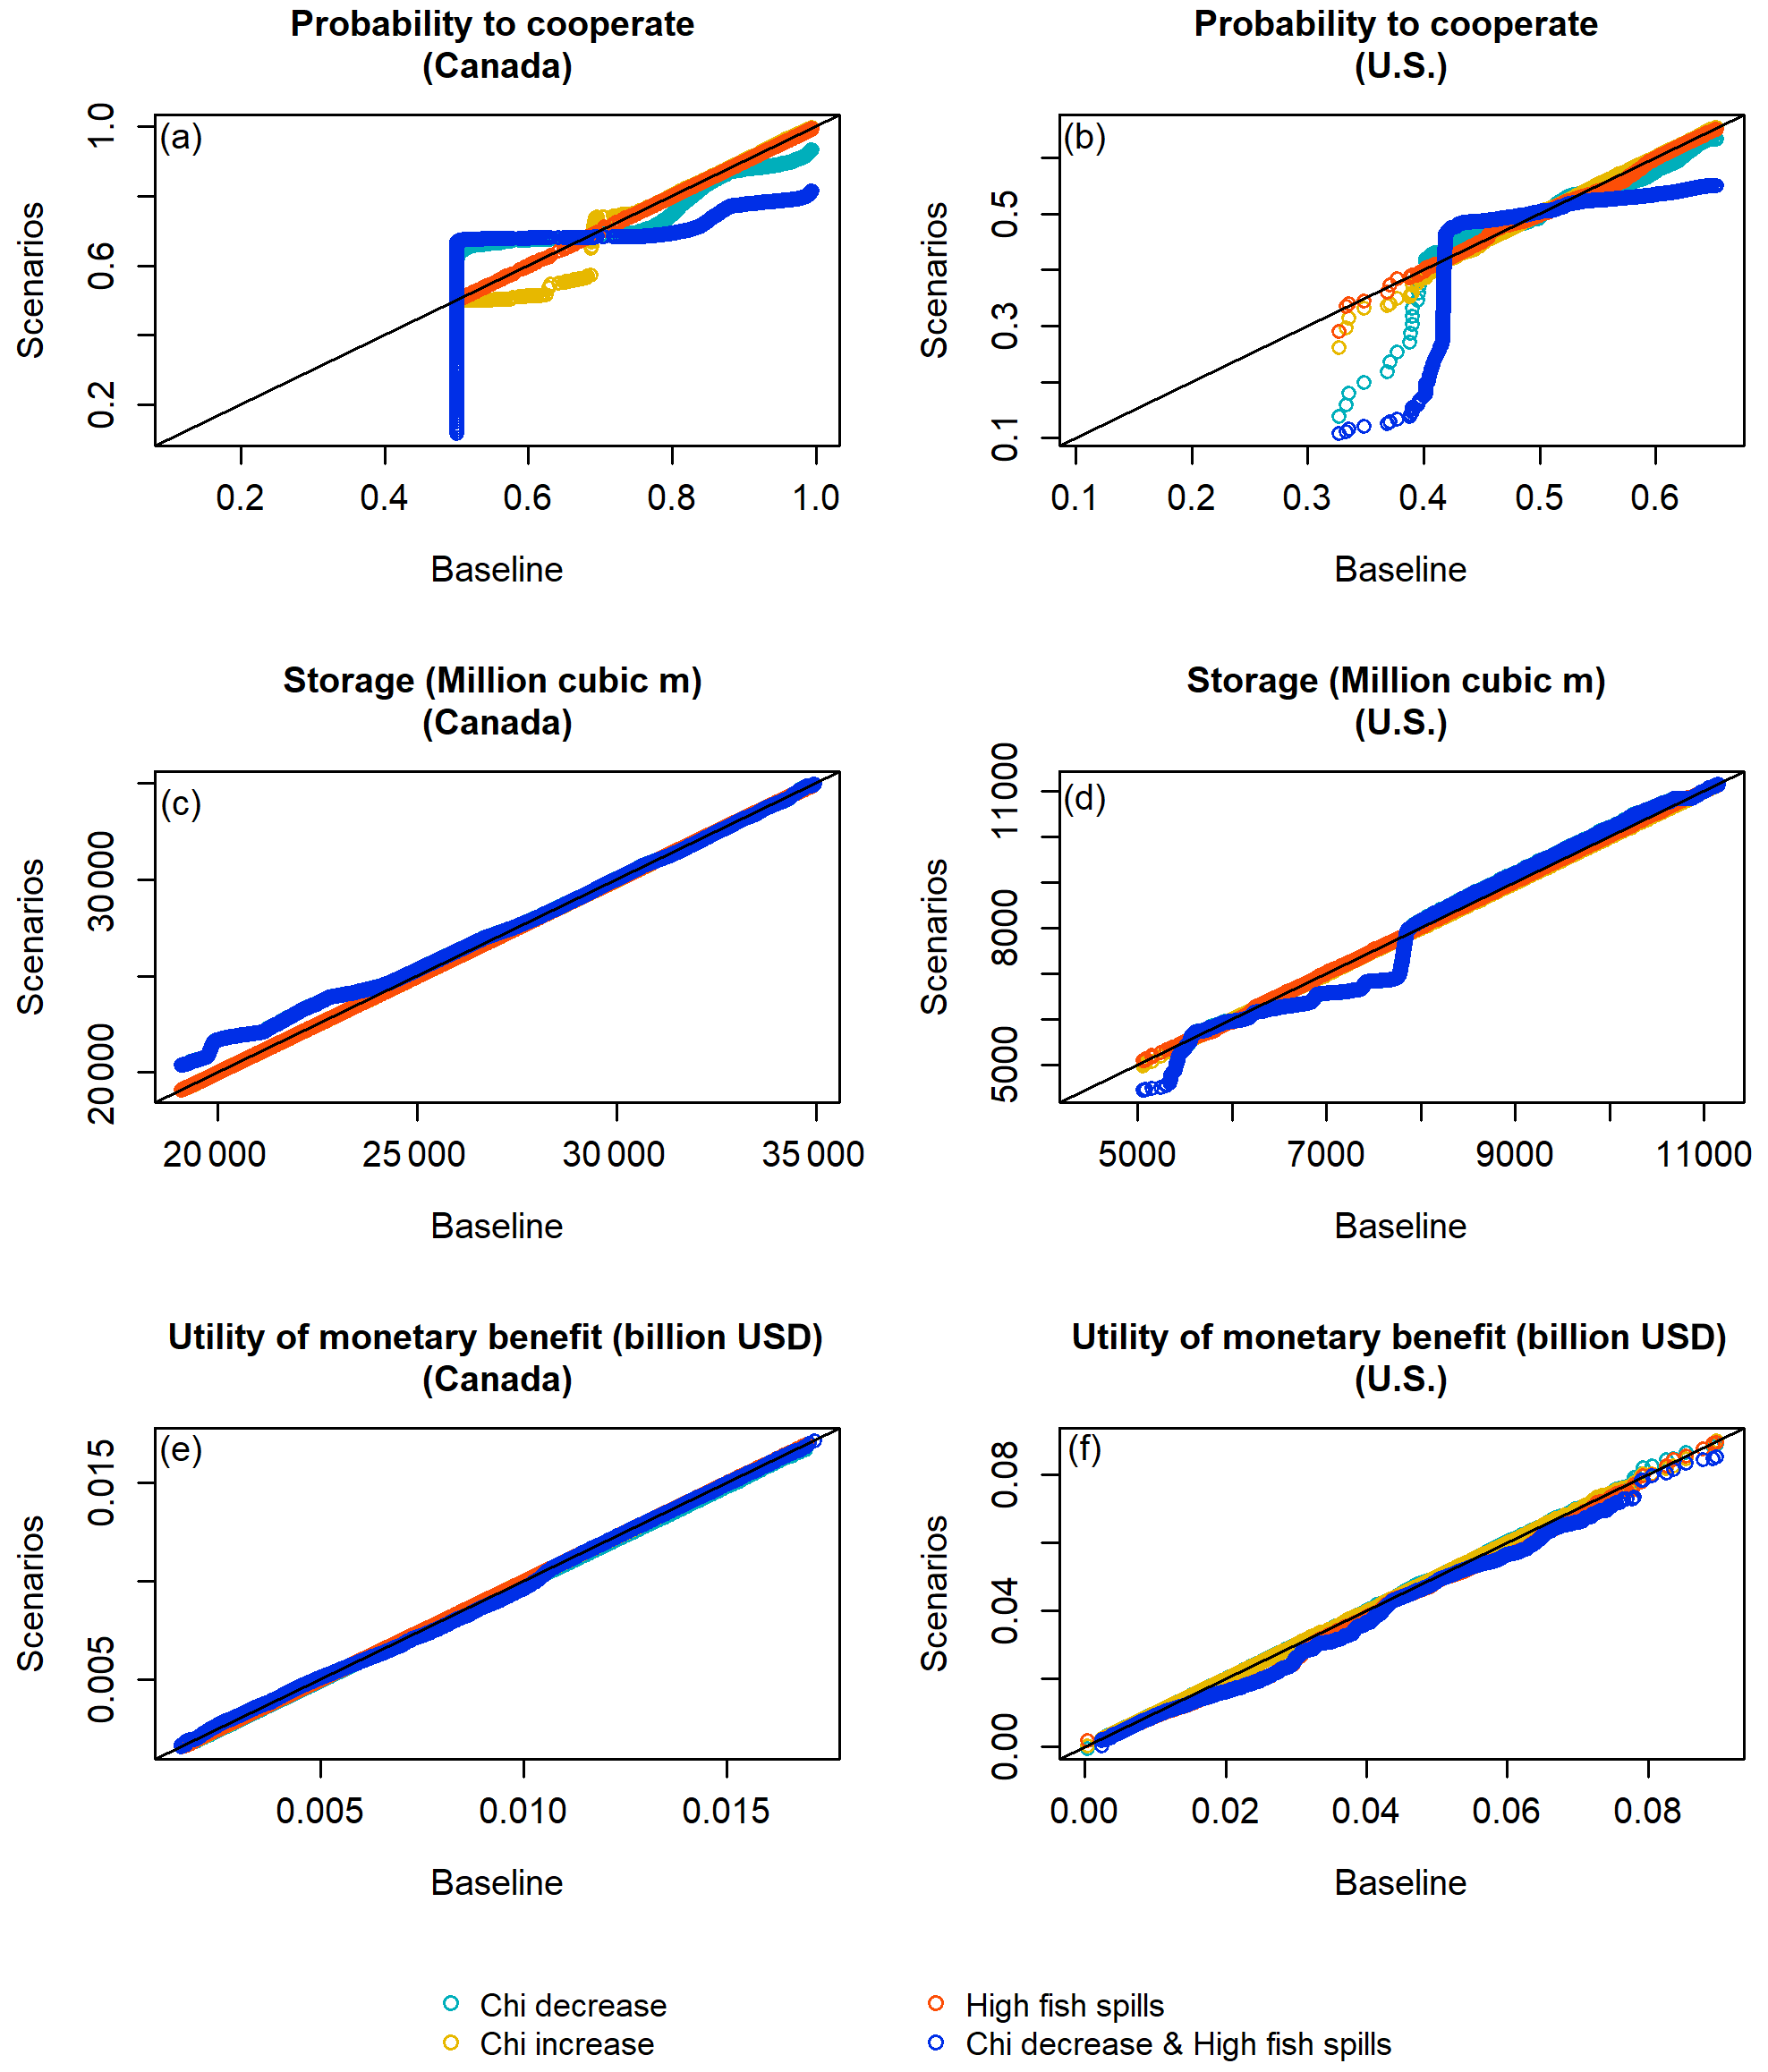
Figure 8Quantile–quantile plot of the baseline versus other scenarios (χ decrease, χ increase, high fish spills, and combined χ decrease and high fish spills) comparing probabilities to cooperate, reservoir storage volumes, and utility of monetary benefits.
4.2.1 Scenarios based on environmental and institutional change
The four scenarios tested here are based on changes in environmental and institutional conditions. The results are compared with the baseline scenario, which represents cooperation between both countries. In the quantile-quantile plot (Fig. 8a–f), the baseline scenario is shown on the horizontal axis and four scenarios on the vertical axis, where each point represents a time step. The scenario “χ decreases” significantly reduces the probabilities to cooperate for both countries as the maximum CCA reduced from 0.9 to 0.8 and maximum CUS reduced from 0.7 to 0.6. Reducing χ showed that the maximum as well as minimum probability to cooperate or CCA reduces. The probability to cooperate for Canada under the “χ decreases” scenario is similar to the “χ decreases and high fish spills” scenario (Fig. 8a); thus blue and cyan points mostly overlap. Similar results were seen for the US probability to cooperate (Fig. 8b). Lowering the χ resulted in lower CCA, and, therefore, Canada would be expected to increase the level of storage in its dams to produce more hydropower as compared to the baseline (Fig. 8c). This could mean the Canada maintains its reservoir at ∼ 1300×106 m3 higher than in baseline. Lowering the χ impacted CUS too, along with CCA, because, if Canada increased its hydropower production, the United States would have to provide its own flood control. Therefore, reservoir levels in the United States would decrease as compared to the baseline when χ decreases (Fig. 8d). Since Canada would produce its own hydropower in this scenario, the monetary benefit slightly increases or remains similar compared to the baseline at the daily timescale, and the result is similar to the “χ decreases and high fish spills” scenario for Canada (Fig. 8e).
The change in χ represents the higher or lower rate of change in probability to cooperate. The “χ increases” scenario indicates better institutional capacity that favors cooperation to either maintain its highest level or increase in the magnitude for cooperation. Maintaining the highest level of the probability to cooperate is most important, which determines the storage thresholds. Increasing χ helped maintain the maximum probabilities to cooperate (i.e., CCA and CUS) and also slightly increase its magnitude (Fig. 8a and b). With increasing χ, Canada would continuously provide flood control to the United States as agreed upon in the CRT; hence storage level remains similar to the baseline (Fig. 8c). In addition, the United States continues its existing operations to produce maximum hydropower; hence the storage level in the United States remains the same as in the baseline (Fig. 8d). With increasing χ, Canada's and the United States' benefit continues to be the same as the baseline (Fig. 8e). When χ increases or decreases, the utility benefit that the United States receives does not change significantly. This is due to the United States balancing the increased flood damage control, while hydropower production is compromised.
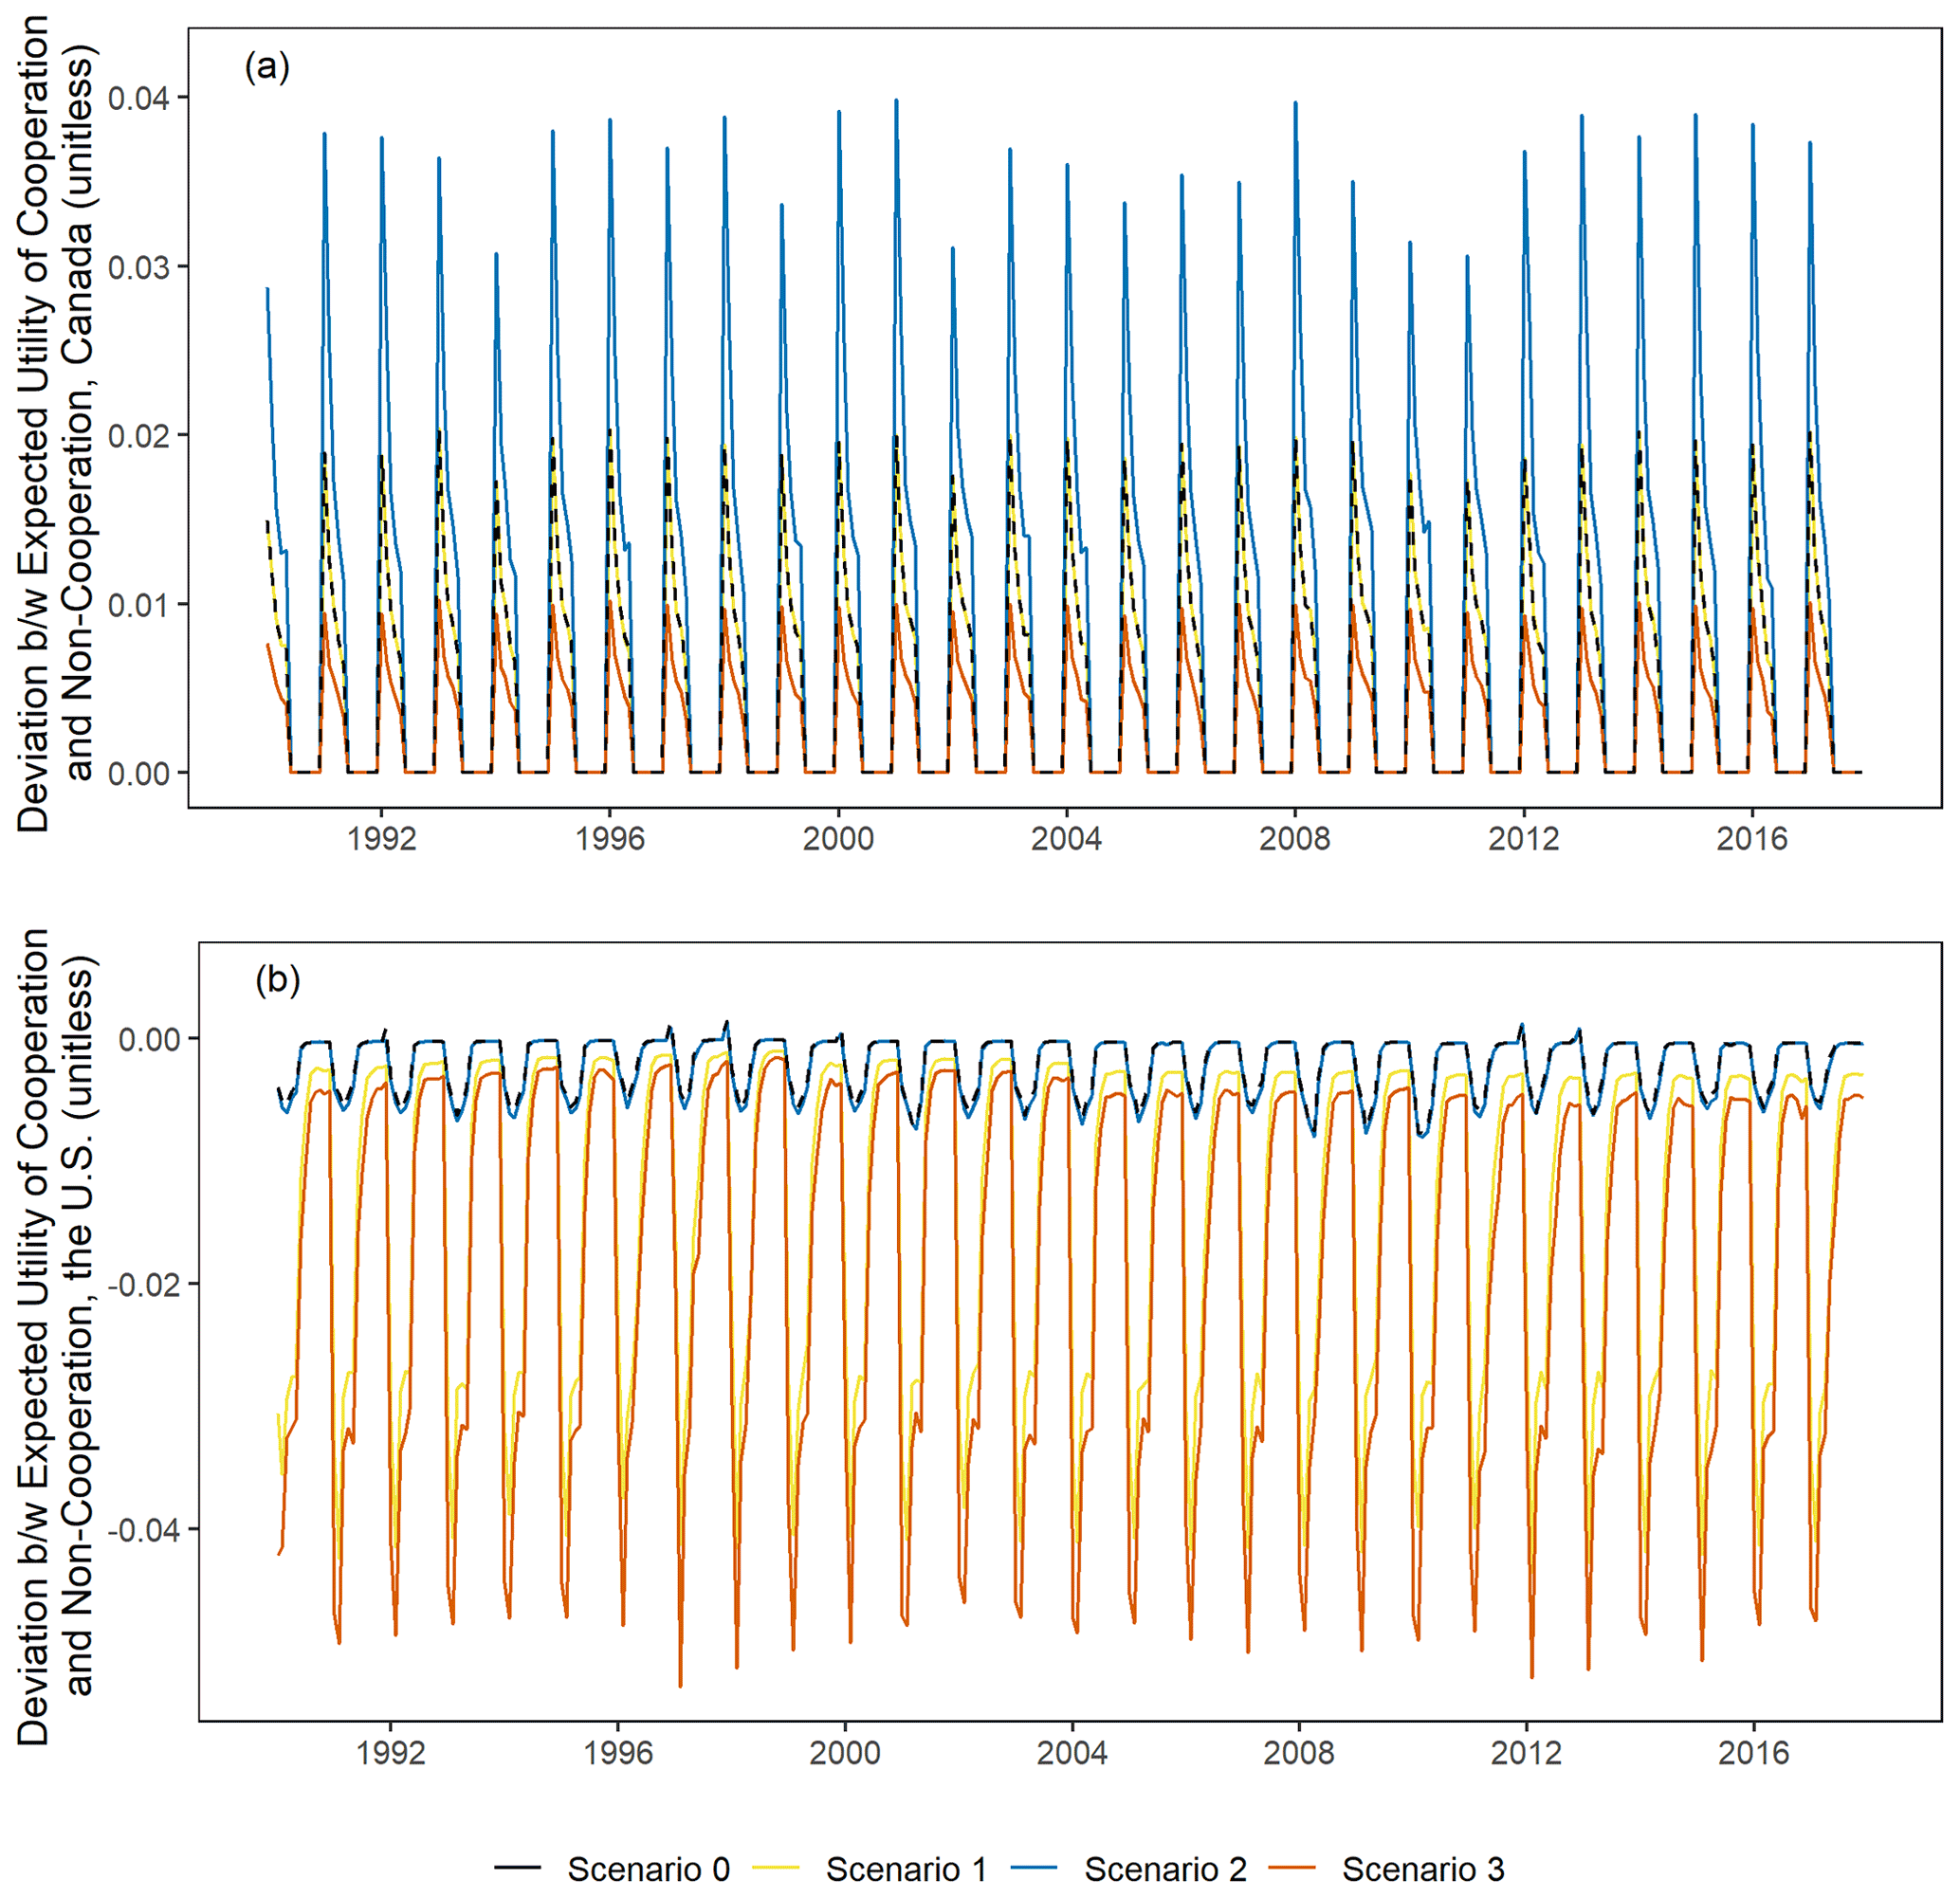
Figure 9The differences between the expected utility of cooperation and no cooperation from each country according to different scenarios for (a) Canada and (b) the United States.
The “high fish spills” scenario refers to strict regulation to protect fish passage along the Columbia River, which has negative implications for hydropower production. Increasing fish spills in US dams has no effect on the Canadian probability to cooperate (CCA) as it does not affect Canadian dam operation (Fig. 8a). Increasing the fish spills decreases peak CUS slightly, but the average remained similar to the baseline (Fig. 8b). This also does not affect the reservoir operation and storage level in the US dams (Fig. 8d), but monetary benefit for the US decreases due to regulation as water is diverted from the hydropower turbines (Fig. 8f). It could mean the loss of ∼ 6000–26 000 MWh worth of hydropower benefits. It is to be noted that this loss of hydropower production affects the United States but has no effect on Canadian benefit because the United States remains obligated to pay the Canadian Entitlement, even if hydropower production is lower. The combined scenario of ``χ decreases and high fish spills” has similar results to the “χ decreases” scenario (Fig. 8a–e), but reduction in monetary benefit is slightly higher compared to the “χ decreases” and “high fish spills” scenarios.
4.2.2 Scenario analysis in terms of social preferences
In addition to the scenarios above, four different scenarios of social preferences were tested and compared to each other. Figure 9 shows the differences between the expected utility of cooperation and non-cooperation from each country according to different scenarios.

Figure 10The probability to cooperate of each country according to different scenarios: (a) Scenario 1, (b) Scenario 2, and (c) Scenario 3.
Figure 10a–c show the changes in the probability to cooperation (CCA and CUS) according to the different configurations of social preferences. As shown in Fig. 10a–c, Canada's probability of cooperation is always higher than 0.5 in all scenarios because Canada can get higher expected utility when it chooses to cooperate, no matter which behavioral types the two countries possess. This explains why the probability to cooperate in Canada is always higher than the United States in Fig. 10a–c. Conversely, since the expected utility of cooperation in the United States is always smaller than the expected utility of non-cooperation in Fig. 9b, the probability of cooperation of the United States is always less than Canada (Fig. 10a–c).
Comparing Scenario 0 and Scenario 1 from the standpoint of Canada, we found that there was no difference in the outputs between Scenario 0 and Scenario 1 (Fig. 10a). This means that a decrease in the guilt coefficient of the United States does not affect Canadian decision-making on whether to cooperate or not. However, in Scenario 2, the gap between the expected utilities with cooperation and without cooperation widens, and Canada is more likely to continue cooperating when Canada feels more jealousy (more sensitive to disadvantageous inequity) (Fig. 9a). From the standpoint of Canada, it is always economically beneficial to cooperate with the United States because Canada can receive the entitlement from the United States under the CRT. In other words, the more unfair the distribution of material benefits between Canada and the United States, and the greater the jealousy of Canada, the more Canada will be motivated to cooperate due to the Canadian Entitlement (Fig. 10b). In Scenario 3, the differences between the expected utility of cooperation and non-cooperation decrease compared to Scenario 0 if Canada does not care about the counterpart's payoffs and focuses on its own payoffs (Fig. 9a). Cooperation will decline as Canada is narrowly self-interested in the fair distribution of material payoffs (Fig. 10c). In terms of cooperation, selfishness is worse than jealousy.
From the standpoint of United States, there was no difference between Scenario 0 and Scenario 2 in terms of outputs (Fig. 10b). This implies that a rise in Canada's jealousy coefficient has no effect on the decision of United States of whether to cooperate. Comparing Scenario 0 and Scenario 1, the difference between expected utilities with and without cooperation is expanded, but the expected utilities of non-cooperation are larger than those of cooperation (Fig. 9b). As a result, the United States is less inclined to cooperate in the future when it feels less guilty (less sensitive to advantageous inequity) (Fig. 10a). In other words, the more material benefits Canada receives, and the less guilt the United States has, the more driven the United States will be motivated to break the treaty. Like Scenario 3, if the United States does not care about the counterpart's payoffs and focuses on its own payoffs, the relative magnitude of expected utility of cooperation will decrease. As the guilt of the United States decreases, the United States becomes less concerned about a “fair deal” with Canada and loses the motivation to continue cooperation. Therefore, the United States can maximize its profits by halting cooperation (not paying the Canadian Entitlement) and operating unilaterally.
Since Canada gets the entitlement due to the CRT, Canada is likely to continue cooperating. If the US preference for a fair distribution of benefits declines during future CRT negotiations, such as in Scenario 1 and Scenario 3, the United States is more likely to break the treaty or change its stance on the Canadian Entitlement. That does not mean that the United States has zero or negative benefit from the CRT. The United States has some benefits, but it would not continue to cooperate because the benefits of not cooperating are greater than the benefits of cooperating. As environmental concerns increase, the net benefit of the United States is expected to decline further because of lower hydropower benefit, so the United States is less likely to agree with continuation of the treaty until it is changed to create greater benefits for the United States from cooperation.
The CRT is regarded as one of the most successful transboundary river agreements. As the upstream and downstream actors, Canada and the United States have asymmetric access to water resources and different positions with regard to the risk of floods and potential for hydropower production. Within the Columbia River basin, Canada is less susceptible to flood risk relative to the United States, and the United States has capacity for higher hydropower production relative to Canada. The unique feature of the CRT is that the two countries developed a plan to manage the river as a unified system and to share the costs and benefits equitably (Bankes and Cosens, 2012; Shurts and Paisley, 2013). This collective sharing of risks from flooding and benefit from hydropower as indicated by Wolf (2007) and Zeitoun et al. (2013) makes the CRT successful among other transboundary river treaties. This study examines the dynamics of cooperation and how it is affected by feedback between humans and natural systems. It is important to understand the underlying drivers of a successful cooperative regime and the factors that influence each country's choice about whether to cooperate or not. The provisions of the CRT expire in 2024, and negotiations for the next phase of the treaty are ongoing. There have been many prominent discussions about what the future of the treaty should look like, including issues related to hydropower generation versus fish and how to account for spills (Blumm and Deroy, 2019; Harman and Stewardson, 2005; Leonard et al., 2015; Muckleston, 1990; Northwest Power and Conservation Council, 2019; United States Government Accountability Office, 2018). Additionally, both countries perceive imbalances in the benefits that are received from the CRT relative to what each deserves or compared to what they perceive the other side's benefits to be (Holm, 2017; Stern, 2018). As discussed in Gain et al. (2021) and Gober and Wheater (2014), the success in treaties or institutions managing river basins depends not only on the control of hydrology, but also on consideration of socio-political dynamics. This study shows that addressing emerging social and environmental issues are critical to continued cooperation, providing valuable insights for the current renegotiation process, as well as future treaty negotiations on transboundary waterways similar to the Columbia River.
Natural and social systems evolve over time. Under unforeseen and uncertain changes, the balance of these systems could shift. A subtle social change can be induced by environmental and hydrological changes, which in turn lead to further unforeseen changes in hydrologic or physical systems. For the Columbia River basin, sudden change in cooperation and deviation from cooperation to conflict is not anticipated because both countries that have similar economy and political power and have shared values, common interests, and multi-layered economic ties. The socio-hydrological system dynamics model developed for this study captures the dynamics of cooperation to reflect external perturbations. Explicitly incorporating the probability to cooperate CCA and CUS (Eqs. 5 and 6) into the model enables exploration of the factors influencing cooperation. This study further illustrates the utility of simplified lumped models in understanding complex systems.
This socio-hydrological model presented here further allowed for the exploration of scenarios under environmental and institutional changes and social preferences, to understand how robust the cooperation on this transboundary waterway is. These scenarios represent current and plausible future socio-political and environmental changes. We found that institutional capacity (χ) plays an important role in long-term cooperation (Figs. 8a, b and S17). Stronger environmental regulation for increased fish spills affects the benefit for the United States but not as substantially as when χ (institutional capacity) decreases. Canada continues to receive payment through the Canadian Entitlement, even when the United States is producing less hydropower, something that is interesting to explore further for future negotiations of the CRT. Different configurations of social preferences for the behavioral model of Canada and United States were used to demonstrate how the probability to cooperate changes. The expected utility of cooperation as compared to expected utility of non-cooperation is higher for Canada and lower for the United States (Fig. 9). Thus, the probability to cooperate was simulated to be higher for Canada. The results show that both the guilt coefficient of the United States and the jealousy coefficient of Canada affect the level of cooperation. For future CRT negotiations, the ideas considered in this study could help provide insight into the long-term dynamics of cooperation and the impacts of benefit sharing. For other transboundary rivers, e.g., along Nepal and India, Bangladesh and India, or India and Pakistan (Ho, 2016; Mirumachi, 2013; Saklani et al., 2020; Thomas, 2017; Uprety and Salman, 2011), the jealousy and guilty coefficient between actors and their social preferences will not be the same as in Columbia River basin. Similarly, the tipping points for the balance of cooperation arising from environmental and social change could be different, and this warrants future research in other transboundary river basins. Our approach of integrating concept of behavioral science such as social preferences is suitable, particularly (and extendable) in cases when reciprocity between actors is the main driver for cooperation and where system operates to share benefits equitably while ensuring the resources are sustainable.
This socio-hydrological system dynamics model can be further improved by considering additional variables related to climate change, land use change, and water use regime changes. The key limitation of this study is the explicit consideration of water use for hydropower production and flood control only. The study does not consider future projections of these variables, which would be a possible direction for future research. Another limitation is the method of estimation of flood damages. We estimated the economic benefits involving flood damage prevention, which does not include the monetary benefit of flood control in Canada due to treaty dams because little information is available in the scientific literature and official reports, and existing resources indicate significantly less flood damage in Canada relative to the United States (BC Ministry of Energy and Mines, 2013; Northwest Power and Conservation Council, 2022). However, future studies should investigate the magnitude of this benefit since there are certainly flood risks averted by Canadian storage.
As mentioned previously, the results of this study can help inform the renegotiation of the CRT in two ways: (1) the methods of modeling the hydrological and social systems in tandem, and using behavioral economics, could be used to help formulate policies or management priorities, and (2) understanding of the connection between the share of benefits received by each side and cooperation can support negotiation discussions to find solutions that would satisfy both sides. More generally, the model demonstrates that understanding the motivations of each country in terms of guilt and jealousy might provide insight into the factors driving each country and the thresholds that might influence their decision about whether to cooperate. We also find that it is of great importance to maintain institutional strength in support of cooperation.
Unlike the United States and Canada where a non-cooperative regime or resort to direct conflict is unanticipated, even if the benefits are perceived to be severely imbalanced, there are many other river basins where different environmental challenges are evolving (UNEP, 2016), and political tensions are high. Globally, conflicts do arise between countries that share a water source, with root causes that extend far beyond the water system (Sadoff and Grey, 2002). However, transboundary rivers support the livelihoods of millions of people, preserve ecosystems, and provide a vital resource that needs to be managed sustainably. Using the methodologies presented in this study and the insights gained could be applied to other river basins around the world to help us understand what behaviors and benefits are driving choices about cooperation.
Data supporting the conclusions in this paper are publicly available at Environment Canada (2022; https://wateroffice.ec.gc.ca/mainmenu/historical_data_index_e.html, last access: 1 July 2022), the Bonneville Power Administration (2020; https://www.bpa.gov/p/Power-Products/Historical-Streamflow-Data/Pages/Monthly-Data.aspx, last access: 1 July 2020), the U.S. Army Corps of Engineers (https://www.nwd-wc.usace.army.mil/dd/common/dataquery/www/, last access: 1 July 2022; USACE, 2022; https://usace.contentdm.oclc.org/digital/collection/p266001coll1/id/3193/, last access: 10 August 2022; USACE, 2013), and the United States Geological Survey (USGS, 2022; https://waterdata.usgs.gov/nwis/uv?14105700, last access: 1 July 2022). Other processed data are available on request from the corresponding author (ashres15@asu.edu).
The supplement related to this article is available online at: https://doi.org/10.5194/hess-26-4893-2022-supplement.
AS, FAAS, SP, and CC planned this work as participants of “Socio-Hydrology Summer Institute on Transboundary Rivers”. AS focused on model development and analysis, FAAS and AS focused on data collection and data analysis, SP focused on behavior economics, and CC focused on review and synthesizing the Columbia River Treaty. AS, FAAS, SP, and CC conceptualized the system dynamics framework, FAAS and AS formulated stock and flow equations, SP formulated cooperation dynamics equations, and AS, FAAS, and SP formulated hydropower and flood control benefit equations. CC conducted assessment of past and current issues affecting treaty renegotiation, AS wrote the model script and performed model testing, scenario analysis, and data visualization, and SP performed social preference scenario analysis and assessment. AS, FAAS, SP, and CC wrote the manuscript draft, AS revised the manuscript, and MG, DJY, and EMM provided guidance and funding and reviewed and edited the manuscript.
The contact author has declared that none of the authors has any competing interests.
Publisher's note: Copernicus Publications remains neutral with regard to jurisdictional claims in published maps and institutional affiliations.
This article is part of the special issue “Socio-hydrology and transboundary rivers”. It is not associated with a conference.
We acknowledge “Summer Institute on Socio-hydrology and Transboundary Rivers” held in Yunnan University, China, in 2019, and Jing Wei for support and feedback. We also acknowledge our professors – Giuliano Di Baldassarre, Günter Blöschl, Megan Konar, Amin Elshorbagy, Fuqiang Tian, and Murugesu Sivapalan – for their feedback we received during and after the institute.
Ashish Shrestha was supported by Margaret Garcia's startup funds from Arizona State University. Margaret Garcia was supported by the National Science Foundation grant: Cross-Scale Interactions & the Design of Adaptive Reservoir Operations (CMMI-1913920). Samuel Park and David J. Yu were supported by NSF CMMI 1913665 and a Purdue Research Foundation (PRF) Grant.
This research has been supported by the National Science Foundation (grant nos. CMMI-1913920 and CMMI-1913665).
This paper was edited by Fuqiang Tian and reviewed by two anonymous referees.
Abraham, A. and Ramachandran, P.: Stable Agreements with Fixed Payments on Transboundary Flood Prone Rivers, in: Contemporary Issues in Group Decision and Negotiation. GDN 2021, Toronto, ON, Canada, June 6–10. Lecture Notes in Business Information Processing, vol. 420, edited by: Morais, D. C., Fang, L., and Horita, M., Springer, Cham, https://doi.org/10.1007/978-3-030-77208-6_8, 2021.
Bankes, N.: Flood Control Regime of the Columbia River Treaty: Before and after 2024, Washington Journal of Environmental Law & Policy, 2, 1–73, 2012.
Bankes, N.: The Columbia River Treaty between Canada and the United States of America–time for change?, in: Water Resource Management and the Law, edited by: Hollo, E. J., Edward Elgar Publishing, https://doi.org/10.4337/9781785369834.00019, 2017.
Bankes, N. and Cosens, B.: The Future of the Columbia River Treaty, Program on Water Issues, Munk School of Global Affairs at the University of Toronto in collaboration with the University of British Columbia, the University of Idaho and the University of Calgary, Toronto, Ontario Canada, 2012.
BC Hydro: Electricity rates & energy use, https://app.bchydro.com/accounts-billing/rates-energy-use.html (last access: 1 June 2021), 2020.
BC Ministry of Energy and Mines: US Benefits from the Columbia River Treaty – Past, Present and Future: A Province of British Columbia Perspective, https://engage.gov.bc.ca/app/uploads/sites/6/2012/07/US-Benefits-from-CRT-June-20-13-2.pdf (last access: 1 June 2021), 2013.
Bernauer, T. and Böhmelt, T.: International conflict and cooperation over freshwater resources, Nat. Sustain., 3, 350–356, https://doi.org/10.1038/s41893-020-0479-8, 2020.
Blumm, M. C. and Deroy, D.: The Fight over Columbia Basin Salmon Spills and the Future of the Lower Snake River Dams, Washington Journal of Environmental Law & Policy, 9, 1–26, 2019.
Bonneville Power Administration (BPA): The Columbia River System Inside Story, BPA, https://www.bpa.gov/-/media/Aep/power/hydropower-data-studies/columbia_river_inside_story.pdf (last access: 10 August 2022), 2001.
Bonneville Power Administration: Columbia Basin salmon and steelhead: many routes to the ocean, BPA, DOE/BP-4529, https://www.bpa.gov/about/newsroom/fact-sheets (last access: 1 July 2019), 2013.
Bonneville Power Administration: Historical Streamflow Data (Monthly Data), BPA [data set], https://www.bpa.gov/p/Power-Products/Historical-Streamflow-Data/Pages/Monthly-Data.aspx, last access: 1 July 2020.
Bowerman, T. E., Keefer, M. L., and Caudill, C. C.: Elevated stream temperature, origin, and individual size influence Chinook salmon prespawn mortality across the Columbia River Basin, Fish. Res., 237, 105874, https://doi.org/10.1016/j.fishres.2021.105874, 2021.
Caldas, M. M., Sanderson, M. R., Mather, M., Daniels, M. D., Bergtold, J. S., Aistrup, J., Heier Stamm, J. L., Haukos, D., Douglas-Mankin, K., Sheshukov, A. Y., and Lopez-Carr, D.: Opinion: Endogenizing culture in sustainability science research and policy, P. Natl. Acad. Sci. USA, 112, 8157–8159, https://doi.org/10.1073/pnas.1510010112, 2015.
Charness, G. and Rabin, M.: Understanding social preferences with simple tests, Q. J. Econ., 117, 817–869, 2002.
Choshen-Hillel, S. and Yaniv, I.: Agency and the construction of social preference: Between inequality aversion and prosocial behavior, J. Pers. Soc. Psychol., 101, 1253–1261, https://doi.org/10.1037/a0024557, 2011.
Cosens, B.: Resilience and law as a theoretical backdrop for natural resource management: flood management in the Columbia River basin, Environmental Law, 42, 241, 2012.
Dombrowsky, I.: Revisiting the potential for benefit sharing in the management of trans-boundary rivers, Water Policy, 11, 125–140, 2009.
Environment Canada: Historical HYDAT (Hydrometric Data) database, https://wateroffice.ec.gc.ca/mainmenu/historical_data_index_e.html, last access: 1 July 2022.
Espey, M. and Towfique, B.: International bilateral water treaty formation, Water Resour. Res., 40, 1–8, https://doi.org/10.1029/2003WR002534, 2004.
FAO: Land & Water, https://www.fao.org/land-water/water/water-management/transboundary-water-management/en/, last access: 19 August 2022.
Fehr, E. and Fischbacher, U.: Why social preferences matter – The impact of non-selfish motives on competition, cooperation and incentives, Econ. J., 112, 1–33, https://doi.org/10.1111/1468-0297.00027, 2002.
Fehr, E. and Schmidt, K. M.: A theory of fairness, competition, and cooperation, Q. J. Econ., 114, 817–868, 1999.
Frey, B. S. and Meier, S.: Pro-social behavior in a natural setting, J. Econ. Behav. Organ., 54, 65–88, https://doi.org/10.1016/j.jebo.2003.10.001, 2004.
Gain, A. K., Hossain, S., Benson, D., Di Baldassarre, G., Giupponi, C., and Huq, N.: Social-ecological system approaches for water resources management, Int. J. Sust. Dev. World, 28, 109–124, 2021.
Gintis, H., Bowles, S., Boyd, R., and Fehr, E.: Explaining altruistic behavior in humans, Evol. Hum. Behav., 24, 153–172, 2003.
Giordano, M., Drieschova, A., Duncan, J. A., Sayama, Y., De Stefano, L., and Wolf, A. T.: A review of the evolution and state of transboundary freshwater treaties, Int. Environ. Agreem.-P., 14, 245–264, 2014.
Giordano, M. A. and Wolf, A. T.: Sharing waters: Post-Rio international water management, Nat. Resour Forum, 27, 163–171, 2003.
Gober, P. and Wheater, H. S.: Socio-hydrology and the science–policy interface: a case study of the Saskatchewan River basin, Hydrol. Earth Syst. Sci., 18, 1413–1422, https://doi.org/10.5194/hess-18-1413-2014, 2014.
Government of British Columbia: 2019 Community Meetings Summary Report, https://engage.gov.bc.ca/app/uploads/sites/6/2020/06/2019-CRT-Community-Meetings-Report_Web.pdf (last access: 10 August 2022), 2019.
Grey, D., Sadoff, C., and Connors, G.: Effective cooperation on transboundary waters: A Practical Perspective. World Bank, Washington, DC, https://openknowledge.worldbank.org/handle/10986/24047 (last access: 20 July 2022), 2016.
Harman, C. and Stewardson, M.: Optimizing dam release rules to meet environmental flow targets, River Res. Appl., 21, 113–129, 2005.
Henrich, J., Boyd, R., Bowles, S., Camerer, C., Fehr, E., Gintis, H., McElreath, R., Alvard, M., Barr, A., and Ensminger, J.: “Economic man” in cross-cultural perspective: Behavioral experiments in 15 small-scale societies, Behav. Brain Sci., 28, 795–815, 2005.
Hirshleifer, J.: Competition, Cooperation, and Conflict in Economics and Biology, in: Papers and Proceedings of the Ninetieth Annual Meeting of the American Economic Association, Am. Econ. Rev., 68, 238–243, American Economic Association, https://www.jstor.org/stable/1816696 (last access: 5 July 2022), 1978.
Ho, S.: “Big brother, little brothers”: Comparing China's and India's transboundary river policies, Water Policy, 18, 32–49, https://doi.org/10.2166/wp.2016.103, 2016.
Hofbauer, J. and Sigmund, K.: Evolutionary game dynamics, B. Am. Math. Soc., 40, 479–519, 2003.
Holm, C. E.: The Columbia River Treaty: Negotiating between Hydropower and Ecosystem-Based Functions, Willamette L. Rev., 54, 89, 2017.
Hyde, J. M.: Columbia River Treaty Past and Future, BPA Hydrovision, 25 pp., http://www.crt2014-2024review.gov/Files/10Aug_Hyde_TreatyPastFuture_FinalRev.pdf (last access: 6 June 2021), 2010.
Islam, S. and Susskind, L.: Using complexity science and negotiation theory to resolve boundary-crossing water issues, J. Hydrol., 562, 589–598, https://doi.org/10.1016/j.jhydrol.2018.04.020, 2018.
Iwasa, Y., Suzuki-Ohno, Y., and Yokomizo, H.: Paradox of nutrient removal in coupled socioeconomic and ecological dynamics for lake water pollution, Theor. Ecol., 3, 113–122, 2010.
Jägerskog, A. and Zeitoun, M.: Getting Transboundary Water Right: Theory and Practice for Effective Cooperation, Report Nr. 25, SIWI, Stockholm, http://environmentportal.in/files/Transboundary_Waters_with_WWW.pdf (last access: 6 June 2021), 2009.
Kameri-Mbote, P.: Water, Conflict and Cooperation: Lessons from the Nile River Basin, World, https://www.wilsoncenter.org/publication/water-conflict-and- cooperation-lessons-the-nile-river-basin-no-4 (last access: 19 August 2022), 2007.
Kareiva, P., Marvier, M., and McClure, M.: Recovery and management options for spring/summer chinook salmon in the Columbia River Basin, Science, 290, 977–979, https://doi.org/10.1126/science.290.5493.977, 2000.
Karpouzoglou, T., Dang Tri, V. P., Ahmed, F., Warner, J., Hoang, L., Nguyen, T. B., and Dewulf, A.: Unearthing the ripple effects of power and resilience in large river deltas, Environ. Sci. Policy, 98, 1–10, https://doi.org/10.1016/j.envsci.2019.04.011, 2019.
Kertzer, J. D. and Rathbun, B. C.: Fair is Fair: Social Preferences and reciprocity in international Politics, World Polit., 67, 613–655, https://doi.org/10.1017/S0043887115000180, 2015.
Khan, H. F., Yang, Y. C. E., Xie, H., and Ringler, C.: A coupled modeling framework for sustainable watershed management in transboundary river basins, Hydrol. Earth Syst. Sci., 21, 6275–6288, https://doi.org/10.5194/hess-21-6275-2017, 2017.
Kliot, N., Shmueli, D., and Shamir, U.: Institutions for management of transboundary water resources: Their nature, characteristics and shortcomings, Water Policy, 3, 229–255, https://doi.org/10.1016/S1366-7017(01)00008-3, 2001.
Koebele, E. A.: When multiple streams make a river: analyzing collaborative policymaking institutions using the multiple streams framework, Policy Sci., 54, 609–628, https://doi.org/10.1007/s11077-021-09425-3, 2021.
Leonard, N. J., Fritsch, M. A., Ruff, J. D., Fazio, J. F., Harrison, J., and Grover, T.: The challenge of managing the Columbia River Basin for energy and fish, Fisheries. Manag. Ecol., 22, 88–98, 2015.
Lower Columbia Estuary Partnership: FACTS ABOUT THE RIVER, https://www.estuarypartnership.org/learn, last access: 15 July 2022.
Lu, Y., Tian, F., Guo, L., Borzì, I., Patil, R., Wei, J., Liu, D., Wei, Y., Yu, D. J., and Sivapalan, M.: Socio-hydrologic modeling of the dynamics of cooperation in the transboundary Lancang–Mekong River, Hydrol. Earth Syst. Sci., 25, 1883–1903, https://doi.org/10.5194/hess-25-1883-2021, 2021.
Madani, K., Zarezadeh, M., and Morid, S.: A new framework for resolving conflicts over transboundary rivers using bankruptcy methods, Hydrol. Earth Syst. Sci., 18, 3055–3068, https://doi.org/10.5194/hess-18-3055-2014, 2014.
McCracken, M. and Wolf, A. T.: Updating the Register of International River Basins of the world, Int. J. Water Resour. D., 35, 732–782, https://doi.org/10.1080/07900627.2019.1572497, 2019.
Mirumachi, N.: Securitising shared waters: An analysis of the hydropolitical context of the Tanakpur Barrage project between Nepal and India, Geogr. J., 179, 309–319, https://doi.org/10.1111/geoj.12029, 2013.
Muckleston, K. W.: Salmon vs. hydropower: Striking a balance in the Pacific Northwest, Environ. Sci. Policy Sustain. Dev., 32, 10–36, 1990.
Natural Resource Council: Upstream-Salmon and Society in the Pacific Northwest, National Academy Press, Washington, DC, https://doi.org/10.17226/4976, 1996.
Northwest Power and Conservation Council: 2019 Columbia River Basin Fish and Wildlife Program Costs Report, https://www.nwcouncil.org/sites/default/files/2020-2.pdf (last access: 15 July 2022), 2019.
Northwest Power and Conservation Council: Dams: impacts on salmon and steelhead, https://www.nwcouncil.org/reports/columbia-river-history/damsimpacts (last access: 10 August 2022), 2020a.
Northwest Power and Conservation Council: Endangered Species Act, Columbia River salmon and steelhead, and the Biological Opinion, https://www.nwcouncil.org/reports/columbia-river-history/EndangeredSpeciesAct (last access: 10 August 2022), 2020b.
Northwest Power and Conservation Council: Hydropower, https://www.nwcouncil.org/reports/columbia-river-history/hydropower (last access: 10 August 2022), 2020c.
Northwest Power and Conservation Council: International Joint Commission, https://www.nwcouncil.org/reports/columbia-river-history/internationaljointcommission (last access: 10 August 2022), 2020d.
Northwest Power and Conservation Council: Floods and flood control, https://www.nwcouncil.org/reports/columbia-river-history/floods, last access: 19 August 2022.
Northwest Power Planning Council: Compilation of information on salmon and steelhead losses in the Columbia River Basin, Northwest Power Planning Council, https://www.nwcouncil.org/reports/compilation-information-salmon-and-steelhead-total-run-size-catch-and- hydropower-related/ (last access: 10 August 2022), 1986.
Odom, O. and Wolf, A. T.: Résilience institutionnelle et variabilité climatique dans les traités internationaux de l'eau: Illustration avec le Bassin du Fleuve Jourdain, Hydrolog. Sci. J., 56, 703–710, https://doi.org/10.1080/02626667.2011.574138, 2011.
Pohl, B. and Swain, A.: Leveraging diplomacy for resolving transboundary water problems, in: Water Dipl. action Conting. approaches to Manag. complex water Probl., edited by: Islam, K. and Madani, K., Anthem Press, 19–34, ISBN: 9781783084937, 2017.
Qaddumi, H.: Practical approaches to transboundary water benefit sharing, Overseas Development Institute London, ISBN 9780850038774, 2008.
Rawlins, J.: Harmonisation of transboundary water governance: advance or align?, https://www.africaportal.org/features/harmonisation- transboundary-water-governance-advance-or-align/ (last access: 7 July 2022), 2019.
Rivera-Torres, M. and Gerlak, A. K.: Evolving together: transboundary water governance in the Colorado River Basin, Int. Environ. Agreem.-P., 21, 553–574, 2021.
Sadoff, C. W. and Grey, D.: Beyond the river: the benefits of cooperation on international rivers, Water Policy, 4, 389–403, 2002.
Sadoff, C. W. and Grey, D.: Cooperation on international rivers: A continuum for securing and sharing benefits, Water Int., 30, 420–427, 2005.
Saklani, U., Shrestha, P. P., Mukherji, A., and Scott, C. A.: Hydro-energy cooperation in South Asia: Prospects for transboundary energy and water security, Environ. Sci. Policy, 114, 22–34, https://doi.org/10.1016/j.envsci.2020.07.013, 2020.
Sanderson, M. R., Bergtold, J. S., Heier Stamm, J. L., Caldas, M. M., and Ramsey, S. M.: Bringing the “social” into sociohydrology: Conservation policy support in the Central Great Plains of Kansas, USA, Water Resour. Res., 53, 6725–6743, 2017.
Scrucca, L.: Package “GA”, https://luca-scr.github.io/GA/ (last access: 1 July 2022), 2021.
Shurts, J. and Paisley, R.: 7. The Columbia River Treaty, in: Water without Borders?, edited by: Norman, E. S., Cohen, A., and Bakker, K., University of Toronto Press, 139–158, ISBN: 978-1-4426-1237-2, 2013.
Sivapalan, M. and Blöschl, G.: Time scale interactions and the coevolution of humans and water, Water Resour. Res., 51, 6988–7022, 2015.
Sivapalan, M., Savenije, H. H. G., and Blöschl, G.: Socio-hydrology: A new science of people and water, Hydrol. Process, 26, 1270–1276, https://doi.org/10.1002/hyp.8426, 2012.
Soetaert, K., Petzoldt, T., and Setzer, R. W.: Solving differential equations in R: Package deSolve, J. Stat. Softw., 33, 1–25, https://doi.org/10.18637/jss.v033.i09, 2010.
Soetaert, K., Petzoldt, T., Setzer, R. W., Brown, P. N., Byrne, G. D., Hairer, E., Hindmarsh, A. C., Moler, C., Petzold, L. R., Saad, Y., and Ulrich, C. W.: Package “deSolve”, CRAN [code], http://desolve.r-forge.r-project.org/ (last access: 10 August 2022), 2020.
Song, J. and Whittington, D.: Why have some countries on international rivers been successful negotiating treaties? A global perspective, Water Resour. Res., 40, 1–18, https://doi.org/10.1029/2003WR002536, 2004.
Sopinka, A. and Pitt, L.: The columbia river treaty: Fifty years after the handshake, Electricity Journal, 27, 84–94, https://doi.org/10.1016/j.tej.2014.04.005, 2014.
Stern, C. V: Columbia River Treaty Review, Congressional Research Service, 7-5700, CRS Report No. R43287, https://aquadoc.typepad.com/files/crs_columbia_river_review_1june2018.pdf (last access: 10 July 2022), 2018.
Taylon, P. D. and Jonker, L. B.: Evolutionarily stable strategies and game dynamics, Math. Biosci., 40, 145–156, 1978.
Thomas, K. A.: The Ganges water treaty: 20 years of cooperation, on India's terms, Water Policy, 19, 724–740, https://doi.org/10.2166/wp.2017.109, 2017.
Trebitz, K. I. and Wulfhorst, J. D.: Relating social networks, ecological health, and reservoir basin governance, River Res. Appl., 37, 198–208, 2021.
Troy, T. J., Konar, M., Srinivasan, V., and Thompson, S.: Moving sociohydrology forward: a synthesis across studies, Hydrol. Earth Syst. Sci., 19, 3667–3679, https://doi.org/10.5194/hess-19-3667-2015, 2015.
UNEP: Transboundary Waters Systems – Status and Trends: Crosscutting analysis, United Nations Environment Programme (UNEP), Nairobi, ISBN: 978-92-807-3531-4, 2016.
UNESCO: Progress on Transboundary Water Cooperation 2018, ISBN: 978-92-3-100467-4, 2021.
United Nations: Transboundary Waters, https://www.unwater.org/water-facts/transboundary-waters/, last access: 19 August 2022.
United States Government Accountability Office: COLUMBIA RIVER Additional Federal Actions Would Benefit Restoration Efforts, GAO-18-561, https://www.gao.gov/assets/gao-18-561.pdf (last access: 1 August 2022), 2018.
UN-Water: Good Practices in Transboundary Water Cooperation, https://www.unwater.org/water-facts/transboundary-waters/ (last access: 1 August 2022), 2015.
Uprety, K. and Salman, S. M. A.: Aspects juridiques du partage et de la gestion des eaux transfrontalières en Asie du Sud: Prévention des conflits et promotion de la coopération, Hydrol. Sci. J., 56, 641–661, https://doi.org/10.1080/02626667.2011.576252, 2011.
USACE: COLUMBIA RIVER TREATY FLOOD CONTROL OPERATING PLAN, Hydrologic Engineering Branch, Water Management Division, 220 NW 8th Ave Portland, OR 97209-3503, https://www.nwd-wc.usace.army.mil/cafe/forecast/FCOP/FCOP2003.pdf (last access: 1 July 2022), 2003.
USACE: Basin Water Control Data (Dataquery 2.0), Northwestern Division, U.S. Army Corps of Engineers, database, https://www.nwd-wc.usace.army.mil/dd/common/dataquery/www/, last access: 1 July 2022.
USACE: Columbia River Treaty Detailed Operating Plan For Canadian Storage, Columbia River Treaty Operating Committee, U.S. Army Corps of Engineers Digital Library, https://usace.contentdm.oclc.org/digital/collection/p266001coll1/id/3193/ (last access: 10 August 2022), 2013.
U.S. Energy Information Administration: https://www.eia.gov/ (last access: 15 July 2020), 2022.
USGS: USGS Real-Time Water Data for USGS 14105700 Columbia River at the Dalles, OR, USGS [data set], http://waterdata.usgs.gov/nwis/uv?14105700, last access: 1 July 2022.
Warner, J. and Zawahri, N.: Hegemony and asymmetry: Multiple-chessboard games on transboundary rivers, Int. Environ. Agreem.-P., 12, 215–229, 2012.
White, S. M., Brandy, S., Justice, C., Morinaga, K. A., Naylor, L., Ruzycki, J., Sedell, E. R., Steele, J., Towne, A., and Webster, J. G.: Progress towards a comprehensive approach for habitat restoration in the Columbia Basin: Case study in the Grande Ronde River, Fisheries, 46, 229–243, 2021.
Wiebe, K.: The Nile River: Potential for Conflict and Cooperation in the Face of Water, Nat. Resour. J., 41, 731–754, 2001.
Williams, J. G., Smith, S. G., Zabel, R. W., Muir, W. D., Scheuerell, M. D., Sandford, B. P., Marsh, D. M., McNatt, R. A., and Achord, S.: Effects of the federal Columbia River power system on salmonid populations, U.S. Dept. Commer., NOAA Tech. Memo. NMFS-NWFSC-63, 150 pp., 2005.
Wolf, A. T.: Shared waters: Conflict and cooperation, Annu. Rev. Env. Resour., 32, 241–269, https://doi.org/10.1146/annurev.energy.32.041006.101434, 2007.
Yu, W.: Benefit Sharing in International Rivers: Findings from the Senegal River Basin, the Columbia River Basin, and the Lesotho Highlands Water Project, World Bank AFTWR Work. Pap., 46456, 1–79, 2008.
Zambrano-Bigiarini, M.: hydroGOF: goodness-of-fit functions for comparison of simulated and observed hydrological time series, https://cran.r-project.org/web/packages/hydroGOF/hydroGOF.pdf (last access: 1 August 2022), 2020.
Zeitoun, M., Goulden, M., and Tickner, D.: Current and future challenges facing transboundary river basin management, WIREs Clim. Change, 4, 331–349, https://doi.org/10.1002/wcc.228, 2013.