the Creative Commons Attribution 4.0 License.
the Creative Commons Attribution 4.0 License.
 | 04 Oct 2022
Rainfall pattern analysis in 24 East Asian megacities using a complex network
Kyunghun Kim
Jaewon Jung
Hung Soo Kim
Masahiko Haraguchi
Soojun Kim
Concurrent floods in multiple locations pose systemic risks to the interconnected economy in East Asia via supply chain disruptions. Despite these significant economic impacts, understanding of the interconnection between rainfall patterns in the region is still currently limited. Here, we analyzed the spatial dependence of the rainfall patterns of 24 megacities in the region using complex analysis theory and discussed the technique's applicability. Each city and rainfall similarity were represented by a node and a link, respectively. Vital-node identification and clustering analysis were conducted using adjacency information entropy and multiresolution community detection. The results of vital-node identification analysis show that high-ranking nodes are cities that are located near main vapor providers in East Asia. Using multiresolution community detection, the groups were clustered to reflect the spatial characteristics of the climate. In addition, the climate links between each group were identified using cross-mutual information considering the delay time for each group. We found a strong bond between Northeast China and the southern Indochinese Peninsula and verified that the links between each group originated from the summer climate characteristics of East Asia. The results of the study show that complex network analysis could be a valuable method for analyzing the spatial relationships between climate factors.
- Article
(5153 KB) - Full-text XML
- BibTeX
- EndNote


East Asia accounts for 54 % of the global supply chain, providing a wide range of services and products across the world (Ann et al., 2020). However, the region is prone to major floods. According to the disaster database of the Centre for Research on the Epidemiology of Disasters (CRED), which offers essential core data on the occurrence and effects of disasters all over the world, an annual average of 165 flood disasters occurred worldwide during the period from 2000 to 2020, resulting in 5278 deaths and economic damage of up to USD 29 million. While more than 22 % of these flood disasters occurred in East Asia, more than 60 % of the global flood-related deaths and economic damage was experienced by this region. For instance, Thailand recorded 813 deaths and USD 40 million worth of damage from floods in 2011 (Haraguchi and Lall, 2015), while China recorded 300 fatalities and USD 4.5 million of damage from floods in 2019 (CRED). This flood damage occurred in several areas of East Asia simultaneously. Even though floods occurred simultaneously in distant areas, the impacts of floods propagate through supply chains, incurring economic losses for the entire region. In this sense, concurrent flooding causes severe loss of life and economic damage in multiple countries at the same time, disrupting the global economy more severely. For example, in 2020, concurrent floods in East Asia inundated automobile factories in Thailand, disrupting automobile supply, adversely affecting China's rare earth and fertilizer industries along the Yangtze River and, thus, also impacting the global rare earth industry (Podlaha et al., 2020).
Changes in rainfall characteristics caused by climate change are some of the primary causes of concurrent floods in East Asia. These changes occur across all regions, and the changed characteristics affect each other, resulting in even more significant changes (Wang et al., 2020). Therefore, it is vital to investigate the relationships among rainfall patterns in each region. Many studies have been conducted to identify rainfall relations in East Asia. Most of them have investigated the relationship between major East Asian countries using statistical techniques (Jeong et al., 2008; Kosaka et al., 2020; Deng et al., 2014), and some have demonstrated connections among weather factors, sea-level temperature, and monsoons. (Wu et al., 2003; Lau and Kim, 2006; Li et al., 2010; Sun and Wang, 2012; Wu, 2017). Researchers have also used teleconnection methods to discover relationships between precipitation in East Asia and other parts of the world (Kripalani and Kulkarni, 2001; Sahai et al., 2003; Riyu and Zhongda, 2009; Lin, 2014; Maity et al., 2020). These studies have been used to anticipate rainfall in East Asia and to aid in preparing for flood disasters. This study investigated the usefulness of complex network concepts for relationship analysis.
Complex network theory, developed by Leonard Euler in 1735, expresses and analyzes a subject or phenomenon as a graph. In the late 1990s, Watts and Strogatz (1998) and Barabási and Albert (1999) extended the analytical technique, making the theory fundamental in network science. A complex network can display a complicated phenomenon as a simple graph. Information obtained from the methodology can be used to identify the characteristics of subjects, their physical behavior, and the roles and relationships of the phenomenon's components. Complex network analysis has also been used in various fields because of its high applicability. For example, researchers have applied it to social networks (Michael et al., 2010), world trade (Bader et al., 2007), air transportation nets (Cardillo et al., 2013), patterns of human migration (Davis et al., 2013), and others. The analytical method has also been used in the fields of hydrology and meteorology to discover new patterns and relationships (Donges et al., 2009; Scarsoglio et al., 2013; Boers et al., 2015; Joo et al., 2021; Wolf et al., 2020). In precipitation-related research, the method had been used to analyze extreme rainfall patterns around the world (Boers et al., 2019), track rainfall events caused by typhoons (Ozturk et al., 2018), and study the spatial connectivity of rainfall (Ihsan et al., 2018) in order to determine new information or characteristics.
With the encouraging results of previous rainfall-related studies, this study applied complex network theory to rainfall in East Asia in order to understand the relationships among rainfall patterns in each region. The complex networks in the fields of hydrology and meteorology define connectivity using statistical interdependence methods. Therefore, characteristics can be analyzed from the relationships. In addition, for clustering analysis, complex network-based methods consider the entire network, rather than the independent regions, unlike many other traditional methods. This feature results in a more accurate clustering (Long and Liu et al., 2019). Despite this advantage, one of the challenges in complex network theory is to identify thresholds, which determine whether the links exist. While no perfect methodology exists to clearly address this challenge, new methodologies are constantly being proposed. In this study, we assumed that each region (node) is connected to all of the other regions (nodes) in the network and that each connection (link) has a similarity, which is used as a weight. By using the similarity measures as weights, the network reflects the relationships between regions. Using the similarity measure makes a network the reflect relationship between regions. The link weight is one of the most important input variables for constructing and analyzing a network. We assessed the effects of each region using centrality analysis and grouped the regions according to clustering analysis. Subsequently, mutual information (MI) was calculated with a time lag (i.e., cross-mutual information) in order to identify the relationships between each group. Past studies on complex networks only considered spatial factors, whereas we add also temporal factors.
The remainder of this paper is organized as follows: Sect. 2 describes the study area and data used in this study; the complex network theory and related indicators are detailed in Sect. 3; Sect. 4 presents the results of the complex network analysis of East Asia and a discussion of these results; and Sect. 5 presents the conclusions.
In this research, the major cities in East Asia are analyzed (Fig. 1). Among the East Asian cities, we used the same cities as selected by Haraguchi et al. (2019). They chose cities with more than 5 million people and with a high degree of urbanization. As rainfall often causes numerous floods in the region and due to growing urbanization, more and more cities have began to experience small and medium-sized frequent floods as well as large-scale, low-probability floods (The World Bank, 2015). It should be noted that we excluded Surabaya, Jakarta, and Badung (Indonesia) from the selected cities because of the changes in the location of rainfall observations since 2007. Instead, we included Ho Chi Minh City, Hai Phong (Vietnam), and Cebu (Philippines), which are economically emerging. Thus, a total of 24 cities were selected.
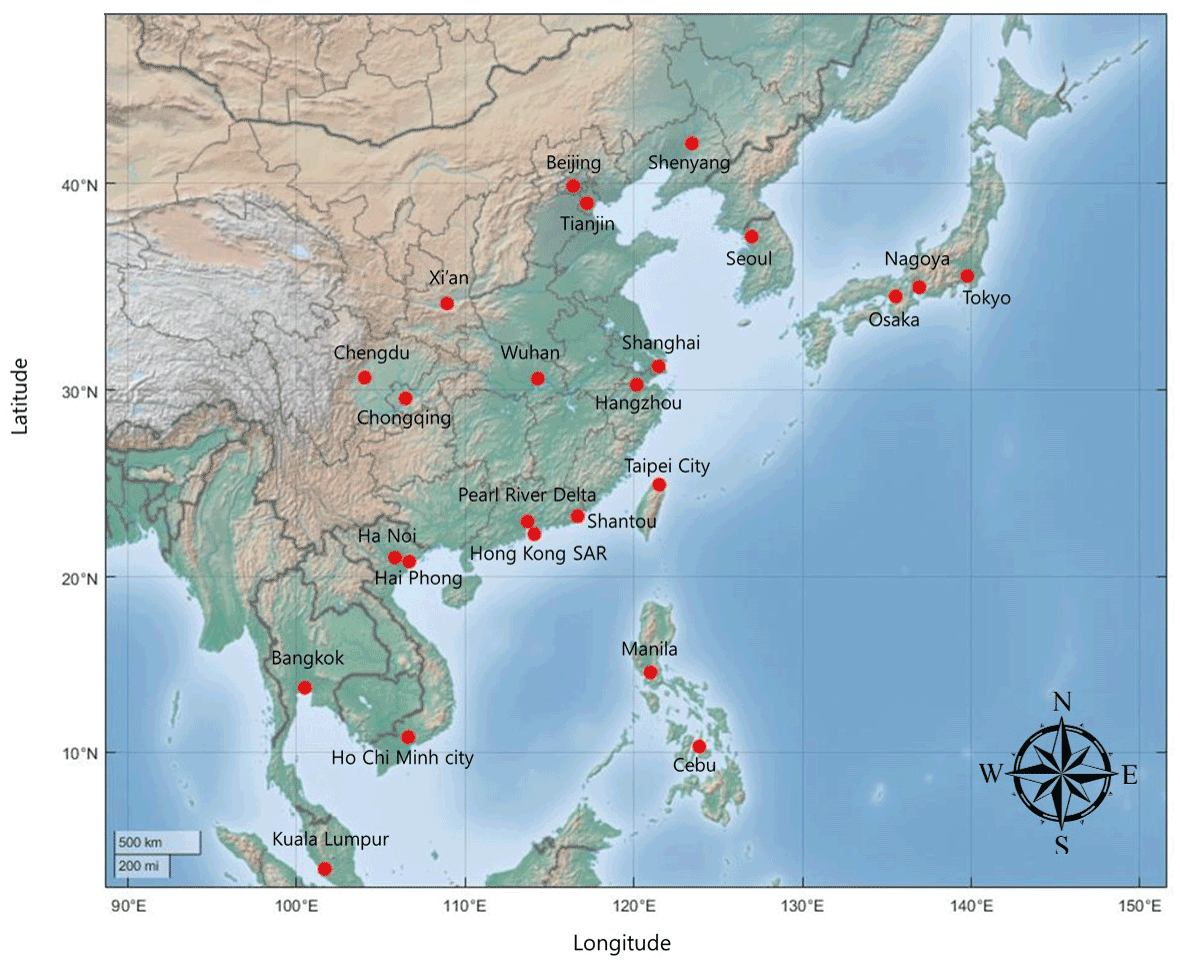
Figure 1The 24 major East Asian cities used in this work.
This study used daily precipitation data from the “Asian Precipitation – Highly-Resolved Observational Data Integration Toward Evaluation” (APHRODITE) gridded precipitation dataset (Akiyo et al., 2012). The APHRODITE dataset contains long-term, high-resolution daily rainfall data of the Asian continent obtained from a dense precipitation observation network (Fig. 2). The data were obtained from the APHRODITE “Water Resources” project conducted by the Research Institute for Humanity and Nature (RHIN) and the Meteorological Research Institute of the Japan Meteorological Agency (MRI/JMA). These data have been used in many studies because of their high definition. We extracted the rainfall data from the grid () to which each city belongs.
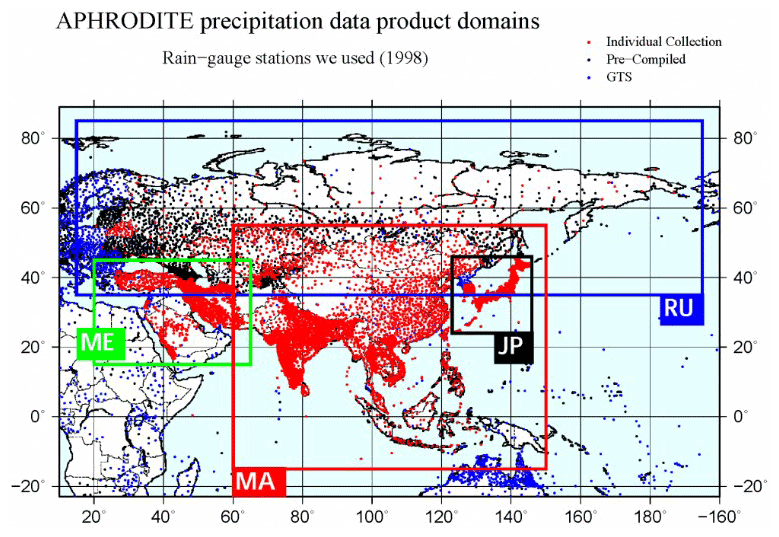
Figure 2The APHRODITE data (http://aphrodite.st.hirosaki-u.ac.jp/products.html, last access: 26 November 2019) for the cities. Dots show the station data distribution of the data used in this work: red represents individual collections, black represents pre-complied data, and blue represents global telecommunication network (GTS) based data obtained from Global Surface Summary of the Day (NCEI/NOAA). Rectangles show the domain of precipitation data. In this research, precipitation data on a 0.25∘ grid for monsoon Asia (MA) for the period from 1981 to 2015 were utilized.
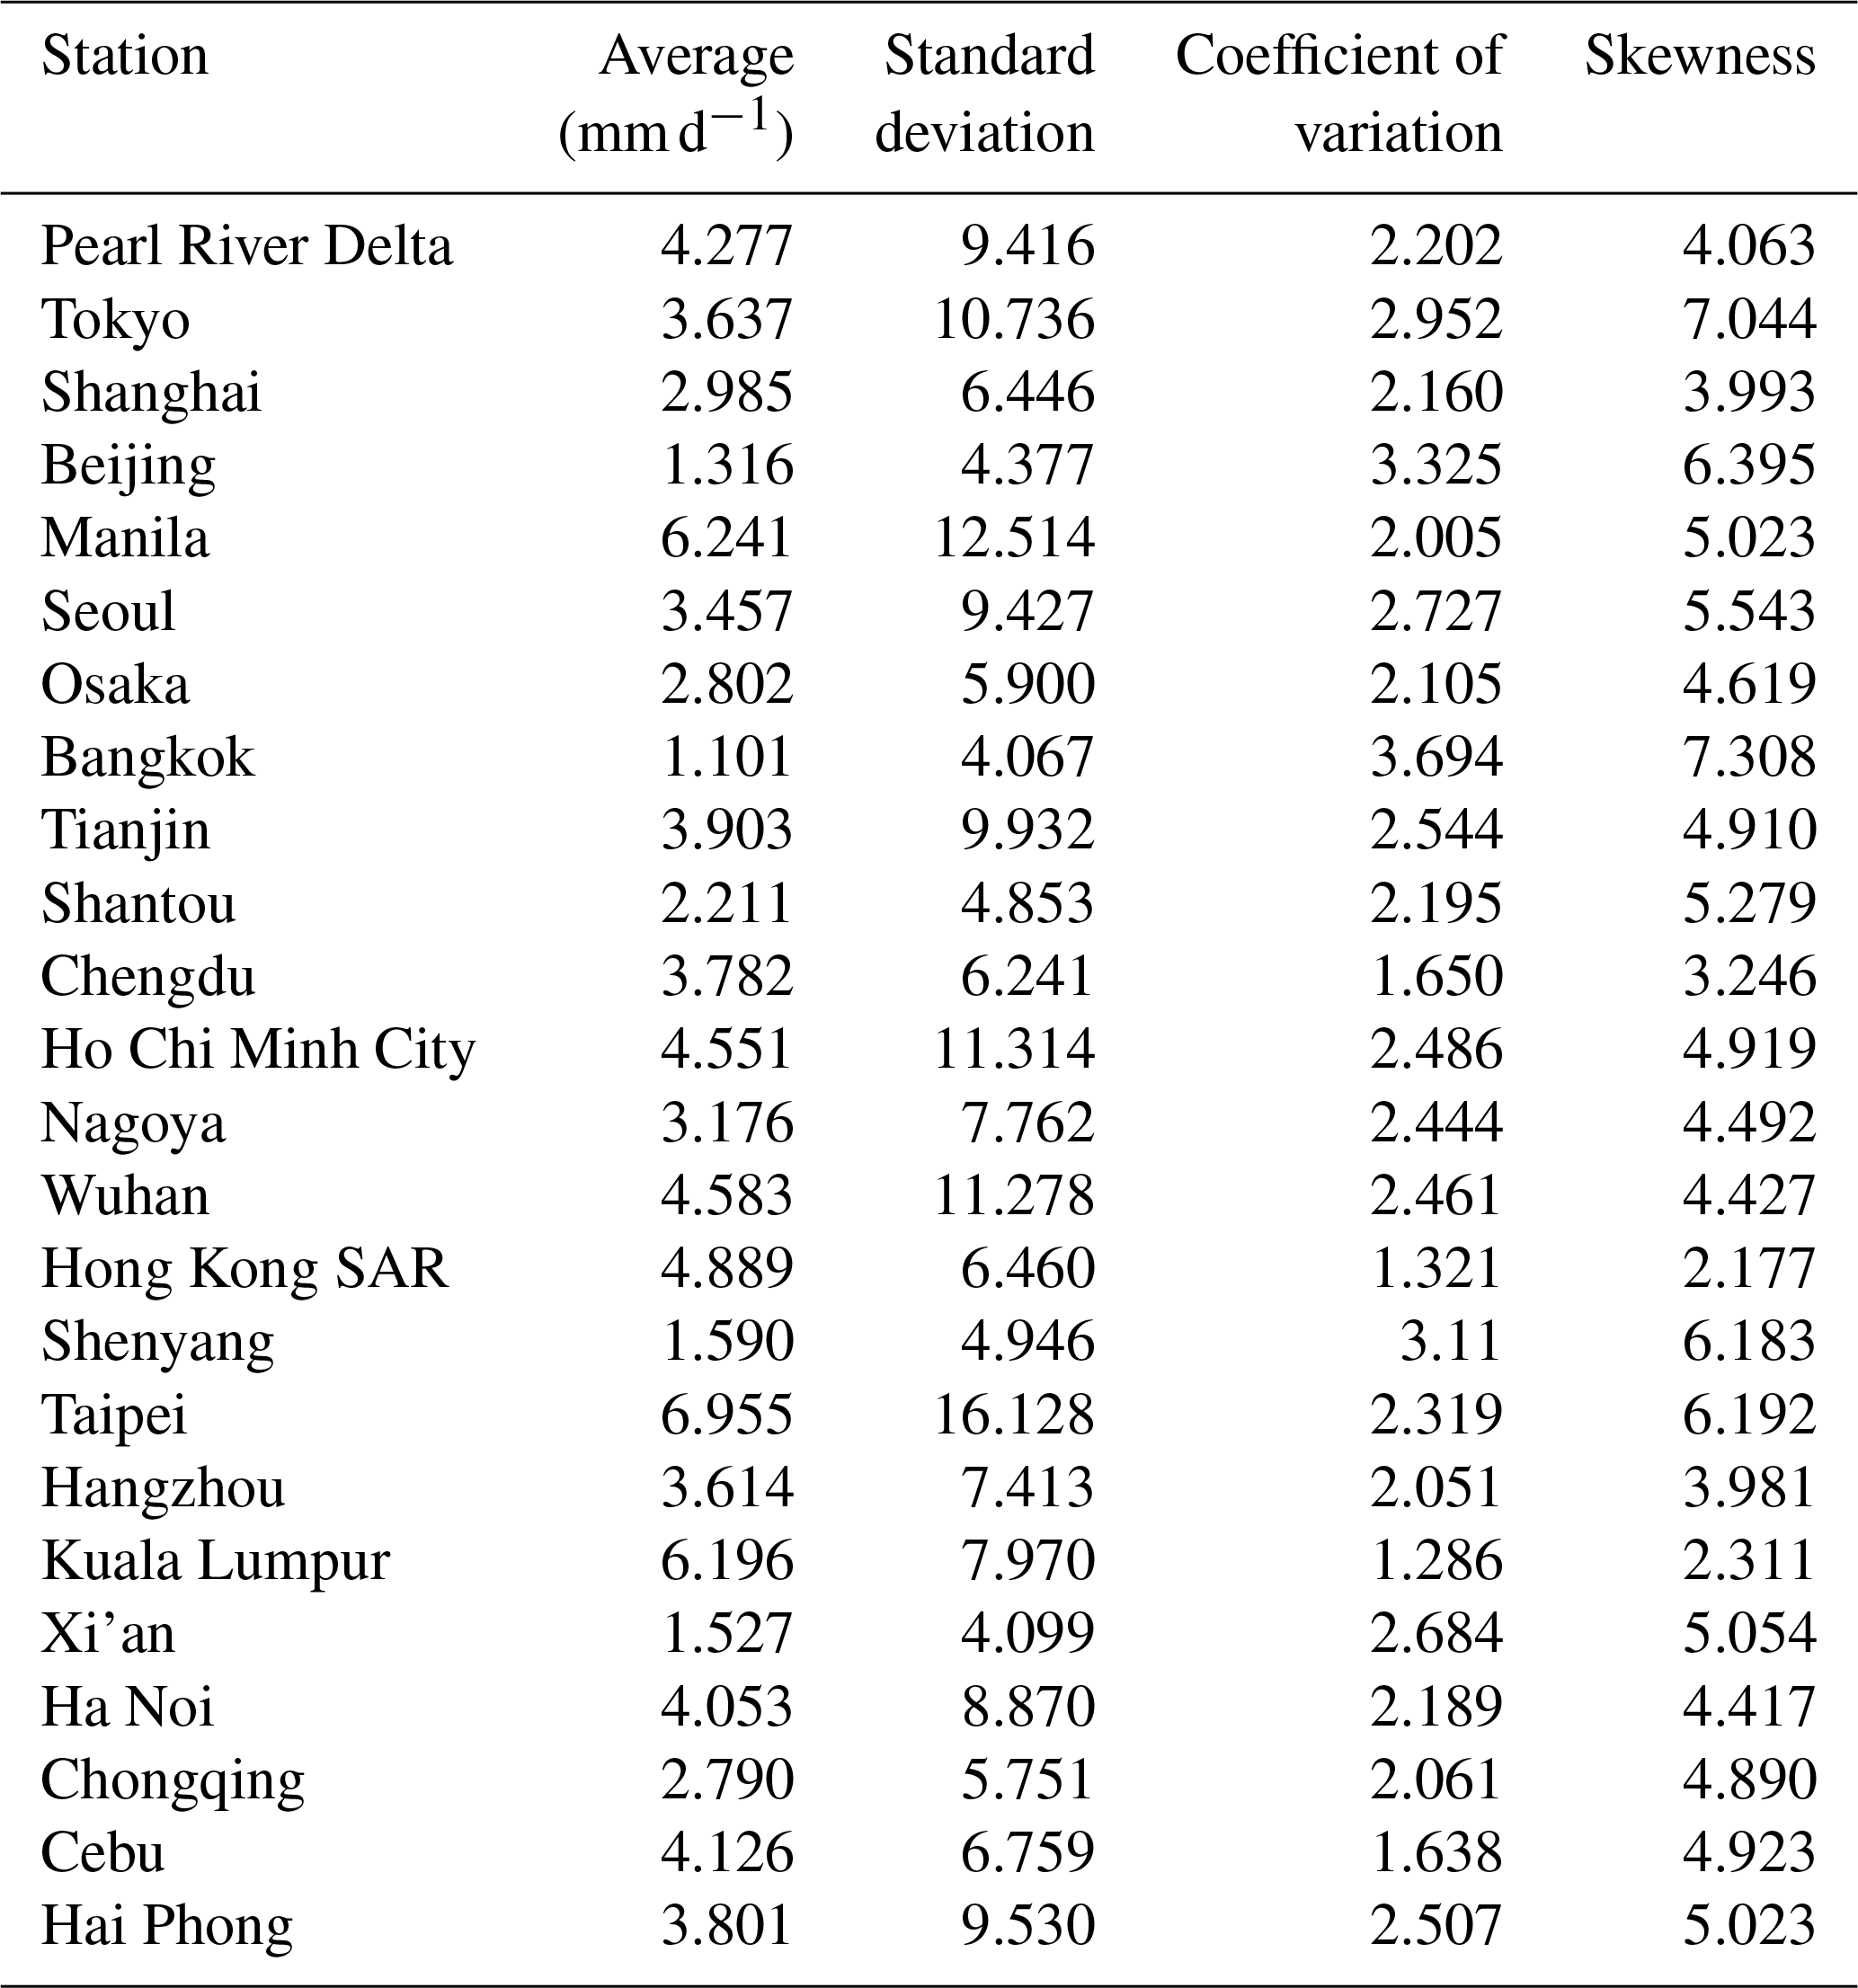
Daily rainfall data for each city consisted of observations from 1 January 1981 to 31 December 2015. The basic statistics for each city's rainfall data are listed in Table 1. Taipei records the largest rainfall amount on average, approximately 6 times higher than that of Bangkok, which has the lowest rainfall. Bangkok also has the largest variation, whereas Kula Lumpur has the least variation.
Table 1Basic statistical values for the rainfall data of cities. The statistics shown are the average, standard deviation, coefficient of variation, and skewness.
3.1 Complex network analysis
Complex network analysis effectively visualizes a subject or phenomenon using a network and analyzes its characteristics, components, and relationships among nodes in the network. To apply complex network analysis, nodes and links must be defined. A node represents some entity or agent that serves as a point of intersection/junction within a network (Kivelä et al., 2014). For example, in the global airways network, airports become nodes. A link is an element that connects each node. Thus, in a global airways network, airways are the links. Defining these two elements is crucial in the analysis because even networks with the same number of nodes and links can potentially take various forms (Fig. 3).
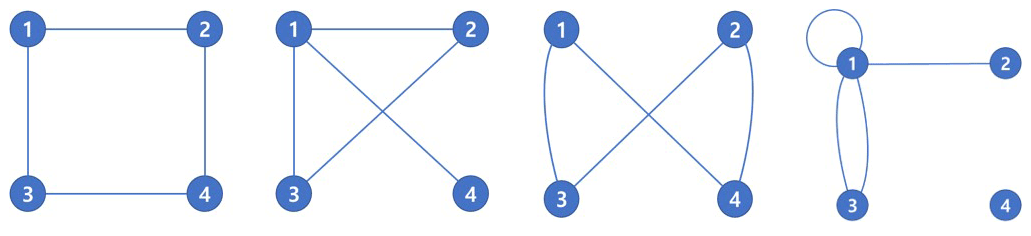
Figure 3Various shapes of networks with the same number of nodes and links. Each network has four nodes and four links; however, these networks take various shapes and have different topological characteristics.
In a complex network, links are the most influential aspects of the network. This is because the type and characteristics of the graph vary depending on the type of link used and how it is defined. Based on the directionality and weight of the link, the network can be an undirected/directed network or an unweighted/weighted network. Generally, it is easy to define links in transportation systems or power grid systems, which show clear connections between elements. However, if uncertainties in the connections exists, such as in social networks, researchers must define them. The most widely used methodology for defining uncertainty in the connections is the similarity measure (Donges et al., 2009). Depending on the value of the similarity calculated between two nodes, the researcher can define whether a link exists. While various previous studies have used the Pearson correlation coefficient for links, it tends to derive inaccurate values when it is applied to nonlinear data (Zadian et al., 2018). To address this problem, some researchers have utilized mutual information (MI) as an alternative (e.g., Donges et al., 2009; Kim et al., 2019; Ghorbani et al., 2021). MI is based on the information and probability theory. For two variables (A and B), it quantifies and represents the amount of information on B contained in the variable A:
where p(a) and p(b) are the probability distributions of the respective variables, and p(a,b) indicates the joint probability density function of the variables. MI values range from 0 to ∞, and an MI value of 0 indicates that the two variables are independent of each other. MI can consider the nonlinearity of the data and has the advantage of calculating the similarity between datasets of different sizes (Goyal, 2014).
3.2 Vital-node identification using adjacency information entropy
Important nodes in a network have various effects on the structure or function of the network. Identifying these nodes is of practical and theoretical value (Xu et al., 2020). For example, if a government identifies the locations that play a key role in power grids and traffic networks, it can effectively invest and create defensive measures to prepare for blackouts and traffic jams. While some methods of identifying important nodes have been developed, these methods have limitations and are only applicable to certain types of networks (Mester et al., 2021), such as undirected networks. Xu et al. (2020) developed a new methodology based on information entropy, making it applicable to all types of networks. This method has more efficient and accurate results than the existing methods. The procedure of the method is briefly outlined in the following (a more detailed explanation of the vital-node identification method is given in Xu et al., 2020). The first step is calculating strength of each node in a weighted network:
where j is the neighbor of node i, Γi is the set of neighbors of node i, and wji is the weight of the link that connects node j and node i. If a network is unweighted, the degree is the number of neighbor nodes. The next step is to estimate the adjacency degree of each node:
where Ai is the adjacency degree, representing the total weight of the neighboring nodes of node i. Based on Eqs. (2) and (3), the selection probability can be calculated as follows:
Eventually, the adjacency information entropy of a node is then calculated:
After comparing the calculated adjacency information entropy of each node, the importance is determined according to the descending power. In the rainfall studies, vital nodes are interpreted as important points for the propagation of a rainfall event.
3.3 Multiresolution community detection in weighted complex networks
A complex network consists of many nodes and links. Some nodes with strong relationships or similar characteristics can be clustered together. These clusters have several features and perform specific network functions. However, the cluster results depend on the level of analysis. Therefore, the multiresolution community detection method can be a useful method for understanding complex networks (Newman, 2012). Several cluster analysis methods have been used for complex networks, but they require intense computations for complicated network shapes and focus only on graphical properties (Long and Liu, 2019). To address these problems, Long and Liu (2019) proposed a new clustering methodology using an intensity-based community detection algorithm (ICDA) in weighted networks. This method is advantageous because it forms groups more accurately and faster than other methods. To form groups, the belonging coefficient of the nodes should be calculated. The first step for estimating belonging coefficient is defining a distinct path. The simple (non-repeating links between nodes) and elementary (non-repeating nodes) path θ between node i and j with k edges is denoted as a k-edge distinct path if the path has no identical intermediate nodes or edges with any other distinct paths. After defining distinct paths, the link intensity of each link must be calculated as follows:
Here, σ(pathp(vi,vj)) is the sum of the link weights in p-edge distinct paths from node i (vi) to node j (vj), P is the parameter of the path, and αp is a polygonal effect parameter. For edge eij between node i and node j, wi and wj are the respective strengths. Based on the link intensity, links must then be found that have a larger link intensity value than a threshold, and a group of nodes with the identified links is created:
Here, is the selected threshold, and cu is a group of nodes. The threshold is determined according to the researcher's personal view. The final step is calculating the belonging coefficient (IP) of the nodes in node set u (cu):
To evaluate the result of the cluster method, we used Newman–Girvan modularity. The Newman–Girvan modularity method compares the number of links connecting nodes inside a group of nodes with an expectation of this number under a random null model (Newman and Girvan, 2004). The modularity (Q) is calculated as follows:
where P is a cluster of node groups (), ga is a node group, and m is the total weight of links. The modularity measure assigns high scores to communities if they are densely connected internally but only weakly connected to other groups. We set the threshold groups by dividing by 2.5 % intervals from 95 % to 75 % and then calculated the Newman–Girvan modularity according to the threshold groups.
4.1 Construction of East Asia rainfall network
In this research, we designed a rainfall network as a weighted and undirected graph. Each node was selected from 24 major cities, and link weights represented shared knowledge between nodes. Table 2 compares the results of the link weights of the nodes.
Table 2The average, maximum, and minimum link weights of each node. The parentheses next to link weights are nodes that form a maximum or minimum value for target nodes.
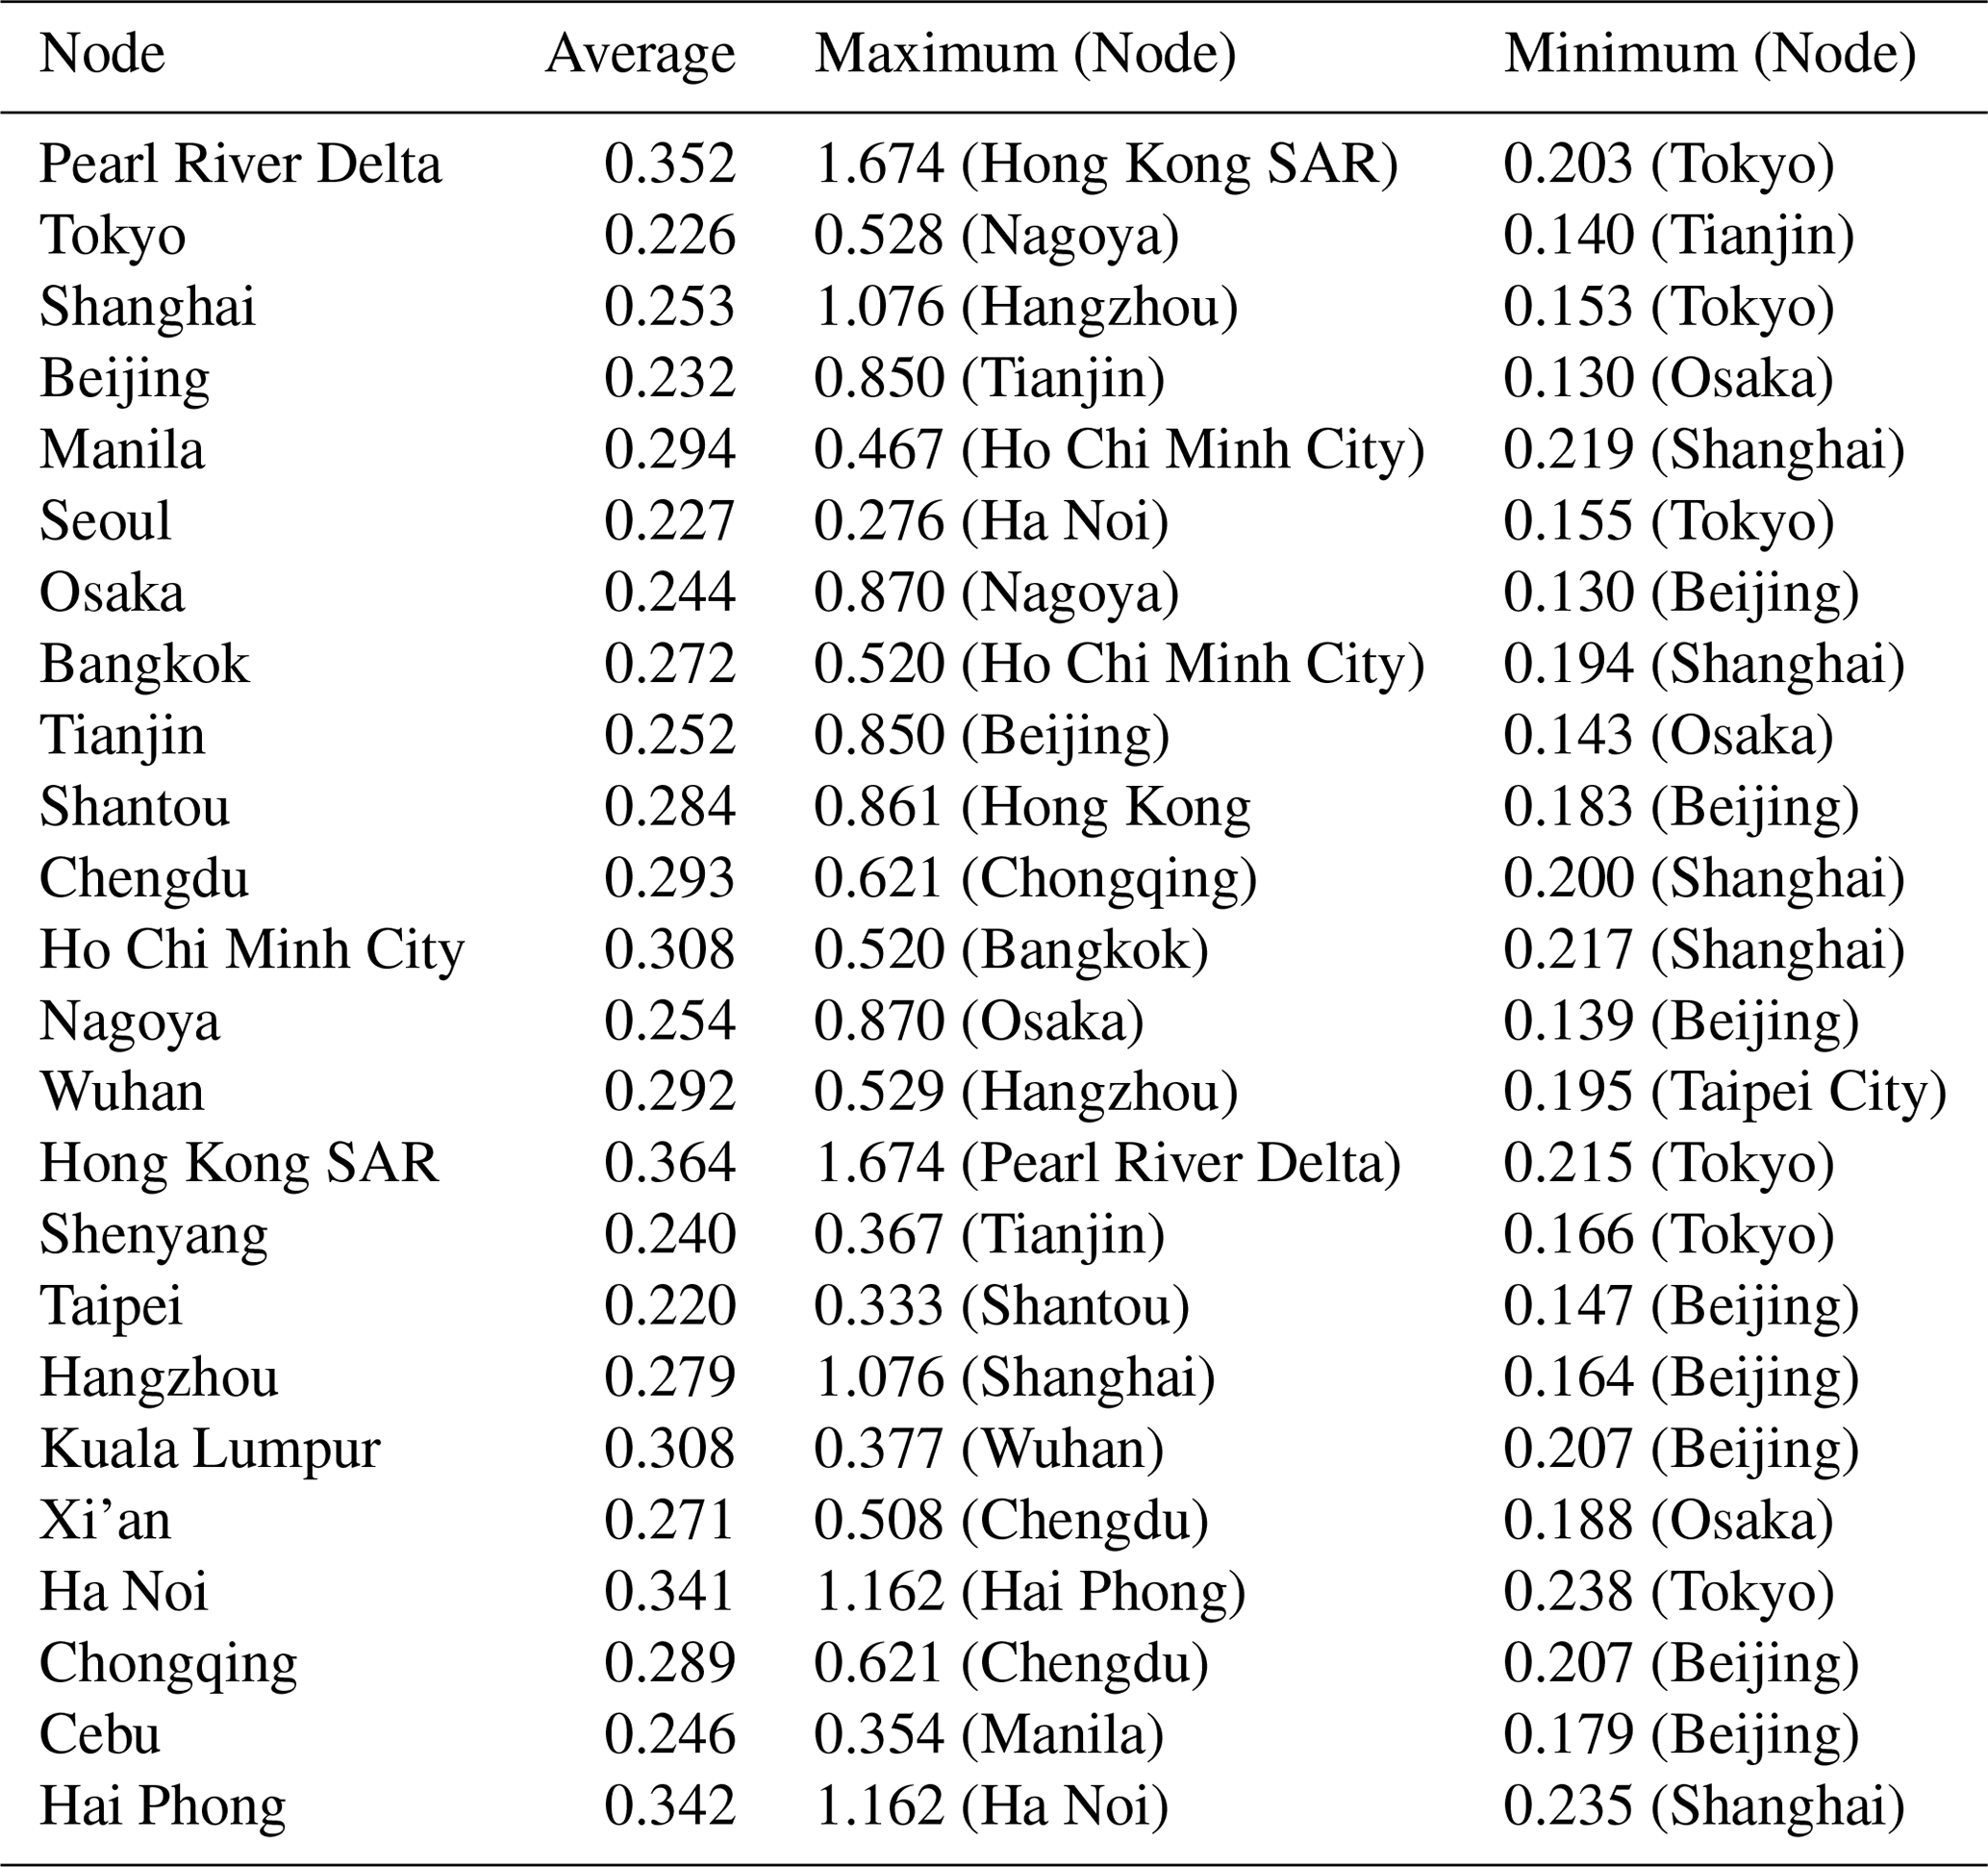
According to Table 2, the ranges of the average, maximum, and minimum link weights are 0.22–0.37, 0.27–1.67, and 0.13–0.24, respectively. The standard deviation of the average, minimum, and maximum values are 0.041, 0.033, and 0.394, respectively. The standard deviations of the maximum values were 10 times larger than the minimum values. We observed that the cities with the maximum values for each node were closely located. This is because the rainfall characteristics of cities located in close proximity to one another are similar; thus, the MI value is high. Each node had a maximum value for several different cities, whereas the minimum values were observed for certain cities such as Beijing and Tokyo. Beijing and Tokyo were selected as the cities with the lowest MI values (8 and 6 times lower than the maximum, respectively). These two cities have a common feature: their location is on the outskirts of the study area.
4.2 Vital-node identification by adjacency information entropy
For the network, we apply vital-node identification (VNI) to determine the influence of nodes. VNI can be used to analyze all types of networks and to more precisely determine the effects of nodes more accurately. The cities with high-ranking nodes are located around the South China Sea (Fig. 4). In addition, they have a high adjacency in the adjacency matrix. Cities with low-ranking nodes are located on the northeast outskirts, except for Taipei, and have a low average MI value. From these results, we can deduce that the location of a node affects its influence. However, location is not the only factor affecting vital-node identification. Despite its proximity to the South China Sea, Taipei has a low rank because its link weight is the smallest on average (0.220). We also find another commonality between high-ranking cities: they are located in the threshold regions with respect to the beginning of the impact of the main factors influencing rainfall in East Asia. We will elaborate on this in Sect. 4.5.
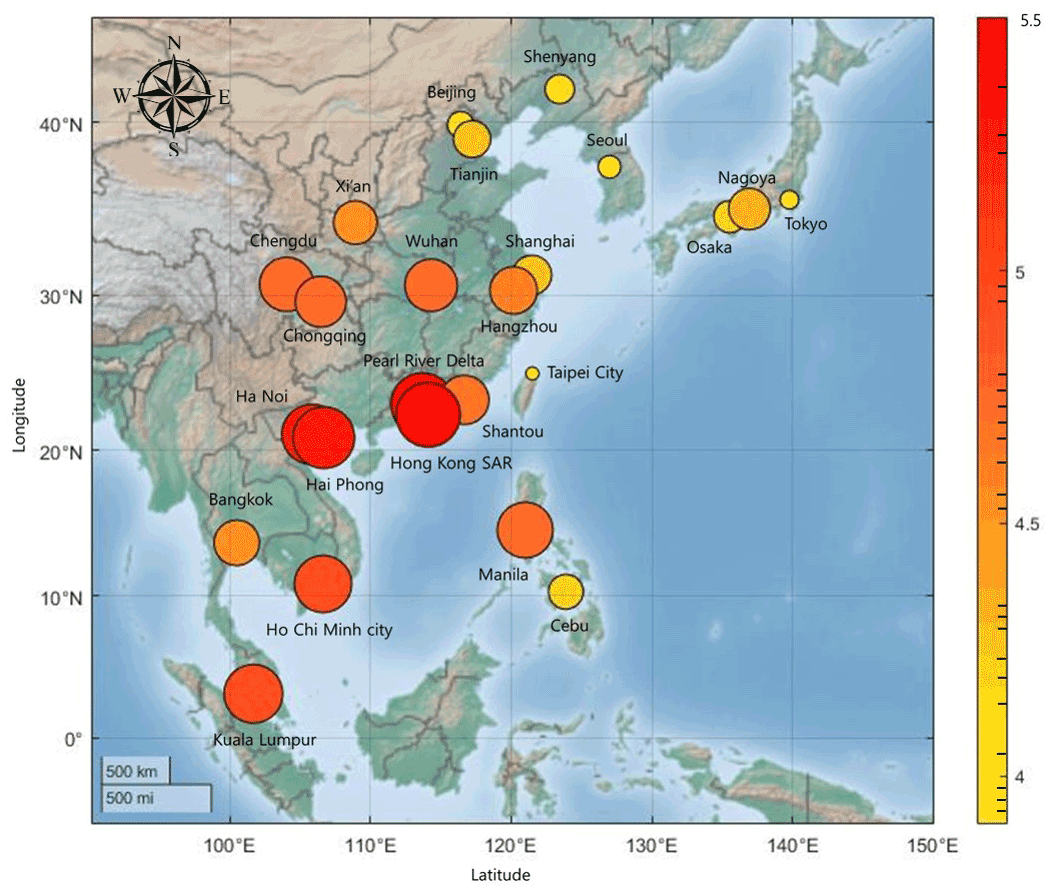
Figure 4The adjacency information entropy value of cities. The colors and sizes of the circles are proportional to the respective entropy and rank. The color bar on the right shows the adjacency information entropy values of nodes; except for Taipei city, nodes near the South China Sea have higher values.
4.3 Clustering analysis using multiresolution community detection
In clustering analysis, multiresolution community detection is applied to 24 nodes to create groups. After calculating the belonging coefficient, we determine the groups based on the threshold value. The threshold value is the 95th quantile of the calculated belonging coefficient, 0.06, in order to form a group of nodes with a strong relationship.
Nodes in close proximity form a group (Fig. 5). The cities of Seoul (South Korea) and Kuala Lumpur (Malaysia) are not clustered with the others. Seoul has low belonging coefficients with the nearby nodes because of its location on the Korean Peninsula. This area is influenced by maritime air masses in summer and continental air masses in winter. Therefore, the precipitation of Seoul is affected by both features and has different characteristics. This feature means that Seoul did not cluster with G2 and G4. For the Kuala Lumpur node, the belonging coefficients calculated with other nodes are between 0.03 and 0.05. Unlike other cities, Kuala Lumpur is significantly influenced by the boreal winter season and the Australia summer monsoon (Sigh and Xiaosheng, 2020). Therefore, Kuala Lumpur has a different rainfall pattern, and this results in a lower belonging coefficient. To evaluate the cluster result, we calculated the Newman–Girvan modularity. We set the threshold groups by dividing by 2.5 % intervals from 95 % to 75 %. In the modularity result, 95 % show the largest modularity (Table 3). In Table 3, there are thresholds with the same modularity value; these thresholds have same clustering result.
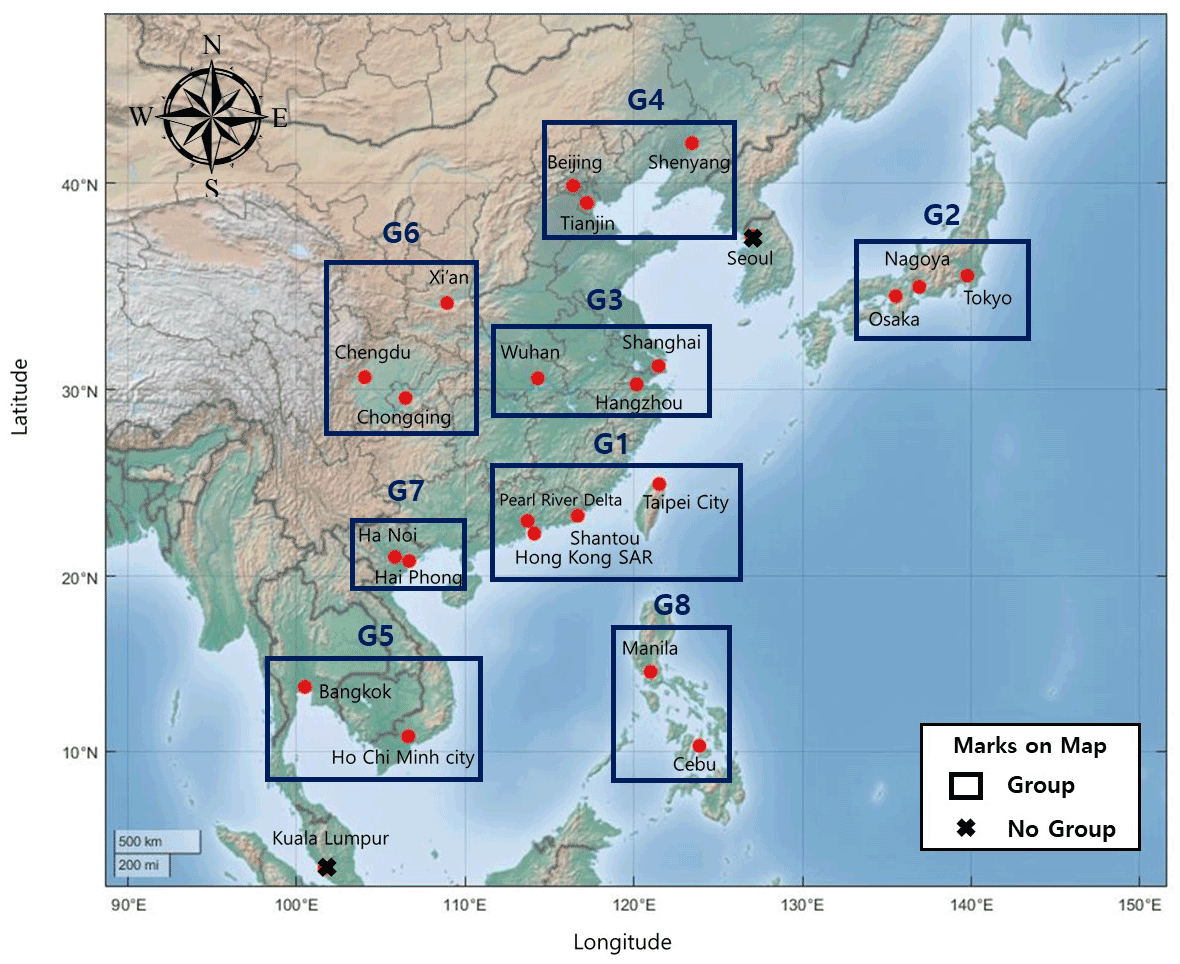
Figure 5The group of nodes using multiresolution community detection. There are eight groups in East Asia: G1 (Pearl River Delta, Hong Kong SAR, Shantou, and Taipei City), G2 (Osaka, Nagoya, and Tokyo), G3 (Wuhan, Hangzhou, and Shanghai), G4 (Tianjin, Shenyang, and Beijing), G5 (Bangkok and Ho Chi Minh City), G6 (Xi'an, Chengdu, and Chongqing), G7 (Ha Noi and Hai Phong), and G8 (Manila and Cebu). Seoul and Kuala Lumpur did not group with other nodes.
Table 3Results of the Newman–Girvan modularity analysis according to different thresholds.

4.4 Relationships between node groups
Nodes are grouped based on their belonging coefficients (Sect. 4.3). The relationships between the groups are determined using cross-mutual information analysis. Cross-mutual information is a methodology for calculating MI by adding time lags between targets. It can estimate an appropriate correlation coefficient by considering the time intervals for geographically distant points. In this study, the time lag ranges from −10 to 10 d, and we check the maximum cross-mutual information value and corresponding time lag of each group.
As Fig. 6 shows, most groups have strong relationships with G5 or G6, with maximum cross-mutual information values. G5 and G6 have the maximum cross-mutual information value with each other, and this value is larger than other cross-mutual information results. This result indicates that the two regions have a comparatively strong relationship. A comparison of the lag times that form the maximum cross-mutual information indicated that the maximum values are in an interval of fewer than 5 d. Therefore, East Asian regions can meaningfully relate to each other within a window of 5 d.
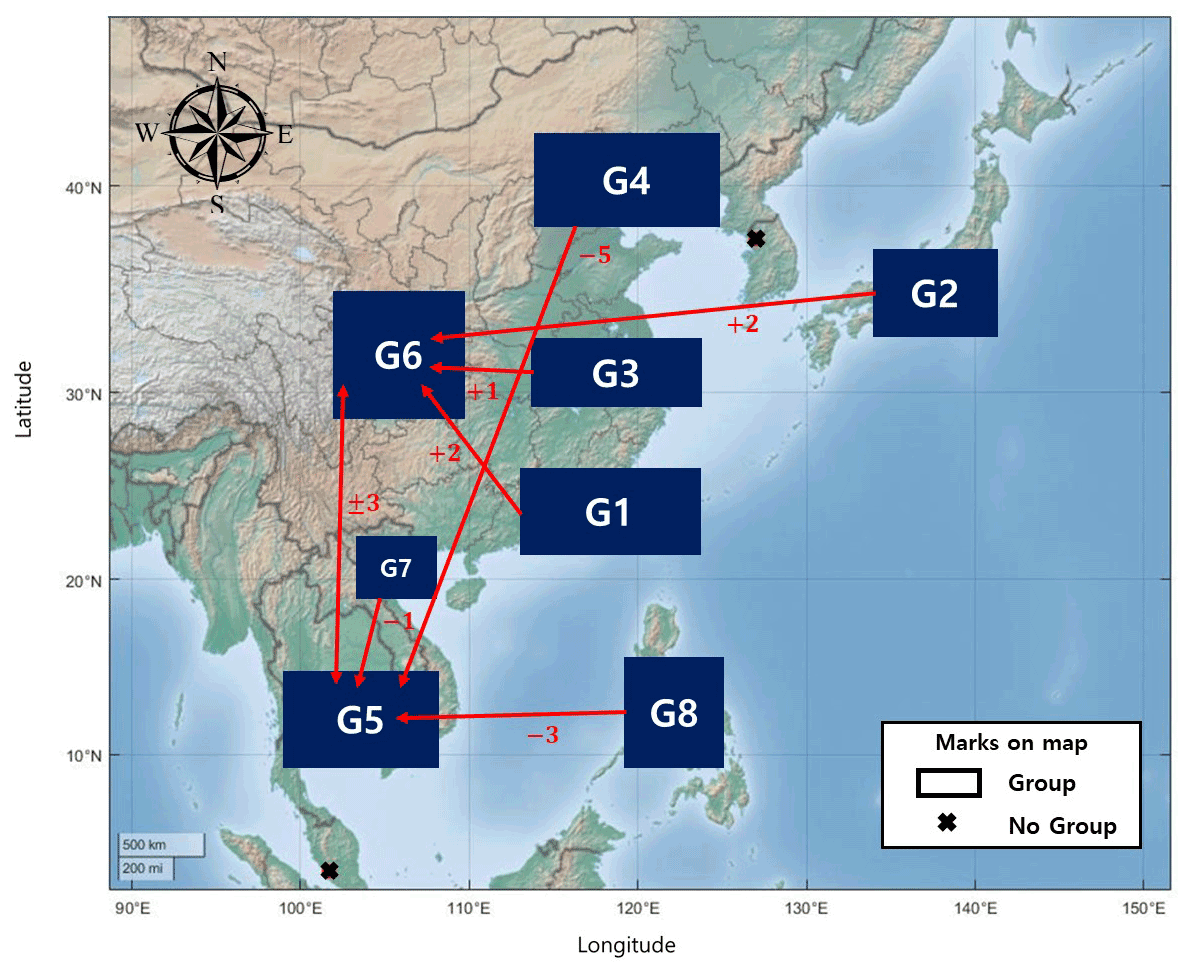
Figure 6The maximum cross-mutual information relationship and its time lag value. Each arrow indicates the maximum relationship group, and the numbers under the arrows express the lag time (days) of the maximum cross-mutual information value. The figure shows the relationships between groups and the influence time intervals in East Asia.
In order to establish the rainfall relationships in East Asia, an analysis of the East Asian summer rainfall system is required, as East Asian summer rainfall comprises more than 90 % of the total rainfall in the region (Chen et al., 2015). The relationships in Fig. 6 are derived from the synoptic atmospheric circulation in East Asia. The Indian and East Asian monsoons are major factors affecting rainfall in East Asia. The Indian monsoon brings highly humid wind from the sea that conveys a large quantity of vapor across India and the Bay of Bengal to East Asia; this vapor can also reach the northern part of China (Wu, 2017). If the Indian monsoon is strong, a large amount of rainfall can occur in India and northern China. This characteristic is observed in the relationship between G5 and G4 (G5 is the first place affected by the Indian monsoon in East Asia, and G4 is the first place affected in northern China). Water vapor from the Indian monsoon moves northwest from the Bay of Bengal, passing mainland China into the Sea of Okhotsk, which is located between the Russian Kamchatka Peninsula and the Japanese island of Sakhalin. Thus, G5, G6, and G7, which are located along this pathway, are related to each other by the Indian monsoon. The movement of water vapor from the Indian monsoon is caused by the low-level jet stream from the Somalian coast. The effect of the South China Sea, which supplies vapor to the mainland, is shown in the relationship between G1 and G6. In the summer, vapor from the the South China Sea arrives on the mainland and causes much rainfall in southern China (Kalnay et al., 1996). Like the Indian Monsoon, the East Asian monsoon affects East Asian rainfall. The East Asian monsoon begins in the western Pacific, moves eastward through Indonesia, and ends in Japan and South Korea. If it is strong, it also affects southern Vietnam and Thailand (Renhe and Akimasa, 2002). This is observed in the relationship between G8 and G5. In the summer, there is an anomalous anticyclone between China and Korea; this anticyclone is located in the western sea and forms a clockwise wind cycle throughout China, Korea, and Japan (Wu, 2017). This wind cycle results in the transport of vapor from Japan to eastern and central China, thereby forming the relationships between G2 and G6 and between G3 and G6.
4.5 Discussion
Complex network analysis is advantageous, as it reduces complex phenomena or systems to a graph form, making it easier to determine characteristics. In addition, it can be used to analyze the effects of network components and perform clustering analysis. Given these merits, we used complex network analysis to examine the relationships between major cities in East Asia.
To create a rainfall network, we first calculated the MI between nodes and used it as the link's weight. Thus, the network reflected the relationship of rainfall in each city and was used as the most important factor in subsequent analyses. Based on the MI results, we found that many cities had the lowest value with Tokyo and Beijing. We attempted to establish why this was the case, but we could not find any differences in the rainfall data. Therefore, future studies should collect and analyze data on other climate and geographical factors to discover why Tokyo and Beijing have unique rainfall characteristics.
The adjacency information entropy was calculated and compared to check the effects of nodes in the network. The results indicate that nodes surrounding the South China Sea and nodes located in threshold region with respect to the beginning of the effect of the two monsoons (Indian and East Asian) were highly ranked and that a node's location is one of the essential factors in identifying vital nodes. In the rainfall complex network research, high-ranking nodes are important sites for the propagation of a rainfall event. Based on the interpretation of a high-ranking node, we verified that the South China Sea and the two monsoons are the primary moisture sources in East Asia. The South China Sea supplies a huge amount of moisture to East Asia, and the two monsoons pass through it. Vapor from the South China Sea first affects coastal cities and then moves to other cities in the continent. Thus, rainfall from some cities affects neighboring cities. Based on this phenomenon, cities in the South China Sea obtained high ranks. Kuala Lumpur and Manila also obtained high ranks; these cities have a commonality in that their location is at the beginning of each major monsoon influence. The two monsoons pass Kuala Lumpur and Manila first and then move as shown in Fig. 7. Due to these characteristics, high-ranking nodes have a higher rainfall intensity and a higher number of rainfall days compared with other cities. Conversely, low-ranking cities have low rainfall intensity and a lower number of rainfall days. As low-ranking cities are commonly located in the north, which is very far from the moisture sources, these cities get less moisture and have less similarity to other cities. Using vital-node identification, we established the major rainfall influence elements in East Asia, and this helped to interpret the relationships between groups in Sect. 4.4.
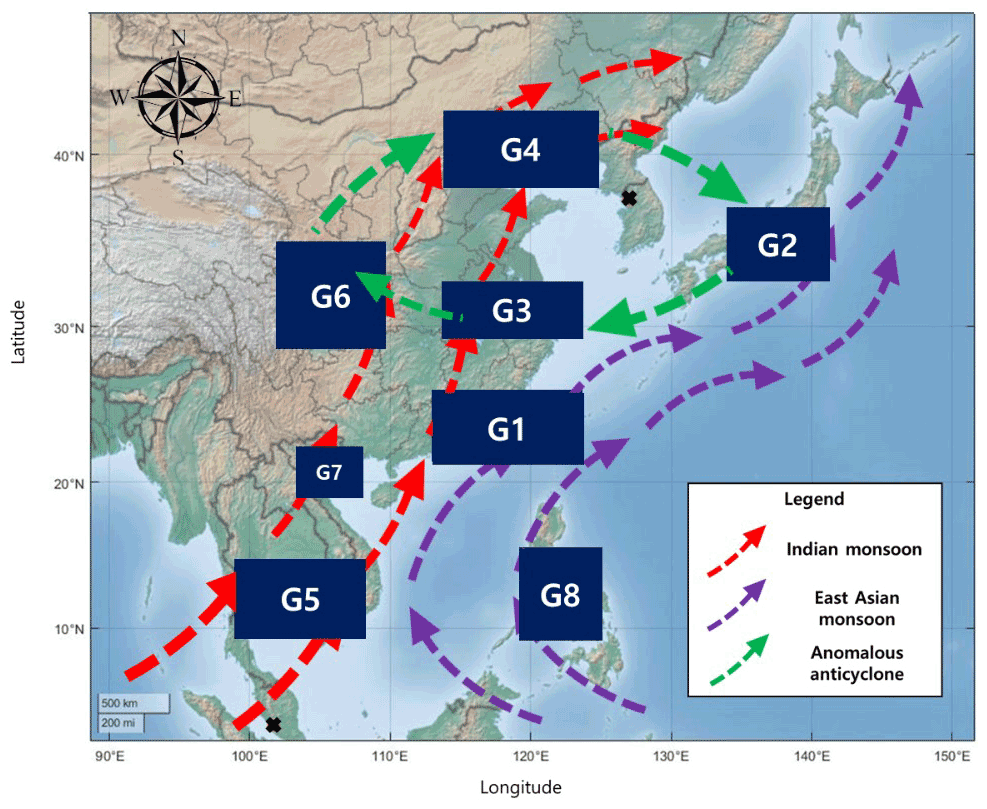
Figure 7Major water vapor transport routes in East Asia. These routes could explain why the relationships between groups occur as they are shown in Fig. 6. The Indian monsoon brings vapor from the Indian Ocean, whereas the East Asian monsoon transports vapor from the Pacific Ocean and East China Sea. An anomalous anticyclone provides vapor to East China, Korea, and Japan.
As described in Sect. 4.3, the belonging coefficient of each node was calculated by using the link weight. Each group consists of nodes located nearby, and their coefficients are significantly higher than those of the other nodes. We also tried to find common physical factors between nodes in the same group. We found that the nodes of some groups are located in the same basin or share a river; however, these factors do not apply to all groups. The cluster analysis result is conducted based on the similarity of rainfall. Rainfall is a meteorological phenomenon caused by a combination of various factors such as geographic, hydrologic, meteorological, and ecological elements. If two regions have a high similarity with respect to rainfall, they share similar characteristics of factors influencing rainfall. This study attempted to find the common factors that resulted in the groups, but it failed to find them. These factors are essential to predict concurrent floods in multiple locations. Therefore, in a future study, we will attempt to establish the factors responsible for the high similarity between nodes in the same group using geographic, meteorological, and hydrological data.
After clustering, we applied cross-mutual information analysis to determine the relationships between groups. During the analysis, the lag time was considered because the groups were geographically separated. The cross-mutual information results were interpreted using the rainfall characteristics of East Asia. Two monsoons (the Indian and East Asian monsoons) and the anomalous anticyclone affect group relationships. This result could also be confirmed when creating groups using various thresholds in Sect. 4.3. When the threshold reached 92.5 %, G5 and G7 were merged. After a threshold of 85 %, G3 and G6 became the same group. At thresholds of 80 % and 77.5 %, G8 was added to the combination of G5 and G7, and Kuala Lumpur was subsequently add to the combination of G5, G7, and G8. As seen from Fig. 6, G7 and G8 have a strong relationship with G5 due to the two monsoons, and G3 and G6 also have a strong relationship due to the anomalous anticyclone. One intriguing finding is the strong relationship between G5 and G6: even with G7 between them, they have a strong connection. Previous research has primarily focused on the relationship between southern China (G1) and regions surrounding the East China Sea (G5, G7, and G8) (Yuan and Qie, 2008; Hu et al., 2014; Zhao et al., 2017). These studies analyzed the effects of monsoons in the East China Sea but did not expand the region to G6. Therefore, research into the physical interpretation of the link between the G5 and G6 regions is required.
Complex network analysis facilitates a simple analysis of the relationship between East Asian cities. Unlike previous studies, we incorporated temporal factors into the relationships. Thus, we discover new relationships and rainfall characteristics in East Asia. During the analysis, vital-node identification helped to identify important sites for the propagation of rainfall as well as major moisture sources in East Asia. Vital-node identification is a useful method to analyze a system or phenomena. Therefore, it can be used to research natural disasters or a meteorological system. The multiresolution community detection method found cities with similar rainfall characteristics according to threshold values. This technique created groups with similar characteristics and simplified the rainfall network, thereby helping to develop our understanding of rainfall relationships between the major East Asian cities.
The two abovementioned methods draw out different results, but they help to interpret the results. For example, the major moisture sources found by vital identification helped to explain the relationship between groups. In addition, their results ultimately helped to deepen our understanding of the rainfall system in East Asia. These results verify that our research framework, using a complex network, is a helpful process for studying regional relationships and weather system. The framework contains not only topological analysis but also statistical analysis, and it considers temporal factors. Moreover, it ultimately reflects climate cycle factors and reveals their characteristics.
Concurrent floods in East Asia can simultaneously inundate a firm's production facilities at multiple locations, thereby causing supply chain disruptions at a global level. In this study, we analyzed the spatial relationships of rainfall between major cities in East Asia using a complex network. The East Asia rainfall network comprises major cities (nodes) and mutual information (links). Once the network was created, vital-node identification and multiresolution community detection were conducted using adjacency information entropy and multiresolution community detection. Cross-mutual information defined relationships between cluster groups in East Asia. The results revealed that the network reflected the rainfall characteristics of East Asia, and the relationships significantly affected vital nodes and clustering analysis. In addition, we observed that Southeast Asia and Northwest China have a strong relationship. This work observed that, while the computational burden of implementing complex network analysis is not overly high, the method accurately reflects the relationship between regional rainfall and can be used to analyze the relationships between various weather factors. In a subsequent study, we intend to evaluate the applicability of complex network methodology to interpret key climate factors, such as the El Niño–Southern Oscillation, the Indian Ocean Dipole, and the North Atlantic Oscillation, which have complex interconnection characteristics.
The “Asian Precipitation – Highly-Resolved Observational Data Integration Toward Evaluation” (APHRODITE) gridded precipitation dataset is available online: http://aphrodite.st.hirosaki-u.ac.jp/ (APHRODITE’s Water Resources, 2012).
KK, JJ, and SK designed and conducted the research. KK analyzed the results, with feedback from HSK, MH, and SK. KK prepared the paper, with contributions from all co-authors.
The contact author has declared that none of the authors has any competing interests.
Publisher's note: Copernicus Publications remains neutral with regard to jurisdictional claims in published maps and institutional affiliations.
This article is part of the special issue “Understanding compound weather and climate events and related impacts (BG/ESD/HESS/NHESS inter-journal SI)”. It is not associated with a conference.
This research was supported by a grant (2021-MOIS36-002) of Technology Development Program on Disaster Restoration Capacity Building and Strengthening funded by Ministry of Interior and Safety (MOIS, Korea).
This research has been supported by the Ministry of the Interior and Safety (grant no. 2021-MOIS36-002).
This paper was edited by Carlo De Michele and reviewed by Geoff Pegram and three anonymous referees.
APHRODITE’s Water Resources: APHRODITE, http://aphrodite.st.hirosaki-u.ac.jp/ (last access: 26 November 2019), 2012.
Akiyo, Y., Kenji, K., Osamu, A., Atsushi, H., Natsuko, Y., and Akio, K.: APHRODITE: Constructing a long-term daily gridded precipitation dataset for Asia based on a dense network of rain gauges, B. Am. Meteorol. Soc., 93, 1401–1415, https://doi.org/10.1175/BAMS-D-11-00122.1, 2012.
Bader, B. W., Harshman, R. A., and Kolda, T. G.: Temporal analysis of semantic graphs using ASALSAN, Seventh IEEE International Conference on Data Mining (ICDM 2007), Omaha, NE, USA, 33–42, https://doi.org/10.1109/ICDM.2007.54, 2007.
Barabási, A. L. and Albert, R.: Emergence of scaling in random networks, Science, 286, 509–512, https://doi.org/10.1126/science.286.5439.509, 1999.
Boers, N., Donner, R. V., Bookhagen, B., and Kurths, J.: Complex network analysis helps to identify impacts of the EL Niño Southern Oscillation on moisture divergence in South America, Clim. Dynam., 45, 619–632, https://doi.org/10.1007/s00382-014-2265-7, 2015.
Boers, N., Goswami, B., Rheinwalt, A., Bookhagen, B., Hoskins, B., and Kurths, J.: Complex networks reveal global pattern of extreme-rainfall teleconnections, Nature, 566, 373–377, https://doi.org/10.1038/s41586-018-0872-x, 2019.
Cardillo, A., Gomez-Gardenes, J., Zanin, M., Romance, M., Papo, D., Pozo, F., and Boccaletti, S.: Emergence of network features from multiplexity, Sci. Rep.-UK, 3, 1344, https://doi.org/10.1038/srep01344, 2013.
Chen, F., Xu, Q., Chen, J., Briks, H. J. B., Liu, J., Zhang, S., Jin, S., An, C., Telfod, R. J., Cao, X., Selvaraj, K., Lu, H., Li, Y., Zheng, Z., Wang, H., Zhou, A., Dong, G., Zhang, J., Huang, X., Bloemendal, J., and Rao, Z.: East Asian summer monsoon precipitation variability since the last deglaciation, Sci. Rep.-UK, 5, 1186, https://doi.org/10.1038/srep11186, 2015.
Davis, K., D'Odorico, P., Laio, F., and Ridolfi, L.: Global spatio-temporal patterns in human migration: A complex network perspective, PLOS ONE, 8, e53723, https://doi.org/10.1371/journal.pone.0053723, 2013.
Deng, Y., Gao, T., Yao, X., and Xie, L.: Regional precipitation variability in East Asia related to climate and environmental factors during 1979–2012, Sci. Rep.-UK, 4, 5693, https://doi.org/10.1038/srep05693, 2014.
Donges, J., Zou, Y., Marwan, N., and Kurths, J.: Complex networks in climate dynamics, Eur. Phys. J.-Spec. Top., 174, 157–179, https://doi.org/10.1140/epjst/e2009-01098-2, 2009.
Ghorbani, M. A., Karimi, V., Ruskeepaa, H., Sivakumar, B., Pham, Q. B., Fatemeth, M., and Nazly, Y.: Application of complex networks for monthly rainfall dynamics over central Vietnam, Stoch. Env. Res. Risk A., 35, 535–548, https://doi.org/10.1007/s00477-020-01962-2, 2021.
Goyal, M. K.: Monthly rainfall prediction using wavelet regression and neural network: an analysis of 1901–2002 data, Assam, India, Theor. Appl. Climatol., 118, 25–34, https://doi.org/10.1007/s00704-013-1029-3, 2014.
Haraguchi, M., and Lall, U.: Flood risks and impacts: A case study of Tailand’s floods in 2011 and research questions for 390 supply chain decision making, Int. J. Dis. Risk Reduct., 14, 256–272, https://doi.org/10.1016/j.ijdrr.2014.09.005, 2015.
Haraguchi, M., Kim, S., and Lall, U.: Correlated Risks for Heavy Precipitation in Mega-cities in East Asia, in: American Geophysical Union, Fall Meeting 2019, San Francisco, USA, 8–14 December 2019, abstract #GC43G-1316, 2019.
Hu, W., Wu, R., and Liu, Y.: Relation of the South China Sea Precipitation Variability to Tropical Indo-Pacific SST Anomalies during Spring to Summer Transition, J. Climate, 27, 5451–5467, https://doi.org/10.1175/JCLI-D-14-00089.1, 2014.
Ihsan, N., Sivakumar, B., Fitsum, M. W., Srivastan, V. R., Minh, T. V., and Shie-Yui, L.: Spatial connections in regional climate model rainfall outputs at different temporal scales: Application of network theory, J. Hydrol., 556, 1232–1243, https://doi.org/10.1016/j.jhydrol.2017.05.029, 2018.
Jeong, J., Kim, B., Ho, C., and Noh, Y.: Systematic variation in wintertime precipitation in East Asia by MJO-induced extratropical vertical motion, J. Climate, 21, 788–801, https://doi.org/10.1175/2007JCLI1801.1, 2008.
Joo, H., Lee, M., Kim, J., Jung, J., Kwak, J., and Kim, H. S.: Stream gauge network grouping analysis using community detection, Stoch. Env. Res. Risk A., 35, 781–795, https://doi.org/10.1007/s00477-020-01916-8, 2021.
Kalnay, E., Kanamitsu, M., Kistler, R., Collins, W., Deaven, D., Gandin, L., Iredell, M., Saha, S., White, G., Woollen, J., Zhu, Y., Chelliah, M., Ebisuzaki, W., Higgins, W., Janowiak, J., Mo, K. C., Ropelewsk, C., Wang, J., Leetmaa, A., Reynolds, R., Jenne, R., and Josepth, D.: The NCEP/NCAR 40-Year Reanalysis Project, B. Am. Meteorol. Soc., 77, 437–471, https://doi.org/10.1175/1520-0477(1996)077<0437:TNYRP>2.0.CO;2, 1996.
Kim, K., Joo, H., Han, D., Kim, S., Lee, T., and Kim, H. S.: On complex network construction of rain gauge stations considering nonlinearity of observed daily rainfall data, Water, 11, 1–19, https://doi.org/10.3390/w11081578, 2019.
Kivelä, M., Arenas, A., Barthelemy, M., Gleeson, J. P., Moreno, Y., and Porter, M. A.: Multilayer networks, Journal of Complex Networks, 2, 203–271, https://doi.org/10.1093/comnet/cnu016, 2014.
Kosaka, Y., Xie, S., and Nakamura, H.: Dynamics of Interannual Variability in Summer Precipitation over East Asia, J. Climate, 24, 5435–5453, https://doi.org/10.1175/2011JCLI4099.1, 2020.
Kripalani, R. H. and Kulkarni, A.: Monsoon rainfall variations and teleconnections over South and East Asia, Int. J. Climatol., 21, 603–616, https://doi.org/10.1002/joc.625, 2001.
Lau, K. M. and Kim, K. M.: Observational relationships between aerosol and Asian monsoon rainfall, and circulation, Geophys. Res. Lett., 33, L21810, https://doi.org/10.1029/2006GL027546, 2006.
Li, H., Dai, A., Zhou, T., and Lu, J.: Responses of East Asian summer monsoon historical SST and atmospheric forcing during 1950–2000, Clim. Dynam., 34, 501–514, https://doi.org/10.1007/s00382-008-0482-7, 2010.
Lin, Z.: Intercomparison of the impacts of four summer teleconnections over Eurasia on East Asian rainfall, Adv. Atmos. Sci., 31, 1366–1376, https://doi.org/10.1007/s00376-014-3171-y, 2014.
Long, H. and Liu, X.: Multiresolution community detection in weighted complex networks, Int. J. Mod. Phys. C, 30, 1–15, https://doi.org/10.1142/S0129183119500165, 2019.
Maity, R., Chanada, K., Dutta, R., Ratnam, J. V., Nonaka, M., and Behera, S.: Contrasting features of hydroclimatic teleconnections and the predictability of seasonal rainfall over east and west japan, Meteorol. Appl., 27, e1881, https://doi.org/10.1002/met.1881, 2020.
Mester, A., Pop, A., Mursa, B. E. M., Grebla, H., Diosan, L., and Chira, C.: Network Analysis Based on Important Node Selection and Community Detection, Mathematics, 9, 2294, https://doi.org/10.3390/math9182294, 2021.
Newman, M. E. J.: Analysis of weighted networks, Phys, Rev., E70, 1–9, https://doi.org/10.1103/PhysRevE.70.056131, 2004.
Newman, M. E. J.: Communities, modules and large-scale structure in networks, Nat. Phys., 8, 25–31, https://doi.org/10.1038/nphys2162, 2012.
Newman, M. E. J. and Girvan, M.: Finding and evaluating community structure in networks, Phys. Rev. E, 69, 026113, https://doi.org/10.48550/arXiv.cond-mat/0308217, 2004.
Ozturk, U., Marwan, N., Korup, O., Saito, H., Agarwal, A., Grossman, M. J., Zaiki, M., and Kurths, J.: Complex networks for tracking extreme rainfall during typhoons, Chaos, 28, 075301, https://doi.org/10.1063/1.5004480, 2018.
Podlaha, A., Bowen, S., Lȯrinc, M., Kerschner, B., and Srivastava, G.: AON Empower Results: Global Catastrophe Recap 360 report, AON publications, London, England, 2020.
Renhe, Z. and Akimasa, S.: Moisture Circulation over East Asia during EL Nino Episode in Northern Winder, Spring and Autumn, J. Meteorol. Soc. Jpn., 80, 213–227, https://doi.org/10.2151/jmsj.80.213, 2002.
Riyu, L. and Zhongda, L.: Role of Subtropical Precipitation Anomalies in Maintaining the Summertime Meridional Teleconnection over the Western North Pacific and East Asia, J. Climate, 22, 213–227, https://doi.org/10.1175/2008JCLI2444.1, 2009.
Sahai, A., Pattanaik, D., Satyan, V., and Alice, M.: Teleconnections in recent time and prediction of Indian summer monsoon rainfall, Meteorol. Atmos. Phys., 84, 217–227, https://doi.org/10.1007/s00703-002-0595-1, 2003.
Scarsoglio, S., Laio, F., and Ridolfi, L.: Climate Dynamics: A Network-Based Approach for the Analysis of Global Precipitation, PLOS ONE, 8, e71129, https://doi.org/10.1371/journal.pone.0071129, 2013.
Singh, V. and Xiaosheng, Q.: Study of rainfall variabilities in Southeast Asia using long-term gridded rainfall and its substantiation through global climate indices, J. Hydrol., 585, 124320, https://doi.org/10.1016/j.jhydrol.2019.124320, 2020.
Sun, J. and Wang, H.: Changes of the connection between the summer North Atlantic Oscillation and the East Asian summer rainfall, J. Geophys. Res., 117, D08110, https://doi.org/10.1029/2012JD017482, 2012.
Szell, M., Lambiotte, R., and Thurner, S.: Multirelational organization of large-scale social networks in an online world, P. Natl. Acad. Sci. USA, 107, 13636–13641, https://doi.org/10.1073/pnas.1004008107, 2010.
The World Bank: Disaster Risk Management Overview, https://www.worldbank.org/en/region/eap/brief/disaster-risk-management (last access: 29 May 2015), 2015.
Uetz, A. M., Kalyvas, J., Miller, V., and Wegrzyn, K.: 2020 Global Supply Chain Disruption and Future Strategies Survey 365 Report, Foley & Lardner LLP publications, Detroit, USA, 20.MC28857, 2020.
Wang, Z., Mu, J., Yang, M., and Yu, X.: Reexaming the mechanisms of East Asian summer monsoon changes in response to non-East-Asian anthropogenic aerosol forcing, J. Climate, 33, 2929–2944, https://doi.org/10.1175/JCLI-D-19-0550.1, 2020.
Watts, D. J. and Strogatz, S. H.: Collective dynamics of “small-world” networks, Nature, 393, 440–442, https://doi.org/10.1038/30918, 1998.
Wolf, F., Bauer, J., Boers, N., and Donner R. V.: Event synchrony measures for functional climate network analysis: A case study on South America rainfall dynamics, Chaos, 30, 1–12, https://doi.org/10.1063/1.5134012, 2020.
Wu, R.: Relationship between Indian and East Asian summer rainfall variations, Adv. Atmos. Sci., 34, 4–15, https://doi.org/10.1007/s00376-016-6216-6, 2017.
Wu. R., Hu, Z., and Kirtman, B. P.: Evolution of ENSO-related rainfall anomalies in East Asia, J. Climate, 16, 3742–3758, https://doi.org/10.1175/1520-0442(2003)016<3742:EOERAI>2.0.CO;2, 2003.
Xu, X., Zhu, C., Wang, Q., Zhu, X., and Zhou, Y.: Identifying vital nodes in complex networks by adjacency information entropy, Sci. Rep.-UK, 10, 2691, https://doi.org/10.1038/s41598-020-59616-w, 2020.
Yuan, T. and Qie, X.: Study on lightning activity and precipitation characteristics before and after the onset of the South China Sea summer monsoon, J. Geophys. Res., 113, D14101, https://doi.org/10.1029/2007JD009382, 2008.
Zaidan, M. A., Haapasilta, V., Relan, R., Paasonen, P., Kerminen, V.-M., Junninen, H., Kulmala, M., and Foster, A. S.: Exploring non-linear associations between atmospheric new-particle formation and ambient variables: a mutual information approach, Atmos. Chem. Phys., 18, 12699–12714, https://doi.org/10.5194/acp-18-12699-2018, 2018.
Zhao, S., Liu, Z., Chen, Q., Wang, X., Shi, J., Jin, H., Liu, J., and Jian, Z.: Spatiotemporal variations of deep-sea sediment components and their fluxes since the last glaciation in the northern South China Sea, Sci. China Earth Sci., 60, 1368–1381, https://doi.org/10.1007/s11430-016-9058-6, 2017.