the Creative Commons Attribution 4.0 License.
the Creative Commons Attribution 4.0 License.
 | 18 Jan 2022
Disentangling sources of future uncertainties for water management in sub-Saharan river basins
Alessandro Amaranto
Dinis Juizo
Water management in sub-Saharan African river basins is challenged by an uncertain future climatic, social and economical patterns potentially causing diverging water demands and availability, and by multi-stakeholder dynamics, resulting in evolving conflicts and tradeoffs. In such contexts, a better understanding of the sensitivity of water management to the different sources of uncertainty can support policymakers in identifying robust water supply policies balancing optimality and low vulnerability against likely adverse future conditions. This paper contributes an integrated decision-analytic framework combining an optimization, robustness, sensitivity, and uncertainty analysis to retrieve the main sources of vulnerability to optimal and robust reservoir operating policies across multi-dimensional objective spaces. We demonstrate our approach on the lower Umbeluzi river basin, Mozambique, which an archetypal example of sub-Saharan river basin, where surface water scarcity compounded by substantial climatic variability, uncontrolled urbanization rate, and agricultural expansion are hampering the Pequenos Libombos dam's ability to supply the agricultural, energy, and urban sectors. We adopt an Evolutionary Multi-Objective Direct Policy Search (EMODPS) optimization approach for designing optimal operating policies, whose robustness against social, agricultural, infrastructural, and climatic uncertainties is assessed via robustness analysis. We then implement the generalized likelihood uncertainty estimation (GLUE) and PAWN uncertainty and sensitivity analysis methods for disentangling the main challenges to the sustainability of the operating policies and quantifying their impacts on the urban, agricultural, and energy sectors. Numerical results highlight the importance of a robustness analysis when dealing with uncertain scenarios, with optimal non-robust reservoir operating policies largely being dominated by robust control strategies across all stakeholders. Furthermore, while robust policies are usually vulnerable only to hydrological perturbations and are able to sustain the majority of population growth and agricultural expansion scenarios, non-robust policies are sensitive also to social and agricultural changes and require structural interventions to ensure stable supply.
- Article
(3897 KB) - Full-text XML
- BibTeX
- EndNote


The availability of freshwater is a limiting factor to food production, energy generation, and industrial consumption around the globe (Hermoso, 2017; Zampieri et al., 2018). Investing in new infrastructure is still the predominant option to expand the storing and conveying capacity of freshwater, particularly in sub-Saharan Africa and southeast Asia, which are areas that have a larger untapped potential (Fields et al., 2009). Yet, this hard path water solution is evoking contentious debates for the considerable environmental and social costs of damming rivers (Moran et al., 2018), reaching a point that the efficient operation of existing infrastructure, rather than planning new ones, is becoming critical to balance the tradeoffs between supply and demand (Gleick and Palaniappan, 2010). In sub-Saharan Africa, more than 2000 dams have been built, and over 200 are currently under construction to enhance food security and increase hydropower production (Kibret et al., 2016). However, projected changes in climate, population growth, and agricultural patterns will likely challenge the ability of the existing and planned dams to produce the level of benefits that triggered the investment for their construction (Giuliani et al., 2016b). Understanding the impact of those uncertainty sources on reservoir operation is, therefore, key for developing robust operating policies that support policymakers towards sustainable river basin management.
An archetypal example of a highly regulated, fast-evolving sub-Saharan hydrosystem is the lower Umbeluzi river basin, Mozambique. About 45 km upstream of its delta in Maputo Bay, the river flows in the Barragem de Pequenos Libombos reservoir, which is operated to balance hydropower production, urban supply to the 2 million inhabitants of Maputo Province, and irrigation supply of the 3600 ha of agricultural districts, which are mostly growing tropical fruits and sugarcane. A still ongoing 5-year-long drought has boosted crop prices by about 50 %, hindering food access to a population currently growing at rate of 0.6 % per year and exacerbating conflicts among the urban, agricultural, and energy sectors. Droogers et al. (2014) estimated a further annual increase of 2 % in the urban population and of 2 % in irrigated area for the coming decades, while a projected 10 % climate-change-induced reduction in precipitation seriously endangers the existing fragile equilibrium among sectors. To cope with the expected growth in water scarcity, the World Bank is funding the Greater Maputo Water Supply Expansion Project, which is a sequence of infrastructural interventions aimed at supplying the city of Maputo with an additional inflow from the Sabie River basin. Started in 2013, the project is expected to be completed in the years that follow. The uncertain evolution of climatic, agricultural, infrastructural, and social patterns in the area calls for assisting policymakers in (1) the development of robust reservoir operating policies, (2) a deep understanding of the main sources of vulnerability challenging the sustainability of water supply strategies, and (3) a quantitative assessment of the impact of such uncertainty sources across the agricultural, energy, and urban sectors.
To do so, we implement an integrated decision-analytic framework combining an optimization, robustness, sensitivity, and uncertainty analysis with the threefold objectives of (1) designing operating policies that integrate optimality with low vulnerability against likely adverse future conditions, (2) retrieving the main sources of vulnerability to water infrastructure operation across a multidimensional objective space, and (3) identifying the evolution in the system drivers which causes a policy to become unsustainable.
The framework is composed of an optimization routine based on the evolutionary multi-objective direct policy search (EMODPS) to design optimal control policies, whose robustness against deeply uncertain (i.e., with unknown probability of occurrence) climate, socioeconomic, and infrastructural scenarios is then tested by means of a robustness analysis. To discover the main uncertainty sources and apportion their specific impact on the hydrological system, we employ the generalized likelihood uncertainty estimation (GLUE; Beven and Binley, 1992) and the PAWN density-based sensitivity analysis (SA) method (Pianosi and Wagener, 2015), respectively.
The main sources of uncertainty that we consider are the projected increase in water demand following urbanization (population uncertainty) and irrigation development (agricultural uncertainty) in the area, the magnitude of streamflow depletion due to climate change (climatic uncertainty), and the completion date of the Greater Maputo Water Supply Expansion Project (infrastructural uncertainty). The proposed methodology builds upon recent studies in the field of multi-objective reservoir operation (Giuliani et al., 2016b, 2019; Denaro et al., 2017; Zaniolo et al., 2018, 2019) and of multi-objective robust decision-making (Giudici et al., 2020; Herman et al., 2015) by employing SA to investigate the role of uncertain exogenous drivers in shaping the effectiveness of optimal control policies across multiple competing sectors. So far, even though it has been recognized that optimal planning and control methods should employ SA to identify water resources system vulnerabilities to both structural and parametric uncertainties (Herman et al., 2019), only few studies have developed quantitative analyses to support water resource planning (e.g., Herman et al., 2015; Trindade et al., 2017, 2019; Groves et al., 2019). To the best of the authors' knowledge, the only application coupling SA with reservoir operation and control problems is represented by Quinn et al. (2019), where SA was employed with the aim of understanding how optimized nonlinear control policies use endogenous information (reservoir state) to prescribe releases in a multi-reservoir, multi-objective context. Our framework complements the findings by Quinn et al. (2019) by investigating the role of uncertain exogenous drivers in shaping the effectiveness of optimal operating policies to sustain the agricultural, urban, and energy sectors.
2.1 The Umbeluzi river basin
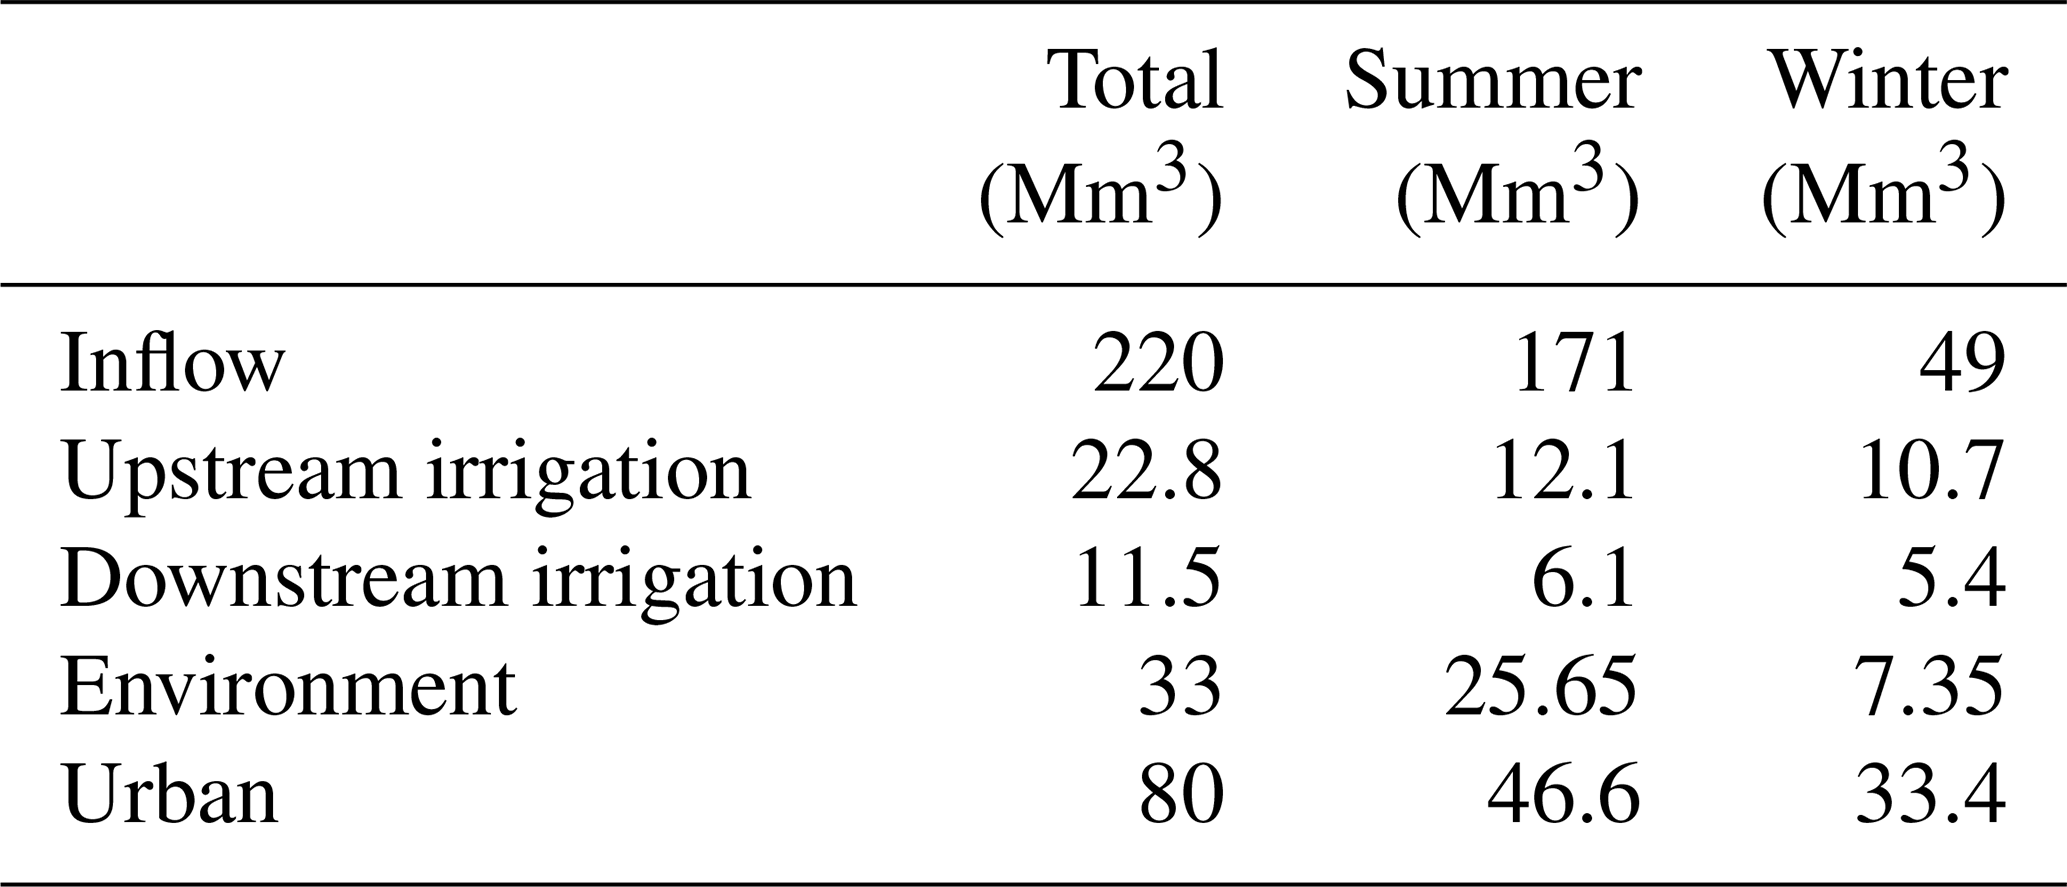
The Umbeluzi river flows across three countries (South Africa, Eswatini, and Mozambique), draining an area of about 5400 km2 (Fig. 1a) before discharging in the Indian Ocean through the Espírito Santo Estuary south of Maputo (Juizo and Hjorth, 2009). The hydroclimatic regime is subtropical, with hot and wet summers from November to May, followed by dry, warm winters from June to October (Fig. 2a and b). The average annual streamflow in the lower Umbeluzi (regulated through the Mnjoli Dam in Eswatini, in the upstream part of the river basin) is of about 220 Mm3 (corresponding to 7 m3 s−1) and, following the hydroclimatic pattern, is unevenly partitioned through seasons, with 78 % of the total discharge occurring in summer (171 Mm3; corresponding to 9.3 m3 s−1) and the remaining 22 % in winter (49 Mm3; 3.75 m3 s−1). As far as the interannual variability is concerned, the Umbeluzi river basin is characterized by frequent prolonged droughts, with the average inflow reduced to only 119 and 100 Mm3 in 2007 and 2015, respectively. Excluding the year 2000, where a terrible flood hit Mozambique, causing about 800 fatalities, the wettest year among those on record (2006–2016) was 2010, when the total discharge volume reached about 360 Mm3.
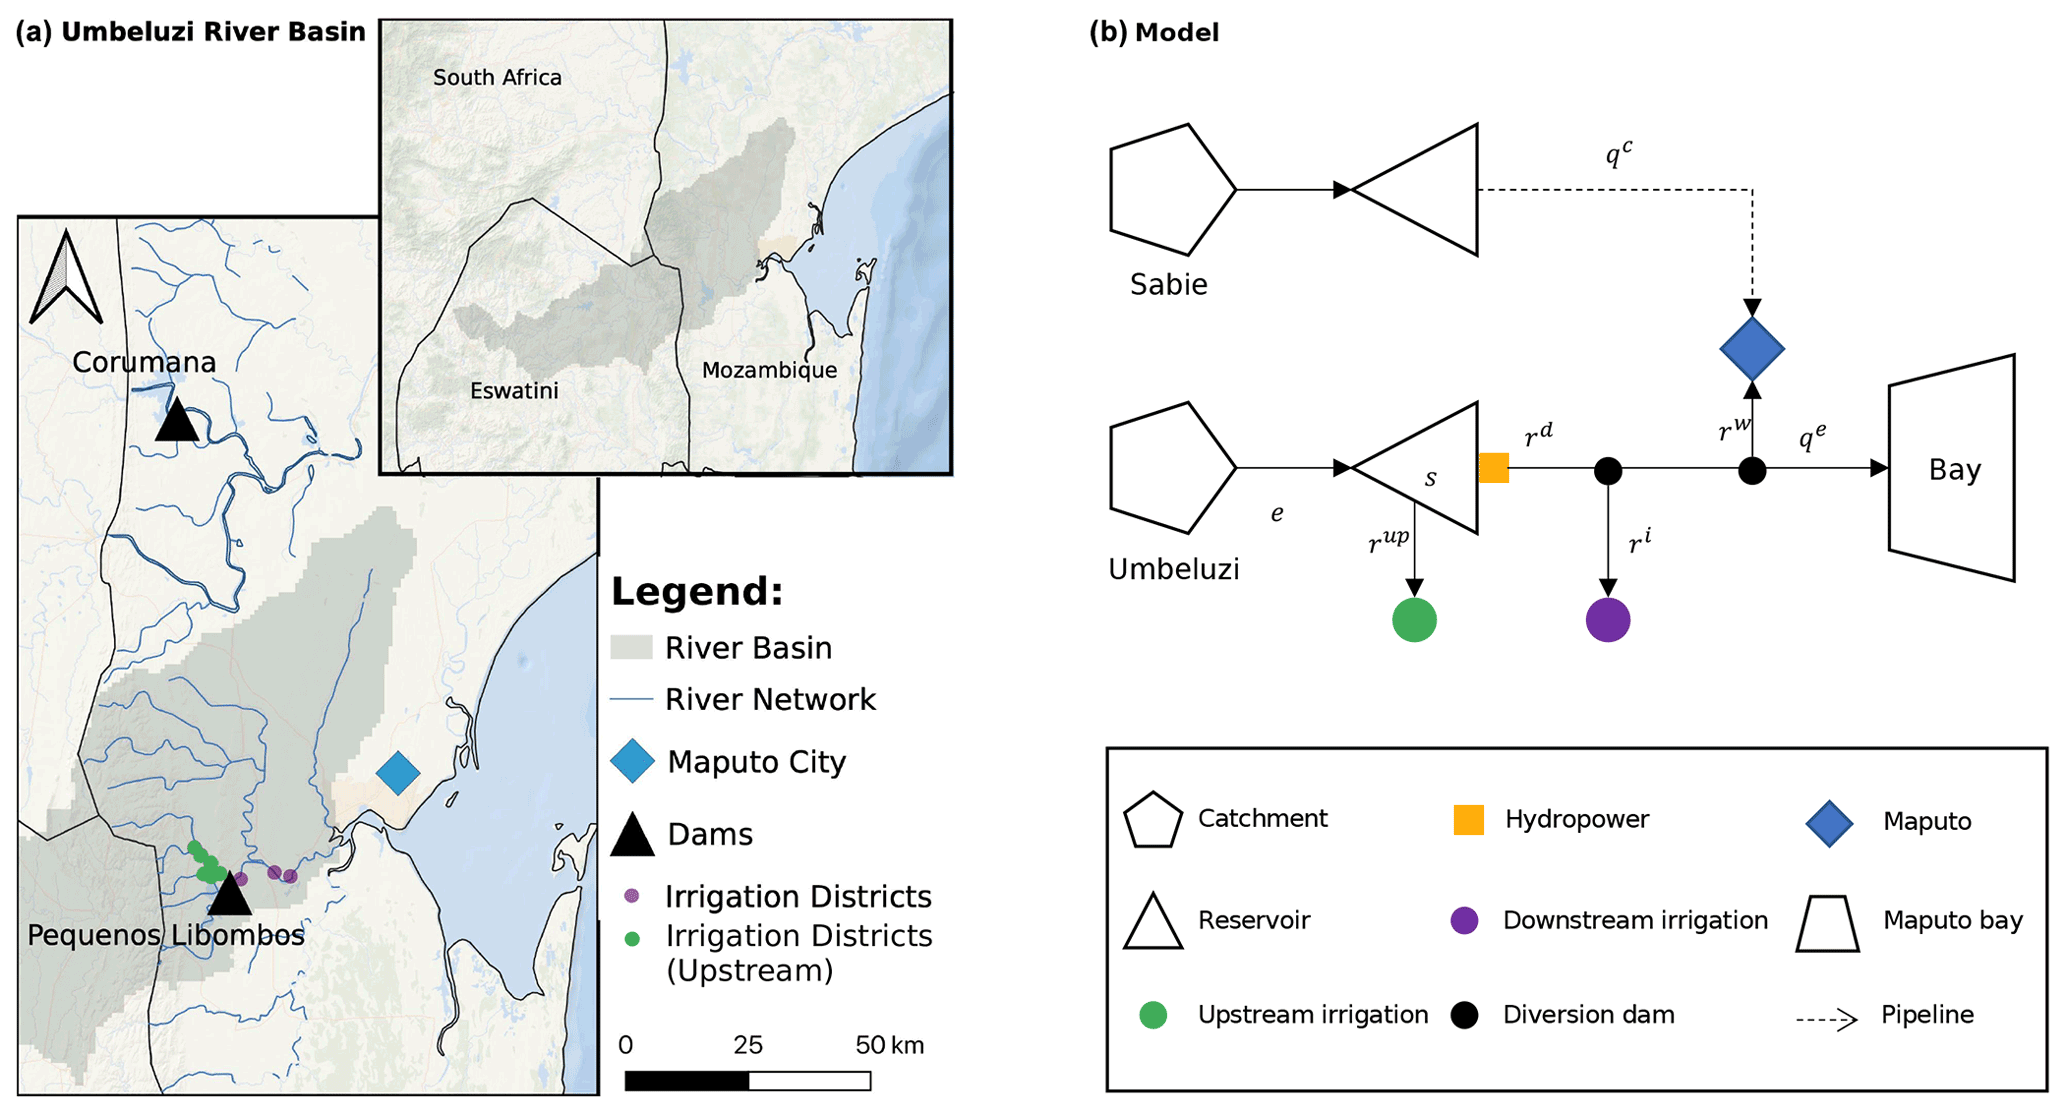
Figure 1(a) Study Area. (b) Topological map of the system.
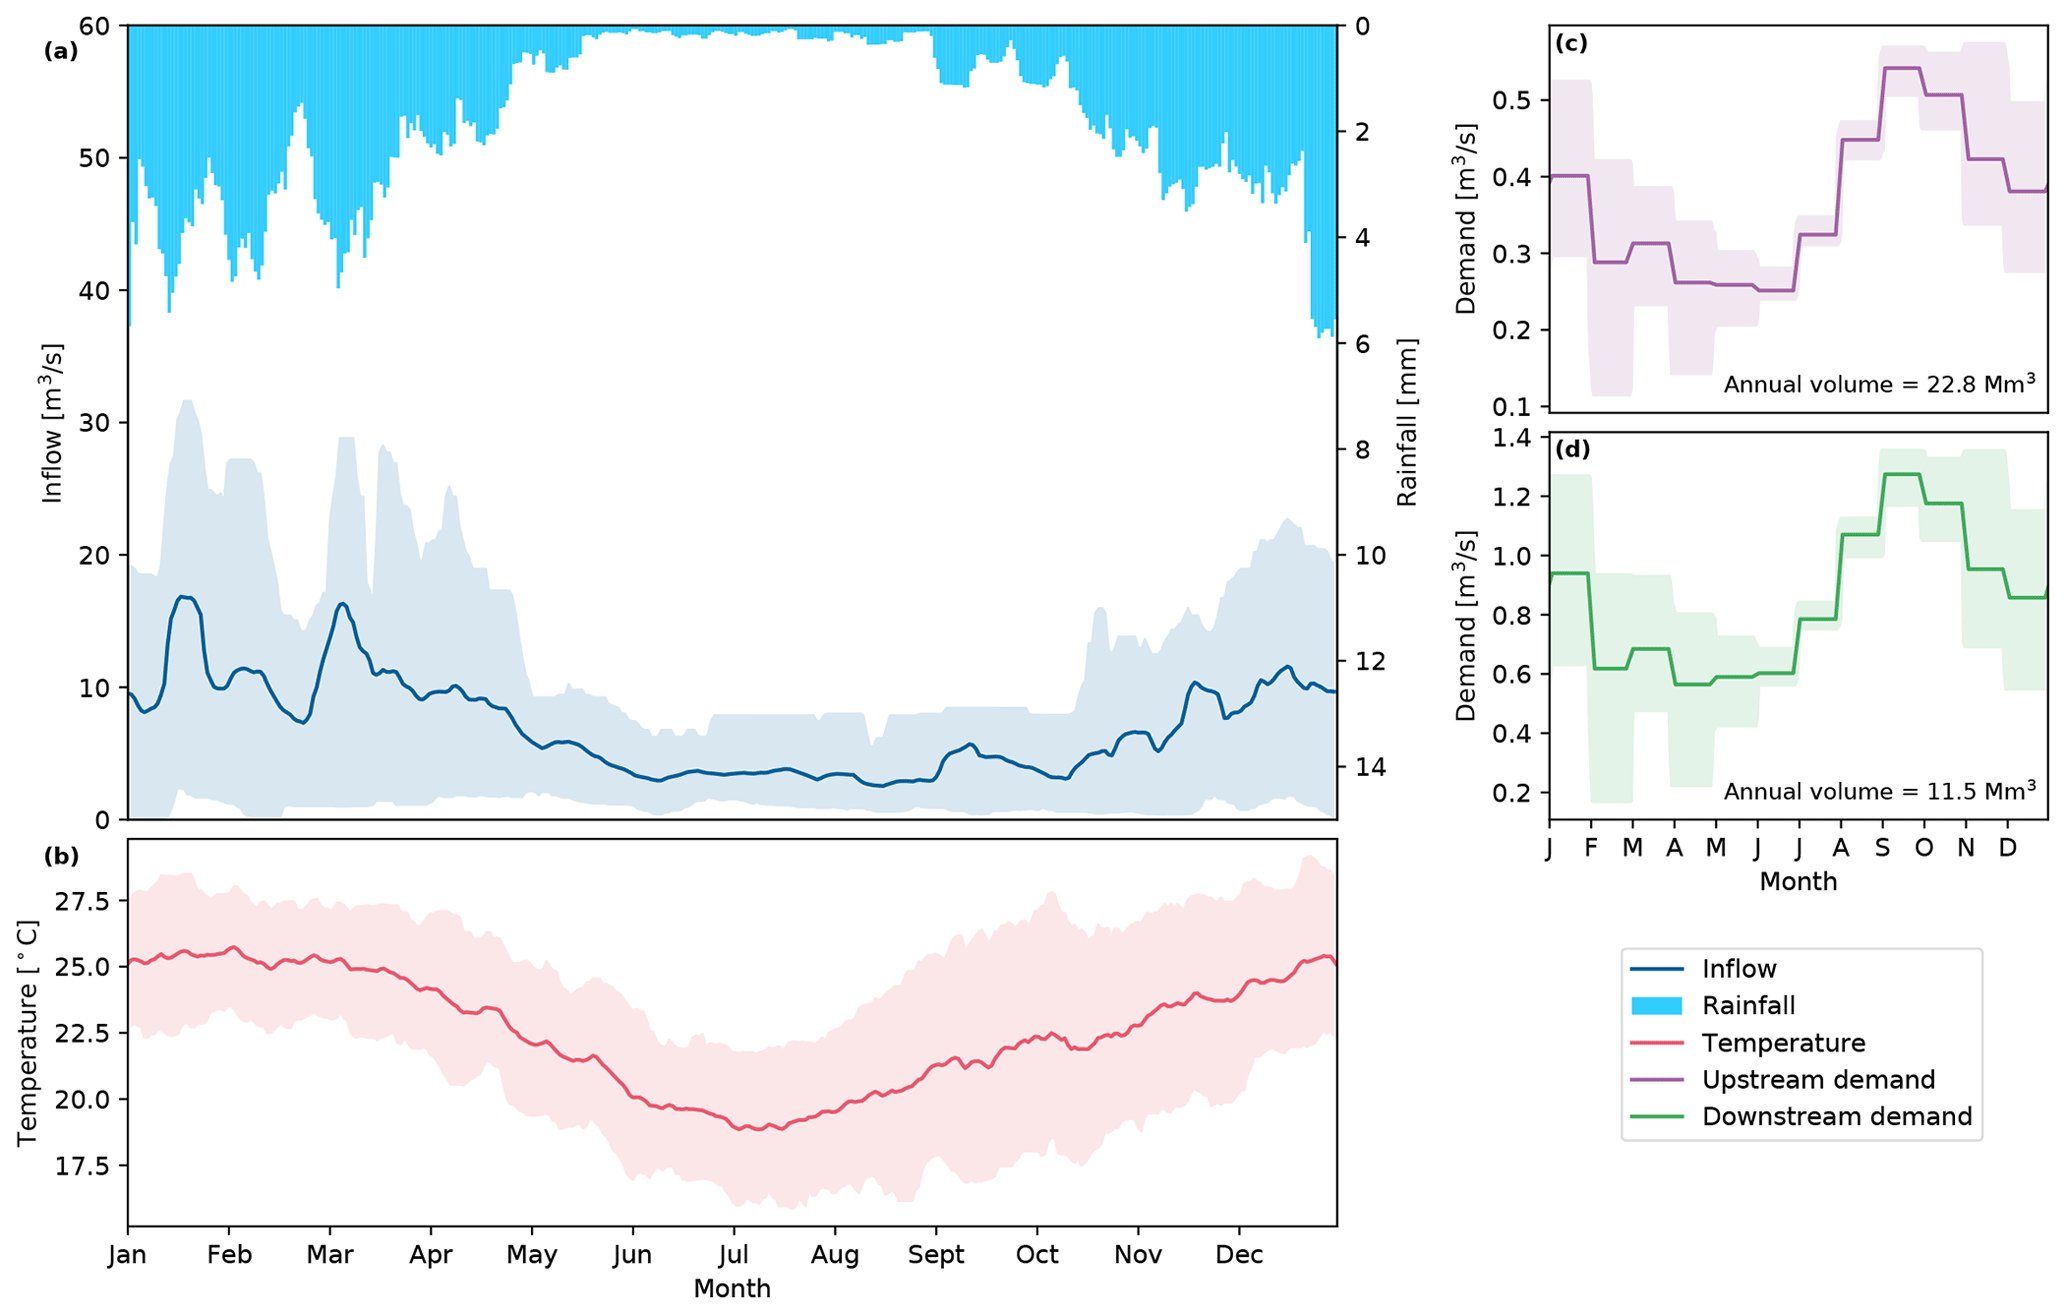
Figure 2Cyclostationary average of the main hydroclimatic variables computed over a 10 d moving window. (a) Precipitation and streamflow, (b) temperature, (c) downstream irrigation demand, and (d) upstream irrigation demand. The shaded areas represent the 10th–90th interquartile range for each variable.
About 40 km upstream of the estuary, the river flows into the Pequenos Libombos Dam (BPL). The dam has a storage capacity (including 10.2 Mm3 of inactive storage) of 382 Mm3. The BPL was constructed in 1987 with the goal of supplying water to the metropolitan area of greater Maputo (including the municipalities of Maputo, Matola, and Boane), especially during winter, when the system is often exposed to droughts. Other operation targets include hydropower generation and irrigation supply, both upstream and downstream of the reservoir. Upstream irrigation districts extend for about 2500 ha and have an yearly water demand of 22.8 Mm3 (Fig. 2c). They abstract water directly from the reservoir to grow mainly tropical fruits (mango and bananas). Water is discharged from the dam into a power plant with a capacity of 1.8 MW. After flowing through the turbine, the reservoir releases serve both urban and irrigation (bananas and sugarcane) demands, which are estimated at around 80 and 11.5 Mm3 yr−1 (Fig. 2c), respectively. To preserve ecosystem sustainability, a minimum flow constraint, corresponding to 15 % of the cyclostationary monthly inflow, is imposed in the estuary. A summary of the main hydroclimatic patterns across seasons, including aggregated values of water demands by sectors, is provided in Table 1.
Table 1Summary of the main hydroclimatic variables and water demand sources aggregated by sector.
Recently, a remarkable decrease in rainfall frequency and intensity has caused the reservoir storage to drop up to less than one-fifth of its maximum capacity, forcing local authorities to suspend distribution for irrigation in 2016 (Macauhub, 2016) in order to ensure continuity in urban supply. This dry pattern is expected to be further exacerbated by climate change in the coming years, with an estimated precipitation decrease of about 10 % and a temperature increase of 3 ∘C (Droogers et al., 2014).
To mitigate the effect of frequent and prolonged drought episodes hitting southern Mozambique, the World Bank have recently financed the Greater Maputo Water Supply Expansion project (GMWSEP; Miguel, 2019). The project consists of a set of infrastructural interventions, mainly constituted by a water treatment plant downstream the Corumana dam, in the adjacent Sabie River basin, and by a 95 km pipeline connecting the Corumana dam with the city of Maputo, ensuring an additional water supply capacity of qC of 1.8 m3 s−1 (about 70 % of the current urban water demand). The GMWSEP is expected to play a key role in not only mitigating drought effects but also in sustaining the rapidly increasing population of Maputo.
2.2 Umbeluzi model
We model the Umbeluzi river system (Fig. 1b) using a combination of conceptual and empirical models, assuming a daily time step for both physical processes and decisions. The BPL dynamics are described by the mass balance equation of the water volume st stored in the reservoir as follows:
where et+1 is net inflow to the reservoir in the interval [t; t+1] (i.e., inflow minus evaporation and seepage losses) and rt+1 is the volume released in the same interval. This is further decomposed into and , representing the downstream releases for hydropower production, urban and irrigation supply, and the upstream pumping to the upstream irrigation districts, respectively. The actual releases , and are formulated according to the nonlinear stochastic relations f1(⋅) and f2(⋅) between , and the release decisions and (Piccardi and Soncini-Sessa, 1991). The latter are in fact constrained by physical constraints (i.e., spillway activation and inactive storage threshold) within a discretionary operating space by the maximum and minimum feasible release function (see Soncini-Sessa et al., 2007, for more details). In particular, the minimum release function constrains the release to zero in case the available volume in the reservoir st equals the inactive storage (10.2 Mm3 s−1), while the maximum hydraulic outflow (including both upstream and downstream releases) can be formulated as follows:
Such constraints, in turn, imply interdependence among the release decisions, so that the total release never exceeds the feasible release. We assume here feedback operating rules, parametric in ζ, where decisions are conditioned upon the current system conditions, as follows:
where It represents the information upon which the policy is based. The analytical expression for the functions f and g depends upon the optimization problem formulation, and it is provided in Sect. 3.2.2.
The aggregated downstream irrigation supply is modeled by means of a diversion dam, represented mathematically with an empirical exponential function (Celeste and Billib, 2009) parametric in α and β of the following form:
where is the aggregated downstream irrigation demand (Fig. 2d). Equation (4) defines the fraction of releases to be diverted for irrigation purposes as inversely proportional to α and exponentially growing with respect to β. It follows that, according to the values assumed by such parameters, urban supply could (as it occurs, for example, in the case of or for β>1 when ) or could not () be placed in the foreground with respect to irrigation. Even though this does not correspond to the actual operating rule of the diversion dam (which systematically prioritizes urban supply in the case of water scarcity conditions), this study aims at exploring the whole irrigation–urban supply tradeoff. Therefore, Eq. (4) is set such that solutions that also favor irrigation could be discovered.
The periodic sequence of the control laws (over a period of 365 d) described in Eqs. (3a), (3b), and (4) constitutes the control policy πθ, where represents the vector of the control policy parameters.
The diversion rules allow hedging the water abstractions to account for downstream users (i.e., the city of Maputo), and the actual diverted flows are constrained by the environmental flow requirement in the Espírito Santo Estuary as follows:
where qmax is the maximum diversion channel capacity.
Finally, the amount of water to be diverted for urban supply to the city of Maputo is computed as follows:
where is the urban demand.
The data necessary for the implementation of the analysis for the time period of December 2016–January 2006 were provided by the Administração Regional de Águas (ARA) do Sul, which is the water agency responsible for river basin management in southern Mozambique (including the Umbeluzi).
3.1 Integrated decision-analytic framework
The integrated decision-analytic framework we adopted is represented in Fig. 3. The approach is composed of three main blocks, namely optimization (O), robustness (R), and sensitivity uncertainty (SU).
Block O is responsible for generating operating policies which are optimal under historical conditions. Block R extracts the optimal policies that are also robust against future changes in climate (climatic uncertainty), irrigation demand (irrigation demand uncertainty), infrastructures (infrastructural uncertainty), and urban demand (population uncertainty). Block SU bridges robust policies (RPs) with the operating objectives variability in response to uncertain input realizations and allows the identification of the main sources of vulnerability for the hydrosystem.
The three blocks are interconnected as follows: first, to explore tradeoffs among stakeholders under the historical climatic, agricultural, infrastructural, and urban demand drivers value (i.e., the baseline), we define the operating objectives, and run a multi-objective evolutionary algorithm to identify the optimal operating policies via optimization-based simulation. Then, we assess their robustness with respect to the future evolution of the drivers by perturbing the baseline across all the four (climatic, agricultural, infrastructural, and population) uncertainty dimensions to generate the states of the world (SOWs). We then re-simulate the system iteratively perturbed by the SOWs for each of the optimal operating policies identified via optimization and compute the worst objective function values. The robust policy for each stakeholder is subsequently identified as that yielding the best performances in the worst condition (minimax robustness metric). To disentangle the sources of vulnerability for the RPs, we implemented an uncertainty and sensitivity analysis framework. In particular, uncertainty analysis is employed to quantify the objective function variability in response to the uncertain future evolution of the system's drivers. Here, following the well-known definition of behavioral parameters (Beven and Binley, 1992; Montanari, 2005), we identify the behavioral system perturbations as those SOWs satisfying predefined performance requirements, i.e., those yielding acceptable objective function values. A sensitivity analysis is responsible for determining the relative contribution of each individual uncertainty source in shaping the objective space and for ranking them across policies and objectives by means of a sensitivity index.
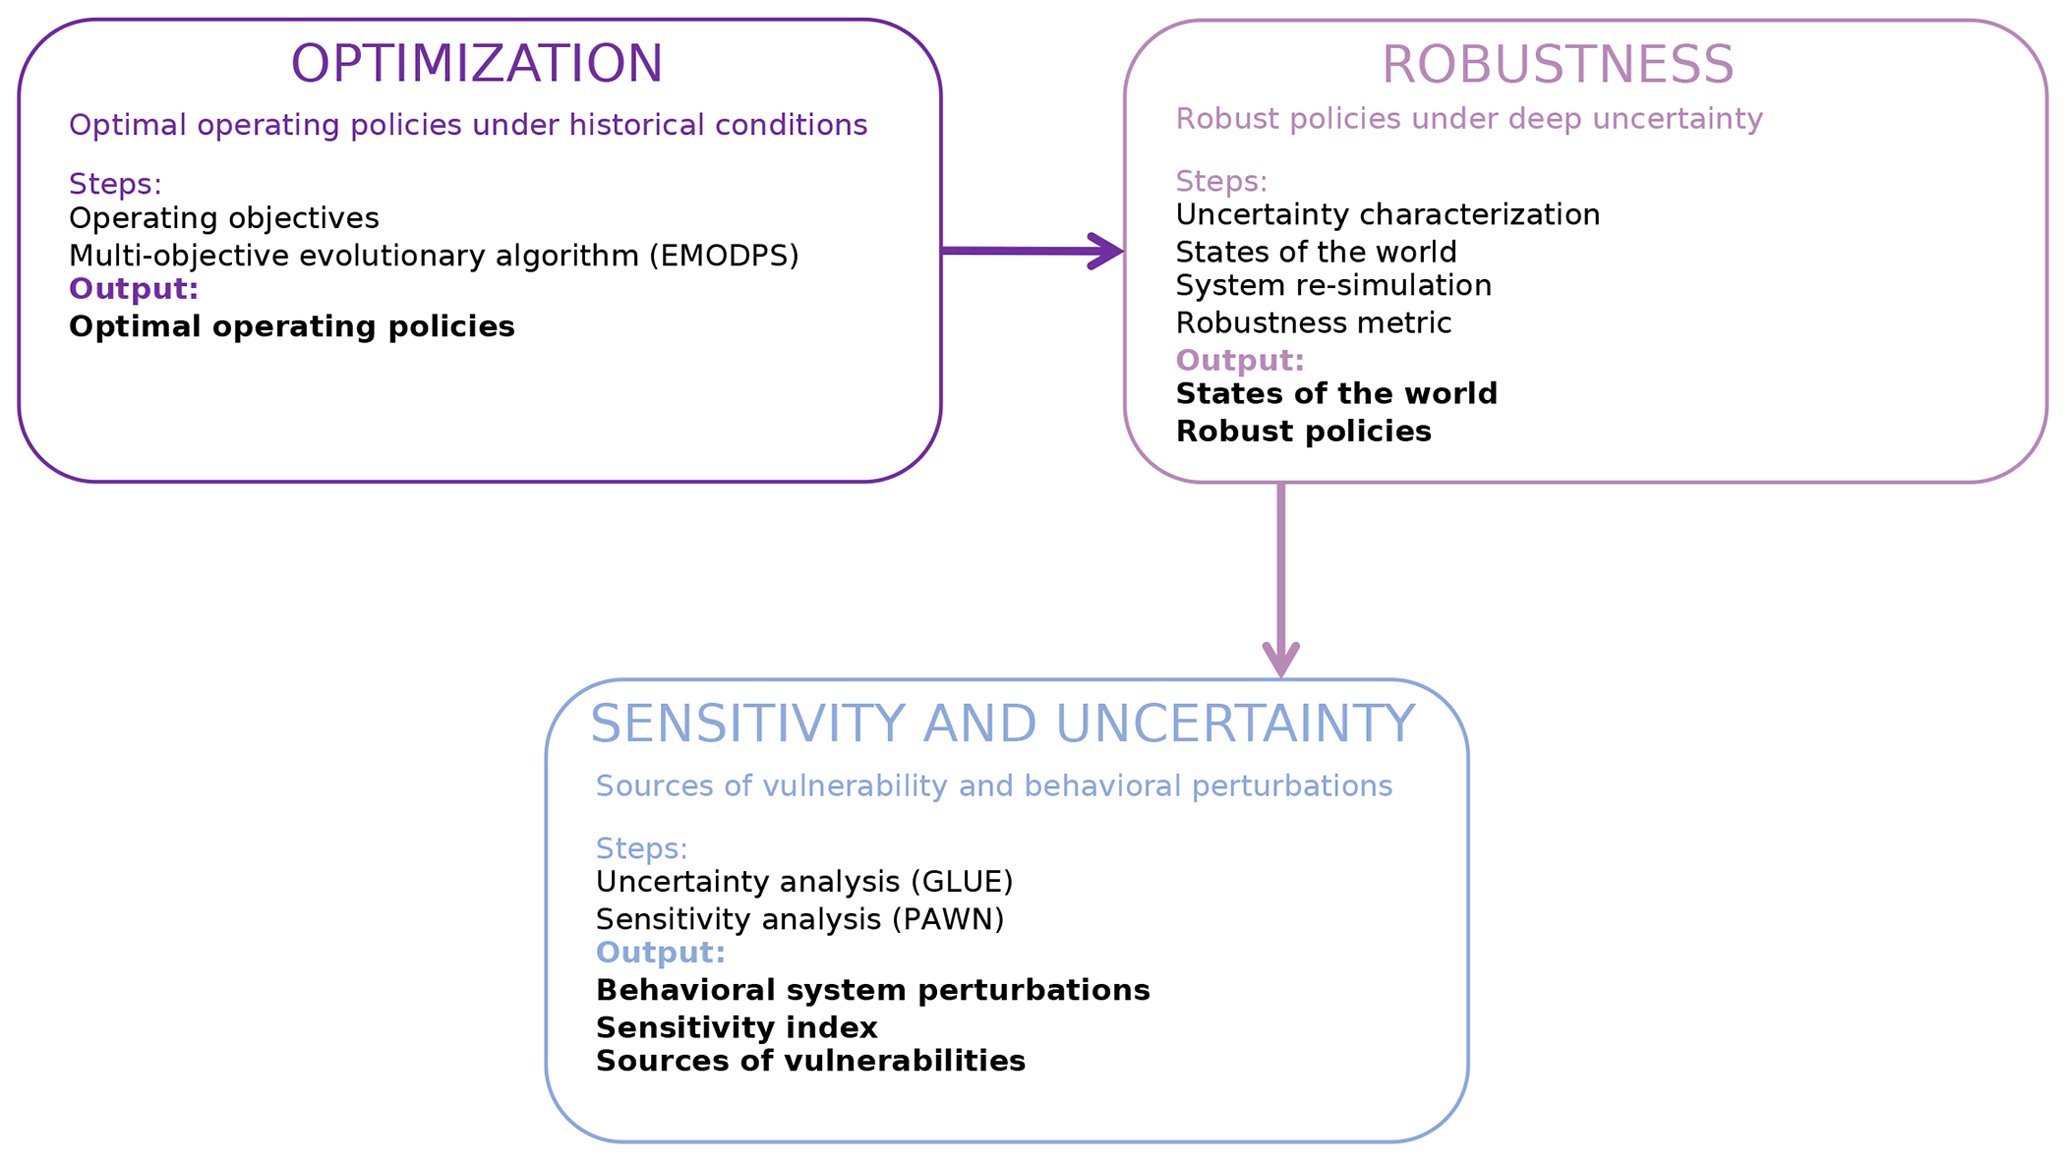
Figure 3The integrated decision-analytic framework adopted in this study. Bold text identifies the output of a certain block which enters the subsequent block.
Further details about each block in Fig. 3 are provided in the following sections.
3.2 Optimization
3.2.1 Operating objectives
We model the stakeholders affected by the operation of the BPL dam through the following four utility functions.
-
The upstream irrigation deficit JIU, which is expressed as the square difference between water supply and demand (to be minimized) as follows:
where N (days) is the simulation horizon, Ny are the number of years in the simulation horizon, and bt is a weight representing higher losses when the deficit occurs during the growing season. and are the irrigation demand and the amount of water pumped from the reservoir to upstream irrigation, respectively. The quadratic water supply deficit has been a traditional formulation in reservoir operations since the work by Hashimoto et al. (1982). The square of the irrigation deficit accounts, in fact, for crop vulnerability by penalizing higher shortages, which are more likely to compromise the crop growth with respect to more frequent but smaller shortages, which are less dangerous to the crops.
-
The downstream irrigation deficit JID is defined similarly as in Eq. (7) (to be minimized) as follows:
where and are the irrigation demand and the reservoir releases diverted for downstream irrigation, respectively.
-
The urban deficit for the city of Maputo JUD is computed as the difference between urban supply and demand (to be minimized) as follows:
where , , and are the urban demand, the reservoir release diverted for urban supply, and the additional inflow from Corumana dam, respectively.
-
The hydropower production in the BPL power plant JHP (to be maximized) is as follows:
where HPt is the hydropower production (MWh) on day t, which is defined as follows:
where η is the turbine efficiency (70 %), g=9.81 m/s2 is the gravitational acceleration, γw=1000 kg/m3 is the water density, ht is the net hydraulic head, and is the turbine flow.
3.2.2 EMODPS
The optimal operating policies under the baseline are designed using evolutionary multi-objective direct policy search (EMODPS) (Giuliani et al., 2016b). EMODPS is a simulation-based optimization approach which has been recently demonstrated (Giuliani et al., 2016b) to successfully overcome the major limitations associated with traditional stochastic dynamic programming (i.e., curses of dimensionality, modeling, and multiple objectives) and derivatives. It is constituted by the following three main modules: (1) direct policy search (DPS), (2) nonlinear approximating networks, and (3) multi-objective evolutionary algorithms (MOEAs).
DPS is employed to explore the parameter space of the system operating policy πθ that optimizes the expected long-term cost as follows:
where, in the following:
is subject to Eqs. (1) to (6), where finding means finding (1) the optimal parameters of the BPL reservoir operating policy and (2) the optimal parameters for the regulation of the irrigation diversion canal. The parameters are intended to be optimal with respect to the objectives Jθ. The reservoir operating policy is selected such that policy inputs It can provide information feedback for the upstream and downstream release decisions . In this study, it is represented with a nonlinear approximating network of the Gaussian radial basis function (RBF) family, which is known for their generalization ability and robust performances in validation (Giuliani et al., 2016b; Quinn et al., 2019).
Mathematically, the operating policy can be expressed as follows:
where n is the number of RBFs, is the weight of each RBF, m is the number of inputs, and c and b are the center and radii of the RBF. The reservoir operating policy parameter vector is therefore constituted as , and the number of parameters nζ to be found is n(2m+k).
The input vector includes the previous day's inflow to the reservoir et, the storage in the reservoir st, and time t, which is here represented by a combination of sine and cosine functions and .
Following Giuliani et al. (2016a), the number n of RBFs is set to . In addition to those of the reservoir operating policy, the two parameters α and β of the power law employed to approximate the diversion dam (as in Eq. 4) also need to be optimized. Following the above, the dimension of the parameter space equals .
In order to explore the parameter space and discover optimal values, we employ multi-objective evolutionary algorithms (MOEAs). The term evolutionary refers to the natural randomized mating, selection, and mutation processes that are mimed by the algorithms to evolve a Pareto-approximate set of solutions (Deb, 2001; Coello et al., 2007). MOEAs have proved to successfully deal with complex multi-objective optimization problems, including water reservoir operations (Maier et al., 2014). In this study, we employ the self-adaptive Borg MOEA (Hadka and Reed, 2013), which has been shown to guarantee high robustness in solving a variety of multi-objective problems when compared to other MOEAs (Salazar et al., 2016).
3.3 Robustness
We perform a robustness analysis with the aim of evaluating the robustness of the various operating policies identified via EMODPS over an ensemble of future realizations of the climatic, agricultural, infrastructural, and urban demand drivers. According to Herman et al. (2015), a robustness analysis is usually carried out by performing the following sequential steps: (1) generation of alternative policies, (2) sampling of possible future scenarios, and (3) computation of robustness metric via system re-simulation. Table 3 provides a conceptualization of the three aforementioned steps tailored upon this study, following the well known XLRM framework (Lempert, 2003). In the framework, X values are the exogenous uncertainty sources, L (of lever) values are the different alternative water management strategies (i.e., the policies identified via optimization) to be explored, M (of measure) values refer to the performance metrics used to rank the desirability of the different policies (L) in the face of the exogenous uncertainties (X), and, finally, R values refer to relationships in the system (i.e., the model), which define how the exogenous uncertainties (X), policies (L), and the outcomes (M) are tied together and relate to each other (Ciullo et al., 2019).
Table 2Conceptualization of the robustness analysis implemented in this study.
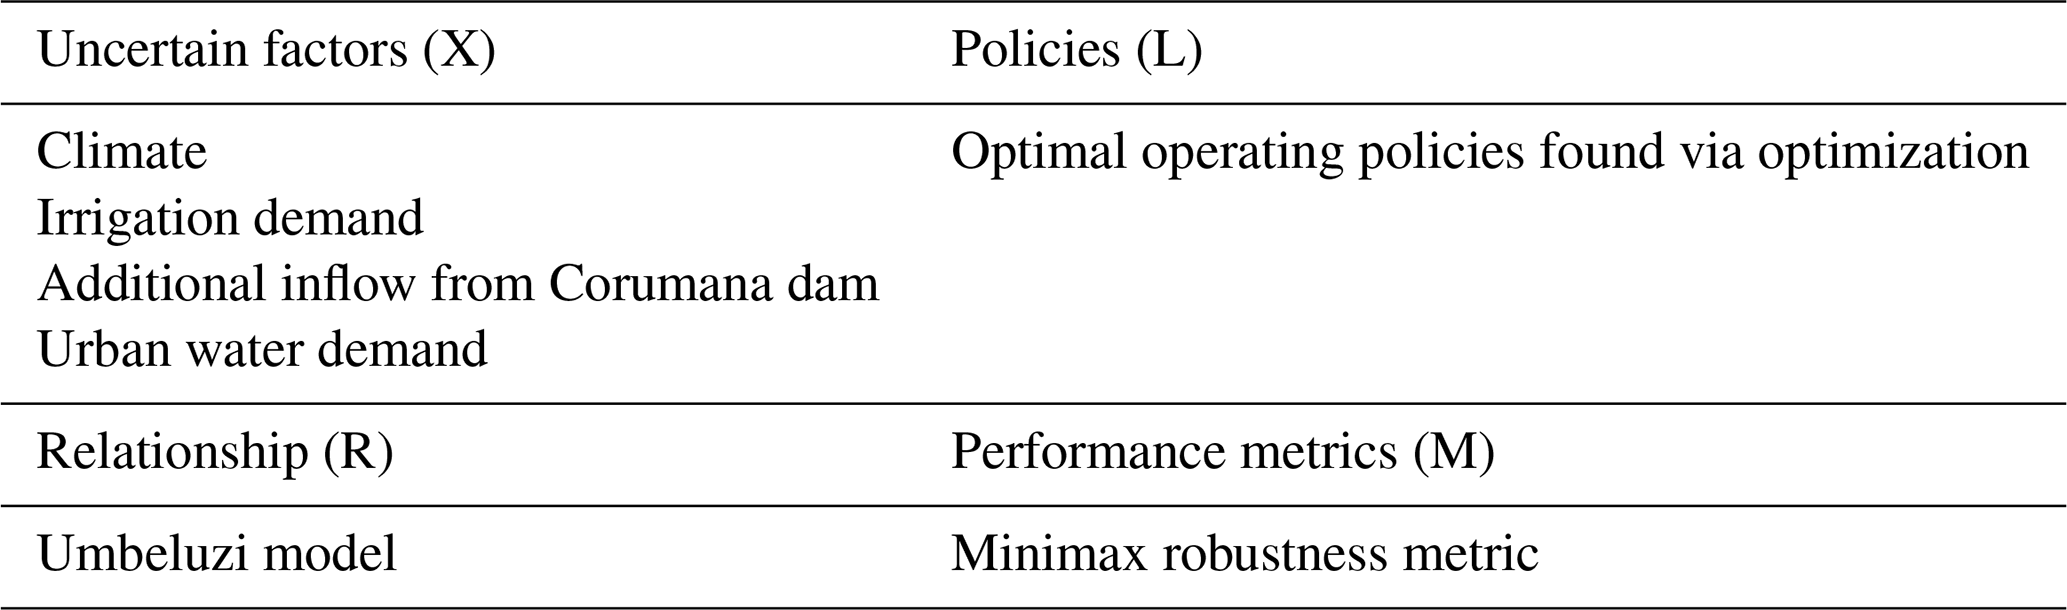
In other words, the alternative operating policies are those identified via optimization, while the generation of future scenarios is performed by perturbing historical trajectories, assuming independent uniform distribution for the perturbation multipliers (Pianosi and Wagener, 2016). The multiplier range is either defined by a priori expert knowledge of the system or based on experimental results. Climatic, agricultural, infrastructural, and population scenarios are then combined to generate a set of uncertain states of the world. Then, the Umbeluzi model is used to re-simulate the system for each policy across all the SOWs. Each simulation produces a performance metric, used to assess the robustness of each policy. Among the robustness metrics available in the literature (for a review, see McPhail et al., 2018), we select minimax, a metric that identifies the solution providing the best performance assuming the realization of the worst conditions.
More details on the formulation of states of the world and on the robustness metrics are provided below.
3.3.1 Formulation of the states of the world
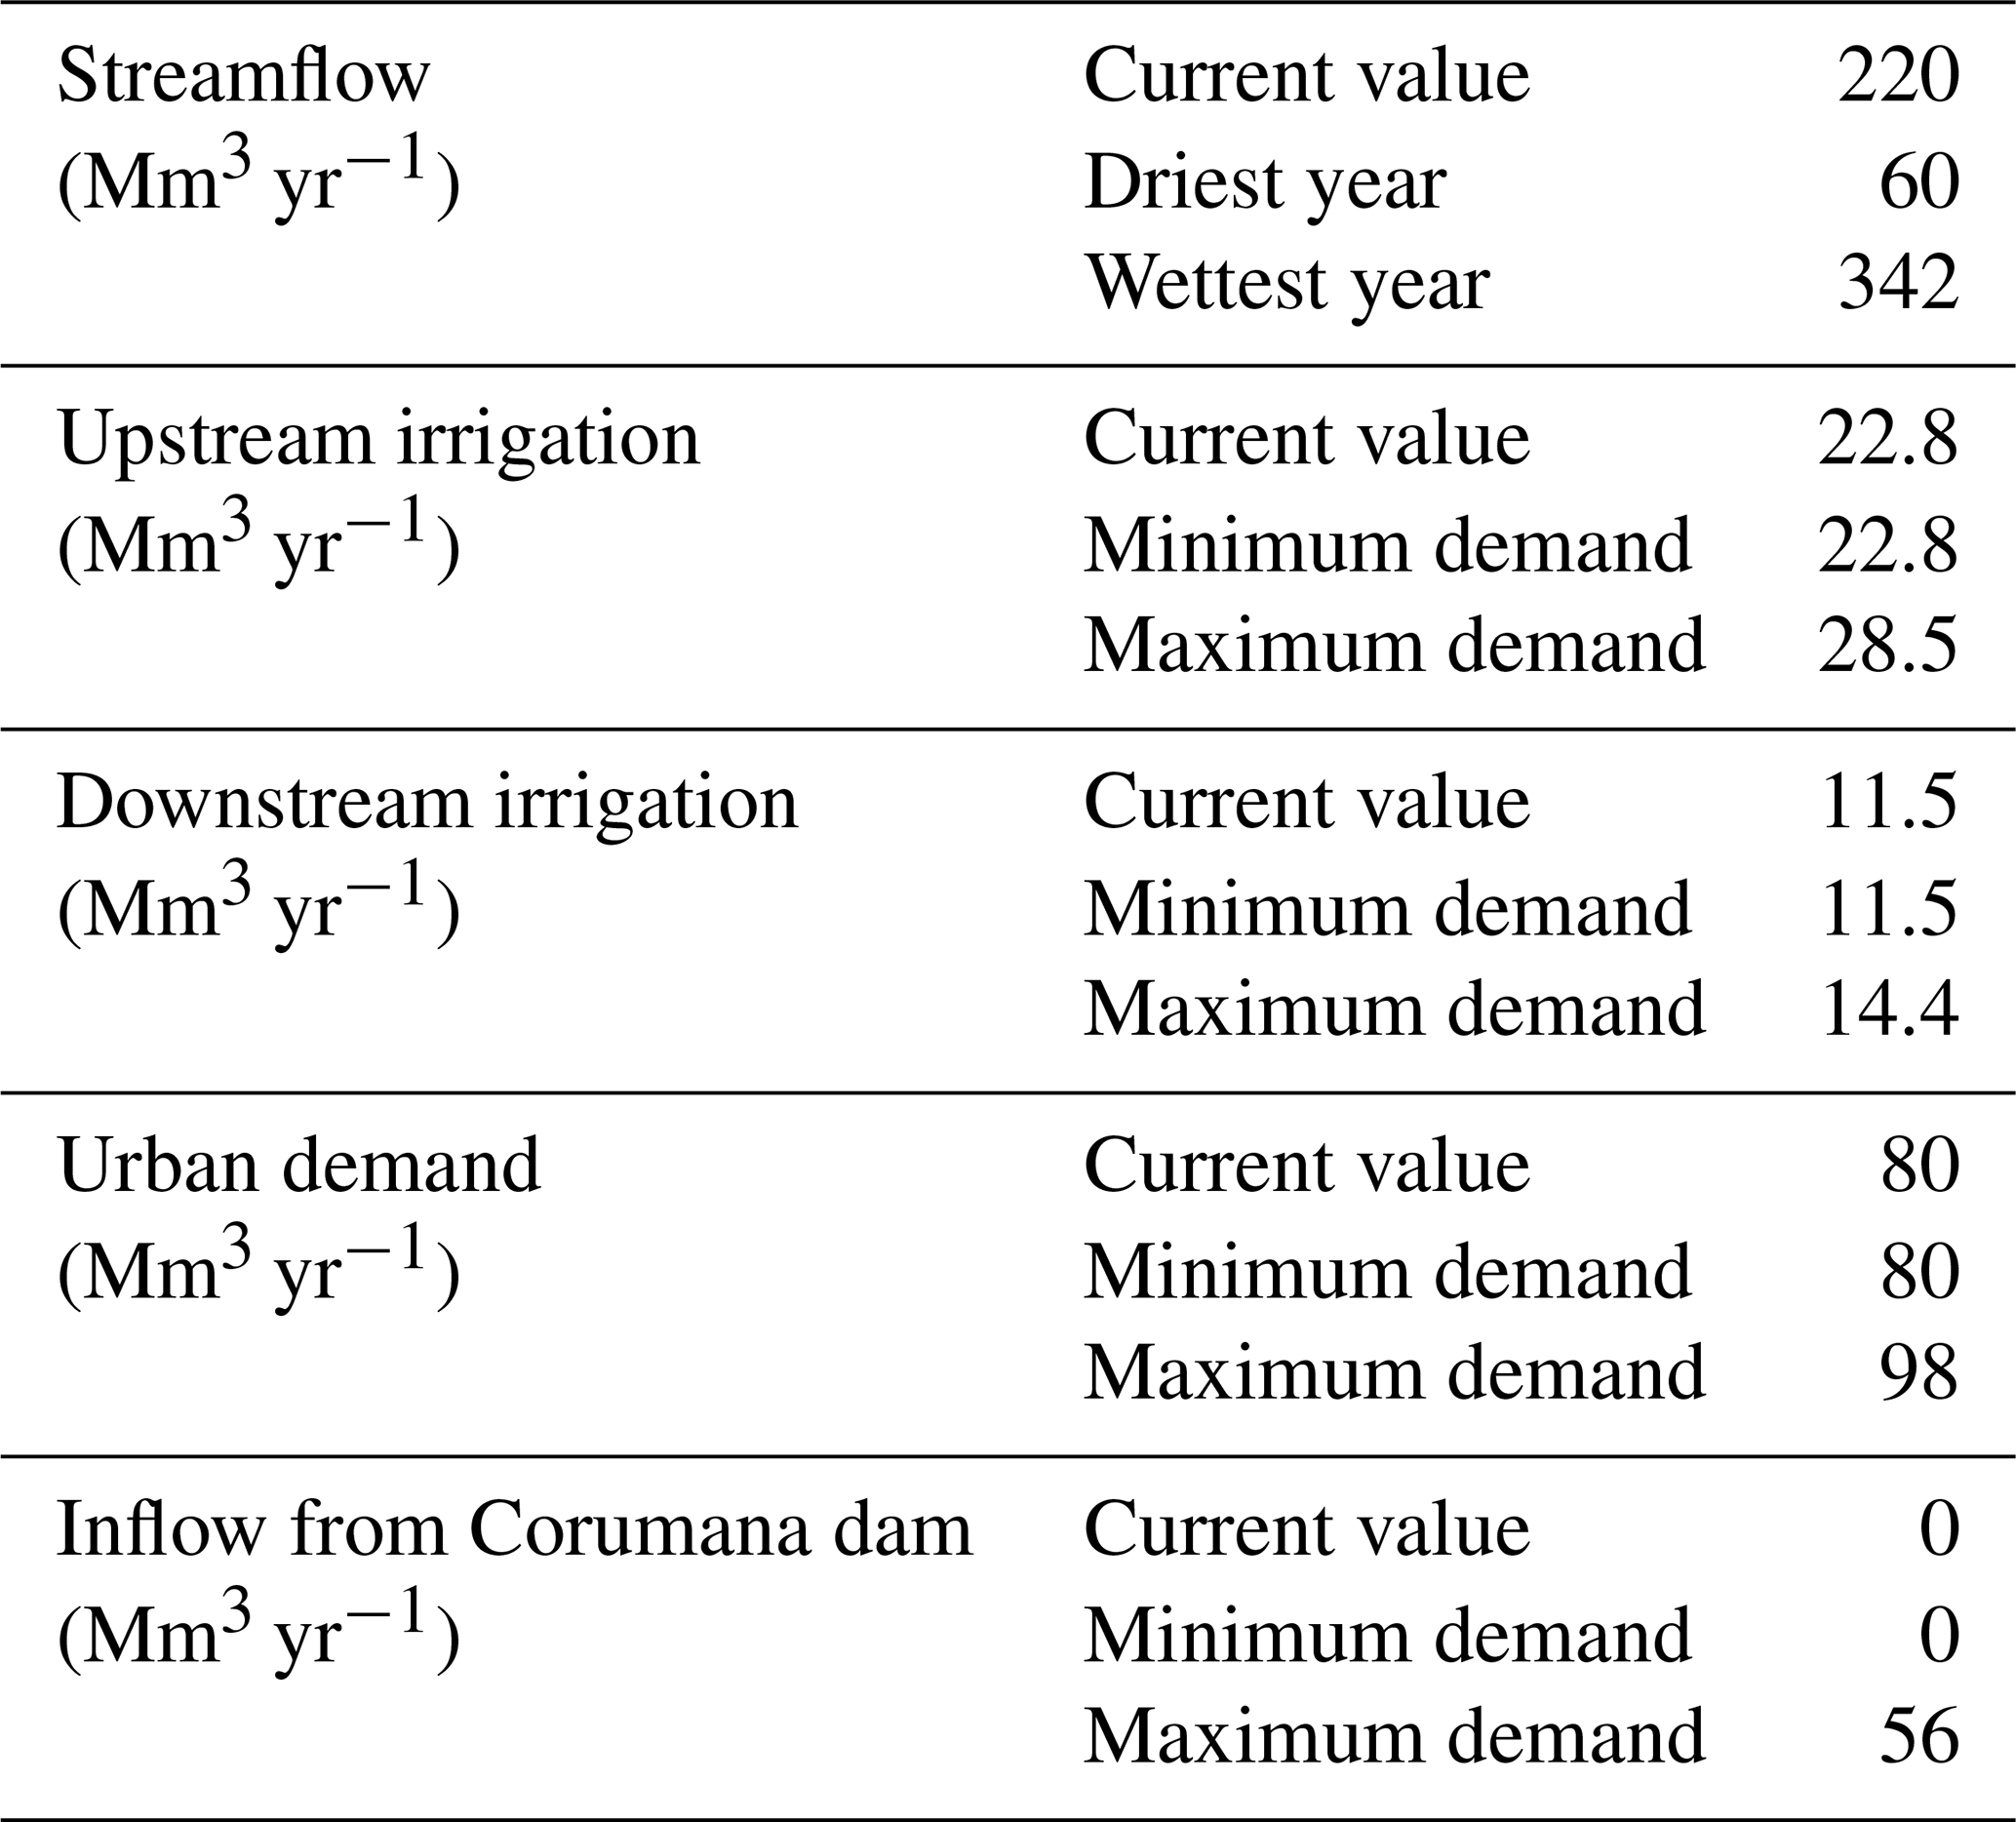
We divide the future sources of uncertainty into the following four categories: (1) climatic, (2) agricultural, (3) infrastructural, and (4) social. They are driven by uncertainty in (1) streamflow, (2) irrigation demand, (3) additional inflow from Corumana dam, and (4) population growth rate and are here characterized as follows:
-
Climatic uncertainty. We generate high-resolution scenarios of rainfall and temperature for the Umbeluzi river basin to the year 2100 by the quantile–quantile mapping (QQ mapping) downscaling procedure. We apply QQ mapping to coarse-resolution data from three different regional circulation models (ICHEC RCA4, ICHEC RACMO, and ICHEC HIRHAM5, developed by the Swedish Meteorological and Hydrological Institute, the Royal Netherlands Meteorological Institute, and the Danish Meteorological Institute) simulated over three distinct representative concentration pathways, i.e., RCP 2.6, RCP 4.5, and RCP 8.5 (Field, 2014). We use the resulting nine precipitation and temperature trajectories to force an HBV model (Lindström et al., 1997) validated over the control period, generating nine inflow trajectories. We then use the minimum (0.05) and the maximum (0.4) of the projected percentage inflow decrease as the feasibility set boundary of a uniform distribution, from which we extracted K=10 000 inflow multipliers in the interval [0.6, 0.95], using simple random sampling. As a result, the historical inflow (which includes both dry and wet hydrological conditions) is decreased in the different scenarios by as much as 40 % (as the product between the historical trajectories and the multipliers). Such a methodological procedure for the generation of the states of the world is often referred to as the delta method (Brown et al., 2012) and has been widely used in the literature (see, for example, Bertoni et al., 2019). One of its main drawbacks is not being able to account for a seasonal shift in the hydrological regime which would naturally follow a change in the hydroclimatic patterns. However, the 110 000 (10 000 multiplier perturbations of the 11 years of historical data) hydrological years upon which the system is simulated provide a states of the world discretization grid which is dense enough to consider both the extremes and the intermediate scenarios over which the robustness of the various operating policies are computed.
-
Irrigation demand uncertainty. Droogers et al. (2014) estimated the expansion in irrigated area in the study site to be up to 25 %. For the irrigation demand trajectories, we, therefore, assume a constant irrigation multiplier, drawing K samples from an uniform distribution over [1, 1.25], using simple random sampling. As a result, K irrigation demand scenarios are generated as the product between each multiplier and the historical irrigation demand time series.
-
Additional inflow from Corumana dam uncertainty. The World Bank is currently financing the Greater Maputo Water Supply Expansion project, which started in 2013 and is still under development. The project is compounded of a water treatment plant downstream of the Corumana dam and by a 95 km pipeline connecting Corumana dam with the city of Maputo and ensuring an additional water supply of 1.8 m3 s−1. The completion day cd of the project is treated as a stochastic variable for which K samples are drawn from a uniform discrete distribution in the interval [0, H], where H= 11 years (i.e., the simulation horizon for an individual SOW). As a result, K additional inflow from Corumana dam scenarios are generated. In each scenario, the inflow from Corumana dam on a day t is computed as follows:
-
Urban water demand uncertainty. The growth for the city of Maputo is expected to be up to 2 % per year. Urban demand multipliers are, therefore, assumed here to be constant every year, and a sample of size K is extracted from a uniform distribution within the range [1, 1.02]. Therefore, the urban demand trajectory in a certain scenario can be computed as the exponential increment of the historical urban demand.
As a result, K=10 000 deeply uncertain SOWs embedding inflow, irrigation demand, additional inflow from Corumana dam, and urban demand scenarios are generated. Each of the K sets could be seen as a vector composed of four parameters (i.e., one multiplier for each uncertainty source) sampled from their uniform distribution. The set Ξ, including all the states of the world where the operating policies are evaluated, is generated with a Latin hypercube sampling (LHS) across the four dimensions of the uncertainty sources, with a sample size Nu=5000 (cardinality of Ξ).
Table 3 provides a summary of the descriptive statistics of the SOWs aggregated by uncertainty source, including the driest and wettest year, the maximum and minimum water demand, and the maximum and minimum yearly inflow from Corumana dam.
Table 3Statistical extremes of the SOWs aggregated by uncertainty source.
3.3.2 Robustness metric
To select the most robust alternative for each of the stakeholders, we used the minimax robustness metric. The computation of the metric requires Nu simulations, i.e., one for each SOW χ∈Ξ.
The minimax identifies, among the optimal control policies π* designed via EMODPS, the most robust alternative as being the one attaining the best performance in the worst among the SOWs, as follows:
This metric, usually associated with a high-risk aversion attitude, selects the alternative, assuming that the worst future conditions will be realized (Wald, 1950).
3.4 Sensitivity and uncertainty
In many hydrological applications, a sensitivity analysis (SA) and uncertainty analysis (UA) are often closely related, to the point that certain UA techniques, such as scenario discovery (SD) and factor mapping (FM), could be assumed to be SA methods. Yet, while UA is used for quantifying the uncertainty in the output, SA is typically adopted to apportion the output uncertainty to the different uncertainty sources (or input factors; Saltelli et al., 2008). Following this line of thought, one could use the FM or SD to determine which uncertain input combination might cause robust policies to perform poorly. Those techniques usually classify the (uncertain) input samples as either behavioral or non-behavioral, depending on whether the response variable (in this application, it is the objective function) exhibits a certain pattern or not. In our study, the distinction between behavioral and non-behavioral perturbations is performed through the GLUE uncertainty analysis, which has been indeed developed starting from some of the basic ideas of regional SA and factor mapping, while the PAWN SA method (Pianosi et al., 2016) was used to identify the major sources of vulnerability. Despite their many similarities, the two techniques often offer a valuable complement to each other, with SA providing valuable extra insights to UA on the identification of the most relevant uncertainty sources.
3.4.1 GLUE
We perform the quantification of the output variability in response to the four uncertainty sources considered in the paper by employing the GLUE method. In particular, GLUE allows for determining which SOW results in optimal robust policies that yield unacceptable results. The implementation of GLUE encompasses several steps, most of which are already included either within the robustness or the sensitivity analysis.
A brief summary is provided below.
-
Generation of the states of the world. As described above, SOWs are obtained in this study by near-random sampling of the perturbed time series of inflow, irrigation demand, infrastructure, and population.
-
Specification of the objective function. This function is defined in this study as being each of the four objectives that constitutes the four-dimensional objective function in Eq. (11b).
-
Definition of the threshold values for the behavioral system perturbation set. Here, the threshold value is defined for each operating policy as the fifth percentile of all the objective function realizations, after simulating the system for Nu SOWs. The behavioral perturbations are defined as the multiplier values keeping the objective function below the threshold.
From a computational perspective, the GLUE algorithm requires, for a certain robust operating policy, a re-simulation of the system for each χ∈Ξ (i.e., for each of the states of the world generated during the robustness analysis). At every simulation, the value of the objective function is computed and stored. Upon completing this step, an empirical cumulative distribution function (CDF) is fit to each dimension of the four objective functions (i.e., the operating objectives). Then, the algorithm checks whether a state of the world leads (or not) to an objective value below a certain threshold (which, in this study, is set as the fifth percentile of the objective CDF). In the former case, the SOW (and the system perturbation set that the SOW is constituted by) is classified as behavioral and, in the latter, as non-behavioral. Considering the expected adverse effect which most of the uncertain future realization of the external system drivers might have on water availability and demands, the choice of the fifth percentile as a threshold value is representative of the stakeholder desire to stay as close as possible to the historical performance.
3.4.2 PAWN
To identify the main sources of vulnerability across robust policies, we use the PAWN sensitivity analysis (Pianosi and Wagener, 2015). PAWN is a distribution-based method, and its choice lies in its applicability to nonlinear models (Amaranto et al., 2020) and its independency from the type of output distributions (for example, symmetric, multimodal, or highly skewed). In addition, several studies (Zadeh et al., 2017; Pianosi and Wagener, 2018) have shown the capacity of PAWN to provide stable results for relatively low sample sizes.
In PAWN, the sensitivity of the output y (in this specific case, the objective function value) to variations of an input xi (climate, agriculture, infrastructure, and population) is measured as the distance between the unconditional and conditional empirical cumulative distribution (CDF) of y. The distance between the distributions is measured by the Kolmogorov–Smirnov (KS) statistics, computed as follows:
where Fy(y) is the empirical unconditional distribution of y, and is the empirical conditional distribution of y when the ith input is kept fixed at the nominal value xi. Considering the dependence of KS on the nominal value, the PAWN method considers KS statistics over a prescribed number of nominal values and then computes the sensitivity index as follows:
where are nc randomly sampled values for the fixed input xi. By definition, all the KS(xi) values, and consequently the sensitivity indices Si, vary in the range [0, 1]. The closer the unconditional distribution Fy(y) is to the conditional ones , the smaller the KS(xi) values and, therefore, the smaller the sensitivity of y to xi and vice versa.
Operatively, Fy(y) is computed for a certain policy by iteratively simulating the system for Nu SOWs, generating, therefore, Nu realizations of each objective upon which the empirical CDFs are constructed (Fig. 4). The computation of requires Nc SOW simulations for each of the nc nominal values of xi (as shown in Fig. 4 for xi=inflow). The unconditional empirical CDF for each uncertainty source is, therefore, estimated upon (nc⋅Nc) system realizations.
Considering M uncertainty sources, the total number of system evaluations required for implementing PAWN for a single policy is, therefore , where Nu and Nc are the number of SOWs used for the unconditional and conditional distributions, respectively, while nc is the number of nominal value for the uncertainty sources.
In this study, we fixed Nu, Nc and nc to 5000, 2000, and 12. The decision is based on the observation of the uncertainty bounds in the sensitivity index obtained by 100 bootstraps of the input–output realizations upon which it is computed.
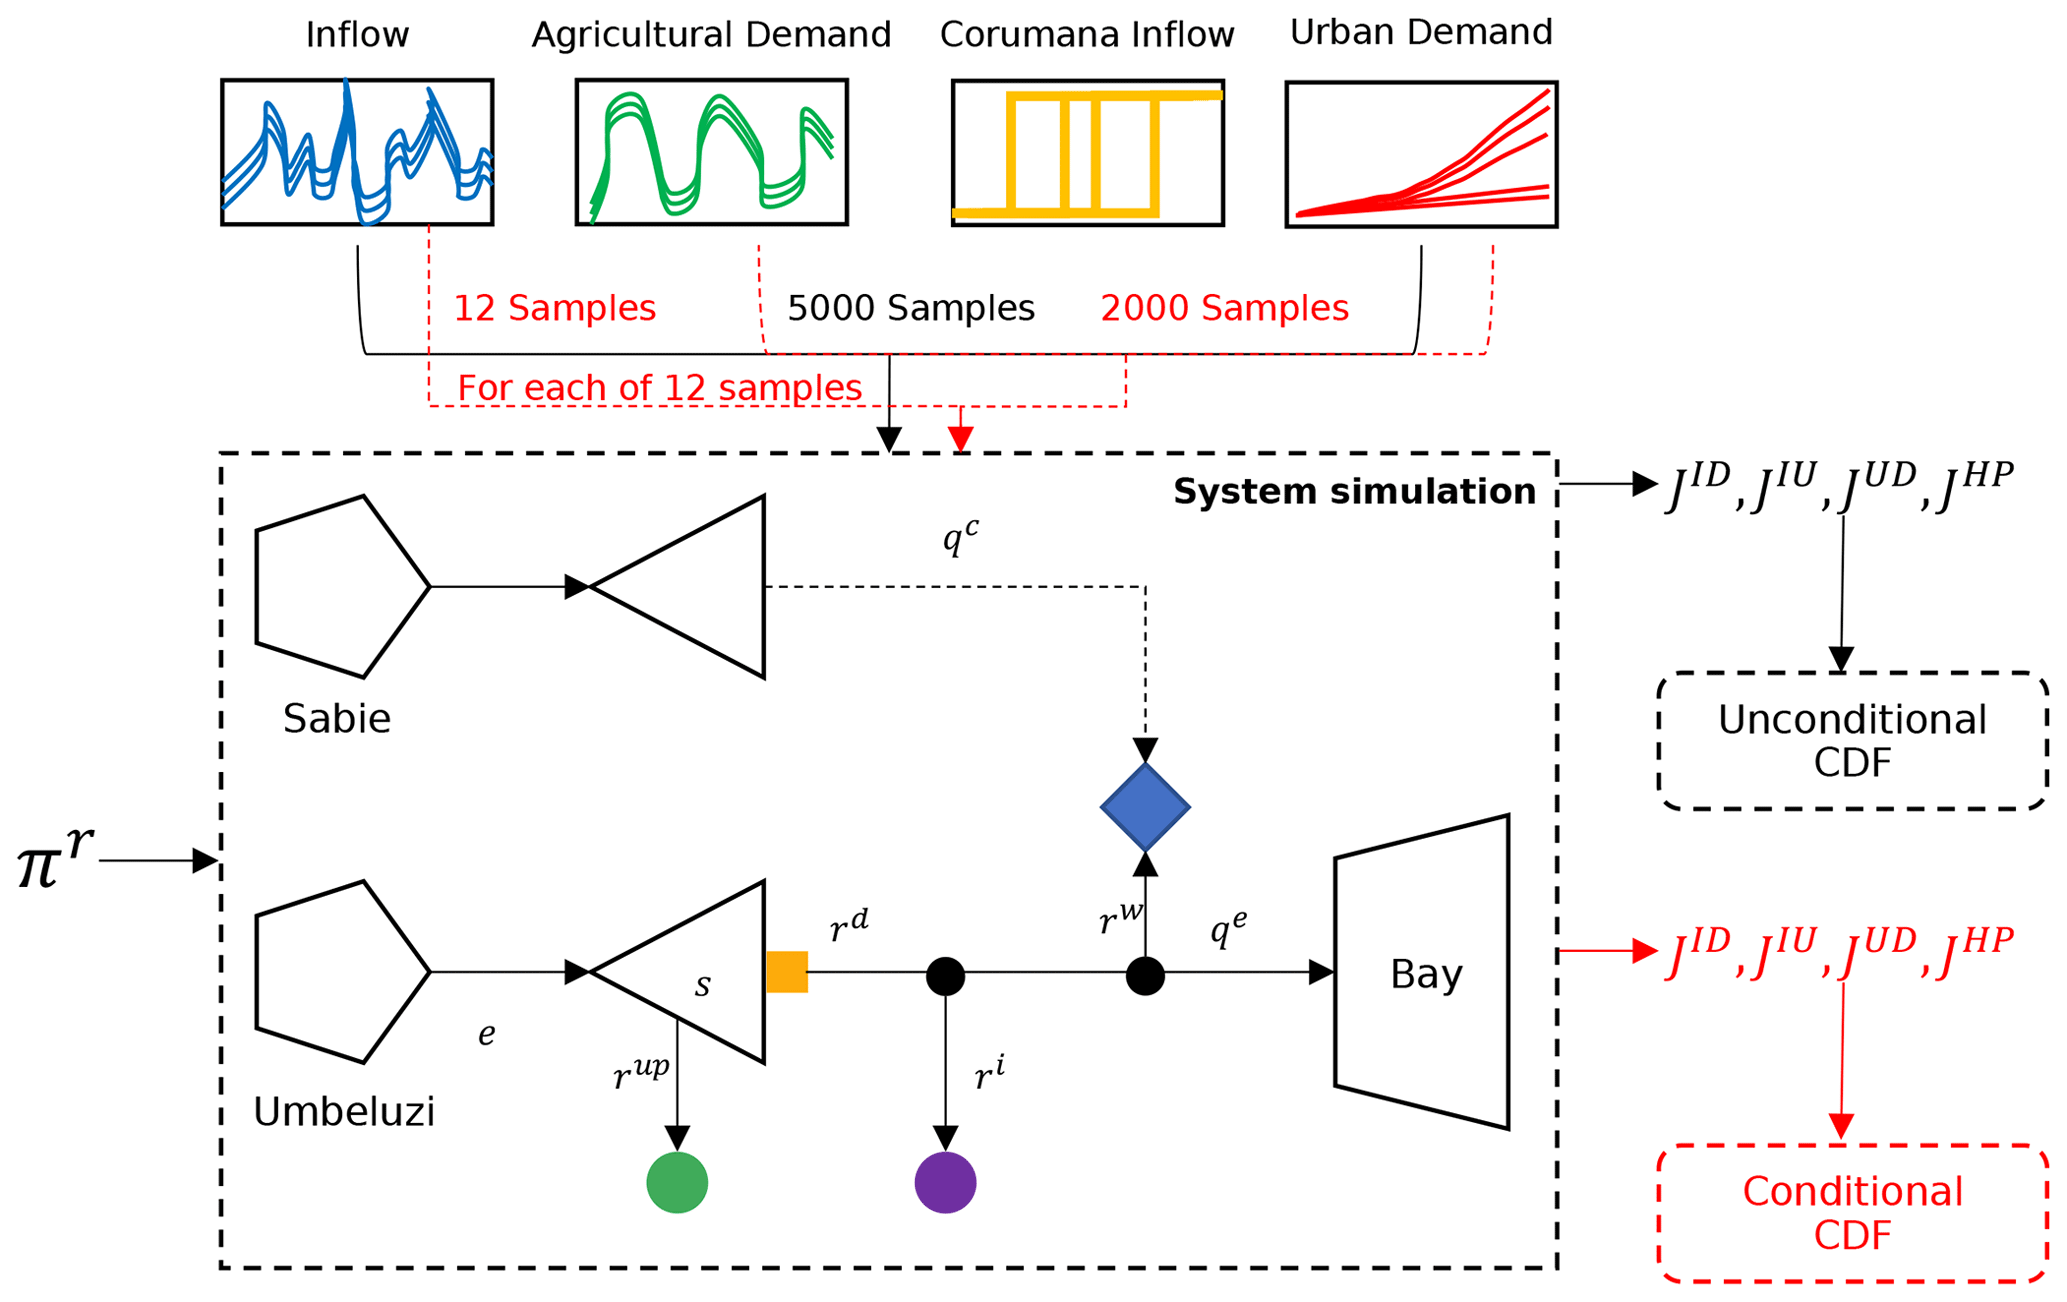
Figure 4PAWN conceptual framework, with the unconditional objective function distribution in black and conditional objective function distribution in red.
4.1 Optimization: multi-objective tradeoffs
The Pareto-optimal policies obtained by solving the optimization problem defined in Eqs. (11a) and (11b) are reported in Fig. 5. We run the optimization on the baseline, i.e., the historical hydrological (Δ inflow =0), agricultural (Δ irrigated area =0), infrastructural (no external supply), and social (population growth =0) conditions. Each line is a different policy, each axis represents an optimization objective, and the crossing point identifies the objective value derived from the implementation of a certain policy (normalized between minimum and maximum) which is to be minimized. The ideal solution is a horizontal line intersecting all four axes at their bottom. The extent of the conflicts is proportional to the slope of the lines connecting two adjacent axis. The color of the lines represents the most robust policy for each stakeholder and will be discussed more in detail later.
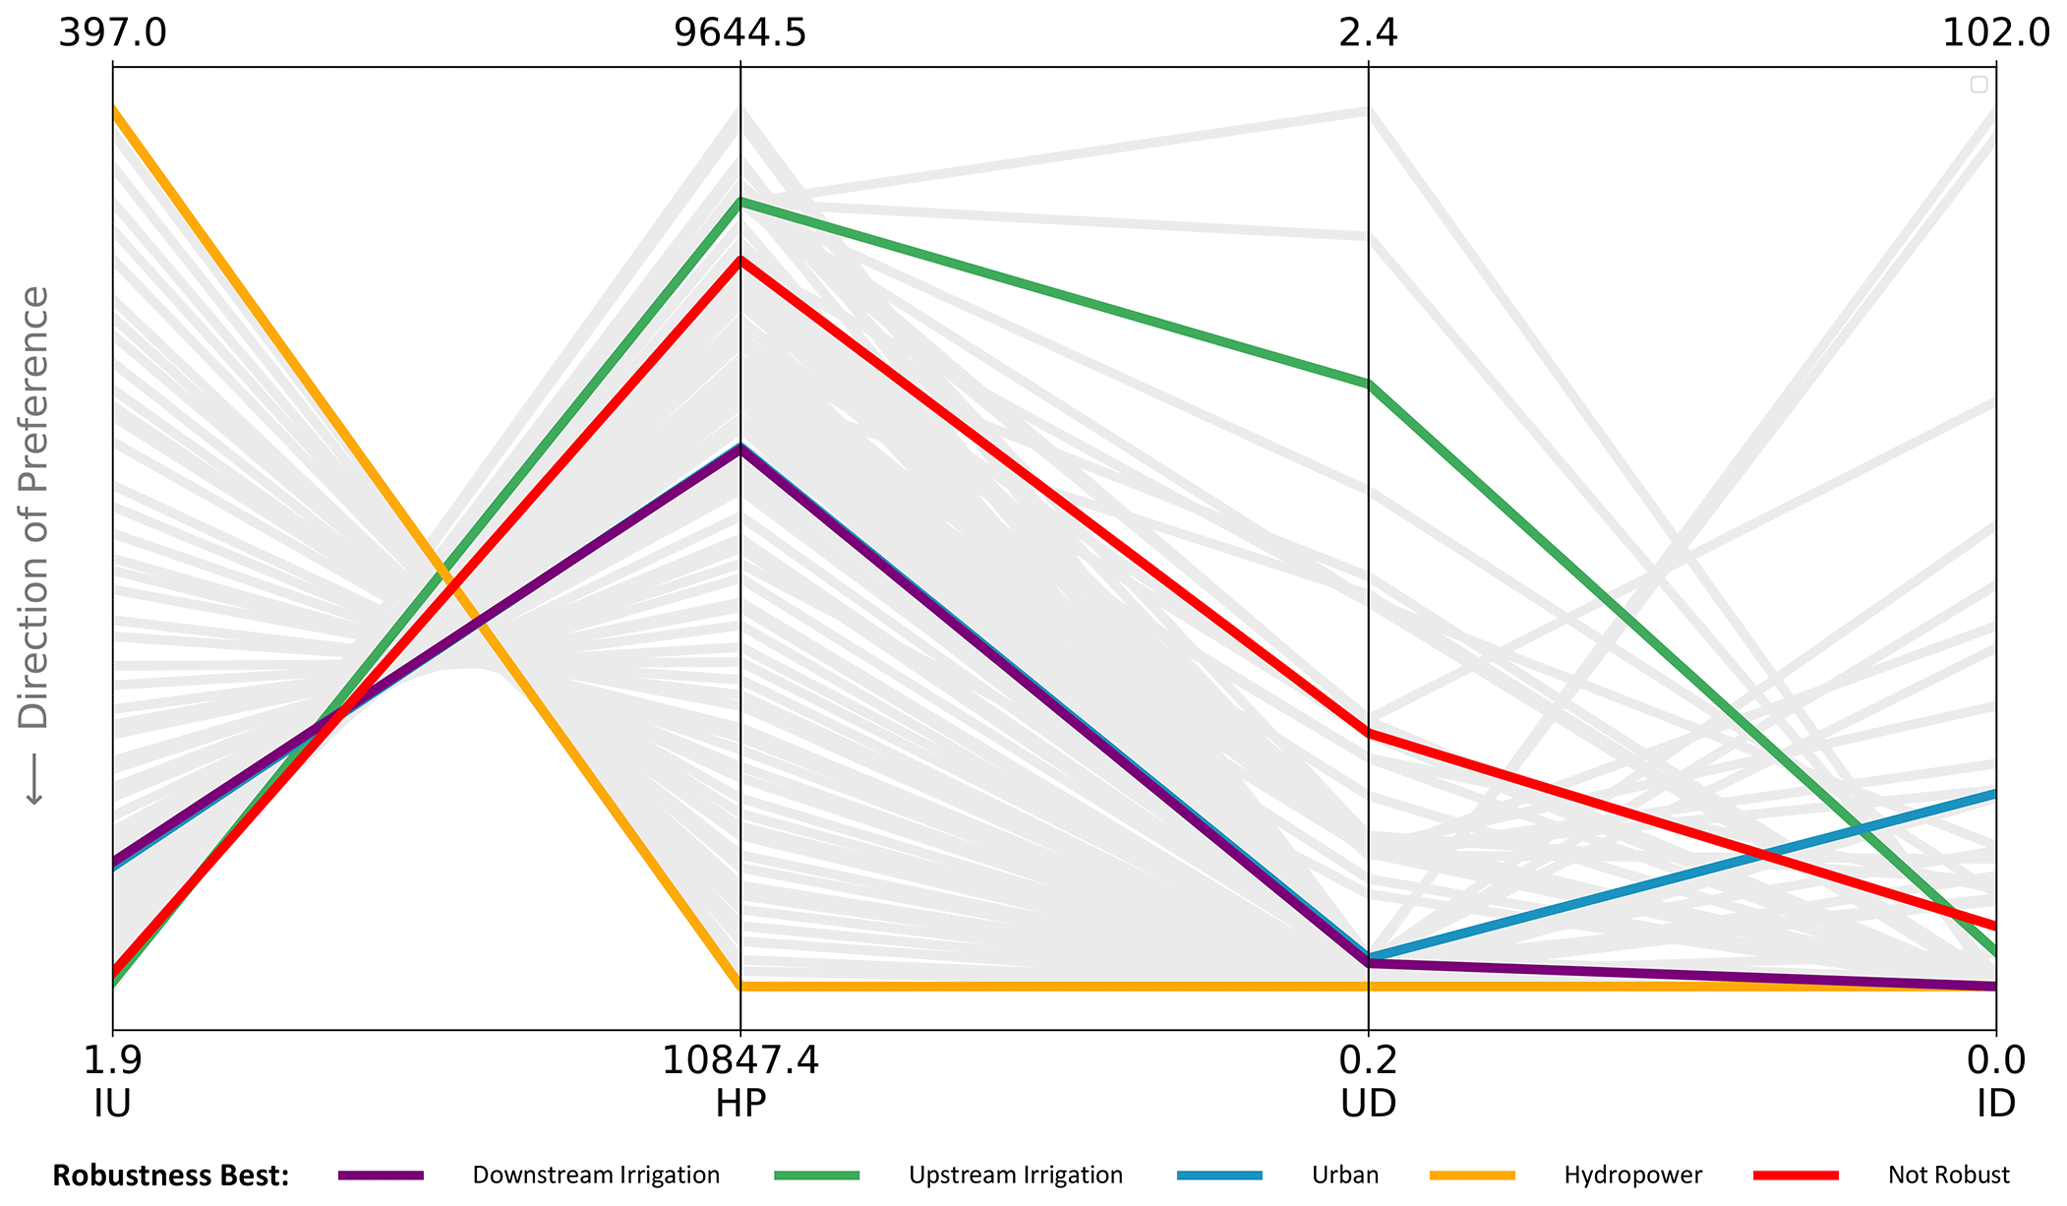
Figure 5Policy performance across sectors under the baseline scenario. IU is the upstream irrigation, HP is the hydropower, UD is the urban deficit, and ID is the irrigation downstream.
Not surprisingly, the most conflicting objectives under the baseline scenarios are hydropower and upstream irrigation, since the latter is the only stakeholder that cannot benefit from the dam releases from hydropower generation, and it subtracts a potential source of water release for energy production by the pumping out of the reservoir to satisfy crop requirements. The combined urban and irrigation demand downstream is about 50 % of the turbine maximum capacity in the power plant and can, therefore, be satisfied by hydropower releases.
In order to compromise, solutions between upstream, urban, and downstream irrigation can be achieved at the expenses of hydropower (as can be seen by the purple line in Fig. 5), with a 10 % reduction in energy production leading to a near-zero deficit for all the other stakeholders.
4.2 Robustness: probabilistic tradeoffs
Figure 6a presents the most robust (MR) solutions for each stakeholder (defined as those performing best in the worst system configuration) under deeply uncertain scenarios, along with where such solution would fall when ranked for other stakeholders. The red line identifies a generic non-robust (NR) policy, which generates the 90th percentile in the overall robustness ranking. Even though, historically, NR led to objective values close to those of the most robust solution for upstream irrigation (robust upstream irrigation – RIU; green lines in Figs. 5 and 6), it experiences a dramatic performance degradation under deep uncertainty, highlighting the importance of a robustness analysis in a multi-objective decision-making framework for the discovery of optimal solutions with low vulnerability against the uncertainties in their forcing realization.
Furthermore, while in historical conditions the robust solution for irrigation downstream (robust downstream irrigation – RID) and for the city of Maputo (robust urban deficit – RUD) produce substantially the same urban deficit (Fig. 5), RID provides much higher objective value under deep uncertainty. Following the opposite line of thought, it is also evident how the historical conflicts between the two stakeholders are exacerbated under deep uncertainty, and RUD becomes one of the worst (94th out of 100 policies) to adopt for downstream irrigation. A possible explanation lies in the way the diversion dam is operated in water scarcity conditions (occurring mainly under deep uncertainty). RID, by fulfilling 99 % of the crop water demand, prioritizes irrigation and increases the urban deficit. RUD, instead, systematically ensures urban water supply to the city of Maputo, generating an irrigation deficit even in historical conditions.
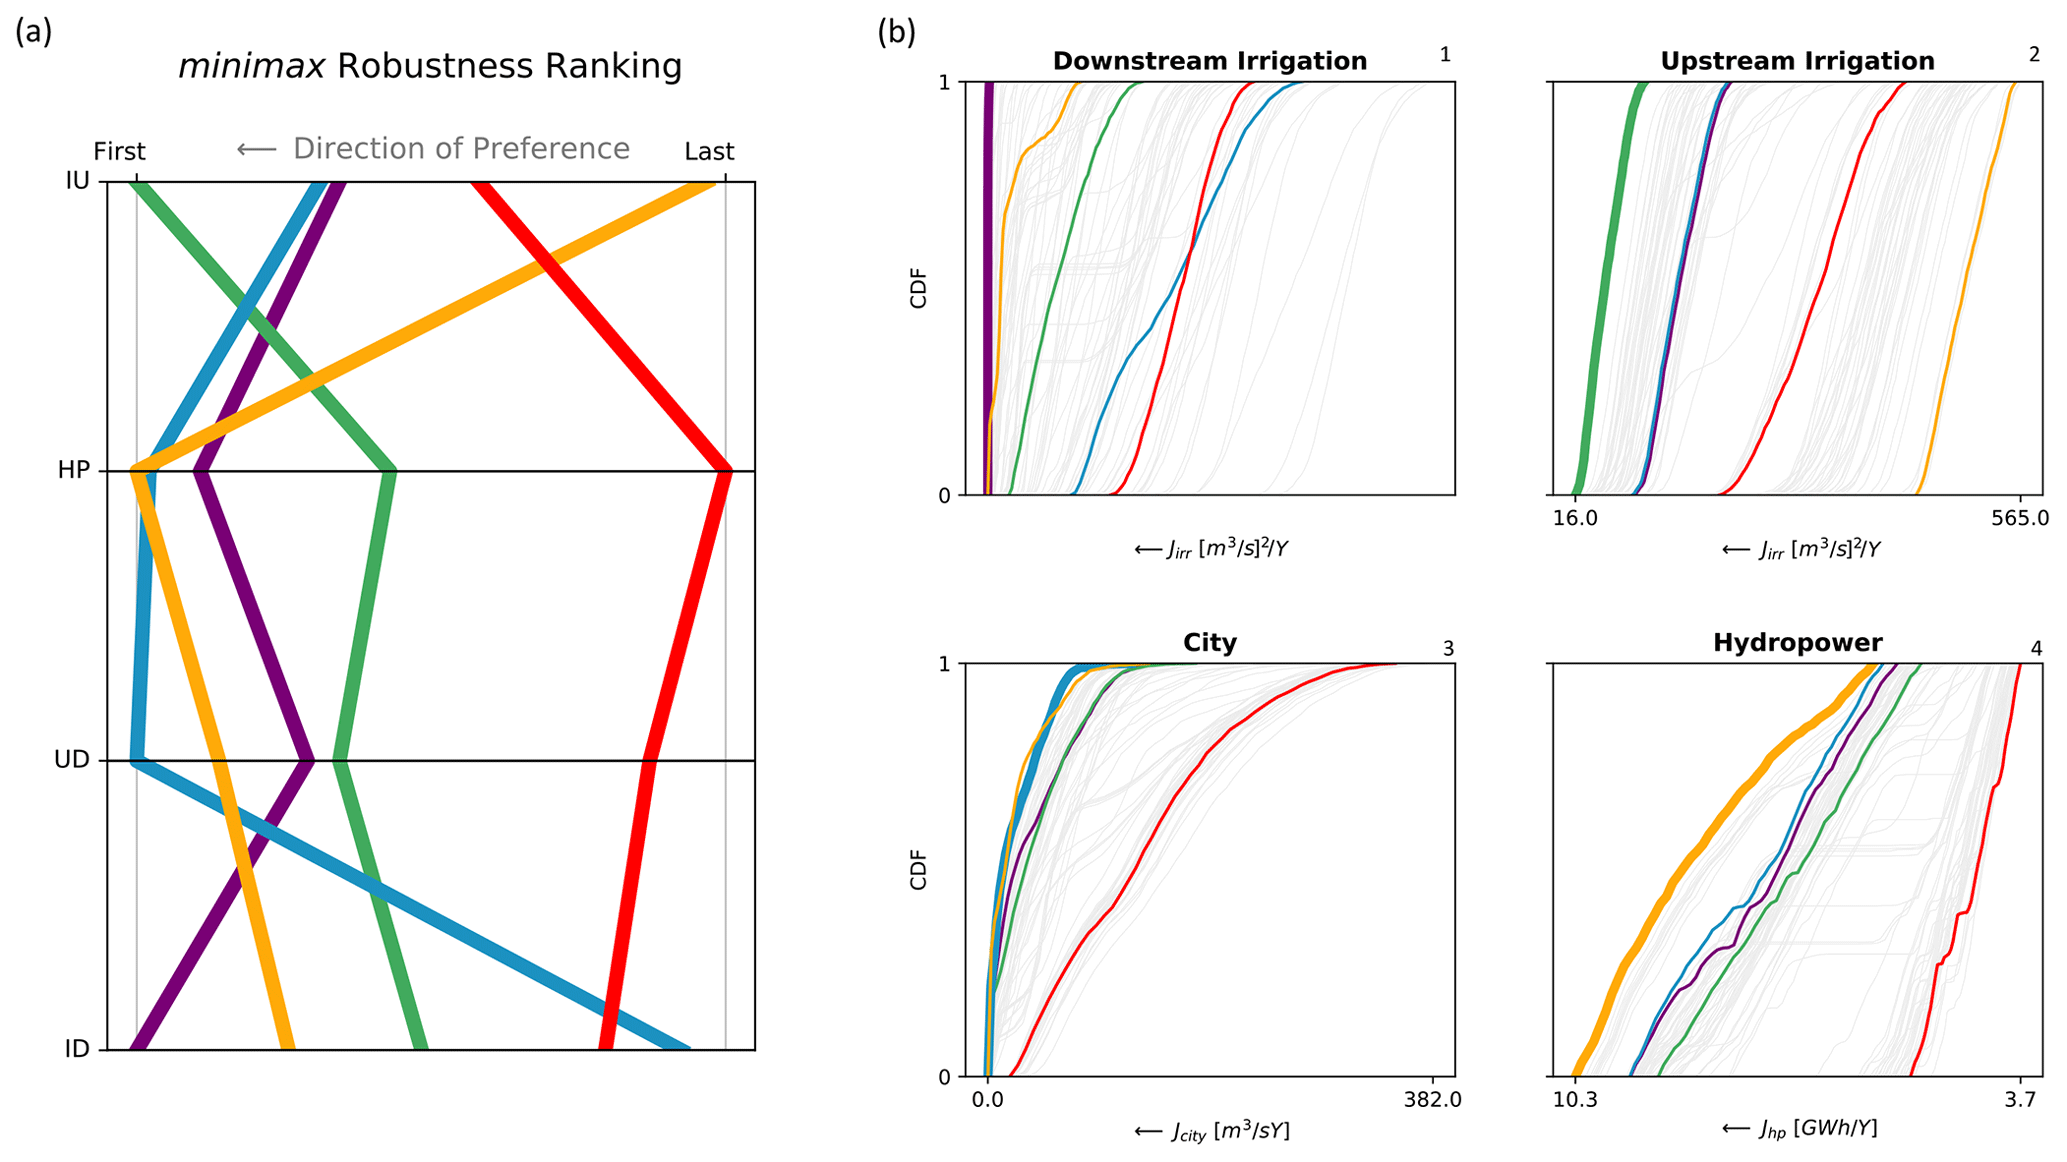
Figure 6(a) Ranking of the best solution according to each stakeholder, along with where these solutions fall when ranked according to other stakeholders. (b) Cumulative distribution functions for the four objectives, using the most robust alternative for each stakeholder. The red line represent a non-robust solution.
The cumulative distributions of performance under deep uncertainty represented in Fig. 6b, along with those found through multi-objective optimization (gray lines), confirm that (1) the NR policy, being on the right side of each box, systematically offers poor performances in all objectives, (2) deep uncertainty might generate disputes among downstream irrigation and the city of Maputo, with one of the highest irrigation deficits produced by RUD (Fig. 6b1), and (3) the existing conflicts between upstream irrigation and hydropower are exacerbated by both water scarcity and the increase in irrigation demand (Fig. 6b2).
The almost straight vertical purple line at the top left corner in Fig. 6b1 also evidences how downstream irrigation is, overall, the stakeholder less vulnerable to deep uncertain scenarios. This is also observable by the high density of gray policies close to the zero-deficit – even in the worst scenario. In addition, about 80 % of the optimal policies still ensure an irrigation deficit value within the historical deficit range [0, 102 (m3 s−1)2 yr−1].
By observing the cloud of gray CDFs, one could notice how some of the operating policies do not monotonically increase towards higher objective values but instead shows sudden discontinuities. Such discontinuities are probably due to the realization of states of the world causing the reservoir level to reach the lower limit of the discretionary operating space. In other words, the variation in the external forcings (most likely a decrease in inflow) is such that, for certain NR operating policies, the reservoir level triggers a zero-release condition for a certain time period. The absence of releases is reflected in the objective value, which suddenly increases due to no supply availability to cover the water demand.
Finally, the objective function of RHP (robust hydropower) shown in Fig. 6b4 rapidly increases, even for smaller system perturbations, making hydropower the most vulnerable sector to deep uncertainties. The possible explanation is twofold because the hydropower sector has the higher water consumption and is solely dependent on inflow. Both conditions make it particularly sensitive to adverse hydroclimatic scenarios, while the latter further exacerbates its sector vulnerability due to the absence of favorable infrastructural measures to mitigate the water scarcity impact.
4.3 Sensitivity and uncertainty
To allow for a comparative discussion on how different SOW realizations unevenly shape the vulnerability of different control policies, we select the most and the least robust among the operational alternatives described above for each sector and analyze the corresponding sensitivities and uncertainties. As mentioned before, hydropower solely depends on inflow and exhibits the same qualitative behavior for all the operating policies. For this reason, results for this sector are not further discussed here.
Figure 7a and b represent a scatterplot of the downstream irrigation objective in correspondence with its relative forcing perturbation for RID (most robust alternative for downstream irrigation) and RUD (least robust alternative among those performing best for at least one stakeholder), respectively. Colors identify, for a specific policy, those SOWs whose realization causes the objective function to assume values below the fifth percentile (defined as the threshold values for the behavioral perturbation set). The robustness of RID against an uncertain future condition is highlighted by the zero deficit produced in more than 4000 out of 5000 input realizations and by the irrigation deficit below 1 (m3 s−1)2 yr−1 in the remaining (Fig. 7a). Furthermore, inflow represents the only influential factor for this control policy (as can be seen in Fig. 7a1). In particular, the irrigation deficit is produced only when the streamflow multiplier falls below 0.65. This practically means that, for any future climatic conditions that generate streamflow reduction to below 35 %, RID is able to ensure water supply regardless of the expansion (among those embedded in the SOWs) in the irrigated area.
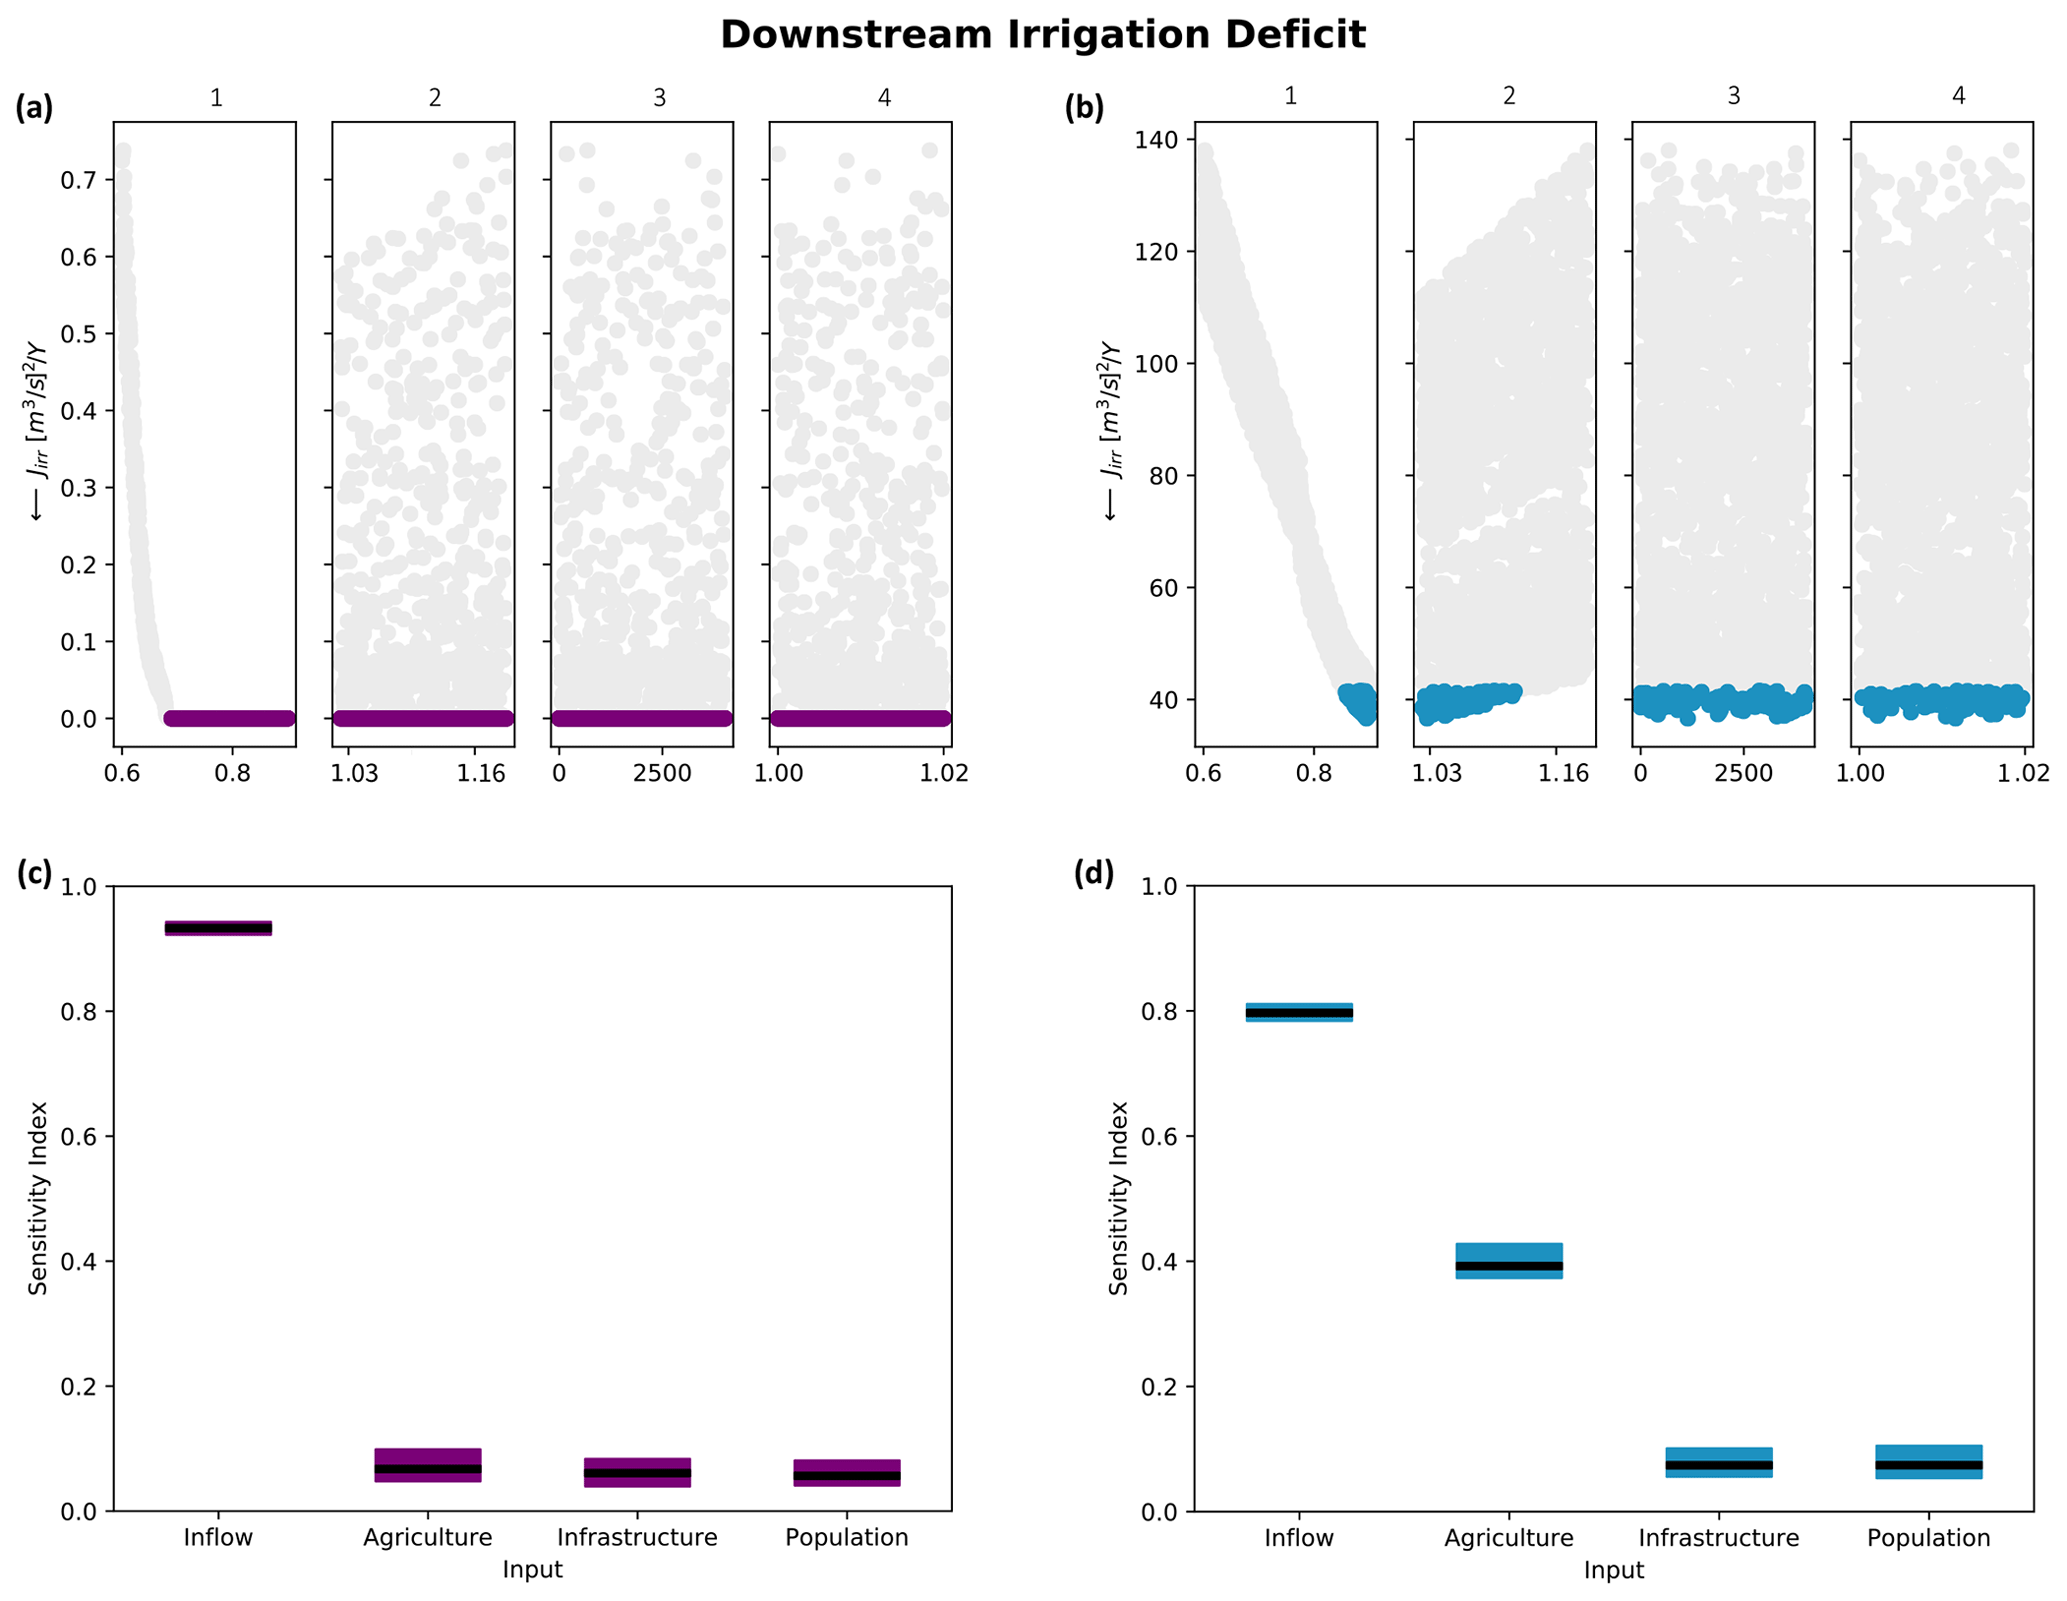
Figure 7Behavioral perturbations (a, b) and sensitivity index (c, d) for the robust upstream irrigation (purple) and robust urban deficit (blue) policies.
Figure 7c and d show the value of the downstream irrigation sensitivity index (SI) to the uncertainty sources. The average value of the SI is represented by a black horizontal line, while the colored box describes the 10–90 interquartile range derived by 100 bootstraps of the input–output realizations over which the SI is computed. The near-zero sensitivity values to agricultural, infrastructural, and population uncertainties seem to confirm the above discussion on the robustness of RID (Fig. 7c). When adopting RUD, instead, an irrigation deficit is generated as soon as any inflow perturbation occurs, and the objective function value (which increases up to 140 (m3 s−1)2 yr−1) is also shaped by the expansion in the irrigated area (Fig. 7b), with sensitivity values to agricultural expansion up to 0.42 (Fig. 7d). From a practical perspective, the main difference between RID and RUD relates to how an expansion in irrigated area might be perceived as an opportunity, in the first case, and as a potential source of conflicts, in the latter case.
As far as the urban deficit is concerned, the increase in the objective value during the 2010 drought (Fig. 8a3 and b3) highlights the pivotal role of the Greater Maputo Water Supply Expansion Project for ensuring continuity of supply. However, when RUD is adopted, urban deficit stabilizes at around 80 m3 s−1 yr−1 immediately after the event, and remains constant even if the project is not completed by the end of the simulation horizon. In other words, if the infrastructure is built before the drought, little or no deficit is generated. Otherwise, the system recovers from the event, and afterwards the urban water demand is fulfilled regardless of the construction time and the population growth. The opposite is true for NR, where the deficit keeps growing, which is also augmented by the increase in water demand caused by population growth. This is also evident from the increased sensitivity to infrastructure and population, with SI values reaching values up to 0.83 and 0.32, respectively (Fig. 8d). The comparison between RUD and NR suggests that the structural intervention in the former case is a fundamental action to undertake in order to cope with extreme hydrological scenarios, while in the latter it becomes pillar for the everyday operation of the system, especially when population growth increases the water demand in the metropolitan area of greater Maputo.
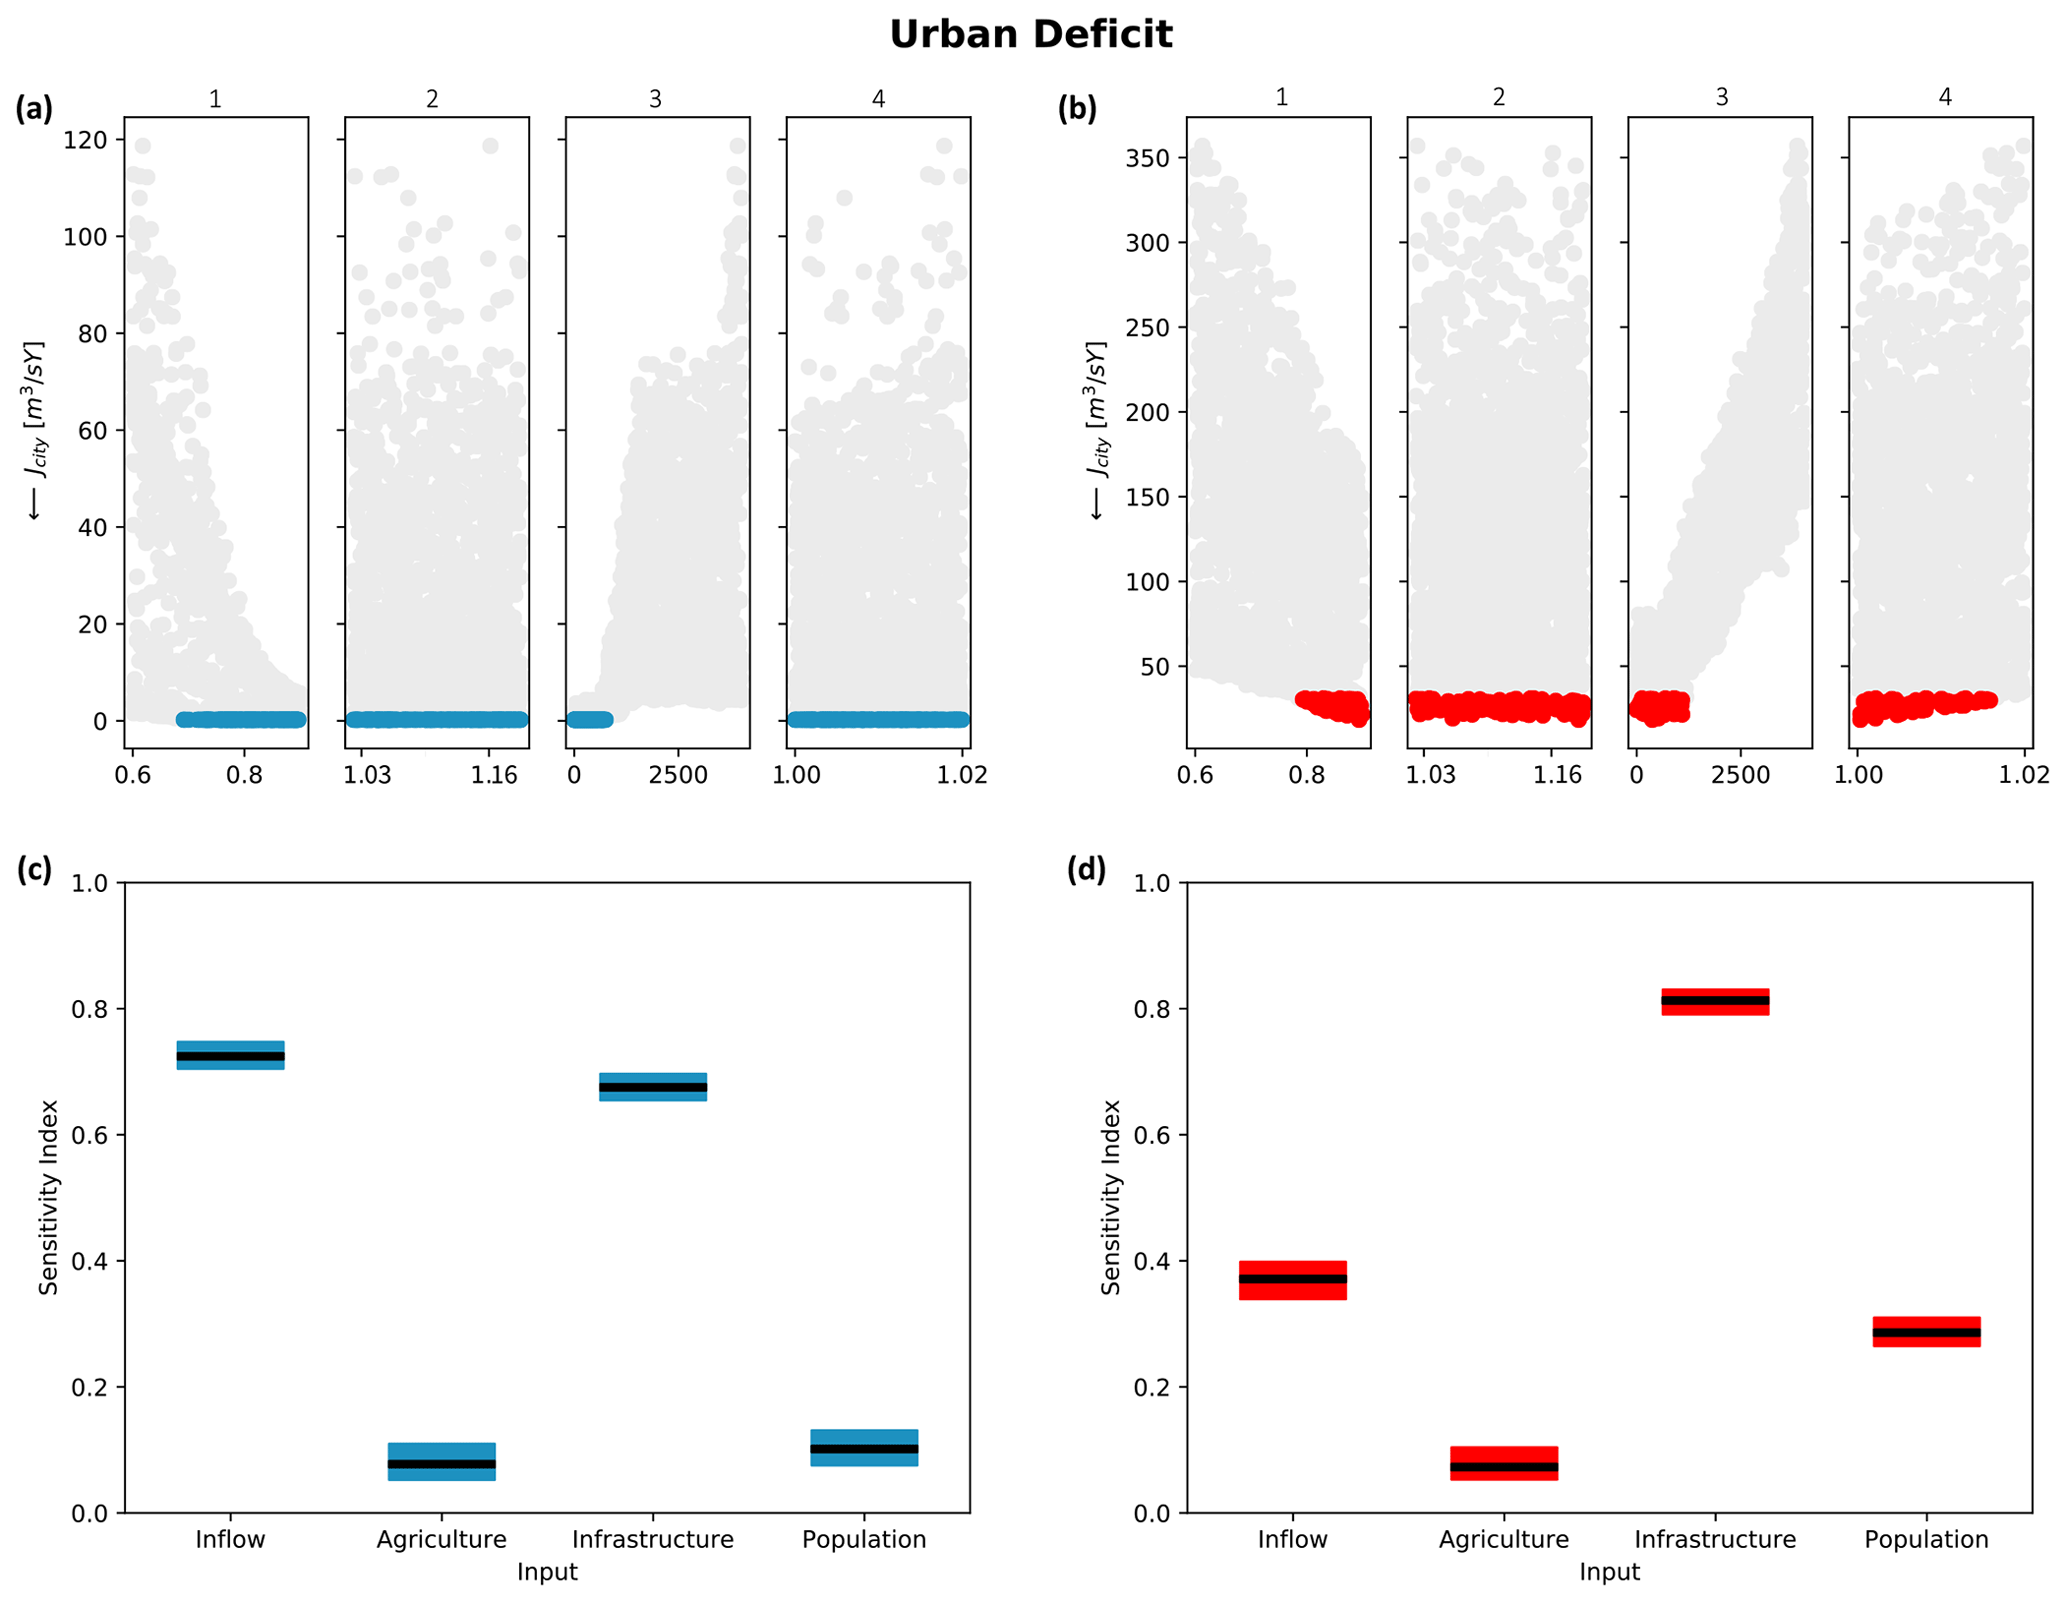
Figure 8Behavioral perturbations (a, b) and sensitivity index (c, d) for the robust urban deficit (blue) and non-robust (red) policies.
Finally, upstream irrigation experiences a sudden increase in irrigation deficit as soon as inflow decreases and irrigation demand grows (Fig. 9a and b). Unlike downstream irrigation districts, the upstream agricultural sector, not being able to re-use water from other sectors, is less flexible to a change in the external drivers and, therefore, less robust to their uncertain realizations. However, when comparing RIU (Fig. 9a) and RHP (Fig. 9b), it is evident that the irrigation deficit grows unevenly among policies, as it is dramatically high (over 500 (m3 s−1)2 yr−1) in the latter and substantially lower in the former.
The higher sensitivity (SI >0.9) of upstream irrigation deficit to agricultural expansion occurring when RHP is adopted (Fig. 9d) seems to identify a systematic pattern in the comparison between the most robust and least robust policies. For all the stakeholders analyzed, the latter have not just been consistently vulnerable to inflow decrease but also to the other non-hydroclimatic system perturbations. In other words, (1) infrastructural interventions become a must, as reflected by the increased urban deficit when the GMWSEP is not built (Fig. 8b3), (2) population growth exerts a non-negligible pressure on the water system and contributes towards increasing urban deficit (Fig. 8d), and (3) agricultural expansion is consistently limited by a lack of water availability (Fig. 9b and d). The opposite is true for RPs. Despite being (as expected) vulnerable to a decrease in inflow (even if lower in magnitude with respect to NR policies), they rely on new infrastructure only in emergency conditions and are able to sustain increases both in terms of population and irrigated area.
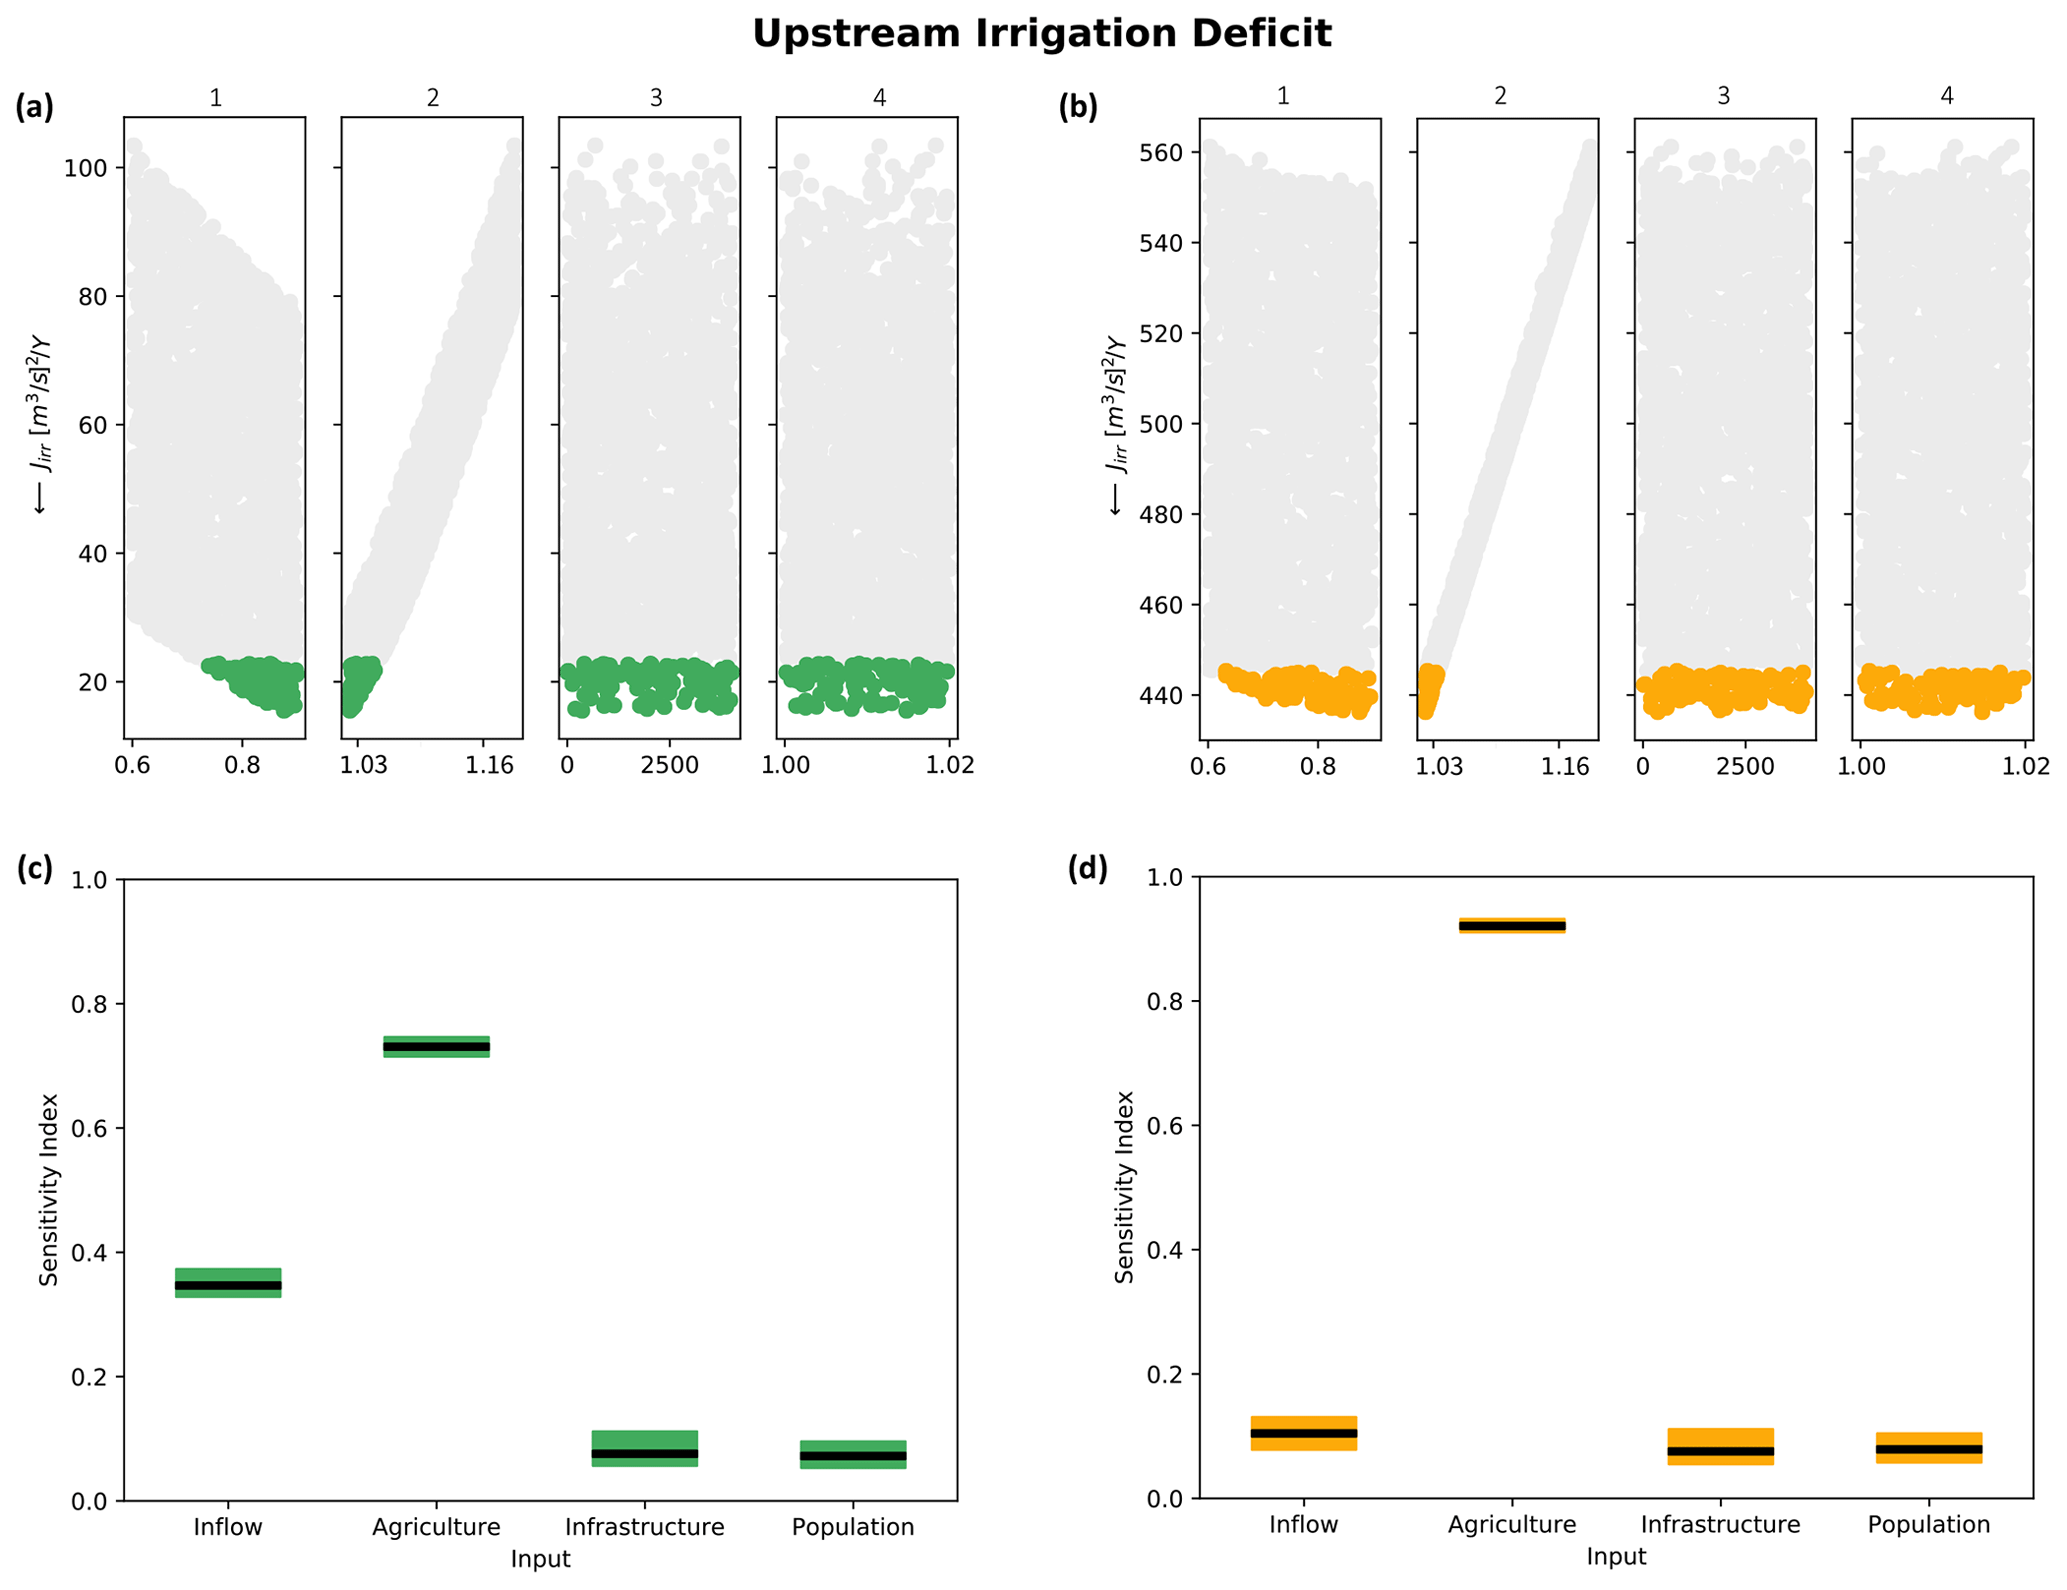
Figure 9Behavioral perturbations (a, b) and sensitivity index (c, d) for the robust upstream irrigation (green) and robust hydropower (yellow) policies.
In this study, we implement an integrated decision-analytic framework combining optimization, robustness, sensitivity, and uncertainty analysis to better understand the major sources of uncertainty for water supply strategies in the lower Umbeluzi river, Mozambique. The results provide important insights on the robustness and vulnerability of reservoir operation to exogenous perturbations in managing multiple conflicting objectives.
In particular, the main findings of this paper are as follows:
-
Optimal reservoir operating policies exploring similar tradeoffs in current conditions might lead to substantially different results under deeply uncertain scenarios. Specifically, the non-robust optimal solution presented in this study was largely dominated by 90 % of the operating policies across all objectives once the system is perturbed.
-
In water scarcity conditions, some new (i.e., not detected under historical conditions) tradeoffs between downstream irrigation and the urban supply suddenly emerge. In fact, while it is possible to explore operating policies ensuring maximum satisfaction for both stakeholders in current conditions, the two stakeholders are found to be in systematic competition, with the most robust policy for greater Maputo being in the 95th percentile (96th out of 100) when ranked for downstream irrigation.
-
Overall, downstream irrigation appeared to be the least vulnerable stakeholder, with about 60 % of the control policies ensuring an objective value in the worst possible condition lower than the maximum computed by forcing the system with the historical trajectories.
-
A robust policy for downstream irrigation ensures sustaining agricultural production with near-zero deficit for the majority of the agricultural water demand scenarios considered in this study. The only source of vulnerability in this case would be a streamflow reduction, which, however, produces only a marginal deficit increase even in the worst conditions. The opposite holds true when choosing the less robust policy, with objective values suddenly increasing even for small perturbations in streamflow and irrigation demand.
-
As expected, hydropower production resulted in being solely dependent on inflow realizations. Furthermore, it was the least robust sector among those considered, with a fast decrease in the objective function values as soon as the system is perturbed.
-
The implementation of the Greater Maputo Water Supply Expansion Project appears to be vital for sustaining urban water supply. However, while its role can be envisioned solely as a drought mitigator when adopting robust policies (even for maximum population growth rates), it becomes essential to mitigate day-to-day deficits for non-robust solutions.
-
Overall, it is possible to conclude that robust policies are usually vulnerable only to hydrological perturbations and are able to sustain the majority of the population growth and agricultural expansion scenarios. Moreover, infrastructural interventions become crucial only in extreme drought conditions. On the contrary, non-robust policies are also sensitive to social and agricultural changes and require structural interventions to ensure stable supply.
From a methodological and computational perspective, the proposed decision-analytic framework could be easily applied to any type of water system. However, in this study, the framework, conclusions, and discussions have been customized for the BPL river basin. Therefore, a possible future research path could be directed towards testing the proposed methodology across a range of hydro systems in order to assess how the stakeholders' tradeoffs, policy robustness, and vulnerabilities are shaped by inherently different water availability and demand trajectories. The aforementioned results, in terms of UA and SA, are specifically tailored to the parametric input perturbation set employed to generate the SOWs. Even though each perturbation set can be well documented from the literature, unexpected changes in one of the exogenous factors (i.e., higher population growth or lower streamflow availability) could shape the behavior of the system, altering, therefore, the extent to which a certain policy is vulnerable to each uncertainty source. One of the main limitations of this study is the assumption of independence among the distributions used for the generation of the historical trajectories multipliers which constitute the foundation for developing the states of the world. Even though such an assumption allows us to explore the full range of the variability in the exogenous drivers of the system, and has been successfully applied in recent hydrological applications (see, for example, Pianosi and Wagener, 2016, and Amaranto et al., 2020), a study entangling the covariance among the uncertainty sources could provide further insights on the robustness of each operating policy and can tailor the sensitivity analysis to a more reliable set of perturbations. It is, therefore, a recommendation for a future research exercise. In this study, the sources of vulnerability and the uncertain output realizations of the optimal water supply strategies are investigated only for robust policies. Therefore, RA and SA are sequential methodological steps rather than being interdependent. Future research could be developed towards implementing SA methods that establish feedback loops with RA in order to enhance the robustness of operating policies against uncertain exogenous factors. Furthermore, robust policies are selected here according to the minimax robustness metric. Minimax, by identifying the best alternative in the worst possible input realization, encompasses the risk-adverse behavior of the decision-maker. However, other criteria are available in the literature (see Giudici et al., 2020, for a review), with each of them representing a different level of risk perception and its associated definition of a robust operating policy. For a more comprehensive analysis, one could include additional robustness metrics in the experimental setup and evaluate how the choice of the metric shapes the selection of robust policy and the identification of the sources of vulnerability. A possible architecture in this regard can be found in Herman et al. (2015), where four different robustness definitions are considered, and robust planning decisions are developed accordingly.
The hydrological variables were provided by the Administração Regional de Águas (ARA) do Sul, but they are not publicly accessible due to the provider's request. Any requests for access to the data can be addressed to Alessandro Amaranto (alessandro. amaranto@gmail.com). All the remaining data used to run the experiment are stored at https://doi.org/10.5281/zenodo.5841294 (Amaranto, 2022a). The codes developed to generate the results are available at https://doi.org/10.5281/zenodo.5841224 (Amaranto, 2022b).
AA and AC conceptualized the paper, developed the methodology, and led the investigation. AA and DJ curated the data. AA wrote the original draft and reviewed and edited the paper with AC and DJ.
The contact author has declared that neither they nor their co-authors have any competing interests.
Publisher’s note: Copernicus Publications remains neutral with regard to jurisdictional claims in published maps and institutional affiliations.
The authors gratefully thank the Administração Regional de Águas (ARA) do Sul for providing the observed hydrological data. Finally, the authors thank Davide Danilo Chiarelli and Maria Cristina Rulli, for providing the irrigation demand data.
This project has been supported by the Polisocial Award 2018 from the Politecnico di Milano.
This paper was edited by Dimitri Solomatine and reviewed by Alessio Ciullo and Micha Werner.
Amaranto, A., Pianosi, F., Solomatine, D., Corzo, G., and Munoz-Arriola, F.: Sensitivity analysis of data-driven groundwater forecasts to hydroclimatic controls in irrigated croplands, J. Hydrol., 587, 124957, https://doi.org/10.1016/j.jhydrol.2020.124957, 2020. a, b
Amaranto, A.: Data from: Disentangling sources of future uncertainties for water management in sub-Saharan river basins [data set], https://doi.org/10.5281/zenodo.5841294, 2022a a
Amaranto, A.: Codes from: Disentangling sources of future uncertainties for water management in sub-Saharan river basins [code], https://doi.org/10.5281/zenodo.5841224, 2022b a
Bertoni, F., Castelletti, A., Giuliani, M., and Reed, P.: Discovering Dependencies, Trade-offs, and Robustness in Joint Dam Design and Operation: An Ex-post Assessment of the Kariba Dam, Earth's Future, 7, 1367–1390, 2019. a
Beven, K. and Binley, A.: The future of distributed models: model calibration and uncertainty prediction, Hydrol. Process., 6, 279–298, 1992. a, b
Brown, C., Ghile, Y., Laverty, M., and Li, K.: Decision scaling: Linking bottom-up vulnerability analysis with climate projections in the water sector, Water Resour. Res., 48, https://doi.org/10.1029/2011WR011212, 2012. a
Celeste, A. B. and Billib, M.: Evaluation of stochastic reservoir operation optimization models, Adv. Water Res., 32, 1429–1443, 2009. a
Ciullo, A., De Bruijn, K. M., Kwakkel, J. H., and Klijn, F.: Systemic flood risk management: The challenge of accounting for hydraulic interactions, Water, 11, 2530, https://doi.org/10.3390/w11122530, 2019. a
Coello, C. A. C., Lamont, G. B., Van Veldhuizen, D. A.: Evolutionary algorithms for solving multi-objective problems, vol. 5, Springer, ISBN 978-0-387-36797-2, 2007. a
Deb, K.: Multi-objective optimization using evolutionary algorithms, vol. 16, John Wiley & Sons, ISBN 978-0-471-87339-6, 2001. a
Denaro, S., Anghileri, D., Giuliani, M., and Castelletti, A.: Informing the operations of water reservoirs over multiple temporal scales by direct use of hydro-meteorological data, Adv. Water Res., 103, 51–63, 2017. a
Droogers, P., de Boer, F. S., and Terink, W.: Water Allocation Models for the Umbeluzi River Basin, Mozambique, Future Water Report, 132, 2014. a, b, c
Field, C. B.: Climate change 2014 – Impacts, adaptation and vulnerability: Regional aspects, Cambridge University Press, ISBN 978-1-107-05816-3, 2014. a
Fields, D., Odegard, L., French, L., and Revell, G.: Directions in hydropower: scaling up for development, Tech. rep., The World Bank, available at: https://documents.worldbank.org/curated/en/846331468333065380/pdf/490170NWP0Box31directionshydropower.pdf (last access: 23 October 2021), 2009. a
Giudici, F., Castelletti, A., Giuliani, M., and Maier, H. R.: An active learning approach for identifying the smallest subset of informative scenarios for robust planning under deep uncertainty, Environ. Modell. Softw., 127, 104681, https://doi.org/10.1016/j.envsoft.2020.104681, 2020. a, b
Giuliani, M., Anghileri, D., Castelletti, A., Vu, P. N., and Soncini-Sessa, R.: Large storage operations under climate change: expanding uncertainties and evolving tradeoffs, Environ. Res. Lett., 11, 035009, https://doi.org/10.1088/1748-9326/11/3/035009, 2016a. a
Giuliani, M., Castelletti, A., Pianosi, F., Mason, E., and Reed, P. M.: Curses, tradeoffs, and scalable management: Advancing evolutionary multiobjective direct policy search to improve water reservoir operations, J. Water Res. Pl., 142, 04015050, https://doi.org/10.1061/(ASCE)WR.1943-5452.0000570, 2016b. a, b, c, d, e
Giuliani, M., Zaniolo, M., Castelletti, A., Davoli, G., and Block, P.: Detecting the state of the climate system via artificial intelligence to improve seasonal forecasts and inform reservoir operations, Water Resour. Res., 55, 9133–9147, https://doi.org/10.1029/2019WR025035, 2019. a
Gleick, P. H. and Palaniappan, M.: Peak water limits to freshwater withdrawal and use, P. Natl. Acad. Sci. USA, 107, 11155–11162, 2010. a
Groves, D. G., Molina-Perez, E., Bloom, E., and Fischbach, J. R.: Robust decision making (RDM): application to water planning and climate policy, in: Decision Making under Deep Uncertainty, 135–163, Springer, Cham, https://doi.org/10.1007/978-3-030-05252-2, ISBN 978-3-030-05251-5, 2019. a
Hadka, D. and Reed, P.: Borg: An auto-adaptive many-objective evolutionary computing framework, Evol. Comput., 21, 231–259, 2013. a
Hashimoto, T., Stedinger, J. R., and Loucks, D. P.: Reliability, resiliency, and vulnerability criteria for water resource system performance evaluation, Water Resour. Res., 18, 14–20, 1982. a
Herman, J. D., Reed, P. M., Zeff, H. B., and Characklis, G. W.: How should robustness be defined for water systems planning under change?, J. Water Res. Pl., 141, 04015012, https://doi.org/10.1061/(ASCE)WR.1943-5452.0000509, 2015. a, b, c, d
Herman, J. D., Quinn, J. D., Steinschneider, S., Giuliani, M., and Fletcher, S.: Climate adaptation as a control problem: Review and perspectives on dynamic water resources planning under uncertainty, Water Resour. Res., 56, e24389, https://doi.org/10.1029/2019WR025502, 2019. a
Hermoso, V.: Freshwater ecosystems could become the biggest losers of the Paris Agreement, Glob. Change Biol., 23, 3433–3436, 2017. a
Juizo, D. and Hjorth, P.: Application of a district management approach to Southern African river basin systems: the case of the Umbeluzi, Incomati and Maputo river basins, Water Policy, 11, 719–730, 2009. a
Kibret, S., Lautze, J., McCartney, M., Nhamo, L., and Wilson, G. G.: Malaria and large dams in sub-Saharan Africa: future impacts in a changing climate, Malaria J., 15, 448, https://doi.org/10.1186/s12936-016-1498-9, 2016. a
Lempert, R. J.: Shaping the next one hundred years: new methods for quantitative, long-term policy analysis, RAND Corporation, ISBN 9780833032751, 2003. a
Lindström, G., Johansson, B., Persson, M., Gardelin, M., and Bergström, S.: Development and test of the distributed HBV-96 hydrological model, J. Hydrol., 201, 272–288, 1997. a
Macauhub: Pequenos Libombos dam, Mozambique suspends distribution of water to agriculture, Macauhub, available at: https://Macauhub.com.mo/2016/12/15/pequenos-libombos-dam-mozambique-suspends-distribution-of-water-to-agriculture/ (last access: 20 September 2021), 2016. a
Maier, H. R., Kapelan, Z., Kasprzyk, J., Kollat, J., Matott, L. S., Cunha, M. C., Dandy, G. C., Gibbs, M. S., Keedwell, E., Marchi, A., Ostfeld, A., Savic, D., Solomatine, D. P., Vrugt, J. A., Zecchin, A. C., Minsker, B. S., Barbour, E. J., Kuczera, G., Pasha, F., Castelletti, A., Giuliani, M., and Reed, P. M.: Evolutionary algorithms and other metaheuristics in water resources: Current status, research challenges and future directions, Environ. Modell. Softw., 62, 271–299, 2014. a
McPhail, C., Maier, H., Kwakkel, J., Giuliani, M., Castelletti, A., and Westra, S.: Robustness metrics: How are they calculated, when should they be used and why do they give different results?, Earth's Future, 6, 169–191, 2018. a
Miguel, M.: Mozambique-AFRICA-P125120-Greater Maputo Water Supply Expansion Project-Procurement Plan, Tech. rep., The World Bank, 2019. a
Montanari, A.: Large sample behaviors of the generalized likelihood uncertainty estimation (GLUE) in assessing the uncertainty of rainfall-runoff simulations, Water Resour. Res., 41, https://doi.org/10.1029/2004WR003826, 2005. a
Moran, E. F., Lopez, M. C., Moore, N., Müller, N., and Hyndman, D. W.: Sustainable hydropower in the 21st century, P. Natl. Acad. Sci. USA, 115, 11891–11898, 2018. a
Pianosi, F. and Wagener, T.: A simple and efficient method for global sensitivity analysis based on cumulative distribution functions, Environ. Modell. Softw., 67, 1–11, 2015. a, b
Pianosi, F. and Wagener, T.: Understanding the time-varying importance of different uncertainty sources in hydrological modelling using global sensitivity analysis, Hydrol. Process., 30, 3991–4003, 2016. a, b
Pianosi, F. and Wagener, T.: Distribution-based sensitivity analysis from a generic input-output sample, Environ. Modell. Softw., 108, 197–207, 2018. a
Pianosi, F., Beven, K., Freer, J., Hall, J. W., Rougier, J., Stephenson, D. B., and Wagener, T.: Sensitivity analysis of environmental models: A systematic review with practical workflow, Environ. Modell. Softw., 79, 214–232, 2016. a
Piccardi, C. and Soncini-Sessa, R.: Stochastic dynamic programming for reservoir optimal control: dense discretization and inflow correlation assumption made possible by parallel computing, Water Resour. Res., 27, 729–741, 1991. a
Quinn, J. D., Reed, P. M., Giuliani, M., and Castelletti, A.: What Is Controlling Our Control Rules? Opening the Black Box of Multireservoir Operating Policies Using Time-Varying Sensitivity Analysis, Water Resour. Res., 55, 5962–5984, 2019. a, b, c
Salazar, J. Z., Reed, P. M., Herman, J. D., Giuliani, M., and Castelletti, A.: A diagnostic assessment of evolutionary algorithms for multi-objective surface water reservoir control, Adv. Water Res., 92, 172–185, 2016. a
Saltelli, A., Ratto, M., Andres, T., Campolongo, F., Cariboni, J., Gatelli, D., Saisana, M., and Tarantola, S.: Global sensitivity analysis: the primer, John Wiley & Sons, ISBN 978-0-470-05997-5, 2008. a
Soncini-Sessa, R., Weber, E., and Castelletti, A.: Integrated and participatory water resources management-theory, Elsevier, ISBN 9780444530134, 2007. a
Trindade, B., Reed, P., Herman, J., Zeff, H., and Characklis, G.: Reducing regional drought vulnerabilities and multi-city robustness conflicts using many-objective optimization under deep uncertainty, Adv. Water Resour., 104, 195–209, 2017. a
Trindade, B., Reed, P., and Characklis, G.: Deeply uncertain pathways: Integrated multi-city regional water supply infrastructure investment and portfolio management, Adv. Water Res., 134, 103442, https://doi.org/10.1016/j.advwatres.2019.103442, 2019. a
Wald, A.: Statistical Decision Functions, John Wiley and Sons, New York, https://doi.org/10.2307/2280105, 1950. a
Zadeh, F. K., Nossent, J., Sarrazin, F., Pianosi, F., van Griensven, A., Wagener, T., and Bauwens, W.: Comparison of variance-based and moment-independent global sensitivity analysis approaches by application to the SWAT model, Environ. Modell. Softw., 91, 210–222, 2017. a
Zampieri, M., Carmona Garcia, G., Dentener, F., Gumma, M. K., Salamon, P., Seguini, L., and Toreti, A.: Surface freshwater limitation explains worst rice production anomaly in India in 2002, Remote Sens., 10, 244, https://doi.org/10.3390/rs10020244, 2018. a
Zaniolo, M., Giuliani, M., Castelletti, A. F., and Pulido-Velazquez, M.: Automatic design of basin-specific drought indexes for highly regulated water systems, Hydrol. Earth Syst. Sci., 22, 2409–2424, https://doi.org/10.5194/hess-22-2409-2018, 2018. a
Zaniolo, M., Giuliani, M., and Castelletti, A.: Data-driven modeling and control of droughts, IFAC-PapersOnLine, 52, 54–60, 2019. a