the Creative Commons Attribution 4.0 License.
the Creative Commons Attribution 4.0 License.
 | 06 Apr 2022
Storylines of UK drought based on the 2010–2012 event
Wilson C. H. Chan
Theodore G. Shepherd
Katie Facer-Childs
Geoff Darch
Nigel W. Arnell
Spatially extensive multi-year hydrological droughts cause significant environmental stress. The UK is expected to remain vulnerable to future multi-year droughts under climate change. Existing approaches to quantify hydrological impacts of climate change often rely solely on global climate model (GCM) projections following different emission scenarios. This may miss out low-probability events with significant impacts. As a means of exploring such events, physical climate storyline approaches aim to quantify physically coherent articulations of how observed events could hypothetically have unfolded in alternative ways. This study uses the 2010–2012 drought, the most recent period of severe hydrological drought in the UK, as a basis and analyses storylines based on changes to (1) precondition severity, (2) temporal drought sequence, and (3) climate change. Evidence from multiple storylines shows that the maximum intensity, mean deficit, and duration of the 2010–2012 drought were highly influenced by its meteorological preconditions prior to drought inception, particularly for northern catchments at shorter timescales. The influence of progressively drier preconditions reflects both the spatial variation in drought preconditions and the role of physical catchment characteristics, particularly hydrogeology in the propagation of multi-year droughts. There are two plausible storylines of an additional dry year with dry winter conditions repeated either before the observed drought or replacing the observed dramatic drought termination confirm the vulnerability of UK catchments to a “third dry winter” storyline. Applying the UKCP18 climate projections, we find that drought conditions worsen with global warming with a mitigation of drought conditions by wetter winters in northern catchments at high warming levels. Comparison of the storylines with a benchmark drought (1975–1976) and a protracted multi-year drought (1989–1993) shows that, for each storyline (including the climate change storylines), drought conditions could have matched and exceeded those experienced during the past droughts at catchments across the UK, particularly for southern catchments. The construction of storylines based on observed events can complement existing methods to stress test UK catchments against plausible unrealised droughts.
- Article
(4530 KB) - Full-text XML
-
Supplement
(1538 KB) - BibTeX
- EndNote


Droughts incur significant impacts on the natural environment and across multiple sectors. Meteorological droughts – continuous periods of below-normal precipitation – propagate through the hydrological cycle and translate into hydrological droughts – extended periods of below-normal river flow or groundwater levels – and soil moisture droughts (Van Loon, 2015). Drought propagation, conditioned by catchment properties, can result in hydrological droughts that are significantly longer in duration and more intense and that affect a larger area (Barker et al., 2016). Hydrological droughts threaten water resources availability and incur additional environmental and socioeconomic consequences. The UK has experienced several periods of severe hydrological droughts since the 1950s, including the benchmark 1975–1976 drought (Marsh et al., 2007). However, although intense, this drought was relatively short-lived, and other events are more significant in locations where hydrological systems are sensitive to longer droughts. The 1989–1993 and 2004–2006 droughts and the more recent 2010–2012 drought further raised awareness of the vulnerability of the UK to future multi-year droughts. Previous research has shown that past UK multi-year droughts were characterised by at least one winter with significant precipitation deficit, and significant uncertainties remain over the role of remote climate drivers and changes to atmospheric circulation under climate change (Parry et al., 2012; Folland et al., 2015), which would affect the probability of multi-year precipitation deficits. A deeper understanding of the causal factors of multi-year droughts is a significant challenge for current and future water management.
National-scale assessment for the impacts of climate change on UK river flows point to a general reduction in annual river flow, except for western Scotland, with higher certainty over a decrease in summer but lower agreement over changes in winter (Arnell, 2011; Prudhomme et al., 2012; v. Christierson et al., 2012). A recent synthesis identified that significant uncertainty remains over the magnitude of seasonal flow changes, with lower agreement on changes in the autumn and spring (Garner et al., 2017). Comparing probabilistic projections from the UK Climate Projections 2009 (UKCP09) and 2018 (UKCP18) at 10 UK catchments, Kay et al. (2020) found that low and average flows at the selected catchments are projected to decrease in most cases for the 2050s, although the magnitude of change for UKCP18 is smaller compared to UKCP09. Specific studies focusing on droughts point to increased drought intensity and frequency, with more significant changes beyond the 2050s (Burke et al., 2010; Rahiz and New, 2013; Dobson et al., 2020). Studies diverge on changes to the frequency and impacts of long-duration droughts, with some suggesting increases in seasonal, shorter-duration droughts (e.g. Blenkinsop and Fowler, 2007; Chun et al., 2013a) and others highlighting parts of the UK, particularly southern England, as hotspots for future multi-year droughts (e.g. Prudhomme et al., 2014; Brunner and Tallaksen, 2019). Using the UKCP09 projections, Rudd et al. (2019) further found that there is a high likelihood of coincident hydrological droughts occurring in the Thames and Severn basins, and that both peak drought intensity and duration are projected to increase in southeastern England in the far future (2070s).
Approaches to studying the hydrological impacts of climate change in the UK have developed from an initially simple stylised approach focused on system sensitivity and has been dominated, since the mid-1990s, by global climate model (GCM)-driven approaches using a variety of techniques to apply climate change scenarios (Chan et al., 2022). A common characteristic of GCM-driven studies is that they are top-down in nature, as their outcomes are constrained by the selected GCMs following different emission scenarios. Often, these studies result in wide uncertainty ranges and are presented via the ensemble mean (Smith et al., 2018; Shepherd, 2019). When quantitative scenarios are used as input to climate models, and subsequently in impact models, multiple sources of uncertainty cascade and total uncertainty increases through each step of the modelling chain, a phenomenon which has been dubbed the “cascade of uncertainty” (Wilby and Dessai, 2010). GCM-related uncertainty – i.e. uncertainty among projected impacts from different climate models – is regularly cited as being the largest source of uncertainty. This relates to uncertainty in the projections of circulation-related aspects of climate change (e.g. precipitation) over land (Shepherd, 2014). Although studies often attempt to analyse as much of the cascade of uncertainty as possible, even the most comprehensive studies are unable to fully analyse all sources of uncertainty along the entire modelling chain (Smith et al., 2018). Recent studies have thus tended to consist of increasingly computationally demanding data-processing workflows, and its outcomes often involve large amounts of data presented with wide uncertainty ranges, which is not conducive to decision-making (Løhre et al., 2019). This drive to disseminate probabilistic information from GCM projections may also fail to adequately consider the full range of possible futures and, in particular, the risks associated with low-likelihood, high-impact events (Sutton, 2019). This is particularly the case with events involving persistent low-frequency atmospheric circulation regimes, which climate models struggle to represent accurately (Simpson et al., 2018).
Given the deep uncertainties involved, bottom-up approaches have emerged to consider a wider range of plausible futures and aim to use GCM projections as complementary information rather than as the only line of evidence. Scenario-neutral approaches explore system sensitivity through exploratory simulations on a two-dimensional response surface (e.g. changes in temperature and precipitation seasonality), encompassing a wide range of plausible outcomes (Prudhomme et al., 2010). Similarly, decision scaling seeks to link response surfaces with specific decisions to identify thresholds where the system becomes unreliable (Brown et al., 2012). However, these approaches are designed as an initial screening tool, and more detailed analysis of the selected futures identified on the response surface are still needed (Prudhomme et al., 2015). A known limitation is that it is difficult to consider more than two dimensions at a time and may require multiple response surfaces to consider additional variables. These approaches can also be resource intensive as they cover sensitivity over large ranges, regardless of plausibility or empirical experience. For a more detailed comparison of the advantages and limitations of top-down and bottom-up approaches, see Chan et al. (2022).
Recent studies have advocated for the creation of tales or storylines of extreme events by conducting exploratory experiments to identify ways in which high-impact events may develop (Hazeleger et al., 2015; Shepherd et al., 2018). Storylines are defined as the physically self-consistent unfolding of past events or of plausible future events (Shepherd et al., 2018). The drivers and impacts of every drought event vary significantly. Analysing the spatial coherence of European hydrological droughts since the 1960s, Hannaford et al. (2011) noted that every event had distinctive drought signatures. There is, therefore, merit in looking at individual droughts following an event storyline approach (as opposed to aggregating over many dissimilar events). An event storyline approach operates on the basis of the observed event and enables a forensic investigation that describes the impacts from a wide range of plausible changes to the event's causal factors (Lloyd and Shepherd, 2020; Doblas-Reyes et al., 2021). This approach is specifically designed to consider plausible, high-impact events and strengthen risk awareness to avoid type II errors (i.e. missed warnings; Shepherd, 2019). Thus, storylines need not have probabilities attached, and they place emphasis on specific drivers of extreme events. Event storylines also enable the creation of downward counterfactuals to reimagine how events could have turned out worse given changes to its characteristics and drivers (such as timing and sequence; Lin et al., 2020). Although storylines are deterministic, there is a logical rationale for the storyline approach based on the fundamental principles of probability theory, given the deep uncertainties in the circulation response of climate change and its representation in climate models (Shepherd, 2021). Recent examples of event-based studies include case studies of the six past droughts in East Anglia (Lister et al., 2018), an analysis of anomalous winter 2010 European temperatures (Cattiaux et al., 2010), a retrospective comparison of the 2003 and 2015 European droughts (Laaha et al., 2017), and an in-depth investigation of the seasonal drivers of the 2018 European heatwave (Bastos et al., 2020).
In this study, we select the 2010–2012 UK drought as a case study from which different counterfactual storylines (i.e. events that did not happen in reality) are constructed. The aims of this research are as follows:
-
Analyse the development of the 2010–2012 UK drought and the variation in hydrological response across UK catchments
-
Create a number of storylines representing alternative unfoldings of the 2010–2012 drought event, with changes to (1) precondition severity, (2) temporal drought sequence, and (3) climate change at different warming levels
-
Compare characteristics of the observed event and its storylines with those of selected severe droughts in the past.
2.1 Streamflow data and hierarchical clustering
In this study, we select catchments in the UK National River Flow Archive's (NRFA) low flow Benchmark Network (LFBN). The LFBN comprises catchments that are suitable for the low flow analysis given their near-natural conditions (Harrigan et al., 2018). We select the 100 catchments within the LFBN that are in England, Scotland, and Wales and which overlap with catchments selected in previous drought studies by Smith et al. (2019) and Barker et al. (2019; Fig. S1 in the Supplement). Daily observed river flow (m3 s−1) and catchment properties were extracted via the rnrfa R package (Vitolo et al., 2016). The Standardised Streamflow Index (SSI) is used to characterise droughts (Vincente-Serrano et al., 2012). The SSI is calculated by accumulating monthly river flow across a user-defined n number of months and fitting a probability distribution function to the accumulated monthly flow for each calendar month and standardised by transformation to a standard normal distribution. Comparing different probability distribution functions, Svensson et al. (2017) concluded that the Tweedie distribution is most suitable and was selected for this study. SSI fitted using the Tweedie distribution has previously been used for hydrological drought analysis in Barker et al. (2016, 2019) and Arnell et al. (2021). Agglomerative hierarchical clustering, a dendrogram-based clustering approach, was used to group catchments with similar drought response using the TSclust R package (Montero and Vilar, 2014). Similar SSI hydrographs accumulated over 6 months (SSI-6) are grouped using the Ward's minimum variance method to minimise total within-cluster variance (Ward, 1963).
2.2 Storylines considered in this study
The storyline approach provides a flexible means to investigate counterfactuals and the impacts of climate change. The storylines created for the 2010–2012 drought involve plausible changes to the causal elements behind the event to represent different ways in which the event could have unfolded. Table 1 shows the various storylines considered in this study and example research questions that each storyline aims to address.
Table 1Storylines considered in this study and description of example research questions.
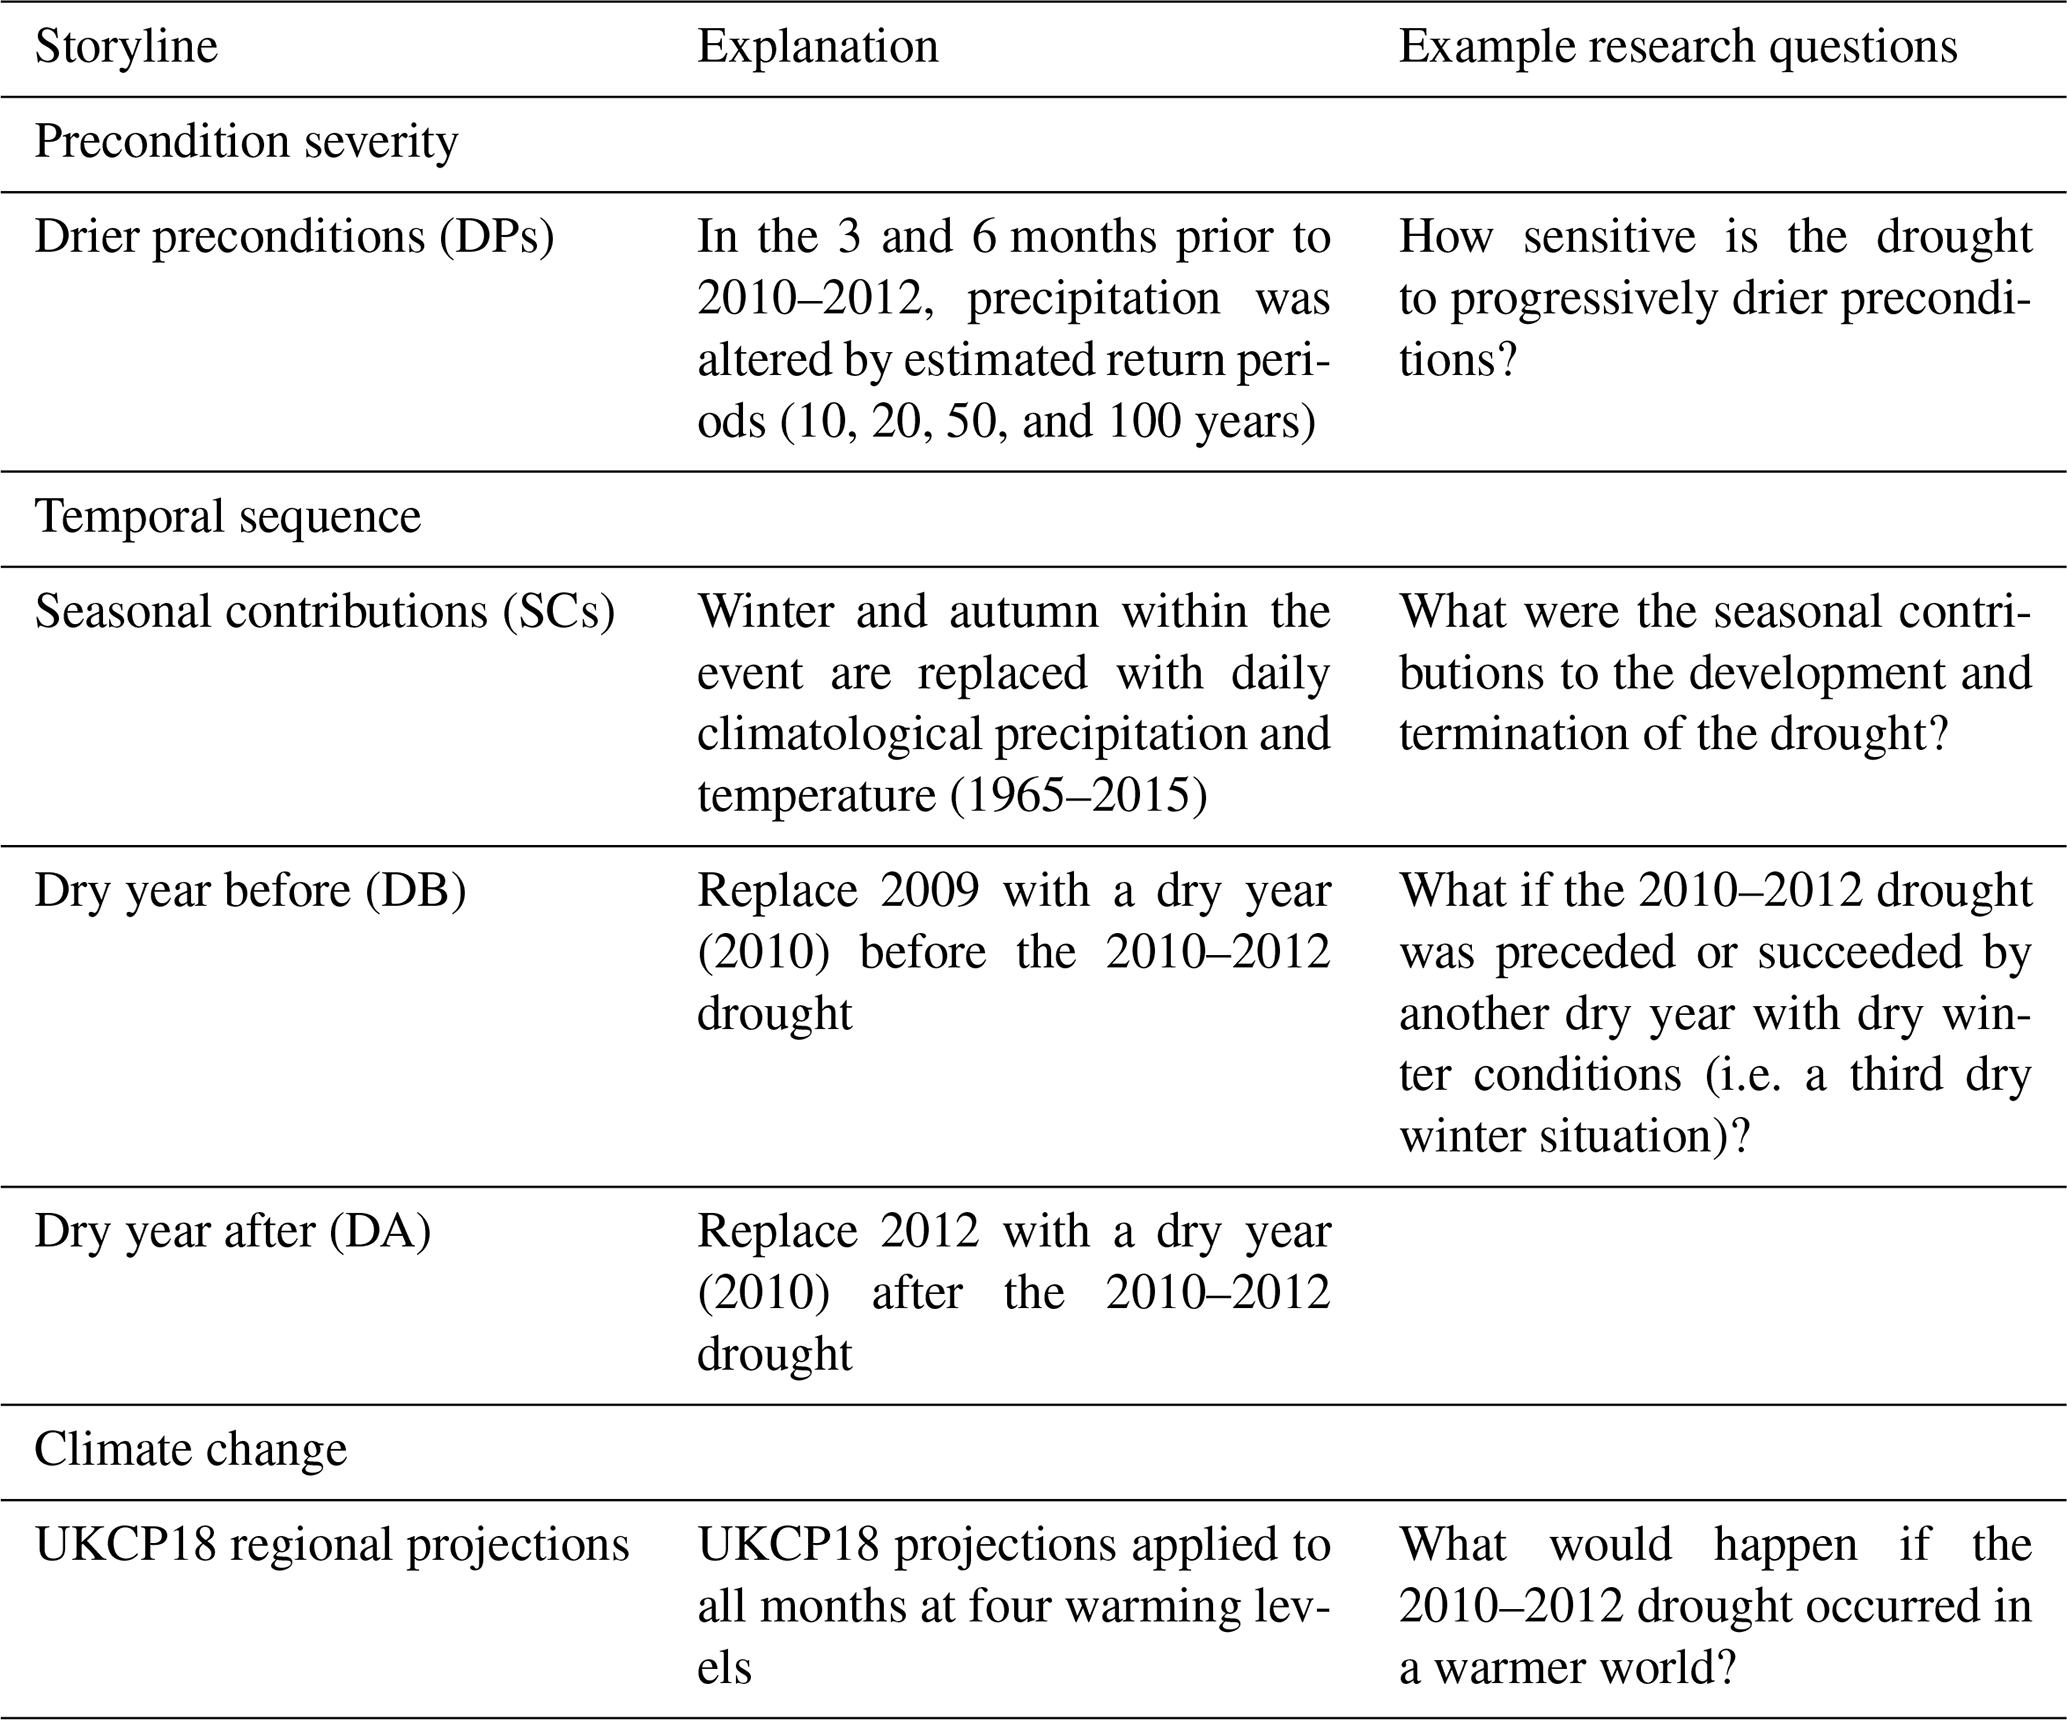
2.2.1 Precondition severity
Storylines of precondition severity investigate the sensitivity of the 2010–2012 event to progressively drier preconditions. The preconditions are altered based on an estimation of the return periods of precipitation for 3 and 6 months preceding the observed event. Specified return periods (10, 20, 50 and 100-year) are estimated from annual average 3-month (October–December) and 6-month (July–December) precipitation for each of the 100 catchments for 1900–2015 and fitted with the generalised extreme value (GEV) distribution. Observed precipitation for the 3 and 6 months prior to the 2010–2012 drought is then reduced or increased to match the estimated precipitation at each return period. The temporal variability is thereby unchanged from the observed precipitation of the specified 3- or 6-month period. The influence of the perturbed preconditions is characterised by the precondition persistence time. This is defined as the number of days needed for river flow at each catchment to return to values close to the baseline simulation (< 1 %) calculated from the start of the perturbation until the influence of the perturbation is no longer detected. The precondition persistence time is not indicative of the time taken for catchments to entirely recover from drought to non-drought conditions but is instead indicative of how long the influence of precondition perturbations lasts for each catchment. This is consistent with indices used in Staudinger and Seibert (2014) and Stoelzle et al. (2020) to assess hydrological response following initial condition perturbations.
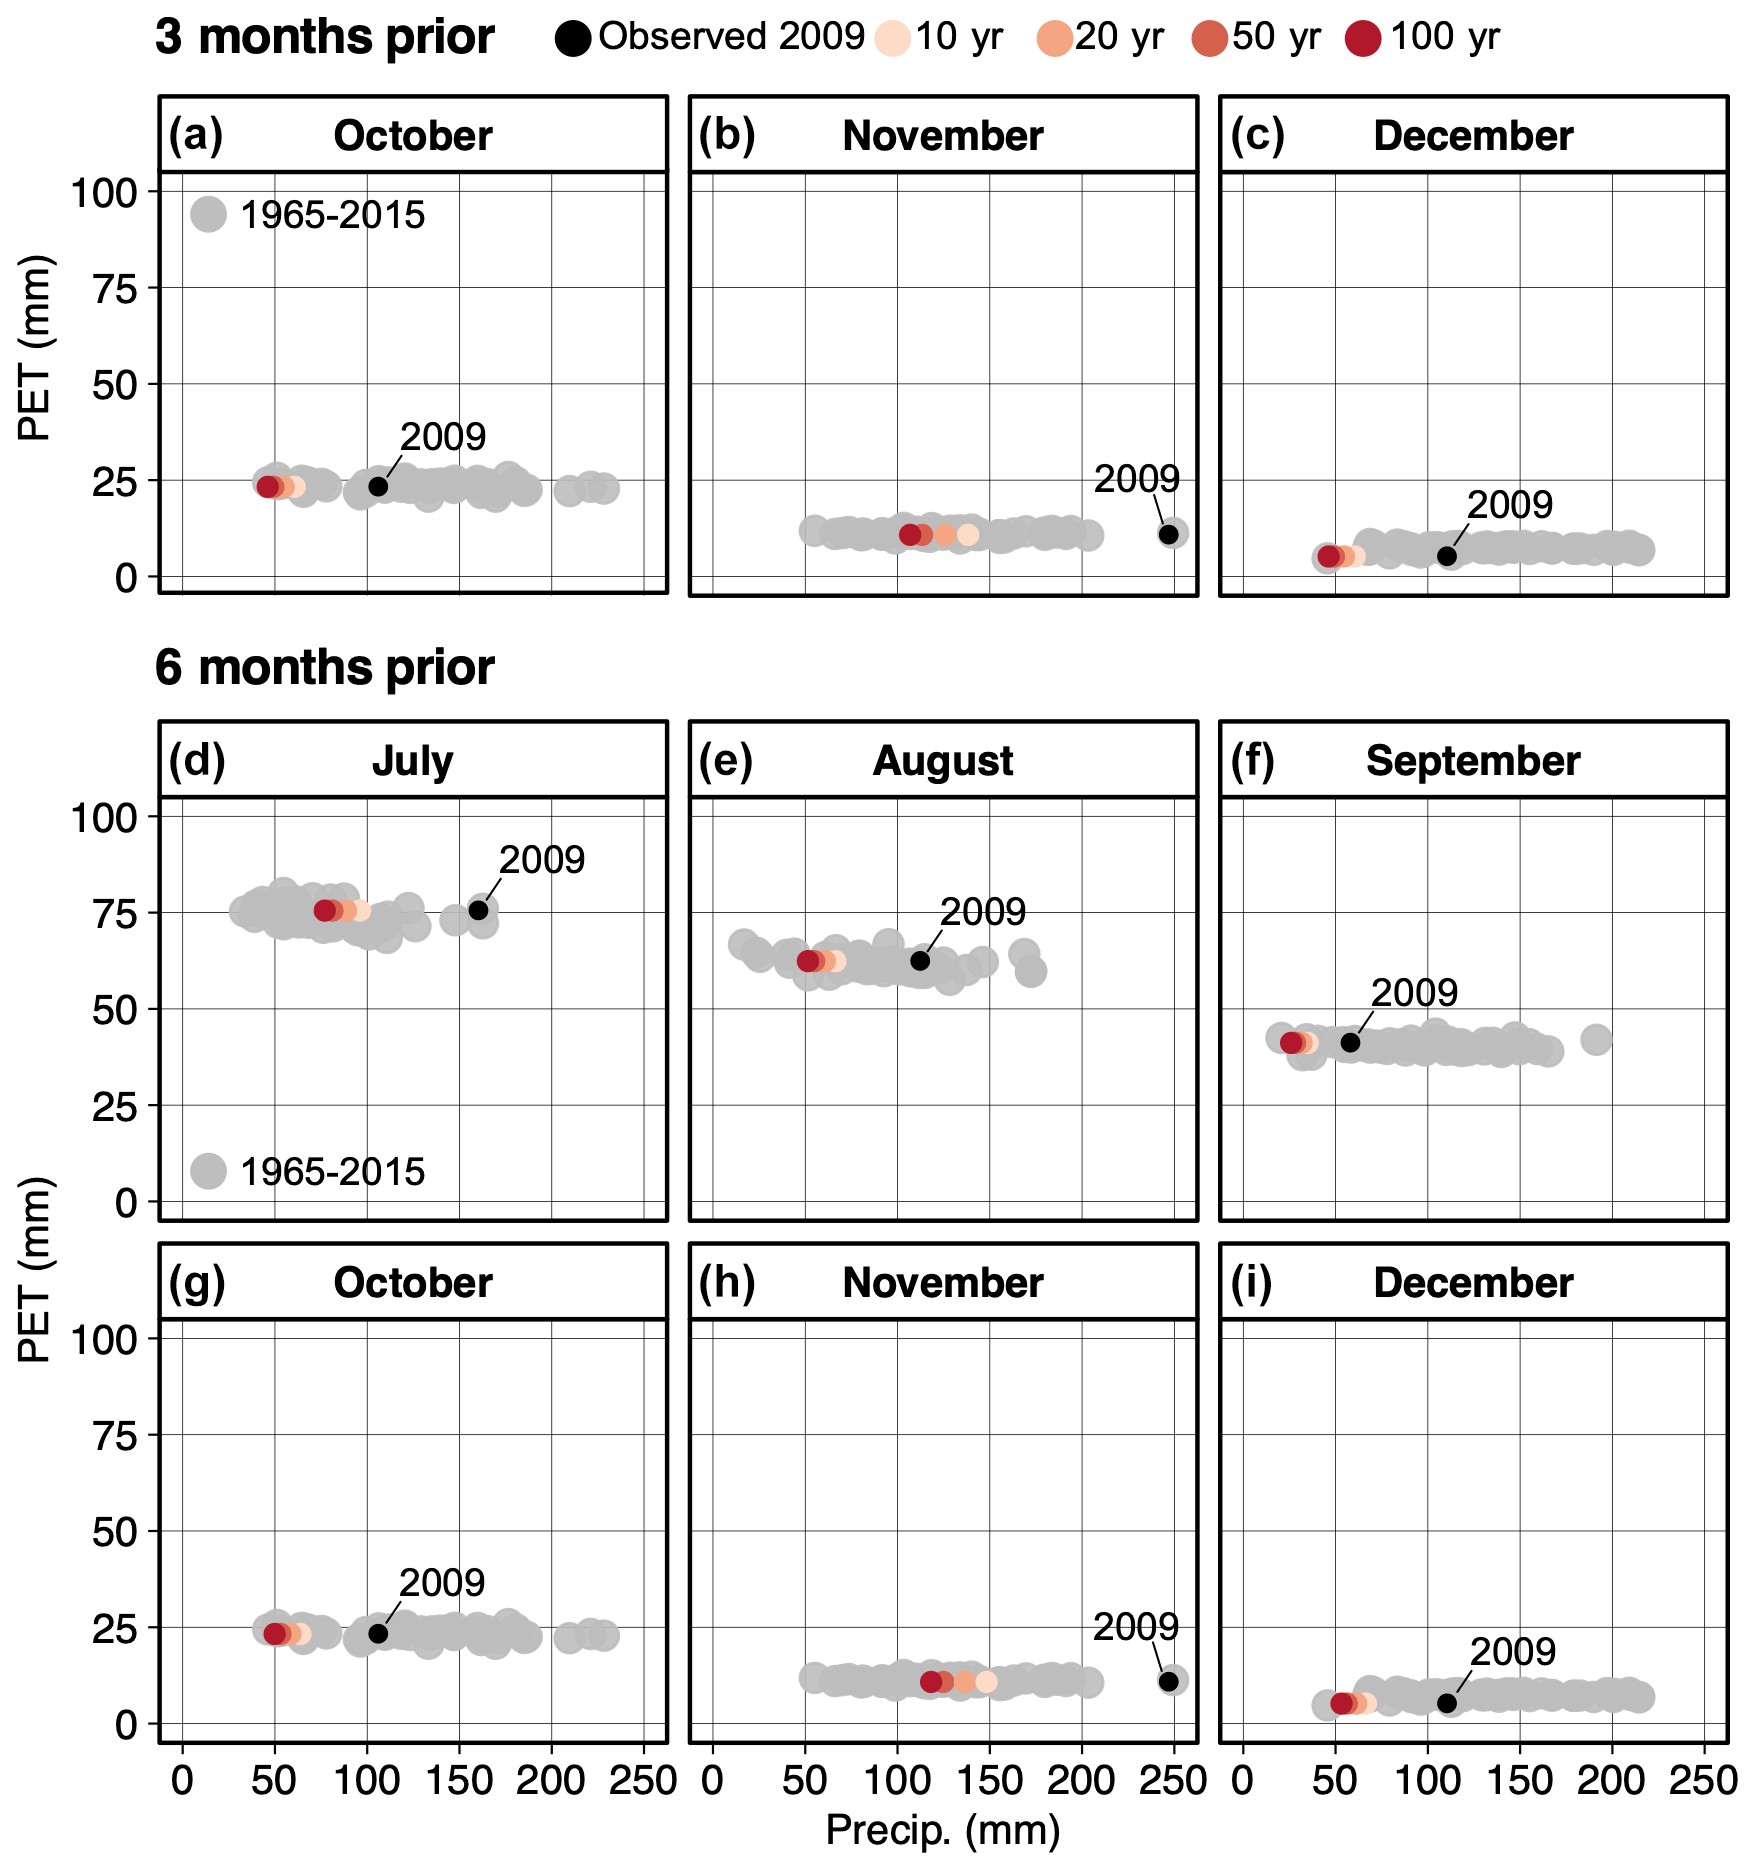
Figure 1October to December (top) and July to December (bottom) monthly precipitation and PET (1965–2015) at an example catchment in southern England. The black circle indicates the observed value in 2009, and the coloured circles indicate the value after precipitation 3 and 6 months prior to the 2010–2012 drought is reduced at four return periods.
A consideration during the creation of these storylines is whether the perturbations violate the correlation structures between PET and precipitation, which are both inputs in subsequent hydrological modelling. Perturbing the precipitation prior to the observed drought independently of PET is plausible, as observed precipitation and PET for the period 1965–2015 exhibit no correlation, except for a weak negative correlation in spring and early summer (Fig. S2). The resulting monthly precipitation after perturbations does not create outliers in the observed relationship between precipitation and PET (Fig. 1). The creation of event storylines to understand the role of preconditions in locations other than the UK may have to consider potential changes to the correlation structures if a strong correlation between different variables of interest is found. Additionally, the precondition perturbations do not violate existing autocorrelation structures as autocorrelation among successive monthly UK precipitation values decays rapidly after the first few months (also noted during the development of stochastic weather generators; Kilsby et al., 2007; Serinaldi and Kilsby, 2012; Chun et al., 2013b).
2.2.2 Temporal sequence
The two sets of storylines are created by altering the temporal sequence of precipitation and temperature of the 2010–2012 drought by retaining certain periods and altering others based on historical observations. First, to investigate the relative importance of individual seasons in drought development, we create storylines of seasonal contributions by prescribing daily climatological average precipitation and temperature for winter 2010/2011 and 2011/2012 and for autumn 2010 and 2011, while retaining observed values for the rest of the time series. The difference between the storylines and the baseline is indicative of the individual contribution of winter/autumn.
Second, we create storylines using historical climate analogues to explore a “third dry winter” situation (i.e. three consecutive dry years with dry winter conditions). These storylines are inspired by the Hydrological Outlook UK historical climate approach, where projections of river flows are produced by driving hydrological models with ensemble meteorological sequences sampled from the historical record combined with up-to-date observations (Prudhomme et al., 2017). The “dry year before” storyline replaces the year preceding the drought (i.e. 2009), whereas the “dry year after” storyline replaces the year succeeding the drought (i.e. from March 2012 to 2013) to explore the consequences if the drought was not terminated by anomalously wet conditions in spring 2012. We select 2010 as the year to be repeated, as it was notable for its cold and dry conditions. Although climate projections indicate average changes in a future period – for example, drier summers and wetter winters – these changes do not necessarily occur concurrently and may not be true for all years. Consecutive dry seasons are possible, and the hydrological response to long dry sequences merits further investigation. Successive dry winters are shown to have caused significant reduction in river flows and reservoir storage in both observations and river flow reconstructions (Watts et al., 2012; Spraggs et al., 2015; Barker et al., 2019). Quantifying historical transition probabilities of consecutive dry half-years in England and Wales, Wilby et al. (2015) found that the longest consecutive dry half-years spanned 4 years (including four dry winters) and that even longer dry sequences are possible. Additionally, a third dry winter situation specific to the 2010–2012 drought is a plausible case to investigate, given widespread concerns during late 2011 and early 2012 when multiple water companies issued water use restrictions and applied for drought permits in anticipation of further depletion in water resources over 2012 based on the prevailing atmospheric conditions (Marsh et al., 2013).
2.2.3 Climate change
We use the UKCP18 12-member HadRM3 perturbed parameter ensemble (PPE) regional climate projections at 12 km resolution to place the 2010–2012 event in a future climate. The 12-member PPE was created by exploring the plausible ranges of the climate model parameter space, which are provided as spatially coherent projections and important, given the spatial characteristics of droughts (Lowe et al., 2018). A time-sampling approach (James et al., 2017) was used to select the 10-year time period starting from the year that each ensemble member reaches conditions equivalent to four global warming levels (1.5, 2, 3, and 4 ∘C) relative to 1981–2010. The delta change method is used to apply the projections. Monthly change factors for precipitation (%) and temperature (∘C) are generated by comparing projections for a baseline period (1981–2010) to projections of the designated 10-year future periods for each river basin region and applied either additively (for temperature) or multiplicatively (for precipitation) to the baseline temperature and precipitation for each catchment. The delta change method is widely and consistently employed in studies projecting the impacts of climate change across UK catchments (e.g. Arnell et al., 2003; Wilby and Harris, 2006; Kay et al., 2020). In its standard form, this method retains the historical variability in the observations, and changes in dry/wet spell lengths are not considered. Variations in the delta change approach have been proposed to calculate percentile- or quantile-based change factors to represent different magnitudes of relative changes in wet and dry days and short-duration rainfall intensity (see Anandhi et al., 2011 for overview). Alternative statistical downscaling techniques correct for different biases, but all techniques share the assumption that the biases corrected for and the bias correction technique itself remain valid for future time periods. It is also challenging to validate the plausibility of analogue events found in bias corrected data due to uncertainty over the realism of climate model simulations for persistent circulation extremes (important for multi-year droughts like the 2010–2012 event; Ault et al., 2014; Moon et al., 2018) and how atmospheric circulation patterns will change under climate change (Shepherd, 2014).
The storylines of climate change aim to place the 2010–2012 drought in a future climate instead of generalising across dissimilar events. The underlying philosophy is that, for such singular events, climate change (at least over the time frame of interest here) is a relatively small perturbation compared to natural variability, so perturbing an observed event is preferable, in terms of physical realism, compared to making a large and inevitably aggregated bias correction to climate model projection. Retaining the observed drought sequence, the meteorological conditions driving the observed drought remain consistent and plausible. This is an assumption that sacrifices the ability to generalise over all droughts, but focuses on the specificity, and does not incur the uncertainties of bias correction and downscaling, which are significant contributors to the cascade of uncertainty (Maraun et al., 2017). It also increases the realism and familiarity with stakeholders and enables more interpretable comparison with the other storylines also created based on altering the observed drought sequence.
2.3 Drought characteristics
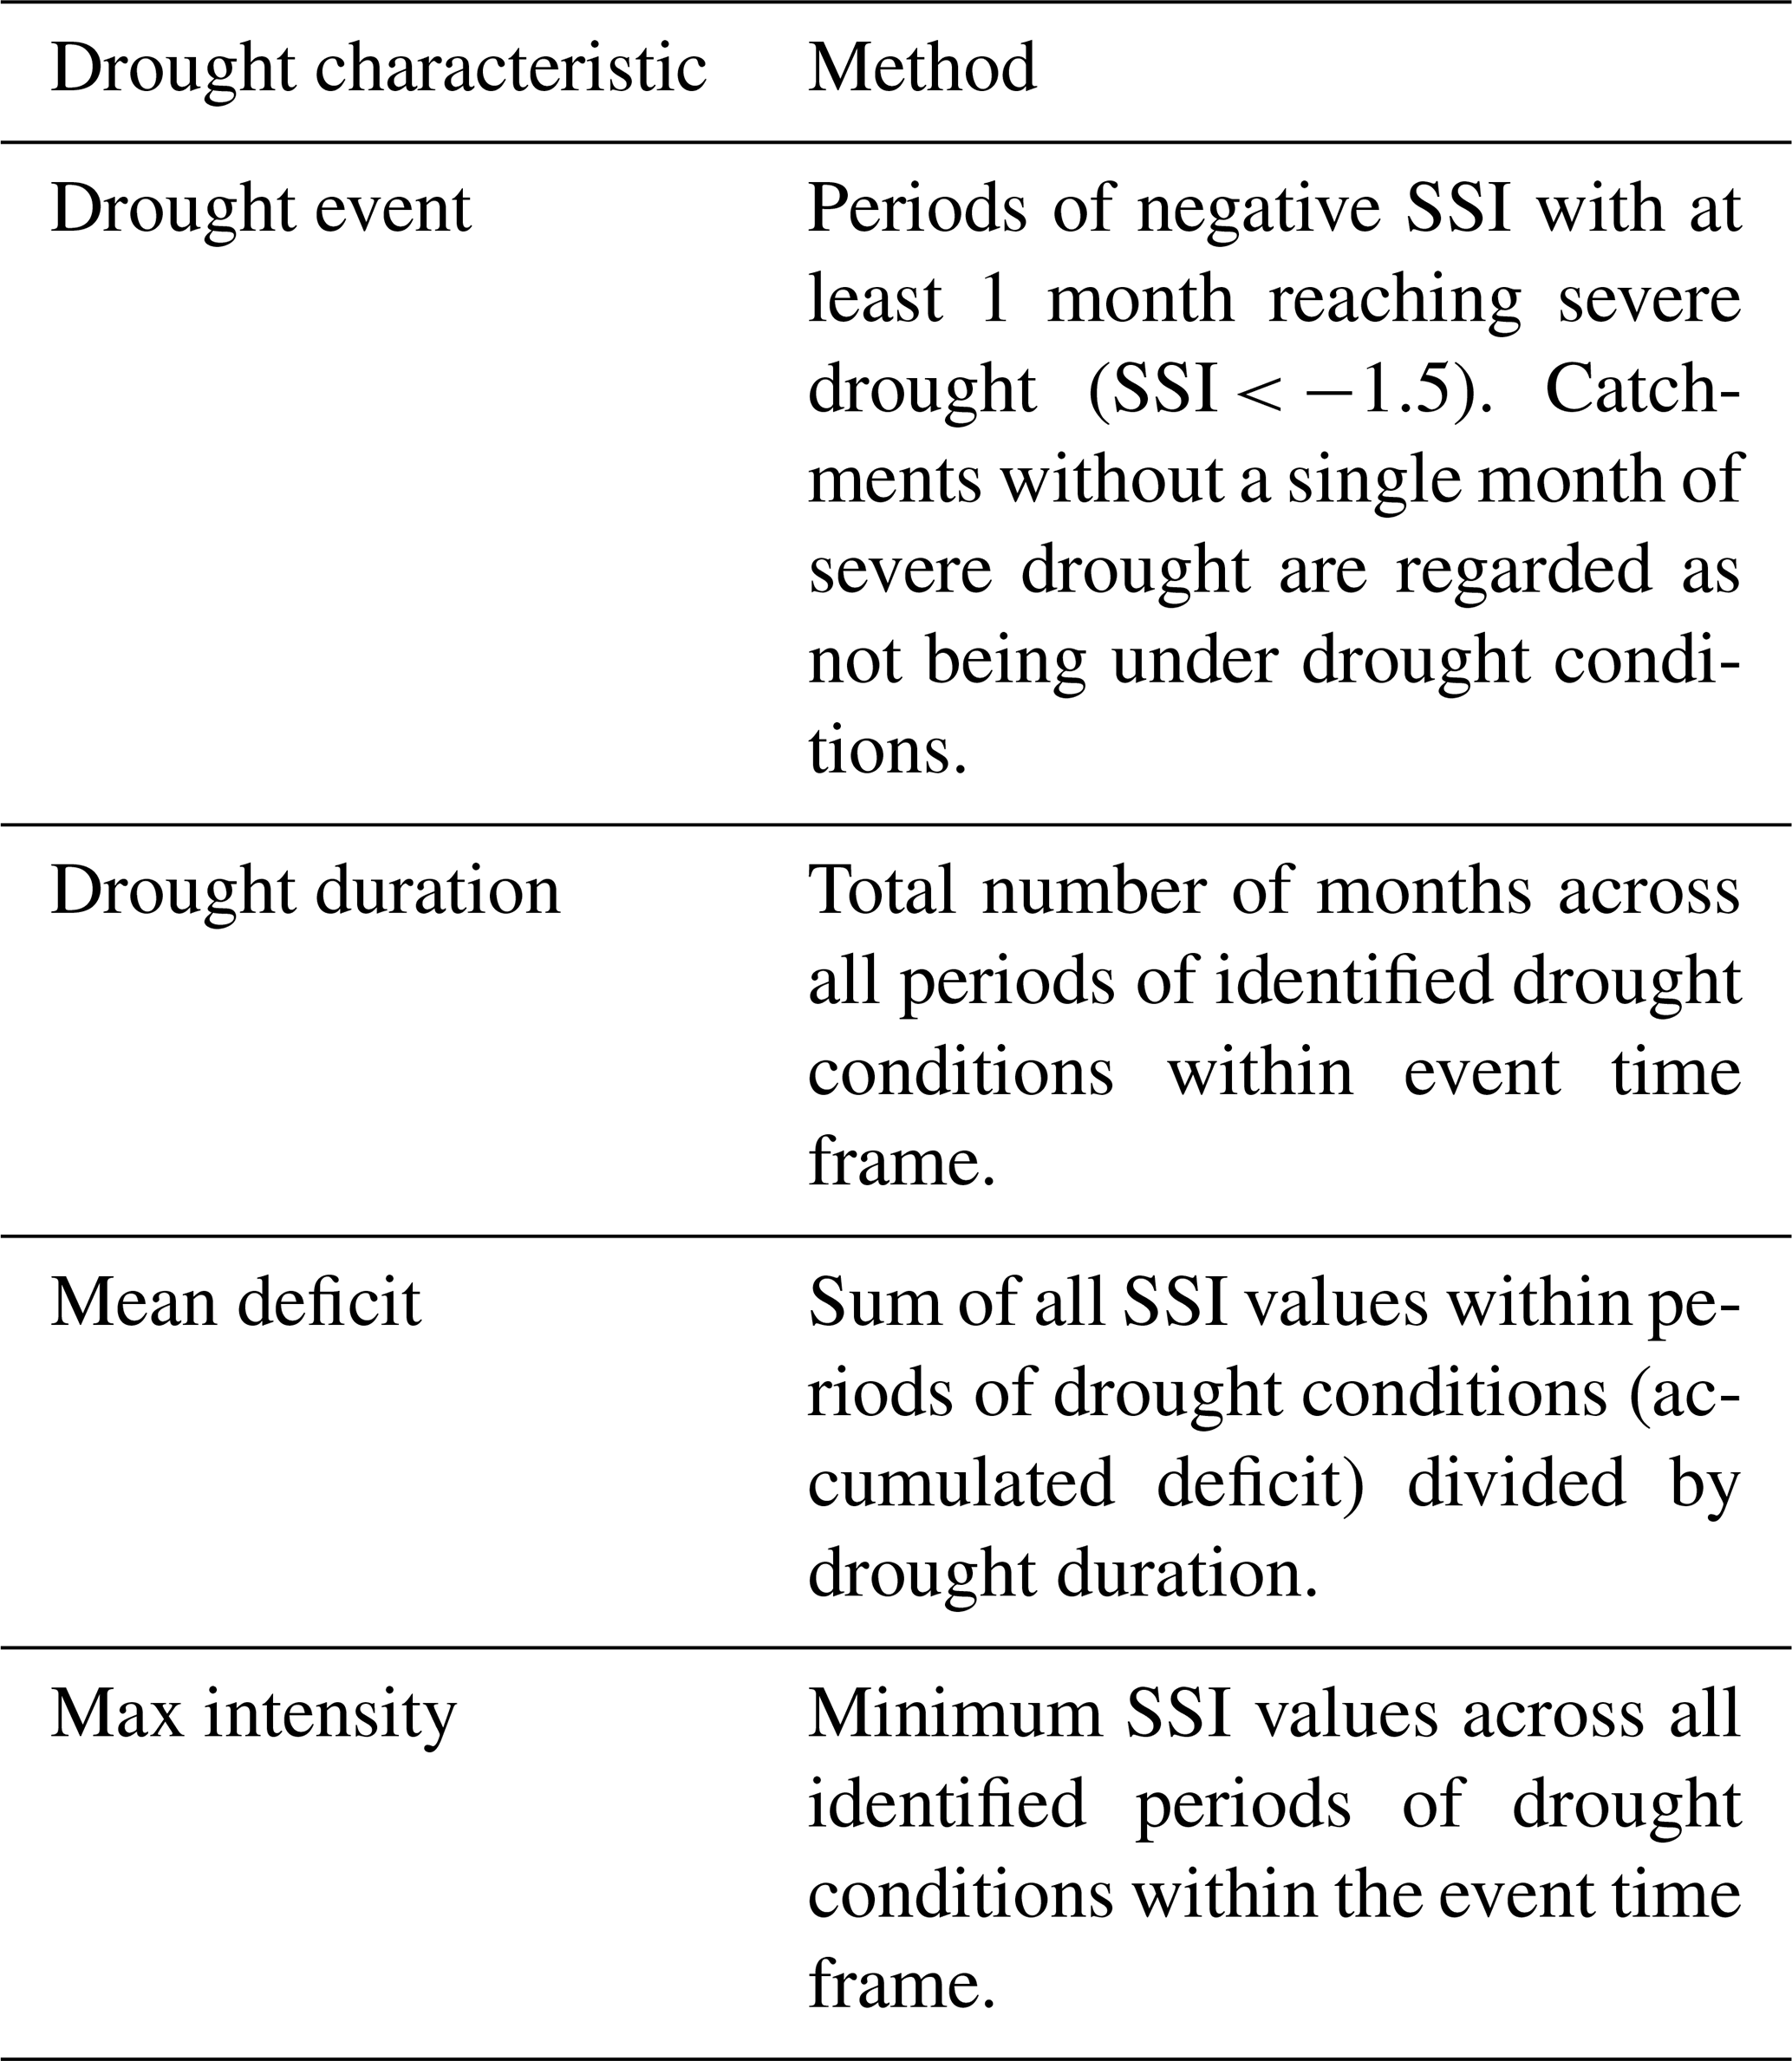
Table 2 shows the drought characteristics extracted using SSI accumulated over 6, 12, and 24 months. The parameter values for fitting the Tweedie distribution are retained from the baseline and used to fit the distribution for each storyline. The same drought characteristics were used in Barker et al. (2019) to characterise historic droughts for the same set of UK catchments.
Table 2Drought characteristics considered in this study and their derivation method.
2.4 Hydrological modelling and parameter uncertainty
The GR4J hydrological model is used to simulate the river flow for the baseline and storylines. GR4J is a daily lumped, bucket-type hydrological model with four model parameters available for calibration (Perrin et al., 2003). GR4J is driven by catchment-averaged daily precipitation (CEH-GEAR dataset; Robinson et al., 2020) and potential evapotranspiration (PET). PET is estimated using the temperature-based McGuinness–Bordne equation calculated from daily mean temperature (CEH CHESS dataset) with parameters tuned specifically for the UK (Tanguy et al., 2018).
In this study, we make use of the GR4J parameter sets produced by Smith et al. (2019) for the same set of catchments. In Smith et al. (2019), 500 000 parameter sets for each catchment were sampled, using Latin hypercube sampling (LHS), and ranked based on model performance of six evaluation metrics focused on both high and low flows and overall water balance (Nash–Sutcliffe efficiency – NSE; absolute percent bias – PBIAS; mean absolute percent error – MAPE; NSE on logarithmic flows – logNSE; absolute percent bias in Q95; absolute percent error in 30 d mean annual minimum flows). Smith et al. (2019) subsequently used the top 500 parameter sets (LHS500) to reconstruct historic flows and demonstrated that they were able to simulate and reproduce characteristics (timing and magnitude) of key historic droughts. As the LHS500 ranking was based on model performance over a long baseline period, we conduct a differential split-sample experiment to re-rank LHS500. For each catchment, the 10 driest years were selected based on mean annual precipitation (1965–2015). Model performance for each of the driest years was calculated using daily observed and simulated river flow for four of the metrics in Smith et al. (2019), namely NSE, logNSE, MAPE, and PBIAS. The metrics selected are unweighted as the high flows (NSE), timing of low flows (logNSE), flow variability (MAPE), and overall water balance (PBIAS) should be considered equally important for river flows during the driest years. This is to ensure that the full range of flow response during dry years is considered, including the potential for wetter interludes during dry years (such as those seen during the 2010–2012 drought). It is also important to consider high flows during the antecedent conditions of drought events. In the context of the storyline approach, this is especially important, given that antecedent conditions are varied in the storylines of precondition severity. The parameter sets are then ranked from best to worst for each metric and given a score (1 to 500, where a higher score implies worse performance). Finally, we re-rank LHS500 based on the total score to obtain the sum of scores for each parameter set for each metric. Retaining the new ranking, the performance metrics are re-calculated for each catchment, first for the 10 wettest years and again for all years. By doing so, we investigate how parameter rankings change under different conditions.
Model performance is comparable between the new (dry rank) and the original rank (LHS500; Fig. 2). NSE and logNSE values show high values across most catchments. (see Fig. S3 in the Supplement). Notable outliers with relatively poorer performance were fast-responding catchments in northern Scotland, identified in Smith et al. (2019) as catchments with flashy river regimes that are difficult to capture with possible snowmelt processes not incorporated in GR4J. The split-sample experiment indicates that optimising the LHS500 parameter ranking based on dry conditions does not result in significant differences, although, for some catchments, the top parameter set in the dry rank results in a marginally better performance during the driest years. The top-ranked parameter set in the original LHS500 ranking remains unchanged in the dry rank for 17 out of the 100 catchments. For most catchments (54 out of 100), the top parameter set in the new dry rank is within the top 10 of the original LHS500 rankings. For the remaining catchments, the top parameter set in the new dry rank are all found in the top 100 of the original LHS500 rankings (Fig. S3c). For the simulation of the baseline 2010–2012 drought and its storylines, we use the top-ranked parameter set from the dry rank which simulates river flows well across the catchments during this period (Fig. S4).
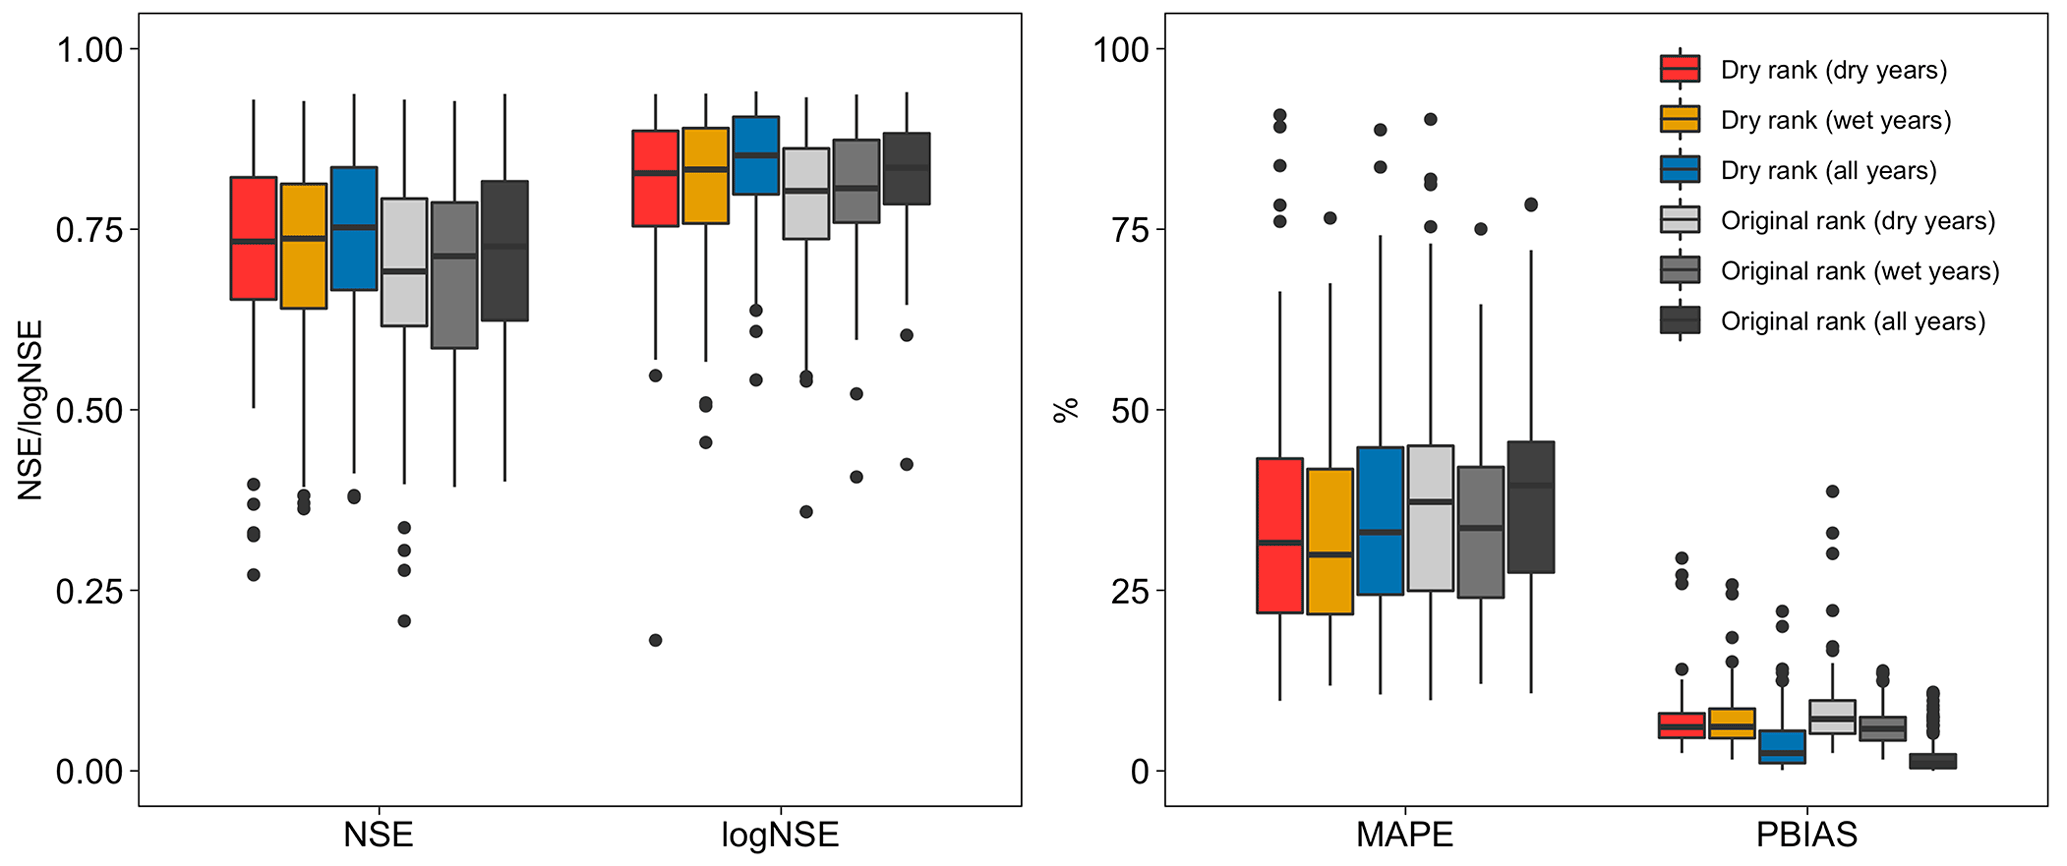
Figure 2Model performance of the top-ranked parameter set across the selected catchments between parameter sets ranked based on the 10 driest years (dry rank) and the original LHS500 rank (original rank). Comparison is made for the top-ranked parameter set in either the dry rank or the original rank when the model performance metrics are calculated for the 10 driest years, 10 wettest years, and all years.
3.1 Anatomy of the 2010–2012 drought
The 2010–2012 drought is ranked among the top 10 most significant multi-year droughts in the English lowlands for the past 100 years (Folland et al., 2015) The drought was characterised by persistent blocked weather patterns over the UK from a northward shift of the jet stream over 2010 and 2011 (Kendon et al., 2013). Precipitation deficits were concentrated in winter, an important period when aquifer replenishment and reservoir re-fills normally occur. The precipitation during winters 2009/2010, 2010/2011, and 2011/2012 was all below average, confirming the importance of consecutive dry winters (Fig. 3). The exceptionally cold and dry winter of 2009/2010 was the precursor to the drought, with significantly below-average precipitation across western UK. The further northward shift of the jet stream in 2010 and across 2011 led to the development of a significant NW/SE precipitation gradient, with normal to above-normal precipitation in the north and drier than average conditions in the south, where the most severe conditions developed (Kendon et al., 2013). The drought was notable for its dramatic termination due to anomalously wet conditions over spring 2012, leading to a drought termination rate that was almost 4 times quicker than other droughts in the observed record (Parry et al., 2013, 2016). Drought orders were used by water companies to supplement reservoir stocks, and temporary hosepipe and water use bans affecting over 20×106 customers were ordered, in early 2012, in anticipation of continued drought stress, prior to its abrupt termination (Kendon et al., 2013). The 2010–2012 drought also incurred over GBP 400 million in agricultural losses and impacts to industrial activities from water use restrictions (Rey et al., 2017).

Figure 3(a) Mean SSI-6 values between January 2010 and March 2012. (b) Yearly winter and autumn precipitation and temperature anomalies (relative to 1965–2015) averaged over the 100 selected catchments. The years 2009, 2010, 2011, and 2012 are shown by the red dots, and the rest of the years are shown by the black dots.
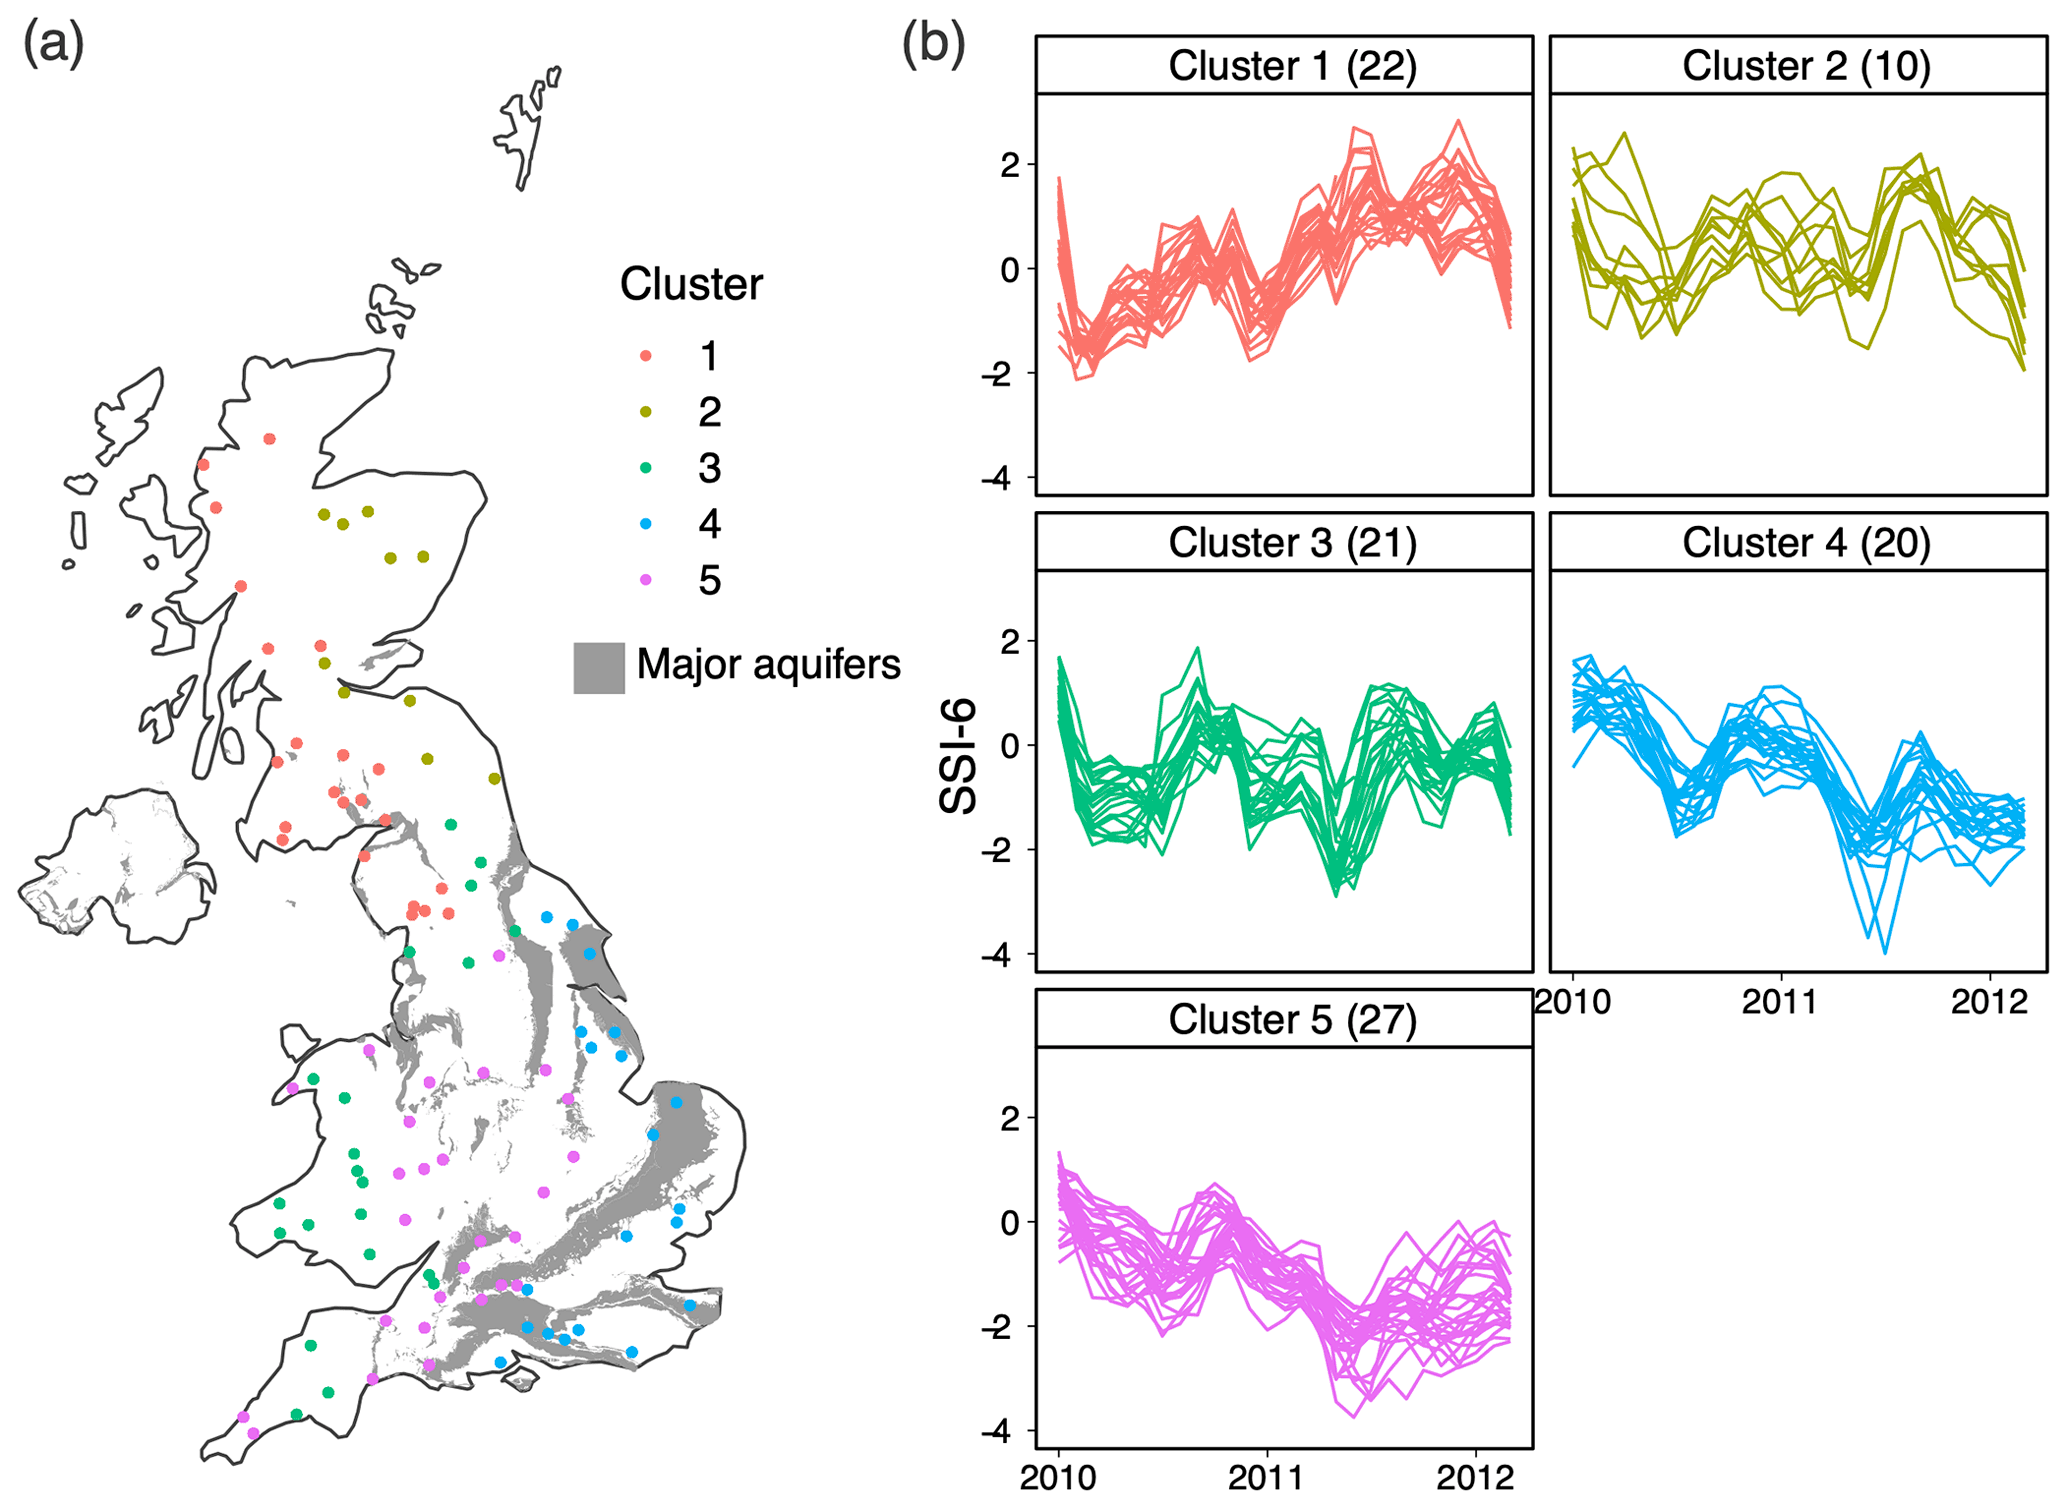
Figure 4Hierarchical clustering of SSI-6 during the 2010–2012 drought event. (a) Spatial variation in the five identified clusters. (b) SSI-6 between January 2010 and December 2012 for the catchments in each cluster (with the number of catchments indicated).
Hierarchical clustering based on the SSI-6 time series between January 2010 and March 2012 is used to group catchments with similar drought response (Fig. 4). Cluster numbers between 2–10 were tested; five clusters are chosen as an appropriate number as this provides a clear distinction between hydrogeological units across southern England. The diversity of hydrological response to droughts in groundwater-dominated catchments in southern England has been shown by Merchant and Bloomfield (2018), and differences in hydrological drought response among catchments in this region should be considered. The use of five clusters also divides northern catchments into east and west Scotland and distinguishes catchments in east Scotland where the influence of snowmelt processes may be more prevalent (also catchments with relatively poorer model performance). We select SSI-6 to delineate clusters because it allows for a greater separation of catchments based on a larger variation in short-term drought response. SSI calculated with longer accumulation periods leads to a grouping of the hydrological response where only two clusters can be qualitatively identified. Subsequent storyline analyses will employ SSI-6, SSI-12, and SSI-24 in order to consider the role of catchment memory.
Initial streamflow response was uniform in response to precipitation deficit in early 2010 for all clusters with moderate to severe drought conditions (SSI < −1.5). Severe drought conditions developed for catchments in Clusters 4 and 5 (southern and southeastern England) because of a second consecutive dry winter. Most catchments in Cluster 4 are underlain by chalk aquifers and are slow-responding catchments with significant groundwater storage. Catchments in Cluster 3 (southwestern England) saw severe drought conditions develop over late 2010 and 2011, but the impacts did not persist as long and were not as severe as Clusters 4 and 5. Although mean SSI-6 was not particularly severe, the SSI-6 time series for Clusters 1 and 2 show mild to severe conditions in the initial response to precipitation deficit over winter 2009/2010, after which streamflow recovered and did not return to drought conditions.
3.2 Storylines of seasonal contributions
Storylines of seasonal contributions reveal the relative importance of individual seasons in the development of the 2010–2012 drought (Fig. 5). The storylines confirm the importance of dry winters in the development of multi-year droughts. Drier than average winters 2010/2011 and 2011/2012 were a major determinant of the severe drought conditions observed across all clusters apart from Cluster 1. Baseline drought conditions across 2011, particularly for catchments in southern England (Clusters 4 and 5), can be attributed to the abnormally cold and dry winter in 2010/2011. The drier-than-average winter of 2011/2012 prolonged drought termination for all clusters, apart from Cluster 1. For Cluster 1, winter 2011/2012 was wetter than average, and the replacement of winter 2011/2012 with climatology would have meant that catchments could have experienced short-term minor drought conditions before recovery due to the wet conditions in 2012.
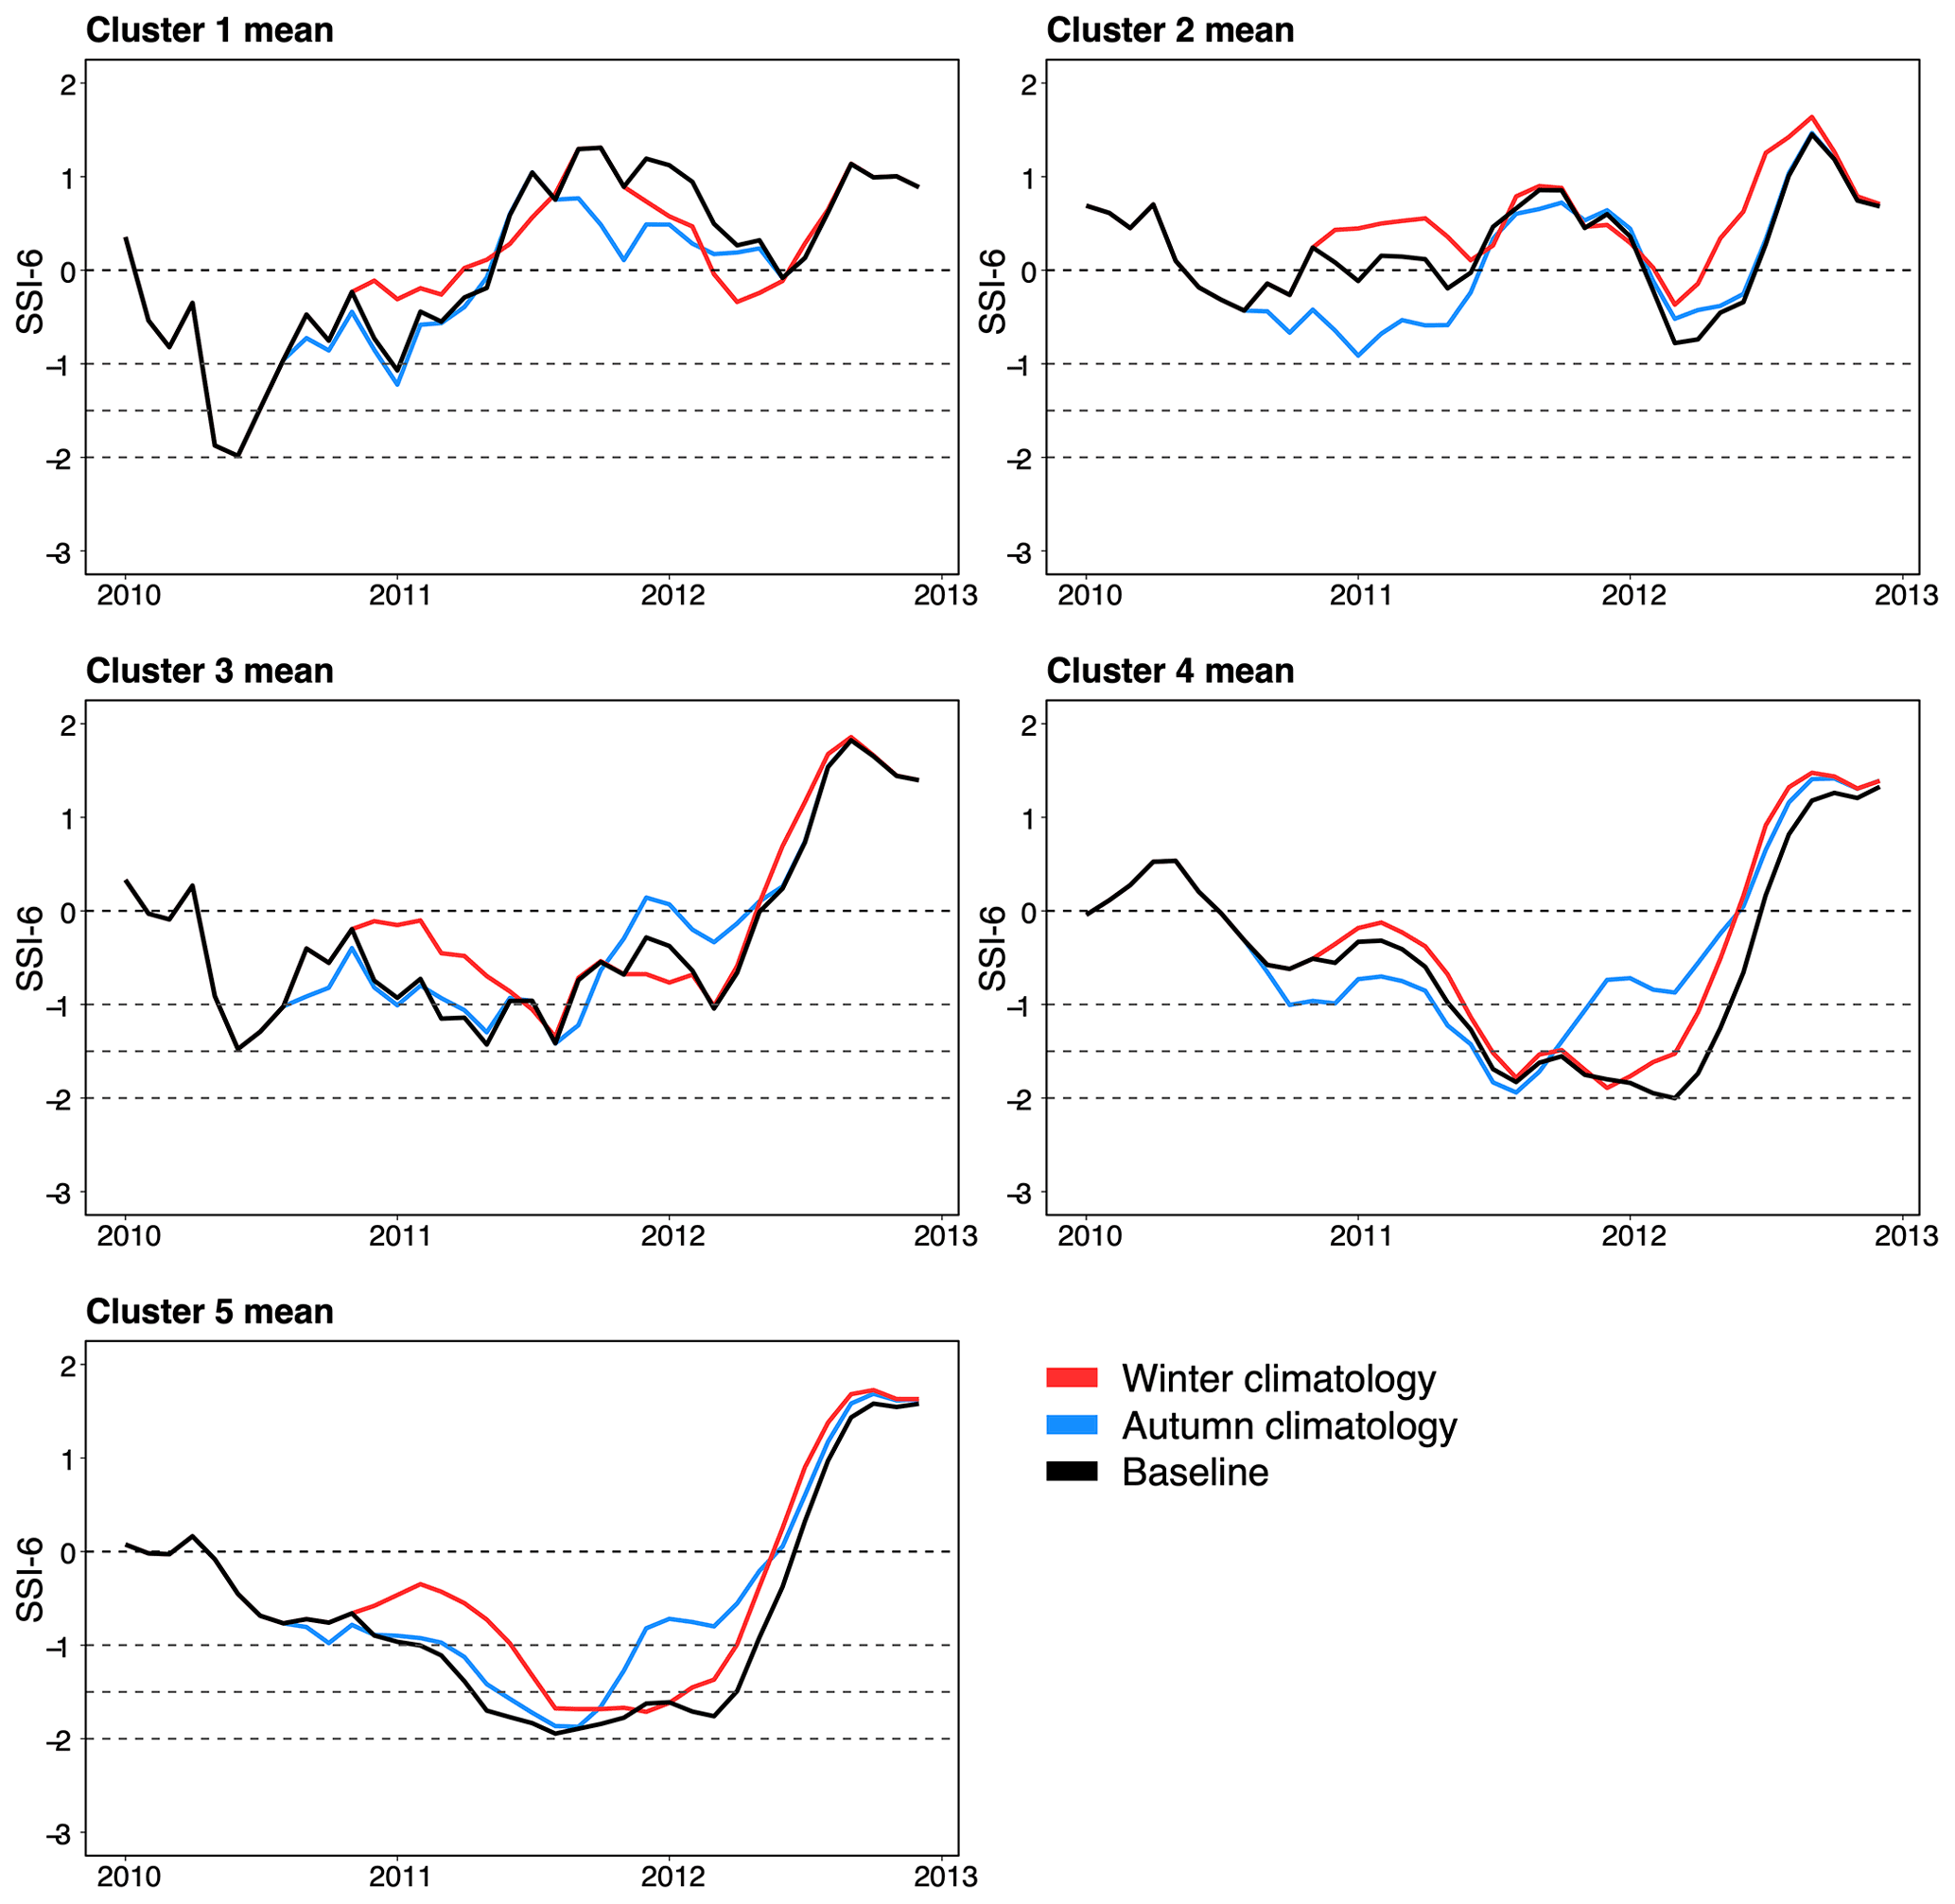
Figure 5Cluster mean SSI-6 for the storylines of seasonal contributions with winter 2010/2011 (red) and with autumn 2010 and 2011 (blue) replaced by daily climatological values. See Figs. S5 and S6 for the equivalent figure for SSI-12 and SSI-24.
The wetter-than-average autumn of 2010 prevented catchments in all clusters from an earlier drought inception and more intense drought conditions, apart from Cluster 5. For Cluster 5, autumn 2010 was drier than average, which accelerated the drought inception for SSI-6, but the effects are less noticeable at longer accumulation periods. Conversely, autumn 2011 was drier than average, which exacerbated conditions across the most affected catchments when coupled with drier-than-average winter conditions. Without the dry autumn 2011, the most affected catchments would have begun drought recovery earlier, and dry winter conditions alone would not have been enough to prolong the drought conditions, as seen in the baseline. For Clusters 1 and 2, the wetter-than-average autumn 2011 prevented the recovered catchments from returning to mild drought conditions, particularly at longer accumulation periods.
In summary, the wetter(drier-)-than-average autumn 2010 (2011) resulted in diverging effects for catchments in Clusters 1 and 2 compared to Clusters 3–5. The drier-than-average winters in 2010/2011 and 2011/2012 worsened drought conditions. At the most affected catchments, the effects of dry winters are most notable for SSI-24, highlighting the role of catchment storage in attenuating dry winter conditions. Autumn conditions were a determinant of the timing of drought inception, while winter conditions were important in determining the drought's length.
3.3 Storylines of precondition severity
Prescribing drier preconditions at varying severity for the 3 and 6 months prior to the 2010–2012 drought reveals the influence of preconditions on the baseline event (Fig. 6). As the aims of altering the precondition severity are to investigate short-term catchment sensitivity to drier preconditions, only SSI-6 is used here. Drier preconditions led to 12-month precipitation prior to the drought varying between 65 % and 107 % (48 % and 90 %) relative to the long-term average for the 3-month (6-month) precipitation reduction, with significantly greater deficit for catchments in Clusters 4 and 5 (Fig. S7). Unsurprisingly, both drought characteristics worsen in most cases for all clusters, with an increase in precondition severity. The exception is Cluster 2, where changes in precondition precipitation with 10- and 20-year return periods lead to a reduction in drought intensity and deficit, meaning that the dryness observed in the 3- and 6-month precipitation prior to the 2010–2012 event had a return period of more than 20 years. The difference between the two precondition lengths is notable, especially at longer return periods, where a 6-month precondition length results in much greater change. Maximum intensity for the catchments in Cluster 5 is particularly less sensitive to the influence of drier preconditions at shorter return periods, indicating that the conditions that developed prior to 2010 (i.e. winter 2009/2010) were already dry enough for the development of severe drought conditions, and only preconditions with longer return periods would result in significant differences to the eventual drought characteristics.

Figure 6Change in mean drought deficit (%), max drought intensity (%), and persistence time (d) from the storylines of precondition severity at different return levels calculated from SSI-6.
The influence of the driest preconditions considered (i.e. 6-month and 100-year return period) separates clusters into fast- (Clusters 1–3) and slow-responding (Clusters 4 and 5; Fig. 6c). Drought conditions at fast-responding catchments are sensitive to the least severe preconditions (10-year return period). Conversely, a change in max intensity is relatively minimal for slow-responding catchments and is only notable with preconditions beyond a 20-year return period. The spatial variation in the precondition persistence time differentiates catchments according to latitude, with those in southern England showing the longest persistence time, coinciding with regions of major aquifers (Fig. 7). Persistence time also accounts for latitudinal differences in the selected catchment properties shown in Table 3. There is a positive relationship between persistence time and both the baseflow index (BFI) and the proportion of arable/horticultural land. Higher values of the BFI are associated with more permeable catchments, particularly in the English lowlands. These catchments have high groundwater storage, which contributes to surface streamflow during drought and are associated with more agricultural/horticultural activities compared to impermeable catchments. Catchments with longer persistence times also tend to be larger in size, less steep, receive lower annual average precipitation, and exhibit dry soil moisture for a larger proportion of time. This confirms that permeable lowland catchments are more vulnerable to long drought propagation, with a lag (and lengthening) between meteorological and hydrological droughts. Catchment sensitivity to drier preconditions reflects a combination of spatial characteristics of the drought and catchment properties and particularly the influence of hydrogeology.
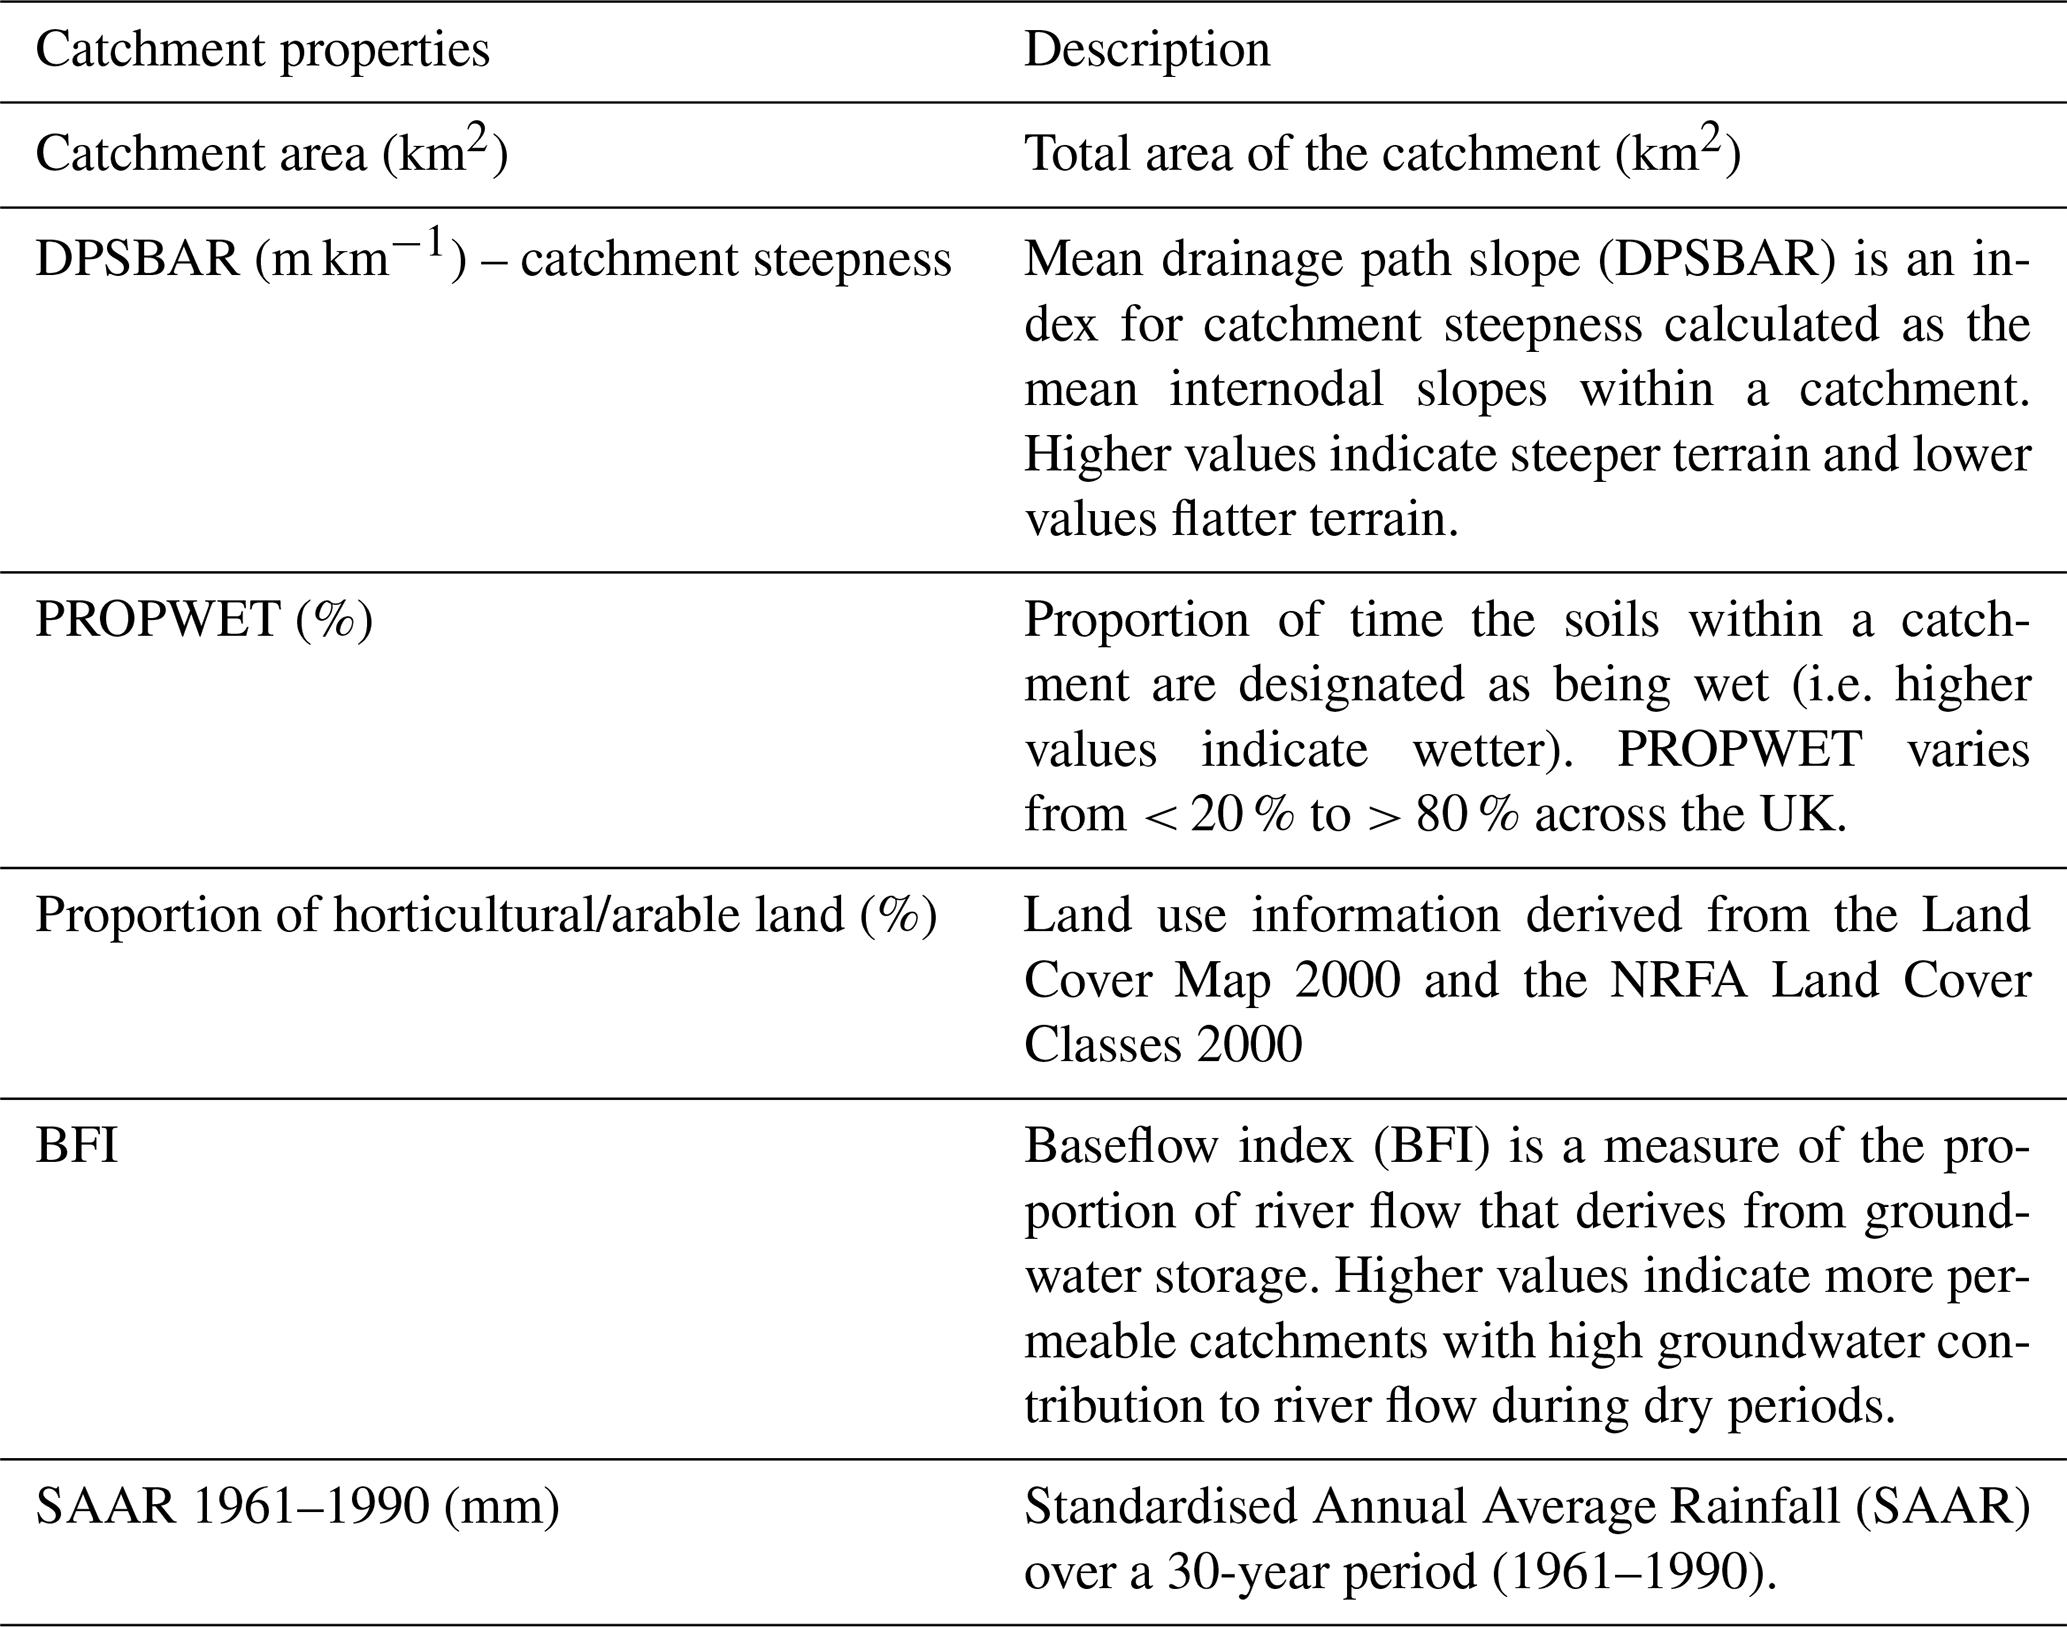
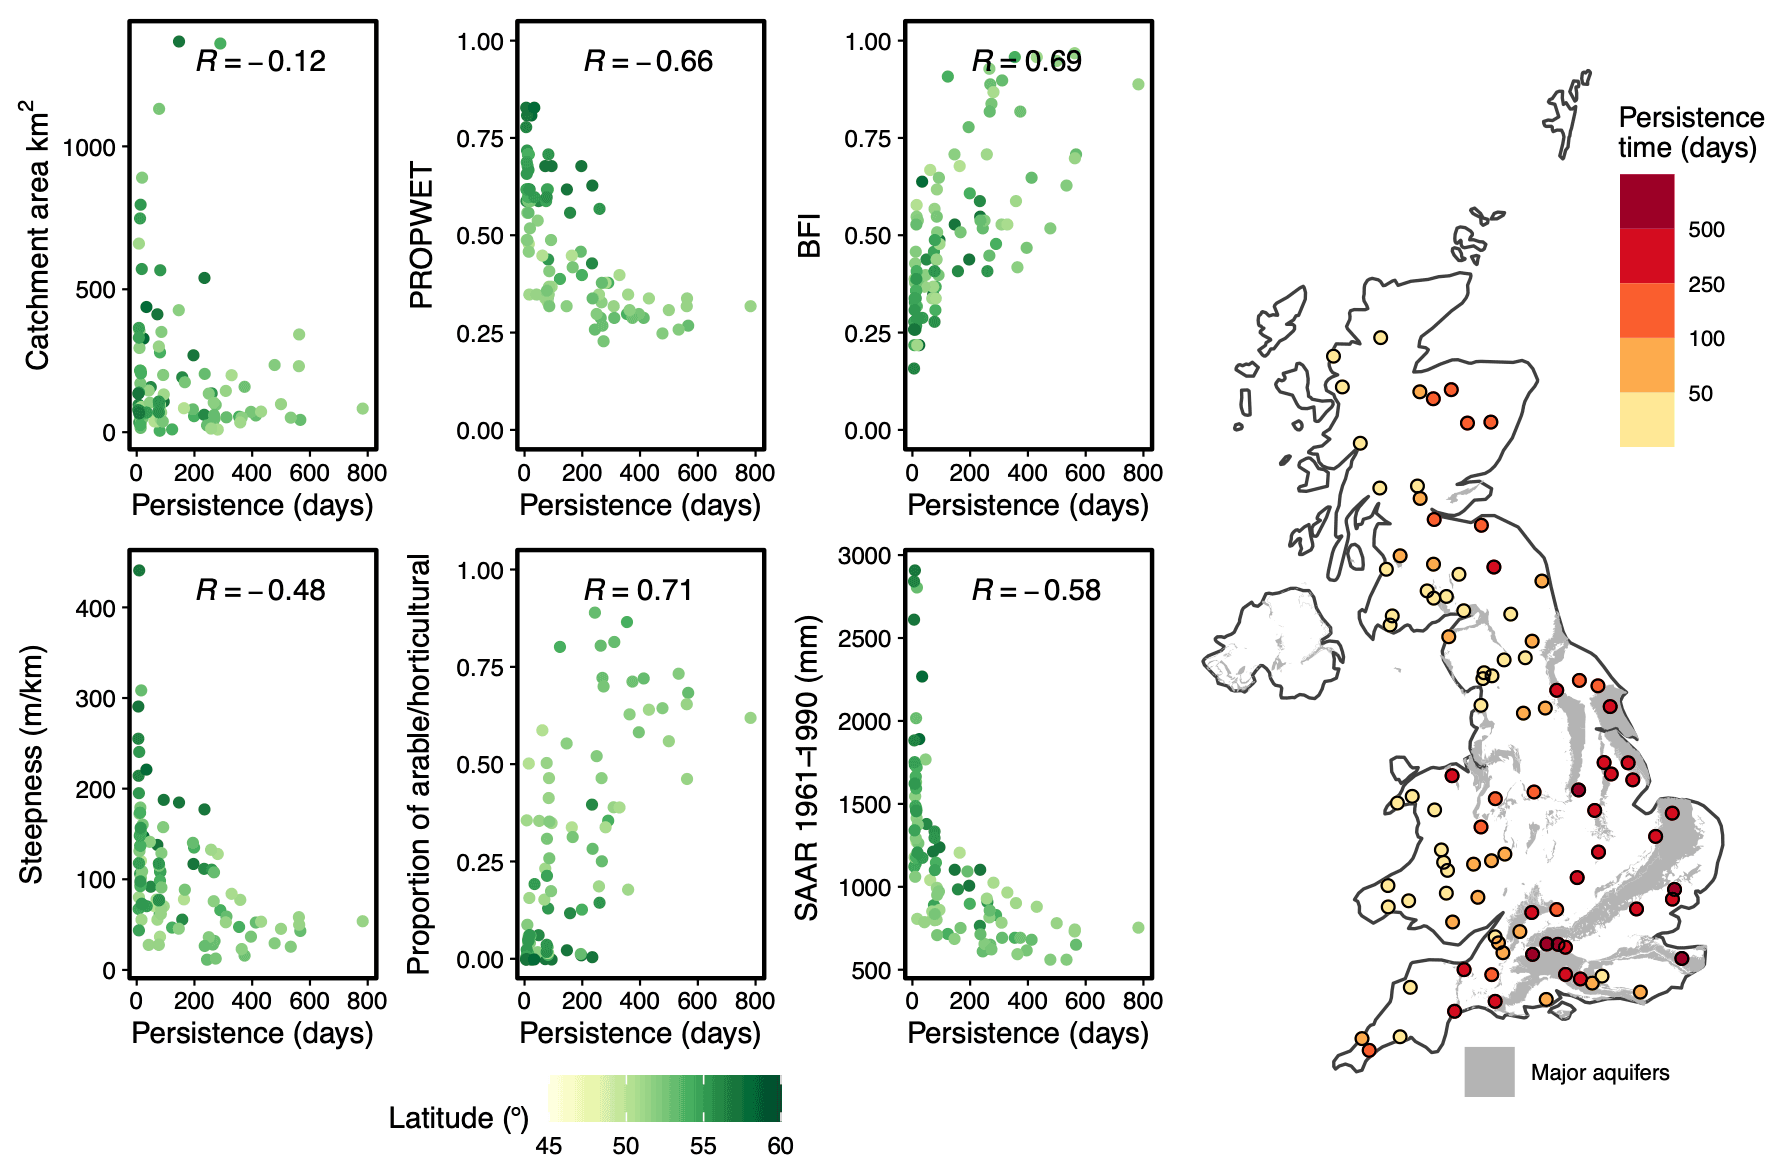
Figure 7(a) Relationship between the persistence time (d) of the 6-month precondition storyline (100-year return period) with selected catchment characteristics. (b) Spatial variation in persistence time for the selected catchments.
3.4 Storylines of temporal sequence
Altering the temporal drought sequence illustrates how much worse the 2010–2012 drought could have been, given another dry year with dry winter conditions (Fig. 8). The drought defined by SSI-6 is estimated to worsen for the dry year before the storyline for all clusters, except for the mean drought deficit for Cluster 4. This anomaly for Cluster 4 can be explained by an increase in drought duration that is greater than the increase in accumulated deficit and maximum intensity. For this storyline, changes in drought characteristics are the greatest for Clusters 1 and 3, with a larger increase with longer accumulation periods. This indicates that the addition of a dry year prior to the observed event increases the risk of abrupt and intense drought conditions in these catchments. Changes in drought conditions are significant enough that they are noticeable at longer accumulation periods, despite the relatively fast precondition persistence times for catchments in these clusters. Conversely, the change in drought conditions for catchments in Clusters 4 and 5 is notable only at longer accumulation periods. The larger change for SSI-24 is particularly important for Clusters 4 and 5, as long accumulation periods are often used to assess drought impacts at these slow-responding catchments with significant catchment storage.
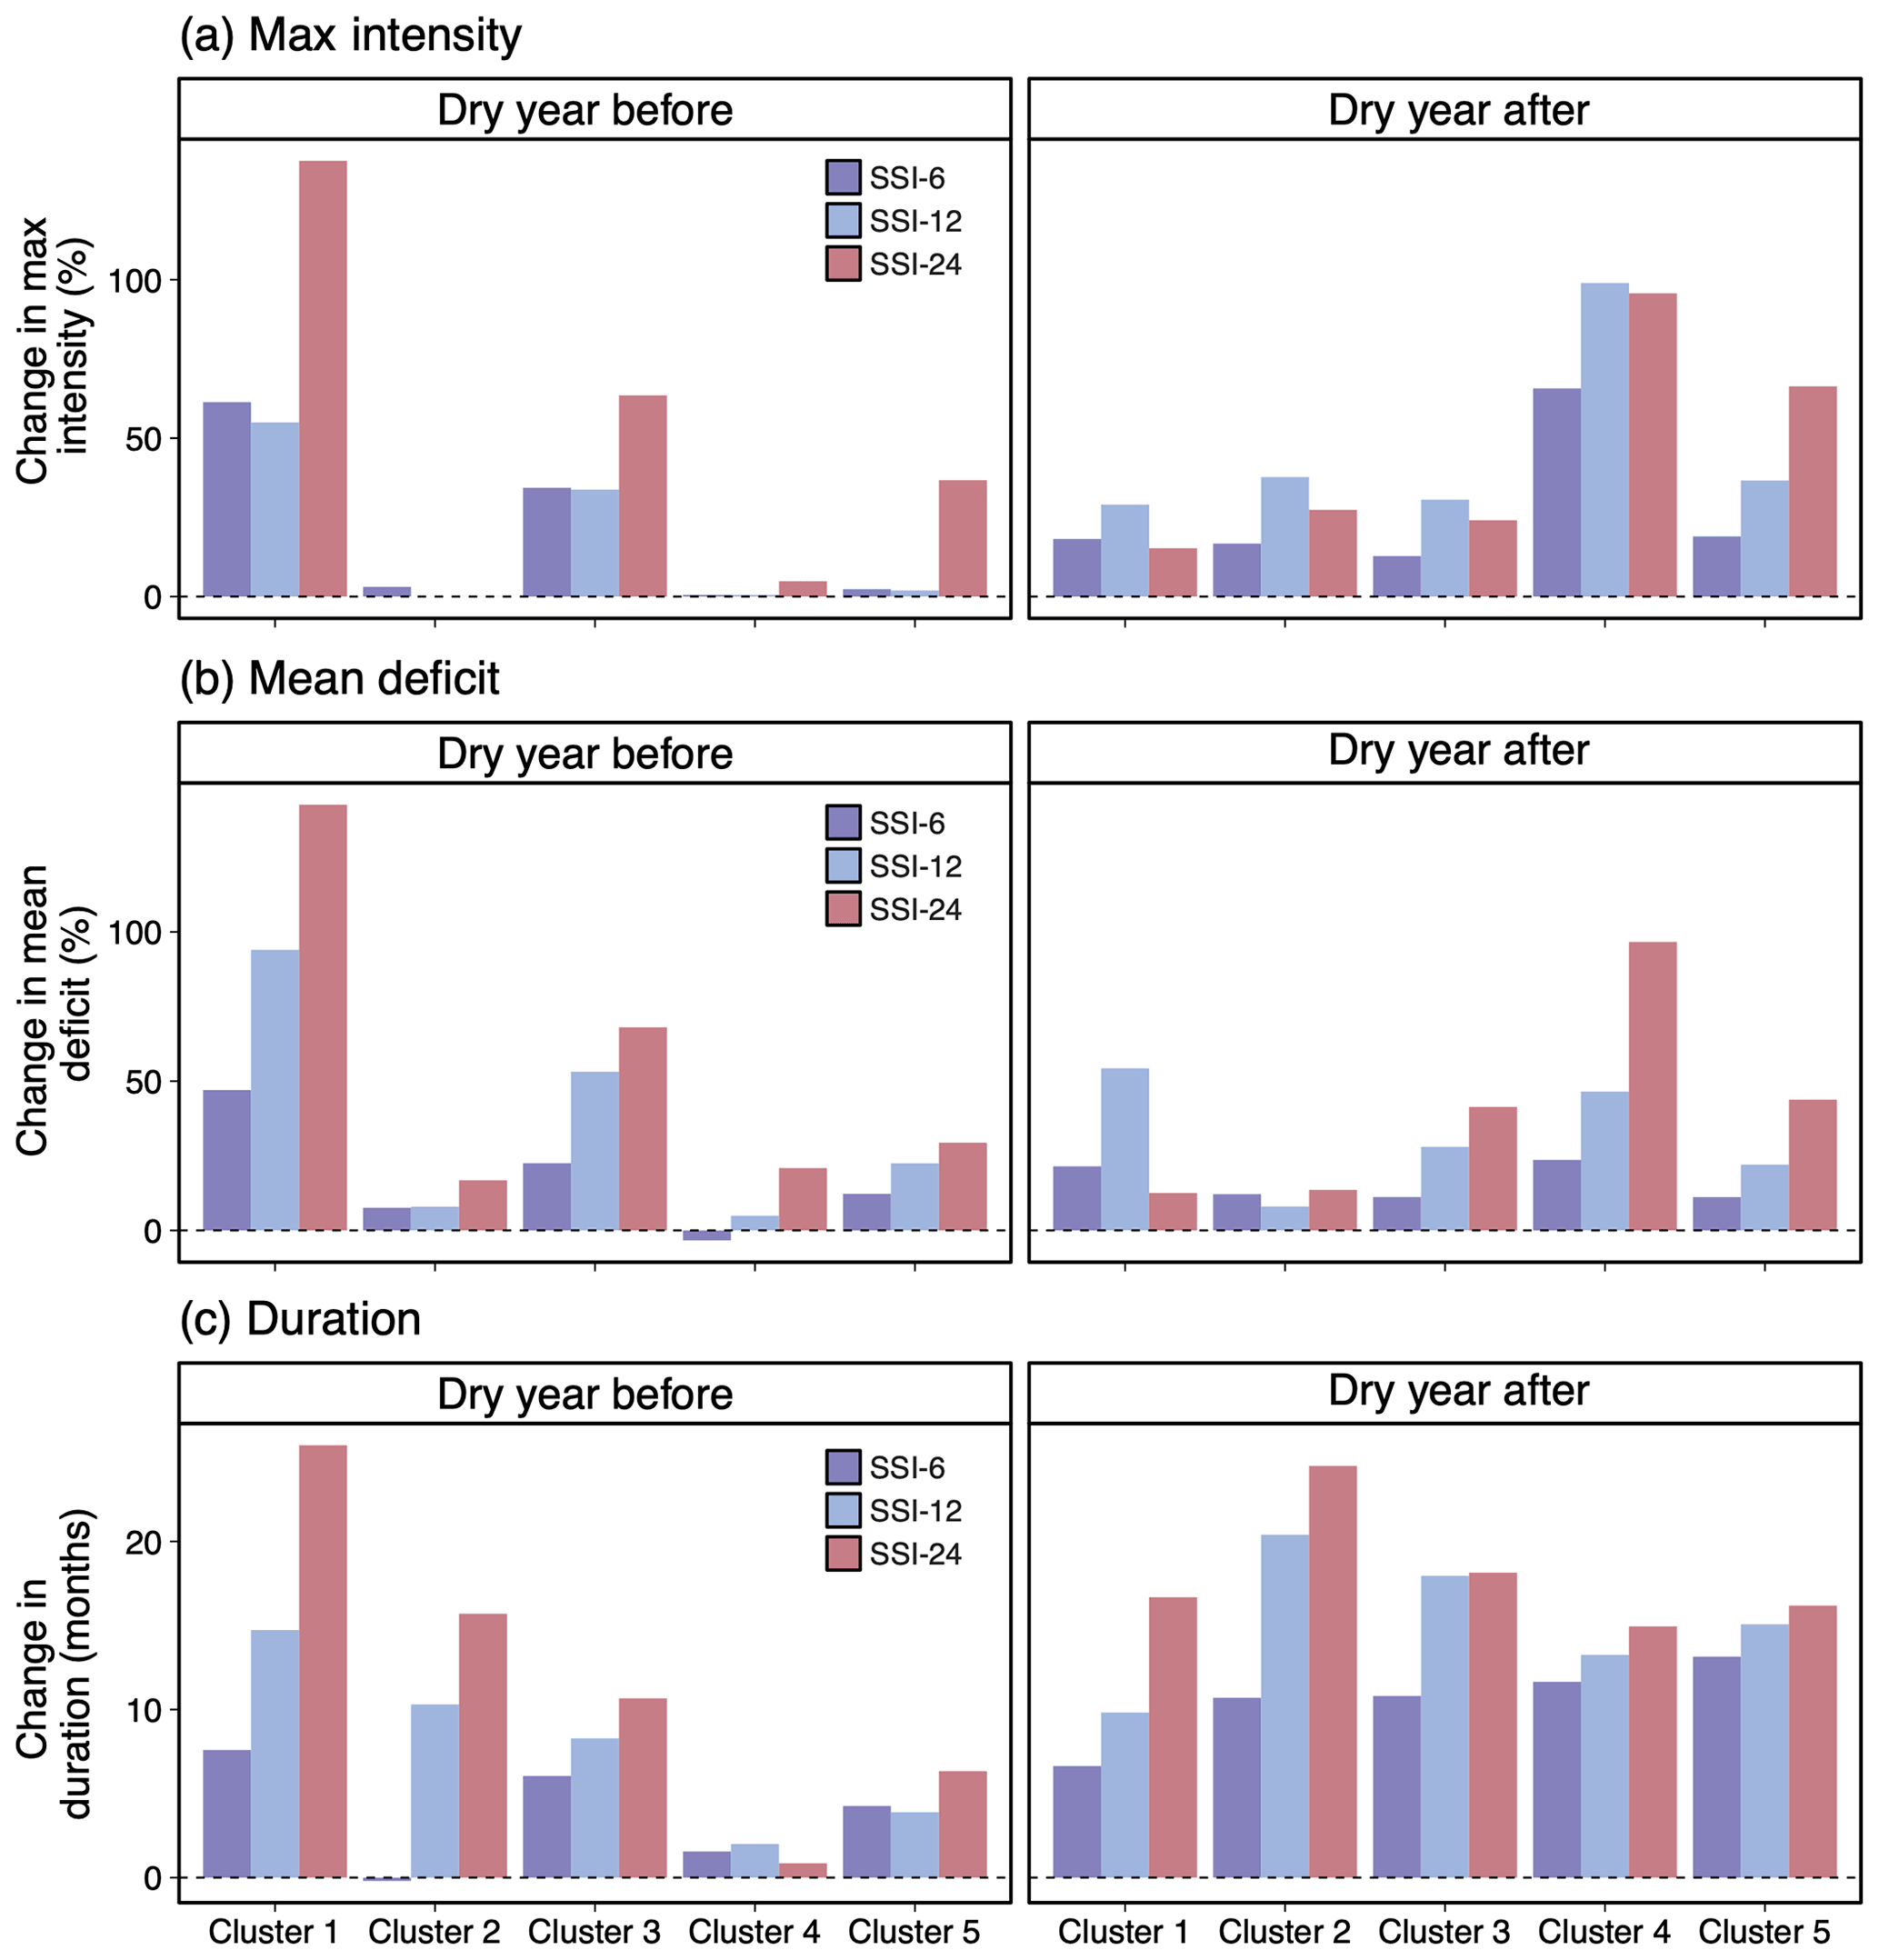
Figure 8Mean change in the (a) max drought intensity (%), (b) mean drought deficit (%), and (c) duration (months) relative to the baseline for each cluster for the repetition of a dry year (2010) either before (left) and after (right) the 2010–2012 drought.
Compared to the dry year before storyline, the dry year after the storyline has a greater effect in the worst affected catchments in southern England. Without the dramatic drought termination in 2012, drought duration would have increased significantly for catchments in all clusters. The max intensity and mean deficit are estimated to increase for all clusters, with larger increases for Clusters 4 and 5 at all accumulation periods. This suggests that there is still considerable scope for worse drought conditions to develop if dry conditions persisted, as has been expected. The change in max intensity is greatest for SSI-12 for all clusters, except Cluster 5, while the magnitude of change in mean deficit increases with accumulation period and is greatest (smallest) for SSI-24 for Clusters 3–5 (Clusters 1–2). This indicates the importance of assessing drought conditions at multiple accumulation periods and highlights the importance of catchment and water resource memory. At Clusters 1-2, SSI-6 and SSI-12 are useful for capturing changes in drought conditions from the storylines, but, for Clusters 3–5, SSI-12 or longer are needed to fully assess the drought response.
Individual catchment response to an additional dry winter again can be grouped by categories based on catchment response time (Fig. 9). First are the fast-responding catchments (e.g. 81002 – Cluster 1; 7001 – Cluster 2) that recover from both the dry year before and dry year after storylines quickly, with changes observable only for the perturbed year. Second are slow-responding catchments (e.g. 38 026 and 42 008 – Cluster 4), where the streamflow response from the dry year before storyline persists across 2010 but not significantly beyond 2011. Third are slow-responding catchments (e.g. 43 014 and 39 019 – Cluster 5), where the streamflow response to the dry year before the storyline persists across 2010 and beyond into 2011. The dry year after storyline also shows that, even with continued dry conditions, the meteorological conditions over 2013 would still have been wet enough to allow the most affected catchments to exit drought conditions.

Figure 9Baseline (black) and simulated SSI-6 for a repetition of a dry year before (red) or after (blue) the 2010–2012 drought for nine example catchments spanning the five hydrograph clusters. The shaded region indicates the duration of the baseline 2010–2012 drought event (January 2010 to March 2012). See Fig. S11 for the locations of the nine example catchments. See Figs. S8 and S9 for the SSI-12 and SSI-24.3.5 storylines of climate change.
In summary, the impacts of the dry year before and dry year after storylines vary spatially. The impacts of the dry year before storyline are particularly severe for catchments in Clusters 1 and 3, although impacts remain apparent when considering catchment memory for Cluster 5. The impacts of the dry year after storyline are particularly severe for Clusters 4 and 5, highlighting the role of catchment storage in slow drought propagation.
The UKCP18 regional projections were used to place the 2010–2012 drought under future warming. The projections point towards, in general, wetter winters and drier summers with increasing temperature (Fig. 10). This climate-change-induced change in the seasonality of precipitation is particularly noticeable at 3 and 4 ∘C warming, with general agreement among the 12 regional projections over the sign of change. Projections also point to increased seasonality in temperature, with the greatest change in temperature in the summer, reaching 6 ∘C higher relative to 1981–2010 in the summer in a 4 ∘C warmer world. Change in annual mean precipitation for each of the catchment clusters across the projections are presented in Fig. S10.
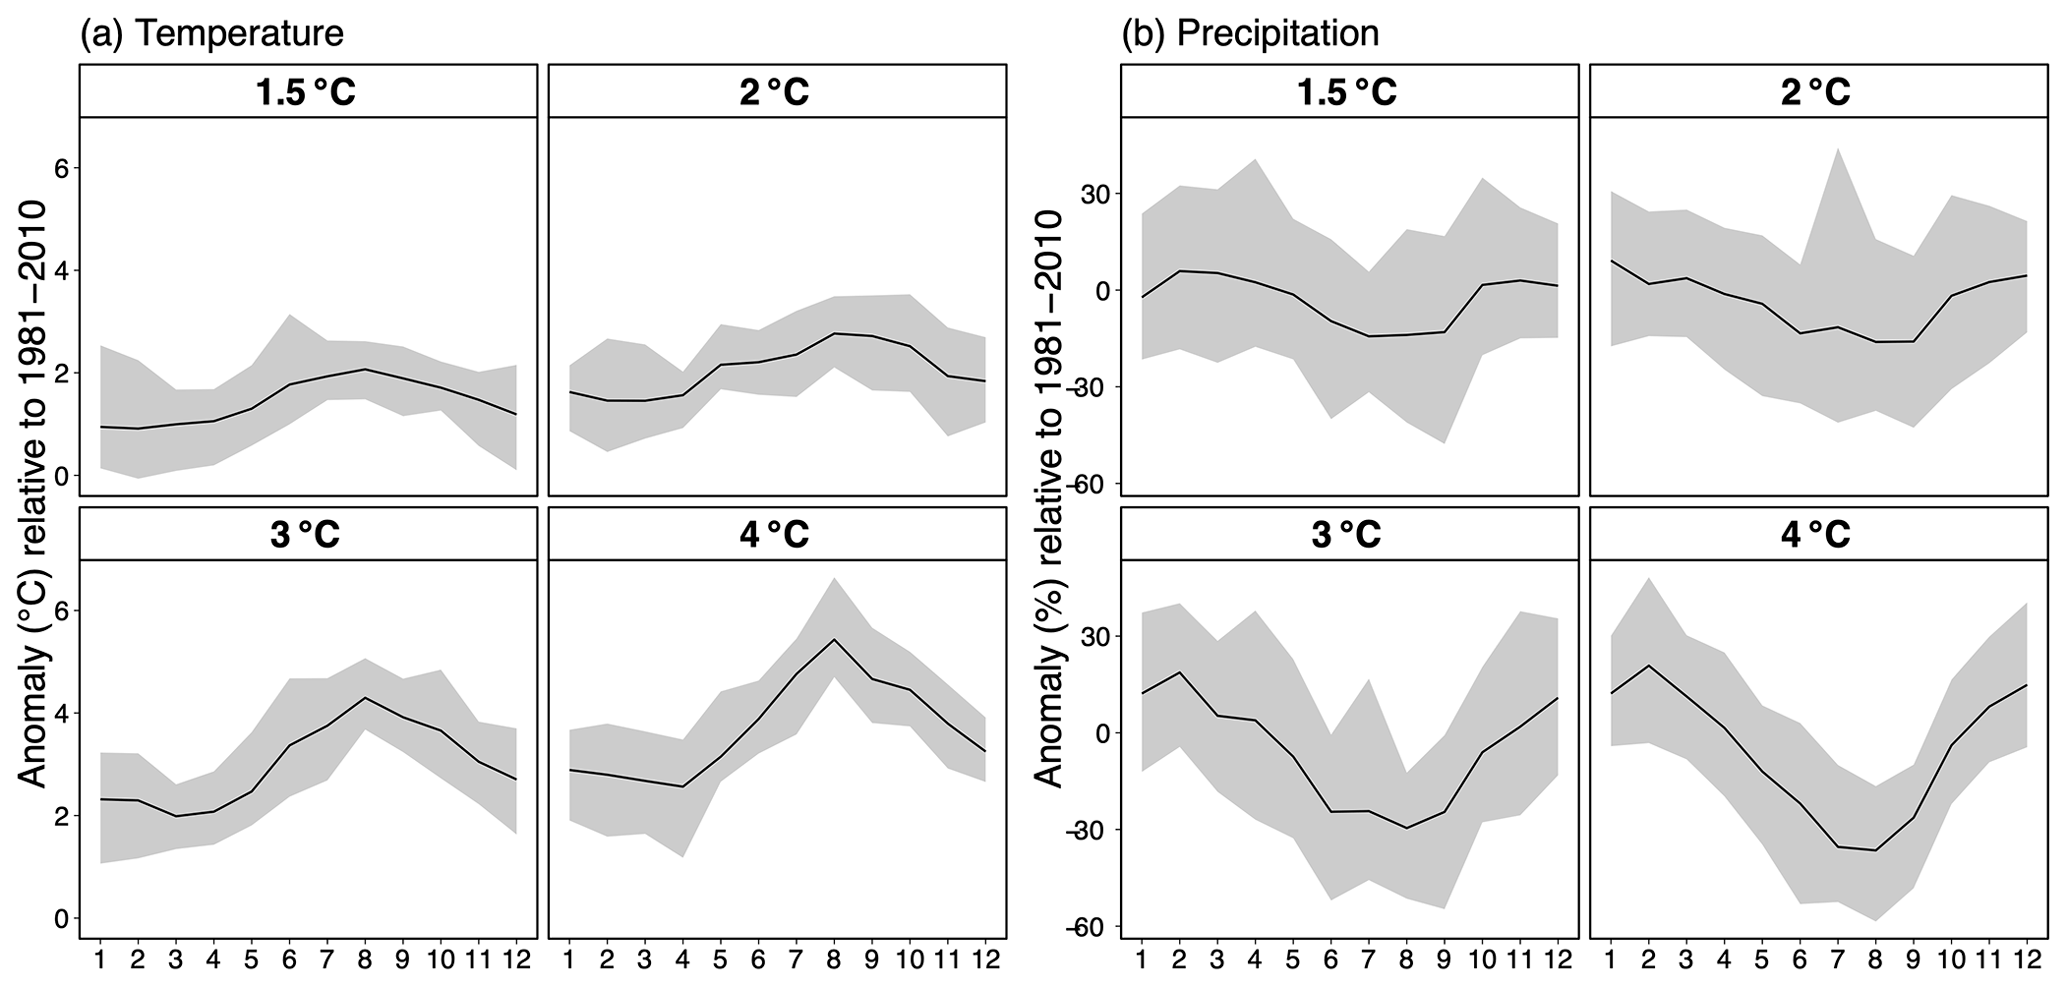
Figure 10Projected percentage change in monthly average (a) temperature and (b) precipitation relative to 1981–2010 from the UKCP18 regional projections at four warming levels averaged across the selected catchments. The shaded region represents the maximum and minimum range of the projected change amongst the 12 regional projections. The solid black line is the ensemble mean.
Under climate change, river flow across the 2010–2012 drought is projected to decrease for most catchments (Fig. S11). In fast-responding catchments (Clusters 1 and 2), winter river flows increase due to the projected increase in winter precipitation. In these catchments, the buffer effects of wetter winters compensate for increased evaporative demand from increased temperature. Mean discharge across the drought event for catchments in southern England and Wales is projected to decline substantially, with larger declines at higher warming levels. River flow is projected to decrease in all seasons, for even a 1.5 ∘C rise in temperature, with increasingly drier conditions at high warming levels, particularly for slow-responding catchments (Clusters 4 and 5). In these catchments, river flow is also projected to decrease progressively over the event timescale.
Given the observed drought sequence, the conditions of the 2010–2012 drought are projected to worsen with global warming (Fig. 11). The change in drought characteristics for the initial temperature rise (1.5 and 2 ∘C) is greater for Clusters 3–5 compared to Clusters 1 and 2. Beyond 2 ∘C, drought characteristics are projected to worsen by a similar magnitude for all clusters and at longer accumulation periods, except Cluster 1. For SSI-12 and SSI-24, the magnitude of change in drought characteristics is larger compared to shorter accumulation periods for all clusters, except Cluster 1. Although drought characteristics are projected to increase with the temperature rise for Cluster 1, the increase in drought duration at 4 ∘C is smaller compared to lower warming levels, indicating more severe drought conditions despite a smaller increase in drought duration. At longer accumulation periods, the projected change for Cluster 1 also does not follow the progressive increase with the warming levels seen in SSI-6. This reflects the fast response times and limited catchment memory for the catchments in Cluster 1, where drought conditions are better captured using short accumulation periods. The anomalous behaviour from Cluster 1 could be attributed to wetter winters for northwestern Scotland, especially at high warming levels, which provide wet interludes and mitigate drought conditions.
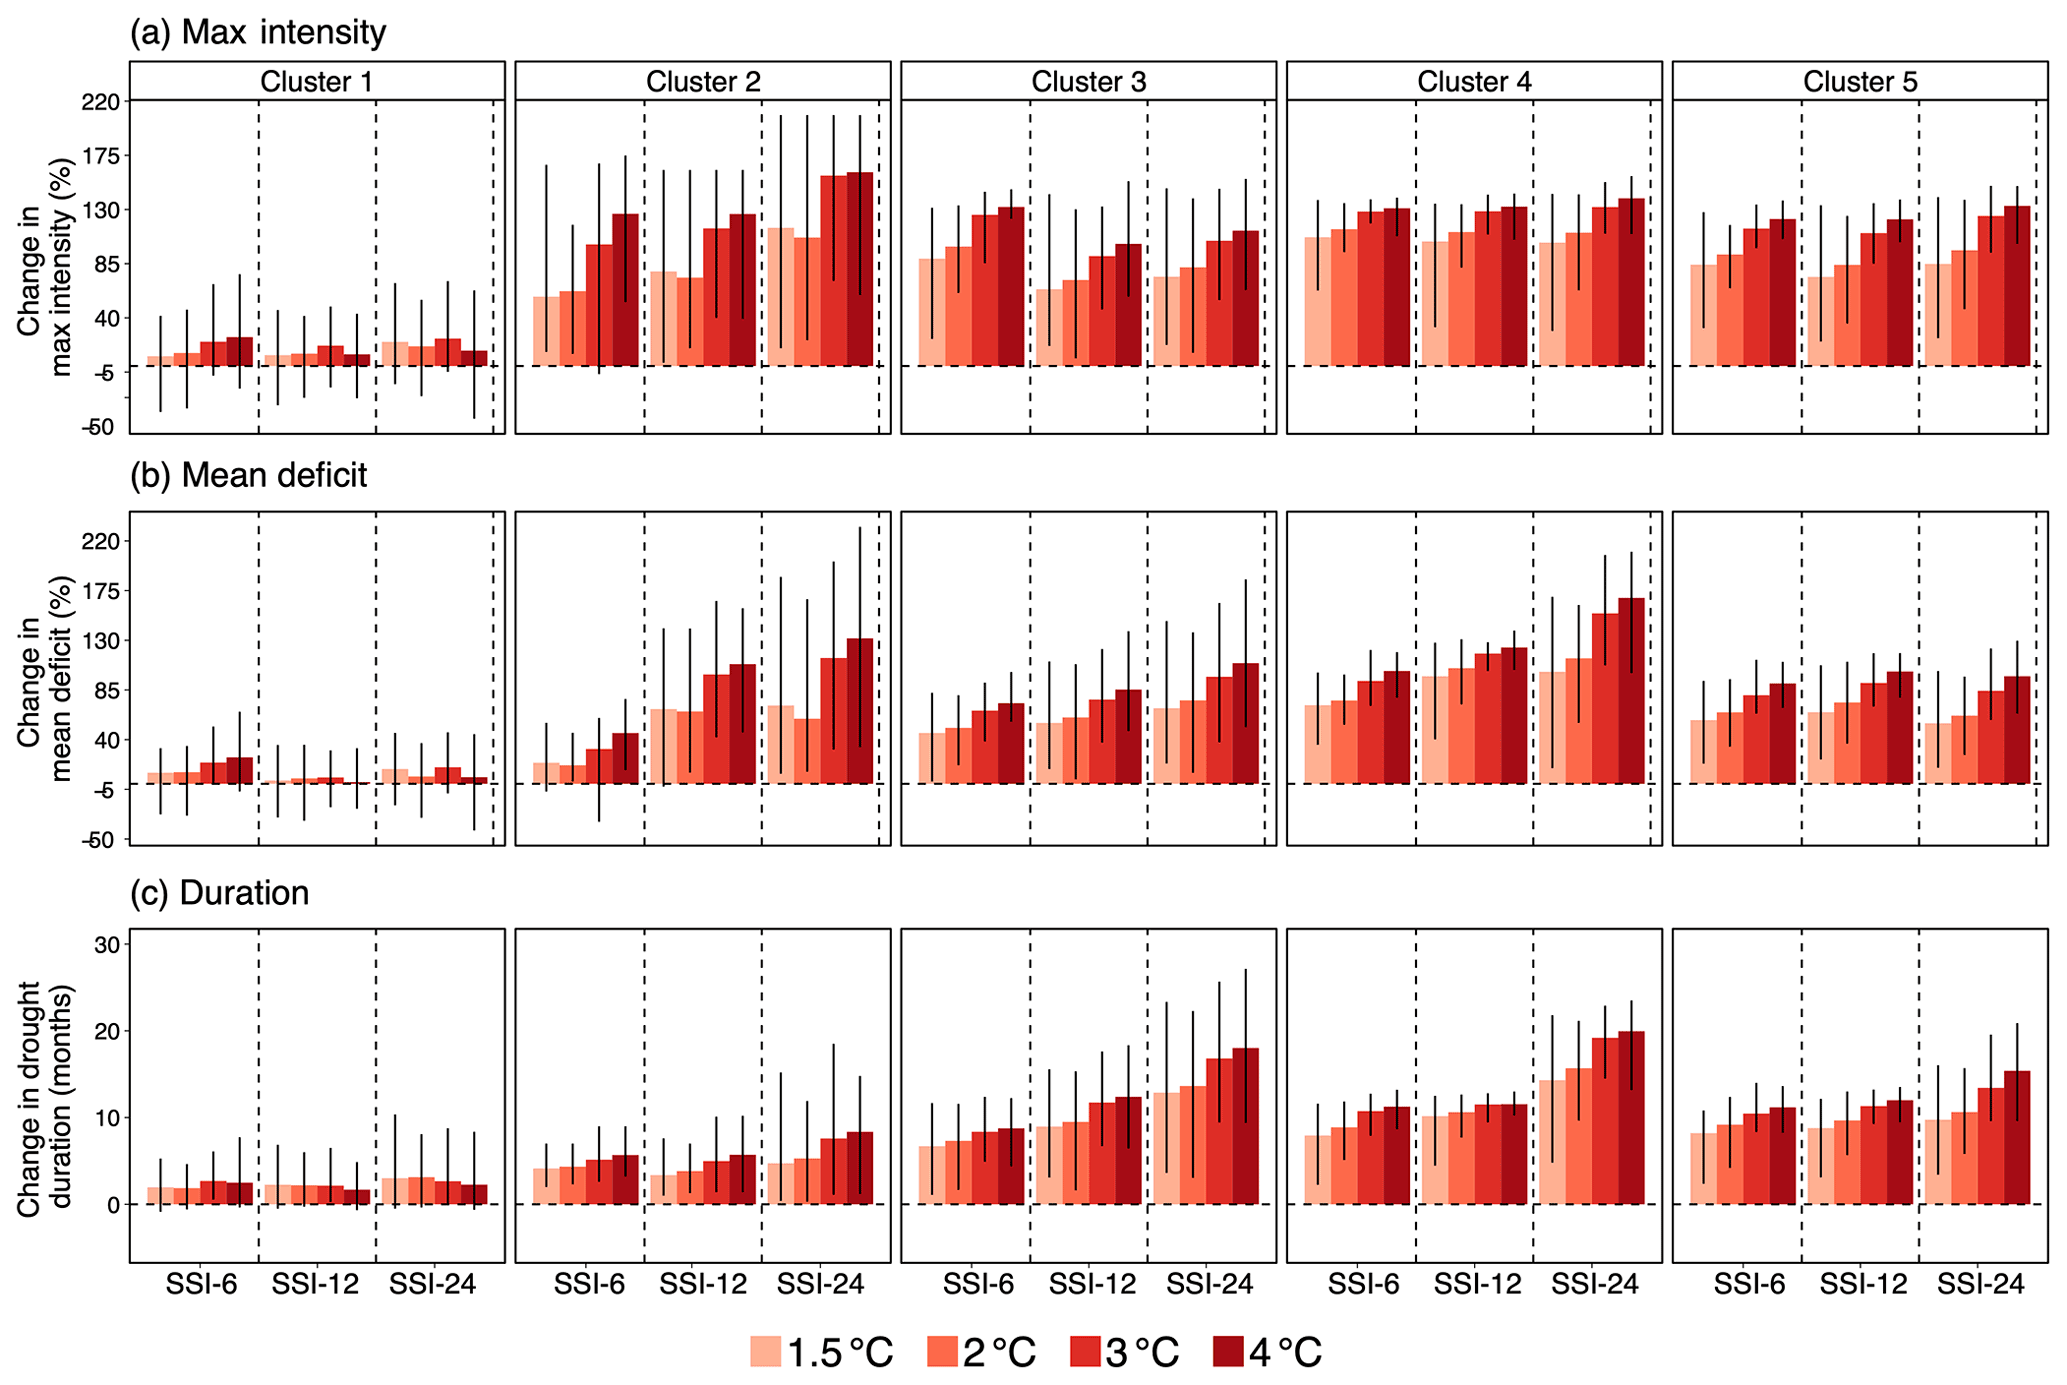
Figure 11Mean change across the 12 UKCP18 regional projections in (a) max drought intensity (%), (b) mean drought deficit (%), and (c) drought duration (months) for the 2010–2012 drought across four warming levels for each cluster and SSI accumulation period. The error bar indicates spread across the 12 regional projections.
3.5 Comparison between storylines
To place the storylines in historical context, we compare the storylines with the benchmark 1975–1976 drought and the more protracted 1989–1993 drought. Both droughts rank among the most severe since the 1970s (Marsh et al., 2007). Based on the characterisation of severe droughts in the same set of catchments by Barker et al. (2019), the 1975–1976 drought was the most severe in terms of maximum intensity and mean deficit across northeastern Scotland and southern England (corresponding to Clusters 2 and 5), while the 1989–1993 drought was most severe for catchments in eastern England (corresponding to Cluster 4). At total of four storylines are selected to compare with past droughts, namely (1) driest preconditions, (2) dry year before, (3) dry year after, and (4) 2 ∘C warming. Figure 12 shows percentage change in max intensity and mean deficit of the four storylines relative to the two past droughts.
First, for the 1975–1976 event, drought conditions calculated using SSI-6 are, in general, less severe across all storylines. Cluster 1 is the exception, where drought conditions match the 1975–1976 drought for the dry year before and driest precondition storylines. When considering longer timescales using SSI-24, the drought conditions of the four selected storylines exceed those of the 1975–1976 drought for Clusters 3–5. The 2 ∘C warming storyline (and warming levels beyond that) results in the largest increase out of the selected storylines. For Clusters 1 and 2, drought conditions calculated using SSI-12 and 24 are less severe than the 1975–1976 drought and less severe than SSI-6. The dry year before storyline for Cluster 1 is the exception, where drought conditions exceed that of the 1975–1976 drought for SSI-24 even though catchments in this cluster are fast responding.
Second, conditions across the four selected storylines are estimated to be more severe than the 1989–1993 drought, apart from Cluster 4. Catchments in Cluster 4 were the most affected during the observed 1989–1993 drought, and only storylines with the more extreme changes could have matched or exceeded observed conditions (i.e. driest preconditions and 2 ∘C and beyond). Out of the four storylines, a 2 ∘C warming is estimated to result in the largest deviation from the 1989–1993 drought for Clusters 3–5. The 2 ∘C warming storyline is less severe for Clusters 1 and 2, where, respectively, the dry year before and the driest preconditions instead result in greater deviations from the 1989–1993 drought. For all selected storylines, the magnitude of change relative to the 1989–1993 drought increases with accumulation period and is greatest for SSI-24 for Clusters 3 and 5, indicating the importance of catchment memory.
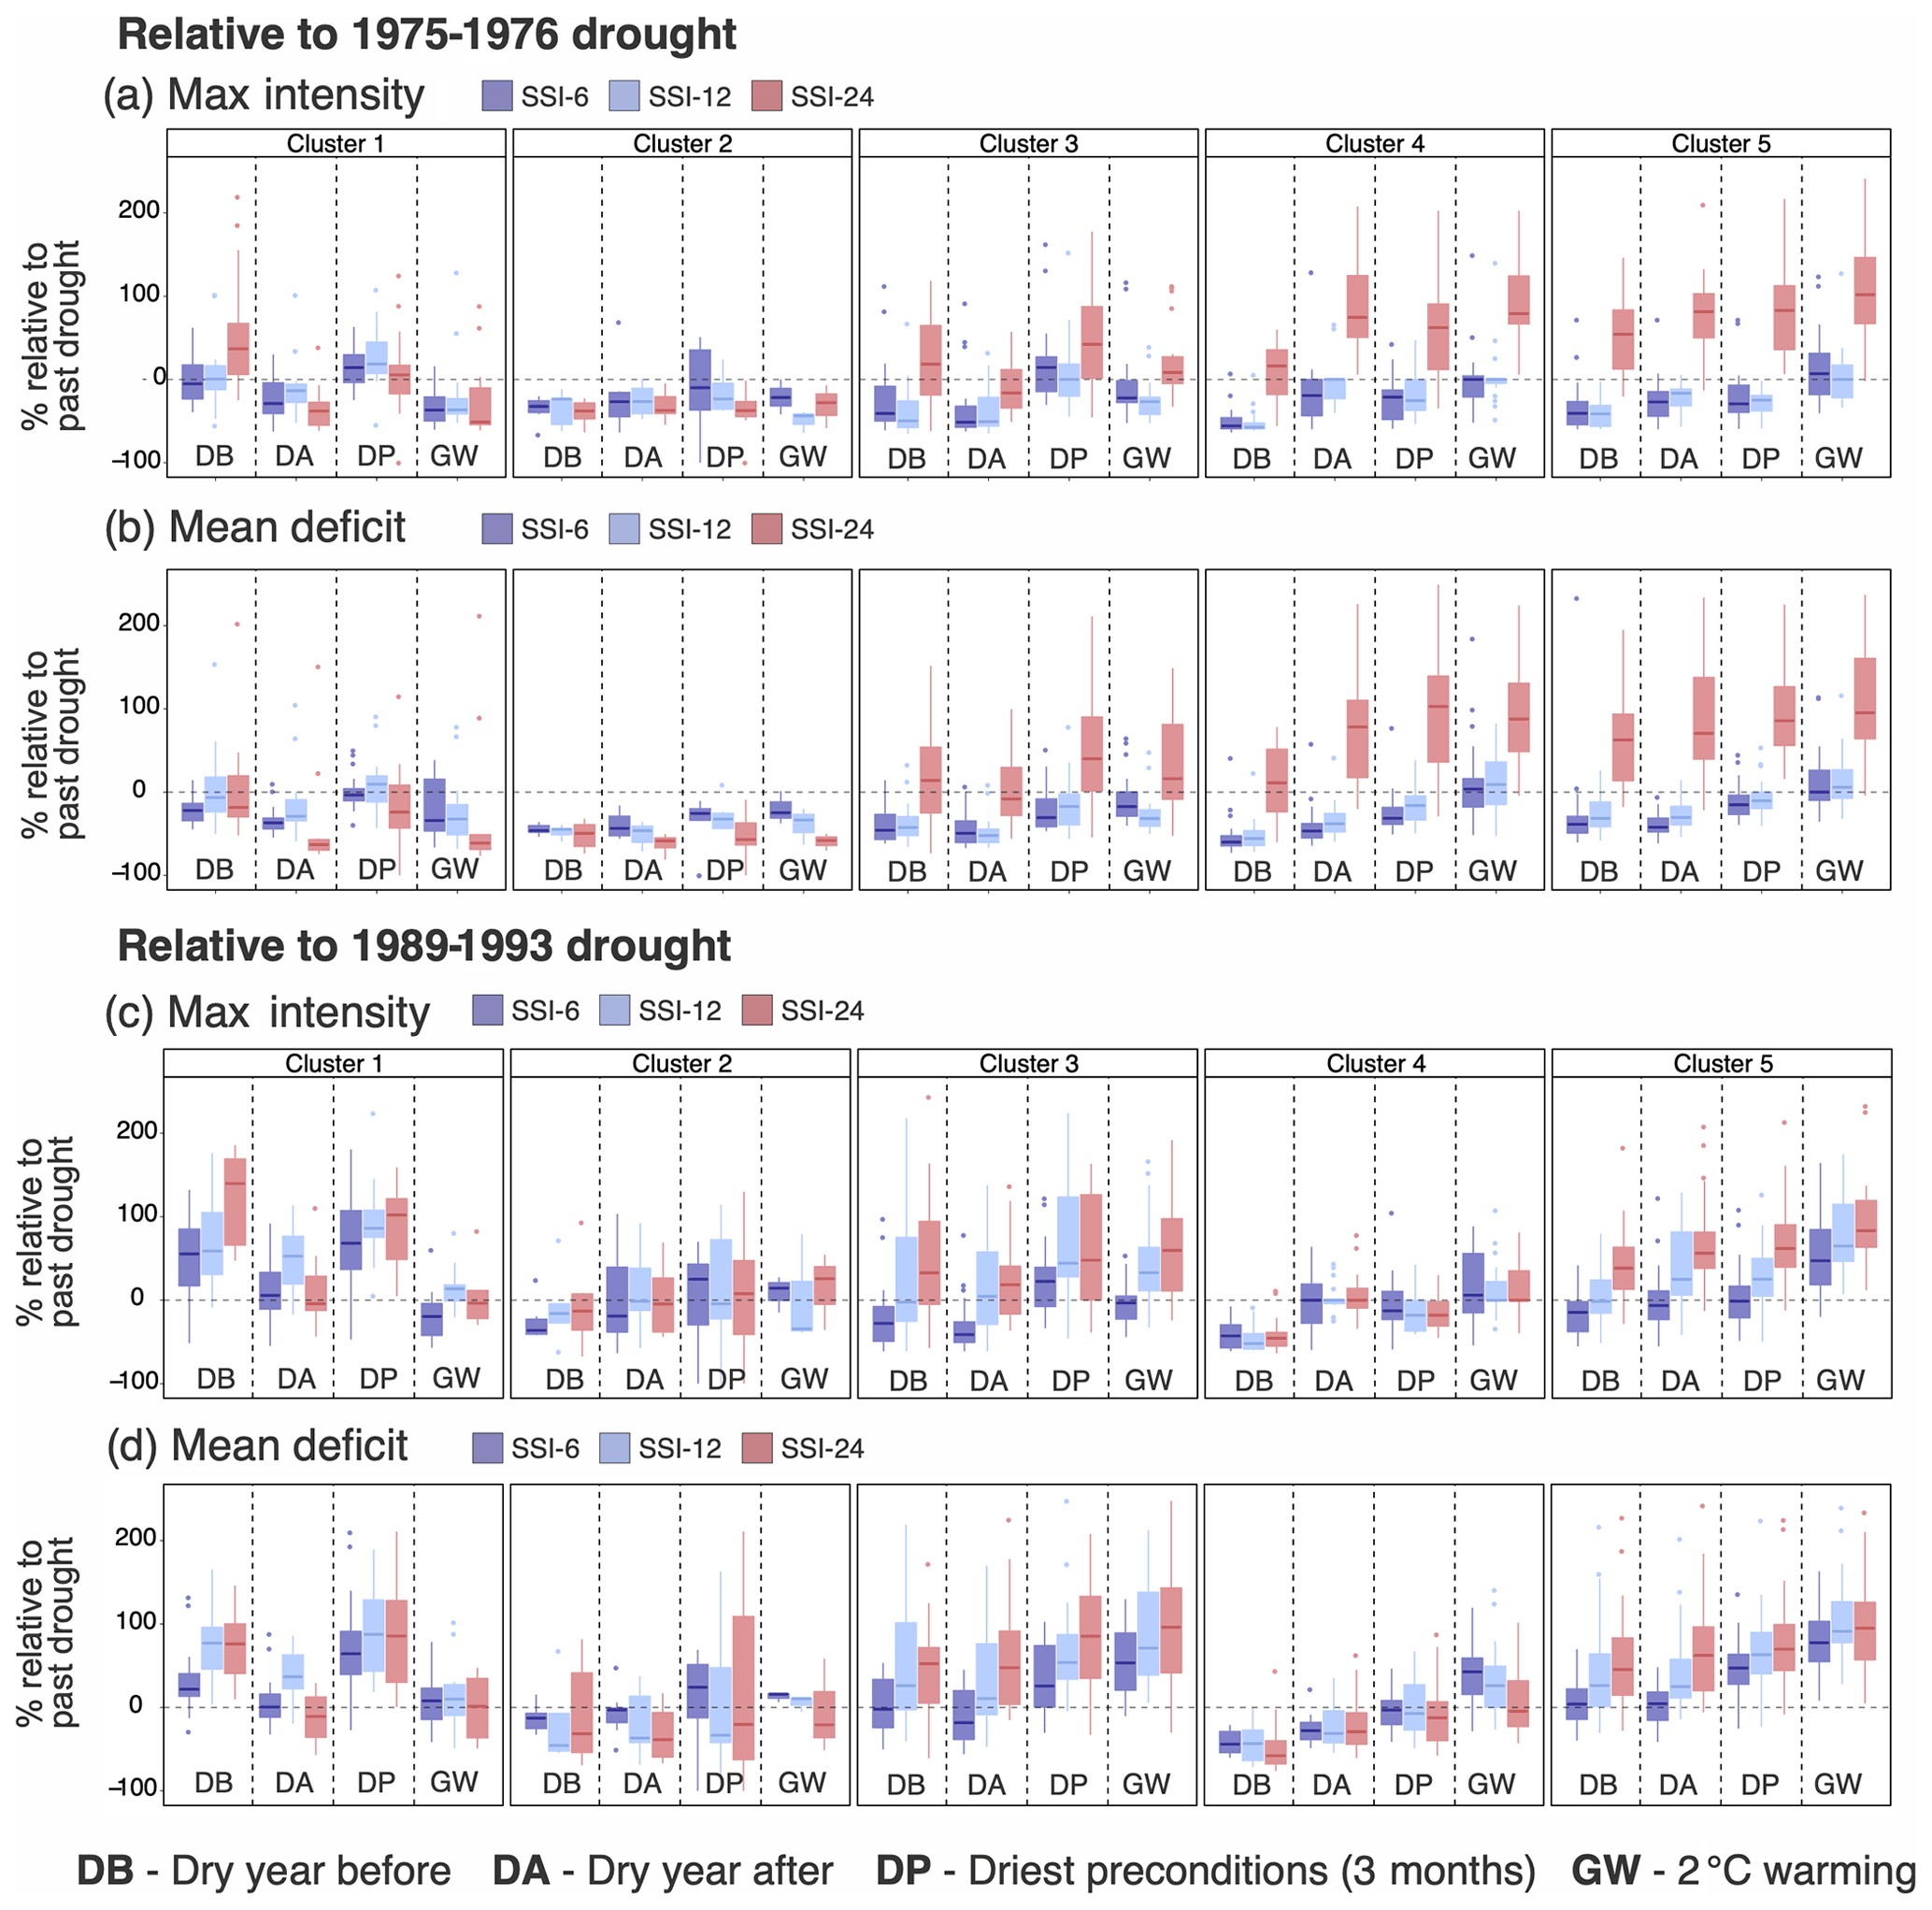
Figure 12Percentage difference in max intensity (a, c) and mean deficit (b, d) calculated from SSI-6, SSI-12, and SSI-24 of the selected storylines relative to the 1976–1976 drought (top) and the 1989–1993 drought (bottom). Drought characteristics of the past droughts are calculated from simulated river flow, using the same input data for the baseline simulation as detailed in Sect. 2.
In summary, the four storylines are all capable of leading to more severe drought conditions for all clusters compared with the two past droughts. Conditions across the storylines are estimated to match the 1975–1976 drought, with comparatively more severe conditions for southern catchments at longer accumulation periods. Conditions are estimated to exceed the 1989–1993 drought for all clusters, apart from Cluster 4, which was the most affected in the observed event. Drought conditions decrease (increase) in severity with longer SSI accumulation periods for Clusters 1–2 (Clusters 3–5).
4.1 Hydrological drought risk
Drought characteristics of the 2010–2012 drought support the northwestern/southeastern gradient for UK drought susceptibility (Barker et al., 2016; Tanguy et al., 2021). The five clusters correspond well with clusters in Barker et al. (2016), with less permeable upland catchments and southeastern catchments with higher storage. This study distinguishes an additional cluster between catchments in southeastern and central England. The storylines of precondition severity confirm the importance of persistence time, which differs spatially according to hydrogeology. This relationship was also found in German and Swiss catchments by Stoelzle et al. (2014) and Staudinger et al. (2015), where generally flatter catchments at lower elevations with the presence of porous aquifers also have longer response times after being subjected to perturbations in initial conditions. The spatial variation in precondition persistence time (and, hence, catchment properties) confirms the importance of preconditions in determining the eventual timing and severity of the 2010–2012 drought, with variation between fast-responding northern and slow-responding southern catchments. Laaha et al. (2017) similarly concluded that preconditions of the preceding seasons of the 2003 and 2015 summer droughts played a crucial role in controlling the event's temporal and spatial dynamics. As the precondition persistence time only characterises the influence of perturbations in the event's initial conditions, it is not indicative of a full recovery from drought to non-drought conditions. Full drought recovery is a complex, longer-term process that would require additional analyses of drought termination metrics such as those proposed in Parry et al. (2016).
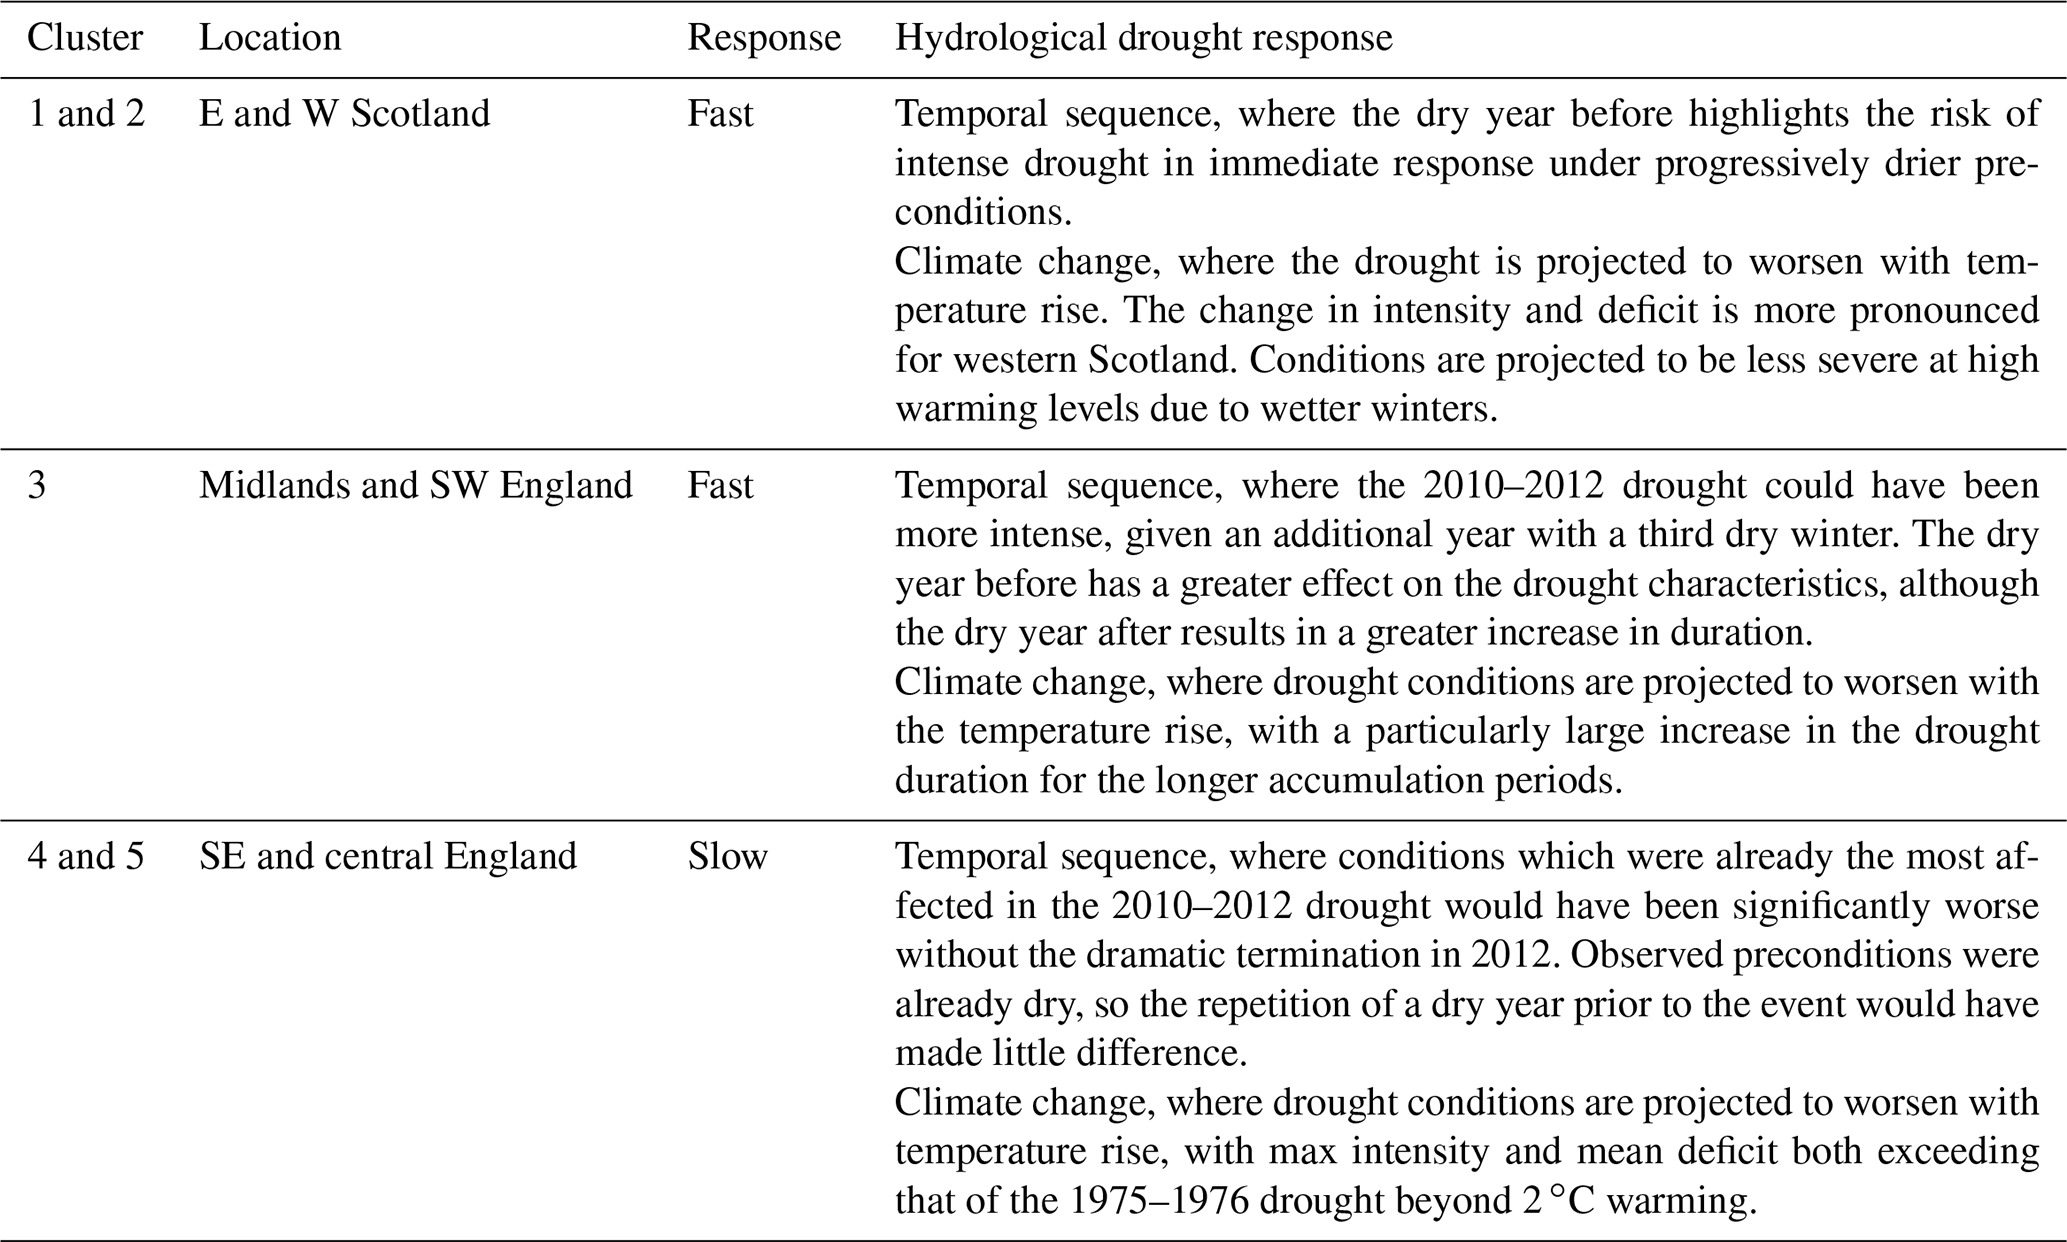
Table 4 summarises hydrological drought response for the storylines of temporal sequence and climate change. Placing the various storylines in context with a relatively short-term severe drought (1975–1976) and a protracted multi-year drought (1989–1993) suggests how selected storylines could have resulted in more severe drought conditions than the two past droughts. Conditions for all storylines could have exceeded those of both the 1975–1976 and 1989–1993 droughts, even in catchments that were most severely affected in the observed droughts, particularly when at long accumulation periods. Comparison with the 1975–1976 drought is consistent with findings in Burke et al. (2010), which placed future ensemble projections in the context of the 1975–1976 drought and concluded that the likelihood of future droughts with similar characteristics to the 1975–1976 drought can be reached once every 10 years, depending on the ensemble member considered. It is interesting to consider the differences between UKCP18 and UKCP09 or CMIP5. In comparison, UKCP18, under Representative Concentration Pathway 8.5 (RCP8.5), projects a slightly larger reduction in summer and autumn precipitation and greater summer warming (Lowe et al., 2018). Precipitation is also projected to increase by a smaller magnitude in the winter compared to UKCP09. The regional projections used can be considered as worst-case scenarios that lie at the upper end of the full probabilistic projections and track the warmer end of the full range of outcomes from CMIP5 (Arnell et al., 2021). Compared to other projections, the smaller increase in autumn precipitation projected by UKCP18 may point to the increased frequency of multi-year droughts as drier conditions develop before winter and are thus more susceptible to the drought development during dry winters.
Table 4Summary of drought response for fast- and slow-responding catchments in the storylines of temporal sequence and climate change.
4.2 Value of the storyline approach
Following the UK Water Act 2014, water companies are required to consider water supply reliability under plausible worst-case droughts (Environment Agency, 2015a). One method is to reconstruct historic river flows to identify the spatial and hydrological characteristics of key historic droughts (Barker et al., 2019). A main drawback relates to hydrological model uncertainty and non-stationarity due to climate and land use change (Spraggs et al., 2015; Barker et al., 2019). An alternative method is to resample observations (e.g. Environment Agency, 2015b) or generate synthetic drought sequences using stochastic weather generators in a response surface framework describing drought response from incremental changes in certain statistical characteristics (e.g. Environment Agency, 2013). However, challenges remain in verifying the plausibility of synthetic droughts, as they do not stem from actual drought events. Additionally, weather generators have predominantly been used as tools to statistically downscale GCM projections for use in hydrological models, and their use is associated with uncertainty related to multi-site generation, the choice of statistical model, and selection of evaluation/verification methods (Maraun et al., 2010). The storyline approach represents a new research avenue to understand the impacts of unrealised droughts and consider specific stakeholder concerns on how catchments may respond in a given situation. Storylines of UK droughts aim to address outstanding research gaps in existing approaches to study past and future hydrological extremes by placing greater emphasis on the pathways and impacts of plausible events and place traditional top-down projections in a wider decision-relevant framework (Chan et al., 2022). The latest regulator guidance indicates a requirement for UK water companies to plan for a higher level of drought resilience (e.g. 1 in 500 years). Although no probability is attached to each storyline, return periods for each event storyline can be estimated and compared to historical events to obtain further information on plausible events of high return periods for which estimates are highly uncertain. Stoelzle et al. (2020) and Hellwig et al. (2021) recently demonstrated a catchment stress test framework, similar to the storylines of precondition severity, to complement traditional climate change projections. The 12-month precipitation deficit of the storylines of precondition severity are comparable to the range considered in the H climate change scenarios for low rainfall and droughts (Wade et al., 2015). Additionally, the range of rainfall deficits considered is also comparable to the increments used in the drought vulnerability response surface framework which forms part of the guidance for water resources planning (Environment Agency, 2015b). Testing management measures against long droughts by stacking multiple observed/reconstructed droughts, Watts et al. (2012) noted that basing their analyses on actual events helped increase realism amongst decision-makers compared to stochastic or weather generator approaches. The storyline approach demonstrated here also builds on recent proposals to increase the focus on the use of event case studies as new lines of evidence to inform risk management (Lloyd and Shepherd, 2020; Sillmann et al., 2021). The in-depth comparative analysis, by Laaha et al. (2017), of the 2003 and 2015 summer droughts demonstrated the potential for new insights to inform water management based on case studies. For example, the three dry winters storylines consider the hypothetical, but plausible, situation which could have seen dry conditions persist. Motivated by similar aims, water companies have previously considered the hypothetical situation of a third dry winter following the 2004–2006 drought (Environment Agency, 2011).
4.3 Limitations and future work
Storylines in this study are based on resampling and perturbing the meteorological time series of the 2010–2012 drought. The main limitation of the delta change method used to place the 2010–2012 drought in a warmer world is that it retains the observed temporal variability in the observed drought. This approach is advantageous given the specific focus on the 2010–2012 drought, and it avoids having to deal with potential climate model biases in the representation of the persistent circulation anomalies that lead to drought. However, the temporal variability and sequencing of weather events may change under climate change, and future changes in variability differ between GCMs and regional climate models (RCMs). The delta method applied to the 2010–2012 drought therefore means that we do not consider ways in which a drought of different nature could unfold in the future and reach impacts similar to or worse than the 2010–2012 drought. Thus, future droughts, where minimum river flow occurs in different seasons (e.g. summer vs. winter) or is driven by compound conditions (e.g multivariate heatwave drought or preconditioned drought from combination of seasonal precipitation deficits; Zscheischler et al., 2020), cannot be assessed using the delta change method alone. By not considering the changes in the likelihood of such an event, the delta change method could therefore under- or overestimate drought impacts from climate change. For example, Wilby and Harris (2006) have previously shown that the direct use of statistically downscaled climate model output can lead to a smaller reduction in low flows and a wider range of projected change compared to the delta change method, although the overall uncertainty is dominated by differences between GCMs. However, given GCM-related uncertainty, and in the absence of confident information on changes in the likelihood of multi-year circulation anomalies, using the delta change method to place a singular event under future warming is a logically sensible approach to take, as it is grounded in Bayesian reasoning (Shepherd, 2021).
Alternative approaches can complement the delta change method by considering natural variability and changes in wet and dry sequences under climate change. For example, weather type analysis (e.g. Richardson et al., 2018) or meteorological analogues (e.g. Cattiaux et al., 2010) can provide a basis for imposing additional plausible changes to the event's drivers, if plausible storylines of such changes could be constructed. Recent studies have created event storylines using atmospheric nudging (e.g. Wehrli et al., 2020; van Garderen et al., 2021) or through searching for analogues resembling observed events (in both drivers and impacts) in large ensemble climate model data. Single model initial condition large ensembles (SMILEs) are well suited for the construction of event storylines, as the larger sample size means a greater likelihood of finding analogue events with similar driving mechanisms to selected observed events (e.g. van der Wiel et al., 2021). Hydrological simulations driven by the output from SMILEs is an area of active research and can be coupled with approaches, such as the UNprecedented Simulation of Extremes with ENsembles (UNSEEN) approach, to investigate unprecedented hydrological extremes not present in the observations (Thompson et al., 2017; Kelder et al., 2020; Brunner and Slater, 2022).
Future work could also relate each storyline with management decisions using water resource system models. This would require the consideration of factors such as water abstractions activities and changes in reservoir yields. This was not done here, as most of the selected catchments are not major catchments contributing to public water supply. Additionally, as an extension to Smith et al. (2019) and Barker et al. (2019), this study employed the same hydrological model and parameter set. To account for hydrological model parameter and structural uncertainty, the use of an ensemble of hydrological models and the full LHS500 parameter sets in Smith et al. (2019) would increase the robustness of the results.
This study extends previous work on historic droughts by applying the same set of hydrological models and river catchments to quantify event storylines of how the 2010–2012 UK drought could hypothetically have unfolded or could unfold in the future. The storyline approach addresses outstanding research gaps in studies following existing GCM-driven approaches to better understand the plausible drivers and pathways of low-likelihood, high-impact events and quantify downward counterfactuals or near-misses to improve risk awareness. It aims to explore traditional climate model projections in a wider bottom-up framework that can be applied in practice, as storylines based on observed events are familiar to stakeholders and can be used in water resources planning to stress test UK catchments against unrealised droughts.
Our results show the role of autumn conditions during the 2010–2012 drought in controlling the timing of drought inception and termination, and the impacts of dry autumn conditions coupled with consecutive dry winters. The 2010–2012 drought is also highly sensitive to preconditions prior to 2010. Catchments in western Scotland are most sensitive to drier preconditions, even with perturbations at short return periods (> 100 % increase in max intensity; > 50 % increase in mean deficit). Conversely, conditions at the worst-affected catchments worsen by the same magnitude only for perturbations at longer return periods, with the persistence of drier preconditions highlighting the role of hydrogeology in drought propagation. Catchments across the UK remain vulnerable to a third dry winter situation, as simulated by the dry year before and dry year after storylines. Northern catchments are especially vulnerable to a dry year prior to the drought in immediate response to dry winter conditions. Drought conditions in some of the most affected southern catchments could still have intensified, particularly at long accumulation periods, given continued dry conditions instead of the abrupt drought termination as observed (> 50 % higher max intensity and mean deficit at SSI-24). Given a repeat of the 2010–2012 drought sequence, the UKCP18 climate projections point towards a worsening of drought conditions with increasing temperature rise, except for wetter winters mitigating drought conditions for fast-responding catchments in western Scotland at high warming levels. Perturbations for all four sets of storylines could have resulted in drought conditions matching or exceeding that of both the benchmark 1975–1976 and the 1989–1993 droughts, particularly for catchments across southern England.
Precipitation data (CEH-GEAR) are freely available on the Environmental Information Data Centre (https://doi.org/10.5285/ee9ab43d-a4fe-4e73-afd5-cd4fc4c82556, Tanguy et al., 2019). Daily mean temperature data (CEH-CHESS) are freely available on the Environmental Information Data Centre (https://doi.org/10.5285/2ab15bf0-ad08-415c-ba64-831168be7293, Robinson et al., 2020). Daily observed river flow data are available from the National River Flow Archive (https://nrfa.ceh.ac.uk/, National River Flow Archive 2021). Calibration parameters for the GR4J hydrological model at 303 UK catchments are available from the Environmental Information Data Centre (https://doi.org/10.5285/f710bed1-e564-47bf-b82c-4c2a2fe2810e, Smith et al., 2018). The input (precipitation and PET) and output (simulated river flows) data for each storyline for each catchment are available on the Zenodo repository (https://doi.org/10.5281/zenodo.5180494, Chan et al., 2021).
The supplement related to this article is available online at: https://doi.org/10.5194/hess-26-1755-2022-supplement.
All authors were involved in the conceptualisation of the study. WCHC conducted the formal analysis and prepared the original paper. TGS, KFC, GD, and NWA supervised the study. All authors contributed to the writing and interpretation of the results.
The contact author has declared that neither they nor their co-authors have any competing interests.
Publisher’s note: Copernicus Publications remains neutral with regard to jurisdictional claims in published maps and institutional affiliations.
The authors would like to thank Cecilia Svensson (UKCEH) and Lucy Barker (UKCEH), for their initial help in calculating the Standardised Streamflow Index (SSI). We also acknowledge the editor, Gemma Coxon, Raed Hamed, and one anonymous referee, for their detailed comments on our analysis.
This research has been supported by the Natural Environment Research Council via the SCENARIO Doctoral Training Partnership (grant no. NE/S007261/1).
This paper was edited by Jim Freer and reviewed by Gemma Coxon, Raed Hamed, and one anonymous referee.
Anandhi, A., Frei, A., Pierson, D. C., Schneiderman, E. M., Zion, M. S., Lounsbury, D., and Matonse, A. H.: Examination of change factor methodologies for climate change impact assessment, Water Resour. Res., 47, W03501, https://doi.org/10.1029/2010WR009104, 2011.
Arnell, N. W.: Relative effects of multi-decadal climatic variability and changes in the mean and variability of climate due to global warming: future streamflows in Britain, J. Hydrol., 270, 195–213, https://doi.org/10.1016/S0022-1694(02)00288-3, 2003.
Arnell, N. W.: Uncertainty in the relationship between climate forcing and hydrological response in UK catchments, Hydrol. Earth Syst. Sci., 15, 897–912, https://doi.org/10.5194/hess-15-897-2011, 2011.
Arnell, N. W., Kay, A. L., Freeman, A., Rudd, A. C., and Lowe, J. A.: Changing climate risk in the UK: a multi-sectoral analysis using policy-relevant indicators, Climate Risk Management, 31, 100265, https://doi.org/10.1016/j.crm.2020.100265, 2021.
Ault, T. R., Cole, J. E., Overpeck, J. T., Pederson, G. T., and Meko, D. M.: Assessing the Risk of Persistent Drought Using Climate Model Simulations and Paleoclimate Data, J. Climate, 27, 7529–7549, https://doi.org/10.1175/JCLI-D-12-00282.1, 2014.
Barker, L. J., Hannaford, J., Chiverton, A., and Svensson, C.: From meteorological to hydrological drought using standardised indicators, Hydrol. Earth Syst. Sci., 20, 2483–2505, https://doi.org/10.5194/hess-20-2483-2016, 2016.
Barker, L. J., Hannaford, J., Parry, S., Smith, K. A., Tanguy, M., and Prudhomme, C.: Historic hydrological droughts 1891–2015: systematic characterisation for a diverse set of catchments across the UK, Hydrol. Earth Syst. Sci., 23, 4583–4602, https://doi.org/10.5194/hess-23-4583-2019, 2019.
Bastos, A., Ciais, P., Friedlingstein, P., Sitch, S., Pongratz, J., Fan, L., Wigneron, J. P., Weber, U., Reichstein, M., Fu, Z., Anthoni, P., Arneth, A., Haverd, V., Jain, A. K., Joetzjer, E., Knauer, J., Lienert, S., Loughran, T., McGuire, P. C., Tian, H., Viovy, N., and Zaehle, S.: Direct and seasonal legacy effects of the 2018 heat wave and drought on European ecosystem productivity, Science Advances, 6, eaba2724, https://doi.org/10.1126/sciadv.aba2724, 2020.
Blenkinsop, S. and Fowler, H. J.: Changes in drought frequency, severity and duration for the British Isles projected by the PRUDENCE regional climate models, J. Hydrol., 342, 50–71, https://doi.org/10.1016/j.jhydrol.2007.05.003, 2007.
Brown, C., Ghile, Y., Laverty, M., and Li, K.: Decision scaling: Linking bottom-up vulnerability analysis with climate projections in the water sector, Water Resour. Res., 48, W09537, https://doi.org/10.1029/2011WR011212, 2012.
Brunner, M. I. and Slater, L. J.: Extreme floods in Europe: going beyond observations using reforecast ensemble pooling, Hydrol. Earth Syst. Sci., 26, 469–482, https://doi.org/10.5194/hess-26-469-2022, 2022.
Brunner, M. I. and Tallaksen, L. M.: Proneness of European Catchments to Multiyear Streamflow Droughts, Water Resour. Res., 55, 8881–8894, https://doi.org/10.1029/2019WR025903, 2019.
Burke, E. J., Perry, R. H. J., and Brown, S. J.: An extreme value analysis of UK drought and projections of change in the future, J. Hydrol., 388, 131–143, https://doi.org/10.1016/j.jhydrol.2010.04.035, 2010.
Cattiaux, J., Vautard, R., Cassou, C., Yiou, P., Masson-Delmotte, V., and Codron, F.: Winter 2010 in Europe: A cold extreme in a warming climate, Geophys. Res. Lett., 37, L20704, https://doi.org/10.1029/2010GL044613, 2010.
Chan, W. C. H., Shepherd, T. G., Facer-Childs, K., Darch, G., and Arnell, N.: Storylines of UK drought based on the 2010–12 event, Zenodo [data set], https://doi.org/10.5281/zenodo.5180494, 2021.
Chan, W. C. H., Shepherd, T. G., Facer-Childs, K., Darch, G., and Arnell, N.: Tracking the methodological development of climate change projections for UK river flows, Progress in Physical Geography: Earth and Environment, https://doi.org/10.1177/03091333221079201, online first, 2022.
Chun, K. P., Wheater, H., and Onof, C.: Prediction of the impact of climate change on drought: an evaluation of six UK catchments using two stochastic approaches, Hydrol. Process., 27, 1600–1614, https://doi.org/10.1002/hyp.9259, 2013a.
Chun, K. P., Wheater, H. S., and Onof, C.: Comparison of drought projections using two UK weather generators, Hydrolog. Sci. J., 58, 295–309, https://doi.org/10.1080/02626667.2012.754544, 2013b.
Doblas-Reyes, F. J., Sörensson, A. A., Almazroui, M., Dosio, A., Gutowski, W. J., Haarsma, R., Hamdi, R., Hewitson, B., Kwon, W.-T., B. L. Lamptey, Maraun, D., Stephenson, T. S., Takayabu, I., Terray, L., Turner, A., and Zuo, Z.: Linking Global to Regional Climate Change, in: Climate Change 2021: The Physical Science Basis, Contribution of Working Group I to the Sixth Assessment Report of the Intergovernmental Panel on Climate Change, edited by: Masson-Delmotte, V., Zhai, P., Pirani, A., Connors, S. L., Péan, C., Berger, S., Caud, N., Chen, Y., Goldfarb, L., Gomis, M. I., Huang, M., Leitzell, K., Lonnoy, E., Matthews, J. B. R., Maycock, T. K., Waterfield, T., Yelekçi, O., Yu, R., and Zhou, B., Cambridge University Press, in press, 2021.
Dobson, B., Coxon, G., Freer, J., Gavin, H., Mortazavi‐Naeini, M., and Hall, J. W.: The Spatial Dynamics of Droughts and Water Scarcity in England and Wales, Water Resour. Res., 56, e2020WR027187, https://doi.org/10.1029/2020WR027187, 2020.
Environment Agency: Impact of long droughts on water resources, https://www.gov.uk/government/publications/impacts-of-long-droughts-on-water-resources (last access: 6 January 2021), 2011.
Environment Agency: Climate change approaches in water resources planning: new methods, https://www.gov.uk/government/publications/climate-change-approaches-in-water-resources-planning-new-methods (last access: 6 January 2021), 2013.
Environment Agency: Write a drought plan: How to write a water company drought plan, https://www.gov.uk/guidance/ write-a-drought-plan (last access: 6 January 2021), 2015a.
Environment Agency: Understanding the performance of water supply systems during mild to extreme droughts, https://www.gov.uk/government/publications/understanding-the-performance-of-water-supply-systems-during-mild-to-extreme-droughts (last access: 6 January 2021), 2015b.
Folland, C. K., Hannaford, J., Bloomfield, J. P., Kendon, M., Svensson, C., Marchant, B. P., Prior, J., and Wallace, E.: Multi-annual droughts in the English Lowlands: a review of their characteristics and climate drivers in the winter half-year, Hydrol. Earth Syst. Sci., 19, 2353–2375, https://doi.org/10.5194/hess-19-2353-2015, 2015.
Fowler, H. J., Blenkinsop, S., and Tebaldi, C.: Linking climate change modelling to impacts studies: recent advances in downscaling techniques for hydrological modelling, Int. J. Climatol., 27, 1547–1578, https://doi.org/10.1002/joc.1556, 2007.
Garner, G., Hannah, D. M., and Watts, G.: Climate change and water in the UK: Recent scientific evidence for past and future change, Prog, Phys. Geog., 41, 154–170, https://doi.org/10.1177/0309133316679082, 2017.
Hannaford, J., Lloyd-Hughes, B., Keef, C., Parry, S., and Prudhomme, C.: Examining the large-scale spatial coherence of European drought using regional indicators of precipitation and streamflow deficit, Hydrol. Process., 25, 1146–1162, https://doi.org/10.1002/hyp.7725, 2011.
Harrigan, S., Hannaford, J., Muchan, K., and Marsh, T. J.: Designation and trend analysis of the updated UK Benchmark Network of river flow stations: the UKBN2 dataset, Hydrol. Res., 49, 552–567, https://doi.org/10.2166/nh.2017.058, 2018.
Hazeleger, W., van den Hurk, B. J. J. M., Min, E., van Oldenborgh, G. J., Petersen, A. C., Stainforth, D. A., Vasileiadou, E., and Smith, L. A.: Tales of future weather, Nat. Clim. Change, 5, 107–113, https://doi.org/10.1038/nclimate2450, 2015.
Hellwig, J., Stoelzle, M., and Stahl, K.: Groundwater and baseflow drought responses to synthetic recharge stress tests, Hydrol. Earth Syst. Sci., 25, 1053–1068, https://doi.org/10.5194/hess-25-1053-2021, 2021.
James, R., Washington, R., Schleussner, C.-F., Rogelj, J., and Conway, D.: Characterizing half-a-degree difference: a review of methods for identifying regional climate responses to global warming targets, WIREs Climate Change, 8, e457, https://doi.org/10.1002/wcc.457, 2017.
Kay, A. L., Watts, G., Wells, S. C., and Allen, S.: The impact of climate change on U. K. river flows: A preliminary comparison of two generations of probabilistic climate projections, Hydrol. Process., 34, 1081–1088, https://doi.org/10.1002/hyp.13644, 2020.
Kelder, T., Müller, M., Slater, L. J., Marjoribanks, T. I., Wilby, R. L., Prudhomme, C., Bohlinger, P., Ferranti, L., and Nipen, T.: Using UNSEEN trends to detect decadal changes in 100-year precipitation extremes, npj Climate and Atmospheric Science, 3, 1–13, https://doi.org/10.1038/s41612-020-00149-4, 2020.
Kendon, M., Marsh, T., and Parry, S.: The 2010–2012 drought in England and Wales, Weather, 68, 88–95, https://doi.org/10.1002/wea.2101, 2013.
Kilsby, C. G., Jones, P. D., Burton, A., Ford, A. C., Fowler, H. J., Harpham, C., James, P., Smith, A., and Wilby, R. L.: A daily weather generator for use in climate change studies, Environ. Modell. Softw., 22, 1705–1719, https://doi.org/10.1016/j.envsoft.2007.02.005, 2007.
Laaha, G., Gauster, T., Tallaksen, L. M., Vidal, J.-P., Stahl, K., Prudhomme, C., Heudorfer, B., Vlnas, R., Ionita, M., Van Lanen, H. A. J., Adler, M.-J., Caillouet, L., Delus, C., Fendekova, M., Gailliez, S., Hannaford, J., Kingston, D., Van Loon, A. F., Mediero, L., Osuch, M., Romanowicz, R., Sauquet, E., Stagge, J. H., and Wong, W. K.: The European 2015 drought from a hydrological perspective, Hydrol. Earth Syst. Sci., 21, 3001–3024, https://doi.org/10.5194/hess-21-3001-2017, 2017.
Lin, Y. C., Jenkins, S. F., Chow, J. R., Biass, S., Woo, G., and Lallemant, D.: Modeling Downward Counterfactual Events: Unrealized Disasters and why they Matter, Front. Earth Sci., 8, 575048, https://doi.org/10.3389/feart.2020.575048, 2020.
Lister, D., Osborn, T., Jones, P., and Darch, G.: Observed droughts in the greater Anglian region since 1920, Climatic Research Unit, University of East Anglia, Research Publication 22 (RP22), https://www.uea.ac.uk/documents/96135/5613032/ENV-CRU-RP22-Reduced-2019.pdf/44413503-3d5f-1202-a50e-ef98114c131b?t=1630500278019 (last access: 6 Janurary 2021), 49 pp., 2018.
Lloyd, E. A. and Shepherd, T. G.: Environmental catastrophes, climate change, and attribution, Ann. NY Acad. Sci., 1469, 105–124, https://doi.org/10.1111/nyas.14308, 2020.
Løhre, E., Juanchich, M., Sirota, M., Teigen, K. H., and Shepherd, T. G.: Climate Scientists' Wide Prediction Intervals May Be More Likely but Are Perceived to Be Less Certain, Weather Clim. Soc., 11, 565–575, https://doi.org/10.1175/WCAS-D-18-0136.1, 2019.
Lowe, J. A., Bernie, D., Bett, P., Bricheno, L., Brown, S., Calvert, D., Clark, R., Eagle, K., Edwards, T., Fosser, G., Fung, F., Gohar, L., Good, P., Gregory, J., Harris, G., Howard, T., Kaye, N., Kendon, E., Krijnen, J., Maisey, P., McDonald, R., McInnes, R.,McSweeney, C., Mitchell, J.F., Murphy, J., Palmer, M., Roberts, C., Rostron, J., Sexton, D., Thornton, H., Tinker, J., Tucker, S., Yamazaki, K., and Belcher, S.: UKCP18 Science Overview report, https://www.metoffice.gov.uk/pub/data/weather/uk/ukcp18/science-reports/UKCP18-Overview-report.pdf (last access: 6 Janurary 2021), 2018.
Maraun, D., Wetterhall, F., Ireson, A. M., Chandler, R. E., Kendon, E. J., Widmann, M., Brienen, S., Rust, H. W., Sauter, T., Themeßl, M., Venema, V. K. C., Chun, K. P., Goodess, C. M., Jones, R. G., Onof, C., Vrac, M., and Thiele‐Eich, I.: Precipitation downscaling under climate change: Recent developments to bridge the gap between dynamical models and the end user, Rev. Geophys., 48, RG3003, https://doi.org/10.1029/2009RG000314, 2010.
Maraun, D., Shepherd, T. G., Widmann, M., Zappa, G., Walton, D., Gutiérrez, J. M., Hagemann, S., Richter, I., Soares, P. M. M., Hall, A., and Mearns, L. O.: Towards process-informed bias correction of climate change simulations, Nat. Clim. Change, 7, 764–773, https://doi.org/10.1038/nclimate3418, 2017.
Marsh, T., Cole, G., and Wilby, R.: Major droughts in England and Wales, 1800–2006, Weather, 62, 87–93, https://doi.org/10.1002/wea.67, 2007.
Marsh, T., Parry. S., Kendon, M., and Hannaford, J.: The 2010–2012 drought and subsequent extensive flooding, Centre for Ecology and Hydrology, https://nora.nerc.ac.uk/id/eprint/503643/1/N503643CR.pdf (last access: 6 Janurary 2021), 54 pp., 2013.
Merchant, B. and Bloomfield, J. P.: Spatio-temporal modelling of the status of groundwater droughts, J. Hydrol., 564, 397–413, https://doi.org/10.1016/j.jhydrol.2018.07.009, 2018.
Montero, P. and Vilar, J. A.: TSclust: An R Package for Time Series Clustering, J. Stat. Softw., 62, 1–43, https://doi.org/10.18637/jss.v062.i01, 2014.
Moon, H., Gudmundsson, L., and Seneviratne, S. I.: Drought Persistence Errors in Global Climate Models, J. Geophys. Res.-Atmos., 123, 3483–3496, https://doi.org/10.1002/2017JD027577, 2018.
National River Flow Archive: https://nrfa.ceh.ac.uk/, last access: 6 January 2021.
Parry, S., Hannaford, J., Lloyd-Hughes, B., and Prudhomme, C.: Multi-year droughts in Europe: analysis of development and causes, Hydrol. Res., 43, 689–706, https://doi.org/10.2166/nh.2012.024, 2012.
Parry, S., Marsh, T., and Kendon, M.: 2012: from drought to floods in England and Wales, Weather, 68, 268–274, https://doi.org/10.1002/wea.2152, 2013.
Parry, S., Wilby, R. L., Prudhomme, C., and Wood, P. J.: A systematic assessment of drought termination in the United Kingdom, Hydrol. Earth Syst. Sci., 20, 4265–4281, https://doi.org/10.5194/hess-20-4265-2016, 2016.
Perrin, C., Michel, C., and Andréassian, V.: Improvement of a parsimonious model for streamflow simulation, J. Hydrol., 279, 275–289, https://doi.org/10.1016/S0022-1694(03)00225-7, 2003.
Prudhomme, C., Wilby, R. L., Crooks, S., Kay, A. L., and Reynard, N. S.: Scenario-neutral approach to climate change impact studies: Application to flood risk, J. Hydrol., 390, 198–209, https://doi.org/10.1016/j.jhydrol.2010.06.043, 2010.
Prudhomme, C., Young, A., Watts, G., Haxton, T., Crooks, S., Williamson, J., Davies, H., Dadson, S., and Allen, S.: The drying up of Britain? A national estimate of changes in seasonal river flows from 11 Regional Climate Model simulations, Hydrol. Process., 26, 1115–1118, https://doi.org/10.1002/hyp.8434, 2012.
Prudhomme, C., Giuntoli, I., Robinson, E. L., Clark, D. B., Arnell, N. W., Dankers, R., Fekete, B. M., Franssen, W., Gerten, D., Gosling, S. N., Hagemann, S., Hannah, D. M., Kim, H., Masaki, Y., Satoh, Y., Stacke, T., Wada, Y., and Wisser, D.: Hydrological droughts in the 21st century, hotspots and uncertainties from a global multimodel ensemble experiment, P. Natl. Acad. Sci. USA, 111, 3262–3267, https://doi.org/10.1073/pnas.1222473110, 2014.
Prudhomme, C., Sauquet, E., and Watts, G.: Low Flow Response Surfaces for Drought Decision Support: A Case Study from the UK, J. Extr. Even., 02, 1550005, https://doi.org/10.1142/S2345737615500050, 2015.
Prudhomme, C., Hannaford, J., Harrigan, S., Boorman, D., Knight, J., Bell, V., Jackson, C., Svensson, C., Parry, S., Bachiller-Jareno, N., Davies, H., Davis, R., Mackay, J., McKenzie, A., Rudd, A., Smith, K., Bloomfield, J., Ward, R., and Jenkins, A.: Hydrological Outlook UK: an operational streamflow and groundwater level forecasting system at monthly to seasonal time scales, Hydrolog. Sci. J., 62, 2753–2768, https://doi.org/10.1080/02626667.2017.1395032, 2017.
Rahiz, M. and New, M.: 21st Century Drought Scenarios for the UK, Water Resour. Manag., 27, 1039–1061, https://doi.org/10.1007/s11269-012-0183-1, 2013.
Rey, D., Holman, I. P., and Knox, J. W.: Developing drought resilience in irrigated agriculture in the face of increasing water scarcity, Reg. Environ. Change, 17, 1527–1540, https://doi.org/10.1007/s10113-017-1116-6, 2017.
Richardson, D., Fowler, H. J., Kilsby, C. G., and Neal, R.: A new precipitation and drought climatology based on weather patterns, Int. J. Climatol., 38, 630–648, https://doi.org/10.1002/joc.5199, 2018.
Robinson, E. L., Blyth, E. M., Clark, D. B., Comyn-Platt, E., and Rudd, A. C.: Climate hydrology and ecology research support system meteorology dataset for Great Britain (1961–2017) [CHESS-met], NERC Environmental Information Data Centre [data set], https://doi.org/10.5285/2ab15bf0-ad08-415c-ba64-831168be7293, 2020.
Rudd, A. C., Kay, A. L., and Bell, V. A.: National-scale analysis of future river flow and soil moisture droughts: potential changes in drought characteristics, Climatic Change, 156, 323–340, https://doi.org/10.1007/s10584-019-02528-0, 2019.
Serinaldi, F. and Kilsby, C. G.: A modular class of multisite monthly rainfall generators for water resource management and impact studies, J. Hydrol., 464–465, 528–540, https://doi.org/10.1016/j.jhydrol.2012.07.043, 2012.
Shepherd, T. G.: Atmospheric circulation as a source of uncertainty in climate change projections, Nat. Geosci., 7, 703–708, https://doi.org/10.1038/ngeo2253, 2014.
Shepherd, T. G.: Storyline approach to the construction of regional climate change information, P. Roy. Soc. A-Math. Phy., 475, 20190013, https://doi.org/10.1098/rspa.2019.0013, 2019.
Shepherd, T. G.: Bringing physical reasoning into statistical practice in climate-change science, Climatic Change, 169, 2, https://doi.org/10.1007/s10584-021-03226-6, 2021.
Shepherd, T. G., Boyd, E., Calel, R. A., Chapman, S. C., Dessai, S., Dima-West, I. M., Fowler, H. J., James, R., Maraun, D., Martius, O., Senior, C. A., Sobel, A. H., Stainforth, D. A., Tett, S. F. B., Trenberth, K. E., van den Hurk, B. J. J. M., Watkins, N. W., Wilby, R. L., and Zenghelis, D. A.: Storylines: an alternative approach to representing uncertainty in physical aspects of climate change, Climatic Change, 151, 555–571, https://doi.org/10.1007/s10584-018-2317-9, 2018.
Sillmann, J., Shepherd, T. G., van den Hurk, B., Hazeleger, W., Martius, O., Slingo, J., and Zscheischler, J.: Event-Based Storylines to Address Climate Risk, 9, e2020EF001783, https://doi.org/10.1029/2020EF001783, 2021.
Simpson, I. R., Deser, C., McKinnon, K. A., and Barnes, E. A.: Modelled and observed multidecadal variability in the North Atlantic jet stream and its connection to sea surface temperatures, J. Climate, 31, 8313–8338, 2018.
Smith, K. A., Tanguy, M., Hannaford, J., and Prudhomme, C.: Historic reconstructions of daily river flow for 303 UK catchments (1891–2015), NERC Environmental Information Data Centre [data set], https://doi.org/10.5285/f710bed1-e564-47bf-b82c-4c2a2fe2810e, 2018.
Smith, K. A., Wilby, R. L., Broderick, C., Prudhomme, C., Matthews, T., Harrigan, S., and Murphy, C.: Navigating Cascades of Uncertainty – As Easy as ABC? Not Quite …, J. Extr. Even., 05, 1850007, https://doi.org/10.1142/S2345737618500070, 2018.
Smith, K. A., Barker, L. J., Tanguy, M., Parry, S., Harrigan, S., Legg, T. P., Prudhomme, C., and Hannaford, J.: A multi-objective ensemble approach to hydrological modelling in the UK: an application to historic drought reconstruction, Hydrol. Earth Syst. Sci., 23, 3247–3268, https://doi.org/10.5194/hess-23-3247-2019, 2019.
Spraggs, G., Peaver, L., Jones, P., and Ede, P.: Re-construction of historic drought in the Anglian Region (UK) over the period 1798–2010 and the implications for water resources and drought management, J. Hydrol., 526, 231–252, https://doi.org/10.1016/j.jhydrol.2015.01.015, 2015.
Staudinger, M. and Seibert, J.: Predictability of low flow – An assessment with simulation experiments, J. Hydrol., 519, 1383–1393, https://doi.org/10.1016/j.jhydrol.2014.08.061, 2014.
Staudinger, M., Weiler, M., and Seibert, J.: Quantifying sensitivity to droughts – an experimental modeling approach, Hydrol. Earth Syst. Sci., 19, 1371–1384, https://doi.org/10.5194/hess-19-1371-2015, 2015.
Stoelzle, M., Stahl, K., Morhard, A., and Weiler, M.: Streamflow sensitivity to drought scenarios in catchments with different geology, Geophys. Res. Lett., 41, 6174–6183, https://doi.org/10.1002/2014GL061344, 2014.
Stoelzle, M., Staudinger, M., Stahl, K., and Weiler, M.: Stress testing as complement to climate scenarios: recharge scenarios to quantify streamflow drought sensitivity, Proc. IAHS, 383, 43–50, https://doi.org/10.5194/piahs-383-43-2020, 2020.
Sutton, R. T.: Climate Science Needs to Take Risk Assessment Much More Seriously, B. Am. Meteorol. Soc., 100, 1637–1642, https://doi.org/10.1175/BAMS-D-18-0280.1, 2019.
Svensson, C., Hannaford, J., and Prosdocimi, I.: Statistical distributions for monthly aggregations of precipitation and streamflow in drought indicator applications, Water Resour. Res., 53, 999–1018, https://doi.org/10.1002/2016WR019276, 2017.
Tanguy, M., Prudhomme, C., Smith, K., and Hannaford, J.: Historical gridded reconstruction of potential evapotranspiration for the UK, Earth Syst. Sci. Data, 10, 951–968, https://doi.org/10.5194/essd-10-951-2018, 2018.
Tanguy, M., Dixon, H., Prosdocimi, I., Morris, D. G., and Keller, V. D. J.: Gridded estimates of daily and monthly areal rainfall for the United Kingdom (1890–2017) [CEH-GEAR], NERC Environmental Information Data Centre [data set], https://doi.org/10.5285/ee9ab43d-a4fe-4e73-afd5-cd4fc4c82556, 2019.
Tanguy, M., Haslinger, K., Svensson, C., Parry, S., Barker, L. J., Hannaford, J., and Prudhomme, C.: Regional Differences in Spatiotemporal Drought Characteristics in Great Britain, Front. Environ. Sci., 9, 639649, https://doi.org/10.3389/fenvs.2021.639649, 2021.
Thompson, V., Dunstone, N. J., Scaife, A. A., Smith, D. M., Slingo, J. M., Brown, S., and Belcher, S. E.: High risk of unprecedented UK rainfall in the current climate, Nat. Commun., 8, 107, https://doi.org/10.1038/s41467-017-00275-3, 2017.
van der Wiel, K., Lenderink, G., and de Vries, H.: Physical storylines of future European drought events like 2018 based on ensemble climate modelling, Weather and Climate Extremes, 33, 100350, https://doi.org/10.1016/j.wace.2021.100350, 2021.
van Garderen, L., Feser, F., and Shepherd, T. G.: A methodology for attributing the role of climate change in extreme events: a global spectrally nudged storyline, Nat. Hazards Earth Syst. Sci., 21, 171–186, https://doi.org/10.5194/nhess-21-171-2021, 2021.
Van Loon, A. F.: Hydrological drought explained, WIREs Water, 2, 359–392, https://doi.org/10.1002/wat2.1085, 2015.
v. Christierson, B., Vidal, J.-P. and Wade, S. D.: Using UKCP09 probabilistic climate information for UK water resource planning, J. Hydrol., 424–425, 48–67, https://doi.org/10.1016/j.jhydrol.2011.12.020, 2012.
Vicente-Serrano, S. M., Beguería, S., Lorenzo-Lacruz, J., Camarero, J. J., López-Moreno, J. I., Azorin-Molina, C., Revuelto, J., Morán-Tejeda, E., and Sanchez-Lorenzo, A.: Performance of Drought Indices for Ecological, Agricultural, and Hydrological Applications, Earth Interact., 16, 1–27, https://doi.org/10.1175/2012EI000434.1, 2012.
Vitolo, C., Fry, M., and Buytaert, W.: rnrfa: an R package to retrieve, filter and visualize data from the UK National River Flow Archive, R J., 8, 102–116, 2016.
Wade, S., Sanderson, M., Golding, N., Lowe, J., Betts, R., Reynard, N., Kay, A., Stewart, L., Prudhomme, C., Shaffrey, L., Lloyg-Hughes, B., and Harvey, B.: Developing H Climate Change Scenarios for Heat Waves, Droughts, Floods, Windstorms and Cold Snaps, London: Committee on Climate Change https://www.theccc.org.uk/publication/met-office-for-the-asc-developing-h-climate-change-scenarios/, (last access: 6 January 2021), 2015.
Ward, J. H.: Hierarchical Grouping to Optimize an Objective Function, J. Am. Stat. Assoc., 58, 236–244, https://doi.org/10.1080/01621459.1963.10500845, 1963.
Watts, G., von Christierson, B., Hannaford, J., and Lonsdale, K.: Testing the resilience of water supply systems to long droughts, J. Hydrol., 414–415, 255–267, https://doi.org/10.1016/j.jhydrol.2011.10.038, 2012.
Wehrli, K., Hauser, M., and Seneviratne, S. I.: Storylines of the 2018 Northern Hemisphere heatwave at pre-industrial and higher global warming levels, Earth Syst. Dynam., 11, 855–873, https://doi.org/10.5194/esd-11-855-2020, 2020.
Wilby, R. L. and Dessai, S.: Robust adaptation to climate change, Weather, 65, 180–185, https://doi.org/10.1002/wea.543, 2010.
Wilby, R. L. and Harris, I.: A framework for assessing uncertainties in climate change impacts: Low-flow scenarios for the River Thames, UK, Water Resour. Res., 42, 2, https://doi.org/10.1029/2005WR004065, 2006.
Wilby, R. L., Prudhomme, C., Parry, S., and Muchan, K. G. L.: Persistence of Hydrometeorological Droughts in the United Kingdom: A Regional Analysis of Multi-Season Rainfall and River Flow Anomalies, J. Extr. Even., 02, 1550006, https://doi.org/10.1142/S2345737615500062, 2015.
Zscheischler, J., Martius, O., Westra, S., Bevacqua, E., Raymond, C., Horton, R. M., van den Hurk, B., AghaKouchak, A., Jézéquel, A., Mahecha, M. D., Maraun, D., Ramos, A. M., Ridder, N. N., Thiery, W., and Vignotto, E.: A typology of compound weather and climate events, Nat. Rev. Earth Environ., 1, 333–347, https://doi.org/10.1038/s43017-020-0060-z, 2020.