the Creative Commons Attribution 4.0 License.
the Creative Commons Attribution 4.0 License.
 | 22 Mar 2022
Evaporation enhancement drives the European water-budget deficit during multi-year droughts
Christian Massari
Francesco Avanzi
Giulia Bruno
Simone Gabellani
Daniele Penna
Stefania Camici
In a warming climate, periods with lower than average precipitation will increase in frequency and intensity. During such periods, known as meteorological droughts, the decline in annual runoff may be proportionally larger than the corresponding decline in precipitation. Reasons behind this exacerbation of runoff deficit during dry periods remain largely unknown, and this challenges the predictability of when this exacerbation will occur in the future and how intense it will be. In this work, we tested the hypothesis that runoff deficit exacerbation during droughts is a common feature across climates, driven by evaporation enhancement. We relied on multidecadal records of streamflow and precipitation for more than 200 catchment areas across various European climates, which distinctively show the emergence of similar periods of exacerbated runoff deficit identified in previous studies, i.e. runoff deficit on the order of −20 % to −40 % less than what expected from precipitation deficits. The magnitude of this exacerbation is two to three times larger for basins located in dry regions than for basins in wet regions, and is qualitatively correlated with an increase in annual evaporation during droughts, in the order of +11 % and +33 % over basins characterized by energy-limited and water-limited evaporation regimes, respectively. Thus, enhanced atmospheric and vegetation demand for moisture during dry periods induces a nonlinear precipitation-runoff relationship for low-flow regimes, which results in an unexpectedly large decrease in runoff during periods of already low water availability. Forecasting onset, magnitude, and duration of these drops in runoff have paramount societal and ecological implications, especially in a warming climate, given their supporting role for safeguarding water, food, and energy. The outcome that water basins are prone to this exacerbation of runoff deficit for various climates and evaporation regimes makes further understanding of its patterns of predictability an urgent priority for water-resource planning and management in a warming and drier climate.
- Article
(1213 KB) - Full-text XML
-
Supplement
(222 KB) - BibTeX
- EndNote


Timing and seasonality of runoff (Q) from a river basin are dictated by the interaction between incoming precipitation (P), atmospheric and vegetation water use (evaporation, ET), and the variation in water stored in the basin (ΔS): (Bales et al., 2018). While changes in precipitation will ultimately affect runoff, processes driving the precipitation-runoff relationship (Saft et al., 2016) are complicated by the nonlinear and often delayed response of ET and ΔS (Bales et al., 2018; Avanzi et al., 2020). Depending on the direction of precipitation change, evaporation-precipitation feedback mechanisms may comprise vegetation expansion and/or mortality (Senf et al., 2020; Choat et al., 2018) and vice versa (Gouveia et al., 2017; Biederman et al., 2014), wildfires (Bowd et al., 2019), a shift in the composition of vegetation according to species-specific water-use strategies (i.e. isohydric to anisohydric prevalent species), and depletion of regolith water storage and rock moisture (McDowell, 2018; Domec and Johnson, 2012; Gentilesca et al., 2017). For instance, weathered bedrock and rock moisture are significant water sources for plant transpiration in addition to soil water in Mediterranean climates (Goulden and Bales, 2019; Hahm et al., 2019; Rungee et al., 2019; Klos et al., 2018). If access to the whole of the regolith is not possible, or regolith moisture has already been depleted as a consequence of a long deficit in precipitation, plant mortality occurs, further decreasing basin-scale transpiration (Karban and Pezzola, 2017; Senf et al., 2020). The rate and distribution of regolith storage recharge and drainage also depends on precipitation, for example in terms of enhanced soil hydrophobicity during periods with low precipitation and the related disconnection between soil and groundwater storage (Rye and Smettem, 2017). These processes are intertwined with changes in other climatic factors, such as air temperature, making water basins profoundly co-evolve with the climate (Troch et al., 2015).
The fact that runoff deficit is not only dictated by atmospheric demand but other factors play a role like access of plants to deep water storage and specific vegetation response to water stress (often not well represented in earth system models, e.g. Fowler et al., 2020; De Kauwe et al., 2015) is especially true when prolonged precipitation deficits occur, such as those experienced during multi-year drought periods. While for a single dry year catchment storage may sustain a higher than usual evaporation rate (Orth and Destouni, 2018), this might not happen during multi-year droughts. During multi-year droughts, precipitation deficit and pre-existing catchment conditions (e.g. storage) modulate the response of evaporation to temperature anomaly in ways that are only partially quantified and predictable and that have direct consequences on runoff volumes. These aspects make multi-year droughts essentially different from individual and shorter dry years and motivate specific research on this topic. Note that we are not excluding here that runoff deficit exacerbation can also manifest during single severe drought years as the one that impacted Europe in 2018 (see the article collection: https://royalsocietypublishing.org/toc/rstb/2020/375/1810, last access: 7 March 2022). However, here we will focus on multi-year drought periods as it is our interest to understand the mechanisms leading to hydrological drought during long and sustained precipitation deficit periods, as already done by (Avanzi et al., 2020; Saft et al., 2015, 2016).
The relevance of ET and storage during droughts has been recognized for a long time (Teuling et al., 2013; Miralles et al., 2019), but the runoff implications of the response to precipitation changes are still poorly understood (Goulden and Bales, 2019). For instance, Orth and Destouni (2018) found that runoff decreases account for 65 %–80 % of the precipitation deficits, while ET reductions are small and only notable in dry climates, accounting for 0 %–20 % of the precipitation deficits. In other words, they found that the decline in runoff during droughts is faster and stronger than that in evaporation. While Orth and Destouni (2018) provided pieces of evidence of the importance of soil moisture and evaporation in the propagation of the meteorological drought into hydrological droughts, they did not focus specifically on multi-year drought periods or explicitly quantify the further aggravation of runoff deficit with respect to precipitation deficit. In this respect, previous studies have shown that prolonged meteorological droughts may indeed result in a larger than expected decrease in runoff (Saft et al., 2015; Avanzi et al., 2020; Tian et al., 2018, 2020; Mastrotheodoros et al., 2020; Alvarez-Garreton et al., 2021). This observation not only shows that precipitation deficit is an insufficient predictor for fully characterizing droughts, but also proves that the co-evolution of water basins with climate (in the form of ET and ΔS) may play a non-negligible role in driving meteorological to hydrological droughts, as during these periods plants adapt differently to water stress (McDowell et al., 2008) and might access water even from very deep water pools (Fan et al., 2017; Klos et al., 2018; Goulden and Bales, 2019; Hahm et al., 2019; Carrière et al., 2020) thus subtracting water from storages potentially destined to runoff.
The ultimate cause behind this observed exacerbation of runoff deficit is still unknown, with previous works providing contrasting and inconclusive results related either to the buffered response time of evaporation to precipitation deficit (Avanzi et al., 2020) or to streamflow memory (Alvarez-Garreton et al., 2021). It is also unclear whether this exacerbation takes place only in specific climates, such as Mediterranean regions where the precipitation distribution is skewed toward winter and summer is normally dry (Feng et al., 2019), or whether exacerbation of runoff deficit during meteorological droughts is a common feature of water basins across climates. In this respect, previous works in non-Mediterranean regions of Europe showed that evaporation amplifies the impact of summer droughts, but these studies mostly focused on storage rather than on runoff exacerbation (Teuling et al., 2013). Large-scale assessments spanning a variety of climates are still needed to gain further understanding of the runoff implications of meteorological droughts. Assessing the validity and the large-scale occurrence of this behaviour especially over a variety of basins with different climate and hydrological characteristics has important implications for defining sustainable water management strategies and understanding potential ecological traits and is becoming more and more urgent due to the increasing frequency and magnitude of drought events (Roudier et al., 2016; Sheffield and Wood, 2008; Samaniego et al., 2018; Wehner et al., 2011; Haile et al., 2020).
In this work, we put forward investigated the following research questions:
- i.
Do multiyear droughts in Europe correspond to an exacerbation of runoff deficit compared to precipitation deficit?
- ii.
If so, how severe is this exacerbation and how much is related to a coupled increase in water allocated to evaporation?
- iii.
Finally, what are the potential drivers of this exacerbation?
To answer these above defined research questions, we used long-term observations from 210 basins across different European climates (area from 200 to 50 000 km2). We calculated if basins show a runoff deficit comparatively larger than expected (i.e. a shift in the water balance), by fitting a multivariate regression across annual cumulative streamflow, basin-averaged cumulative annual precipitation, and a categorical variable denoting drought and non-drought years. The basins analysed, located from + 10∘ W to + 25∘ E and from + 35 to + 70∘ N, experienced at least one multi-year drought episode over the period 1979–2016.
2.1 Study area
The study area was initially composed of 1043 basins, with an area ranging in size from 200 to 50 000 km2. Basins were scattered across Europe, over a longitude varying from 10∘ W to 25∘ E and a latitude from 35 to 70∘ N (see Fig. 1). The considered region is characterized by a complex topography, with the Alpine and Pyrenees Mountain chains crossing the continent from west to east. Hilly plateaus gently slope towards the Great European Plain, a low, flat region extending from the Atlantic coast of France to the Urals, crossed by many rivers and with densely populated cities. The climate is humid continental in central and eastern Europe (with cold summers) and Mediterranean in southern Europe (with dry summers and humid winters). Mean annual precipitation across Europe ranges from about 300 to 4000 mm yr−1, depending on the location. The North Atlantic coast of Spain, the Alps and Balkan countries generally receive higher precipitation amounts. Flood occurrence ranges from spring to summer, moving from northeastern Europe towards the Alps, whereas the Mediterranean region and western Europe are mainly subject to winter floods (Berghuijs et al., 2014).
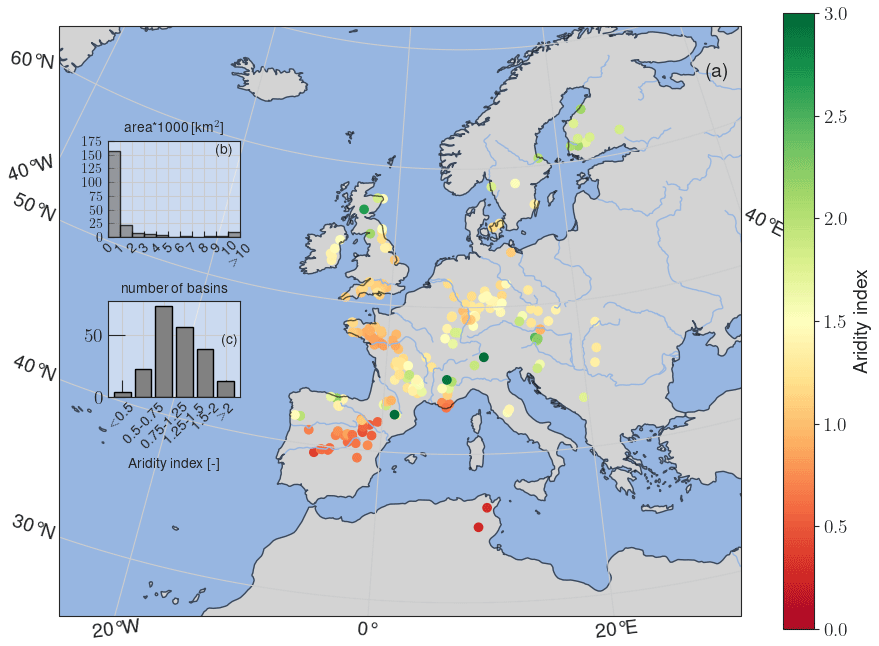
Figure 1(a) Aridity index (P PET) distribution of the basins of the study area, (b) frequency distribution of the area of the basins, (c) frequency distribution of the aridity index of the basins of the study area.
2.2 Precipitation, temperature, evaporation, and soil data
The present analysis relies on two high-quality precipitation data sets: one having a comparatively high spatial resolution (i.e. 0.25∘) and using ground observations (the European Climate Assessment & Dataset Project E-OBS, Haylock et al., 2008), and a reanalysis dataset (ERA5, Hersbach et al., 2020, spatial resolution 36 km see below). The gridded precipitation dataset E-OBS is derived through interpolation of the European Climate Assessment & Data (ECA&D) station data. The station dataset comprises a network of 2316 stations, with the highest density of stations in northern and central Europe and lower densities in the Mediterranean region, northern Scandinavia and eastern Europe. The E-OBS was used to analyse the precipitation-runoff relationship for each basin, while ERA5 was used for the drought characterization. The motivations for the use of two different precipitation data sets are further explained in Sect. 2.5.
From ERA5 we also extracted actual and potential evaporation. ERA5 is the latest climate reanalysis produced by the European Centre for Medium-Range Weather Forecasts (ECMWF), providing hourly data on many atmospheric, land-surface and sea-state parameters together with estimates of uncertainty. Actual evaporation from ERA5 reanalysis was used because of its relatively high quality (Martens et al., 2020) over its predecessor ERA-Interim, which already showed relatively good performance in comparison to other evaporation products and in closing the water balance of many catchments worldwide (Miralles et al., 2016). In particular, a good performance is expected especially over Europe where a substantially large volume of observations is assimiliated within ERA5. The latter is expected to improve the accuracy in the simulation of latent heat fluxes determined by vegetation and land cover change. On the other hand, attempts to implement more complex land cover and vegetation changes in the ECMWF model land cover characterization (by leveraging on state of the art earth observations) showed mostly neutral impacts on the simulated surface latent and sensible heat fluxes when compared against 51 FLUXNET stations over 1996–2014 over Europe (Nogueira et al., 2021).
Precipitation, actual and potential evaporation as well as air temperature variables used in this study are characterized by a spatial resolution of 36 km and monthly temporal resolution. ERA5 data were downloaded from the Copernicus Climate Change Service (https://climate.copernicus.eu/climate-reanalysis, last access: 24 April 2020, see data availability section below).
Precipitation and evaporation data were extracted for each basin by selecting pixels falling within the catchment boundaries and then averaged to provide basin-averaged annual precipitation and evaporation time series since 1979. E-OBS and ERA5 precipitation and evaporation variables were accumulated over the yearly time scale, while monthly temperature data were average out to obtain mean yearly temperature.
Catchment average soil properties (rooting depth and total available water content) were obtained from the European Soil Database Derived Data product (Hiederer and Hiederer, 2013) for each basin.
The climate of the specific basin was defined based on the aridity index, which we calculated as the ratio between long-term average annual potential evaporation and precipitation (both from ERA5) (Unesco, 1979). Note that this index was used for the mere climate classification while departures from it during multi-year drought periods and its impact on the precipitation-runoff relationship are beyond the scope of the study.
2.3 Runoff data
Daily streamflow records for the 1980–2015 period over Europe were obtained by merging the Global Runoff Data Base (GRDC); the Italian ISPRA HIS national database; the Portuguese national database; and the (see data availability note for more information). Most of these streamflow records mainly derived from near natural catchments were also used in previous studies as for instance by Stahl et al. (2010) and Orth and Destouni (2018) and, according to the authors, are characterized by relatively low human influence.
However, an additional detailed screening was carried out to avoid the influence of human regulations by considering the following processing steps:
-
From an initial number of more than 3900 stations, 1043 stations were retained by excluding (via visual inspection) those with evident dubious patterns due to human regulations (such as constant flows), inhomogeneity, problems in the low-flow range, missing values for a long period of time (>2 years, as suggested in Kundzewicz and Robson, 2004), or an observation period below 20 years.
-
Gauged stations for catchments with an area larger than 50 000 km2 were excluded from the analysis because human interference is unavoidable at that scale (Piniewski et al., 2018).
-
Discharge time series were partially gap-filled via linear interpolation for a maximum time window of 5 d.
-
Only years where the number of observations were available for more than 350 d were retained.
Although care was taken in identifying these issues, some human-induced alterations are likely to be still present in these time series. Nevertheless, a certain degree of disturbance can be tolerated (Murphy et al., 2013), considering also the annual granularity of our analyses. To avoid influence of the catchment area and to be coherent with the units of precipitation and evaporation streamflow measurements have been expressed in terms of runoff (i.e. we have considered the catchment area to transform m3 s−1 to mm yr−1).
2.4 Multi-year drought definition
Multi-year droughts were identified based on the precipitation deficit. The reason for using precipitation to characterize the multi-year drought period is base on our interest in analysing the runoff response, therefore it was not used to define the drought (Saft et al., 2016). In particular, we used the indications reportet in Saft et al., 2016 to define a multi-year drought period, using precipitation anomalies (i.e. the departures from the mean divided by the standard deviation). The following procedure was adopted:
-
Calculation of the precipitation anomalies. These were calculated both on the mean annual precipitation and on precipitation smoothed with a 3-year moving window. Smoothing was applied to avoid single wet years to interrupt a long and significantly dry period and was only used to set the beginning of the multi-year-drought period.
-
To reduce the blurring effect of the moving window, the exact end date of the dry period was determined through analysis of the unsmoothed anomalies from the last negative 3-year anomaly. The end year was set as the last year of this 3-year period unless: (i) there was a year with a positive anomaly larger than 0.15, in which case the end year was set to the year prior to that year; or (ii) if the last 2 years had slightly positive anomalies (but each less than 0.15), the end year was set to the first year of a positive anomaly;
-
The first year of the drought remained the start of the first 3-year negative anomaly. To ensure that the dry periods were sufficiently long and severe, we only used dry periods with the following characteristics: (i) length over 3 years; (ii) mean dry period anomaly <−0.8.
-
By defining drought in this way, we ended up with 210 basins out of 1043 having experienced at least 1 multi-year drought episode over the available period of recording.
Although relaxing the procedure for the multi-year drought definition would have brought a larger sample of basins, we preferred to maintain this approach to have consistent results with previous studies (Saft et al., 2016) and because doing so guaranteed that the period analysed coincided with a period of a severe precipitation deficit. The above procedure resulted in a satisfactory multi-year drought definition (see Fig. 2) that was validated with data found in the literature (Spinoni et al., 2015 see results section) with a minimum of 3 years to a maximum value of 8 years for few basins (median duration of 4 years). Note that we also:
-
tested different thresholds (i.e. larger than 3 years), without noticing any significant difference in the results;
-
cross-validated our drought definition technique (i.e. based on yearly precipitation anomalies divided by the standard deviation) with the use of a classical SPI-12 based on monthly data (not shown) and found almost identical patterns between the two. However, given that our analysis focused on annual water balance we preferred to maintain the use of precipitation anomalies.

Figure 2Year of the most intense drought (the most negative precipitation anomalies) within the multi-year drought period identified as well as its duration for each basin. Note that other years might have shown more severe droughts but they were shorter than the 3-year period we have defined.
2.5 Shift in the precipitation-runoff relationship
We detected shifts in the precipitation-runoff relationship by fitting a multivariate regression across annual cumulative streamflow (target variable), basin-averaged annual precipitation, and a categorical variable denoting drought and non-drought years (Avanzi et al., 2020; Peterson et al., 2021)
where I is a categorical drought variable (1 for years characterized by multi-drought and 0 otherwise), b0, b1, and b2 are regression coefficients, ϵ is noise, and QBC is annual streamflow transformed according to a Box-Cox transformation following the arguments in Avanzi et al. (2020):
where λ has been estimated from data to ensure linearity and heteroscedasticity (i.e. the λ that maximizes the log-likelihood function (Box and Cox, 1964). A parameter b1 different from zero (p-value <0.05) indicates a shift of the precipitation-runoff relationship during multi-year droughts. Following Avanzi et al. (2020) the statistical significance of coefficient b1 during droughts was assessed based on whether the signs of the confidence bounds agreed (significance level α=5 %, (Kottegoda and Rosso, 2008).
The relative magnitude of the shift in precipitation vs. runoff (MQ) for each basin was calculated by using the approach suggested by Saft et al. (2016):
where is the (predicted annual) runoff for a representative precipitation during dry periods according to the shifted precipitation- runoff relationship (I=1 in Eq. 1), while Qdry, P is the full natural flow for the same precipitation according to the non-shifted relationship (I=0 in Eq. 1). We assumed as representative annual precipitation the mean between average and minimum annual precipitation across the entire period of recording.
In this study, I in Eq. (1) was defined based on ERA5 precipitation (I=1 during multi-year drought and I=0 for the other years), while the annual precipitation P was calculated based on the E-OBS precipitation dataset. We used two different precipitation datasets because we wanted to rely only on observed higher spatial resolution precipitation (i.e. E-OBS) for the definition of the precipitation-runoff relationship to reduce water balance issues. On the contrary, for the drought definition we relied on ERA5 because we aimed to have consistent ERA5-based drought definition evaporation anomalies (both coming from the same dataset). On the other hand, both ERA5 and E-OBS precipitation are characterized by a relatively high accuracy (Massari et al., 2020) and high similarities over Europe (Pearson annual correlation close to 0.9 during the 1980–2016 period) and interchanging them guaranteed very similar results (not shown here).
3.1 Multi-year droughts in Europe and water budget deficit exacerbation
During the last five decades, Europe has experienced various multi-year drought episodes (Parry et al., 2012; Spinoni et al., 2015; Hanel et al., 2018), which have been perhaps less studied but are as relevant as those that have impacted other world regions, such as Australia, California, and South America (Dijk et al., 2013; Griffin and Anchukaitis, 2014; Garreaud et al., 2017). For instance, the 1995–1997 multi-year drought impacted almost all of Central and North Europe but unlike episodes prior to 1979 (which were not taken into consideration here), it had a limited initial spatial extent and coherence on a regional basis, with a late exacerbation in terms of severity and extent by 1997 (Parry et al., 2012). The 1989-1991 drought impacted Belgium, France, Luxembourg, The Netherlands, as well as Balkan countries, the Mediterranean region (Spinoni et al., 2015) and also the UK (Marsh et al., 1994; Peters et al., 2006). The period from 1992 to 1995 was one of the driest in the century for the Iberian Peninsula, and especially for Spain (Sheffield and Wood, 2011; Domínguez-Castro et al., 2019). The 2000–2005 period was also impacted by a severe drought in northern Italy, the Italian Alps (Fink et al., 2004) and Scandinavia (https://www.geo.uio.no/edc/droughtdb/edr/DroughtEvents/2003_Event.php, last access: 7 January 2022). The drought characterization we included in this work, based on precipitation anomalies (Saft et al., 2016, see Sect. 2.4 for details and motivation of this choice), provided consistent results with the above-mentioned studies (see Fig. 2). In particular, the 1989–1991 drought in the UK and France and the severe drought that peaked in 1992 in Central Europe (see Table 4 of Spinoni et al., 2015) were identified by our procedure. The same holds for the long drought which hit Spain during 1990–1995 also mentioned by Sheffield and Wood, 2011, and the 2000–2005 drought over the Alps and Scandinavia.
During these periods of severe precipitation deficit, 69 out of the considered 210 basins with at least 1 multi-year drought (i.e. 33 %) showed a statistically significant shift in the water balance (i.e. a negative shift in the precipitation-runoff relationship, see Fig. 3). This means that these 69 basins experienced statistically significant less runoff than would be expected based solely on the historical functional dependency of runoff on precipitation. This so-called negative shift is in contrast with experiencing no shift or a positive shift, where the runoff deficit during droughts would be equal to or smaller than that expected based on the precipitation deficit. By way of examples, a shift in the precipitation-runoff relationship of −30 % during 1 year belonging to a multi-year meteorological drought with mean annual precipitation equal to the long-term 10th percentile (which corresponds to a standardized precipitation index of about −1.6 and thus to a severe drought, see McKee et al., 1993) means that a basin of 1400 km2 (75th percentile of the areas of the considered basins) would experience an additional reduction in runoff volume of 43 Mm3 compared to what one would predict solely based on precipitation deficit. This reduction in runoff is equivalent to the annual renewable freshwater resource for 10k people, considering that the annual renewable freshwater resources averaged over the total European population for the period 1990–2017 reached 4560 m3 per person (https://www.eea.europa.eu/data-and-maps/indicators/use-of-freshwater-resources-3/assessment-4, last access: 25 October 2021). On the other hand, even if 30 %–40 % of runoff reduction can result in a small absolute reduction for drier basins, this reduction can lead to important changes in hydrological connectivity and shifts in streamflow regimes from perennial to intermittent (Fovet et al., 2021) with serious implications for water quality (Armstrong et al., 2012; Addy et al., 2019), river ecosystems and fish survival (Lennox et al., 2019), freshwater biodiversity (Datry et al., 2016) and the quality and diversity of ecosystem services they provide, especially over southern Europe (Vicente-Serrano et al., 2014; García-Ruiz et al., 2011).
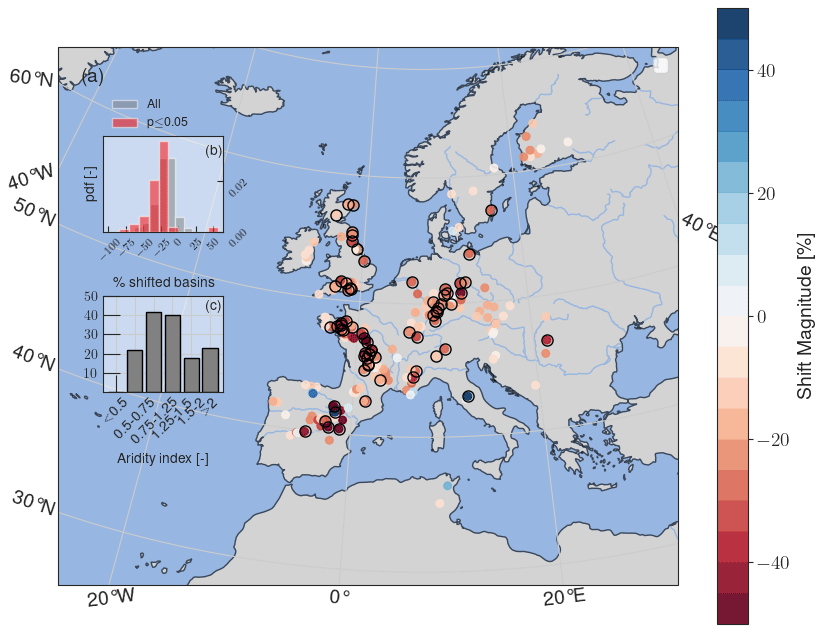
Figure 3Spatial distribution of the magnitude of the shift in the precipitation-runoff relationship (a). The shift in the precipitation-runoff relationship was calculated by fitting a multivariate regression across annual cumulative streamflow (target variable), basin-averaged annual precipitation, and a categorical variable denoting drought and non-drought years. Each dot refers to the position of the river gauge station. The basins where the shift was found to be statistically significant with p-value <0.05 are plotted with a black outline. Darker red dots refer to catchment areas where a larger exacerbation of runoff deficit during multi-year drought periods was observed. (b) Probability density function (pdf) of the magnitude of shift found for the basins in the study area. (c) Percentage of basins showing statistically significant shift (p<0.05) as a function of the aridity index calculated as the ratio between ERA5 precipitation and potential evaporation. The percentage has been calculated by stratifying basins for each aridity index class.
Although this exacerbation could also take place during shorter dry periods, we focused here on multi-year droughts because of their relevance from a water management standpoint. Also, we expect precipitation deficit to be particularly intense, sustained, and prolonged during multi-year droughts, which facilitates the quantification of any shift in the precipitation-runoff relationship and the testing of our research hypothesis.
The shift magnitude ranges from approximately −85 % to −12 % (−28 % in median, see Fig. 3b), consistent with and even larger than those found in previous works (Saft et al., 2015; Avanzi et al., 2020; Tian et al., 2018, 2020). Only two basins showed a statistically significant positive shift (i.e. 3 % of the sample). A similar result was also found by Saft et al. (2016) and no clear explanation was provided. The reasons behind it could be due to the quality of the data used, the screening process, the uncertainty in the multi-year drought definition and in the fitting of the precipitation-runoff relationship.
3.2 Evaporation enhancement, catchment aridity, and water budget deficit exacerbation
The distribution of basins with a statistically significant shift shows no obvious pattern of variability with the aridity index (see Fig. 3c). Note that we assume the aridity index to be a proxy of climate (Unesco, 1979). The only exception is that no shift was observed at very high latitudes (>65∘ N), where winters are comparatively cold and the evaporation regime is strongly energy-limited.
The magnitude of runoff deficit exacerbation during droughts is strongly related to mean annual runoff, being larger for drier basins (Fig. 4). This outcome qualitatively agrees with earlier findings related to the pre-drought aridity index being an important predictor of shifts in the precipitation-runoff relationship in Australia (Saft et al., 2016). Runoff exacerbation occurs in both rainfall-dominated and cryosphere-dominated basins as defined by the month of maximum daily discharge (see Fig. 4). Exacerbation occurs both in energy-limited and water-limited regimes, as delimited by the aridity index (Budyko and Miller, 1974; Maurer et al., 2022) (Fig. 4b). This demonstrates that catchments may experience a shift in the precipitation-runoff relationship and so an exacerbation of runoff deficit during droughts regardless of the predominant local climate. Indeed, we found a statistically significant shift for 25 % of the basins within the water-limited domains and for 35 % of the basins in the energy-limited domains (Fig. 4b), including snow-dominated basins characterized by an annual runoff peak during late spring and summer. Nonetheless, drier catchments experience a larger runoff reduction during multi-year droughts than wetter catchments: shift magnitude asymptotically tends to −20 % for wet catchments, while drier basins reach shift magnitudes as large as −80 % (Fig. 4).
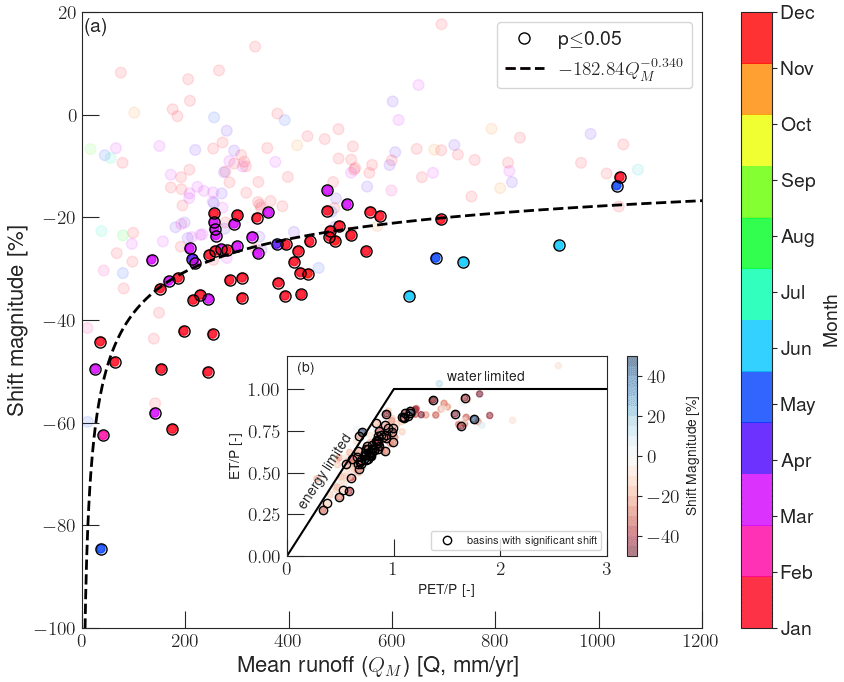
Figure 4(a) Shift magnitude vs. mean discharge grouped for maximum daily monthly discharge for all basins and for basins showing a shift (p-value <0.05 are shown with darker colour and a black edge). The black dashed line was obtained by fitting mean runoff vs. shift magnitude of basins showing a statistically significant shift. (b) Energy-limited and water-limited domain of the basins as a function of the shift magnitude. Dots with black outline indicate basins showing statistically significant shift at p<0.05. PET ERA5 potential evaporation, P precipitation, ET actual evaporation.
Given the annual water balance (), we explain this relationship between shift magnitude and aridity with the potentially enhanced contribution of evaporation to the annual water budget, particularly for water-limited regimes during droughts. In basins located over water-limited regimes, atmospheric demand for moisture is generally well above the available water storage needed to support evaporation, so that the latter will have a significant impact on already low runoff, especially at the beginning of a multi-year drought when water storage is comparatively large. In energy-limited environments, instead, evaporation is mainly controlled by the available energy and may play a minor role in the annual allocation of incoming precipitation.
The distribution of actual evaporation anomalies shows enhanced evaporation during multi-year droughts compared to the remainder of the years, for catchments located over energy-limited and water-limited regimes (Fig. 5). Basins located in a water-limited regime show a larger increase compared to those located in a energy-limited regime (33 % vs. 12 %). A two-sample Kolmogorov-Smirnov test carried out between the distributions of evaporation anomalies during droughts vs. during non-drought years confirms that the anomaly during droughts is statistically different (p<0.01) from that during non-drought years. This anomaly is generally larger for basins with the largest shifts (in absolute values, see Fig. S2 in the Supplement). Note that in Fig. S2 we divided basins between those located above and those located below 50∘ N, because we did not observe basins with a positive anomaly in evaporation below 30 % in the water-limited domain (we assumed that northern basins are mainly energy-limited).
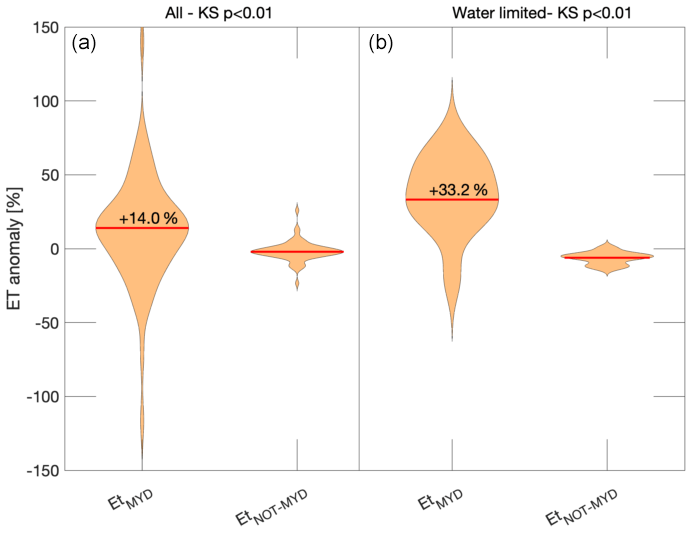
Figure 5ERA5 evaporation anomalies distribution for multi-year drought period (ETMYD) vs. non-multi-year drought periods (ETNOT-MYD) for basins showing statistically significant shifts (p<0.05) and characterized by an energy-limited regime (a) and for basins in the water-limited regime (b). KS refer to the two-sample Kolmogorov-Smirnov test between the distribution of evaporation anomalies of ETMYD and ETNOT-MYD. The red line in the violin plots refers to the median value. The anomalies are calculated as the ratio between the deviation with respect to the long-term mean and the absolute long-term standard deviation on the catchments showing statistically significant shifts.
This regime of enhanced evaporation during droughts was previously suggested by Teuling et al. (2013) and points to generally warmer conditions during droughts leading to additional demand for moisture, as also suggested by Orth and Destouni (2018) and Mastrotheodoros et al. (2020). Here, we further expanded these findings by showing that evaporation anomaly exacerbates runoff deficit in the form of shifts in the precipitation-runoff relationship beyond Alpine regions and across various climates. A similar result (not shown) was also found by calculating evaporation as and thus neglecting the contribution of the change in storage, as in Teuling et al. (2013).
The distribution of evaporation anomalies in Fig. 5 shows a larger spread during droughts than during non-drought years. We attributed this increased variability in evaporation during droughts to the regulation operated by energy (i.e. vapour pressure deficit) and available water (i.e. storage) during these water-scarce periods. Figure 6a and b shows two such examples, which also iterate how a positive actual evaporation anomaly is intimately coupled with runoff exacerbation (precipitation-runoff relationships for these two basins are shown in Fig. S1). Figure 6a shows a multi-year drought period in northern Europe (1989–1994); this drought was characterized by both negative precipitation anomalies (−77 mm yr−1 on average) and a positive anomaly in potential evaporation (+47 mm yr−1 on average). The result of this dry and warm period was a positive actual evaporation anomaly (+8 mm yr−1 on average) and a markedly negative runoff anomaly (−44 mm yr−1 on average). This situation significantly differs from 1996, a single dry year with (i) much less precipitation than observed during many of the multi-year drought years (e.g. 1990, 537 mm yr−1 vs. 368 mm yr−1) and, importantly, (ii) a substantially lower potential evaporation anomaly (−75 mm yr−1) denoting a much colder year with respect to 1989–1994. This cold-dry 1996 resulted in a negative actual evaporation anomaly (−72 mm yr−1), which translated into a much smaller runoff deficit than the multi-year drought (−33 mm yr−1 as opposed to −49 mm yr−1 in 1990). This demonstrates that in such energy-limited environments, the emergence of an enhanced evaporation regime during droughts is regulated by the available energy: if this is not sufficient, then actual evaporation will not increase.
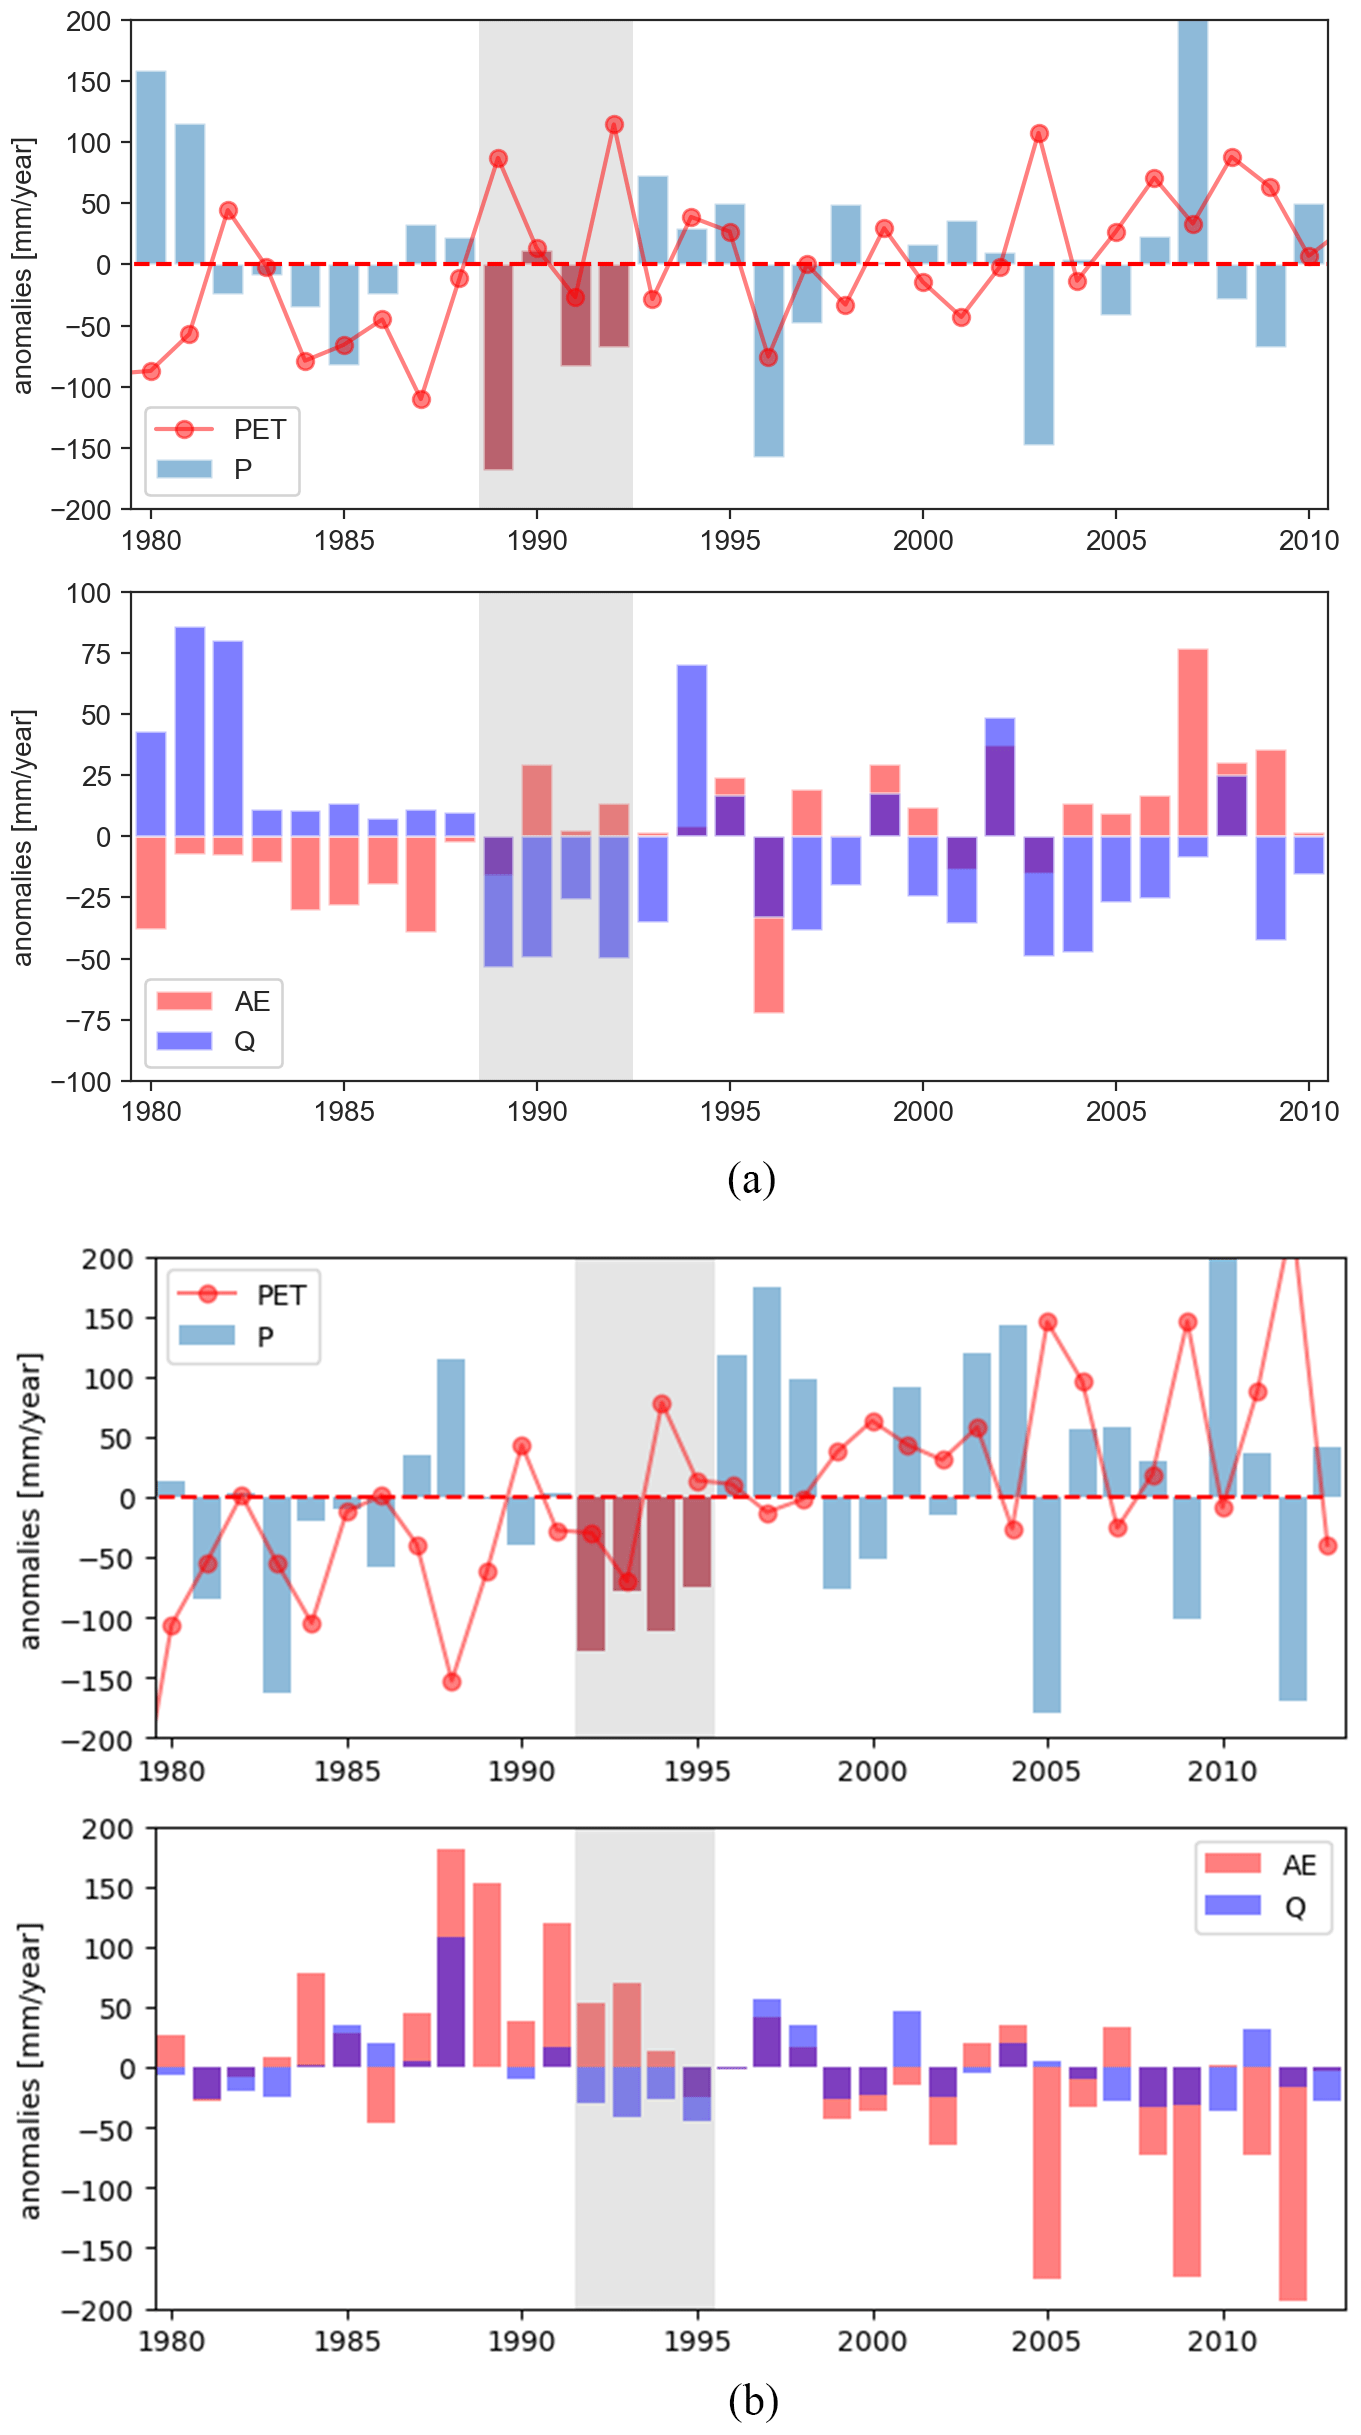
Figure 6(a) Precipitation and potential evaporation long-term mean anomalies (top), actual evaporation and runoff anomalies (bottom) for a basin located in northern Europe (6.8∘ W, 53.6∘ N) characterized by a energy limited regime according to Fig. 4b. (b) same as (a) but for southern Europe (5.4∘ W, 39.8∘ N) characterized by a water- limited regime. Grey areas represent the identified multi-year drought periods.
Similar conclusions can be drawn for the basins located in southern Europe (Fig. 6b), with some notable differences in this water-limited region. The multi-year drought period 1991–1995 in this area was characterized by a close to zero anomaly in potential evaporation (−1.94 mm yr−1 on average) and a below average precipitation (−98 mm yr−1). This dry-mild period significantly differs from another single, dry and warm year, i.e. 2012 (+229 mm yr−1 of potential evaporation and −98 mm yr−1 precipitation). Despite the much warmer and drier 2012, we observed a relatively larger runoff deficit during the multi-year drought period (−35 mm yr−1 on average equal to 25.9 mm yr−1) than in 2012 (−16 mm yr−1, equal to 46 mm yr−1) with an increase of actual evaporation equal to +27 mm yr−1 on average during the multi-year drought. In contrast to the basins located in northern Europe (i.e. in an energy-limited region), the emergence of an enhanced evaporation regime in a water-limited region is much more complex and regulated by both energy and available water storage (Seneviratne et al., 2010) (that can even result from carryover from previous years). Here, demand for moisture may also trigger plant-stomata closure thus reducing transpiration. Therefore, in water-limited regimes the year to year comparison of runoff deficit and evaporation anomaly is not straightforward and can be further complicated by the precipitation variability typical of Mediterranean regions (Seager et al., 2020). In any case, if storage is not sufficient, and/or other feedback mechanisms like stomata closure occur, then actual evaporation will not increase and runoff may be substantially higher than in relatively wetter periods.
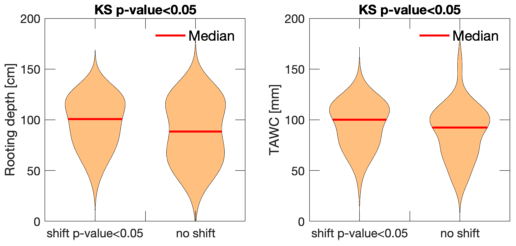
Figure 7Average rooting depth and total available water content (TAWC) for basins characterized by a significant shift in the precipitation-runoff relationship and those where shift was not significant. KS refer to the two- sample Kolmogorov-Smirnov test between the distribution of basins with shift (p-value <0.05) and basins showing a not statistically significant shift.
As basin storage (i.e. ΔS) plays an important but frequently neglected role in modulating runoff deficit via sustaining evaporation during multi-year droughts (Van Loon and Laaha, 2015), we compared the average rooting depth and the total available water content (TAWC) distribution for basins characterized by significant vs. nonsignificant shifts (see Fig. 7). Results highlight that the basins showing a significant shift in the precipitation-runoff relation are characterized by a different distribution of rooting depth and TAWC from basins showing nonsignificant shifts (two-sample Kolmogorov-Smirnov test with p-value <0.05). Because basins with a statistically significant shift show both a slightly deeper rooting depth and a larger TAWC, these findings tally with the enhanced ET anomaly for shifting basins in Fig. 5, because a deeper rooting depth may provide access to deeper storage during water stress and so sustain evaporation even during dry periods. Nonetheless, these findings are only of qualitative nature, given that distributions in Fig. 7 tend to overlap.
In a warming climate, different regions of the world will experience an increase in frequency and intensity of meteorological droughts. In this respect, this work provides evidence that:
-
Runoff-deficit exacerbation compared to precipitation deficit during droughts is a common feature of basins across Europe.
-
Runoff-deficit exacerbation occurs irrespective of local climate. In other words, we found such exacerbation in both water-limited and energy-limited environments. Moreover, basins prone to shifts in the precipitation-runoff relationship are characterized by vegetation cover featuring a comparatively larger rooting depth and by soils with greater total available water content compared to basins that do not show shifts in the precipitation-runoff relationship. This suggests the important role of storage in sustaining basin-scale evaporation.
-
Runoff exacerbation is related to an increase in evaporation occurring under two defined and concurrent preconditions: (1) water storage can support ET during the drought period, and (2) there is a sufficient vapour-pressure deficit (mainly driven by the temperature increase) to generate evaporation. When both circumstances are verified, then the catchment water balance shifts toward a new regime in which ET proportionally weights more than during wet periods. The macroscopic, bulk effect of this regime change is the shift in the precipitation-runoff relationship as observed in previous works (Avanzi et al., 2020). This shift is more pronounced in drier catchments because evaporation tends to be proportionally higher as long as enough water is available to sustain the atmospheric and vegetation demand for moisture. It is noteworthy that these drier catchments are areas of the world where water planners and ecosystem services are already challenged by limited water resources.
These results were obtained from an empirical, strictly data-based analysis, but are in line with earlier findings (Saft et al., 2015; Avanzi et al., 2020), as well with those inferred from blending data with mechanistic modelling across the European Alps (Mastrotheodoros et al., 2020). The key role of evaporation was also addressed in Europe by Orth and Destouni (2018) and points to the vegetation as a potential driver (Vicente-Serrano et al., 2014; Peña-Gallardo et al., 2019; Peña-Angulo et al., 2021) caused by enhanced evaporative demand during drought. Despite the fact that this was not clearly demonstrated in this work, the cited literature and Fig. 6b suggest that this is likely the case. In other words, our findings suggest that the increase in actual evaporation can be sustained also for long dry periods (i.e. multi-year droughts) and in typically water-limited environments, while for example Orth and Destouni (2018) highlighted this behaviour predominantly in energy limited regions. A potential explanation for this can be given by the capacity of deep-rooted trees to access water from weathered highly porous saprock or rock moisture (Rempe and Dietrich, 2018; Hahm et al., 2019; Carrière et al., 2020; Amin et al., 2020) which can reach up to 20–30 m beneath the surface (Klos et al., 2018). These mechanisms, which are vital to support the ecosystem during extended drought periods especially over water-limited regions by bringing large volumes of subsurface water into the atmosphere, might subtract water to runoff potentially determining an aggravation of the hydrological drought (Amin et al., 2020; Carrière et al., 2020; Barbeta and Peñuelas, 2017). Thus, during long and sustained dry periods like those that have impacted the European continent, runoff is not only reduced faster than evaporation (Orth and Destouni, 2018) but it is also reduced stronger than expected.
The understanding of the propagation of meteorological drought into hydrological drought for long and sustained dry periods is challenging because the overall catchment storage is expected to play a major role in driving runoff deficit. However, understanding the role played by storage is complicated by the difficulty to measure and estimate it (apart from large scale satellite-derived measurements like the Gravity Recovery and Climate Experiment (GRACE, Rodell et al., 2009), which is seldom addressed at catchment scale (McNamara et al., 2011). This is mainly due to the fact that storage is characterized by marked spatial heterogeneity, which is difficult to measure at the point scale and then extrapolate to the catchment scale (Spence, 2010). We have addressed this by plotting the root depth distribution and TAWC for basins experiencing a significant shift in the precipitation-runoff relationship finding that the latter are characterized by slightly larger values of these two variables. Nonetheless, further evidence is needed to corroborate this finding.
On top of this, the tested hypothesis of the drop in predictive skill in ET during drought found by Avanzi et al. (2020) and the fact that ET seems to be less coupled with soil moisture than models can generally predict (Dong et al., 2020; Qiu et al., 2020) can undermine the comprehension of the response of ET to drought in earth system models, especially over water-limited environments for long dry periods where, the “shallow” moisture storage, simulated by the latter can be already completely depleted leading to the paradox of null evaporation (Fowler et al., 2020). The suboptimal representation of ET by earth system models is not rare. For example, many models do not include stomatal response to dry periods, hydrologic regulation of plant rooting depth (De Kauwe et al., 2015; Fan et al., 2017), correct representation of the plant hydraulics (Li et al., 2021; Kennedy et al., 2019) as well as coevolution mechanisms, such as vegetation mortality and expansion (Goulden and Bales, 2019). These coevolution mechanisms affect the so-called climate elasticity of evaporation (Avanzi et al., 2020), i.e. the capability of ET (and indirectly runoff) to respond and adapt to changes in climate. This is specifically true for conceptual rainfall-runoff models which are still widely used in operational practice as well as for many scientific purposes like climate-change studies due to their parsimony and computationally efficient model structure (Pagano et al., 2014). These models may be inadequate tools during periods of runoff exacerbation like those we found here across Europe especially if one considers that their calibration remains inevitable (Beven and Freer, 2001; Fowler et al., 2016).
The findings of our study highlight the need to gain a better knowledge about the propagation of meteorological to hydrological anomalies across different climatic regions (Lorenzo-Lacruz et al., 2013) as well as the identification of meteorological drought indices that best reflect streamflow anomalies as suggested by Tijdeman et al., 2018. This would provide an important basis for large-scale drought monitoring and early warning information. This is true especially over data-scarce regions due to the observed decline of stream gauge observations (Crochemore et al., 2020) where meteorological-based drought indices are normally used to monitor and predict hydrological droughts.
Given the projected warming climate and aridity, and the role of ET in driving the exacerbation of runoff during droughts, improving understanding of this elasticity appears an urgent task for future work and attempts to do this are still ongoing (Fowler et al., 2020; Hughes et al., 2021). The large-scale experiment we carried out provides useful insights about the influence of climate and catchment characteristics on the propagation of the meteorological to the hydrological drought. Although the study catchments were limited to Europe, the diversity of physiographic and aridity settings, as well as the number of sites used suggest that storage and evaporation are important factors involved in shifting the water balance of other regions of the world. On the other hand, further research is needed in this direction also considering that:
-
In the study we did not consider the potential impact of trends in temperature and the associated long-term coevolutionary mechanisms of the catchments. In this respect there can be potential reflections of coevolution mechanisms on the runoff reduction for which a simple fitting of the precipitation-runoff relationship might be inadequate.
-
Despite the fact that we have carried out a highly controlled experiment employing as much as possible near natural catchments by screening out basins potentially characterized by human regulation and used some of the best available precipitation and evaporation products, we cannot exclude that the observed runoff deficit exacerbation might have been driven by other factors related to the climate or land cover changes or water regulation interactions than the simple increase of actual evaporation (Vicente-Serrano et al., 2019; Teuling et al., 2019; Teuling and Hoek van Dijke, 2020) which might also not be well represented in the actual evaporation dataset used.
-
Our analysis was based on an annual time scale. However, intra-annual variations of the water balance components could exert an important role to explain hydrological drought response to precipitation deficits. Despite this, the study might lack details in resolution (for instance it can reveal periods where the runoff deficit is larger and the impact of the climate of the seasons on the runoff aggravation) but it is still valid in terms of water balance perspectives.
-
The processes underlying the aggravation of the runoff deficit due to increased evaporation for individual catchments may be related to differences in water storage dynamics, flow paths, and evaporation due to changes in the infiltration capacity of soils, the duration of infiltration periods, the timing of infiltration periods, the soil moisture regime and the human water use, amongst other factors. Given the diversity of environments in our dataset, each with its own internal heterogeneity, the mechanisms connecting precipitation deficit to runoff deficit are likely to result from combinations of factors and may vary from site to site as well as depending on human influences and topography of the catchment. Further work is needed to clarify which hydrological processes play a major role on the findings we have presented.
-
Despite having selected some of the best possible climate datasets of evaporation and precipitation, some uncertainty is unavoidable which is also related to the their relatively coarse spatial resolution with respect to the size of the basins analysed.
Despite these limitations, the findings of this study have significant implications for water resource ecological management of river basins. Given the projected global temperature rise is expected to lead to significant increase in drought frequency and intensity in many regions of the world our results indicate possible larger than expected decreases in mean streamflow across different climates in the world.
All codes are available upon request.
Data from E-OBS were obtained via https://www.ecad.eu/download/ensembles/download.php#datafiles (ECA&D, 2022; Cornes et al., 2018). ERA5 data used for the analysis are freely available via the Copernicus Climate Change Service (C3S) (https://doi.org/10.24381/cds.adbb2d47, Copernicus Climate Change Service, 2022), runoff data and basin areas were downloaded from the Global Runoff Data Base (GRDC). Discharge observations and shapefiles are obtained from the Global Runoff Data Center (https://www.bafg.de/GRDC/EN/01_GRDC/grdc_node.html, GRDC, 2022). Additional river discharge data are obtained from the Italian ISPRA HIS national database (http://www.hiscentral.isprambiente.gov.it/hiscentral/default.aspx, ISPRA HIS, 2022); the Portuguese national database (http://snirh.pt/, SNIRH, 2022).
The supplement related to this article is available online at: https://doi.org/10.5194/hess-26-1527-2022-supplement.
CM and FA designed and coordinated the study and made the analyses. GB helped in the data analysis and interpretation, DP and SG helped in the result interpretation, SC helped in the result interpretation and in the data collection. All authors contributed to the editing of the paper.
The contact author has declared that neither they nor their co-authors have any competing interests.
Publisher’s note: Copernicus Publications remains neutral with regard to jurisdictional claims in published maps and institutional affiliations.
The authors would like to thank the Editor Adriaan J. (Ryan) Teuling and the two anonymous reviewers for the useful and constructive comments that have significantly improved the quality of the paper. We acknowledge the E-OBS dataset from the EU-FP6 project UERRA (http://www.uerra.eu, last access: 17 March 2022), the Copernicus Climate Change Service, and the data providers of the ECA&D project (https://www.ecad.eu, last access: 17 March 2022).
This paper has been partially supported by MIUR Project (PRIN 2020) “Unravelling interactions between WATER and carbon cycles during drought and their impact on water resources and forest and grassland ecosySTEMs in the Mediterranean climate (WATERSTEM)” (protocol code: 20202WF53Z) and “WAFER” CNR (Consiglio Nazionale delle Ricerche).
This paper was edited by Adriaan J. (Ryan) Teuling and reviewed by two anonymous referees.
Addy, K., Gold, A. J., Welsh, M. K., August, P. V., Stolt, M. H., Arango, C. P., and Groffman, P. M.: Connectivity and Nitrate Uptake Potential of Intermittent Streams in the Northeast USA, Front. Ecol. Evol., 7, 225, https://doi.org/10.3389/fevo.2019.00225, 2019.
Alvarez-Garreton, C., Boisier, J. P., Garreaud, R., Seibert, J., and Vis, M.: Progressive water deficits during multiyear droughts in basins with long hydrological memory in Chile, Hydrol. Earth Syst. Sci., 25, 429–446, https://doi.org/10.5194/hess-25-429-2021, 2021.
Amin, A., Zuecco, G., Geris, J., Schwendenmann, L., McDonnell, J. J., Borga, M., and Penna, D.: Depth distribution of soil water sourced by plants at the global scale: A new direct inference approach, Ecohydrology, 13, e2177, https://doi.org/10.1002/eco.2177, 2020.
Armstrong, A., Stedman, R. C., Bishop, J. A., and Sullivan, P. J.: What's a Stream Without Water? Disproportionality in Headwater Regions Impacting Water Quality, Environ. Manage., 50, 849–860, https://doi.org/10.1007/s00267-012-9928-0, 2012.
Avanzi, F., Rungee, J., Maurer, T., Bales, R., Ma, Q., Glaser, S., and Conklin, M.: Climate elasticity of evapotranspiration shifts the water balance of Mediterranean climates during multi-year droughts, Hydrol. Earth Syst. Sci., 24, 4317–4337, https://doi.org/10.5194/hess-24-4317-2020, 2020.
Bales, R. C., Goulden, M. L., Hunsaker, C. T., Conklin, M. H., Hartsough, P. C., O'Geen, A. T., Hopmans, J. W., and Safeeq, M.: Mechanisms controlling the impact of multi-year drought on mountain hydrology, Sci. Rep., 8, 690, https://doi.org/10.1038/s41598-017-19007-0, 2018.
Barbeta, A. and Peñuelas, J.: Relative contribution of groundwater to plant transpiration estimated with stable isotopes, Sci. Rep., 7, 10580, https://doi.org/10.1038/s41598-017-09643-x, 2017.
Berghuijs, W. R., Woods, R. A., and Hrachowitz, M.: A precipitation shift from snow towards rain leads to a decrease in streamflow, Nat. Clim. Change, 4, 583–586, https://doi.org/10.1038/nclimate2246, 2014.
Beven, K. and Freer, J.: Equifinality, data assimilation, and uncertainty estimation in mechanistic modelling of complex environmental systems using the GLUE methodology, J. Hydrol., 249, 11–29, https://doi.org/10.1016/S0022-1694(01)00421-8, 2001.
Biederman, J. A., Harpold, A. A., Gochis, D. J., Ewers, B. E., Reed, D. E., Papuga, S. A., and Brooks, P. D.: Increased evaporation following widespread tree mortality limits streamflow response, Water Resour. Res., 50, 5395–5409, https://doi.org/10.1002/2013WR014994, 2014.
Bowd, E. J., Banks, S. C., Strong, C. L., and Lindenmayer, D. B.: Long-term impacts of wildfire and logging on forest soils, Nat. Geosci., 12, 113–118, https://doi.org/10.1038/s41561-018-0294-2, 2019.
Box, G. E. P. and Cox, D. R.: An Analysis of Transformations, J. R. Stat. Soc. Ser. B Methodol., 26, 211–243, https://doi.org/10.1111/j.2517-6161.1964.tb00553.x, 1964.
Budyko, M. I. and Miller, D. H.: Climate and Life, vol. 18, 1st edn., New York Academic Press, 507 pp., edited by: Budyko, ISBN 9780080954530, 1974.
Carrière, S. D., Martin-StPaul, N. K., Cakpo, C. B., Patris, N., Gillon, M., Chalikakis, K., Doussan, C., Olioso, A., Babic, M., Jouineau, A., Simioni, G., and Davi, H.: The role of deep vadose zone water in tree transpiration during drought periods in karst settings – Insights from isotopic tracing and leaf water potential, Sci. Total Environ., 699, 134332, https://doi.org/10.1016/j.scitotenv.2019.134332, 2020.
Choat, B., Brodribb, T. J., Brodersen, C. R., Duursma, R. A., López, R., and Medlyn, B. E.: Triggers of tree mortality under drought, Nature, 558, 531–539, https://doi.org/10.1038/s41586-018-0240-x, 2018.
Copernicus Climate Change Service (C3S): ERA5 data, https://doi.org/10.24381/cds.adbb2d47, 2022.
Cornes, R., van der Schrier, G., van den Besselaar, E. J. M., and Jones, P. D.: An Ensemble Version of the E-OBS Temperature and Precipitation Datasets, J. Geophys. Res.-Atmos., 123, https://doi.org/10.1029/2017JD028200, 2018.
Crochemore, L., Isberg, K., Pimentel, R., Pineda, L., Hasan, A., and Arheimer, B.: Lessons learnt from checking the quality of openly accessible river flow data worldwide, Hydrol. Sci. J., 65, 699–711, https://doi.org/10.1080/02626667.2019.1659509, 2020.
Datry, T., Fritz, K., and Leigh, C.: Challenges, developments and perspectives in intermittent river ecology, Freshw. Biol., 61, 1171–1180, https://doi.org/10.1111/fwb.12789, 2016.
De Kauwe, M. G., Zhou, S.-X., Medlyn, B. E., Pitman, A. J., Wang, Y.-P., Duursma, R. A., and Prentice, I. C.: Do land surface models need to include differential plant species responses to drought? Examining model predictions across a mesic-xeric gradient in Europe, Biogeosciences, 12, 7503–7518, https://doi.org/10.5194/bg-12-7503-2015, 2015.
Dijk, A. I. J. M. van, Beck, H. E., Crosbie, R. S., Jeu, R. A. M. de, Liu, Y. Y., Podger, G. M., Timbal, B., and Viney, N. R.: The Millennium Drought in southeast Australia (2001–2009): Natural and human causes and implications for water resources, ecosystems, economy, and society, Water Resour. Res., 49, 1040–1057, https://doi.org/10.1002/wrcr.20123, 2013.
Domec, J.-C. and Johnson, D. M.: Does homeostasis or disturbance of homeostasis in minimum leaf water potential explain the isohydric versus anisohydric behavior of Vitis vinifera L. cultivars?, Tree Physiol., 32, 245–248, https://doi.org/10.1093/treephys/tps013, 2012.
Domínguez-Castro, F., Vicente-Serrano, S. M., Tomás-Burguera, M., Peña-Gallardo, M., Beguería, S., El Kenawy, A., Luna, Y., and Morata, A.: High spatial resolution climatology of drought events for Spain: 1961–2014, Int. J. Climatol., 39, 5046–5062, https://doi.org/10.1002/joc.6126, 2019.
Dong, J., Dirmeyer, P. A., Lei, F., Anderson, M. C., Holmes, T. R. H., Hain, C., and Crow, W. T.: Soil Evaporation Stress Determines Soil Moisture-Evapotranspiration Coupling Strength in Land Surface Modeling, Geophys. Res. Lett., 47, e2020GL090391, https://doi.org/10.1029/2020GL090391, 2020.
ECA&D: E-OBS, https://www.ecad.eu/download/ensembles/download.php#datafiles, last access: 8 March 2022.
Fan, Y., Miguez-Macho, G., Jobbágy, E. G., Jackson, R. B., and Otero-Casal, C.: Hydrologic regulation of plant rooting depth, P. Natl. Acad. Sci. USA, 114, 10572–10577, https://doi.org/10.1073/pnas.1712381114, 2017.
Feng, X., Thompson, S. E., Woods, R., and Porporato, A.: Quantifying Asynchronicity of Precipitation and Potential Evapotranspiration in Mediterranean Climates, Geophys. Res. Lett., 46, 14692–14701, https://doi.org/10.1029/2019GL085653, 2019.
Fink, A. H., Brücher, T., Krüger, A., Leckebusch, G. C., Pinto, J. G., and Ulbrich, U.: The 2003 European summer heatwaves and drought – synoptic diagnosis and impacts, Weather, 59, 209–216, https://doi.org/10.1256/wea.73.04, 2004.
Fovet, O., Belemtougri, A., Boithias, L., Braud, I., Charlier, J.-B., Cottet, M., Daudin, K., Dramais, G., Ducharne, A., Folton, N., Grippa, M., Hector, B., Kuppel, S., Le Coz, J., Legal, L., Martin, P., Moatar, F., Molénat, J., Probst, A., Riotte, J., Vidal, J.-P., Vinatier, F., and Datry, T.: Intermittent rivers and ephemeral streams: Perspectives for critical zone science and research on socio-ecosystems, WIREs Water, 8, e1523, https://doi.org/10.1002/wat2.1523, 2021.
Fowler, K., Knoben, W., Peel, M., Peterson, T., Ryu, D., Saft, M., Seo, K., and Western, A.: Many commonly used rainfall-runoff models lack long, slow dynamics: implications for runoff projections, Water Resour. Res., 56, e2019WR025286, https://doi.org/10.1029/2019WR025286, 2020.
Fowler, K. J. A., Peel, M. C., Western, A. W., Zhang, L., and Peterson, T. J.: Simulating runoff under changing climatic conditions: Revisiting an apparent deficiency of conceptual rainfall-runoff models, Water Resour. Res., 52, 1820–1846, https://doi.org/10.1002/2015WR018068, 2016.
García-Ruiz, J. M., López-Moreno, J. I., Vicente-Serrano, S. M., Lasanta–Martínez, T., and Beguería, S.: Mediterranean water resources in a global change scenario, Earth-Sci. Rev., 105, 121–139, https://doi.org/10.1016/j.earscirev.2011.01.006, 2011.
Garreaud, R. D., Alvarez-Garreton, C., Barichivich, J., Boisier, J. P., Christie, D., Galleguillos, M., LeQuesne, C., McPhee, J., and Zambrano-Bigiarini, M.: The 2010–2015 megadrought in central Chile: impacts on regional hydroclimate and vegetation, Hydrol. Earth Syst. Sci., 21, 6307–6327, https://doi.org/10.5194/hess-21-6307-2017, 2017.
Gentilesca, T., Camarero, J. J., Colangelo, M., Nolè, A., and Ripullone, F.: Drought-induced oak decline in the western Mediterranean region: an overview on current evidences, mechanisms and management options to improve forest resilience, IForest – Biogeosciences For., 10, 796, https://doi.org/10.3832/ifor2317-010, 2017.
Goulden, M. L. and Bales, R. C.: California forest die-off linked to multi-year deep soil drying in 2012–2015 drought, Nat. Geosci., 12, 632–637, https://doi.org/10.1038/s41561-019-0388-5, 2019.
Gouveia, C. M., Trigo, R. M., Beguería, S., and Vicente-Serrano, S. M.: Drought impacts on vegetation activity in the Mediterranean region: An assessment using remote sensing data and multi-scale drought indicators, Glob. Planet. Change, 151, 15–27, https://doi.org/10.1016/j.gloplacha.2016.06.011, 2017.
GRDC (Global Runoff Data Center): Discharge observations and shapefiles, https://www.bafg.de/GRDC/EN/01_GRDC/grdc_node.html (last access: 17 March 2022), 2022.
Griffin, D. and Anchukaitis, K. J.: How unusual is the 2012–2014 California drought?, Geophys. Res. Lett., 41, 9017–9023, https://doi.org/10.1002/2014GL062433, 2014.
Hahm, W. J., Dralle, D. N., Rempe, D. M., Bryk, A. B., Thompson, S. E., Dawson, T. E., and Dietrich, W. E.: Low Subsurface Water Storage Capacity Relative to Annual Rainfall Decouples Mediterranean Plant Productivity and Water Use From Rainfall Variability, Geophys. Res. Lett., 46, 6544–6553, https://doi.org/10.1029/2019GL083294, 2019.
Haile, G. G., Tang, Q., Hosseini-Moghari, S.-M., Liu, X., Gebremicael, T. G., Leng, G., Kebede, A., Xu, X., and Yun, X.: Projected Impacts of Climate Change on Drought Patterns Over East Africa, Earths Future, 8, e2020EF001502, https://doi.org/10.1029/2020EF001502, 2020.
Hanel, M., Rakovec, O., Markonis, Y., Máca, P., Samaniego, L., Kyselý, J., and Kumar, R.: Revisiting the recent European droughts from a long-term perspective, Sci. Rep., 8, 9499, https://doi.org/10.1038/s41598-018-27464-4, 2018.
Haylock, M. R., Hofstra, N., Klein Tank, A. M. G., Klok, E. J., Jones, P. D., and New, M.: A European daily high-resolution gridded data set of surface temperature and precipitation for 1950–2006, J. Geophys. Res., 113, D20119, https://doi.org/10.1029/2008JD010201, 2008.
Hersbach, H., Bell, B., Berrisford, P., Hirahara, S., Horányi, A., Muñoz-Sabater, J., Nicolas, J., Peubey, C., Radu, R., Schepers, D., Simmons, A., Soci, C., Abdalla, S., Abellan, X., Balsamo, G., Bechtold, P., Biavati, G., Bidlot, J., Bonavita, M., Chiara, G. D., Dahlgren, P., Dee, D., Diamantakis, M., Dragani, R., Flemming, J., Forbes, R., Fuentes, M., Geer, A., Haimberger, L., Healy, S., Hogan, R. J., Hólm, E., Janisková, M., Keeley, S., Laloyaux, P., Lopez, P., Lupu, C., Radnoti, G., Rosnay, P. de, Rozum, I., Vamborg, F., Villaume, S., and Thépaut, J.-N.: The ERA5 global reanalysis, Q. J. Roy. Meteor. Soc., 146, 1999–2049, https://doi.org/10.1002/qj.3803, 2020.
Hiederer, R. and Hiederer, R.: Mapping Soil Properties for Europe- Spatial Representation of, Luxembourg: Publications Office of the European Union Technical Research series, 47 pp., ISBN 978-92-79-32516-8, https://doi.org/10.2788/94128, 2013.
Hughes, J., Potter, N., Zhang, L., and Bridgart, R.: Conceptual Model Modification and the Millennium Drought of Southeastern Australia, Water, 13, 669, https://doi.org/10.3390/w13050669, 2021.
ISPRA HIS: River discharge data, http://www.hiscentral.isprambiente.gov.it/hiscentral/default.aspx, last access: 8 March 2022.
Karban, R. and Pezzola, E.: Effects of a multi-year drought on a drought-adapted shrub, Artemisia tridentata, Plant Ecol., 218, 547–554, https://doi.org/10.1007/s11258-017-0710-5, 2017.
Kennedy, D., Swenson, S., Oleson, K. W., Lawrence, D. M., Fisher, R., Lola da Costa, A. C., and Gentine, P.: Implementing Plant Hydraulics in the Community Land Model, Version 5, J. Adv. Model. Earth Syst., 11, 485–513, https://doi.org/10.1029/2018MS001500, 2019.
Klos, P. Z., Goulden, M. L., Riebe, C. S., Tague, C. L., O'Geen, A. T., Flinchum, B. A., Safeeq, M., Conklin, M. H., Hart, S. C., Berhe, A. A., Hartsough, P. C., Holbrook, W. S., and Bales, R. C.: Subsurface plant-accessible water in mountain ecosystems with a Mediterranean climate, WIRES Water, 5, e1277, https://doi.org/10.1002/wat2.1277, 2018.
Kottegoda, N. and Rosso, R.: Applied Statistics for Civil and Environmental Engineers, Wiley, ISBN-13 978-1-4051-7917-1, 2008.
Kundzewicz, Z. W. and Robson, A. J.: Change detection in hydrological records – a review of the methodology/Revue méthodologique de la détection de changements dans les chroniques hydrologiques, Hydrol. Sci. J., 49, 7–19, https://doi.org/10.1623/hysj.49.1.7.53993, 2004.
Lennox, R. J., Crook, D. A., Moyle, P. B., Struthers, D. P., and Cooke, S. J.: Toward a better understanding of freshwater fish responses to an increasingly drought-stricken world, Rev. Fish Biol. Fish., 29, 71–92, https://doi.org/10.1007/s11160-018-09545-9, 2019.
Li, L., Yang, Z.-L., Matheny, A. M., Zheng, H., Swenson, S. C., Lawrence, D. M., Barlage, M., Yan, B., McDowell, N. G., and Leung, L. R.: Representation of Plant Hydraulics in the Noah-MP Land Surface Model: Model Development and Multiscale Evaluation, J. Adv. Model. Earth Syst., 13, e2020MS002214, https://doi.org/10.1029/2020MS002214, 2021.
Lorenzo-Lacruz, J., Vicente-Serrano, S. M., González-Hidalgo, J. C., López-Moreno, J. I., and Cortesi, N.: Hydrological drought response to meteorological drought in the Iberian Peninsula, Clim. Res., 58, 117–131, https://doi.org/10.3354/cr01177, 2013.
Marsh, T., Monkhouse, R., Arnell, N., Lees, M., and Reynard, N.: The 1988–92 drought, NERC Institute of Hydrology, ISBN 0948540591, 1994
Martens, B., Schumacher, D. L., Wouters, H., Muñoz-Sabater, J., Verhoest, N. E. C., and Miralles, D. G.: Evaluating the land-surface energy partitioning in ERA5, Geosci. Model Dev., 13, 4159–4181, https://doi.org/10.5194/gmd-13-4159-2020, 2020.
Massari, C., Brocca, L., Pellarin, T., Abramowitz, G., Filippucci, P., Ciabatta, L., Maggioni, V., Kerr, Y., and Fernandez Prieto, D.: A daily 25 km short-latency rainfall product for data-scarce regions based on the integration of the Global Precipitation Measurement mission rainfall and multiple-satellite soil moisture products, Hydrol. Earth Syst. Sci., 24, 2687–2710, https://doi.org/10.5194/hess-24-2687-2020, 2020.
Mastrotheodoros, T., Pappas, C., Molnar, P., Burlando, P., Manoli, G., Parajka, J., Rigon, R., Szeles, B., Bottazzi, M., Hadjidoukas, P., and Fatichi, S.: More green and less blue water in the Alps during warmer summers, Nat. Clim. Change, 10, 155–161, https://doi.org/10.1038/s41558-019-0676-5, 2020.
Maurer, T., Avanzi, F., Glaser, S. D., and Bales, R. C.: Drivers of drought-induced shifts in the water balance through a Budyko approach, Hydrol. Earth Syst. Sci., 26, 589–607, https://doi.org/10.5194/hess-26-589-2022, 2022.
McDowell, N., Pockman, W. T., Allen, C. D., Breshears, D. D., Cobb, N., Kolb, T., Plaut, J., Sperry, J., West, A., Williams, D. G., and Yepez, E. A.: Mechanisms of plant survival and mortality during drought: why do some plants survive while others succumb to drought?, New Phytol., 178, 719–739, https://doi.org/10.1111/j.1469-8137.2008.02436.x, 2008.
McDowell, N. G.: Deriving pattern from complexity in the processes underlying tropical forest drought impacts, New Phytol., 219, 841–844, https://doi.org/10.1111/nph.15341, 2018.
McKee, T. B., Doesken, N. J., and Kleist, J.: The relationship of drought frequency and duration to time scales, in: Proceedings of the 8th Conference on Applied Climatology, Anaheim, California, 17–22 January 1993, Boston, American Meteorological Society, 179–184, 1993.
McNamara, J. P., Tetzlaff, D., Bishop, K., Soulsby, C., Seyfried, M., Peters, N. E., Aulenbach, B. T., and Hooper, R.: Storage as a Metric of Catchment Comparison, Hydrol. Process., 25, 3364–3371, https://doi.org/10.1002/hyp.8113, 2011.
Miralles, D. G., Jiménez, C., Jung, M., Michel, D., Ershadi, A., McCabe, M. F., Hirschi, M., Martens, B., Dolman, A. J., Fisher, J. B., Mu, Q., Seneviratne, S. I., Wood, E. F., and Fernández-Prieto, D.: The WACMOS-ET project – Part 2: Evaluation of global terrestrial evaporation data sets, Hydrol. Earth Syst. Sci., 20, 823–842, https://doi.org/10.5194/hess-20-823-2016, 2016.
Miralles, D. G., Gentine, P., Seneviratne, S. I., and Teuling, A. J.: Land-atmospheric feedbacks during droughts and heatwaves: state of the science and current challenges, Ann. N. Y. Acad. Sci., 1436, 19–35, https://doi.org/10.1111/nyas.13912, 2019.
Murphy, C., Harrigan, S., Hall, J., and Wilby, R. L.: Climate-driven trends in mean and high flows from a network of reference stations in Ireland, Hydrol. Sci. J., 58, 755–772, https://doi.org/10.1080/02626667.2013.782407, 2013.
Nogueira, M., Boussetta, S., Balsamo, G., Albergel, C., Trigo, I. F., Johannsen, F., Miralles, D. G., and Dutra, E.: Upgrading Land-Cover and Vegetation Seasonality in the ECMWF Coupled System: Verification With FLUXNET Sites, METEOSAT Satellite Land Surface Temperatures, and ERA5 Atmospheric Reanalysis, J. Geophys. Res.-Atmos., 126, e2020JD034163, https://doi.org/10.1029/2020JD034163, 2021.
Orth, R. and Destouni, G.: Drought reduces blue-water fluxes more strongly than green-water fluxes in Europe, Nat. Commun., 9, 3602, https://doi.org/10.1038/s41467-018-06013-7, 2018.
Pagano, T. C., Wood, A. W., Ramos, M.-H., Cloke, H. L., Pappenberger, F., Clark, M. P., Cranston, M., Kavetski, D., Mathevet, T., Sorooshian, S., and Verkade, J. S.: Challenges of Operational River Forecasting, J. Hydrometeorol., 15, 1692–1707, https://doi.org/10.1175/JHM-D-13-0188.1, 2014.
Parry, S., Hannaford, J., Lloyd-Hughes, B., and Prudhomme, C.: Multi-year droughts in Europe: analysis of development and causes, Hydrol. Res., 43, 689–706, https://doi.org/10.2166/nh.2012.024, 2012.
Peña-Angulo, D., Vicente-Serrano, S. M., Domínguez-Castro, F., Noguera, I., Tomas-Burguera, M., López-Moreno, J. I., Lorenzo-Lacruz, J., and El Kenawy, A.: Unravelling the role of vegetation on the different trends between climatic and hydrologic drought in headwater catchments of Spain, Anthropocene, 36, 100309, https://doi.org/10.1016/j.ancene.2021.100309, 2021.
Peña-Gallardo, M., Vicente-Serrano, S. M., Hannaford, J., Lorenzo-Lacruz, J., Svoboda, M., Domínguez-Castro, F., Maneta, M., Tomas-Burguera, M., and Kenawy, A. E.: Complex influences of meteorological drought time-scales on hydrological droughts in natural basins of the contiguous Unites States, J. Hydrol., 568, 611–625, https://doi.org/10.1016/j.jhydrol.2018.11.026, 2019.
Peters, E., Bier, G., van Lanen, H. A. J., and Torfs, P. J. J. F.: Propagation and spatial distribution of drought in a groundwater catchment, J. Hydrol., 321, 257–275, https://doi.org/10.1016/j.jhydrol.2005.08.004, 2006.
Peterson, T. J., Saft, M., Peel, M. C., and John, A.: Watersheds may not recover from drought, Science, 372, 745–749, https://doi.org/10.1126/science.abd5085, 2021.
Piniewski, M., Marcinkowski, P., and Kundzewicz, Z. W.: Trend detection in river flow indices in Poland, Acta Geophys., 66, 347–360, https://doi.org/10.1007/s11600-018-0116-3, 2018.
Qiu, J., Crow, W. T., Dong, J., and Nearing, G. S.: Model representation of the coupling between evapotranspiration and soil water content at different depths, Hydrol. Earth Syst. Sci., 24, 581–594, https://doi.org/10.5194/hess-24-581-2020, 2020.
Rempe, D. M. and Dietrich, W. E.: Direct observations of rock moisture, a hidden component of the hydrologic cycle, P. Natl. Acad. Sci. USA, 115, 2664–2669, https://doi.org/10.1073/pnas.1800141115, 2018.
Rodell, M., Velicogna, I., and Famiglietti, J. S.: Satellite-based estimates of groundwater depletion in India, Nature, 460, 999–1002, https://doi.org/10.1038/nature08238, 2009.
Roudier, P., Andersson, J. C. M., Donnelly, C., Feyen, L., Greuell, W., and Ludwig, F.: Projections of future floods and hydrological droughts in Europe under a +2 ∘C global warming, Clim. Change, 135, 341–355, https://doi.org/10.1007/s10584-015-1570-4, 2016.
Rungee, J., Bales, R., and Goulden, M.: Evapotranspiration response to multiyear dry periods in the semiarid western United States, Hydrol. Process., 33, 182–194, https://doi.org/10.1002/hyp.13322, 2019.
Rye, C. F. and Smettem, K. R. J.: The effect of water repellent soil surface layers on preferential flow and bare soil evaporation, Geoderma, 289, 142–149, https://doi.org/10.1016/j.geoderma.2016.11.032, 2017.
Saft, M., Western, A. W., Zhang, L., Peel, M. C., and Potter, N. J.: The influence of multiyear drought on the annual rainfall-runoff relationship: An Australian perspective, Water Resour. Res., 51, 2444–2463, https://doi.org/10.1002/2014WR015348, 2015.
Saft, M., Peel, M. C., Western, A. W., and Zhang, L.: Predicting shifts in rainfall-runoff partitioning during multiyear drought: Roles of dry period and catchment characteristics: runoff shifts during decadal drought, Water Resour. Res., 52, 9290–9305, https://doi.org/10.1002/2016WR019525, 2016.
Samaniego, L., Thober, S., Kumar, R., Wanders, N., Rakovec, O., Pan, M., Zink, M., Sheffield, J., Wood, E. F., and Marx, A.: Anthropogenic warming exacerbates European soil moisture droughts, Nat. Clim. Change, 8, 421–426, https://doi.org/10.1038/s41558-018-0138-5, 2018.
Seager, R., Liu, H., Kushnir, Y., Osborn, T. J., Simpson, I. R., Kelley, C. R., and Nakamura, J.: Mechanisms of Winter Precipitation Variability in the European–Mediterranean Region Associated with the North Atlantic Oscillation, J. Climate, 33, 7179–7196, 2020.
Seneviratne, S. I., Corti, T., Davin, E. L., Hirschi, M., Jaeger, E. B., Lehner, I., Orlowsky, B., and Teuling, A. J.: Investigating soil moisture–climate interactions in a changing climate: A review, Earth-Sci. Rev., 99, 125–161, https://doi.org/10.1016/j.earscirev.2010.02.004, 2010.
Senf, C., Buras, A., Zang, C. S., Rammig, A., and Seidl, R.: Excess forest mortality is consistently linked to drought across Europe, Nat. Commun., 11, 6200, https://doi.org/10.1038/s41467-020-19924-1, 2020.
Sheffield, J. and Wood, E. F.: Projected changes in drought occurrence under future global warming from multi-model, multi-scenario, IPCC AR4 simulations, Clim. Dynam, 31, 79–105, https://doi.org/10.1007/s00382-007-0340-z, 2008.
Sheffield, J. and Wood, E. F.: Drought: Past problems and future scenarios, Publisher Taylor and Francis, https://doi.org/10.4324/9781849775250, ebook ISBN 9781849775250, 210 pp., January 2012.
SNIRH: Portuguese national database, http://snirh.pt/, last access: 8 March 2022.
Spence, C.: A Paradigm Shift in Hydrology: Storage Thresholds Across Scales Influence Catchment Runoff Generation, Geogr. Compass, 4, 819–833, https://doi.org/10.1111/j.1749-8198.2010.00341.x, 2010.
Spinoni, J., Naumann, G., Vogt, J. V., and Barbosa, P.: The biggest drought events in Europe from 1950 to 2012, J. Hydrol. Reg. Stud., 3, 509–524, https://doi.org/10.1016/j.ejrh.2015.01.001, 2015.
Stahl, K., Hisdal, H., Hannaford, J., Tallaksen, L. M., van Lanen, H. a. J., Sauquet, E., Demuth, S., Fendekova, M., and Jódar, J.: Streamflow trends in Europe: evidence from a dataset of near-natural catchments, Hydrol. Earth Syst. Sci., 14, 2367–2382, https://doi.org/10.5194/hess-14-2367-2010, 2010.
Teuling, A. J. and Hoek van Dijke, A. J.: Forest age and water yield, Nature, 578, E16–E18, https://doi.org/10.1038/s41586-020-1941-5, 2020.
Teuling, A. J., Van Loon, A. F., Seneviratne, S. I., Lehner, I., Aubinet, M., Heinesch, B., Bernhofer, C., Grünwald, T., Prasse, H., and Spank, U.: Evapotranspiration amplifies European summer drought: Evapotranspiration and summer droughts, Geophys. Res. Lett., 40, 2071–2075, https://doi.org/10.1002/grl.50495, 2013.
Teuling, A. J., de Badts, E. A. G., Jansen, F. A., Fuchs, R., Buitink, J., Hoek van Dijke, A. J., and Sterling, S. M.: Climate change, reforestation/afforestation, and urbanization impacts on evapotranspiration and streamflow in Europe, Hydrol. Earth Syst. Sci., 23, 3631–3652, https://doi.org/10.5194/hess-23-3631-2019, 2019.
Tian, W., Liu, X., Liu, C., and Bai, P.: Investigation and simulations of changes in the relationship of precipitation-runoff in drought years, J. Hydrol., 565, 95–105, https://doi.org/10.1016/j.jhydrol.2018.08.015, 2018.
Tian, W., Bai, P., Wang, K., Liang, K., and Liu, C.: Simulating the change of precipitation-runoff relationship during drought years in the eastern monsoon region of China, Sci. Total Environ., 723, 138172, https://doi.org/10.1016/j.scitotenv.2020.138172, 2020.
Tijdeman, E., Barker, L. J., Svoboda, M. D., and Stahl, K.: Natural and Human Influences on the Link Between Meteorological and Hydrological Drought Indices for a Large Set of Catchments in the Contiguous United States, Water Resour. Res., 54, 6005–6023, https://doi.org/10.1029/2017WR022412, 2018.
Troch, P. A., Lahmers, T., Meira, A., Mukherjee, R., Pedersen, J. W., Roy, T., and Valdés-Pineda, R.: Catchment coevolution: A useful framework for improving predictions of hydrological change?, Water Resour. Res., 51, 4903–4922, https://doi.org/10.1002/2015WR017032, 2015.
Unesco: Map of the world distribution of arid regions: Explanatory note, Unesco, ISBN 92-3-101484-6, United Nations Educational, Scientific and Cultural Organization, Paris, 1979.
Van Loon, A. F. and Laaha, G.: Hydrological drought severity explained by climate and catchment characteristics, J. Hydrol., 526, 3–14, https://doi.org/10.1016/j.jhydrol.2014.10.059, 2015.
Vicente-Serrano, S. M., Lopez-Moreno, J.-I., Beguería, S., Lorenzo-Lacruz, J., Sanchez-Lorenzo, A., García-Ruiz, J. M., Azorin-Molina, C., Morán-Tejeda, E., Revuelto, J., Trigo, R., Coelho, F., and Espejo, F.: Evidence of increasing drought severity caused by temperature rise in southern Europe, Environ. Res. Lett., 9, 044001, https://doi.org/10.1088/1748-9326/9/4/044001, 2014.
Vicente-Serrano, S. M., Peña-Gallardo, M., Hannaford, J., Murphy, C., Lorenzo-Lacruz, J., Dominguez-Castro, F., López-Moreno, J. I., Beguería, S., Noguera, I., Harrigan, S., and Vidal, J.-P.: Climate, Irrigation, and Land Cover Change Explain Streamflow Trends in Countries Bordering the Northeast Atlantic, Geophys. Res. Lett., 46, 10821–10833, https://doi.org/10.1029/2019GL084084, 2019.
Wehner, M., Easterling, D. R., Lawrimore, J. H., Heim, R. R., Vose, R. S., and Santer, B. D.: Projections of Future Drought in the Continental United States and Mexico, J. Hydrometeorol., 12, 1359–1377, https://doi.org/10.1175/2011JHM1351.1, 2011.