the Creative Commons Attribution 4.0 License.
the Creative Commons Attribution 4.0 License.
 | 08 Nov 2021
Attributing correlation skill of dynamical GCM precipitation forecasts to statistical ENSO teleconnection using a set-theory-based approach
Tongtiegang Zhao
Haoling Chen
Quanxi Shao
Tongbi Tu
Yu Tian
Xiaohong Chen
Climate teleconnections are essential for the verification of valuable precipitation forecasts generated by global climate models (GCMs). This paper develops a novel approach to attributing correlation skill of dynamical GCM forecasts to statistical El Niño–Southern Oscillation (ENSO) teleconnection by using the coefficient of determination (R2). Specifically, observed precipitation is respectively regressed against GCM forecasts, Niño3.4 and both of them, and then the intersection operation is implemented to quantify the overlapping R2 for GCM forecasts and Niño3.4. The significance of overlapping R2 and the sign of ENSO teleconnection facilitate three cases of attribution, i.e., significantly positive anomaly correlation attributable to positive ENSO teleconnection, attributable to negative ENSO teleconnection and not attributable to ENSO teleconnection. A case study is devised for the Climate Forecast System version 2 (CFSv2) seasonal forecasts of global precipitation. For grid cells around the world, the ratio of significantly positive anomaly correlation attributable to positive (negative) ENSO teleconnection is respectively 10.8 % (11.7 %) in December–January–February (DJF), 7.1 % (7.3 %) in March–April–May (MAM), 6.3 % (7.4 %) in June–July–August (JJA) and 7.0 % (14.3 %) in September–October–November (SON). The results not only confirm the prominent contributions of ENSO teleconnection to GCM forecasts, but also present spatial plots of regions where significantly positive anomaly correlation is subject to positive ENSO teleconnection, negative ENSO teleconnection and teleconnections other than ENSO. Overall, the proposed attribution approach can serve as an effective tool to investigate the sources of predictability for GCM seasonal forecasts of global precipitation.
- Article
(6006 KB) - Full-text XML
-
Supplement
(3668 KB) - BibTeX
- EndNote


Precipitation is one of the most important hydrological variables and is an integral part of the global water cycle (Huffman et al., 2007; Ushio et al., 2009; Scofield and Kuligowski, 2003; Schneider et al., 2016; Beck et al., 2019). It plays a key role in driving hydrological processes at catchment, regional and continental scales (e.g., Yuan et al., 2014; Greuell et al., 2018; Robertson et al., 2013; Wu et al., 2014; Lakshmi and Satyanarayana, 2019). Despite the importance, the forecasting of precipitation remains a formidable task due to complex interactions of ocean, atmosphere and land surface processes (Doblas-Reyes et al., 2013; Zhao et al., 2019; Vano et al., 2014; Johnson et al., 2019; Tesfa et al., 2020). Comparing multiple sets of global temperature and precipitation forecasts from the North American Multi-Model Ensemble (NMME) experiment, Becker et al. (2020) highlighted that there have been substantial improvements in temperature forecasts over both land and ocean during the past decades and that there is still plenty of room for improvement of global precipitation forecasts.
Global climate models (GCMs) generate valuable forecasts of worldwide precipitation for hydrological modeling and water management (Kirtman et al., 2014; Doblas-Reyes et al., 2013; Schepen et al., 2020). Nowadays, GCMs have been employed by major climate centers around the world to produce operational climate outlooks (Demargne et al., 2014; Delworth et al., 2020). For example, the Climate Forecast System version 2 (CFSv2) of the US National Centers for Environmental Prediction (NCEP) has been implemented for coupled ocean–atmosphere forecasting since 2011 (Saha et al., 2010); the European Centre for Medium-Range Weather Forecasts (ECMWF) System 5 model became operational in 2017 (Johnson et al., 2019); and the Seamless System for Prediction and Earth System Research (SPEAR) became the next-generation modeling system at the Geophysical Fluid Dynamics Laboratory (GFDL) in 2020 (Delworth et al., 2020). In the meantime, GCM forecasts have been increasingly incorporated into forecasting systems of streamflow, crop yield and soil water, and they are shown to create enormous socioeconomic benefits (e.g., Vano et al., 2014; Peng et al., 2018; Wang et al., 2019).
Climate teleconnections, which are widely used in conventional statistical hydrological forecasting (Wang et al., 2020; Steinschneider and Lall, 2016; Mendoza et al., 2017; Lima and Lall, 2010; Mortensen et al., 2018), are an essential part of assessing the skill of GCM forecasts (Neelin and Langenbrunner, 2013). That is, a number of teleconnection patterns are usually investigated upon the issuance of a new set of GCM forecasts (Delworth et al., 2020; Jia et al., 2015; Kim et al., 2012). For example, El Niño–Southern Oscillation (ENSO) and Madden–Julian oscillation (MJO) have been investigated for CFSv2 forecasts (Saha et al., 2014). North Atlantic Oscillation (NAO), Arctic Oscillation (AO) and Pacific North American (PNA) teleconnections have been assessed for the Global Earth Observing System (GEOS) modeling and data assimilation system (Molod et al., 2020). ENSO and Pacific decadal oscillation (PDO) have been examined for GFDL-SPEAR forecasts (Delworth et al., 2020). It is generally found that skillful GCM forecasts are owing to effective formulations of teleconnection patterns (e.g., Merryfield et al., 2013; Jia et al., 2015; Delworth et al., 2020; Saha et al., 2014; Molteni et al., 2011).
There have been in-depth investigations of ENSO for GCM forecasts as it is one of the most prominent modes of climate variability (Fu et al., 1997; Wang et al., 2003; Feng and Hao, 2021). For example, the influence of ENSO on the East Asian–western Pacific climate was studied for CFSv2 forecasts (Yang and Jiang, 2014) and also for climate projections in the Coupled Model Intercomparison Project Phase 5 (Gong et al., 2015; Kim et al., 2016; Kim and Kug, 2018). The relationship between forecast skill and the state of sea surface temperatures (SSTs) was evaluated for the seasonal outlook of precipitation over the United States, and the skill was found to be dominantly attributed to ENSO in late autumn to late spring (Quan et al., 2006; Pegion and Kumar, 2013; Shin et al., 2019). Understanding the sources for predictability is important for physically based validations of GCM forecasts (Neelin and Langenbrunner, 2013; Manzanas et al., 2014; Shin et al., 2019). Nevertheless, previous studies tended to pay attention to regions subject to prominent ENSO influences (Vashisht et al., 2021; Kim et al., 2016; Rivera and Arnould, 2020). At the global scale, the attribution of GCM precipitation forecasts to ENSO teleconnection is yet to be conducted.
This paper is devoted to attributing correlation skill of dynamical CFSv2 forecasts (e.g., Saha et al., 2010; Yuan et al., 2011; Jia et al., 2015; Becker et al., 2020; Zhao et al., 2020a) to statistical ENSO teleconnection at the global scale. A novel approach based on set theory is devised to facilitate the attribution. With the coefficient of determination (R2) characterizing the ratio of explained variance and the set operations illustrating the overlapping R2, the significance test by grid cell is conducted by random permutations in order to identify where correlation skill is attributable to ENSO teleconnection. As will be demonstrated through the case study of CFSv2 forecasts, three cases are effectively revealed: (1) significantly positive anomaly correlation attributable to positive ENSO teleconnection, (2) significantly positive anomaly correlation attributable to negative ENSO teleconnection and (3) significantly positive anomaly correlation not attributable to ENSO teleconnection.
GCM forecasts comprise a typical high-dimensional dataset (Becker et al., 2020; Chen and Kumar, 2016; Kirtman et al., 2014; Saha et al., 2014; Zhao et al., 2020a). For the CFSv2 forecasts investigated in this paper, there are five dimensions: (1) forecast start time s, (2) lead time l, (3) ensemble size n, (4) latitude y and (5) longitude x. s represents the number of months since the benchmark time that is January 1982; l is the number of months ahead, which ranges from 0 to 9 month for the CFSv2 forecasts; n=1, …, 24; i.e., the total number of ensemble members is 24; y ranges from −90 to 90, while x is from 0 to 359, with a horizontal resolution of 1.0∘ latitude by 1.0∘ longitude. The set of forecasts is denoted by
in which f represents forecast values specified by the five dimensions, and F is the dataset of forecasts.
There are three dimensions for the dataset of observed precipitation corresponding to forecasts (Infanti and Kirtman, 2015; Xie et al., 2007; Schneider et al., 2016). They are target time t, which is equal to the sum of start time s and lead time l to align observations with forecasts; latitude y; and longitude x. The set of observed precipitation corresponding to the forecasts is denoted as
The NOAA Climate Prediction Center (CPC) global daily Unified Rain-gauge Database (CPC-URD), which has been widely used in the analysis of regional and global precipitation (Chen et al., 2008), is used as the referenced observed precipitation.
Correlation skill, which is in the form of Pearson's correlation coefficient, is calculated so as to relate CFSv2 precipitation forecasts to CPC-URD observations:
In Eq. (3), k represents the target year (k=1982, 1983, …, 2010), where the other dimensions of o and f are omitted for the sake of simplicity. The value of r(o,f) measures how well CFSv2 forecasts correspond to observed precipitation. A significantly positive r(o,f) implies that large (small) forecasts are indicative of large (small) observations, whereas a neutral or negative r(o,f) indicates non-skillful forecasts (Zhao et al., 2020a, b; Yuan et al., 2011).
It is noted that forecasts/observations, which are monthly, are aggregated by season. The aggregation is meant to facilitate the analysis at the seasonal timescale. Attention is paid to the latest forecasts. That is, seasonal precipitation forecasts generated at the beginning of the season are investigated. For example, the December–January–February (DJF) forecasts are generated at the beginning of December. Similarly, seasonal forecasts for March–April–May (MAM), June–July–August (JJA) and September–October–November (SON) are respectively produced at the start of March, June and September.
The concurrent correlation between Niño3.4 and CPC-URD observations is employed to represent ENSO teleconnection (Kim and Kug, 2018; Cai et al., 2009; Steptoe et al., 2018):
Niño3.4 is a commonly used index of ENSO (Mason and Goddard, 2001; Vashisht et al., 2021; Chen and Kumar, 2020). The sign of r(o, Niño3.4) indicates the effects of ENSO. A positive r(o, Niño3.4) means that high (low) values of Niño3.4 correspond to large (small) values of observed precipitation; i.e., El Niño events are associated with wet conditions, whereas La Niña events relate to dry conditions. By contrast, a negative r(o, Niño3.4) indicates that high (low) values of Niño3.4 coincide with below-normal (above-normal) precipitation.
3.1 Mathematical formulation
The approach to attributing correlation skill of GCM seasonal forecasts to ENSO teleconnection is built upon the coefficient of determination, i.e., R2 (Koster et al., 2010). Mathematically, R2 is equivalent to the squared value of Pearson's correlation coefficient r (Krause et al., 2005):
There is a difference in the meanings of r in relating observed precipitation to forecasts and ENSO. As for forecasts, r tends to be positive; i.e., high (low) values of forecasts can be indicative of high (low) values of observations (Zhao et al., 2020a, b; Yuan et al., 2011). However, ENSO teleconnection can be either positive or negative. For example, in DJF, positive r(o, Niño3.4) tends to be dominant over southern North America, and negative r(o, Niño3.4) is generally prevalent over northern South America (Mason and Goddard, 2001).
Both positive and negative correlations contribute to R2. R2 is respectively derived for forecasts and ENSO in relating them to observed precipitation. Specifically, simple linear regression models are set up to regress observed precipitation respectively against GCM forecasts and Niño3.4:
where β1 and β2 are the regression coefficients; ϵ1 and ϵ2 are the residuals; and k represents the target year. Further, through bivariate linear regression, the variance explained by the union of forecasts and Niño3.4 is calculated:
in which the union operator is introduced to represent the joint effect. If GCM forecasts were independent from Niño3.4, then could conceptually be obtained by simply adding up R2(o∼f) and R2(o∼Niño3.4). On the other hand, if GCM forecasts were dependent on Niño3.4, then there would be some overlaps for R2(o∼f) and R2(o∼Niño3.4). As a result, would not be as large as the sum of R2(o∼f) and R2(o∼Niño3.4).
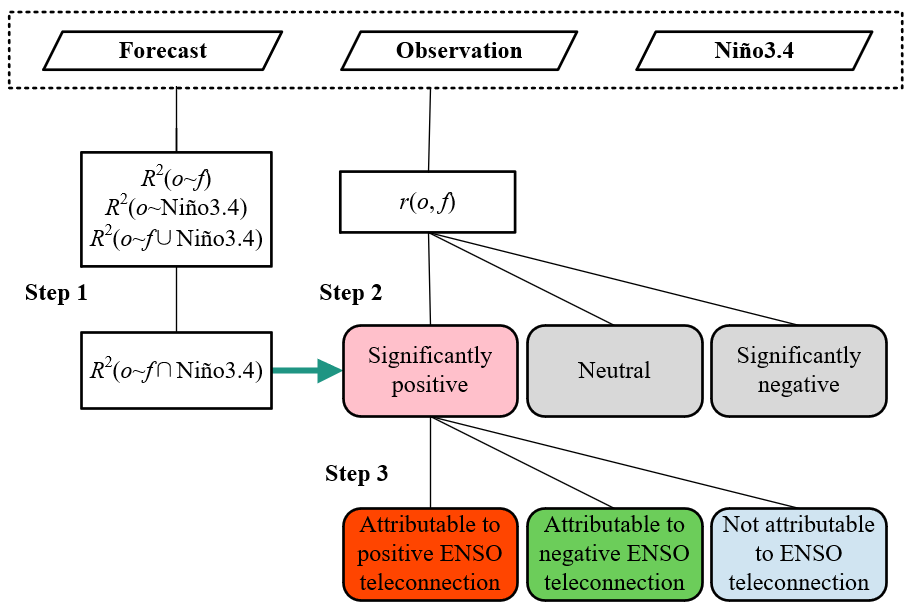
Figure 1Flowchart of the three steps that attribute significantly positive anomaly correlation of dynamical GCM forecasts to statistical ENSO teleconnection.
According to set theory, the intersection between R2(o∼f) and R2(o∼Niño3.4) is derived by subtracting from the sum of R2(o∼f) and R2(o∼Niño3.4):
in which the intersection operator is introduced to formulate the overlapping R2 between forecasts and Niño3.4. Specifically, the value of quantifies the overlapping part of the explained variance of observed precipitation accounted for by both GCM forecasts and Niño3.4.
3.2 Attribution of correlation skill
There are three steps to attributing correlation skill of GCM forecasts to ENSO teleconnection. As shown in Fig. 1, the first step is the implementation of three linear regression models to derive R2(o∼f), R2(o∼Niño3.4) and so as to derive . In the absence of a theoretical distribution function for the overlapping R2, the significance is tested by randomly permutating GCM forecasts and Niño3.4 1000 times under the null hypothesis that observed precipitation was independent from either GCM forecasts or Niño3.4. In this way, is tested to examine whether the overlapping R2 between f and Niño3.4 is significant.
Secondly, the significance of correlation coefficient is calculated for GCM forecasts in relating them to global precipitation. Specifically, r(o,f) is obtained for each grid cell over global land. The two-tailed significance test is implemented, and r(o,f) is therefore identified to be significantly positive, neutral or significantly negative. In this paper, the significance levels in the first and second steps are set to be 0.10.
The third step focuses on significantly positive r(o,f) that indicates informative forecasts (Becker et al., 2020; Zhao et al., 2020a, b). There are two criteria: (1) the significance of overlapping R2 and (2) the sign of ENSO teleconnection. Overall, three cases are obtained: (1) significantly positive anomaly correlation attributable to positive ENSO teleconnection, (2) significantly positive anomaly correlation attributable to negative ENSO teleconnection and (3) significantly positive anomaly correlation not attributable to ENSO teleconnection.
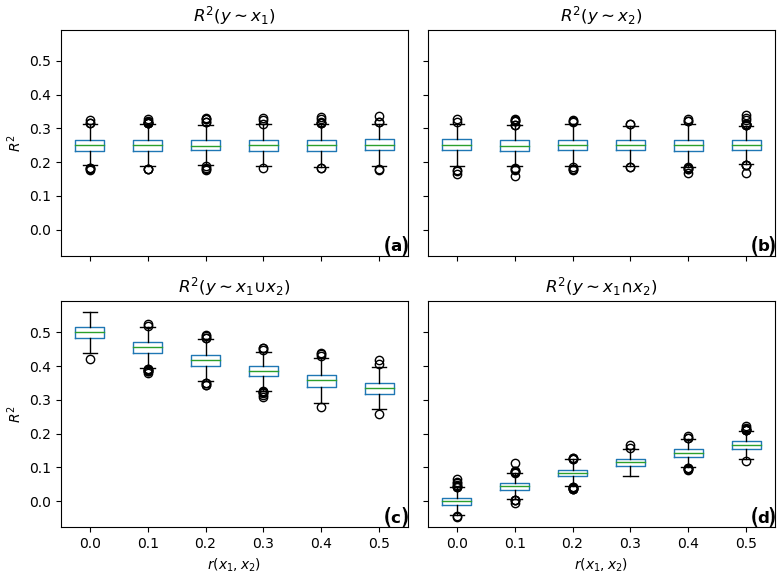
Figure 2Box plots of coefficient of determination (R2) for (a) R2(y∼x1), (b) R2(y∼x2), (c) and (d) in the Monte Carlo experiments.
3.3 An illustrative example
An example based on synthetic data is devised to illustrate how the overlapping R2 for the response variable y is influenced by the association between two explanatory variables x1 and x2. Samples of x1, x2 and y are randomly drawn from a trivariate normal distribution
where μ and Σ are the mean vector and covariance matrix, respectively:
In the example, the correlations of y with x1, x2 are fixed to be 0.5 respectively. As a result, the focus is on r(x1,x2) that determines the intersection between x1 and x2. The value of r(x1,x2) is set to be 0.0, 0.1, 0.2, 0.3, 0.4 and 0.5. For each pre-specified r(x1,x2), 1000 samples of x1, x2 and y are drawn to facilitate linear regression models to derive R2(y∼x1), R2(y∼x2), and . For R2, the median and interquartile ranges are estimated through 1000 Monte Carlo experiments.
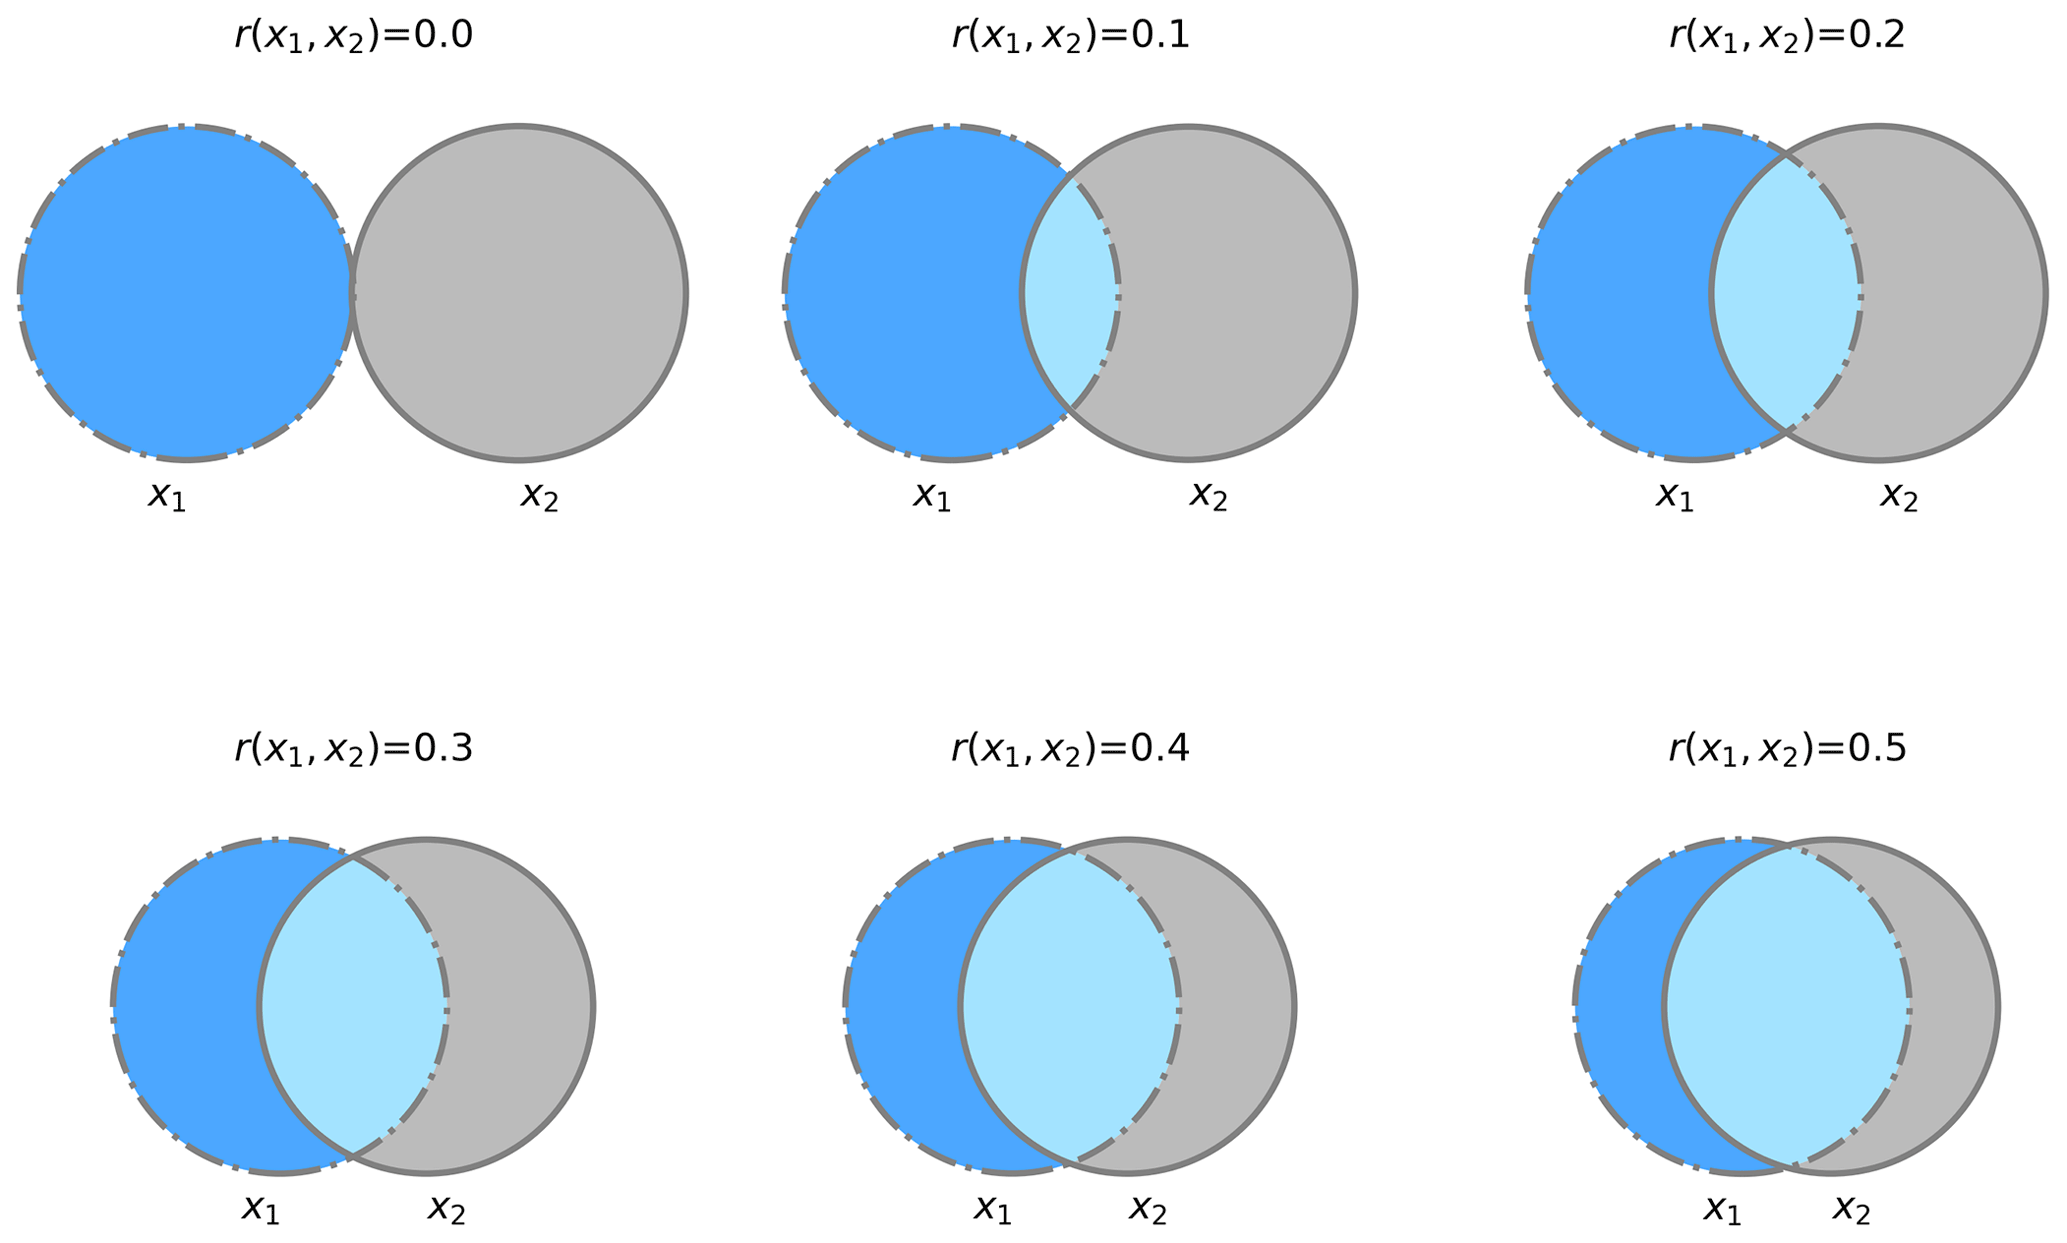
Figure 3Venn diagrams for the variance of y explained by x1 and x2 given six levels of correlation between x1 and x2.
Figure 2 illustrates the influences of r(x1,x2) on R2(y∼x1), R2(y∼x2), and . Figure 2a and b show that the median values of R2(y∼x1) and R2(y∼x2) approximate the squared value of pre-specified r(y,x1) and r(y,x2). That is, they remain around 0.25, i.e., 0.52, as r(x1,x2) increases from 0.0 to 0.5. The indication is that the change in correlation between forecasts and Niño3.4 does not influence the amount of information that they respectively provide for observed precipitation. By contrast, Fig. 2c shows that , which represents the ratio of variance explained by the union of x1 and x2, decreases with the increase of r(x1,x2). This phenomenon coincides with the increase of with r(x1,x2).
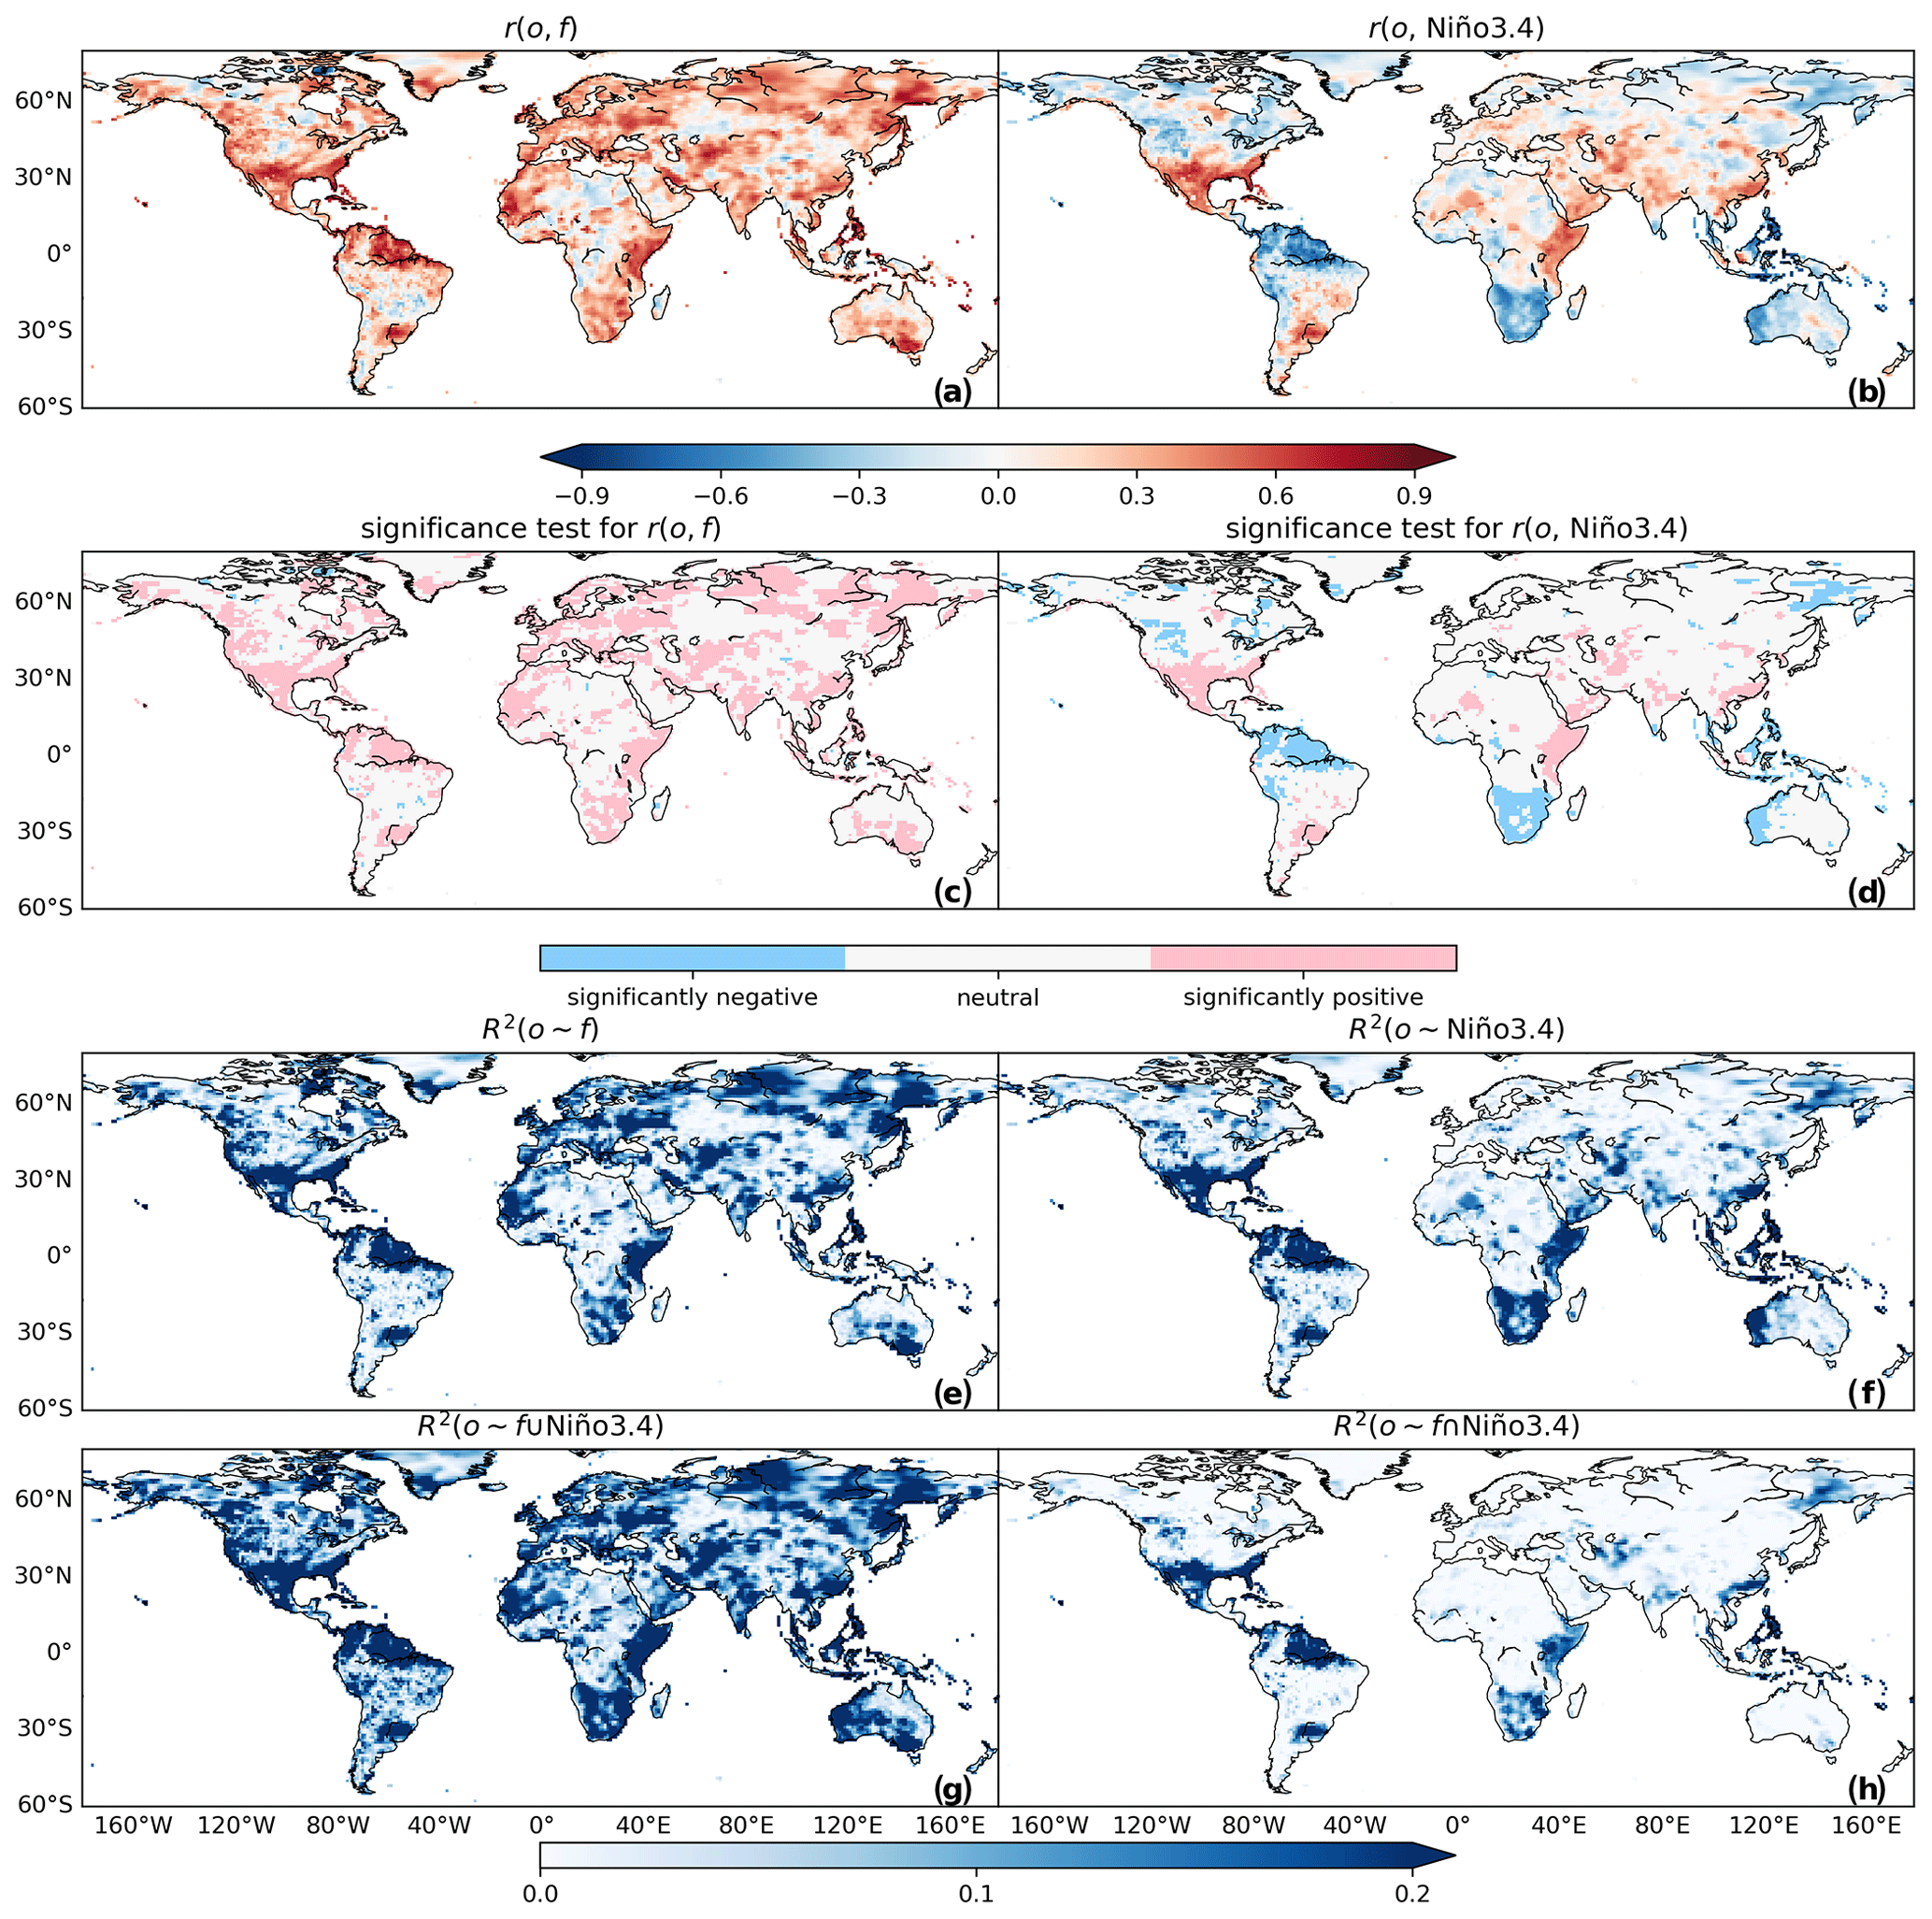
Figure 4Correlation coefficients between observed precipitation in DJF with (a) 0-month lead CFSv2 forecasts generated at the beginning of December and (b) concurrent Niño3.4. Significance tests of correlation for (c) CFSv2 forecasts and (d) Niño3.4. Coefficient of determination (R2) for the regression of observed precipitation against (e) CFSv2 forecasts, (f) Niño3.4, (g) the union of CFSv2 forecasts and Niño3.4 and (h) the intersection of CFSv2 forecasts and Niño3.4.
Figure 3 further shows the influence of r(x1,x2) using a Venn diagram that illustrates the extent to which R2(y∼x1) and R2(y∼x2) intersect. The intersection is represented by the overlapping area between the two circles. From this figure, it can be seen that it is the correlation between x1 and x2 that leads to the decrease of and the increase of . For global precipitation forecasting, the intersection reflects the overlapping R2 for GCM forecasts and ENSO teleconnection. Figure 3 suggests that the correlation between GCM forecasts and Niño3.4 would lead to a decrease of total information and an increase of overlapping information.
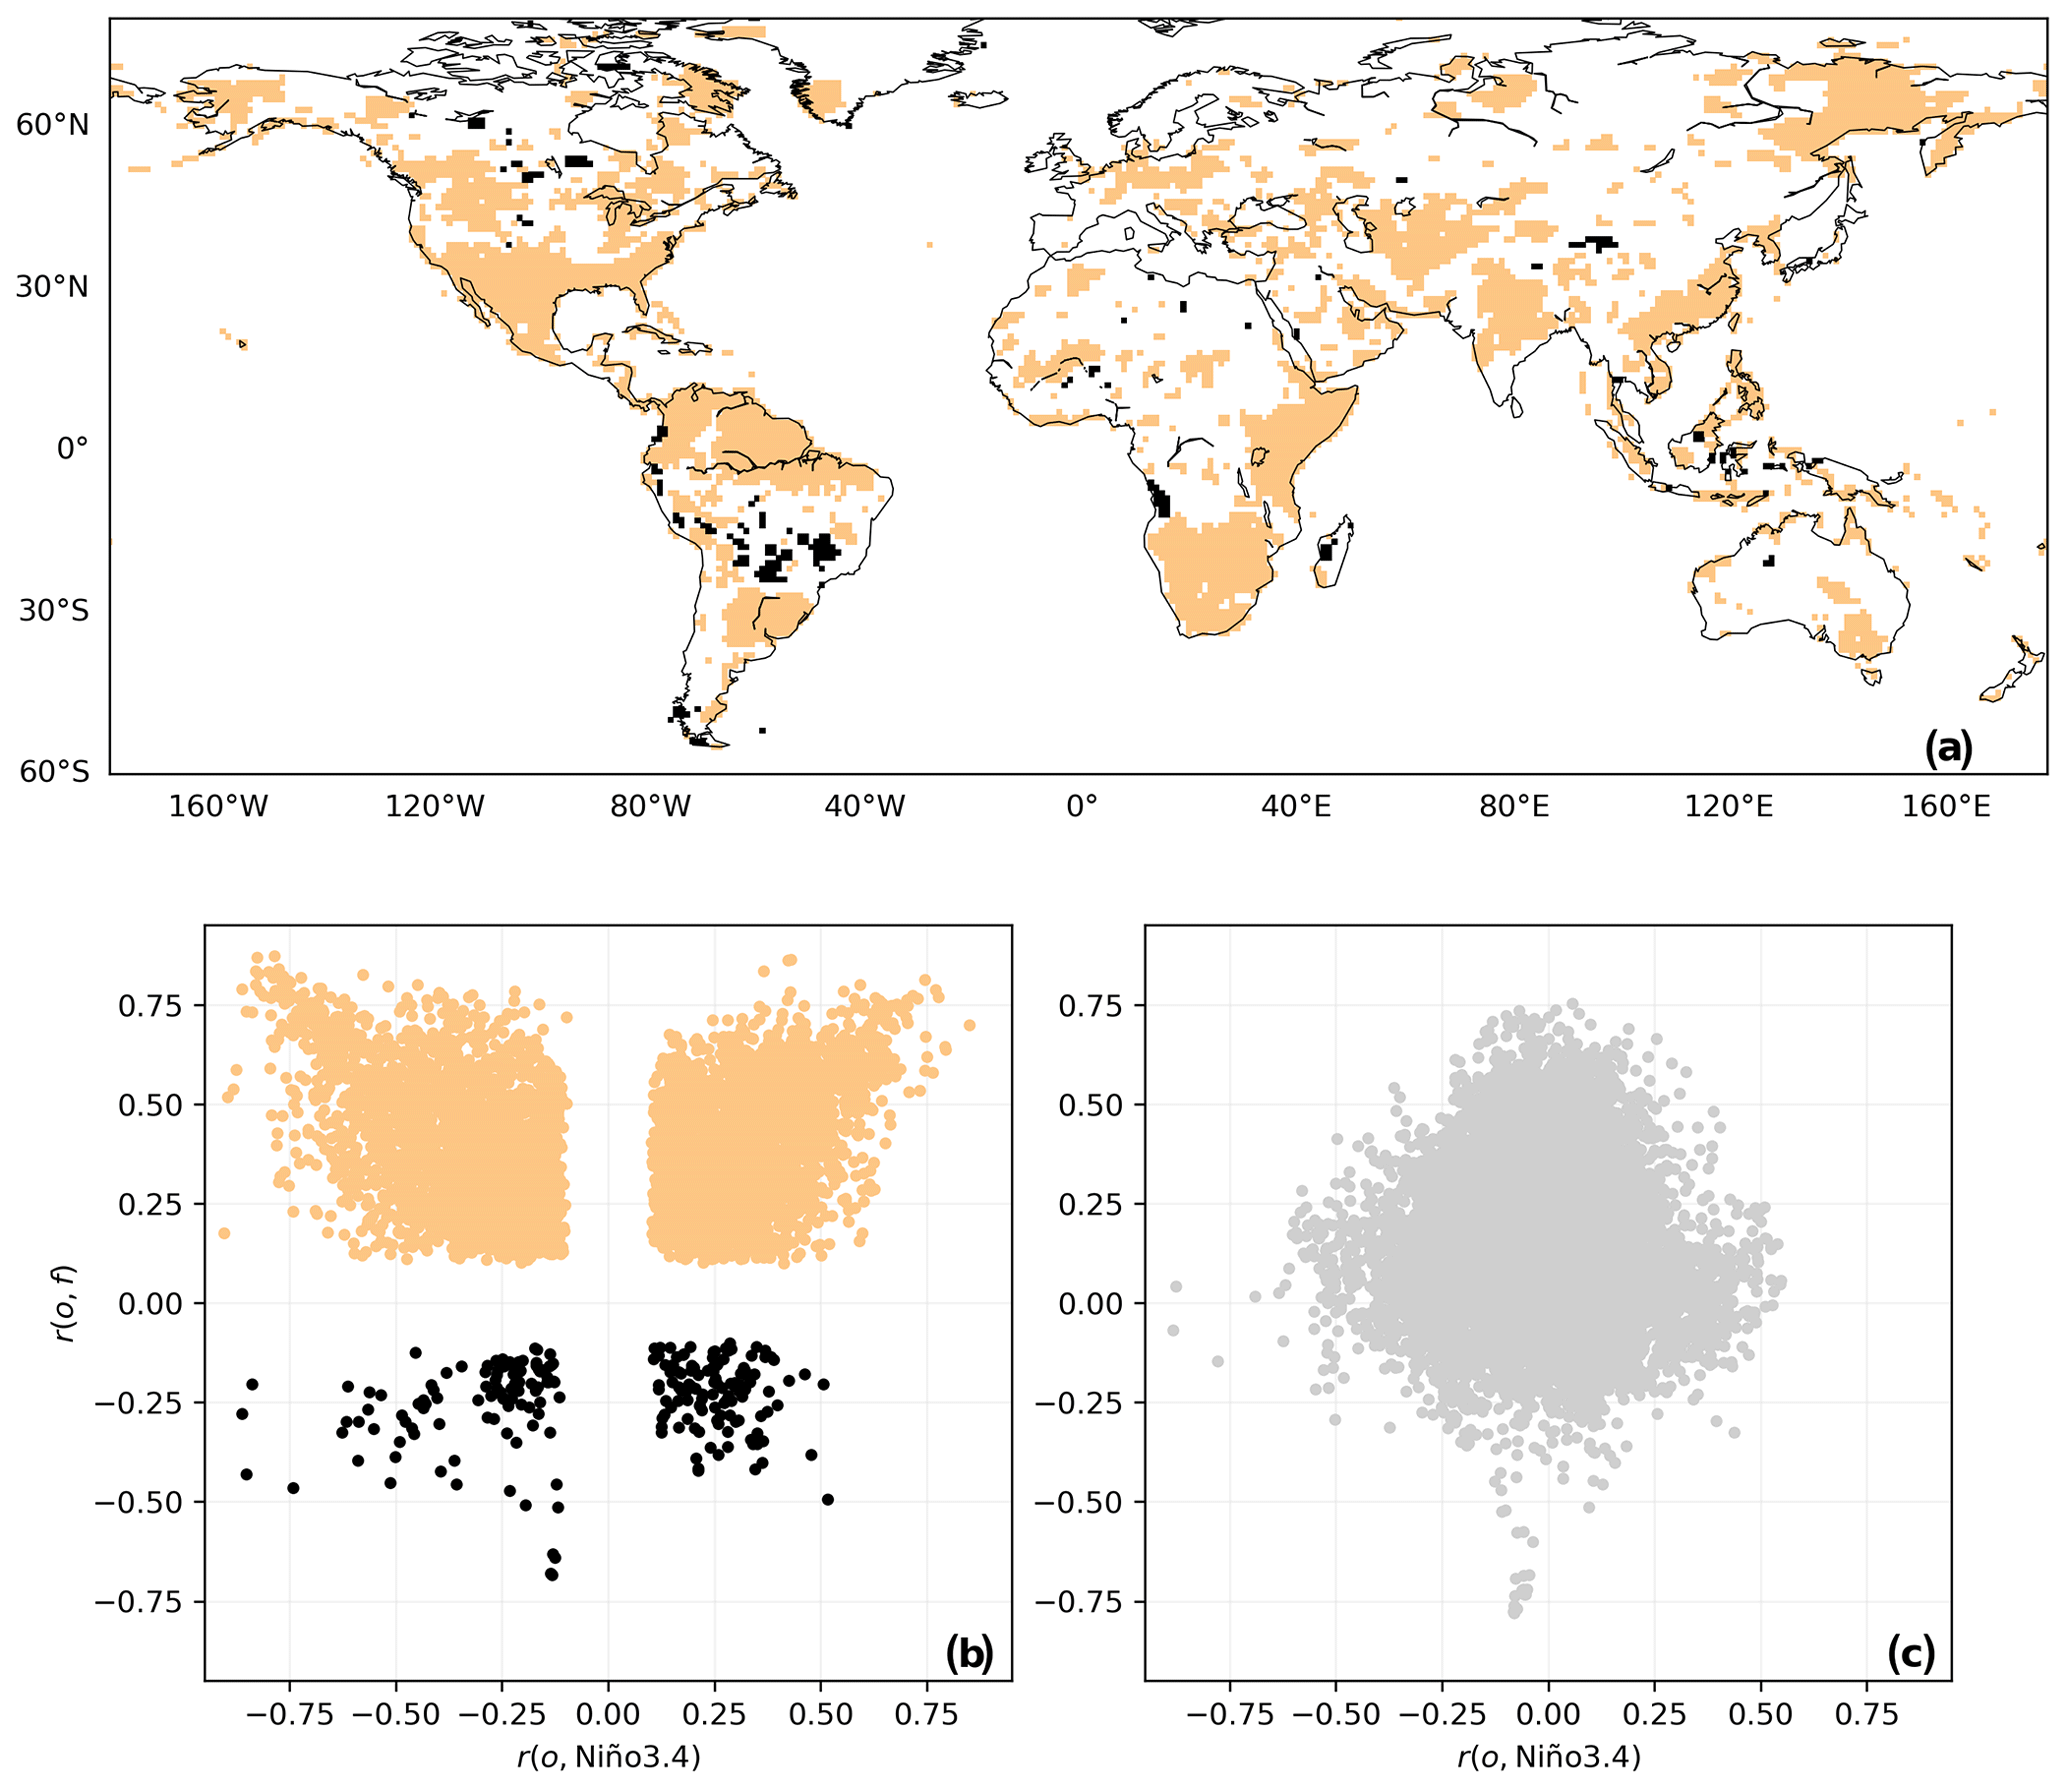
Figure 5(a) Spatial distribution of grid cells with significant overlapping R2 for CFSv2 forecasts generated in December and Niño3.4 in DJF. Scatter plots of anomaly correlation against ENSO teleconnection for grid cells (b) with significant overlapping R2 and (c) with non-significant overlapping R2. Grey points in panel (c) are marked in white in panel (a).
4.1 Correlation skill and ENSO teleconnection in DJF
Global maps of correlation skill and ENSO teleconnection in DJF, which is the peak season of ENSO, are shown in the upper part of Fig. 4. In Fig. 4a, correlation skill is observed to be largely positive, indicating that CFSv2 forecasts are skillful in general (Saha et al., 2010). In Fig. 4b, ENSO teleconnection exhibits both positive and negative values. That is, observed precipitation around the world can be positively or negatively correlated with Niño3.4 (Mason and Goddard, 2001; Vashisht et al., 2021; Chen and Kumar, 2020). The two-tailed significance test is applied to anomaly correlation and ENSO teleconnection at each grid cell. Figure 4c illustrates that correlation skills of CFSv2 forecasts are significantly positive over extensive areas around the globe. Moreover, Fig. 4c is observed to correspond to Fig. 4d to some extent – significantly positive correlation appears over southern North America and East Africa in both Fig. 4c and d. In addition, significantly positive anomaly correlation (Fig. 4c) corresponds to significantly negative ENSO teleconnection (Fig. 4d) in northern South America, southern Africa and southeast Asia.
The results of simple linear regressions that lay the foundation for the attribution analysis are shown in Fig. 4e to h. Figure 4e and f, which are respectively for CFSv2 forecasts and Niño3.4, respectively conform to Fig. 4a and b. This outcome is due to R2 being mathematically equal to the squared value of the correlation coefficient (Krause et al., 2005). The union in Fig. 4g exhibits a higher value of R2 than that in either Fig. 4e or f. The subtraction of the union from the sum facilitates the intersection. As illustrated in Fig. 4h, dark blue grid cells are seen to distribute in southern North America, northern South America, East Africa, southern Africa and southeast Asia. Over these regions, both GCM forecasts and the Niño3.4 index can explain a considerable ratio of the variance of observed precipitation (Fig. 4e and f). More importantly, their explained variances intersect (Fig. 4h).
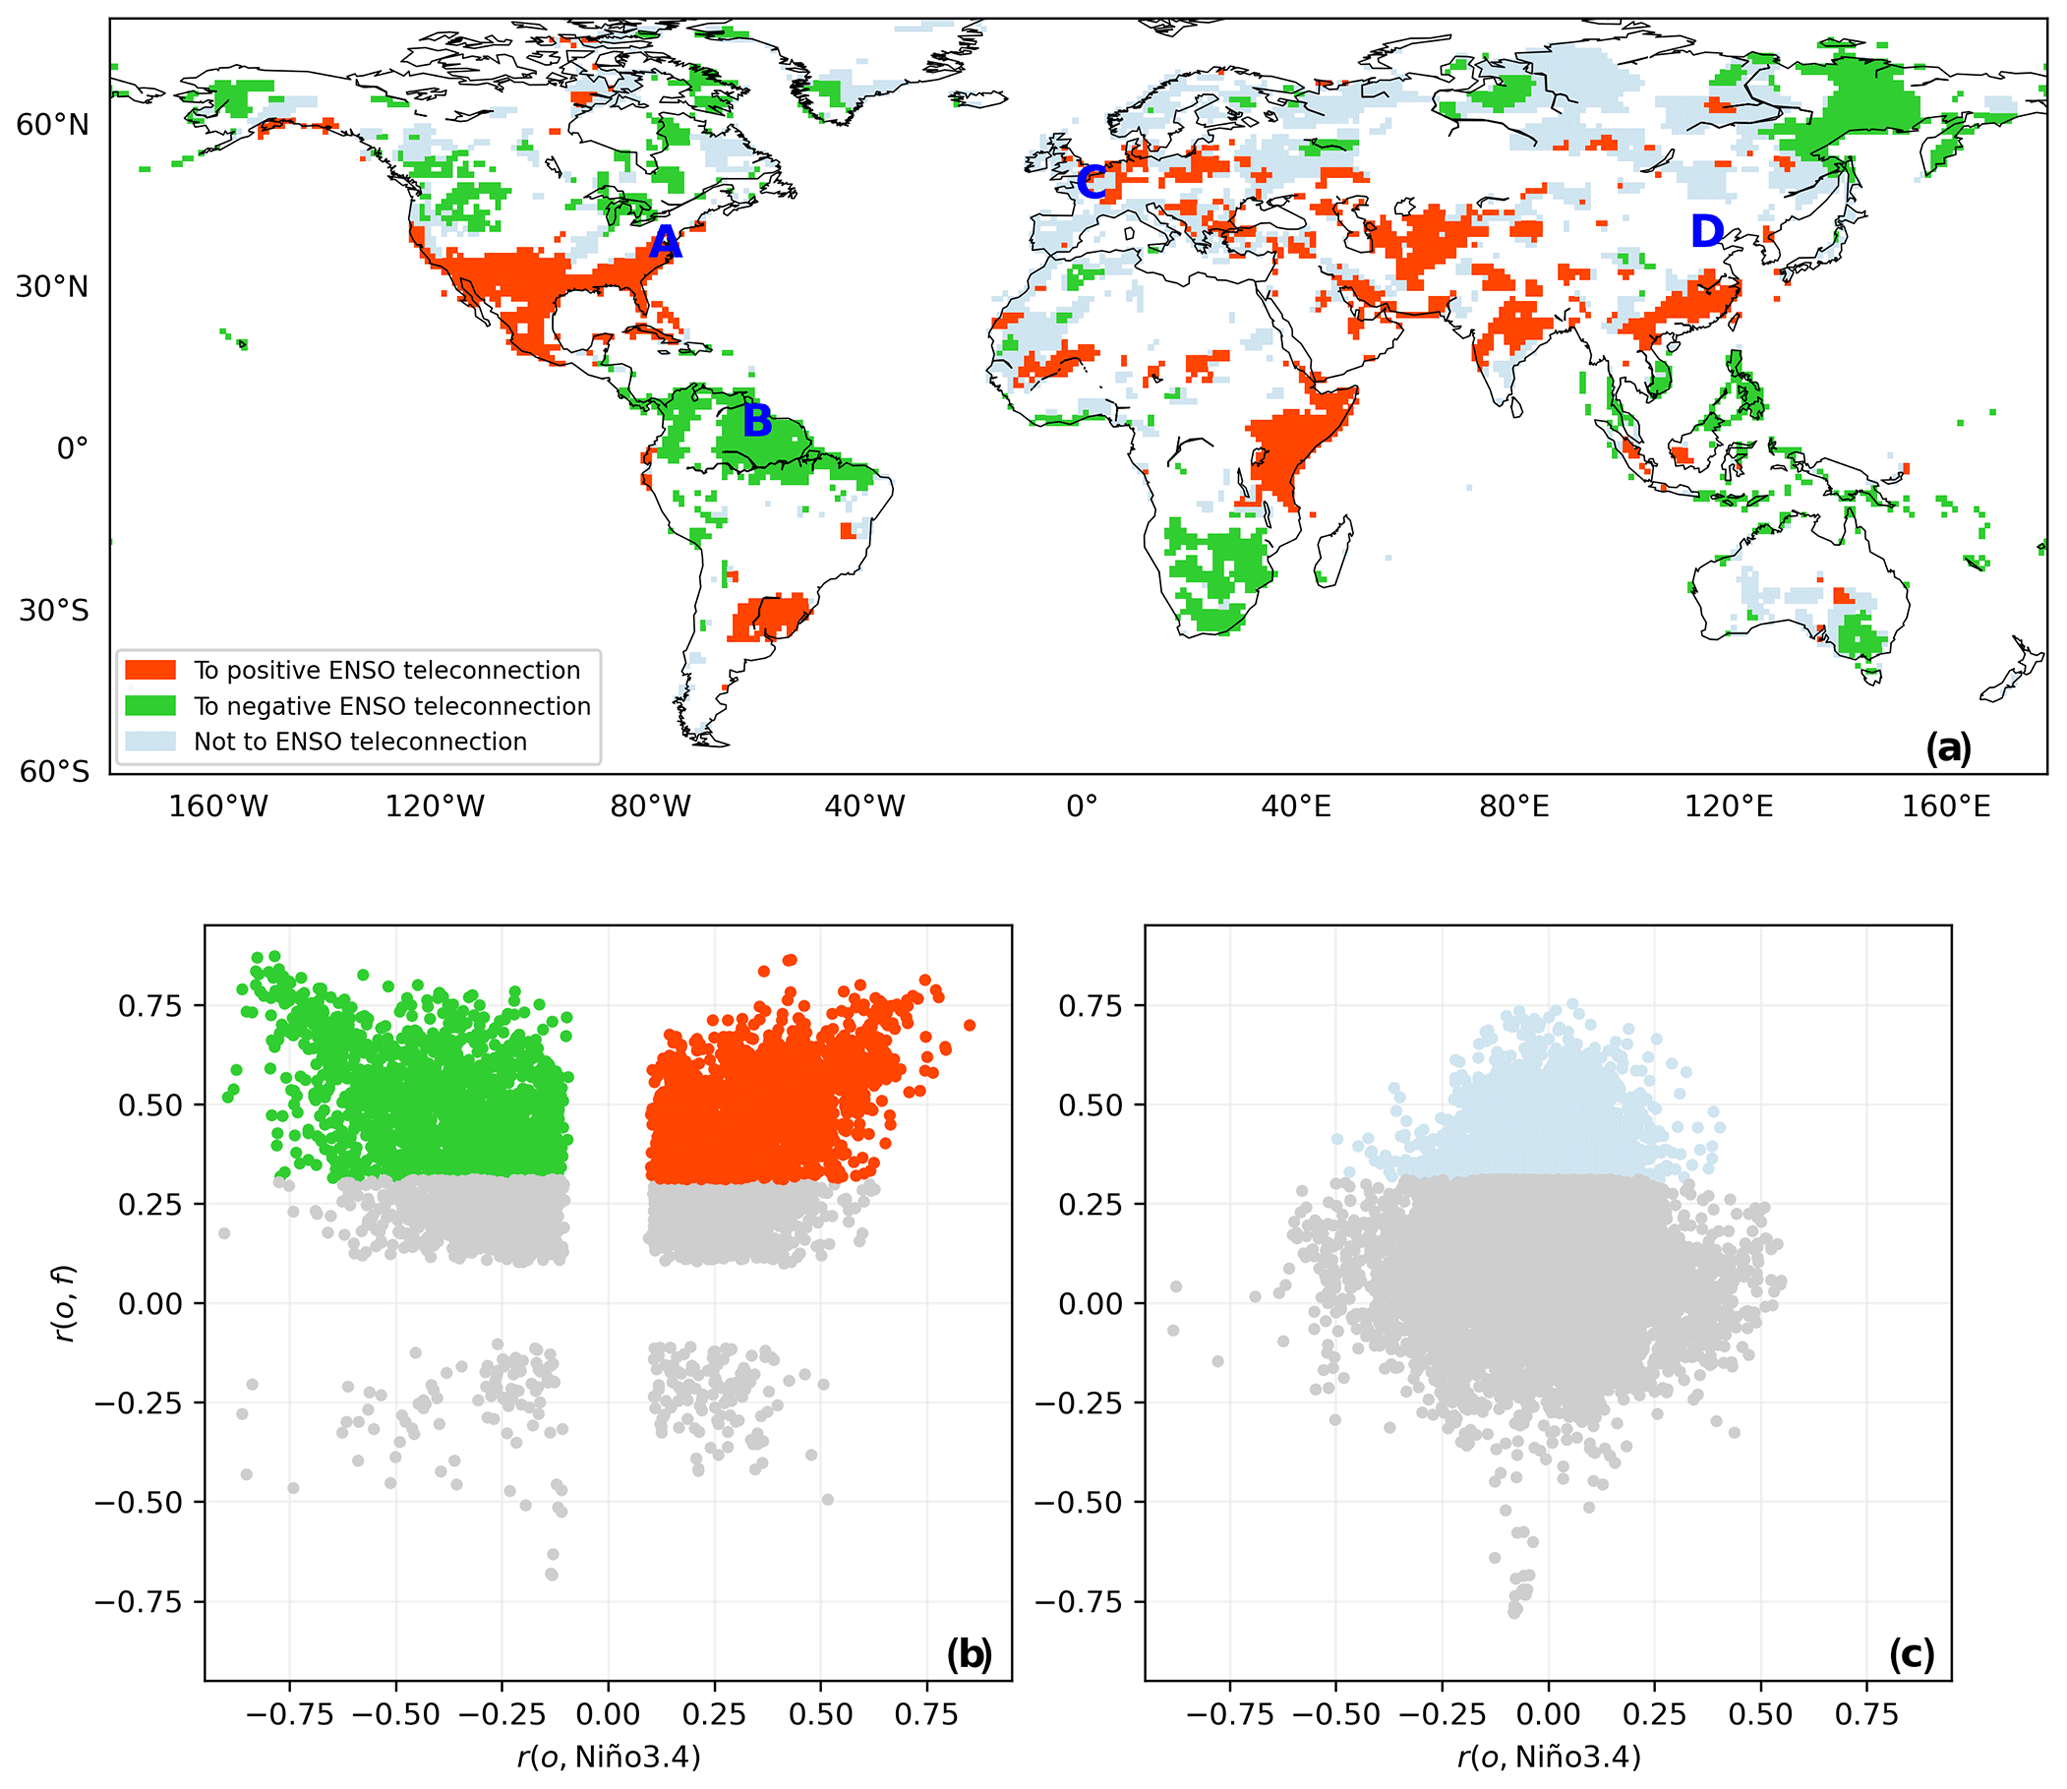
Figure 6(a) Spatial distribution of grid cells for the three cases attributing anomaly correlation of CFSv2 forecasts to ENSO teleconnection. Scatter plots of anomaly correlation against ENSO teleconnection for grid cells (b) with significant overlapping R2 and (c) without significant overlapping R2. Grey points in panels (b) and (c) are marked in white in panel (a). Four grid cells are selected and labeled with capital letters from panel (a) for the subsequent analysis of the attribution of CFSv2 forecasts to ENSO teleconnection.
4.2 Attribution at the global scale
The significance of the overlapping R2 for CFSv2 forecasts and Niño3.4 is shown in Fig. 5. In Figure 5a, grid cells with significant overlapping R2 are marked in orange. The corresponding anomaly correlation and ENSO teleconnection, which are respectively obtained from Fig. 4a and b, are illustrated using the scatter plot in Fig. 5b. The scatter points tend to fall towards the upper right and left corners of the plot. The implication is that both anomaly correlation and ENSO teleconnection ought to be large enough to facilitate a significant intersection. Largely owing to overlapping R2, anomaly correlation is observed to increase with the increase of positive ENSO teleconnection and also with the decrease of negative ENSO teleconnection. For Fig. 5b, there are notably some outliers that suggest ENSO teleconnection could contribute to negative anomaly correlation. CFSv2 forecasts are generally wrong in these cases, and the potentially problematic grid cells are marked in black in Fig. 5a. Further, the scatter plot in Fig. 5c is for grid cells where overlapping R2 is non-significant. For a fair number of grid cells, anomaly correlation can rise above 0.50, but ENSO teleconnection remains at nearly 0.00. The implication is that the corresponding anomaly correlation is not relevant to ENSO teleconnection.
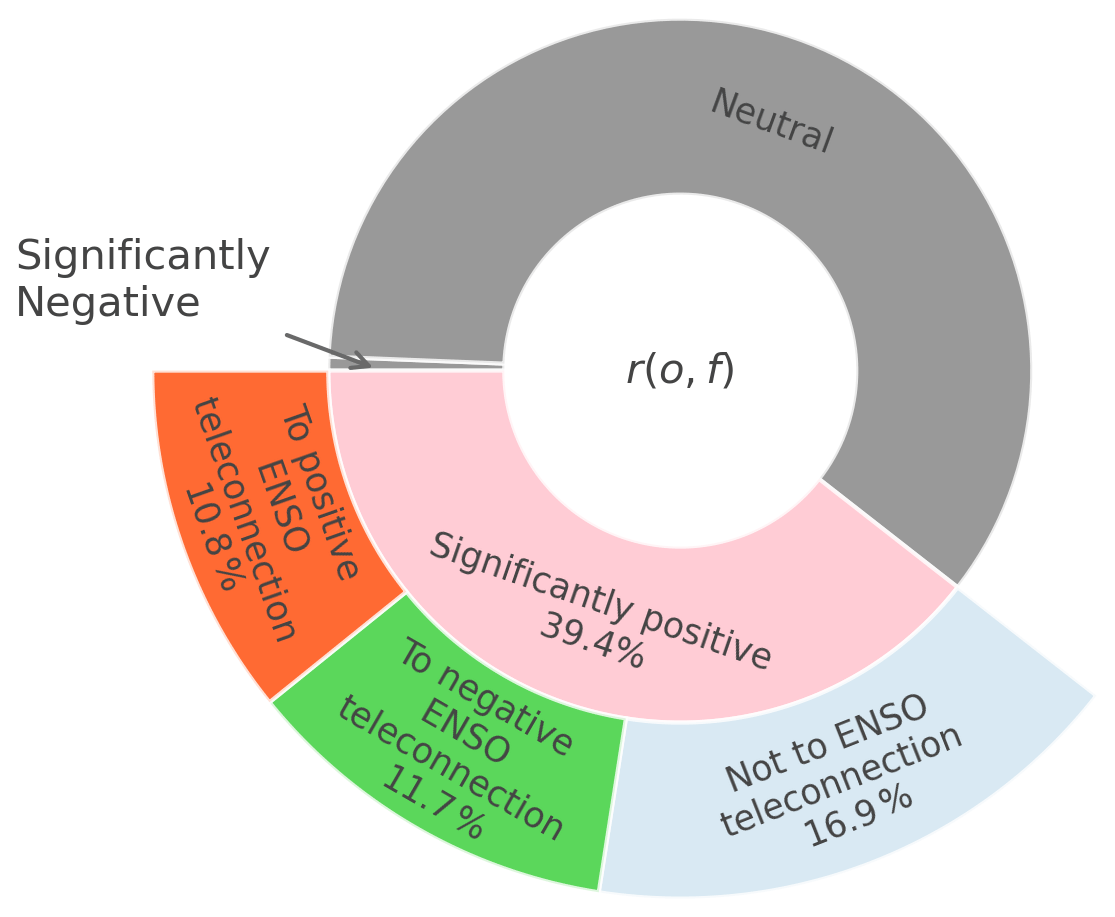
Figure 7Sunburst diagram of the attribution of significantly positive anomaly correlation to ENSO teleconnection for CFSv2 forecasts in DJF.
Figure 6 presents the three cases of attribution of significantly positive anomaly correlation. The red color marks grid cells where significantly positive anomaly correlation is attributable to positive ENSO teleconnection. Some corresponding grid cells are observed in regions of known positive ENSO teleconnections, such as southern North America (Strazzo et al., 2019) and equatorial eastern Africa (Vashisht et al., 2021); and some are in less-investigated regions, such as parts of central, southern and eastern Asia. The green color indicates grid cells where significantly positive anomaly correlation is attributable to negative ENSO teleconnection. They appear in northern South America and southern Africa, where negative ENSO teleconnection is known to exist (Cai et al., 2020; Howard et al., 2019) and also in parts of Far East and Alaska. There are also grey areas where significantly positive anomaly correlation is not attributable to ENSO teleconnection. The corresponding grid cells are generally located in Europe, North Asia, northwestern Africa and southern Australia. Therein, skillful forecasts can relate to teleconnections other than ENSO, such as AO and NAO (Minami and Takaya, 2020).
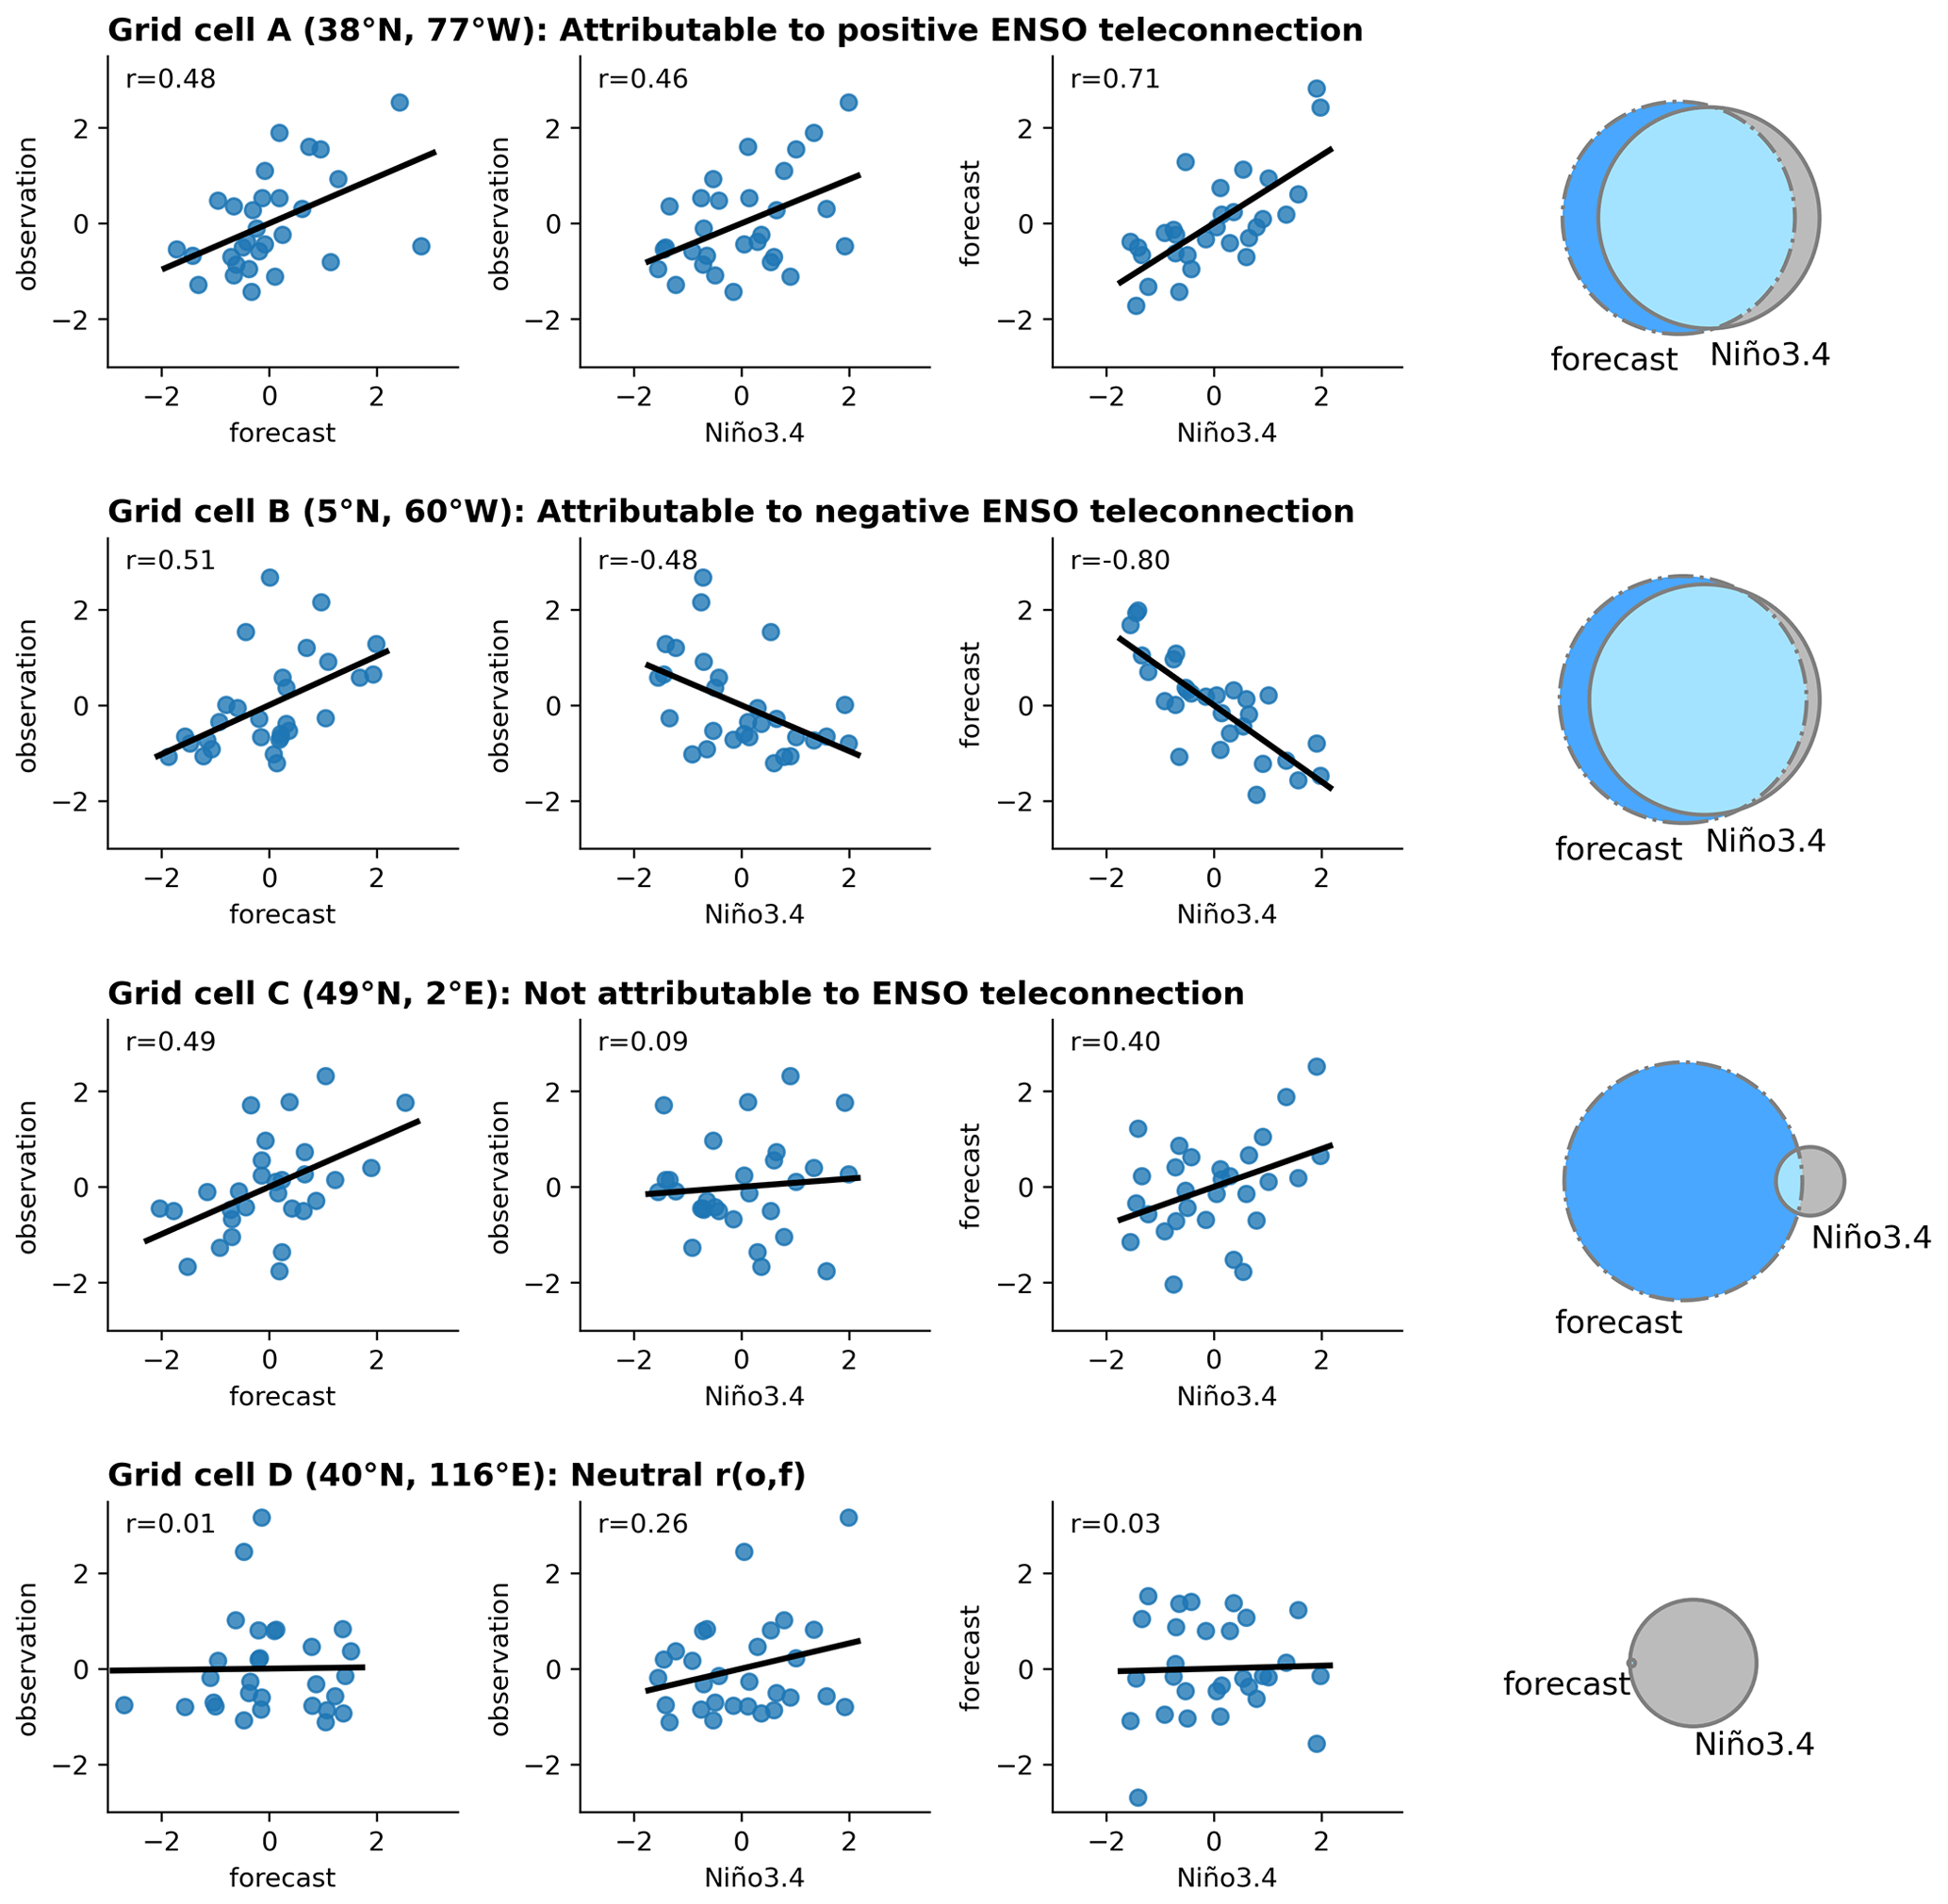
Figure 8Scatter plots of the relationships between normalized observation, forecast and Niño3.4 and Venn diagrams of the union and intersection operations for four selected grid cells.
Figure 7 presents a sunburst diagram that quantifies the percentages of significantly positive anomaly correlation and its attribution results. As shown by the central cycle, anomaly correlation is identified to be significantly positive, neutral or significantly negative (Zhao et al., 2020a, b). The grey segment suggests that more than half of grid cells around the globe are of neutral anomaly correlation, indicating that GCM precipitation forecasts still have plenty of room for improvement (Delworth et al., 2020; Jia et al., 2015; Kim et al., 2012). The pink segment indicates that 39.4 % of the grid cells exhibit significantly positive anomaly correlation. There are three cases of attribution for significantly positive anomaly correlation. The results are shown by the extended segments, of which the color scheme is the same as that of Fig. 6. It can be seen that significantly positive anomaly correlation is attributable to positive (negative) teleconnections for 10.8 % (11.7 %) of grid cells around the globe. Furthermore, significantly positive anomaly correlation is not attributable to ENSO teleconnection for 16.9 % of grid cells around the globe.
4.3 Attribution for selected grid cells
Four grid cells are selected from Figure 6a to showcase the attribution of CFSv2 forecasts to ENSO teleconnection. As is illustrated in the Methods section, there are three variables under investigation. They are observed precipitation, forecast precipitation and Niño3.4. Their values are normalized, i.e., subtracting the mean and dividing by the standard deviation, to facilitate the intercomparison of results across the four grid cells. In Fig. 8, the first column plots normalized observation against normalized forecast; the second column plots normalized observation against normalized Niño3.4; and the third column plots normalized forecasts against normalized Niño3.4. Furthermore, the last column of Fig. 8 presents the Venn diagrams illustrating the set operation of intersection.
Grid cell A shown in the first row of Fig. 8 presents the case of significantly positive anomaly correlation attributable to positive ENSO teleconnection. The coordinates of the grid cell are 38∘ N, 77∘ W. In southern North America, DJF precipitation is known to be modulated by the ENSO-induced Pacific North American (PNA) pattern (Jong et al., 2021). Specifically, in southern North America, PNA tends to cause an enhanced DJF Pacific jet stream that extends further east than normal during El Niño events, and there are nearly reversed patterns during La Niña events. Since the jet stream determines the paths of DJF storms, the PNA pattern enables ENSO to affect precipitation in southern North America. It can be seen that forecasts exhibit a high correlation with Niño3.4. This result suggests that CFSv2 forecasts can reasonably represent the influence of ENSO. As a result, R2 explained by forecasts and Niño3.4 largely overlap in grid cell A.
Grid cell B shown in the second row of Fig. 8 is for the case of significantly positive anomaly correlation attributable to negative ENSO teleconnection. Its coordinates are 5∘ N, 60∘ W. In DJF, there is a negative ENSO teleconnection over northern South America; it is owing to ENSO-related SSTs driving changes in the climatological Walker circulation that promotes anomalous descending (ascending) motion and contributes to negative (positive) precipitation anomalies in El Niño (La Niña) events (Kayano and Andreoli, 2006). The high correlation between forecasts and Niño3.4 highlights the effectiveness of CFSv2 in capturing the negative ENSO teleconnection. There is a considerable intersection between the variability explained by forecasts and Niño3.4 in grid cell B. It is noted that some similarities in the Venn diagrams are observed for grid cells A and B, at which ENSO teleconnection is respectively positive and negative. Specifically, r(o, Niño3.4) is respectively 0.46 and −0.48 at grid cells A and B. R2 that is the focus of the Venn diagrams mathematically represents the squared value of the correlation coefficient. Therefore, the similar Venn diagrams highlight that both positive and negative ENSO teleconnection can contribute to correlation skill.
Grid cell C displayed in the third row of Fig. 8 is for the case of significantly positive correlation not attributable to ENSO teleconnection. Its coordinates are 49∘ N, 2∘ E. The remote influence of ENSO on Europe has pathways through the North Atlantic or Arctic regions, including the tropospheric and stratospheric bridges (Butler et al., 2014). However, the amplitude of ENSO impacts is weak and generally not significant in the European region (Butler et al., 2014). In addition, DJF precipitation in Europe is known to be modulated by the NAO (Greuell et al., 2018), the Eurasian snow cover extent and the Quasi-biennial Oscillation (Butler et al., 2014). It can be seen that while observed precipitation shows a neutral correlation with Niño3.4, CFSv2 forecasts explain a substantial fraction of observed precipitation variability. This result indicates the capability of CFSv2 in capturing teleconnection patterns other than ENSO.
Grid cell D shown in the last row of Fig. 8 represents the case of neutral anomaly correlation. The coordinates are 40∘ N, 116∘ E. Over East Asia, precipitation is known to be influenced by the response of Rossby waves to ENSO (Yang et al., 2018). Also, winter monsoon activities in East Asia are profoundly influenced by wind–SST–evaporation feedbacks over tropical central Pacific to northwestern Pacific (Kim and Kug, 2018). It can be observed that there is a moderate but not significant correlation between observed precipitation and Niño3.4. However, CFSv2 forecasts exhibit a neutral anomaly correlation, suggesting that the information of ENSO teleconnection is not represented in the forecasts.
4.4 Extended analysis of the other seasons
The attribution analysis is further extended to the other seasons, i.e., MAM, JJA and SON. Global maps of the three cases of attribution are illustrated by season in Fig. 9 and also in Figs. S1 to S6 in the Supplement. Overall, the results of attribution vary considerably across the four seasons. This is generally owing to the fact that ENSO teleconnection varies by season (Kim and Kug, 2018; Steptoe et al., 2018; Wang et al., 2019) and that GCMs formulate not only ENSO, but also other teleconnections (Saha et al., 2014; Jia et al., 2015; Delworth et al., 2020). Overall, the percentage of significantly positive anomaly correlation is 27.0 %, 24.0 % and 34.6 % respectively in MAM, JJA and SON, which tends to be smaller than that in DJF. This result can be due to the seasonal cycle of ENSO; i.e., ENSO forcing tends to be the strongest in DJF, and it translates into weaker precipitation variability in the other seasons (Yang et al., 2018).
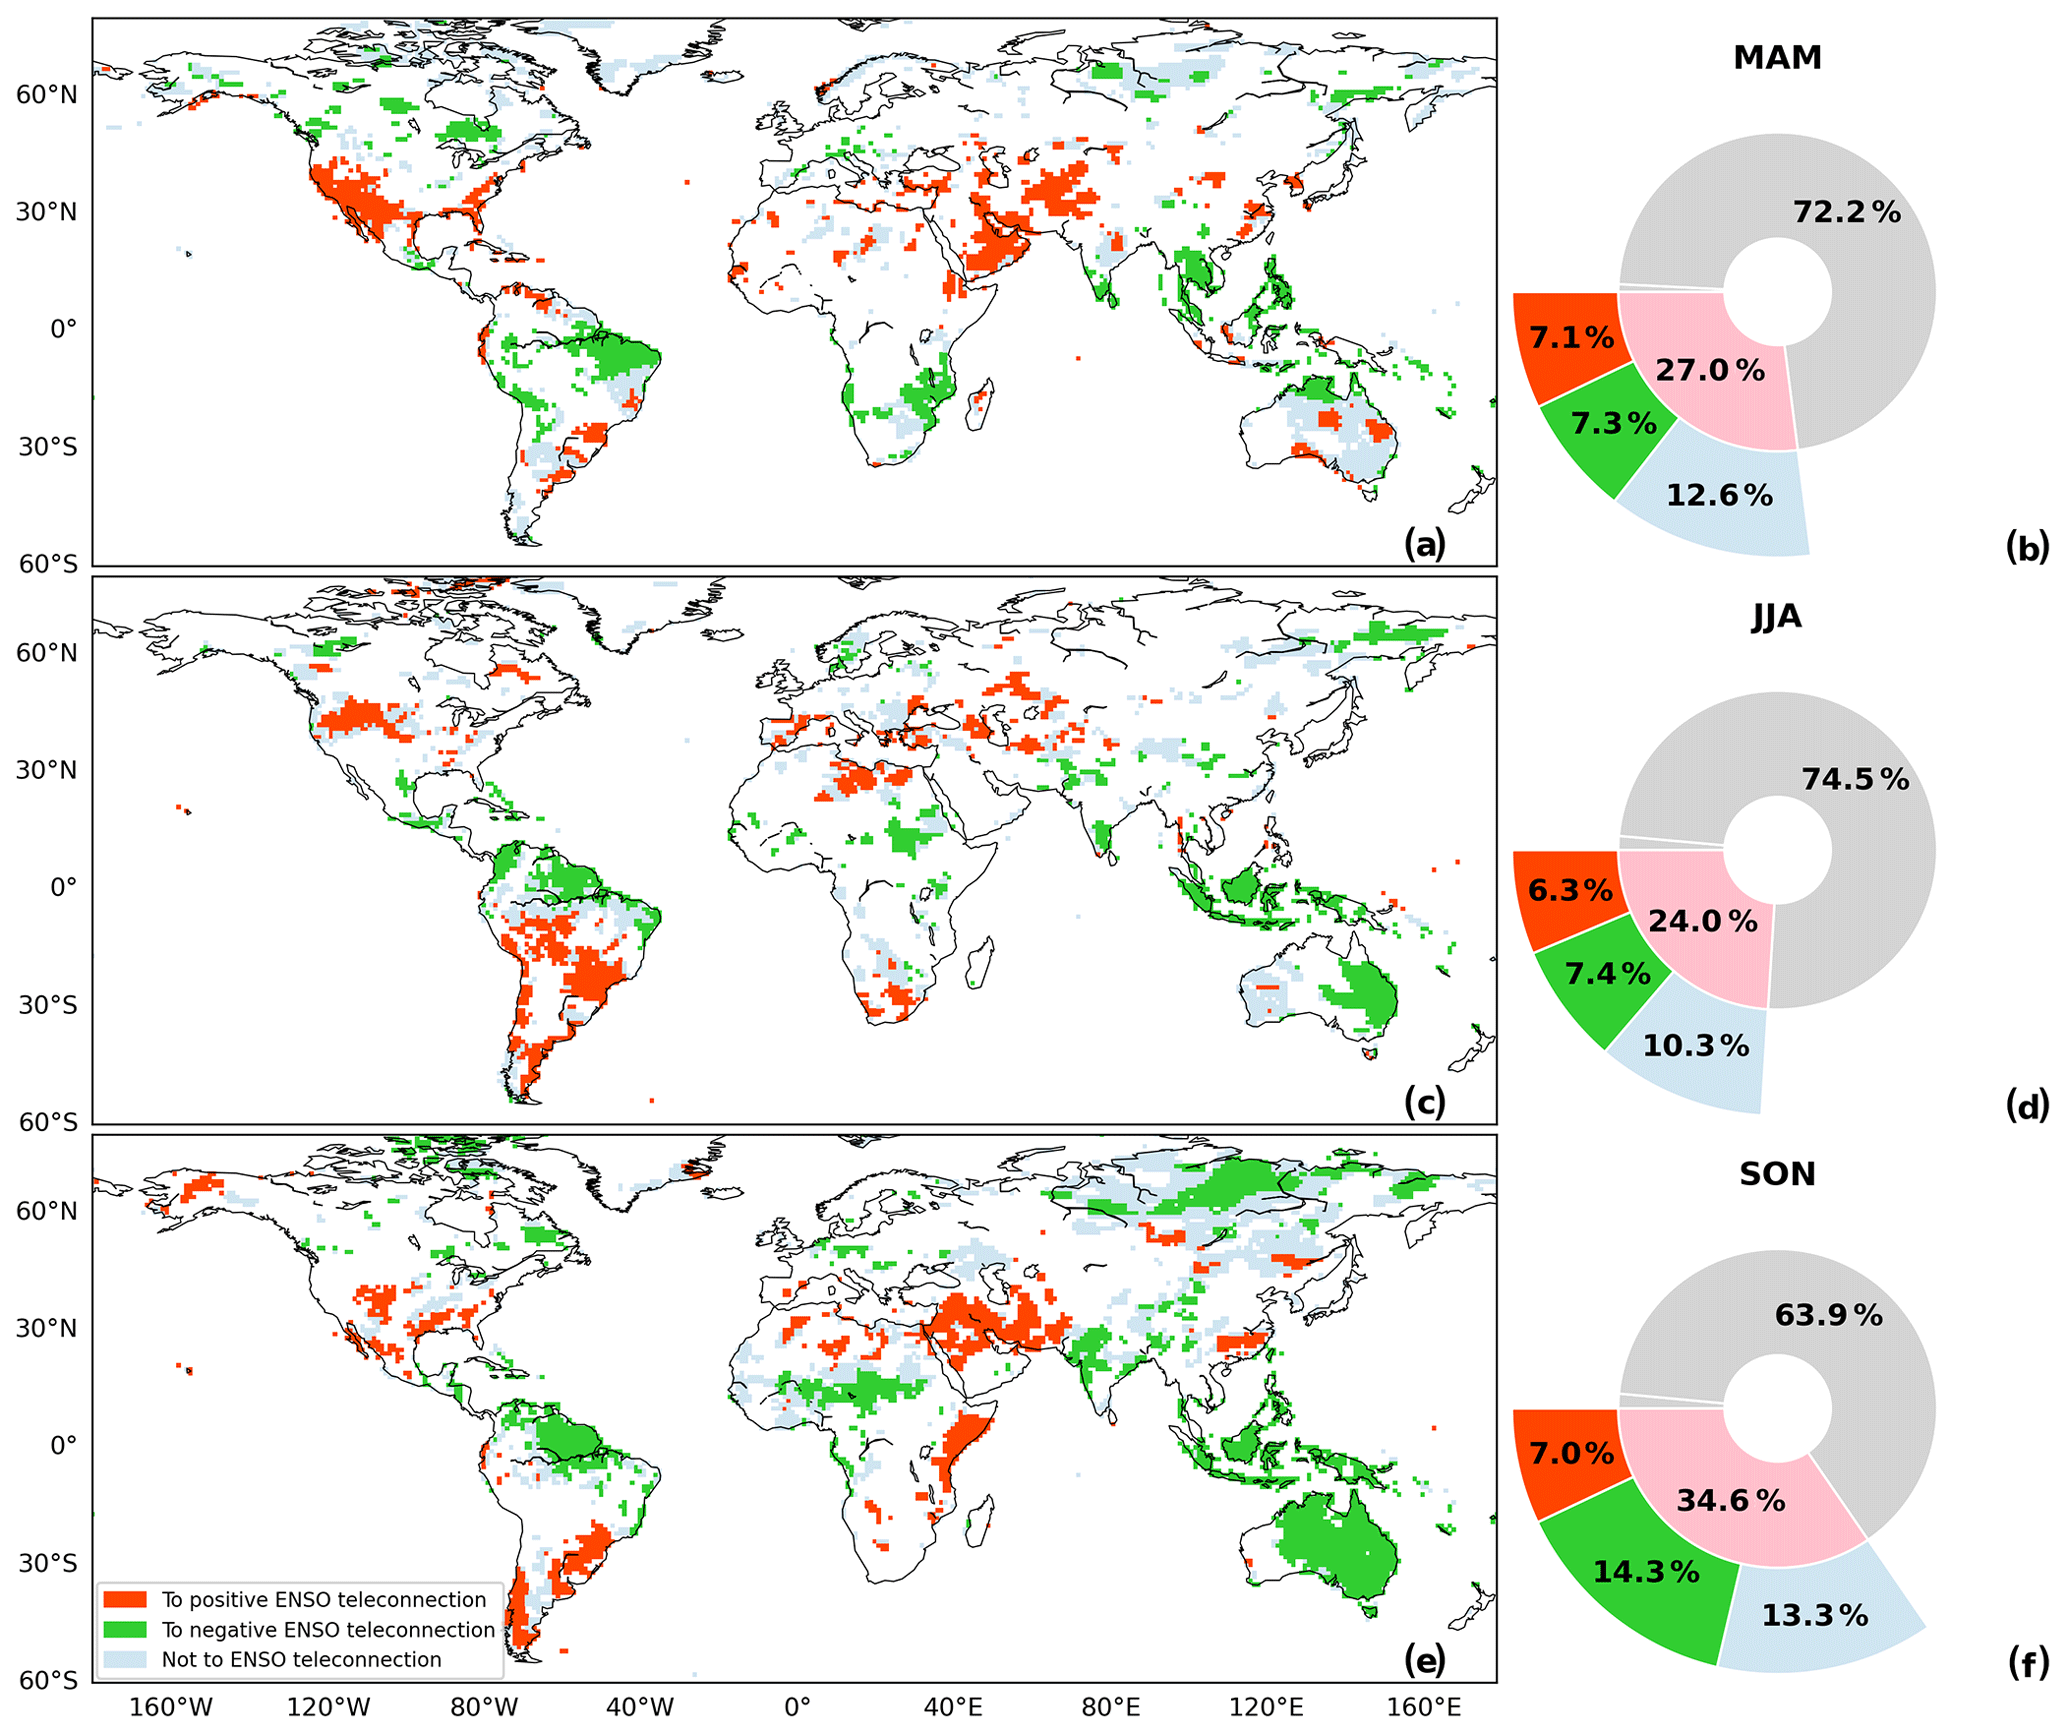
Figure 9Spatial maps (a–c) and sunburst diagrams (d–f) of the three cases of attribution of significantly positive anomaly correlation in MAM (a, b), JJA (c, d) and SON (e, f).
The percentage of significantly positive anomaly correlation attributable to positive ENSO teleconnection is respectively 7.1 %, 6.3 % and 7.0 % in MAM, JJA and SON. Representative regions for this case are the western United States in MAM (Pegion and Kumar, 2013), parts of South America in JJA (Cai et al., 2020) and the Middle East in SON (Mariotti, 2007). In total, 7.3 %, 7.4 % and 14.3 % of grid cells are with significantly positive anomaly correlation attributable to negative ENSO teleconnection respectively in MAM, JJA and SON. One representative region is southeast Asia, where precipitation is strongly correlated with ENSO in MAM, JJA and SON (Jiang and Li, 2017); also, in Australia, precipitation in SON is found to be substantially influenced by the extratropical teleconnection pathway of ENSO (Cai and Weller, 2013). Furthermore, 12.6 %, 10.3 % and 13.3 % of grid cells are with significantly positive anomaly correlation not attributable to ENSO teleconnection. This result calls for the investigation of other teleconnection patterns for GCM seasonal precipitation forecasts.
Correlation skill between forecast and observed precipitation is one of the most important indicators of the usefulness of GCM forecasts (Yuan et al., 2011; Becker et al., 2020; Vano et al., 2014; Johnson et al., 2019; Zhao et al., 2020b). To facilitate forecast applications, correlation skill is conventionally calculated from data and then presented using spatial plotting (Zhao et al., 2020a, b). Focusing on the relationship between correlation skill and ENSO teleconnection, the present paper highlights that significantly positive anomaly correlation, which is always advantageous for practical applications of GCM forecasts (Vano et al., 2014; Yuan et al., 2014; Peng et al., 2018), can be attributed to positive (negative) ENSO teleconnection or not to ENSO. In DJF, significantly positive anomaly correlation for CFSv2 forecasts is attributable to positive ENSO teleconnection in southern North America and East Africa, and it is attributable to negative ENSO teleconnection in northern South America and southern Africa. Moreover, significantly positive anomaly correlation in Europe can be attributable to teleconnections other than ENSO. The different cases of attribution also exist for MAM, JJA and SON, but their spatial extents vary considerably (Figs. S4–S6). These results conform to previous findings that regions exhibiting positive (negative) ENSO teleconnection change substantially by season (Mason and Goddard, 2001; Vashisht et al., 2021; Chen and Kumar, 2020) and that performances of GCM forecasts vary by season (Vano et al., 2014; Johnson et al., 2019; Zhao et al., 2020b).
Lagged ENSO teleconnection and correlation skill by lead time are important issues for seasonal forecasting (Schepen et al., 2012; Peng et al., 2014; Steinschneider and Lall, 2016). A numerical experiment of attribution is performed for Niño3.4 indices at different time lags. Specifically, for precipitation in DJF, the concurrent Niño3.4 in the analysis is replaced by Niño3.4 in November, October and September so as to investigate the overlapping R2 for 1-, 2- and 3-month lag ENSO teleconnection. Figures S7 to S10 show that the results tend to be similar at the three lags; the similarities are generally owing to the temporal persistency of Niño3.4 (Yang et al., 2018). Furthermore, another experiment is devised for GCM forecasts at the lead time of 1, 2 and 3 months. That is, for precipitation in DJF, forecasts generated in November, October and September are used to replace forecasts generated in December in the analysis (Figs. S11 to S14). It can be observed that the case of significantly positive anomaly correlation attributable to positive ENSO teleconnection remains for southern North America and that the case of significantly positive anomaly correlation attributable to negative ENSO teleconnection remains for northern South America and southern Africa.
The capability to formulate climate teleconnections is an essential part in the evaluation of GCM forecasts (Jong et al., 2021; Molod et al., 2020). Adding to previous studies that investigated GCM forecasts for regions subject to prominent ENSO influences (Jha et al., 2016; Manzanas et al., 2014; Pegion and Kumar, 2013), this paper presents an investigation of ENSO teleconnection at the global scale. For grid cells around the world, the ratio of significantly positive anomaly correlation attributable to positive (negative) ENSO teleconnection is respectively 10.8 % (11.7 %) in DJF, 7.1 % (7.3 %) in MAM, 6.3 % (7.4 %) in JJA and 7.0 % (14.3 %) in SON. Furthermore, the ratio of significantly positive anomaly correlation not attributable to ENSO teleconnection, which suggests that other climate teleconnections are at play in determining the skill of GCM forecasts, is respectively 16.9 %, 12.6 %, 10.3 % and 13.3 % in DJF, MAM, JJA and SON. Overall, the spatial plots and the attribution results can serve as a reference for further investigations of the effects of ENSO teleconnections and other climate patterns on the predictive performance of GCM forecasts.
Climate teleconnections, in particular ENSO, have been extensively used in conventional statistical hydrological forecasting. This paper is devoted to investigating the relationship between statistical ENSO teleconnection and correlation skill of dynamical CFSv2 forecasts. A novel mathematical approach is built upon set theory by making use of the coefficient of determination (R2) that measures the ratio of explained variance to total variance. Specifically, taking advantage of simple linear regression, the ratios of variance explained by GCM forecasts, Niño3.4 and their union are respectively obtained; then, the overlapping R2 for GCM forecasts and Niño3.4 is derived based on the intersection operation. Based on the significance of overlapping R2 and the sign of ENSO teleconnection, three cases of attribution are derived. They are significantly positive anomaly correlation attributable to positive ENSO teleconnection, attributable to negative ENSO teleconnection and not attributable to ENSO teleconnection. The effectiveness of the developed approach is demonstrated through the case study of CFSv2 seasonal forecasts of global precipitation. Spatial plots of the attribution are illustrated by season. The spatial patterns of forecast skill attributed to different types of ENSO teleconnections confirm previous studies associating seasonal precipitation variability with ENSO and highlight the capability of CFSv2 in capturing the pathways of ENSO teleconnections. The attribution method proposed in this paper can lay a basis for future evaluations of other teleconnections and investigations of predictability sources for GCM seasonal precipitation forecasts.
All datasets used in this study are publicly available. Both precipitation forecasts and the observations (Kirtman et al., 2014) can be downloaded from the International Research Institute for Climate and Society, Earth Institute, Columbia University (https://iridl.ldeo.columbia.edu/SOURCES/.Models/.NMME/) (IRI, 2021). The Niño3.4 index is download from the NOAA Physical Sciences Laboratory (https://psl.noaa.gov/data/climateindices/list/) (NOAA, 2021).
The supplement related to this article is available online at: https://doi.org/10.5194/hess-25-5717-2021-supplement.
TZ designed the study. TZ and HC developed the model code, did the numerical experiments and wrote the manuscript. QS, TT, YT and XC provided feedback on results and edited the manuscript.
The contact author has declared that neither they nor their co-authors have any competing interests.
Publisher's note: Copernicus Publications remains neutral with regard to jurisdictional claims in published maps and institutional affiliations.
We are grateful to the editors and anonymous reviewers for the insightful and constructive comments that led to substantial improvements of the paper. This research has been supported by the National Natural Science Foundation of China, the National Natural Science Foundation of China-Guangdong Joint Fund, and the Guangdong Science and Technology Department.
This study is jointly supported by the Ministry of Science and Technology of China (grant nos. 2021YFC3000014 and 2017YFC1502600), the National Natural Science Foundation of China (grant nos. 51979295, 51861125203, 52109046 and U1911204) and the Guangdong Provincial Department of Science and Technology (grant no. 2019ZT08G090).
This paper was edited by Xing Yuan and reviewed by three anonymous referees.
Beck, H. E., Pan, M., Roy, T., Weedon, G. P., Pappenberger, F., van Dijk, A. I. J. M., Huffman, G. J., Adler, R. F., and Wood, E. F.: Daily evaluation of 26 precipitation datasets using Stage-IV gauge-radar data for the CONUS, Hydrol. Earth Syst. Sci., 23, 207–224, https://doi.org/10.5194/hess-23-207-2019, 2019.
Becker, E., Kirtman, Ben P., and Pegion, K.: Evolution of the North American Multi-Model Ensemble, Geophys. Res. Lett., 47, e2020GL087408, https://doi.org/10.1029/2020GL087408, 2020.
Butler, A. H., Polvani, L. M., and Deser, C.: Separating the stratospheric and tropospheric pathways of El Niño–Southern Oscillation teleconnections, Environ. Res. Lett., 9, 024014, https://doi.org/10.1088/1748-9326/9/2/024014, 2014.
Cai, W. and Weller, E.: Asymmetry in the IOD and ENSO Teleconnection in a CMIP5 Model Ensemble and Its Relevance to Regional Rainfall, J. Climate, 26, 5139–5149, https://doi.org/10.1175/JCLI-D-12-00789.1, 2013.
Cai, W., Sullivan, A., and Cowan, T.: Rainfall Teleconnections with Indo-Pacific Variability in the WCRP CMIP3 Models, J. Climate, 22, 5046–5071, https://doi.org/10.1175/2009JCLI2694.1, 2009.
Cai, W., McPhaden, M. J., Grimm, A. M., Rodrigues, R. R., Taschetto, A. S., Garreaud, R. D., Dewitte, B., Poveda, G., Ham, Y.-G., Santoso, A., Ng, B., Anderson, W., Wang, G., Geng, T., Jo, H.-S., Marengo, J. A., Alves, L. M., Osman, M., Li, S., Wu, L., Karamperidou, C., Takahashi, K., and Vera, C.: Climate impacts of the El Niño–Southern Oscillation on South America, Nat. Rev. Earth Environ., 1, 215–231, https://doi.org/10.1038/s43017-020-0040-3, 2020.
Chen, M. and Kumar, A.: The utility of seasonal hindcast database for the analysis of climate variability: an example, Clim. Dynam., 48, 265–279, https://doi.org/10.1007/s00382-016-3073-z, 2016.
Chen, M. and Kumar, A.: Understanding Skill of Seasonal Mean Precipitation Prediction over California during Boreal Winter and Role of Predictability Limits, J. Climate, 33, 6141–6163, https://doi.org/10.1175/jcli-d-19-0275.1, 2020.
Chen, M., Shi, W., Xie, P., Silva, V. B. S., Kousky, V. E., Wayne Higgins, R., and Janowiak, J. E.: Assessing objective techniques for gauge-based analyses of global daily precipitation, J. Geophys. Res., 113, D04110, https://doi.org/10.1029/2007jd009132, 2008.
Delworth, T. L., Cooke, W. F., Adcroft, A., Bushuk, M., Chen, J. H., Dunne, K. A., Ginoux, P., Gudgel, R., Hallberg, R. W., Harris, L., Harrison, M. J., Johnson, N., Kapnick, S. B., Lin, S. J., Lu, F., Malyshev, S., Milly, P. C., Murakami, H., Naik, V., Pascale, S., Paynter, D., Rosati, A., Schwarzkopf, M. D., Shevliakova, E., Underwood, S., Wittenberg, A. T., Xiang, B., Yang, X., Zeng, F., Zhang, H., Zhang, L., and Zhao, M.: SPEAR: The Next Generation GFDL Modeling System for Seasonal to Multidecadal Prediction and Projection, J. Adv. Model. Earth Syst., 12, e2019MS001895, https://doi.org/10.1029/2019ms001895, 2020.
Demargne, J., Wu, L., Regonda, S. K., Brown, J. D., Lee, H., He, M., Seo, D.-J., Hartman, R., Herr, H. D., Fresch, M., Schaake, J., and Zhu, Y.: The Science of NOAA's Operational Hydrologic Ensemble Forecast Service, B. Am. Meteorol. Soc., 95, 79-98, https://doi.org/10.1175/BAMS-D-12-00081.1, 2014.
Doblas-Reyes, F. J., García-Serrano, J., Lienert, F., Biescas, A. P., and Rodrigues, L. R. L.: Seasonal climate predictability and forecasting: status and prospects, Wiley Interdisciplin. Rev. Clim. Change, 4, 245–268, https://doi.org/10.1002/wcc.217, 2013.
Feng, S. and Hao, Z.: Quantitative contribution of ENSO to precipitation-temperature dependence and associated compound dry and hot events, Atmos. Res., 260, 105695, https://doi.org/10.1016/j.atmosres.2021.105695, 2021.
Fu, R., Dickinson, R. E., and Newkirk, B.: Response of the upper tropospheric humidity and moisture transport to changes of tropical convection. A comparison between observations and a GCM over an ENSO cycle, Geophys. Res. Lett., 24, 2371-2374, https://doi.org/10.1029/97GL02505, 1997.
Gong, H., Wang, L., Chen, W., Nath, D., Huang, G., and Tao, W.: Diverse Influences of ENSO on the East Asian–Western Pacific Winter Climate Tied to Different ENSO Properties in CMIP5 Models, J. Climate, 28, 2187–2202, https://doi.org/10.1175/JCLI-D-14-00405.1, 2015.
Greuell, W., Franssen, W. H. P., Biemans, H., and Hutjes, R. W. A.: Seasonal streamflow forecasts for Europe – Part I: Hindcast verification with pseudo- and real observations, Hydrol. Earth Syst. Sci., 22, 3453–3472, https://doi.org/10.5194/hess-22-3453-2018, 2018.
Howard, E., Washington, R., and Hodges, K. I.: Tropical Lows in Southern Africa: Tracks, Rainfall Contributions, and the Role of ENSO, J. Geophys. Res.-Atmos., 124, 11009–11032, https://doi.org/10.1029/2019jd030803, 2019.
Huffman, G. J., Bolvin, D. T., Nelkin, E. J., Wolff, D. B., Adler, R. F., Gu, G., Hong, Y., Bowman, K. P., and Stocker, E. F.: The TRMM Multisatellite Precipitation Analysis (TMPA): Quasi-Global, Multiyear, Combined-Sensor Precipitation Estimates at Fine Scales, J. Hydrometeorol., 8, 38–55, https://doi.org/10.1175/jhm560.1, 2007.
Infanti, J. M. and Kirtman, B. P.: North American rainfall and temperature prediction response to the diversity of ENSO, Clim. Dynam., 46, 3007–3023, https://doi.org/10.1007/s00382-015-2749-0, 2015.
IRI: Models NMME, IRI [code], https://iridl.ldeo.columbia.edu/SOURCES/.Models/.NMME/, last access: 1 November 2021.
Jha, B., Kumar, A., and Hu, Z.-Z.: An update on the estimate of predictability of seasonal mean atmospheric variability using North American Multi-Model Ensemble, Clim. Dynam., 53, 7397–7409, https://doi.org/10.1007/s00382-016-3217-1, 2016.
Jia, L., Yang, X., Vecchi, G. A., Gudgel, R. G., Delworth, T. L., Rosati, A., Stern, W. F., Wittenberg, A. T., Krishnamurthy, L., Zhang, S., Msadek, R., Kapnick, S., Underwood, S., Zeng, F., Anderson, W. G., Balaji, V., and Dixon, K.: Improved Seasonal Prediction of Temperature and Precipitation over Land in a High-Resolution GFDL Climate Model, J. Climate, 28, 2044–2062, https://doi.org/10.1175/jcli-d-14-00112.1, 2015.
Jiang, L. and Li, T.: Why rainfall response to El Niño over Maritime Continent is weaker and non-uniform in boreal winter than in boreal summer, Clim. Dynam., 51, 1465–1483, https://doi.org/10.1007/s00382-017-3965-6, 2017.
Johnson, S. J., Stockdale, T. N., Ferranti, L., Balmaseda, M. A., Molteni, F., Magnusson, L., Tietsche, S., Decremer, D., Weisheimer, A., Balsamo, G., Keeley, S. P. E., Mogensen, K., Zuo, H., and Monge-Sanz, B. M.: SEAS5: the new ECMWF seasonal forecast system, Geosci. Model Dev., 12, 1087–1117, https://doi.org/10.5194/gmd-12-1087-2019, 2019.
Jong, B.-T., Ting, M., and Seager, R.: Assessing ENSO Summer Teleconnections, Impacts, and Predictability in North America, J. Climate, 34, 3629–3643, https://doi.org/10.1175/jcli-d-20-0761.1, 2021.
Kayano, M. T. and Andreoli, R. V.: Relationships between rainfall anomalies over northeastern Brazil and the El Niño–Southern Oscillation, J. Geophys. Res., 111, D13101, https://doi.org/10.1029/2005JD006142, 2006.
Kim, H.-M., Webster, P. J., and Curry, J. A.: Seasonal prediction skill of ECMWF System 4 and NCEP CFSv2 retrospective forecast for the Northern Hemisphere Winter, Clim. Dynam., 39, 2957–2973, https://doi.org/10.1007/s00382-012-1364-6, 2012.
Kim, S. and Kug, J. S.: What Controls ENSO Teleconnection to East Asia? Role of Western North Pacific Precipitation in ENSO Teleconnection to East Asia, J. Geophys. Res.-Atmos., 123, 10406–10422, https://doi.org/10.1029/2018JD028935, 2018.
Kim, S., Son, H.-Y., and Kug, J.-S.: How well do climate models simulate atmospheric teleconnctions over the North Pacific and East Asia associated with ENSO?, Clim. Dynam., 48, 971–985, https://doi.org/10.1007/s00382-016-3121-8, 2016.
Kirtman, B. P., Min, D., Infanti, J. M., Kinter, J. L., Paolino, D. A., Zhang, Q., van den Dool, H., Saha, S., Mendez, M. P., Becker, E., Peng, P., Tripp, P., Huang, J., DeWitt, D. G., Tippett, M. K., Barnston, A. G., Li, S., Rosati, A., Schubert, S. D., Rienecker, M., Suarez, M., Li, Z. E., Marshak, J., Lim, Y.-K., Tribbia, J., Pegion, K., Merryfield, W. J., Denis, B., and Wood, E. F.: The North American Multimodel Ensemble: Phase-1 Seasonal-to-Interannual Prediction; Phase-2 toward Developing Intraseasonal Prediction, B. Am. Meteorol. Soc., 95, 585–601, https://doi.org/10.1175/BAMS-D-12-00050.1, 2014.
Koster, R. D., Mahanama, S. P. P., Yamada, T. J., Balsamo, G., Berg, A. A., Boisserie, M., Dirmeyer, P. A., Doblas-Reyes, F. J., Drewitt, G., Gordon, C. T., Guo, Z., Jeong, J.-H., Lawrence, D. M., Lee, W.-S., Li, Z., Luo, L., Malyshev, S., Merryfield, W. J., Seneviratne, S. I., Stanelle, T., van den Hurk, B. J. J. M., Vitart, F., and Wood, E. F.: Contribution of land surface initialization to subseasonal forecast skill: First results from a multi-model experiment, Geophys. Res. Lett., 37, L02402, https://doi.org/10.1029/2009GL041677, 2010.
Krause, P., Boyle, D. P., and Bäse, F.: Comparison of different efficiency criteria for hydrological model assessment, Adv. Geosci., 5, 89–97, https://doi.org/10.5194/adgeo-5-89-2005, 2005.
Lakshmi, D. D. and Satyanarayana, A. N. V.: Influence of atmospheric rivers in the occurrence of devastating flood associated with extreme precipitation events over Chennai using different reanalysis data sets, Atmos. Res., 215, 12–36, https://doi.org/10.1016/j.atmosres.2018.08.016, 2019.
Lima, C. H. R. and Lall, U.: Climate informed monthly streamflow forecasts for the Brazilian hydropower network using a periodic ridge regression model, J. Hydrol., 380, 438–449, https://doi.org/10.1016/j.jhydrol.2009.11.016, 2010.
Manzanas, R., Frías, M. D., Cofiño, A. S., and Gutiérrez, J. M.: Validation of 40 year multimodel seasonal precipitation forecasts: The role of ENSO on the global skill, J. Geophys. Res.-Atmos., 119, 1708–1719, https://doi.org/10.1002/2013JD020680, 2014.
Mariotti, A.: How ENSO impacts precipitation in southwest central Asia, Geophys. Res. Lett., 34, L16706, https://doi.org/10.1029/2007GL030078, 2007.
Mason, S. J. and Goddard, L.: Probabilistic precipitation anomalies associated with ENSO, B. Am. Meteorol. Soc., 82, 619–638, https://doi.org/10.1175/1520-0477(2001)082<0619:PPAAWE>2.3.CO;2, 2001.
Mendoza, P. A., Wood, A. W., Clark, E., Rothwell, E., Clark, M. P., Nijssen, B., Brekke, L. D., and Arnold, J. R.: An intercomparison of approaches for improving operational seasonal streamflow forecasts, Hydrol. Earth Syst. Sci., 21, 3915–3935, https://doi.org/10.5194/hess-21-3915-2017, 2017.
Merryfield, W. J., Lee, W.-S., Boer, G. J., Kharin, V. V., Scinocca, J. F., Flato, G. M., Ajayamohan, R. S., Fyfe, J. C., Tang, Y., and Polavarapu, S.: The Canadian Seasonal to Interannual Prediction System. Part I: Models and Initialization, Mon. Weather Rev., 141, 2910–2945, https://doi.org/10.1175/mwr-d-12-00216.1, 2013.
Minami, A. and Takaya, Y.: Enhanced Northern Hemisphere Correlation Skill of Subseasonal Predictions in the Strong Negative Phase of the Arctic Oscillation, J. Geophys. Res.-Atmos., 125, e2019JD031268, https://doi.org/10.1029/2019JD031268, 2020.
Molod, A., Hackert, E., Vikhliaev, Y., Zhao, B., Barahona, D., Vernieres, G., Borovikov, A., Kovach, R. M., Marshak, J., Schubert, S., Li, Z., Lim, Y. K., Andrews, L. C., Cullather, R., Koster, R., Achuthavarier, D., Carton, J., Coy, L., Friere, J. L. M., Longo, K. M., Nakada, K., and Pawson, S.: GEOS-S2S Version 2: The GMAO High-Resolution Coupled Model and Assimilation System for Seasonal Prediction, J. Geophys. Res.-Atmos., 125, e2019JD031767, https://doi.org/10.1029/2019JD031767, 2020.
Molteni, F., Stockdale, T., Balmaseda, M., Balsamo, G., Buizza, R., Ferranti, L., Magnusson, L., Mogensen, K., Palmer, T., and Vitart, F.: The new ECMWF seasonal forecast system (System 4), European Centre for Medium-Range Weather Forecasts, Reading, 2011.
Mortensen, E., Wu, S., Notaro, M., Vavrus, S., Montgomery, R., De Piérola, J., Sánchez, C., and Block, P.: Regression-based season-ahead drought prediction for southern Peru conditioned on large-scale climate variables, Hydrol. Earth Syst. Sci., 22, 287–303, https://doi.org/10.5194/hess-22-287-2018, 2018.
Neelin, J. D. and Langenbrunner, B.: Analyzing ENSO Teleconnections in CMIP Models as a Measure of Model Fidelity in Simulating Precipitation, J. Climate, 26, 4431–4446, https://doi.org/10.1175/jcli-d-12-00542.1, 2013.
NOAA: Climate Indices: Monthly Atmospheric and Ocean Time-Series, NOAA [data set], https://psl.noaa.gov/data/climateindices/list/, last access: 1 November 2021.
Pegion, K. and Kumar, A.: Does An ENSO-Conditional Skill Mask Improve Seasonal Predictions?, Mon. Weather Rev., 141, 4515–4533, https://doi.org/10.1175/mwr-d-12-00317.1, 2013.
Peng, B., Guan, K., Pan, M., and Li, Y.: Benefits of Seasonal Climate Prediction and Satellite Data for Forecasting U.S. Maize Yield, Geophys. Res. Lett., 45, 9662–9671, https://doi.org/10.1029/2018gl079291, 2018.
Peng, Z., Wang, Q. J., Bennett, J. C., Pokhrel, P., and Wang, Z.: Seasonal precipitation forecasts over China using monthly large-scale oceanic-atmospheric indices, J. Hydrol., 519, 792–802, https://doi.org/10.1016/j.jhydrol.2014.08.012, 2014.
Quan, X., Hoerling, M., Whitaker, J., Bates, G., and Xu, T.: Diagnosing Sources of U.S. Seasonal Forecast Skill, J. Climate, 19, 3279–3293, https://doi.org/10.1175/JCLI3789.1, 2006.
Rivera, J. A. and Arnould, G.: Evaluation of the ability of CMIP6 models to simulate precipitation over Southwestern South America: Climatic features and long-term trends (1901–2014), Atmos. Res., 241, 104953, https://doi.org/10.1016/j.atmosres.2020.104953, 2020.
Robertson, D. E., Shrestha, D. L., and Wang, Q. J.: Post-processing rainfall forecasts from numerical weather prediction models for short-term streamflow forecasting, Hydrol. Earth Syst. Sci., 17, 3587–3603, https://doi.org/10.5194/hess-17-3587-2013, 2013.
Saha, S., Moorthi, S., Pan, H.-L., Wu, X., Wang, J., Nadiga, S., Tripp, P., Kistler, R., Woollen, J., Behringer, D., Liu, H., Stokes, D., Grumbine, R., Gayno, G., Wang, J., Hou, Y.-T., Chuang, H.-y., Juang, H.-M. H., Sela, J., Iredell, M., Treadon, R., Kleist, D., Delst, P. V., Keyser, D., Derber, J., Ek, M., Meng, J., Wei, H., Yang, R., Lord, S., Dool, H. v. d., Kumar, A., Wang, W., Long, C., Chelliah, M., Xue, Y., Huang, B., Schemm, J.-K., Ebisuzaki, W., Lin, R., Xie, P., Chen, M., Zhou, S., Higgins, W., Zou, C.-Z., Liu, Q., Chen, Y., Han, Y., Cucurull, L., Reynolds, R. W., Rutledge, G., and Goldberg, M.: The NCEP Climate Forecast System Reanalysis, B. Am. Meteorol. Soc., 91, 1015–1058, https://doi.org/10.1175/2010bams3001.1, 2010.
Saha, S., Moorthi, S., Wu, X., Wang, J., Nadiga, S., Tripp, P., Behringer, D., Hou, Y.-T., Chuang, H.-y., Iredell, M., Ek, M., Meng, J., Yang, R., Mendez, M. P., Dool, H. v. d., Zhang, Q., Wang, W., Chen, M., and Becker, E.: The NCEP Climate Forecast System Version 2, J. Climate, 27, 2185–2208, https://doi.org/10.1175/jcli-d-12-00823.1, 2014.
Schepen, A., Wang, Q. J., and Robertson, D.: Evidence for Using Lagged Climate Indices to Forecast Australian Seasonal Rainfall, J. Climate, 25, 1230–1246, https://doi.org/10.1175/jcli-d-11-00156.1, 2012.
Schepen, A., Everingham, Y., and Wang, Q. J.: On the Joint Calibration of Multivariate Seasonal Climate Forecasts from GCMs, Mon. Weather Rev., 148, 437–456, https://doi.org/10.1175/mwr-d-19-0046.1, 2020.
Schneider, U., Ziese, M., Meyer-Christoffer, A., Finger, P., Rustemeier, E., and Becker, A.: The new portfolio of global precipitation data products of the Global Precipitation Climatology Centre suitable to assess and quantify the global water cycle and resources, Proc. Int. Assoc. Hydrol. Sci., 374, 29–34, https://doi.org/10.5194/piahs-374-29-2016, 2016.
Scofield, R. A. and Kuligowski, R. J.: Status and Outlook of Operational Satellite Precipitation Algorithms for Extreme-Precipitation Events, Weather Forecasting, 18, 1037-1051, https://doi.org/10.1175/1520-0434(2003)018<1037:Saooos>2.0.Co;2, 2003.
Shin, C.-S., Huang, B., and Kumar, A.: Predictive Skill and Predictable Patterns of the U.S. Seasonal Precipitation in CFSv2 Reforecasts of 60 Years (1958–2017), J. Climate, 32, 8603–8637, https://doi.org/10.1175/jcli-d-19-0230.1, 2019.
Steinschneider, S. and Lall, U.: El Niño and the U.S. precipitation and floods: What was expected for the January–March 2016 winter hydroclimate that is now unfolding?, Water Resour. Res., 52, 1498–1501, https://doi.org/10.1002/2015WR018470, 2016.
Steptoe, H., Jones, S. E. O., and Fox, H.: Correlations Between Extreme Atmospheric Hazards and Global Teleconnections: Implications for Multihazard Resilience, Rev. Geophys., 56, 50–78, https://doi.org/10.1002/2017rg000567, 2018.
Strazzo, S., Collins, D. C., Schepen, A., Wang, Q. J., Becker, E., and Jia, L.: Application of a Hybrid Statistical–Dynamical System to Seasonal Prediction of North American Temperature and Precipitation, Mon. Weather Rev., 147, 607–625, https://doi.org/10.1175/mwr-d-18-0156.1, 2019.
Tesfa, T. K., Leung, L. R., and Ghan, S. J.: Exploring Topography-Based Methods for Downscaling Subgrid Precipitation for Use in Earth System Models, J. Geophys. Res.-Atmos., 125, e2019JD031456, https://doi.org/10.1029/2019JD031456, 2020.
Ushio, T., Sasashige, K., Kubota, T., Shige, S., Okamoto, K. i., Aonashi, K., Inoue, T., Takahashi, N., Iguchi, T., Kachi, M., Oki, R., Morimoto, T., and Kawasaki, Z.-I.: A Kalman Filter Approach to the Global Satellite Mapping of Precipitation (GSMaP) from Combined Passive Microwave and Infrared Radiometric Data, J. Meteorol. Soc. Jpn., 87A, 137–151, https://doi.org/10.2151/jmsj.87A.137, 2009.
Vano, J. A., Udall, B., Cayan, D. R., Overpeck, J. T., Brekke, L. D., Das, T., Hartmann, H. C., Hidalgo, H. G., Hoerling, M., McCabe, G. J., Morino, K., Webb, R. S., Werner, K., and Lettenmaier, D. P.: Understanding Uncertainties in Future Colorado River Streamflow, B. Am. Meteorol. Soc., 95, 59–78, https://doi.org/10.1175/bams-d-12-00228.1, 2014.
Vashisht, A., Zaitchik, B., and Gnanadesikan, A.: ENSO Teleconnection to Eastern African Summer Rainfall in Global Climate Models: Role of the Tropical Easterly Jet, J. Climate, 34, 293–312, https://doi.org/10.1175/jcli-d-20-0222.1, 2021.
Wang, H.-M., Chen, J., Xu, C.-Y., Chen, H., Guo, S., Xie, P., and Li, X.: Does the weighting of climate simulations result in a better quantification of hydrological impacts?, Hydrol. Earth Syst. Sci., 23, 4033–4050, https://doi.org/10.5194/hess-23-4033-2019, 2019.
Wang, J., Wang, X., Lei, X. h., Wang, H., Zhang, X. h., You, J. j., Tan, Q. f., and Liu, X. l.: Teleconnection analysis of monthly streamflow using ensemble empirical mode decomposition, J. Hydrol., 582, 124411, https://doi.org/10.1016/j.jhydrol.2019.124411, 2020.
Wang, P.-H., Minnis, P., Wielicki, B. A., Wong, T., Cess, R. D., Zhang, M., Vann, L. B., and Kent, G. S.: Characteristics of the 1997/1998 El Niño cloud distributions from SAGE II observations, J. Geophys. Res.-Atmos., 108, AAC 5-1–AAC 5-11, https://doi.org/10.1029/2002JD002501, 2003.
Wu, H., Adler, R. F., Tian, Y., Huffman, G. J., Li, H., and Wang, J.: Real-time global flood estimation using satellite-based precipitation and a coupled land surface and routing model, Water Resour. Res., 50, 2693–2717, https://doi.org/10.1002/2013wr014710, 2014.
Xie, P., Arkin, P. A., and Janowiak, J. E.: CMAP: The CPC Merged Analysis of Precipitation, in: Measuring Precipitation From Space, Advances In Global Change Research, Springer, Dordrecht, 319–328, https://doi.org/10.1007/978-1-4020-5835-6_25, 2007.
Yang, S. and Jiang, X.: Prediction of Eastern and Central Pacific ENSO Events and Their Impacts on East Asian Climate by the NCEP Climate Forecast System, J. Climate, 27, 4451–4472, https://doi.org/10.1175/JCLI-D-13-00471.1, 2014.
Yang, S., Li, Z., Yu, J.-Y., Hu, X., Dong, W., and He, S.: El Niño–Southern Oscillation and its impact in the changing climate, Natl. Sci. Rev., 5, 840–857, https://doi.org/10.1093/nsr/nwy046, 2018.
Yuan, X., Wood, E. F., Luo, L., and Pan, M.: A first look at Climate Forecast System version 2 (CFSv2) for hydrological seasonal prediction, Geophys. Res. Lett., 38, L13402, https://doi.org/10.1029/2011GL047792, 2011.
Yuan, X., Wood, E. F., and Liang, M.: Integrating weather and climate prediction: Toward seamless hydrologic forecasting, Geophys. Res. Lett., 41, 5891–5896, https://doi.org/10.1002/2014gl061076, 2014.
Zhao, T., Zhang, Y., and Chen, X.: Predictive performance of NMME seasonal forecasts of global precipitation: A spatial-temporal perspective, J. Hydrol., 570, 17–25, https://doi.org/10.1016/j.jhydrol.2018.12.036, 2019.
Zhao, T., Zhang, W., Zhang, Y., Liu, Z., and Chen, X.: Significant spatial patterns from the GCM seasonal forecasts of global precipitation, Hydrol. Earth Syst. Sci., 24, 1–16, https://doi.org/10.5194/hess-24-1-2020, 2020a.
Zhao, T., Chen, H., Xu, W., Cai, H., Yan, D., and Chen, X.: Spatial association of anomaly correlation for GCM seasonal forecasts of global precipitation, Clim. Dynam., 55, 2273–2286, https://doi.org/10.1007/s00382-020-05384-2, 2020b.