the Creative Commons Attribution 4.0 License.
the Creative Commons Attribution 4.0 License.
 | 28 Oct 2021
Vegetation greening weakened the capacity of water supply to China's South-to-North Water Diversion Project
Jiehao Zhang
Yulong Zhang
Ge Sun
Conghe Song
Matthew P. Dannenberg
Jiangfeng Li
Ning Liu
Kerong Zhang
Quanfa Zhang
Lu Hao
Recent climate change and vegetation greening have important implications for global terrestrial hydrological cycles and other ecosystem functions, raising concerns about the watershed water supply capacity for large water diversion projects. To address this emerging concern, we built a hybrid model based on the Coupled Carbon and Water (CCW) and Water Supply Stress Index (WaSSI) models and conducted a case study on the upper Han River basin (UHRB) in Central China that serves as the water source area to the middle route of the South-to-North Water Diversion Project (SNWDP). Significant vegetation greening occurred in the UHRB during 2001–2018, largely driven by the widespread afforestation in the region, with the normalized difference vegetation index increasing at a rate of 0.5±0.1 % yr−1 (p<0.05) but with no significant trends in climate during the same period (albeit with large interannual variability). Annual water yield greatly decreased, and vegetation greening alone induced a significant decrease in water yield of 3.2±1.0 mm yr−1 (p<0.05). Vegetation greening could potentially reduce the annual water supply by 7.3 km3 on average, accounting for 77 % of the intended annual water diversion volume of the SNWDP. Although vegetation greening can bring enormous ecosystem goods and services (e.g., carbon sequestration and water quality improvement), it could aggravate the severity of hydrological drought. Our analysis indicated that vegetation greening in the UHRB reduced about a quarter of water yield on average during drought periods. Given the future warming and drying climate is likely to continue to raise evaporative demand and exert stress on water availability, the potential water yield decline induced by vegetation greening revealed by our study needs to be taken into account in the water resources management over the UHRB while reaping other benefits of forest protection and ecological restoration.
- Article
(6253 KB) - Full-text XML
- BibTeX
- EndNote


As the world's population and economy expand under a changing climate, human demand for freshwater increases, and water shortage has become a concern globally (Jackson et al., 2001). Water diversion with long-range transport has become an alternative measure to alleviate regional water shortage (Emanuel et al., 2015), but the sustainability of such projects depends on water supply from the donor watersheds. Watershed water supply is becoming increasingly uncertain due to rapid land use and land cover change and global climate change. In addition, vegetation greening has been observed globally in many regions as a combined result of climate change, land cover change (e.g., afforestation), and CO2 fertilization (Chen et al., 2019; Zhang et al., 2017; Zhu et al., 2016). How this “greening up” affects water yield in source regions of water diversion projects is unclear. A better understanding of the hydrological effects of vegetation greening on water supply of water diversion projects is critical for designing watershed management strategies to meet future water demand under a changing climate (van Loon et al., 2016).
The South-to-North Water Diversion Project (SNWDP) is the largest hydrological engineering project (in terms of investment) in the world to mitigate the water shortage in North China (Zhang, 2009). The upper Han River basin (UHRB), a subtropical basin in Central China, is the water source area for the middle route of the SNWDP. Considering the importance of the UHRB for the SNWDP, China implemented large-scale afforestation and ecological restoration projects to safeguard water quality and increase soil water storage from the UHRB. The afforestation-driven greening of the UHRB has been larger and more significant than in most other parts of the world (Chen et al., 2019). The greening of the UHRB could create a trade-off between ecological restoration and water availability (Jackson et al., 2005). The increased forest cover in the UHRB reduced sediment in the streamflow, improved water quality (Li et al., 2008; Qi et al., 2019), and significantly increased carbon storage (Zhang et al., 2014). However, afforestation and vegetation greening could also exert considerable influences on the water cycle by increasing vegetation water use (Bai et al., 2019; Li et al., 2018). Specifically, enhanced vegetation activity from greening potentially consumes more water through transpiration, which could lead to a reduction in water yield (Bai et al., 2020; Cao et al., 2016; Li et al., 2018), especially during drought periods (Teuling et al., 2013; Tian et al., 2018).
Since the UHRB was chosen as the source water area for the middle route of the SNWDP, whether the basin has the capacity to supply enough water to the project is one of the most debated issues about the project (Barnett et al., 2015; Stone, 2006; Zhang et al., 2020). The planned total water diversion each year during Phase I of the middle route project is 9.5 km3, accounting for nearly one-third of the mean annual runoff of the UHRB. However, water yield in the UHRB has sharply declined since the early 1990s (Chen et al., 2007; Liu et al., 2012; She et al., 2017). Moreover, the UHRB is quite vulnerable to hydrological drought events (Xu et al., 2011; Zhang et al., 2018), because about 70 % of its precipitation is recycled back to the atmosphere via evapotranspiration (ET) (China Meteorological Administration, 2020). The capacity of water supply to the SNWDP in drought years is only half of that of a normal year (Wang and Yang, 2005), exerting a large influence on the water supply capacity of the water diversion project, especially at the seasonal scale. The drought risks are likely compounded by warming-induced increases in evaporative demand due to increasing vapor pressure deficit (Cook et al., 2014, 2020; Lesk et al., 2016; Williams et al., 2020). Combined with the effects of afforestation and vegetation greening, the uncertainties in water supply capacity to the SNWDP are amplified. How the rapid and widespread greening has affected water yield in the UHRB, and thus the water supply to the middle-route SNWDP, remains largely unknown.
The small paired-watershed experiment approach is the “gold standard” for investigating the mechanisms of changes in water balance in response to vegetation (Bosch and Hewlett, 1982), but this method is not feasible for large basins (Wei et al., 2008). Eco-hydrological models based on remote sensing inputs provide an efficient way to understand hydrological processes at a high spatial resolution over large areas and long time periods (Wang and Dickinson, 2012). To investigate interactions among vegetation, climate, and the water cycle in the UHRB, a hydrological model should consider the effects of both vegetation and climate change and mechanistic understanding of hydrology. While many studies have investigated hydrological processes using mechanistic land surface models (Baker and Miller, 2013; Shin et al., 2019; Xi et al., 2018), their complex model structures and large number of parameters limit their applicability at a large spatial scale. Likewise, carbon and water fluxes of vegetation are tightly connected, but many hydrological models lack biological constraints of photosynthetic carbon uptake in quantifying hydrological variables.
To navigate this trade-off between mechanistic carbon–water linkage and computational efficiency, we developed and applied a new hybrid model that integrates two existing models: the “water-centric” Water Supply Stress Index (WaSSI) model (Sun et al., 2011; Caldwell et al., 2012; Liu et al., 2020) and the “carbon-centric” Coupled Carbon and Water (CCW) model (Y. Zhang et al., 2016, 2019). Here, we use this coupled model to address the following questions. (1) What were the spatial and temporal patterns of annual and monthly water yield (WY) in the UHRB from 2001 to 2018? (2) To what extent did the rapid local vegetation greening affect WY in the UHRB and thus water supply for the SNWDP? (3) How did the local vegetation greening change hydrological drought risks in the UHRB? Overall, our goal is to improve understanding of the effects of local vegetation greening on the water balance and hydrological drought and to provide a scientific basis for managing watersheds that serve as a critical water supply in inter-basin water diversion projects.
2.1 Study area
The Han River in Central China covers approximately 1.59×10⁵ km2 with a total length of 1577 km (Jin and Guo, 1993; Yang et al., 1997), making it the longest tributary of the Yangtze River. Its mountainous upper reaches (31∘20′–34∘10′ N, 106∘–112∘ E; 210–3500 m a.s.l) are 925 km long and drain an area of approximately 9.5×10⁴ km2 (Yang et al., 1997). The historical mean annual runoff of the UHRB is 41.1 km3 (though with high interannual variability) (Yang et al., 1997). The Danjiangkou Reservoir, located on the easternmost tip of the UHRB, stores runoff from the UHRB and serves as the water source for the middle route of the SNWDP (Fig. 1).

Figure 1(a) The location of the UHRB in China and the middle route of the South-to-North Water Diversion Project (from the Map World). (b) Topography of the UHRB, where the black, red, and yellow triangles, respectively, mark the location of the hydrological gauging stations for model evaluation, hydropower plants (dams), and the Danjiangkou Reservoir.
The SNWDP is an ambitious plan to alleviate the water shortage in North China, whose water consumption and requirements have increased greatly since the 1980s due to the increasing acceleration of both economic development and population growth (Liu and Zheng, 2002). The SNWDP serves roughly 400 million people, accounting for about one-third of China's population. However, annual available water resources per capita in North China are less than one-fourth of those in South China (Zhang et al., 2020). Water shortages in North China, including in China's capital Beijing, have become a major factor constraining economic and social development. The SNWDP consists of three routes: the eastern, middle, and western routes (Liu and Zheng, 2002). The eastern route uses an ancient canal in East China to divert water from the lower Yangtze River, the middle route diverts water from the UHRB via aqueducts, and the western route (currently in the planning stages) would divert water from the upper Yangtze River (Liu and Zheng, 2002).
2.2 Data sources and processing
The land cover and vegetation index data used in this study were obtained from Moderate Resolution Imaging Spectroradiometer (MODIS) data products (Table 1). Biomes were defined based on land cover data for 2001–2018 from the MODIS annual 500 m land cover product (MCD12Q1 v006) using the International Geosphere-Biosphere Programme (IGBP) classification scheme (Sulla-Menashe et al., 2019). We also obtained a 16 d, 250 m monthly normalized difference vegetation index (NDVI) from the MODIS MOD13Q1 v006 product for the same period (Huete et al., 2002). We smoothed the NDVI data with the adaptive Savitzky–Golay filter in the TIMESAT 3.3 software (Jönsson and Eklundh, 2004) and then aggregated to a monthly scale with temporal averaging.
The climate data required for the model include precipitation (P), air temperature (T), vapor pressure deficit (VPD, in hPa), and shortwave radiation (SR). These were all obtained from the monthly, ∼4 km (∘) TerraClimate dataset (Abatzoglou et al., 2018) for 2001 to 2018 (Table 1). We estimated the mean temperature by averaging monthly maximum and minimum temperature.
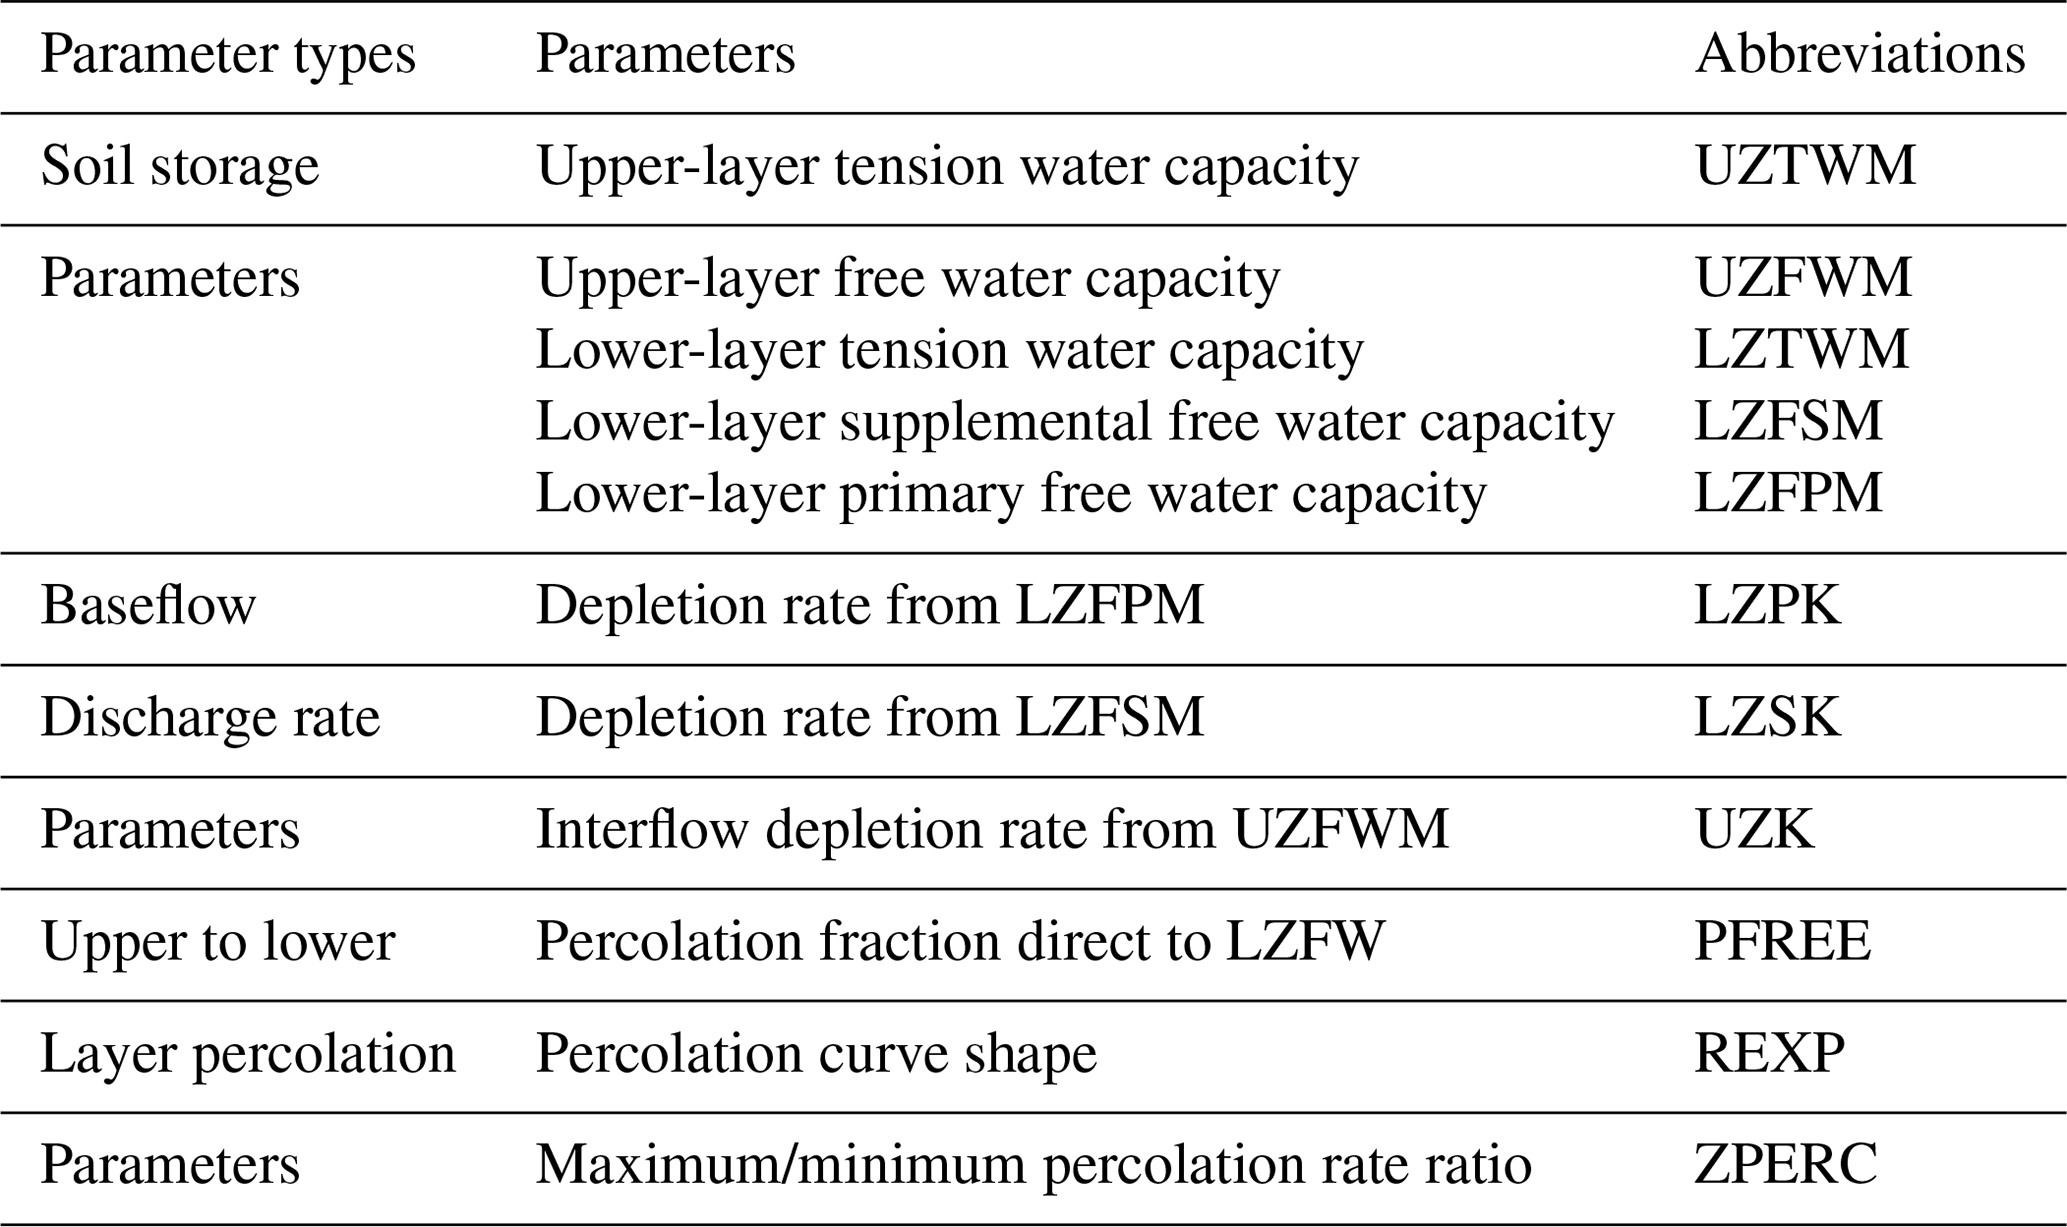
Soil attributes were derived from the SoilGrids dataset (Table 1), a system for global digital soil mapping using a state-of-the-art machine learning method to map the spatial distribution of soil properties across the globe. SoilGrids prediction models are fitted using over 230 000 soil profile observations from the World Soil Information Service database and a series of environmental covariates. The soil data include sand, silt, and clay content at six standard depth intervals (5 cm for each interval) at a spatial resolution of 250 m needed to derive soil model parameters (Table A1). All spatial data were rescaled to 250 m resolution based on the cubic convolution resampling method in ArcGIS 10.5, except for the land cover data, which were resampled based on the nearest neighbor.
Table 1Descriptions of model input data sources and usage by the hybrid ecohydrological model.
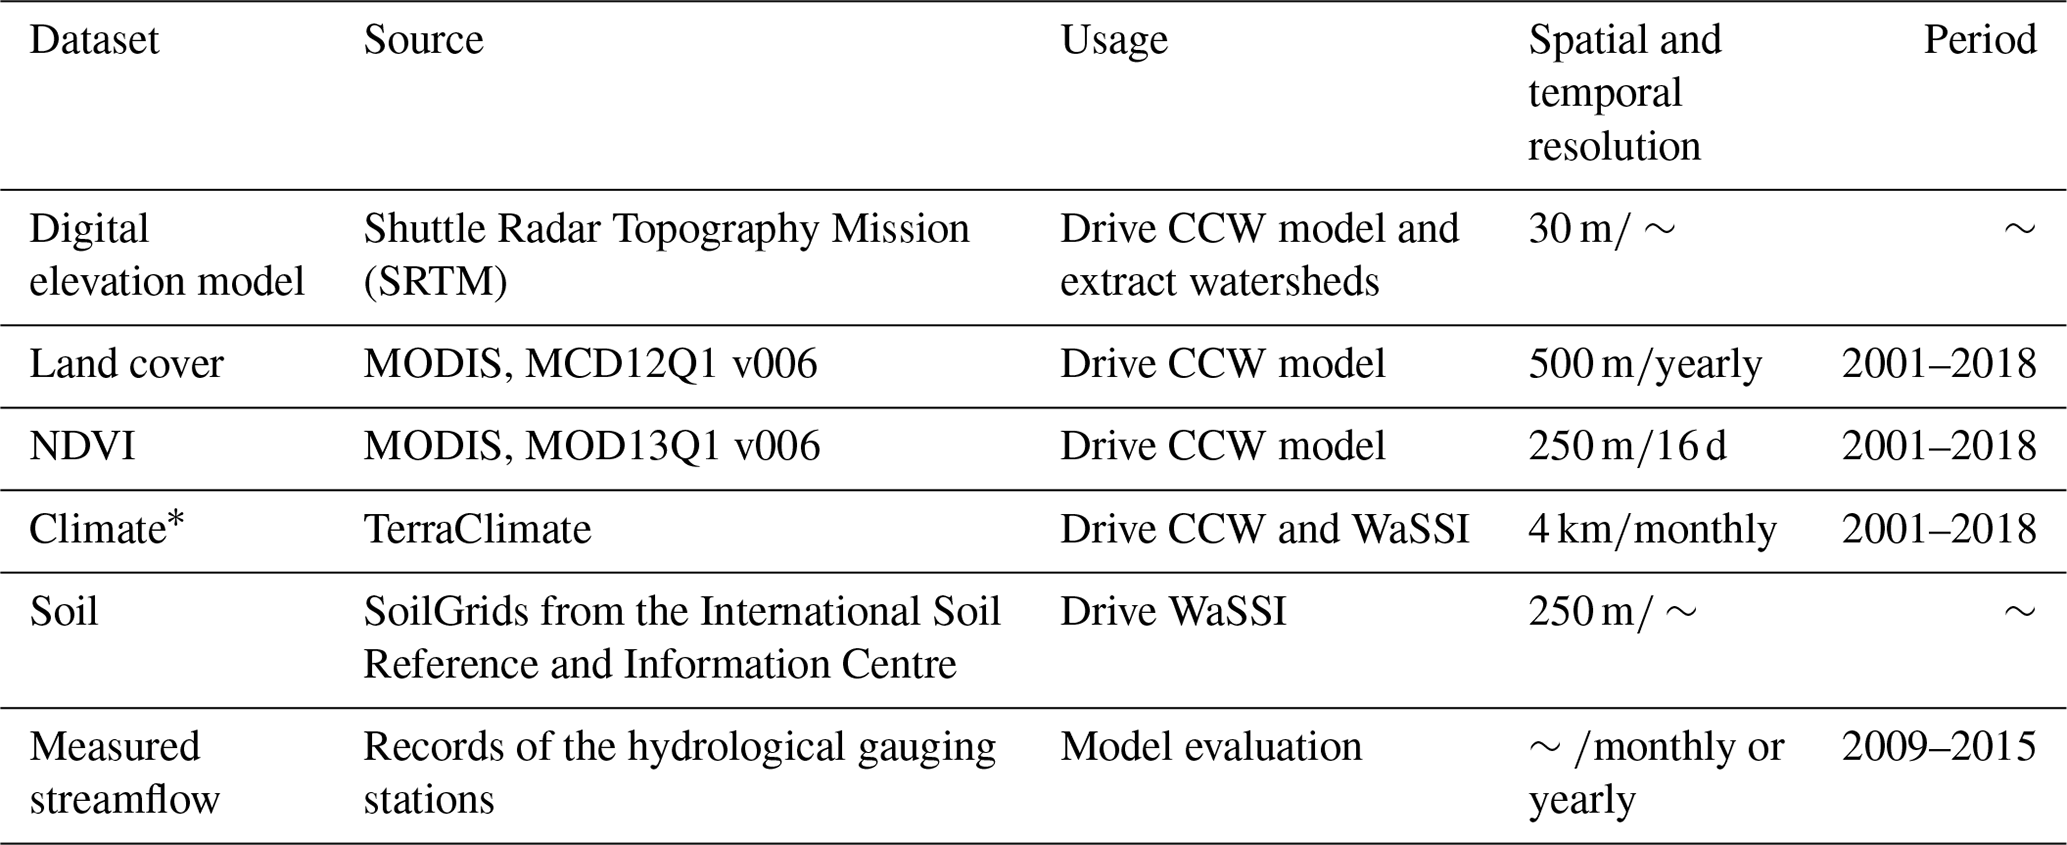
* The climate data (https://developers.google.com/earth-engine/datasets/catalog/IDAHO_EPSCOR_TERRACLIMATE alst access 22 October 2021) include precipitation, air temperature, vapor pressure deficit, and shortwave radiation at monthly time steps.
2.3 Model development
We integrated the WaSSI model (Sun et al., 2011; Caldwell et al., 2012) and the CCW model (Zhang et al., 2016), hereafter referred to as the CCW-WaSSI model, to fully take advantage of the strengths of both models and effectively address our research objectives (Fig. 2). The “water-centric” WaSSI model is an integrated ecohydrological model designed for modeling water balance and carbon assimilation at a broad scale. The key components of WaSSI include a parsimonious ET model and a soil water routing model for estimating ET, water yield, and ecosystem productivity (Sun et al., 2011; Caldwell et al., 2012). To account for the biophysical control on the ET processes, we replaced the ET model in WaSSI and adopted the carbon-centric ET model in CCW. This modification effectively couples the carbon assimilation (gross primary production, GPP) and ET processes at a monthly scale (Zhang et al., 2016). As a result, the hybrid model retains mechanistic linkages between carbon and water in the CCW model and watershed soil water routing in WaSSI and the simplicity and computational efficiency of both models.
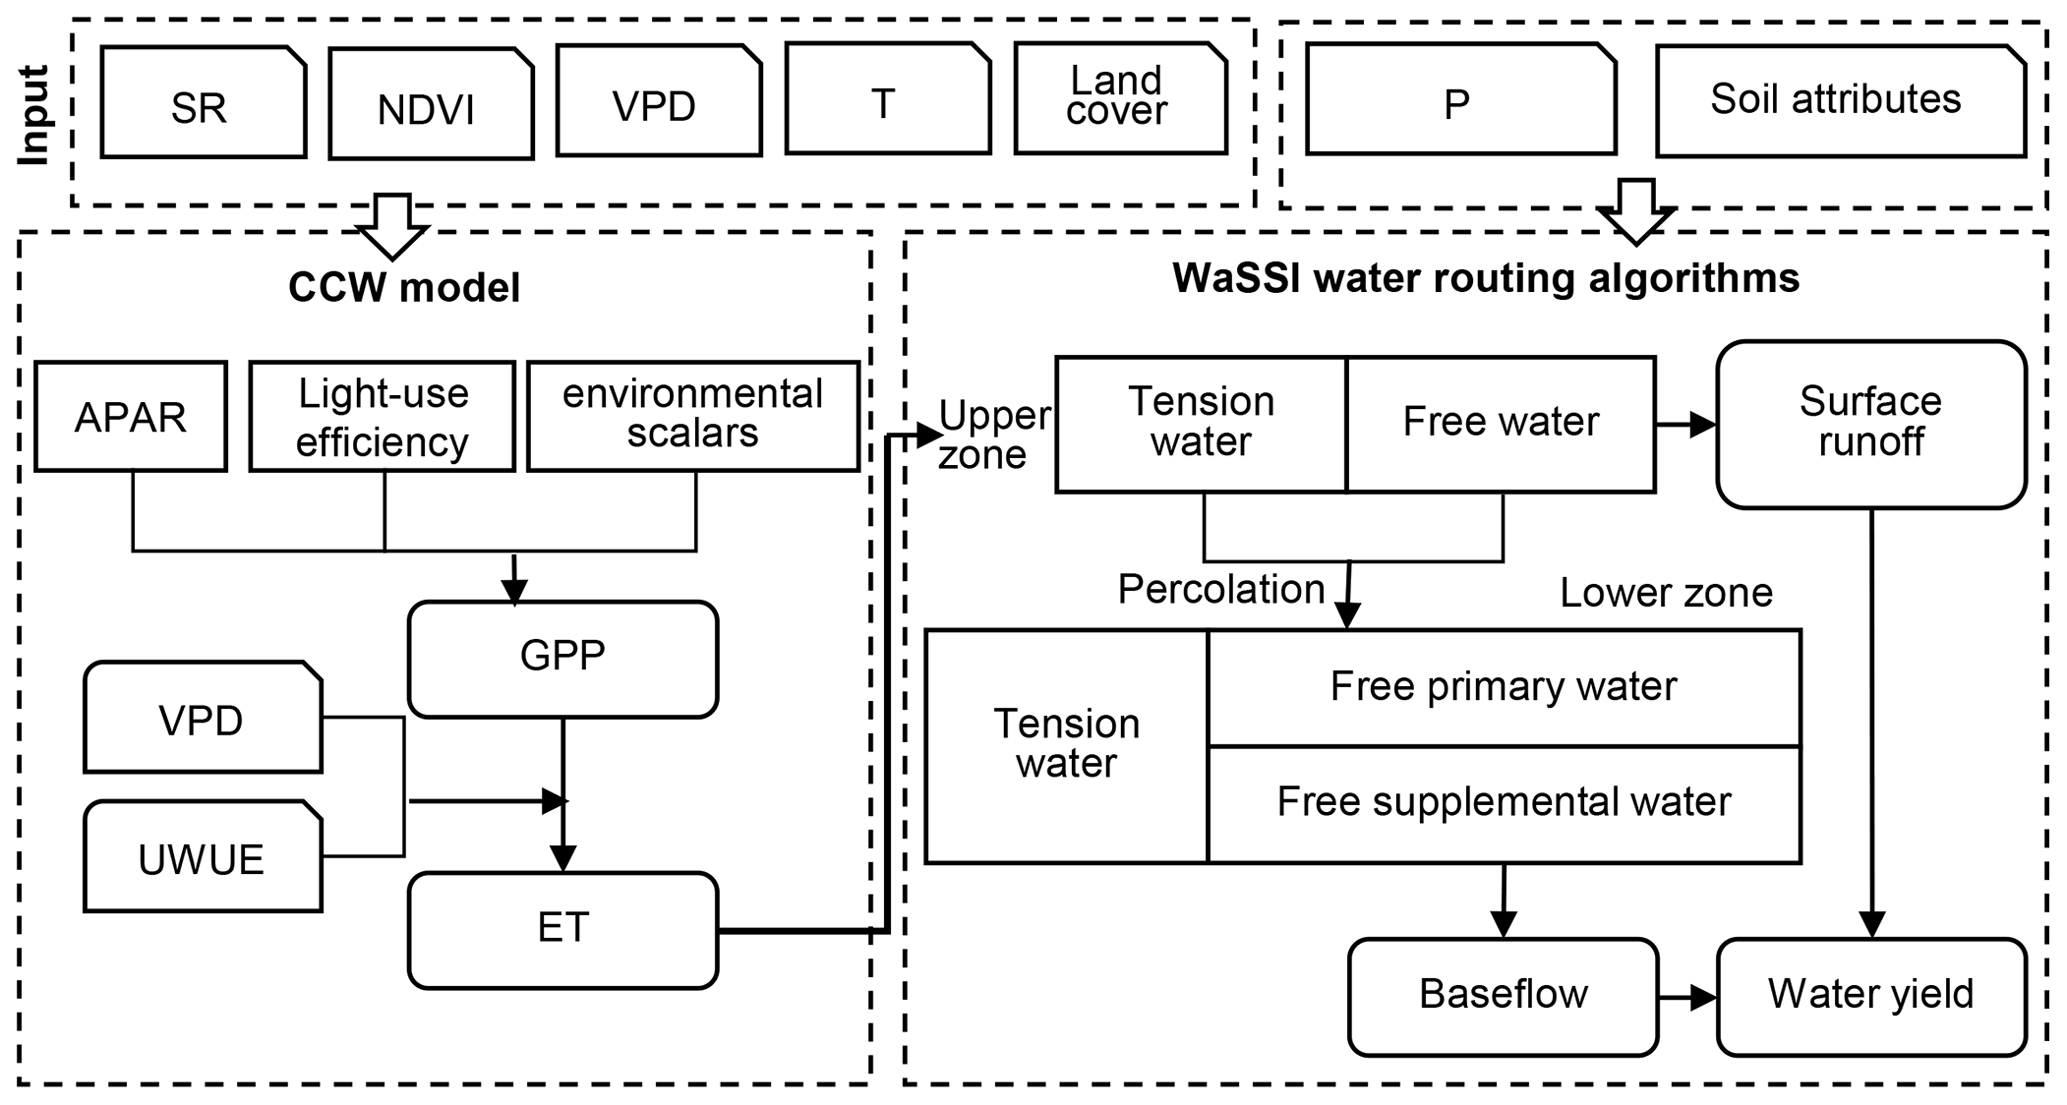
Figure 2The framework of the CCW-WaSSI hybrid ecohydrology model. The corner-snipped rectangles denote inputs of the model, the rectangles denote state variables, and the rounded rectangles denote fluxes as model outputs. Arrows show the model process directions.
CCW has a much simpler model structure than more complex process-based models for ET, e.g., the Penman–Monteith (Penman, 1948; Monteith, 1965), RHESSys (Tague and Band, 2004), and ORCHIDEE (Krinner et al., 2005) models, while maintaining similar accuracy (Zhang et al., 2016; Q. Zhang et al., 2019). Driven by remotely sensed data, CCW first estimates GPP as the product of absorbed photosynthetically active radiation (APAR) and realized light-use efficiency (ε) (Fig. 2), from which ET is estimated based on underlying water-use efficiency (UWUE) theory (Zhou et al., 2014):
where PAR is the photosynthetically active radiation (MJ m−2), which is taken as 45 % of the total shortwave radiation (Running et al., 2000); FPAR is the fraction of PAR absorbed by plants, determined by the NDVI; εpot (g×C MJ−1) is the biome-specific potential light-use efficiency under optimal conditions; Rs, Ts, and Ws are, respectively, environmental scalars (in the range of [0, 1]) related to diffuse radiation, temperature, and moisture stresses on primary production; UWUE represents the biome-specific underlying water-use efficiency, derived from global flux tower data (Pastorello et al., 2020), ranging from 4.5 to 8.4 g C kg H2O. FPAR, Rs, Ts, and Ws were calculated according to Sims et al. (2005), King et al. (2011), Raich et al. (1991), and Landsberg and Waring (1997), respectively, as
where Ra and Rcs are, respectively, actual and clear-sky radiation. The calculation of Rcs is based on Raes et al. (2009). Tmin, Tmax, and Topt are, respectively, the biome-specific minimum, maximum, and optimal air temperature for photosynthetic activity. VPDmin is the biome-specific minimum VPD exceeding which moisture stress starts to take effect. The parameters (εpot, Tmin, Tmax, Topt, VPDmin, K1, and K2) were calibrated based on global FLUXNET data through a Monte Carlo simulation (Zhang et al., 2016; Q. Zhang et al., 2019).
Using ET estimated from CCW, we estimated WY with WaSSI (Fig. 2). The Sacramento Soil Moisture Accounting Model (SAC-SMA) (Burnash, 1995; Burnash et al., 1973) was used to model WY in the WaSSI model, driven by ET, precipitation (P), and soil parameters (Table A1). Soil parameters (Table A1) were generated from multi-layer soil particle-size distribution and depth according to Anderson et al. (2006). The algorithm divides the soil layer into lower and upper zones at different depths and estimates the distribution of moisture – including both tension water components (driven by evapotranspiration and diffusion) and free water components (driven by gravitational forces) in each of these two zones (Fig. 2). The model then uses P, soil moisture, and the basin's relative permeability to estimate total water storage and runoff (Fig. 2).
2.4 Model evaluation
To evaluate the performance of the CCW-WaSSI model, we compared the estimated WY to the measured streamflow of the hydrological gauging stations within the UHRB. We used the six stations within the basin that were relatively free from direct modification (e.g., hydropower plants, reservoirs, dams) (Fig. 1b) to evaluate the model at both monthly and annual scales. We also used the annual streamflow records of the Danjiangkou Reservoir to evaluate the modeled WY for the overall UHRB. It should be noted that the streamflow records of the reservoir were under the influences of at least seven major hydropower plants along the Han River mainstream (Fig. 1b) and several other hydraulic structures within the UHRB. We evaluated model performance using both the Nash–Sutcliffe efficiency (NSE) and the coefficient of determination (R2). The NSE is a widely used statistic variable for assessing the goodness of fit of hydrologic models, defined as one minus the ratio of the error variance of the modeled time series WY divided by the variance of the observed WY time series (McCuen et al., 2006).
2.5 Model simulations of greening effects on water yield
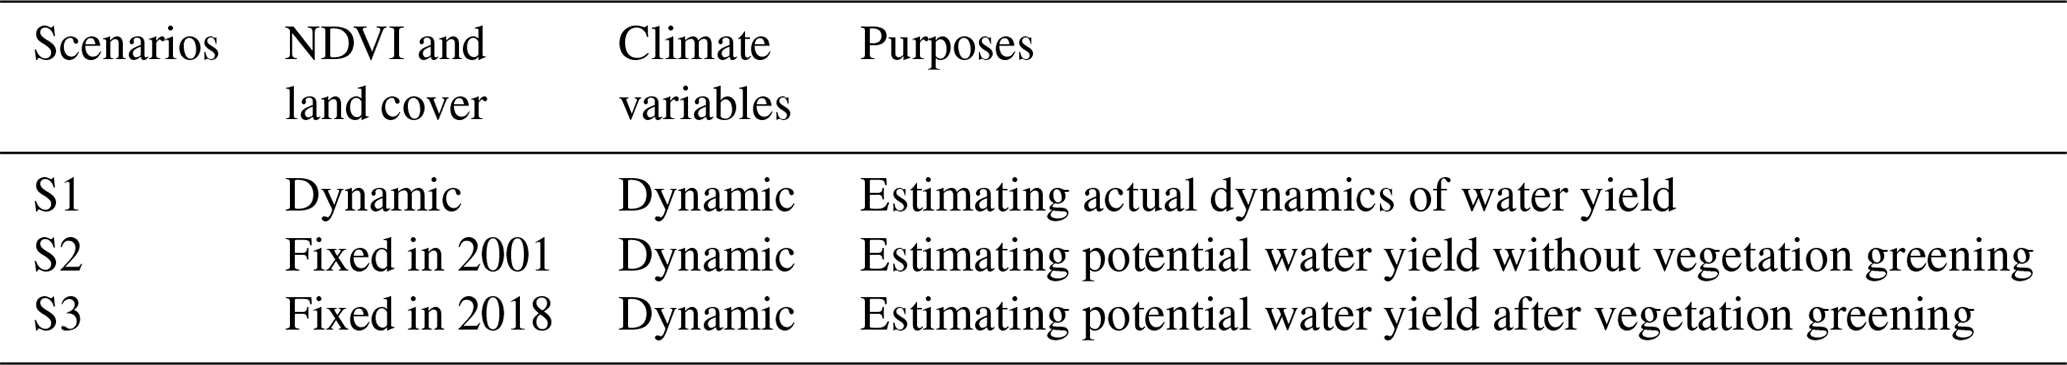
To explore the relative contributions of vegetation and climate on WY, we designed three scenario experiments (Table 2). We first simulated the actual variation of WY based on dynamic land cover type, NDVI, and climate from 2001 to 2018 (Scenario S1), thus representing the combined effects from both climate and vegetation. To isolate the effect of vegetation alone on WY, we designed two more simulation scenarios. In Scenario S2, we fixed land cover and NDVI in 2001, while all climatic variables were allowed to change, thus obtaining climate effects on WY without any vegetation greening. In Scenario S3, we fix land cover and NDVI at 2018 values while allowing the climatic variable to change with time, thus simulating WY after vegetation greening.
Table 2Scenario simulation experimental design to separate the effects of vegetation change from climate effects in the upper Hanjiang River basin.
We estimated two types of greening effects on WY using a difference-in-difference approach: the dynamic greening effects (S1–S2) and potential greening effects (S3–S2). The dynamic greening effects are the dynamic WY changes caused by vegetation greening alone during 2001–2018. The potential greening effects are the differences in WY between S2 and S3, which are the possible changes in WY from vegetation greening during 2001–2018 if each year had the same vegetation greening condition as 2018. Unlike dynamic greening effects, the potential greening effects can present a range of greening effects with the variation of climate conditions, which is expected to continue in the future. To investigate trends in WY for each scenario, we used the Mann–Kendall test, a widely used test in hydrological studies for trend and change point detection (Hamed, 2008).
To quantify changes in hydrological drought risk from vegetation greening, we calculated a hydrological drought index from WY under the three scenarios. Hydrological drought refers to a severe lack of water in the hydrological system, manifesting in abnormally low streamflow in rivers and abnormally low water levels in lakes, reservoirs, and groundwater (van Loon, 2015). Here, the monthly drought index was calculated as the percentages of monthly WY to the mean WY of the same month during 2001–2018 based on simulated WY (Zargar et al., 2011). We then classified drought intensities for each month based on the magnitude of the drought index. Specifically, months with WY within 10 % above or below average were classified as “normal”, months with WY 10 %–30 % above or below average were classified as “moderate drought/wet”, months with WY 30 %–50 % above or below average were classified as “severe drought/wet”, and months with WY greater than 50 % above or below average were classified as “extreme drought/wet”.
3.1 Vegetation and climate changes
The annual mean NDVI over the UHRB showed a significant upward trend with a rate of 0.5 ± 0.1 % yr−1 at the 95 % confidence level (Fig. 3a). Spatially, 97.4 % of the area had increasing trends, 94.0 % of which were statistically significant (p<0.05). The few areas with decreasing trends were distributed around the cities and the Danjiangkou Reservoir. In total, 17.9 % of the land area in the basin experienced a change in land cover between 2001 and 2018. Forest cover increased from 40.9 % (38 753.6 km2) in 2001 to 50.7 % (48 012.6 km2) in 2018 (Fig. 3b), and 98.8 % of the new increased forests were converted from shrubland. Shrubland showed the largest decrease by 18.3 %, from 51.8 % (49 093.4 km2) in 2001 to 42.3 % (40 025.5 km2) in 2018 (Fig. 3b). The area of cropland decreased by 9.9 % from 5175.1 km2 (5.5 %) in 2001 to 4660.8 km2 (4.9 %) in 2018. The area covered by open water more than doubled, from 313.1 km2 in 2001 to 746.6 km2 in 2018, likely caused by increasing water levels in the Danjiangkou Reservoir for providing water to the SNWDP.
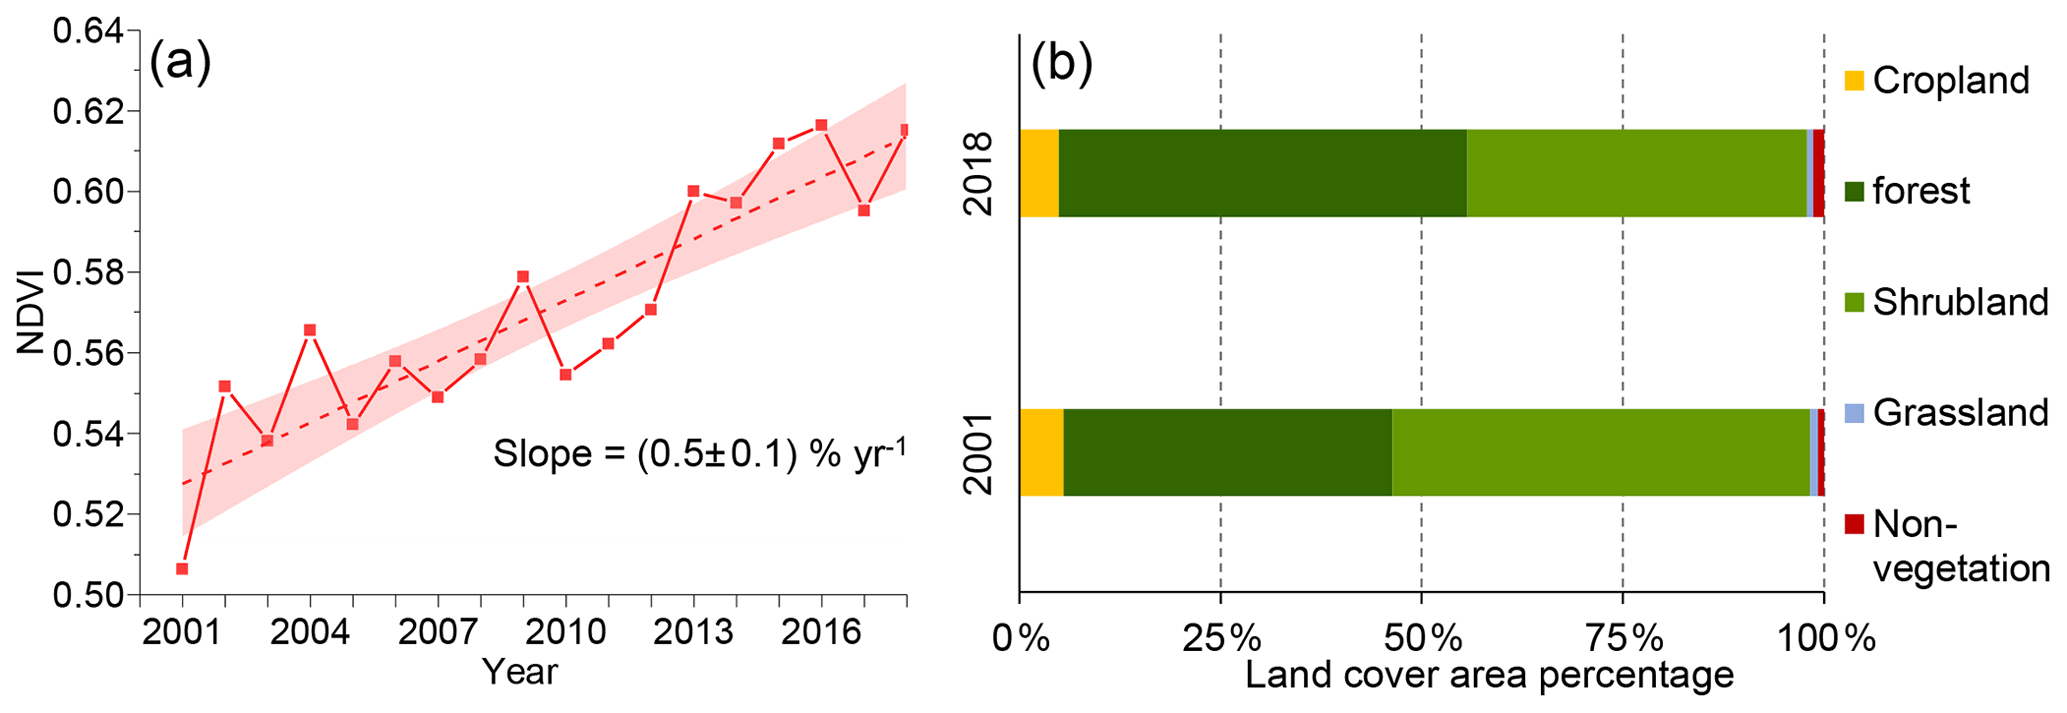
Figure 3(a) The temporal variation of annual mean NDVI in the UHRB during 2001–2018 and its 95 % confidence interval (red shade). (b) The composition of the main land cover types in the UHRB in 2001 and 2018.
Due to high interannual variability and the relatively short study period (less than 20 years), none of the four climatic variables (i.e., P, T, VPD, SR) showed statistically significant trends at the annual scale (Fig. A1 in the Appendix).
3.2 Model evaluation
The CCW-WaSSI model performed well in estimating monthly and annual WY at six hydrological gauging stations in the UHRB. The measured and simulated WY are not only strongly correlated with each other, but also have nearly identical trends ( km3 yr−1 at the 95 % confidence level) (Fig. 4a) at the entire watershed scale. The CCW-WaSSI model captured 90 % of annual WY variation (R2=0.9), with an NSE of 0.8 and root mean squared error (RMSE) of 3.9 km3 yr−1 (Fig. 4a) for the whole UHRB. At the sub-watershed scale based on the six hydrological gauging stations, the model captured 80 % of the annual WY variation (R2=0.8), with an NSE of 0.9 and RMSE of 96.3 mm yr−1 (Fig. 4b). Monthly-scale NSE across the six stations ranged from 0.5 to 0.8 (Fig. 4c), and the model captured 50 %–80 % of the monthly variation (R2=0.5–0.8) of WY with an RMSE of 15.9–30.7 mm per month (Fig. 4c). Averaged across all gauges, monthly NSE was 0.6, R2 was 0.7, and RMSE was 21.2 mm per month.
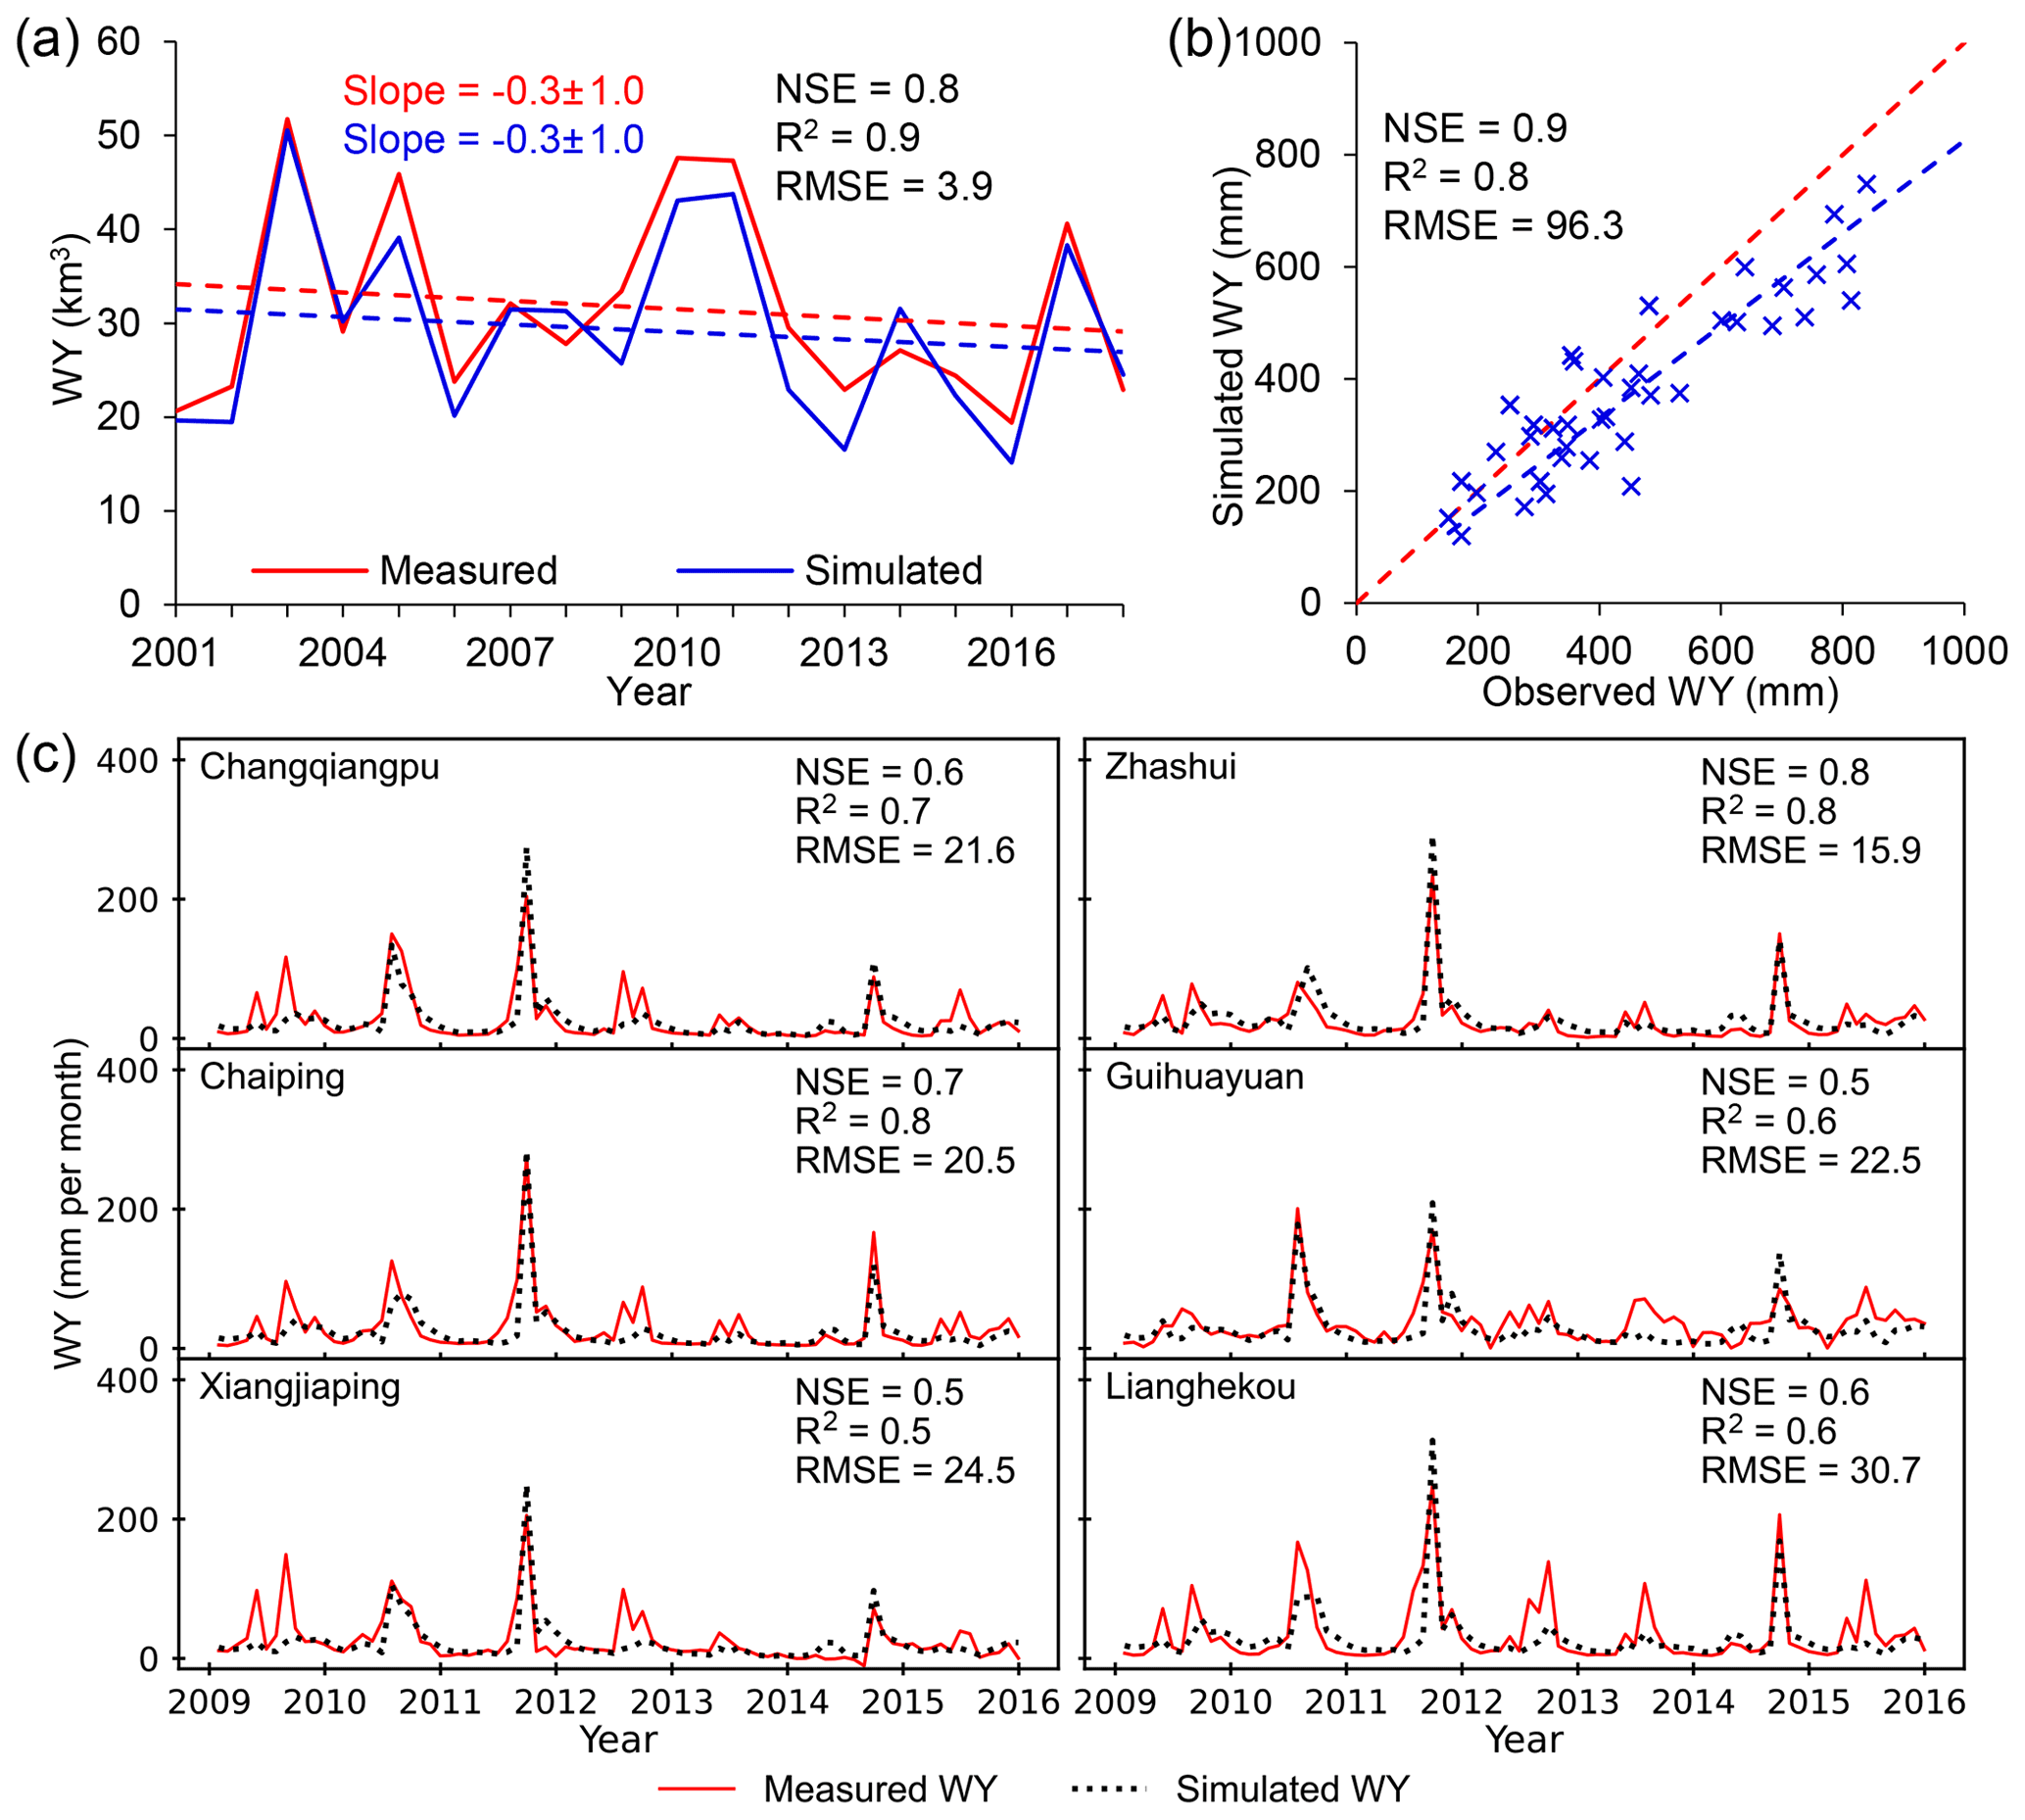
Figure 4(a) Time series of the simulated water yield (WY) and measured streamflow to the Danjiangkou Reservoir at the annual scale and their slopes at 95 % confidence intervals. (b) Comparison between simulated and observed annual WY for six hydrological gauging stations within the UHRB, shown in Fig. 1. (c) Time series of the simulated and measured WY at the monthly scale for six hydrological gauging stations.
3.3 Changes in WY
The UHRB had an annual WY of 160–533 mm yr−1 with a mean of 309 mm yr−1 during 2001–2018 under Scenario 1 (i.e., all factors considered) (S1) (Fig. 5a, b), peaking in late summer to early autumn and accounting for 34 % of the mean annual P (Fig. 5d). The overall WY in the UHRB slightly decreased at a rate of −2.9 ± 10.0 mm yr−1 over the study period at the 95 % confidence level. Decreasing trends of WY occurred over 74 % of the UHRB, though only 9 % of the basin had a trend at the confidence level of 90 % (p<0.10; see Appendix Fig. A2). The model experiments (Scenarios S1 and S2) revealed that vegetation greening had a significant negative effect on annual WY, with a rate of mm yr−1 at the 95 % confidence level during 2001–2018 (Fig. 5c). Spatially, greening induced a WY decrease in 90 % of the UHRB, while WY increases due to greening were mainly in high-elevation areas (above 3000 m). The WY decrease from greening had strong negative correlations over space with elevation () and positive correlation with average annual temperature (R=0.7) and VPD (R=0.8). The effects of climate on WY varied substantially from year to year, with a standard deviation (SD) of 101.9 mm, but had no significant trend (0.4±10.0 mm yr−1 at the 95 % confidence level; Figure 5c). These climate effects were also the main driver of overall annual WY variation (SD = 108.6).
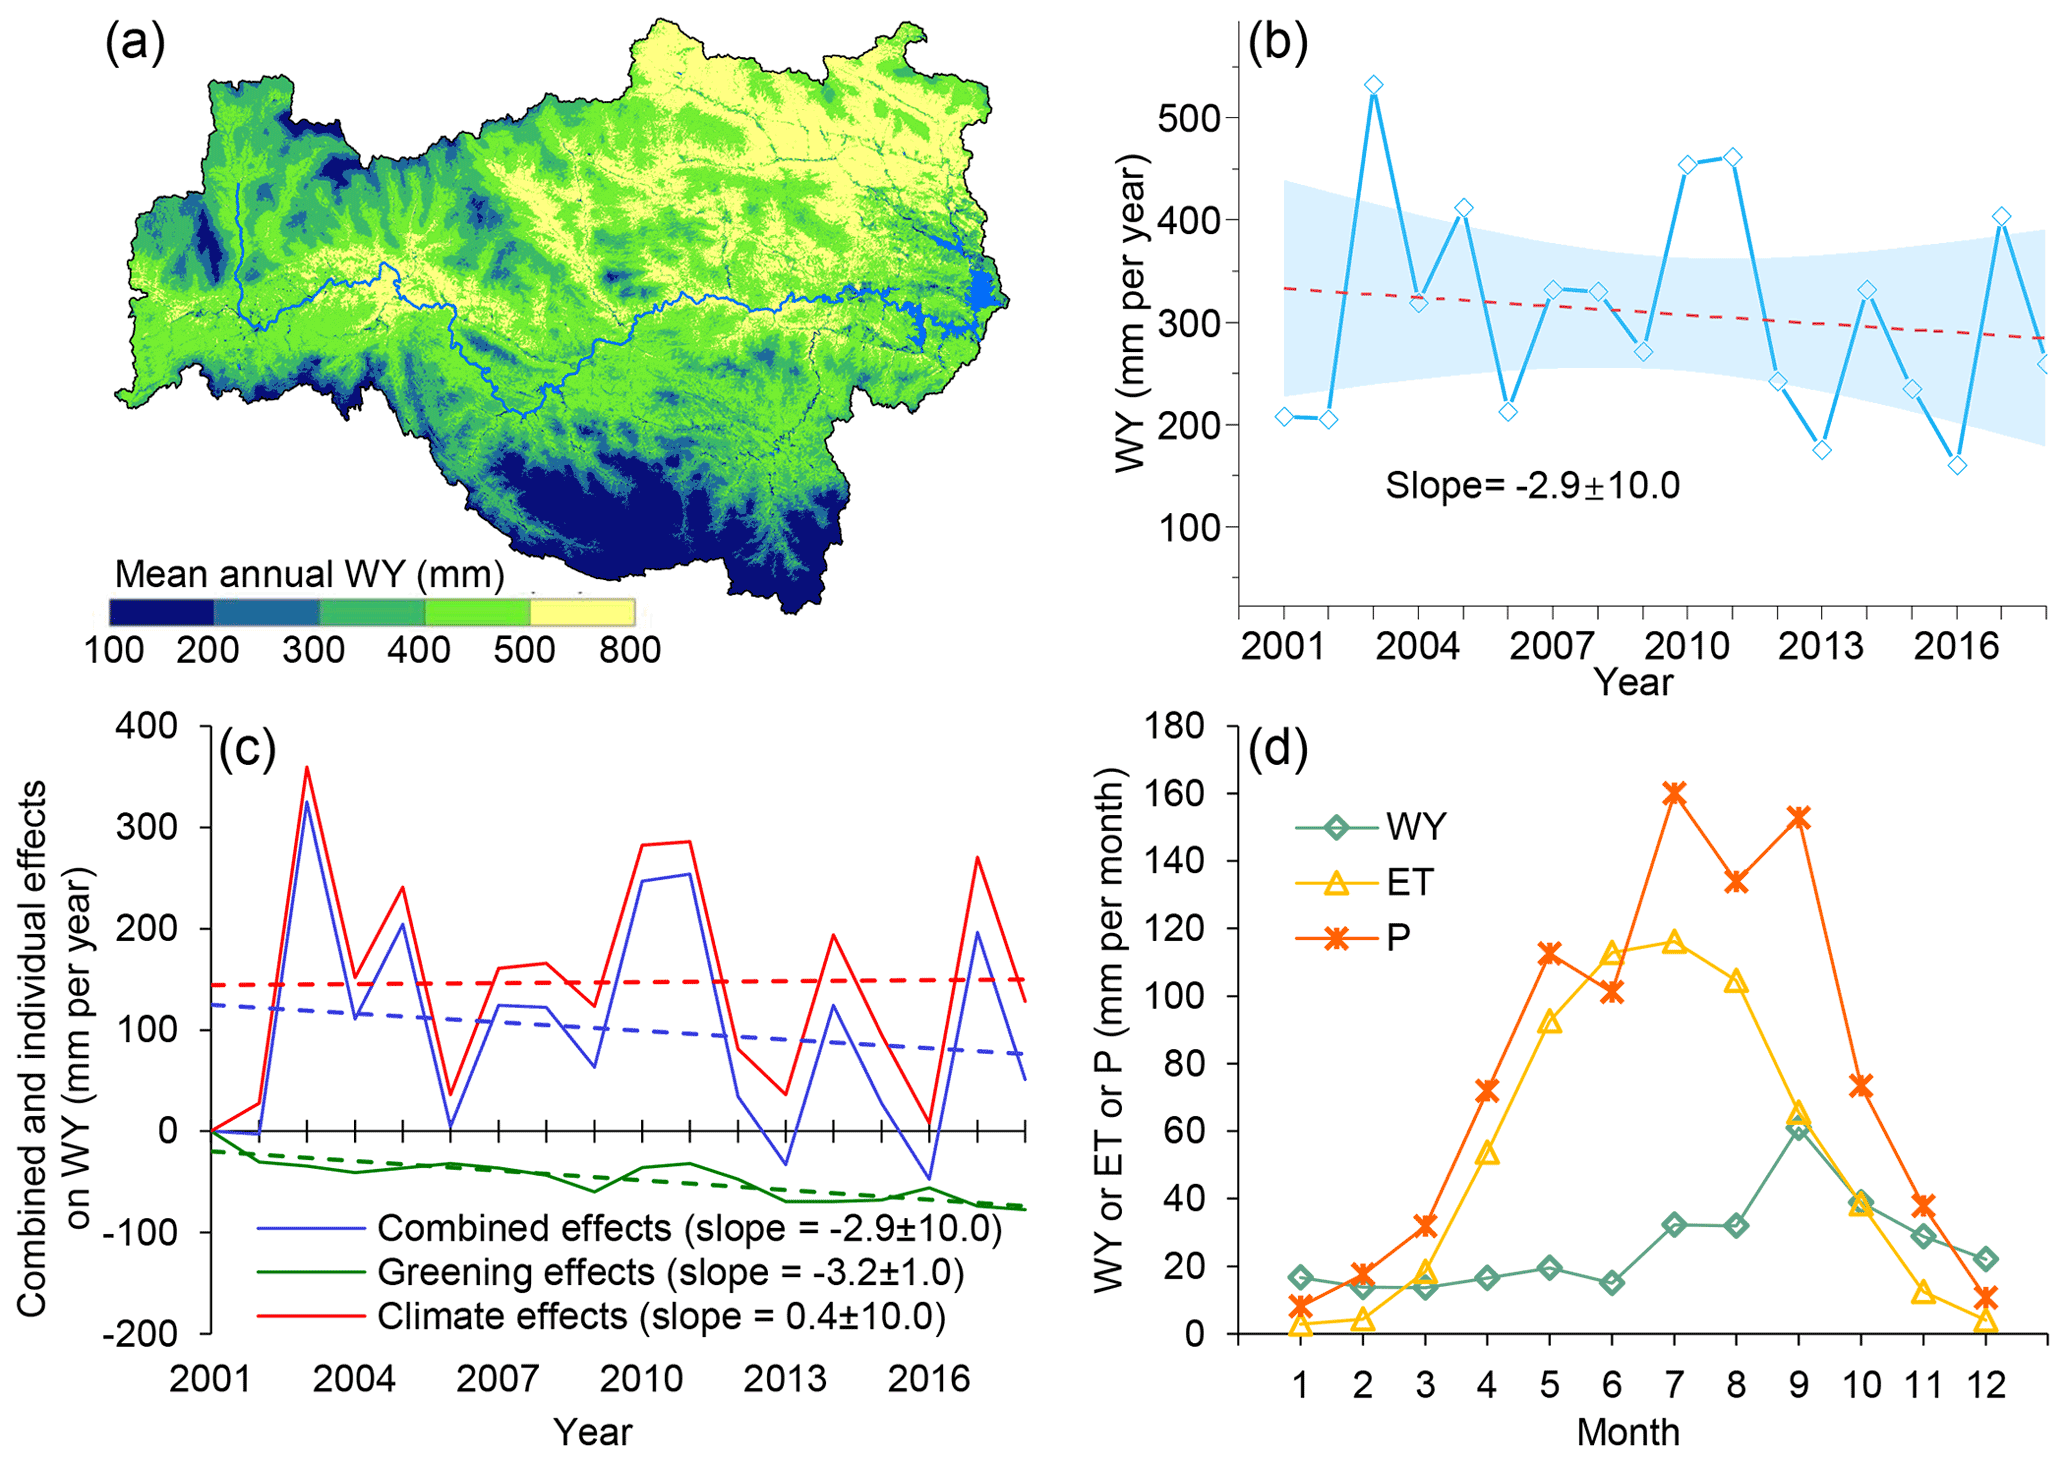
Figure 5(a) The spatial distribution of modeled mean annual WY during 2001–2018 in the upper Han River basin. (b) The temporal variation of modeled annual WY (Scenario S1) during 2001–2018 and its 95 % confidence interval (blue shade). (c) The combined and individual effects of vegetation and climate on WY during 2001–2018 and their slopes at 95 % confidence intervals. (d) Average monthly evapotranspiration (ET), WY, and precipitation (P) during 2001–2018.
In addition to reducing total WY, vegetation greening also significantly reduced the ratio of annual WY to P (Fig. 6a). After 2003, the ratio decreased with a significant trend of 0.01±0.008 yr−1 at the 95 % confidence level (Fig. 6a). The annual WY ratio also had a significant negative correlation with the NDVI, with a correlation coefficient of −0.7 (p<0.001) (Fig. 6b).
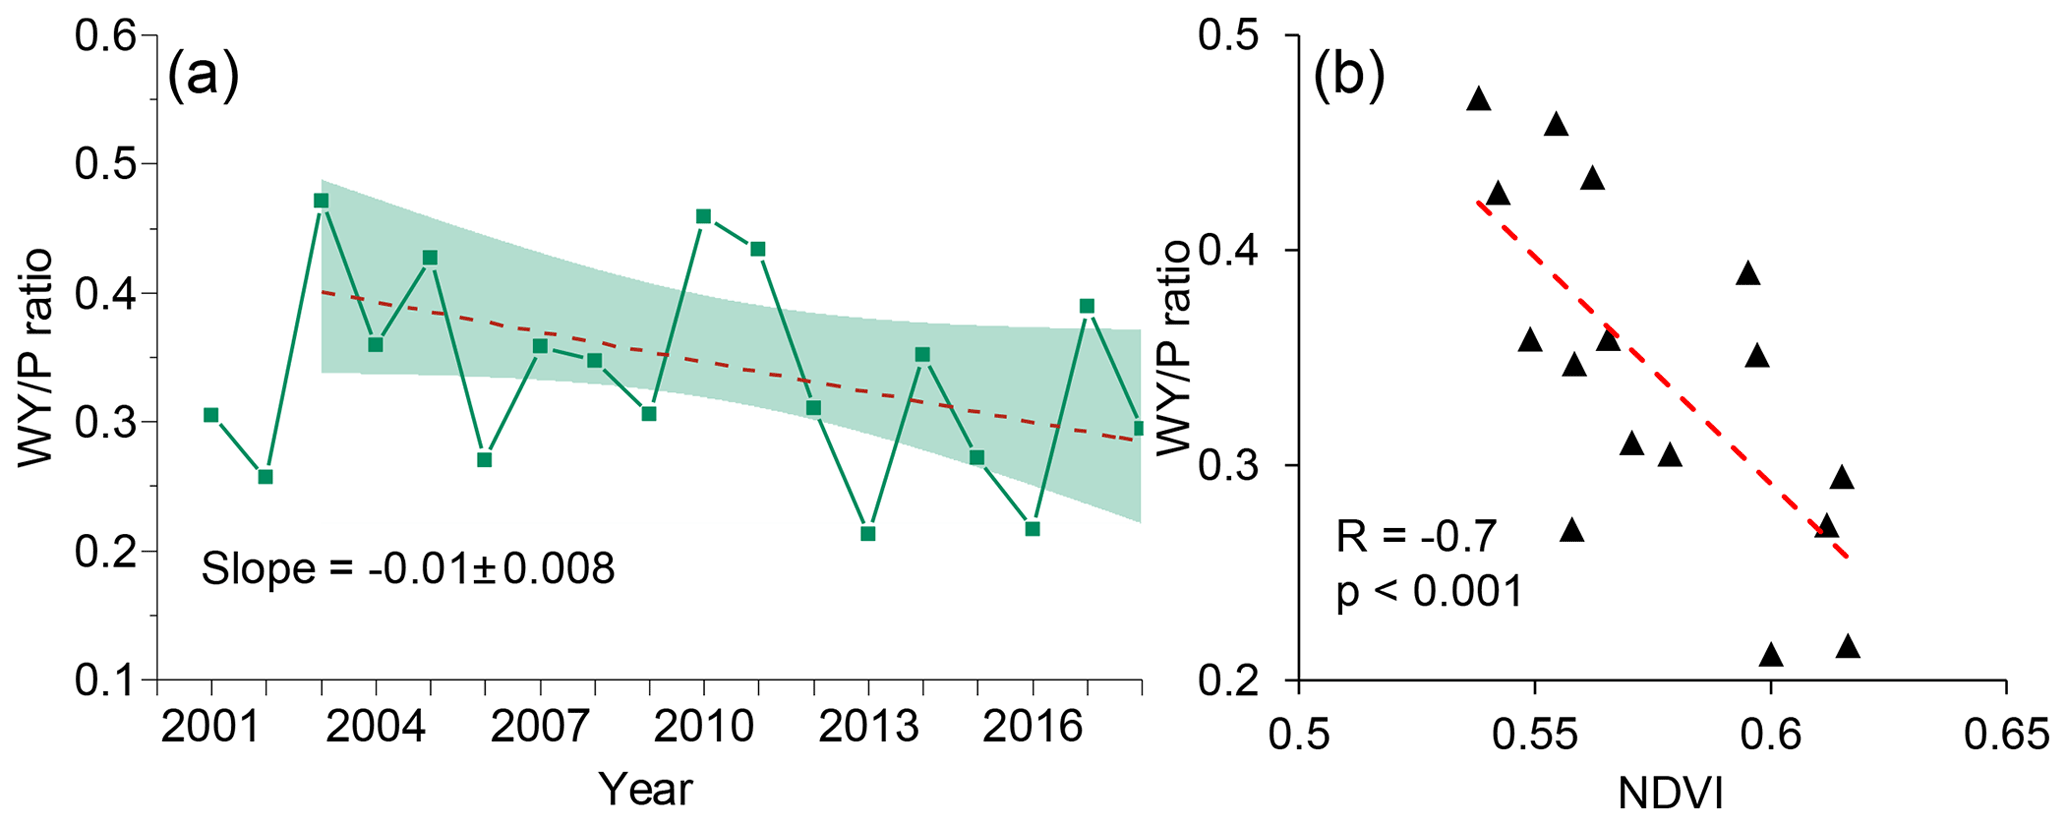
Figure 6(a) The temporal variation of annual WY (water yield precipitation) ratio; the red dotted line denotes the trend for the period 2003–2018, and the green shade is the 95 % confidence interval. (b) The scatter plot between WY ratio and NDVI during 2003–2018.
3.4 Potential greening effects on WY in different climate conditions
The greening trend from 2001 to 2018 significantly reduced WY, but the same greening trend could exert different effects on WY depending on climate conditions (Fig. 7). By comparing the WY without greening (Scenario S2) and after greening (Scenario S3) but with dynamic climate variability, we found that the vegetation greening could potentially induce a reduction of 77.1 mm in annual WY on average, accounting for 25 % of the mean annual WY (308.5 mm) during 2001–2018. The 2018 vegetation greening condition could have caused the largest decrease in WY by 99.3 mm in 2003 and the lowest by 43.9 mm in 2001 (Fig. 7). The relative changes in WY derived from S2 and S3 during 2001–2018 ranged from 14 % (2011) to 31 % (2002) (Fig. 7).

Figure 7The annual WY without vegetation greening and potential effects of vegetation greening on WY from 2001 to 2018 derived from the difference between S2 and S3 under different climate conditions and their proportion to WY without greening.
The differences in potential vegetation greening effects on WY could result from different climate conditions in those years. In order to understand the relationship between the potential greening effects on WY and climate, we explored the correlation between greening-induced ET and WY changes and climate variables (Fig. 8). The three climate variables (SR, T, VPD) have strong positive correlations (R>0.6) with potential absolute ET changes from greening (Fig. 8), indicating that vegetation greening would increase ET more in a warmer and drier climate. In contrast, the three climate variables are not as strongly correlated with potential absolute WY changes from greening (Fig. 8). The nature of the relationship reversed for potential relative WY changes from greening compared with those of the absolute WY changes. The greening effects on proportional change in WY were positively correlated with T (R=0.7, p=0.02), SR (R=0.5, p=0.00), and VPD (R=0.4, p=0.06) (Fig. 8) and negatively correlated with P (, p=0.00), indicating that vegetation greening could cause more proportional WY decrease in dry years. Regression analyses also revealed that the proportional WY changes from greening would increase by one percentage point per 0.1 ∘C increase in T or 0.3 hPa increase in VPD.
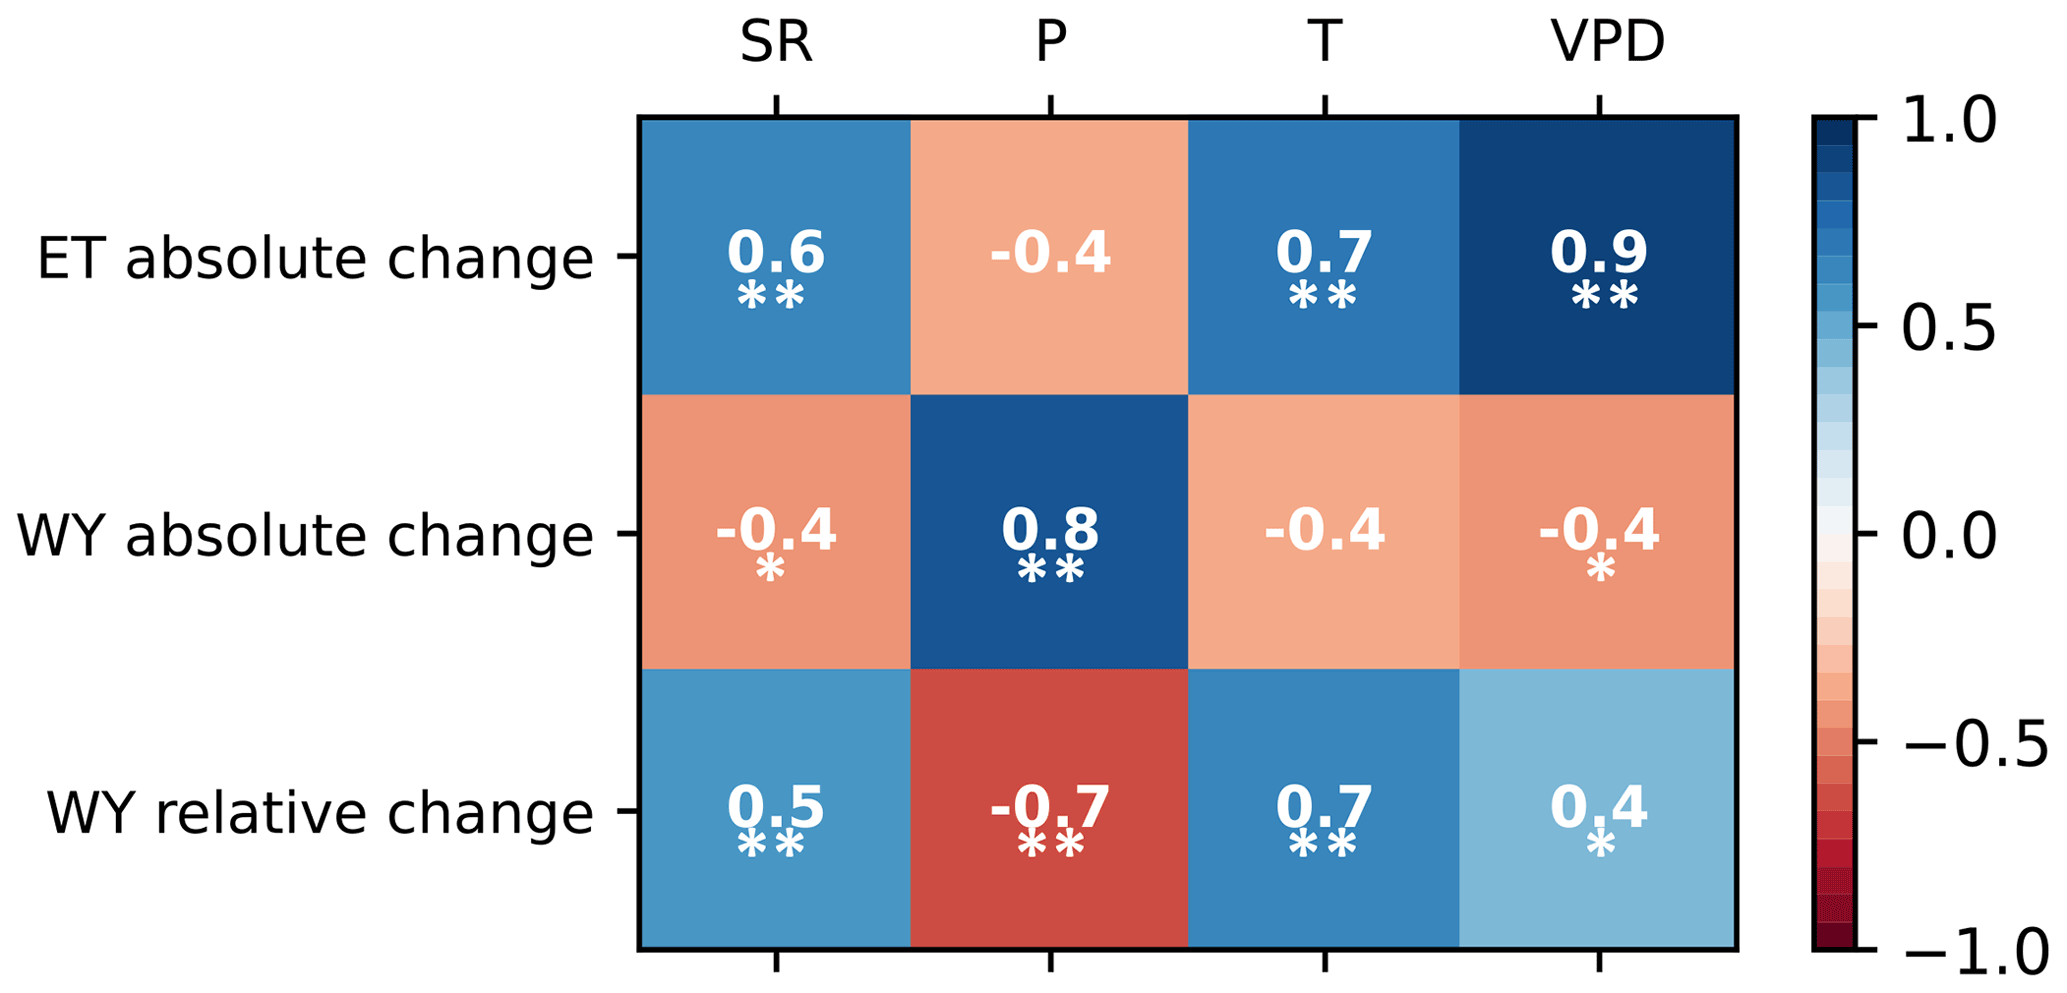
Figure 8Correlation coefficients between potential greening effects on ET and WY and climate variables (shortwave radiation, SR; precipitation, P; temperature, T; and vapor pressure deficit, VPD). The absolute changes refer to total magnitude change in ET or WY from vegetation greening, while the relative changes denote the proportional change in WY after greening relative to WY without any greening. The numbers in boxes are the corresponding correlation coefficients. Double asterisks denote p<0.05; single asterisks denote p<0.10.
3.5 Changes in hydrological drought risk from vegetation greening
Hydrological drought risks increased due to vegetation greening. There were 109 drought months during 2001–2018 based on Scenario S1 (dynamic climate and vegetation), but there were only 87 drought months of the same intensity in the scenario without greening (S2) (Fig. 9). In contrast, the number of hydrological drought months increased to 132 in the scenario with 2018 greenness (S3) (Fig. 9). The risk of extreme hydrological drought more than doubled between the scenarios without greening (17 total months) and after greening (42 total months), indicating that vegetation greening during 2001–2018 could not only increase the frequency of hydrological drought relative to historical norms, but could also amplify the intensity of those hydrological droughts.
Given that the monsoon period (July–November) contributes about 70 % of annual WY in the UHRB, changes in hydrological drought risk during the monsoon period is more critical to water supply capacity to the water diversion project than other months. Nearly two-thirds (63 %) of months experiencing severe or extreme hydrological drought for Scenario S1 were during the monsoon periods (July–November) of 2001–2018. Vegetation greening could potentially cause a reduction in WY during the monsoon period of 38.2 mm on average, accounting for 18 % of the mean WY without greening during the monsoon period. The six driest monsoon periods were in severe or extreme hydrological drought (less than 70 % of mean WY) during 2001–2018, during which vegetation greening could potentially cause a WY decrease of 23.2 mm, accounting for 23 % of the WY without greening.
4.1 Reduced water yield and drought amplification from greening
Paired catchment and modeling studies provided evidence that vegetation greening and/or afforestation would increase ET and decrease WY (Bosch and Hewlett, 1982; Farley et al., 2005; Liu et al., 2008). However, the extent of the effects of vegetation greening varies in different climate conditions (Bai et al., 2020; Ingwersen, 1985). Typically, WY is more sensitive to vegetation greening in water-limited regions than in energy-limited regions (Feng et al., 2016). For example, in the Loess Plateau, an arid/semi-arid area of China, the ratio of annual WY to P decreased from 8 % before afforestation (1980–1999) to 5 % as vegetation increased during 2000–2010 (Feng et al., 2016). In contrast, the Poyang Lake basin, a subtropical basin in Southeast China with an annual P of around 1800 mm experienced greening as well, but its effects on annual WY were limited (Guo et al., 2008; Wang et al., 2018). Unlike the previous two examples, vegetation greening in the UHRB induced a substantial decrease in WY (Scenario S2), but WY under the combined effects (Scenario S1) did not have a statistically significant trend as a result of the large interannual variation of the climate.

Figure 9The percentages of counts of months in the different hydrological drought intensities for actual WY (S1), WY without greening (S2), and WY after greening (S3) (numbers in color bars are the corresponding counts of months).
The UHRB is located on the southern side of the Qinling Mountains, which marks the northern edge of the subtropical monsoon and the dividing line between the subtropical and temperate zones in China (Fig. 1a). The P in the UHRB is less than that of other subtropical basins (e.g., Poyang Lake basin), but ET of the UHRB is comparable to those subtropical basins due to the abundance of vegetation. The climate regime and vegetation cover make the UHRB more likely to suffer hydrological drought, and the water cycle can largely be influenced by vegetation dynamics. While the WY of the Poyang Lake basin would only decrease by approximately 3 % even under an extreme greening scenario (Guo et al., 2008; Tang et al., 2018), the effects of vegetation greening on the water cycle in the UHRB are much larger than this, with a decrease in WY of up to 25 % for comparable levels of vegetation greening (Fig. 5c). However, as the latest round of afforestation efforts is about to conclude, implementation of afforestation projects will likely soon slow down in China, and combined with potential limitations from future water stress (Feng et al., 2021), the current greening trend may not continue or even slow down in the UHRB in the future.
Although vegetation greening had negative effects on WY at the regional scale, as we found in the UHRB, some previous studies indicated that vegetation greening could increase WY at larger spatial scales (Ellison et al., 2012; Makarieva et al., 2007; Spracklen et al., 2012). Enhanced ET from vegetation could moisten the atmosphere, thus driving P to increase (Ellison et al., 2012). On the other hand, Makarieva et al. (2007) argued that increases in ET could drive the transport of water vapor across continental space via changing atmospheric pressure dynamics. Therefore, vegetation greening in the UHRB may also potentially increase P via increasing atmospheric vapor. However, the amount of recycled P is strongly dependent on the watershed area, with larger geographical expanses having greater potential for recycling (Ellison et al., 2012). At the regional scale, 87 % of the atmosphere moisture through enhanced ET in nine large basins around the world is not likely to recycle back as P but transport to other regions (Ellison et al., 2012). The proportion of recycled P in the UHRB would be lower due to its smaller extent. Tuinenburg et al. (2020) found that moisture from the ocean contributes approximately 67 % of P in the Yangtze River basin (where the UHRB located). In addition, the atmosphere moisture through enhanced ET in the upwind areas was possible to transport to the downwind, thus increasing P (Ellison et al., 2017). The upwind areas of the UHRB, Southeast China, also experienced vegetation greening simultaneously (Chen et al., 2019), which may lead to P increase in the UHRB. A modeling study found that vegetation greening only induced an P increase of 1.5 % per decade in the Yangtze River basin from 1982 to 2011 (Li et al., 2018). Given that no particular trend in annual P in the UHRB was observed (Fig. A1b), the effects of local and upwind greening on P may be limited during the study period. However, such complex feedbacks among vegetation, evaporation, and precipitation are worth investigating in the future.
Aside from greening, temperature and VPD are also critical factors in the interaction between vegetation and the water cycle. Drought risk has increased globally in recent decades and will likely continue to increase in the future as a result of anthropogenic climate change (Cook et al., 2020; Huang et al., 2016; Lesk et al., 2016; Williams et al., 2020). An increase in temperature increases saturation vapor pressure of the atmosphere, which in turn increases global VPD (Yuan et al., 2019; Q. Zhang et al., 2019), especially when combined with a decrease in oceanic evaporation (Trenberth et al., 2007), which contributes approximately 85 % of atmospheric water vapor. Here, we show that the same greening trend could cause a greater decline in WY under higher temperature and VPD conditions.
4.2 Trade-offs among ecosystem goods and services induced by greening
One of the initial intentions of afforestation and vegetation restoration projects in the UHRB was reducing soil erosion and sedimentation, thus improving water quality in the downstream. The projects had achieved these goals to some extent according to government reports and related studies (Qi et al., 2019; Li et al., 2008). Vegetation recovery in the UHRB reduced annual sediment by 1.7×10⁷ metric tons from 2000 to 2010, representing 13 % of sediment loading in 2000 (Qi et al., 2019). An in situ sample analysis found that the watersheds in the UHRB with higher vegetation cover had relatively better water quality in terms of turbidity, suspended particulate matter, and dissolved solids (Li et al., 2008). Zhang et al. (2014) found that vegetation greening also had additional benefits by enhancing vegetation productivity and potentially increasing carbon sequestration in the Yangtze River basin, in which the UHRB as a sub-basin is a major contributor.
On the other hand, as indicated by our study, the afforestation and vegetation greening could decrease WY in the UHRB by enhancing ET and thus reducing the water supply capacity to the SNWDP. Although the capacity of the water supply to the SNWDP is directly linked to the holding capacity of the source reservoir (i.e., Danjiangkou Reservoir; Fig. 1b), it is influenced by the net water yield produced by the UHRB, which can be approximately estimated as WY of the UHRB minus the downstream water demand. The downstream water-use demands include household, agriculture, and industry as well as a basic flow maintaining rate for shipping and pollutant dilution (Li et al., 2017; Liu et al., 2003), likely ranging from 12.2 to 18.5 km3 yr−1 (Hu and Guo, 2006; Li et al., 2017; Liu et al., 2003; Xu and Chang, 2009). In the future, as our modeling experiments show (i.e., Scenario S3), the water supply capacity to the SNWDP could be 14 km3 yr−1 on average even if vegetation greenness does not continue to increase beyond the 2018 level and the climate regime remains stable by assuming the lower bound of downstream water demand to be 12.2 km3 yr−1. In contrast, the water supply capacity would be about 21 km3 yr−1 if the UHRB had pre-2001 vegetation conditions (Scenario S2), indicating that vegetation greening during 2001–2018 could decrease the water supply capacity of the UHRB to the SNWDP by 7.3 km3 yr−1, accounting for 77 % of the planned annual water diversion target of the Phase I project (9.5 km3 yr−1).
The capacity of water supply to the SNWDP in the source Danjiangkou Reservoir was highly influenced by the seasonal water yield under extreme climate conditions such as drought in the UHRB. Vegetation greening could significantly exacerbate the risk, duration, and intensity of hydrological drought by enhancing ET, although the possible negative feedback of drought on vegetation could slow down such effects. Consequently, the water storage of the reservoir would rapidly decrease as hydrological drought progresses, thus directly lowering the water diversion potential to the SNWDP, although the active reservoir management may reduce the water shortage risk for the SNWDP. In such scenarios, the SNWDP would have to face a dilemma of balancing the trade-off of forest ecosystem services induced by the ongoing afforestation and vegetation greening: local WY was significantly reduced despite an improvement in water quality (Li et al., 2008) and carbon uptake (Zhang et al., 2014).
4.3 Implications for water diversion projects
Compared to other water diversion projects (WDPs) around the world, the middle route of the SNWDP diverts a much larger proportion of water yield from the source basin (UHRB) (Shumilova et al., 2018). About one-third to half of the total annual WY from UHRB is diverted by the SNWDP. In contrast, 78 % of the water diversions in the US in 1973–1982 extracted <1 % of annual streamflow from the source basins (Emanuel et al., 2015). Consequently, the middle route of the SNWDP has a large influence on the natural water balance in the water source basin, and the water diversion capacity is more vulnerable to hydrological drought events. In addition, more than 12 million people live downstream of the UHRB, and 12 000 km2 of farmlands and many large-scale industries all rely on water from the UHRB. Currently, the perennial mean water available for diversion is 12–14 km3 yr−1 but only about 6 km3 yr−1 in dry years (Wang and Yang, 2005). Water supply under severe droughts could be much lower (Barnett et al., 2015), and increasing frequency or severity of drought events will challenge the feasibility of the project (Liu et al., 2015). The inflow of the Danjiangkou Reservoir showed a sharp decrease from 41.0 km3 during 1951–1989 to 31.6 km3 yr−1 during 1990–2006, largely attributed to the reduction of precipitation (Liu et al., 2012). According to official statistics of the SNWDP (middle route), the capacity of the water supply of the UHRB may not be able to meet expectations, partly due to the insufficient WY in the UHRB during the operational period relative to long-term levels (Zhang et al., 2020). To stabilize the water supply of the middle route of the SNWDP, the Phase II project will construct an additional canal to divert water from the mainstream Yangtze River to the Danjiangkou Reservoir.
Watershed management to reduce soil erosion and sedimentation is essential in maintaining headwater watersheds for clean water supply in WDPs (Li et al., 2008). Our study suggests that, with recovery of forest vegetation and associated “greening”, water yield could be significantly reduced, especially during drought periods. Therefore, navigating the trade-off between water quality improvement and water yield and supply should be an important consideration for current and future WDPs. To achieve this, we suggest that local rather than fast-growing exotic tree species should be used to minimize water use while still serving soil erosion control and ecological restoration purposes (Sasaki et al., 2008; Cao et al., 2011). Soils in natural forests may have more organic matter and higher surface infiltration rates compared to plantation forests in southern China (Yang et al., 2019) and hence generate less sediment (Piégay et al., 2004). Forest management measures, such as stand thinning to reduce water use and fire risk, should also be considered part of an integrated watershed management strategy.
Managing water stress needs to consider both supply and demand. From the perspective of water demand in North China, water transfer from the south supplied more than 70 % of the domestic water use in the project-served cities in 2019. Moreover, the probability of concurrent drought events between the UHRB and North China is highly likely to increase in the next 30 years (Liu et al., 2015). Consequently, any fluctuation of water yield or water quality problem in the UHRB may influence the water supply of the serviced cities with a huge population. Therefore, it is risky for cities in North China to become over-dependent on water diversion. Comprehensive water management policies are needed to sustain the water supply from the UHRB and thus maximally meet the water demand in North China.
4.4 Limitations
Several limitations are worthy of being mentioned. First, we designed three modeling experiments to separate the effects of vegetation greening from those of climate change on WY. Using a new modeling tool, we found that vegetation greening significantly affected water yield from 2001 to 2018. However, it is impossible to completely decouple the effects of climate change and vegetation greening on hydrological dynamics due to the close biophysical interactions and feedbacks between vegetation and climate. The observed vegetation change, as indicated by the NDVI, represents the combined effects of changes in climate, human activity (i.e., reforestation, irrigation), and natural vegetation (re)growth. However, because P, T, VPD and radiation had relatively small and insignificant trends during the study period (Fig. A1), the effects of climate on the vegetation change (NDVI trend and land cover change) were likely relatively minor compared to direct human modification of the landscape and vegetation growth. Second, as stated before, vegetation greening in the local and upwind areas may potentially increase P downwind via increased atmospheric vapor. This water vapor cycling likely offsets some negative local vegetation effects of increased ET on WY. The climate data used as model inputs might implicitly include a certain level of the feedback effects from vegetation greening, but those effects could not be explicitly disentangled in our analysis. Thus, our results represent an attempt to estimate the direct, first-order net effects of climate and vegetation greening on WY. Third, the potential effects of CO2 fertilization on WY were not explicitly included in this study, although previous work has shown that forest water-use efficiency only increased by about 15 %–20 % over the entire 20th century (Frank et al., 2015) and that the fertilization effect is weakening (Wang et al., 2020). Lastly, the future effects of vegetation greening on hydrological dynamics and thus water supply for the SNWDP depend on the projected warming and drying climate, the continuance of vegetation greening, and the complex feedbacks among climate, soil, and vegetation, which deserve long-term monitoring and deeper investigations in the future.
Using a coupled watershed ecohydrological model, we found that vegetation greening significantly decreased annual water yield on an order of 3.2±1.0 mm yr−1 (p<0.05) in the upper Han River basin during 2001–2018. Vegetation greening exacerbated hydrological drought risk and reduced about a quarter of water yield on average during hydrological drought periods. This decline in water yield due to vegetation greening has the potential to reduce the capacity of water supply to the South-to-North Water Diversion Project, a key project providing water for 400 million people in North China. Despite the enormous ecosystem goods and services provided by forest (e.g., carbon sequestration, water quality improvement, and regulation of air temperature and moisture), our study suggests that navigating the trade-off of water supply with these benefits in source watersheds is an important consideration in large water diversion projects. Integrated watershed management (e.g., forest management practices for reducing water use in headwaters) becomes increasingly essential in vegetation “greening-up” regions, especially in the context of a changing climate and increasing water demand for human use.
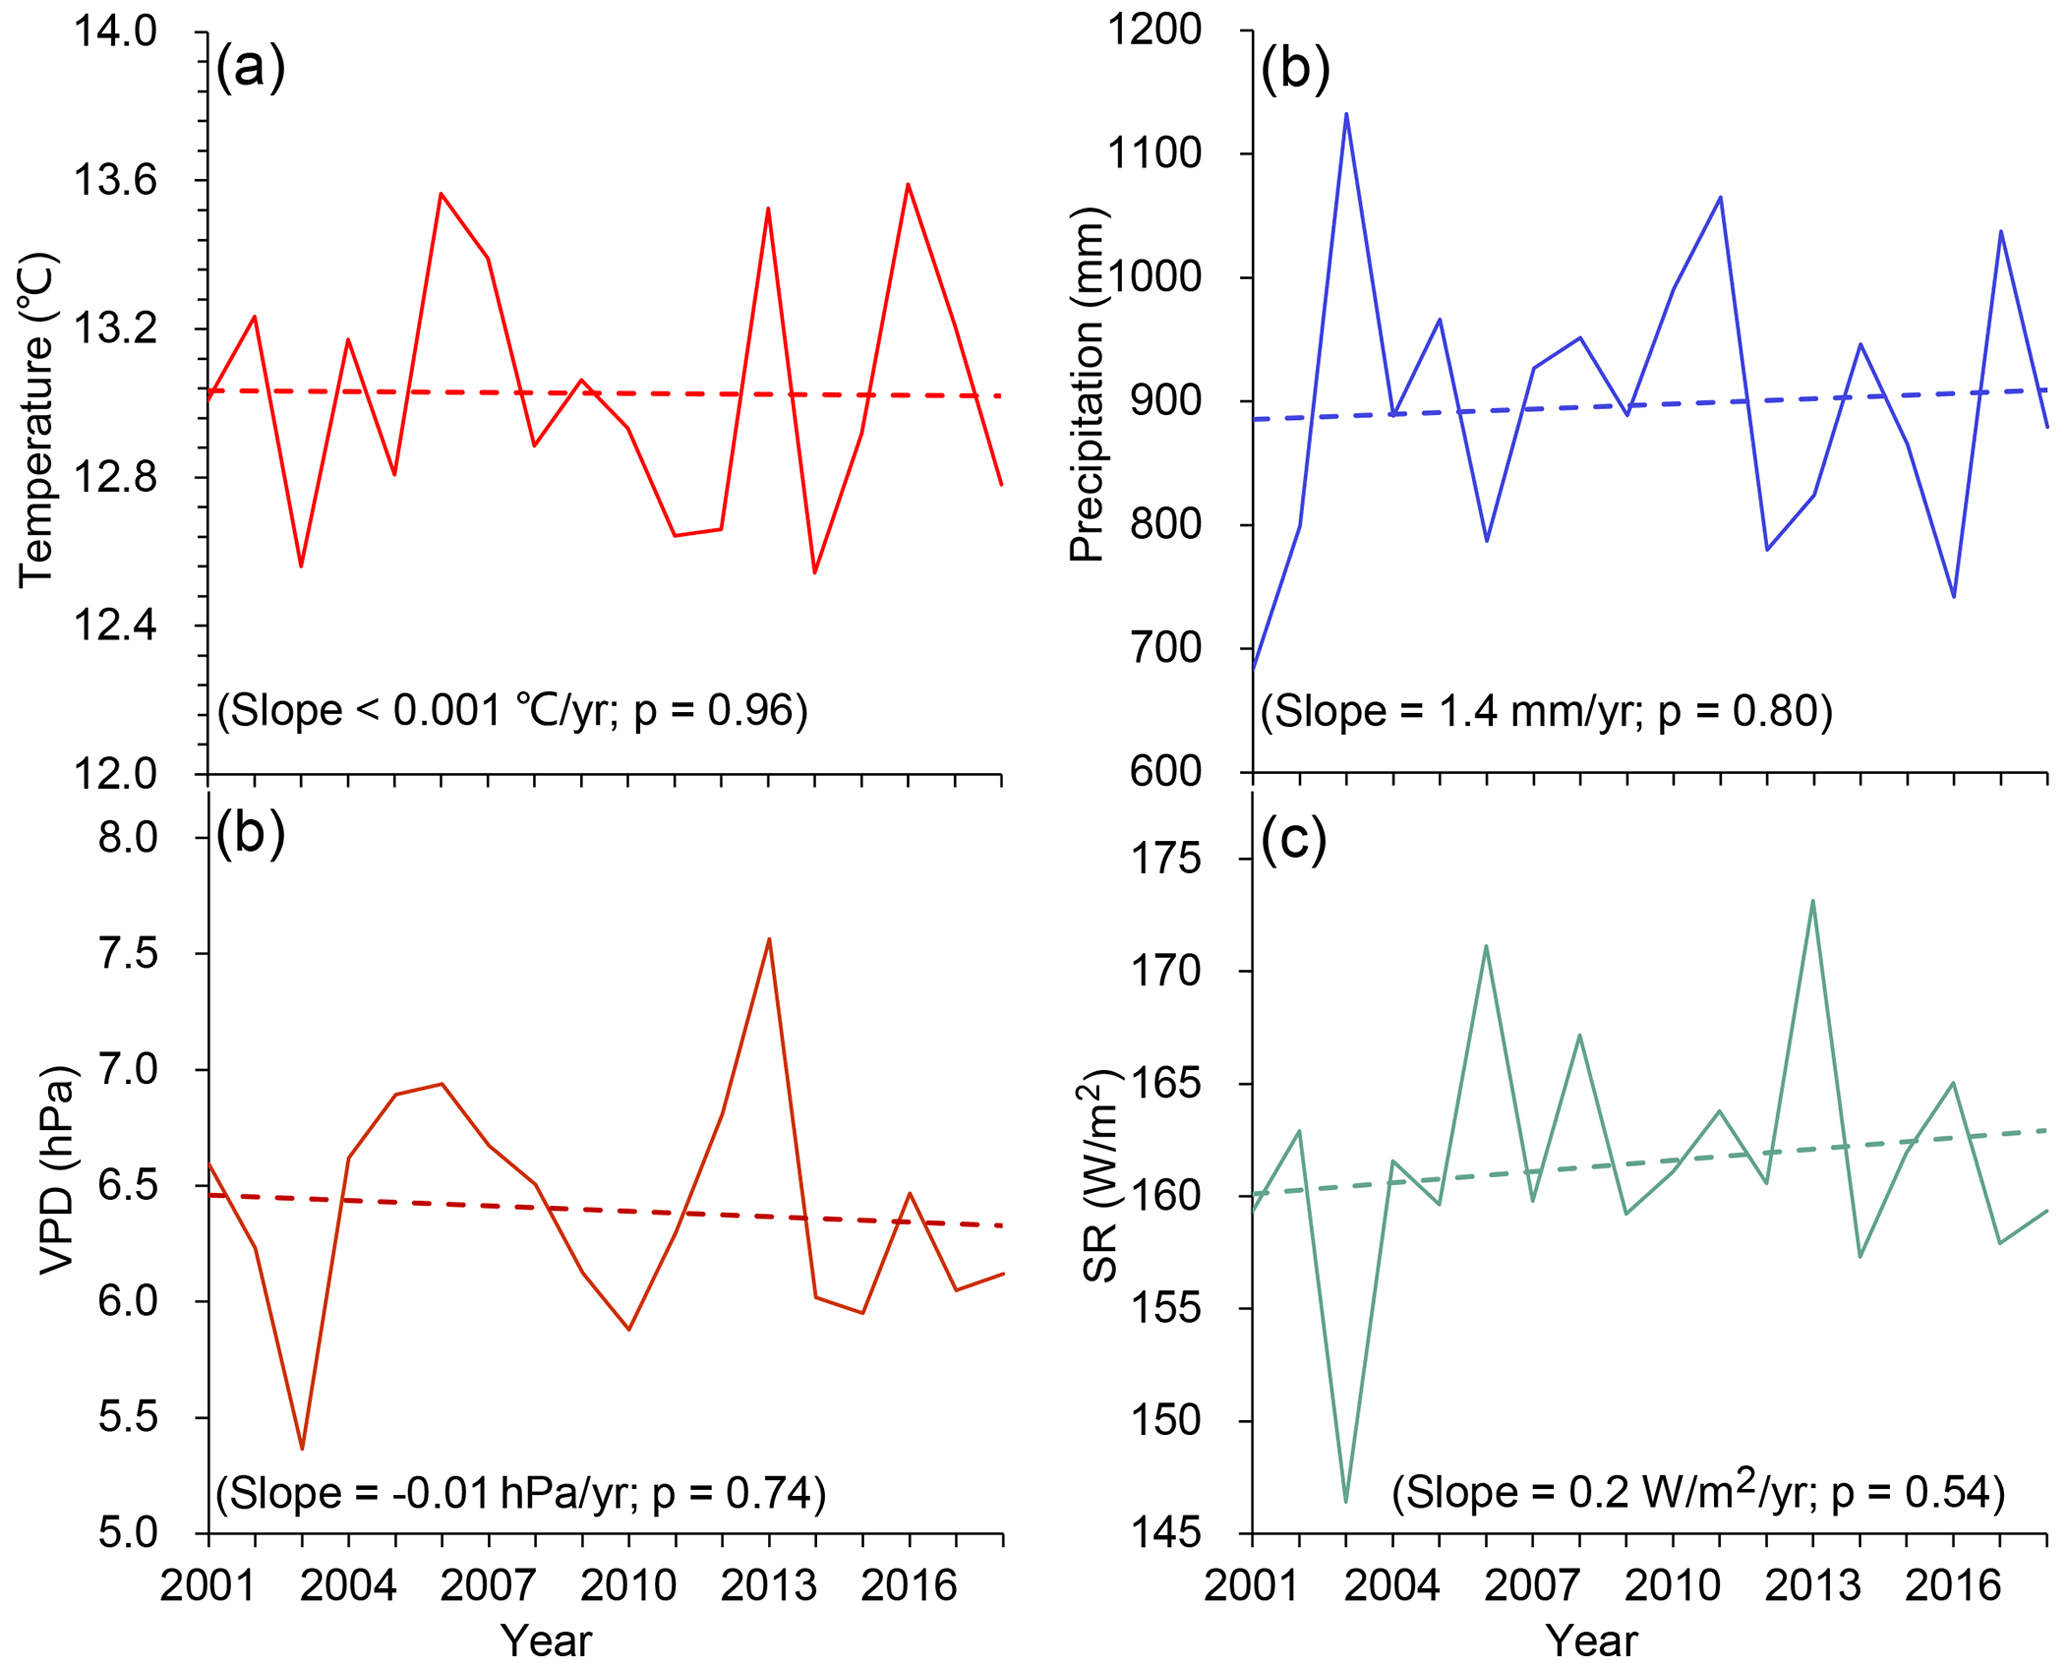
Figure A1Interannual variations of averaged air temperature (a), total precipitation (b), vapor pressure deficit (VPD) (c) and shortwave radiation (SR) (d) in the upper Han River basin from 2001 to 2018.

Figure A2The linear trend of annual WY at the confidence level of 90 % (p<0.10).
Datasets used for driving models were obtained from different sources described in Table 1. The monthly streamflow records of six hydrological gauging stations for model evaluation were derived from the Yearbook of the Han River Hydrology. The inflow records of the Danjiangkou Reservoir were derived from http://113.57.190.228:8001/web/Report/BigMSKReport (Department of Water Sources of Hubei Province, China, 2021). All the data related to our results in this study can be found at https://osf.io/f5bgk/ (Zhang et al., 2021), except for the monthly streamflow records for six hydrological gauging stations, which are available upon reasonable request.
JZ designed the study, developed the model code, did the simulation experiments, and wrote the first draft of the paper. YZ, GS, and CS designed the research and edited the manuscript. MPD and LH provided feedback on results and edited the manuscript. JL offered suggestions on research design. NL provided WaSSI model codes for data processing. KZ and QZ provided the streamflow data for model evaluation and provided feedback on the modeling results.
The contact author has declared that neither they nor their co-authors have any competing interests.
Publisher's note: Copernicus Publications remains neutral with regard to jurisdictional claims in published maps and institutional affiliations.
The majority of the research was conducted in the Remote Sensing and Ecological Modeling group in the Department of Geography at the University of North Carolina at Chapel Hill, USA. Partial support for this study also comes from the Southern Research Station, USDA Forest Service.
This study was supported by the National Natural Science Foundation of China (grant no. 42061144004) and the overseas study scholarship offered by the China University of Geosciences, Wuhan, China.
This paper was edited by Ryan Teuling and reviewed by three anonymous referees.
Abatzoglou, J. T., Dobrowski, S. Z., Parks, S. A., and Hegewisch, K. C.: TerraClimate, a high-resolution global dataset of monthly climate and climatic water balance from 1958–2015, Scientific Data, 5, 170191, https://doi.org/10.1038/sdata.2017.191, 2018.
Anderson, R. M., Koren, V. I., and Reed, S. M.: Using SSURGO data to improve Sacramento Model a priori parameter estimates, J. Hydrol., 320, 103–116, https://doi.org/10.1016/j.jhydrol.2005.07.020, 2006.
Bai, M., Shen, B., Song, X., Mo, S., Huang, L., and Quan, Q.: Multi-Temporal Variabilities of Evapotranspiration Rates and Their Associations with Climate Change and Vegetation Greening in the Gan River Basin, China, Water, 11, 2568, https://doi.org/10.3390/w11122568, 2019.
Bai, P., Liu, X., Zhang, Y., and Liu, C.: Assessing the impacts of vegetation greenness change on evapotranspiration and water yield in China, Water Resour. Res., 56, e2020WR027965 https://doi.org/10.1029/2019WR027019, 2020.
Baker, T. J. and Miller, S. N.: Using the Soil and Water Assessment Tool (SWAT) to assess land use impact on water resources in an East African watershed, J. Hydrol., 486, 100–111, https://doi.org/10.1016/j.jhydrol.2013.01.041, 2013.
Barnett, J., Rogers, S., Webber, M., Finlayson, B., and Wang, M.: Sustainability: Transfer project cannot meet China's water needs, Nature, 527, 295–297, https://doi.org/10.1038/527295a, 2015.
Bosch, J. M. and Hewlett, J. D.: A review of catchment experiments to determine the effect of vegetation changes on water yield and evapotranspiration, J. Hydrol., 55, 3–23, https://doi.org/10.1016/0022-1694(82)90117-2, 1982.
Burnash, R.: The NWS river forecast system-catchment modeling, Computer models of watershed hydrology, 311–366, 1995.
Burnash, R., Ferral, L., and McGuire, R.: A generalized streamflow simulation system: Conceptual modeling for digital computers, US Department of Commerce, National Weather Service, Sacramento, California, US, 1973.
Caldwell, P. V., Sun, G., McNulty, S. G., Cohen, E. C., and Moore Myers, J. A.: Impacts of impervious cover, water withdrawals, and climate change on river flows in the conterminous US, Hydrol. Earth Syst. Sci., 16, 2839–2857, https://doi.org/10.5194/hess-16-2839-2012, 2012.
Cao, S., Sun, G., Zhang, Z., Chen, L., Feng, Q., Fu, B., McNulty, S., Shankman, D., Tang, J., Wang, Y., and Wei, X.: Greening China naturally, Ambio, 40, 828–831, https://doi.org/10.1007/s13280-011-0150-8, 2011.
Cao, S., Zhang, J., Chen, L., and Zhao, T.: Ecosystem water imbalances created during ecological restoration by afforestation in China, and lessons for other developing countries, J. Environ. Manage., 183, 843–849, https://doi.org/10.1016/j.jenvman.2016.07.096, 2016.
Chen, C., Park, T., Wang, X., Piao, S., Xu, B., Chaturvedi, R. K., Fuchs, R., Brovkin, V., Ciais, P., Fensholt, R., Tømmervik, H., Bala, G., Zhu, Z., Nemani, R. R., and Myneni, R. B.: China and India lead in greening of the world through land-use management, Nature Sustainability, 2, 122–129, https://doi.org/10.1038/s41893-019-0220-7, 2019.
Chen, H., Guo, S., Xu, C., and Singh, V. P.: Historical temporal trends of hydro-climatic variables and runoff response to climate variability and their relevance in water resource management in the Hanjiang basin, J. Hydrol., 344, 171–184, https://doi.org/10.1016/j.jhydrol.2007.06.034, 2007.
China Meteorological Administration: Yearbook of Meteorological Disasters in China (2019), Meteorological Press, Beijing, ISBN 978-7-5029-7187-8, 2020.
Cook, B. I., Smerdon, J. E., Seager, R., and Coats, S.: Global warming and 21st century drying, Clim. Dynam., 43, 2607–2627, https://doi.org/10.1007/s00382-014-2075-y, 2014.
Cook, B. I., Mankin, J. S., Marvel, K., Williams, A. P., Smerdon, J. E., and Anchukaitis, K. J.: Twenty-First Century Drought Projections in the CMIP6 Forcing Scenarios, Earth's Future, 8, e2019EF001461, https://doi.org/10.1029/2019EF001461, 2020.
Department of Water Sources of Hubei Province, China: Water resources information retrieval system, Department of Water Sources of Hubei Province, China [data set], available at: http://113.57.190.228:8001/web/Report/BigMSKReport, last access: 31 August 2021.
Ellison, D., Futter, M. N., and Bishop, K., On the forest cover–water yield debate: from demand- to supply-side thinking. Glob. Change Biol., 18, 806–820, https://doi.org/10.1111/J.1365-2486.2011.02589.X, 2012.
Ellison, D., Morris, C. E., Locatelli, B., Sheil, D., Cohen, J., Murdiyarso, D., Gutierrez, V., Noordwijk, M. van, Creed, I. F., Pokorny, J., Gaveau, D., Spracklen, D. v., Tobella, A. B., Ilstedt, U., Teuling, A. J., Gebrehiwot, S. G., Sands, D. C., Muys, B., Verbist, B., Springgay, E., Sugandi, Y., and Sullivan, C. A.: Trees, forests and water: Cool insights for a hot world, Global Environ. Chang., 43, 51–61, https://doi.org/10.1016/J.GLOENVCHA.2017.01.002, 2017.
Emanuel, R. E., Buckley, J. J., Caldwell, P. V., McNulty, S. G., and Sun, G.: Influence of basin characteristics on the effectiveness and downstream reach of interbasin water transfers: Displacing a problem, Environ. Res. Lett., 10, 124005, https://doi.org/10.1088/1748-9326/10/12/124005, 2015.
Farley, K. A., Jobbágy, E. G., and Jackson, R. B.: Effects of afforestation on water yield: A global synthesis with implications for policy, Global Change Biol., 11, 1565–1576, https://doi.org/10.1111/j.1365-2486.2005.01011.x, 2005.
Feng, X., Fu, B., Piao, S., Wang, S., Ciais, P., Zeng, Z., Lü, Y., Zeng, Y., Li, Y., Jiang, X., and Wu, B.: Revegetation in China's Loess Plateau is approaching sustainable water resource limits, Nat. Clim. Change, 6, 1019–1022, https://doi.org/10.1038/nclimate3092, 2016.
Feng, X., Fu, B., Zhang, Y., Pan, N., Zeng, Z., Tian, H., Lyu, Y., Chen, Y., Ciais, P., Wang, Y., Zhang, L., Cheng, L., Maestre, F. T., Fernández-Martínez, M., Sardans, J., and Peñuelas, J.: Recent leveling off of vegetation greenness and primary production reveals the increasing soil water limitations on the greening Earth, 66, 1462–1471, https://doi.org/10.1016/j.scib.2021.02.023, 2021.
Frank, D. C., Poulter, B., Saurer, M., Esper, J., Huntingford, C., Helle, G., Treydte, K., Zimmermann, N. E., Schleser, G. H., Ahlström, A., Ciais, P., Friedlingstein, P., Levis, S., Lomas, M., Sitch, S., Viovy, N., Andreu-Hayles, L., Bednarz, Z., Berninger, F., Boettger, T., D`Alessandro, C. M., Daux, V., Filot, M., Grabner, M., Gutierrez, E., Haupt, M., Hilasvuori, E., Jungner, H., Kalela-Brundin, M., Krapiec, M., Leuenberger, M., Loader, N. J., Marah, H., Masson-Delmotte, V., Pazdur, A., Pawelczyk, S., Pierre, M., Planells, O., Pukiene, R., Reynolds-Henne, C. E., Rinne, K. T., Saracino, A., Sonninen, E., Stievenard, M., Switsur, V. R., Szczepanek, M., Szychowska-Krapiec, E., Todaro, L., Waterhouse, J. S., and Weigl, M.: Water-use efficiency and transpiration across European forests during the Anthropocene, Nat. Clim. Change, 5, 579–583, https://doi.org/10.1038/nclimate2614, 2015.
Guo, H., Hu, Q., and Jiang, T.: Annual and seasonal streamflow responses to climate and land-cover changes in the Poyang Lake basin, China, J. Hydrol., 355, 106–122, https://doi.org/10.1016/j.jhydrol.2008.03.020, 2008.
Hamed, K. H.: Trend detection in hydrologic data: The Mann-Kendall trend test under the scaling hypothesis, J. Hydrol., 349, 350–363, https://doi.org/10.1016/j.jhydrol.2007.11.009, 2008.
Hu, A. Y. and Guo, H. J.: Discussion on ecological environment water demand in the middle-lower reaches of Han River river, China Water Resources, 23, 14–16, 2006 (in Chinese).
Huang, J., Yu, H., Guan, X., Wang, G., and Guo, R.: Accelerated dryland expansion under climate change, Nat. Clim. Change, 6, 166–171, https://doi.org/10.1038/nclimate2837, 2016.
Huete, A., Didan, K., Miura, T., Rodriguez, E. P., Gao, X., and Ferreira, L. G.: Overview of the radiometric and biophysical performance of the MODIS vegetation indices, Remote Sens. Environ., 83, 195–213, https://doi.org/10.1016/S0034-4257(02)00096-2, 2002.
Ingwersen, J. B.: Fog drip, water yield, and timber harvesting in the bull run municipal watershed, Oregon, J. Am. Water Resour. As., 21, 469–473, https://doi.org/10.1111/j.1752-1688.1985.tb00158.x, 1985.
Jackson, R. B., Carpenter, S. R., Dahm, C. N., McKnight, D. M., Naiman, R. J., Postel, S. L., and Running, S. W.: Water in a changing world, Ecol. Appl., 11, 1027–1045, https://doi.org/10.1890/1051-0761(2001)011[1027:WIACW]2.0.CO;2, 2001.
Jackson, R. B., Jobbágy, E. G., Avissar, R., Roy, S. B., Barrett, D. J., Cook, C. W., Farley, K. A., le Maitre, D. C., McCarl, B. A., and Murray, B. C.: Atmospheric science: Trading water for carbon with biological carbon sequestration, Science, 310, 1944–1947, https://doi.org/10.1126/science.1119282, 2005.
Jin, R. and Guo, H.: Water resources assessment in the water source areas of the Middle Route of the South to North Water Transfer Project and water quantity analysis in the Danjiangkou Reservoir, Yangzte River, 24, 7–12, 1993 (in Chinese).
Jönsson, P. and Eklundh, L.: TIMESAT – A program for analyzing time-series of satellite sensor data, Computers and Geosciences, 30, 833–845, https://doi.org/10.1016/j.cageo.2004.05.006, 2004.
King, D. A., Turner, D. P., and Ritts, W. D.: Parameterization of a diagnostic carbon cycle model for continental scale application, Remote Sens. Environ., 115, 1653–1664, https://doi.org/10.1016/j.rse.2011.02.024, 2011.
Krinner, G., Viovy, N., de Noblet-Ducoudré, N., Ogée, J., Polcher, J., Friedlingstein, P., Ciais, P., Sitch, S., and Prentice, I. C.: A dynamic global vegetation model for studies of the coupled atmosphere-biosphere system, Global Biochem. Cy., 19, GB1015, https://doi.org/10.1029/2003GB002199, 2005.
Landsberg, J. J. and Waring, R. H.: A generalised model of forest productivity using simplified concepts of radiation-use efficiency, carbon balance and partitioning, Forest Ecol. Manag., 95, 209–228, https://doi.org/10.1016/S0378-1127(97)00026-1, 1997.
Lesk, C., Rowhani, P., and Ramankutty, N.: Influence of extreme weather disasters on global crop production, Nature, 529, 84–87, https://doi.org/10.1038/nature16467, 2016.
Li, S., Gu, S., Liu, W., Han, H., and Zhang, Q.: Water quality in relation to land use and land cover in the upper Han River Basin, China, CATENA, 75, 216–222, https://doi.org/10.1016/J.CATENA.2008.06.005, 2008.
Li, Y., Cui, Q., Li, C., Wang, X., Cai, Y., Cui, G., and Yang, Z.: An improved multi-objective optimization model for supporting reservoir operation of China's South-to-North Water Diversion Project, Sci. Total Environ., 575, 970–981, https://doi.org/10.1016/j.scitotenv.2016.09.165, 2017.
Li, Y., Piao, S., Li, L. Z. X., Chen, A., Wang, X., Ciais, P., Huang, L., Lian, X., Peng, S., Zeng, Z., Wang, K., and Zhou, L.: Divergent hydrological response to large-scale afforestation and vegetation greening in China, Science Advances, 4, eaar4182, https://doi.org/10.1126/sciadv.aar4182, 2018.
Liu, B. J., Shao, D. G., Xu, M. X., and Yang, S. M.: Research of the water resources utilization relationship between the middle route of South-to North Water Transfer Project and the middle and lower Basin of Hanjiang River, South-to-North Water Transfers and Water Science and Technology, 1, 6–9, 2003 (in Chinese).
Liu, C. and Zheng, H.: South-to-north water transfer schemes for China, Int. J. Water Resour. D., 18, 453–471, https://doi.org/10.1080/0790062022000006934, 2002.
Liu, M., Tian, H., Chen, G., Ren, W., Zhang, C., and Liu, J.: Effects of Land-Use and Land-Cover Change on Evapotranspiration and Water Yield in China During 1900–2000, JAWRA, J. Am. Water Resour. As., 44, 1193–1207, https://doi.org/10.1111/j.1752-1688.2008.00243.x, 2008.
Liu, N., Sun, P., Caldwell, P. v., Harper, R., Liu, S., and Sun, G.: Trade-off between watershed water yield and ecosystem productivity along elevation gradients on a complex terrain in southwestern China, J. Hydrol., 590, 125449, https://doi.org/10.1016/j.jhydrol.2020.125449, 2020.
Liu, X., Liu, C., Luo, Y., Zhang, M., and Xia, J.: Dramatic decrease in streamflow from the headwater source in the central route of China's water diversion project: Climatic variation or human influence?, J. Geophys. Res.-Atmos., 117, D06113, https://doi.org/10.1029/2011JD016879, 2012.
Liu, X., Luo, Y., Yang, T., Liang, K., Zhang, M., and Liu, C.: Investigation of the probability of concurrent drought events between the water source and destination regions of China's water diversion project, Geophys. Res. Lett., 42, 8424–8431, https://doi.org/10.1002/2015GL065904, 2015.
Makarieva, A. M. and Gorshkov, V. G.: Biotic pump of atmospheric moisture as driver of the hydrological cycle on land, Hydrol. Earth Syst. Sci., 11, 1013–1033, https://doi.org/10.5194/hess-11-1013-2007, 2007.
McCuen, R. H., Knight, Z., and Cutter, A. G.: Evaluation of the Nash–Sutcliffe Efficiency Index, J. Hydrol. Eng., 11, 597–602, https://doi.org/10.1061/(asce)1084-0699(2006)11:6(597), 2006.
Monteith, J. L.: Evaporation and environment, Symposia of the society for experimental biology, Cambridge University Press, Cambridge, UK, 19, 205–234, 1965.
Pastorello, G., Trotta, C., Canfora, E. et al.: The FLUXNET2015 dataset and the ONEFlux processing pipeline for eddy covariance data, Scientific data, 7, 225, https://doi.org/10.1038/s41597-020-0534-3, 2020.
Penman, H. L.: Natural evaporation from open water, bare soil and grass, P. R. Soc. A, 193, 120–145, https://doi.org/10.1098/rspa.1948.0037, 1948.
Piégay, H., Walling, D. E., Landon, N., He, Q., Liébault, F., and Petiot, R.: Contemporary changes in sediment yield in an alpine mountain basin due to afforestation (the upper Drôme in France), Catena, 55, 183–212, https://doi.org/10.1016/S0341-8162(03)00118-8, 2004.
Qi, W., Li, H., Zhang, Q., and Zhang, K.: Forest restoration efforts drive changes in land-use/land-cover and water-related ecosystem services in China's Han River basin, Ecol. Eng., 126, 64–73, https://doi.org/10.1016/j.ecoleng.2018.11.001, 2019.
Raes, D., Steduto, P., Hsiao, T. C., and Fereres, E.: Aquacrop-The FAO crop model to simulate yield response to water: II. main algorithms and software description, Agron. J., 101, 438–447, https://doi.org/10.2134/agronj2008.0140s, 2009.
Raich, J. W., Rastetter, E. B., Melillo, J. M., Kicklighter, D. W., Steudler, P. A., Peterson, B. J., Grace, A. L., Moore, B., and Vorosmarty, C. J.: Potential Net Primary Productivity in South America: Application of a Global Model, Ecol. Appl., 1, 399–429, https://doi.org/10.2307/1941899, 1991.
Running, S. W., Thornton, P. E., Nemani, R., and Glassy, J. M.: Global Terrestrial Gross and Net Primary Productivity from the Earth Observing System, in: Methods in Ecosystem Science, Springer New York, 44–57, https://doi.org/10.1007/978-1-4612-1224-9_4, 2000.
Sasaki, T., Okayasu, T., Jamsran, U., and Takeuchi, K.: Threshold changes in vegetation along a grazing gradient in Mongolian rangelands, J. Ecol., 96, 145–154, https://doi.org/10.1111/j.1365-2745.2007.01315.x, 2008.
She, D., Xia, J., Shao, Q., Taylor, J. A., Zhang, L., Zhang, X., Zhang, Y., and Gu, H.: Advanced investigation on the change in the streamflow into the water source of the middle route of China's water diversion project, J. Geophys. Res.-Atmos., 122, 6950–6961, https://doi.org/10.1002/2016JD025702, 2017.
Shin, H., Park, M., Lee, J., Lim, H., and Kim, S. J.: Evaluation of the effects of climate change on forest watershed hydroecology using the RHESSys model: Seolmacheon catchment, Paddy Water Environ., 17, 581–595, https://doi.org/10.1007/s10333-018-00683-1, 2019.
Shumilova, O., Tockner, K., Thieme, M., Koska, A., and Zarfl, C.: Global Water Transfer Megaprojects: A Potential Solution for the Water-Food-Energy Nexus?, Frontiers in Environmental Science, 6(DEC), 150, https://doi.org/10.3389/fenvs.2018.00150, 2018.
Sims, D. A., Rahman, A. F., Cordova, V. D., Baldocchi, D. D., Flanagan, L. B., Goldstein, A. H., Hollinger, D. Y., Misson, L., Monson, R. K., Schmid, H. P., Wofsy, S. C., and Xu, L.: Midday values of gross CO2 flux and light use efficiency during satellite overpasses can be used to directly estimate eight-day mean flux, Agr. Forest Meteorol., 131, 1–12, https://doi.org/10.1016/j.agrformet.2005.04.006, 2005.
Spracklen, D. V., Arnold, S. R., and Taylor, C. M. Observations of increased tropical rainfall preceded by air passage over forests, Nature, 489, 282–285, https://doi.org/10.1038/nature11390, 2012.
Stone, R.: Hydroengineering: Going Against the Flow, Science, 313, 1034–1037, https://doi.org/10.1126/science.313.5790.1034, 2006.
Sulla-Menashe, D., Gray, J. M., Abercrombie, S. P., and Friedl, M. A.: Hierarchical mapping of annual global land cover 2001 to present: The MODIS Collection 6 Land Cover product, Remote Sens. Environ., 222, 183–194, https://doi.org/10.1016/j.rse.2018.12.013, 2019.
Sun, G., Caldwell, P., Noormets, A., McNulty, S. G., Cohen, E., Moore Myers, J., Domec, J.-C., Treasure, E., Mu, Q., Xiao, J., John, R., and Chen, J.: Upscaling key ecosystem functions across the conterminous United States by a water-centric ecosystem model, J. Geophys. Res., 116, G00J05, https://doi.org/10.1029/2010JG001573, 2011.
Tague, C. L. and Band, L. E.: RHESSys: Regional Hydro-Ecologic Simulation System – An Object-Oriented Approach to Spatially Distributed Modeling of Carbon, Water, and Nutrient Cycling, 8, 19, 1–42, https://doi.org/10.1175/1087-3562(2004)8<1:RRHSSO>2.0.CO;2, 2004.
Tang, L.-L., Cai, X.-B., Gong, W.-S., Lu, J.-Z., Chen, X.-L., Lei, Q., and Yu, G.-L.: Increased Vegetation Greenness Aggravates Water Conflicts during Lasting and Intensifying Drought in the Poyang Lake Watershed, China, Forests, 9, 24, https://doi.org/10.3390/f9010024, 2018.
Teuling, A. J., van Loon, A. F., Seneviratne, S. I., Lehner, I., Aubinet, M., Heinesch, B., Bernhofer, C., Grünwald, T., Prasse, H., and Spank, U.: Evapotranspiration amplifies European summer drought, Geophys. Res. Lett., 40, 2071–2075, https://doi.org/10.1002/grl.50495, 2013.
Tian, L., Jin, J., Wu, P., and Niu, G. Y.: Quantifying the impact of climate change and human activities on streamflow in a Semi-Arid Watershed with the Budyko Equation incorporating dynamic vegetation information, Water, 10, 1781, https://doi.org/10.3390/w10121781, 2018.
Trenberth, K. E., Smith, L., Qian, T., Dai, A., and Fasullo, J.: Estimates of the global water budget and its annual cycle using observational and model Data, J. Hydrometeorol., 8, 758–769, https://doi.org/10.1175/JHM600.1, 2007.
Tuinenburg, O. A., Theeuwen, J. J. E., and Staal, A.: High-resolution global atmospheric moisture connections from evaporation to precipitation, Earth Syst. Sci. Data, 12, 3177–3188, https://doi.org/10.5194/essd-12-3177-2020, 2020.
van Loon, A. F.: Hydrological drought explained, Wiley Interdisciplinary Reviews: Water, 2, 359–392, https://doi.org/10.1002/wat2.1085, 2015.
van Loon, A. F., Gleeson, T., Clark, J., van Dijk, A. I. J. M., Stahl, K., Hannaford, J., di Baldassarre, G., Teuling, A. J., Tallaksen, L. M., Uijlenhoet, R., Hannah, D. M., Sheffield, J., Svoboda, M., Verbeiren, B., Wagener, T., Rangecroft, S., Wanders, N., and van Lanen, H. A. J.: Drought in the Anthropocene, Nat. Geosci., 9, 89–91, https://doi.org/10.1038/ngeo2646, 2016.
Wang, K. and Dickinson, R. E.: A review of global terrestrial evapotranspiration: Observation, modeling, climatology, and climatic variability, Rev. Geophys., 50, RG2005, https://doi.org/10.1029/2011RG000373, 2012.
Wang, S., Zhang, Y., Ju, W., Chen, J. M., Ciais, P., Cescatti, A., Sardans, J., Janssens, I. A., Wu, M., Berry, J. A., Campbell, E., Fernández-Martínez, M., Alkama, R., Sitch, S., Friedlingstein, P., Smith, W. K., Yuan, W., He, W., Lombardozzi, D., Kautz, M., Zhu, D., Lienert, S., Kato, E., Poulter, B., Sanders, T. G. M., Krüger, I., Wang, R., Zeng, N., Tian, H., Vuichard, N., Jain, A. K., Wiltshire, A., Haverd, V., Goll, D. S., and Peñuelas, J.: Recent global decline of CO2 fertilization effects on vegetation photosynthesis, Science, 370, 1295–1300, https://doi.org/10.1126/SCIENCE.ABB7772, 2020.
Wang, Y. and Yang, Y.: South-North Water Transfer Project of China, Yangtze River, 7, 2–5, 2005 (in Chinese).
Wang, Y., Liu, Y., and Jin, J.: Contrast Effects of Vegetation Cover Change on Evapotranspiration during a Revegetation Period in the Poyang Lake Basin, China, Forests, 9, 217, https://doi.org/10.3390/f9040217, 2018.
Wei, X., Sun, G., Liu, S., Jiang, H., Zhou, G., and Dai, L.: The Forest-Streamflow Relationship in China: A 40-Year Retrospect 1, JAWRA J. Am. Water Resour. As., 44, 1076–1085, https://doi.org/10.1111/j.1752-1688.2008.00237.x, 2008.
Williams, A. P., Cook, E. R., Smerdon, J. E., Cook, B. I., Abatzoglou, J. T., Bolles, K., Baek, S. H., Badger, A. M., and Livneh, B.: Large contribution from anthropogenic warming to an emerging North American megadrought, Science, 368, 314–318, https://doi.org/10.1126/science.aaz9600, 2020.
Xi, Y., Peng, S., Ciais, P., Guimberteau, M., Li, Y., Piao, S., Wang, X., Polcher, J., Yu, J., Zhang, X., Zhou, F., Bo, Y., Ottle, C., and Yin, Z.: Contributions of Climate Change, CO2, Land-Use Change, and Human Activities to Changes in River Flow across 10 Chinese Basins, J. Hydrometeorol., 19, 1899–1914, https://doi.org/10.1175/JHM-D-18-0005.1, 2018.
Xu, Y. and Chang, F. X.: Preliminary study on requirement rate of ecological water demand in middle and lower reaches of Hanjiang River, Yangtze River Scientific Research Institute, 26, 1–4, 2009 (in Chinese).
Xu, Y., Lin, S., Huang, Y., Zhang, Q., and Ran, Q.: Drought analysis using multi-scale standardized precipitation index in the Han River Basin, China, Journal of Zhejiang University: Science A, 12, 483–494, https://doi.org/10.1631/jzus.A1000450, 2011.
Yang, Y., Zhou, N., Guo, X., and Hu, Q.: The hydrology characteristics analysis of HanJiang up-streams, Hydrology, 2, 54–56, 1997.
Yang, Z., Chen, S., Liu, X., Xiong, D., Xu, C., Arthur, M. A., McCulley, R. L., Shi, S., and Yang, Y.: Loss of soil organic carbon following natural forest conversion to Chinese fir plantation, Forest Ecol. Manag., 449, 117476, https://doi.org/10.1016/J.FORECO.2019.117476, 2019.
Yuan, W., Zheng, Y., Piao, S., Ciais, P., Lombardozzi, D., Wang, Y., Ryu, Y., Chen, G., Dong, W., Hu, Z., Jain, A. K., Jiang, C., Kato, E., Li, S., Lienert, S., Liu, S., Nabel, J. E. M. S., Qin, Z., Quine, T., Sitch, S., Smith, W. K., Wang, F., Wu, C., Xiao, Z., and Yang, S.: Increased atmospheric vapor pressure deficit reduces global vegetation growth, Science Advances, 5, eaax1396, https://doi.org/10.1126/sciadv.aax1396, 2019.
Zargar, A., Sadiq, R., Naser, B., and Khan, F. I. : A review of drought indices. Environmental Reviews, 19, 333–349, https://doi.org/10.1139/a11-013, 2011.
Zhang, C., Duan, Q., Yeh, P. J. F., Pan, Y., Gong, H., Gong, W., Di, Z., Lei, X., Liao, W., Huang, Z., Zheng, L., and Guo, X.: The Effectiveness of the South-to-North Water Diversion Middle Route Project on Water Delivery and Groundwater Recovery in North China Plain, Water Resour. Res., 56, e2019WR026759, https://doi.org/10.1029/2019WR026759, 2020.
Zhang, D., Zhang, Q., Qiu, J., Bai, P., Liang, K., and Li, X.: Intensification of hydrological drought due to human activity in the middle reaches of the Yangtze River, China, Sci. Total Environ., 637–638, 1432–1442, https://doi.org/10.1016/j.scitotenv.2018.05.121, 2018.
Zhang, J., Zhang, Y., Sun, G., Song, C., Dannenberg, M. P., Li, J., Liu, N., Zhang, K., and Zhang, Q.: Vegetation Greening Significantly Reduced the Capacity of Water Supply to China’s South-North Water Diversion Project, available at: https://osf.io/f5bgk/ last access: 31 August 2021.
Zhang, Q.: The South-to-North Water Transfer Project of China: Environmental Implications and Monitoring Strategy, JAWRA J. Am. Water Resour. As., 45, 1238–1247, https://doi.org/10.1111/j.1752-1688.2009.00357.x, 2009.
Zhang, Q., Ficklin, D. L., Manzoni, S., Wang, L., Way, D., Phillips, R. P., and Novick, K. A.: Response of ecosystem intrinsic water use efficiency and gross primary productivity to rising vapor pressure deficit, Environ. Res. Lett., 14, 7, https://doi.org/10.1088/1748-9326/ab2603, 2019.
Zhang, Y., Song, C., and Zhang, K.: Effects of land-use/land-cover and climate changes on terrestrial net primary productivity in the Yangtze River Basin, China from 2001 to 2010, J. Geophys. Res.-Biogeo., 119, 1092–1109, https://doi.org/10.1002/2014JG002616, 2014.
Zhang, Y., Song, C., Sun, G., Band, L. E., McNulty, S., Noormets, A., Zhang, Q., and Zhang, Z.: Development of a coupled carbon and water model for estimating global gross primary productivity and evapotranspiration based on eddy flux and remote sensing data, Agr. Forest Meteorol., 223, 116–131, https://doi.org/10.1016/j.agrformet.2016.04.003, 2016.
Zhang, Y., Song, C., Band, L. E., Sun, G., and Li, J., Reanalysis of global terrestrial vegetation trends from MODIS products: Browning or greening?, Remote Sens. Environ., 191, 145–155, https://doi.org/10.1016/j.rse.2016.12.018, 2017.
Zhang, Y., Song, C., Band, L. E., and Sun, G.: No Proportional Increase of Terrestrial Gross Carbon Sequestration from the Greening Earth, J. Geophys. Res.-Biogeo., 124, 2540–2553, https://doi.org/10.1029/2018jg004917, 2019.
Zhou, S., Yu, B., Huang, Y., and Wang, G.: The effect of vapor pressure deficit on water use efficiency at the subdaily time scale, Geophys. Res. Lett., 41, 5005–5013, https://doi.org/10.1002/2014GL060741, 2014.
Zhu, Z., Piao, S., Myneni, R. B., Huang, M., Zeng, Z., Canadell, J. G., Ciais, P., Sitch, S., Friedlingstein, P., Arneth, A., Cao, C., Cheng, L., Kato, E., Koven, C., Li, Y., Lian, X., Liu, Y., Liu, R., Mao, J., Pan, Y., Peng, S., Peñuelas, J., Poulter, B., Pugh, T. A. M., Stocker, B. D., Viovy, N., Wang, X., Wang, Y., Xiao, Z., Yang, H., Zaehle, S., and Zeng, N.: Greening of the Earth and its drivers, Nat. Clim. Change, 6, 791–795, https://doi.org/10.1038/nclimate3004, 2016.