the Creative Commons Attribution 4.0 License.
the Creative Commons Attribution 4.0 License.
 | 31 Aug 2021
How does water yield respond to mountain pine beetle infestation in a semiarid forest?
Jianning Ren
Jennifer C. Adam
Jeffrey A. Hicke
Erin J. Hanan
Christina L. Tague
Mingliang Liu
Crystal A. Kolden
John T. Abatzoglou
Mountain pine beetle (MPB) outbreaks in the western United States result in widespread tree mortality, transforming forest structure within watersheds. While there is evidence that these changes can alter the timing and quantity of streamflow, there is substantial variation in both the magnitude and direction of hydrologic responses, and the climatic and environmental mechanisms driving this variation are not well understood. Herein, we coupled an eco-hydrologic model (RHESSys) with a beetle effects model and applied it to a semiarid watershed, Trail Creek, in the Bigwood River basin in central Idaho, USA, to examine how varying degrees of beetle-caused tree mortality influence water yield. Simulation results show that water yield during the first 15 years after beetle outbreak is controlled by interactions between interannual climate variability, the extent of vegetation mortality, and long-term aridity. During wet years, water yield after a beetle outbreak increased with greater tree mortality; this was driven by mortality-caused decreases in evapotranspiration. During dry years, water yield decreased at low-to-medium mortality but increased at high mortality. The mortality threshold for the direction of change was location specific. The change in water yield also varied spatially along aridity gradients during dry years. In wetter areas of the Trail Creek basin, post-outbreak water yield decreased at low mortality (driven by an increase in ground evaporation) and increased when vegetation mortality was greater than 40 % (driven by a decrease in canopy evaporation and transpiration). In contrast, in more water-limited areas, water yield typically decreased after beetle outbreaks, regardless of mortality level (although the driving mechanisms varied). Our findings highlight the complexity and variability of hydrologic responses and suggest that long-term (i.e., multi-decadal mean) aridity can be a useful indicator for the direction of water yield changes after a disturbance.
- Article
(5842 KB) - Full-text XML
-
Supplement
(895 KB) - BibTeX
- EndNote


-
Mountain pine beetle (MPB)-caused tree mortality increases water yield in most wet years, and decreases in water yield mainly happen in dry years; therefore, interannual climate variability is an important driver of water yield response to beetle-caused tree mortality.
-
A long-term (multi-decade) aridity index is a reliable indicator of water yield response to MPBs: in a dry year, decreases in water yield occur mainly in water-limited areas and the level of vegetation mortality has only minor effects; in wetter areas, decreases in water yield only occur at low vegetation mortality levels.
-
Generally, in a dry year, low-to-medium MPB-caused vegetation mortality decreases water yield and high mortality increases water yield; this response to mortality level is nonlinear and varies by location and year.
In recent decades, mountain pine beetle (MPB) outbreaks in the Western US and Canada have killed billions of coniferous trees (Bentz et al., 2010). Coniferous forests can provide essential ecosystem services, including a water supply for local communities (Anderegg et al., 2013). Therefore, it is essential to understand how ecosystems and watersheds respond to beetle outbreaks and to identify the dominant processes that drive these responses (Bennett et al., 2018). A growing number of studies have qualitatively examined hydrologic responses to beetle outbreaks and disturbance; however, these studies have produced conflicting results (Adams et al., 2012; Goeking and Tarboton, 2020). While some studies show increases in water yield following beetle outbreaks (e.g., Bethlahmy, 1974; Livneh et al., 2015; Potts, 1984), many others show no change, or even decreases (e.g., Biederman et al., 2014; Guardiola-Claramonte et al., 2011; Slinski et al., 2016). To determine which mechanisms control the change in water yield following a beetle outbreak, more quantitative approaches are needed.
Water yield is often thought to increase after vegetation is killed or removed by disturbances such as fire, thinning, and harvesting (Buma and Livneh, 2017; Chen et al., 2014; Hubbart, 2007; Robles et al., 2014; Wine et al., 2018). In the Rocky Mountain West, beetle outbreaks have increased water yield through multiple mechanisms. First, defoliation/needle loss can reduce plant transpiration, canopy evaporation, and canopy snow sublimation losses to the atmosphere (Montesi et al., 2004). Snow sublimation is an important process in snow-dominated forest systems. Beetle-caused decreases in total sublimation can increase water yield, especially since canopy sublimation is more sensitive to disturbances than ground snow sublimation (Frank et al., 2019). Increased canopy openings can also enable snow accumulation and allow more radiation to reach the ground surface, resulting in earlier and larger peak snowmelt events, which can in turn reduce soil moisture and therefore decrease summer evapotranspiration (ET).
Several studies have documented decreases in water yield following disturbances (e.g., mortality, fire, beetle outbreaks; Bart et al., 2016; Biederman et al., 2014; Goeking and Tarboton, 2020; Slinski et al., 2016). For example, in the southwestern US, beetle outbreaks have decreased streamflow by opening forest canopies and increasing radiation to the understory and at the ground surface, which leads to increases in understory vegetation transpiration (Guardiola-Claramonte et al., 2011) and soil evaporation, therefore increasing total ET (Bennett et al., 2018). Tree mortality or removal can reduce streamflow because surviving trees and/or understory vegetation compensate by using more water (Tague et al., 2019).
In a review of 78 studies, Goeking and Tarboton (2020) concluded that the decrease in water yield after tree mortality mainly happens in semiarid regions. Previous studies also provide rule-of-thumb thresholds above which water yield will increase: a loss of vegetation cover of at least 20 % and a mean precipitation of 500 mm yr−1 (Adams et al., 2012). However, many watersheds in the western US experience high interannual climate variability (Fyfe et al., 2017), and local environmental gradients (e.g., long-term aridity gradients) may strongly influence vegetation and hydrologic responses to disturbances such as beetle outbreaks, making such rules of thumb difficult to apply in practice (Winkler et al., 2014). Given the possibility of either increases or decreases in water yield following beetle outbreaks, modeling approaches are crucial for identifying the specific mechanisms that control these responses.
Our overarching goal was to identify mechanisms driving the direction of change in annual water yield after beetle outbreaks in semi-arid regions (note that in the following text, “water yield” refers to the mean annual water yield). To accomplish this goal, we asked the following questions:
-
Q1: What is the role of interannual climate variability in water yield response?
-
Q2: What is the role of mortality level in water yield response?
-
Q3: How does long-term aridity (defined as the temporally averaged potential evapotranspiration relative to precipitation) modify these responses, and how do responses vary spatially within a watershed along aridity gradients?
We hypothesized that multiple ecohydrologic processes (e.g., snow accumulation and melt, evaporation, transpiration, drainage, and a range of forest structural and functional responses to beetles) could interactively influence how water yield responds to beetle outbreaks. However, one or more processes may dominate in certain locations. In addition, the dominant ecohydrologic processes may vary over space and time due to interannual climate variability (i.e., precipitation), vegetation mortality, and long-term aridity. In Sect. 2 of this paper, we present a conceptual framework for identifying and depicting dominant hydrologic processes through which forests respond to beetle infestation. We used this framework to interpret the modeling results. In Sect. 3, we describe our mechanistic modeling approach, i.e., using the Regional Hydro-Ecological Simulation System (RHESSys), which can prescribe a range of vegetation mortality levels, capture the effects of landscape heterogeneity and the role of lateral soil moisture redistribution, and project ecosystem carbon and nitrogen dynamics, including post-disturbance plant recovery. In Sects. 4 and 5, we then present modeling results that explore how multiple mechanisms influence water yield responses. This study can help inform management in beetle-affected watersheds by providing a tool for identifying locations that should be prioritized to mitigate flooding and erosion risk under different climate conditions.
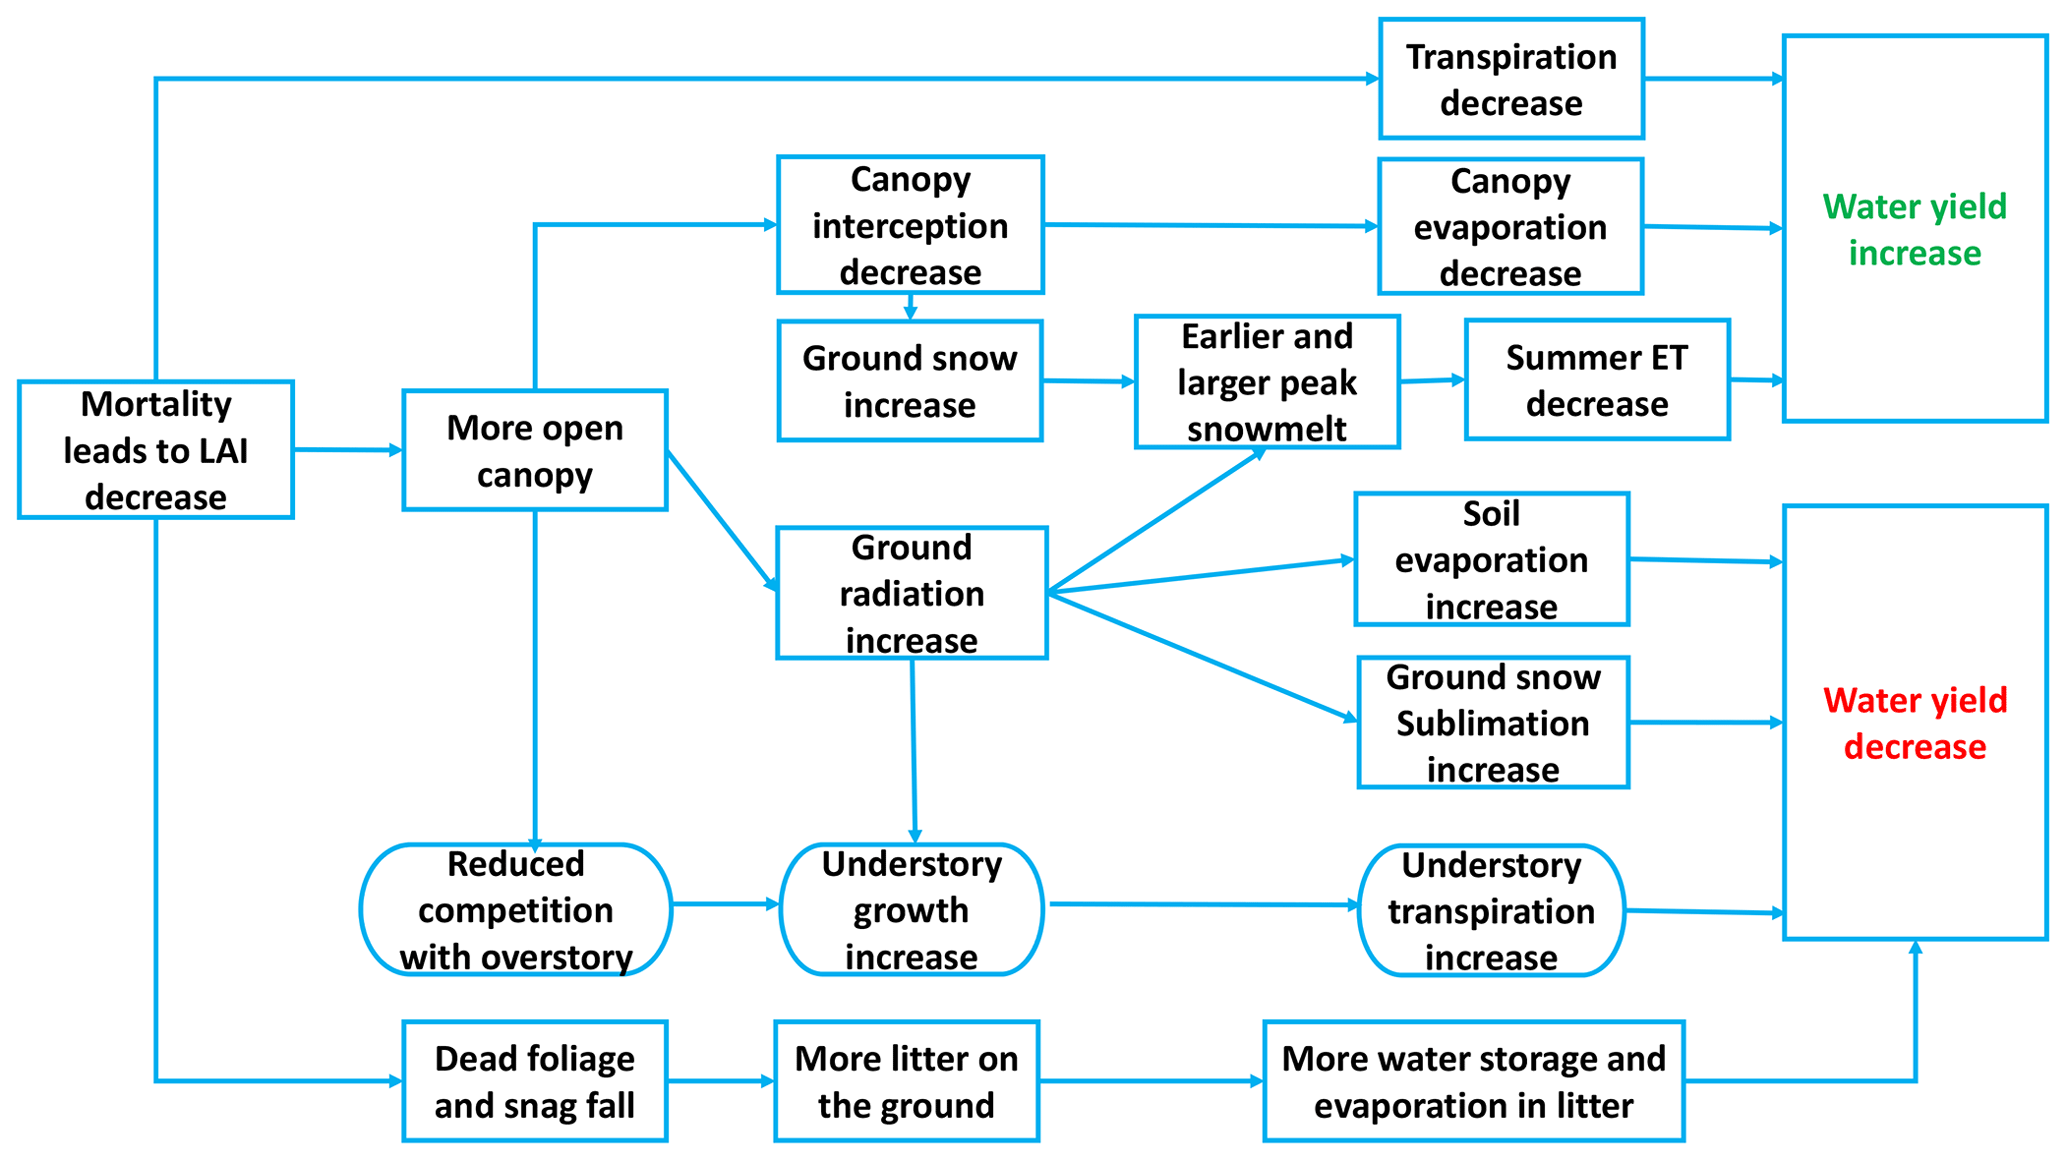
Figure 1Mechanism of water yield responses to beetle-caused mortality during the red and gray phases (0–10 years after beetle outbreak); semicircular boxes represent understory responses and square boxes represent overstory responses.
2.1 Vegetation response to beetle outbreaks
Mountain pine beetles (MPB) introduce blue stain fungi into the xylem of attacked trees, which reduces water transport in plants and eventually shuts it off (Paine et al., 1997). During outbreaks, MPBs prefer to attack and kill larger host trees that have greater resources (e.g., carbon), while smaller-diameter host trees and non-host vegetation (including the understory) remain unaffected (Edburg et al., 2012). After an MBP outbreak, trees experience three phases (i.e., red, gray, and old) over time (Hicke et al., 2012). During the red phase, the trees' needles turn red. During the gray phase, there are no needles in the canopy. During the old phase, killed trees have fallen and understory vegetation and new seedlings experience rapid growth (Hicke et al., 2012; Mikkelson et al., 2013).
2.2 Hydrologic response to beetle outbreaks
Figure 1 describes the main processes that alter evapotranspiration and either decrease or increase water yield, depending on which processes dominate (Adams et al., 2012; Goeking and Tarboton, 2020). During the red and gray phases, needles fall to the ground, the leaf area index (LAI) is lower, and the canopy is more open (Hicke et al., 2012). During these phases, changes in canopy cover can interact with hydroclimatic conditions across a watershed to alter transpiration and evaporation in a variety of ways.
Canopy mortality can reduce transpiration rates in infected trees, though in water-limited environments, remaining trees may compensate to some extent by increasing transpiration (Adams et al., 2012; Tague et al., 2019). More open canopies (i.e., following tree mortality) intercept less precipitation than closed canopies, reducing canopy evaporation but potentially increasing it from soil and litter layers (Montesi et al., 2004; Sexstone et al., 2018). Meanwhile, opening canopies can also increase the proportion of snow falling to the ground and, therefore, increase snowpack accumulation. With more solar radiation reaching the ground, earlier and larger peak snowmelt can also occur (Bennett et al., 2018). Generally, earlier snowmelt increases water for spring streamflow and decreases water for summertime ET (Pomeroy et al., 2012). However, once snags fall, reductions in longwave radiation can actually lead to later snowmelt (Lundquist et al., 2013). An open canopy, combined with less competition for resources such as solar radiation and nutrients, can also promote understory vegetation growth, which may increase understory transpiration (Biederman et al., 2014; Tague et al., 2019). In some riparian corridors, the regreening of surviving vegetation and the compensatory response of remaining tissues could diminish the reduction in ET caused by foliage fall, leading to no significant water yield response to beetle-caused mortality (Nagler et al., 2018; Snyder et al., 2012). Therefore, whether water yield increases or decreases following beetle outbreak ultimately depends on how these processes interact.
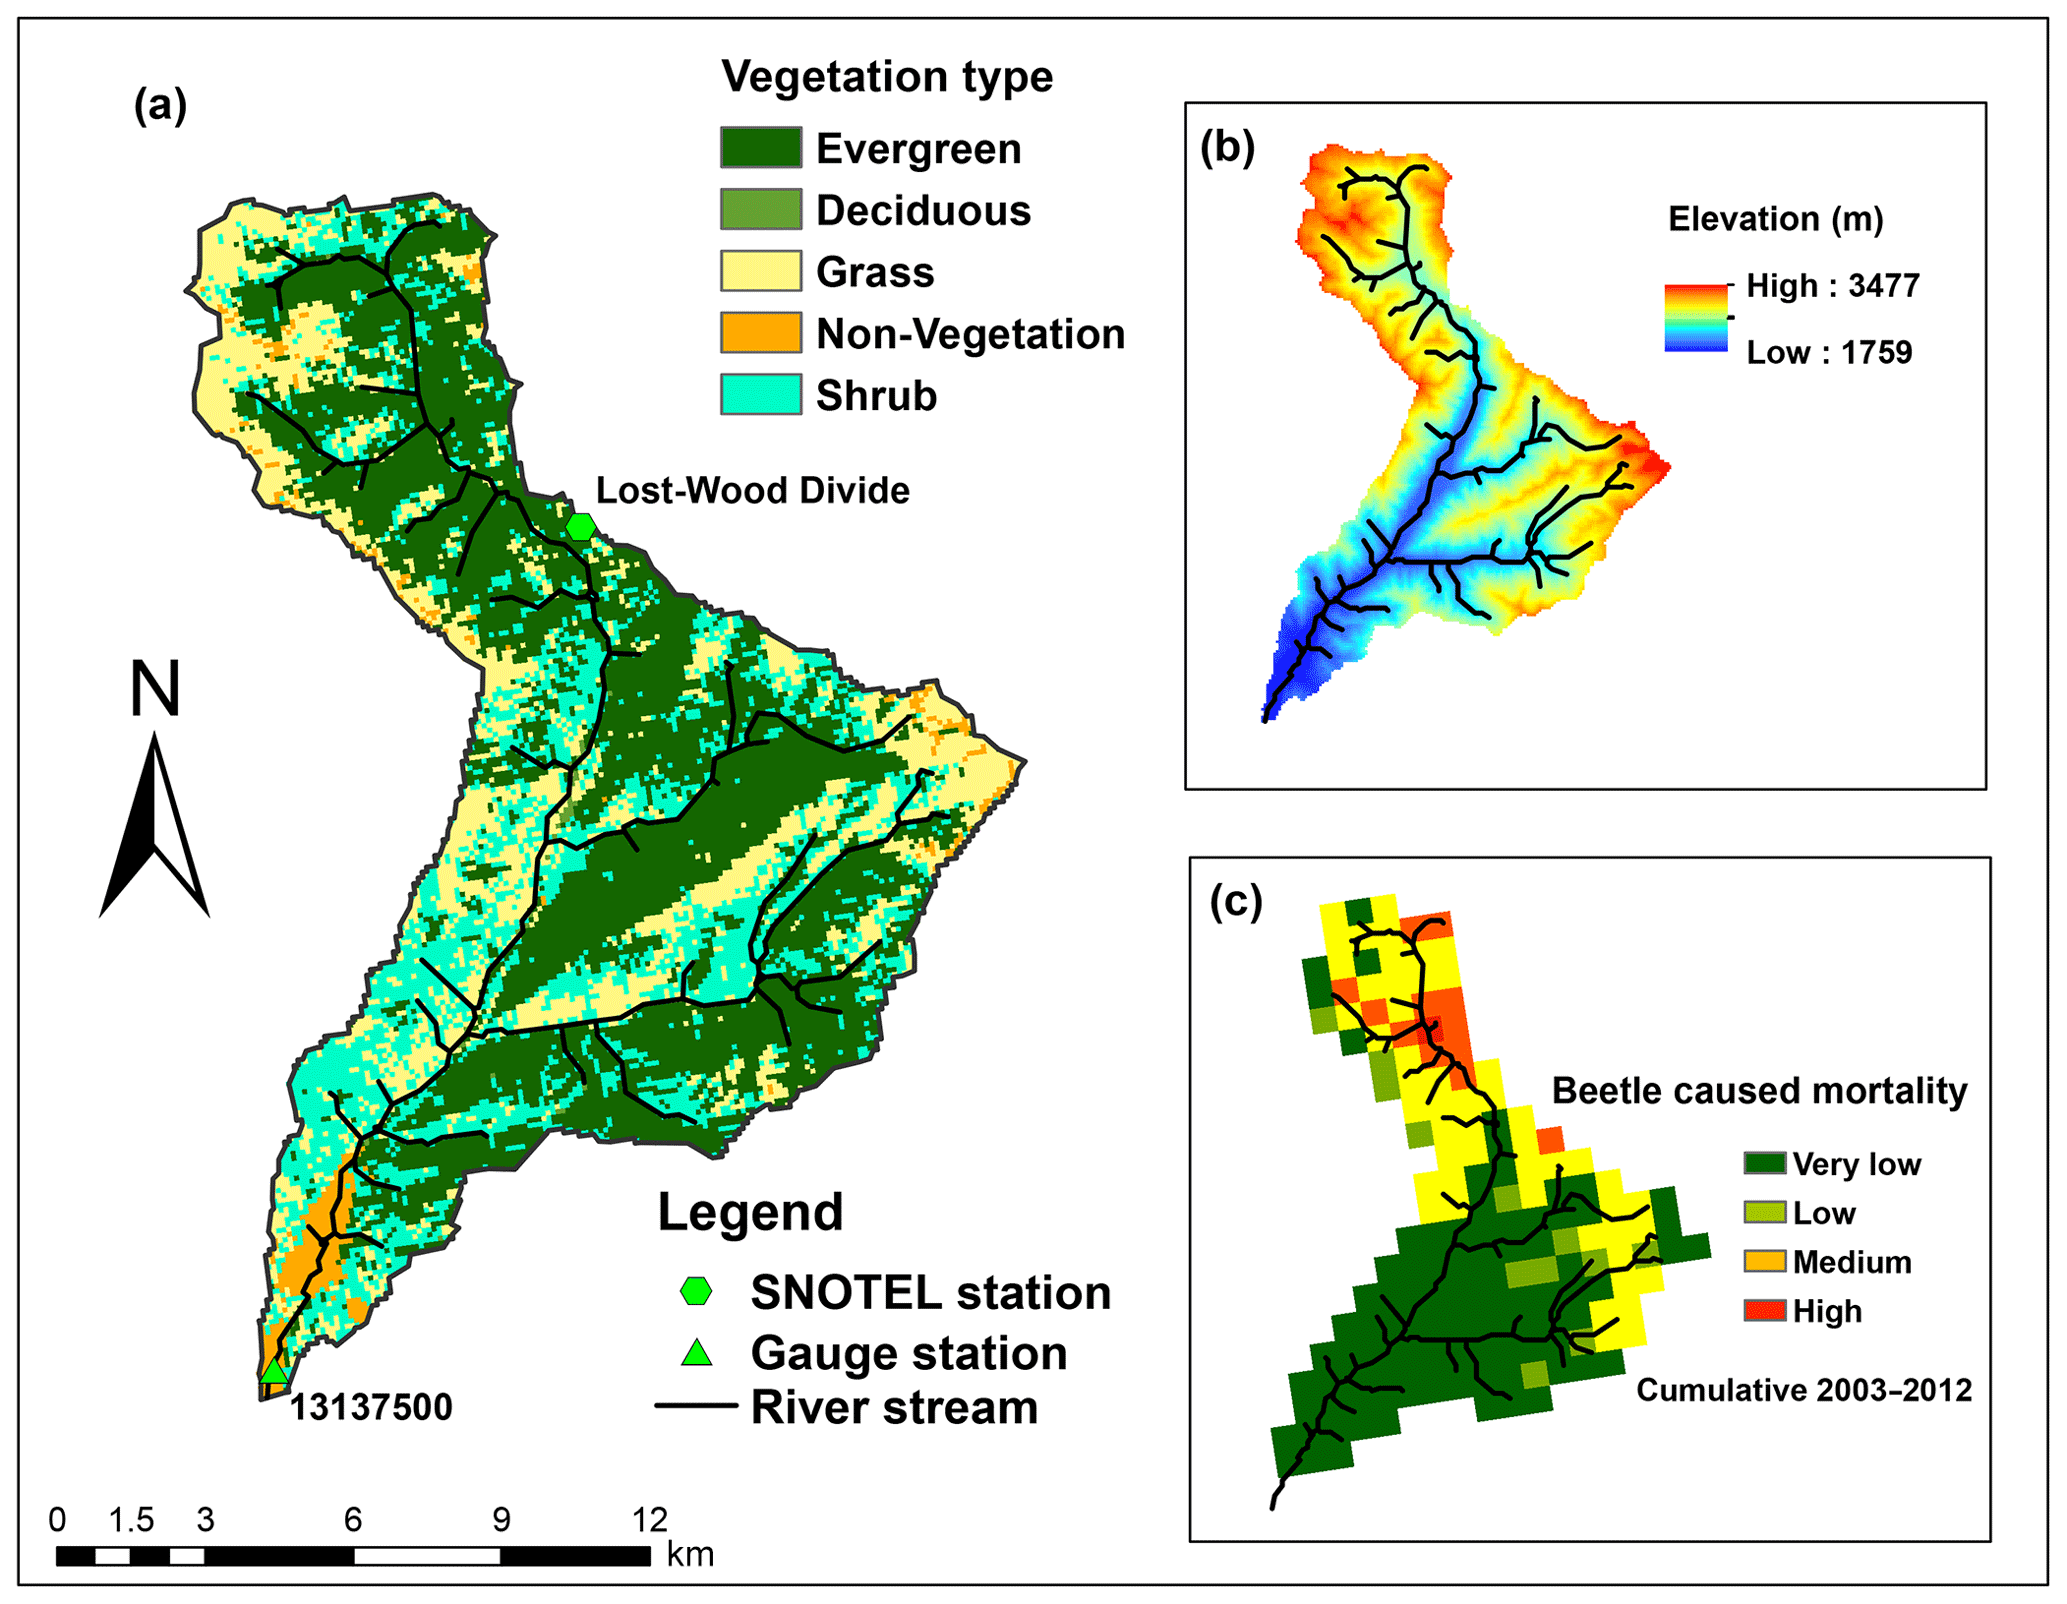
Figure 2Land cover, elevation, and tree mortality for Trail Creek: (a) is a land cover map showing the main vegetation types, (b) shows the elevation gradient, and (c) shows the severity of beetle-caused tree mortality (during the period 2003–2012; Meddens et al., 2012). Note that, for our modeling experiments, we prescribed that the beetle outbreak occurred uniformly across the evergreen patches instead of using historical beetle outbreak data.
Interannual variability in climate (e.g., dry versus wet years) can affect how hydrologic processes interact in forested watersheds (Goeking and Tarboton, 2020; Winkler et al., 2014). For instance, during wet years, remaining plants are not water limited, and reductions in plant transpiration due to beetle-caused mortality dominate over increases in soil evaporation or remaining plant transpiration, resulting in a higher water yield. In contrast, during dry years, plants are already under water stress and decreases in plant transpiration caused by tree mortality may be compensated for by increased soil evaporation and transpiration by remaining trees or understory vegetation, leading to declines in water yield. Moreover, these responses are also affected by land cover types (e.g., young versus old trees, different tree species), which is not currently well documented (Morillas et al., 2017; Perry and Jones, 2017).
2.3 Review of modeling approaches
Many models, ranging from empirical and lumped to physically based and fully distributed, have been used to study hydrologic responses to disturbances. Goeking and Tarboton (2020) argue that only physically based and fully distributed models can capture how disturbances alter water yield because they represent fine-scale spatial heterogeneity and physical process that vary over space and time. Despite their advantages, many process-based models such as the coupled CLM-ParFlow model (Mikkelson et al., 2013; Penn et al., 2016), the Distributed Hydrology Soil Vegetation Model (Livneh et al., 2015; Sun et al., 2018), and the Variable Infiltration Capacity Model (Bennett et al., 2018) also have some limitations. For example, (1) they may assume a constant LAI after disturbances and static vegetation growth (e.g., VIC and DHSVM), (2) they may omit lateral flow that redistributes soil moisture (VIC), and (3) in some cases, the approach used to represent the effects of beetle outbreaks may be too simplified (e.g., changing only LAI and conductance without considering two-way beetle–vegetation interactions in post-disturbance biogeochemical and water cycling, as in CLM-ParFlow). Thus, improving current fully distributed process-based models to capture the coupled dynamics between hydrology and vegetation at multiple scales is critical if we are to project how beetle outbreaks will affect water yield in semiarid systems (Goeking and Tarboton, 2020). Here we use the RHESSys–Beetle model, which captures these processes.
3.1 Study area
Our study focused on the Trail Creek watershed, which is located in Blaine County between the Sawtooth National Forest and the Salmon-Challis National Forest (43.44∘ N, 114.19∘ W; Fig. 2). This is a 167 km2 sub-catchment in the south part of Big Wood River basin, and is within the wildland–urban interface, where residents are vulnerable to the flood and debris flows caused by forest disturbances (Skinner, 2013). Trail Creek has frequently experienced beetle outbreaks, notably in 2004 and 2009, when beetles killed 7 and 19 km2 of trees, respectively (Berner et al., 2017).
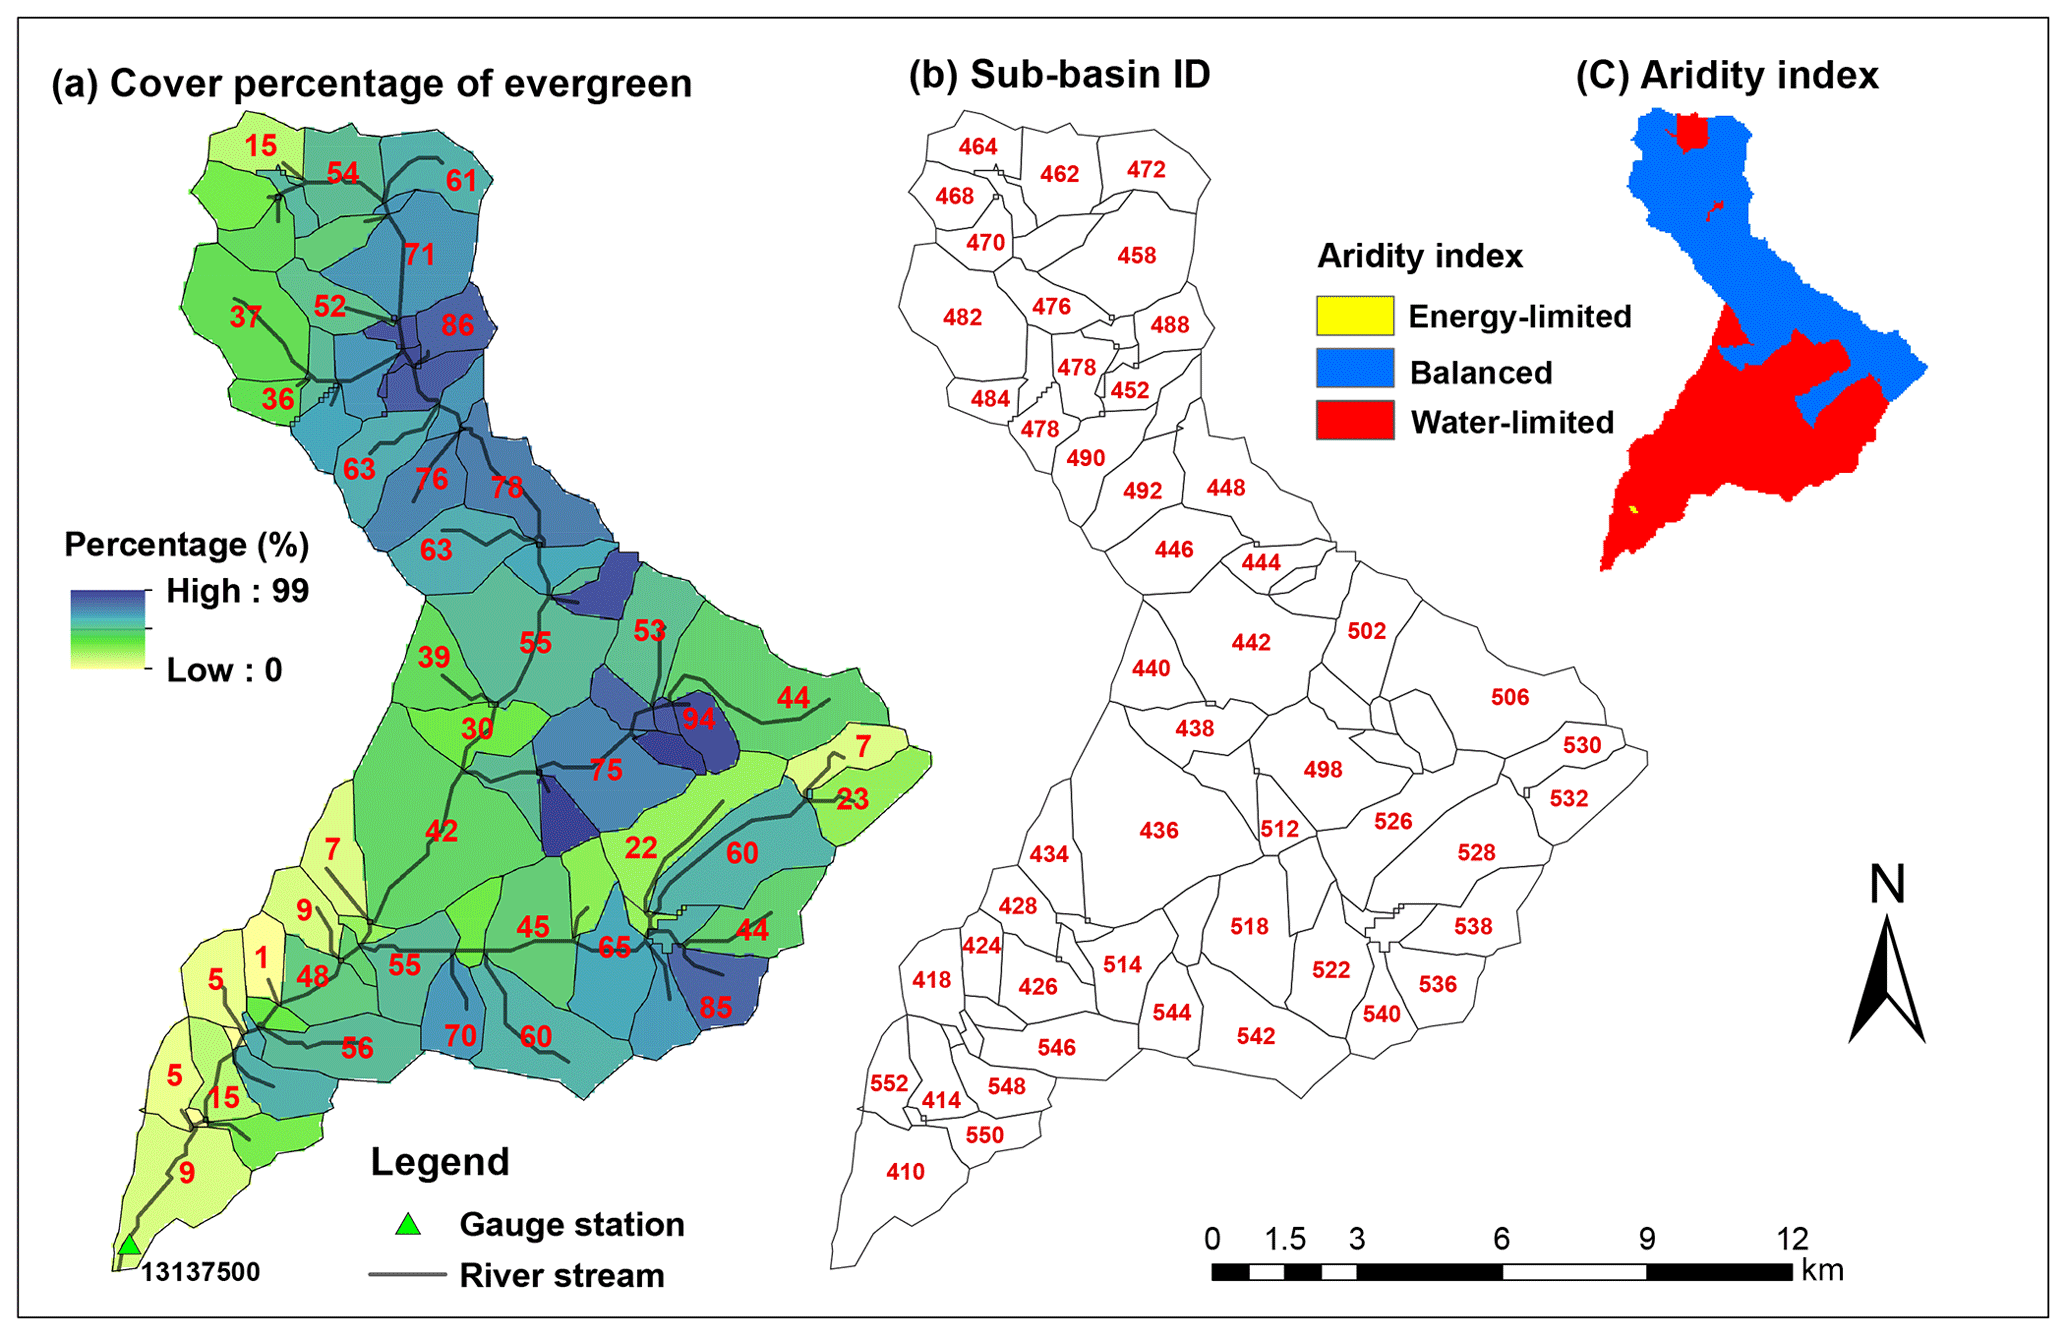
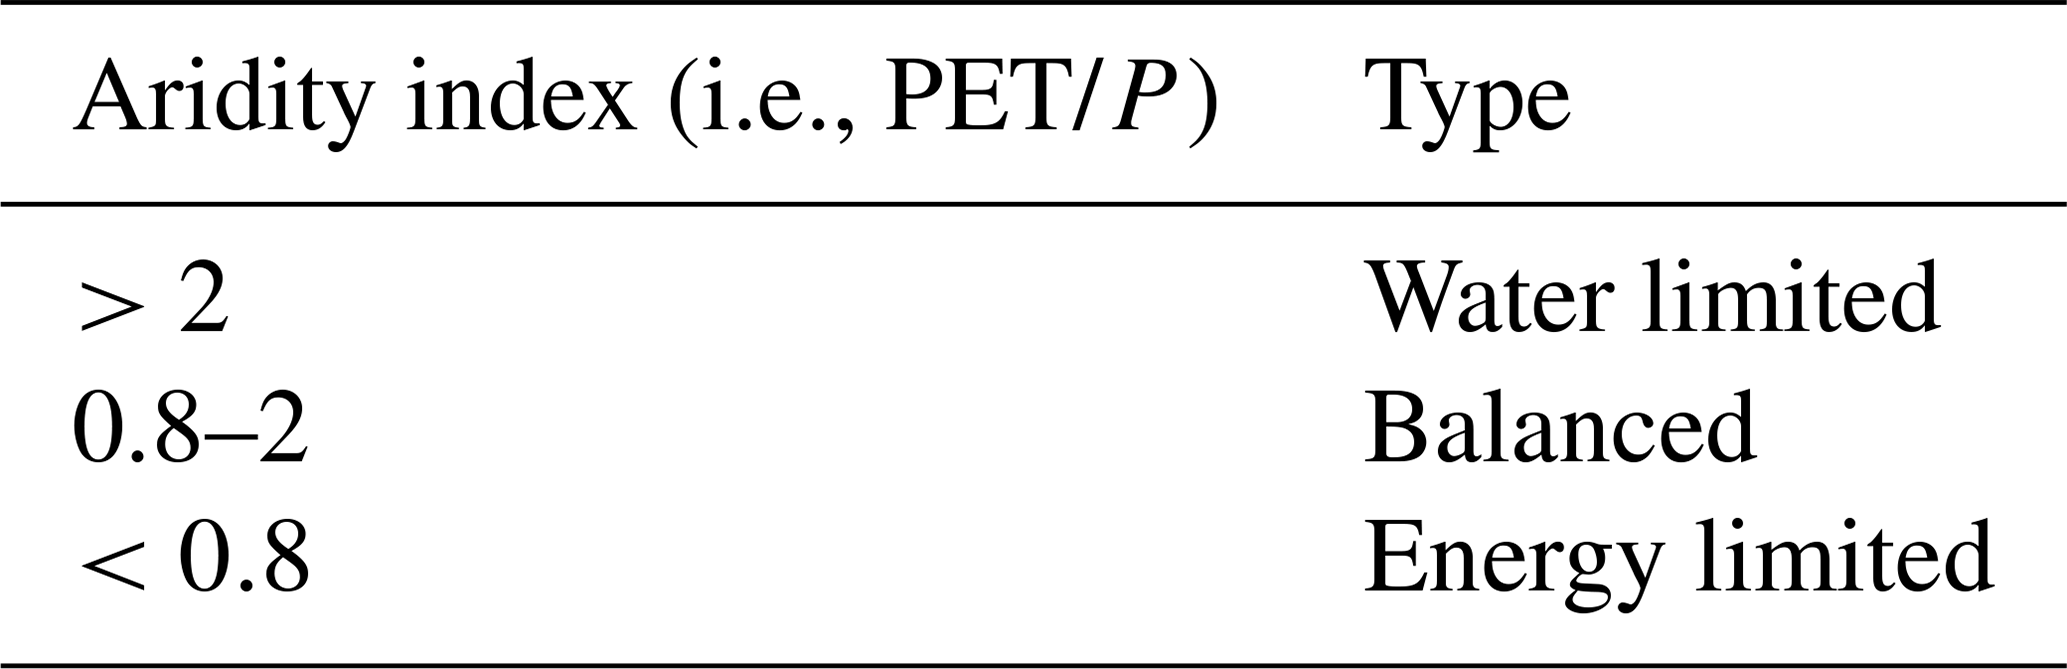
Figure 3Evergreen forest cover percentage and ID of each sub-basin in Trail Creek, and long-term aridity index for this watershed. Aridity index is defined as annual mean potential evapotranspiration (PET)/precipitation (P) from 38 years of data (see Sect. 3.4); PET/P>2 is water limited, PET/P<0.8 is energy limited, and PET/P between 0.8 and 2 is balanced. Recall that only evergreen forest trees are attacked during beetle outbreaks.
Trail Creek has cold, wet winters and warm, dry summers; mean annual precipitation is approximately 978 mm, 60 % of which falls as snow (Frenzel, 1989). The soil is mostly permeable coarse alluvium (Smith, 1960). Elevations range from 1760 to 3478 m. Along this elevation gradient, there are also strong vegetation and aridity gradients (Fig. 3). The northern (higher elevation) portion of the basin is mesic and covered principally by evergreen forest containing Douglas fir (Pseudotsuga menziesii), lodgepole pine (Pinus contorta var. latifolia), subalpine fir (Abies lasiocarpa), and mixed shrub and herbaceous vegetation. The southern (lower elevation) portion is xeric and covered by shrubs, grasses, and mixed herbaceous species, including sagebrush, riparian species, and grasslands (Buhidar, 2002).
In total, Trail Creek contains 72 sub-basins, and two of them (sub-basins 412 and 416 in Fig. 3) are urban areas. When we classified this basin into different zones according to an aridity index, i.e., the ratio of the 38 year average annual potential evapotranspiration (PET) to the precipitation (P) (Sect. 3.4), two distinct hydrologic–vegetation cover types emerged: the high-elevation northern area is balanced (i.e., PET/P is between 0.8 and 2) and evergreen tree coverage is more than 50 %; the southern part is water limited (i.e., PET/P>2) and evergreen tree coverage is less than 30 % (Figs. 2 and 3).
3.2 Model descriptions
3.2.1 Ecohydrologic model
The Regional Hydro-Ecological Simulation System (RHESSys; Tague and Band, 2004) is a mechanistic model designed to simulate the effects of climate and land-use changes on ecosystem carbon and nitrogen cycling and hydrology. RHESSys fully couples hydrologic processes (including streamflow, lateral flow, ET, and soil moisture, etc.), plant growth and vegetation dynamics (including photosynthesis, maintenance respiration, and mortality, etc.), and soil biogeochemical cycling (including soil organic matter decomposition, mineralization, nitrification, denitrification, and leaching, etc.). It has been widely tested and applied in several mountainous watersheds in western North America, including many in the Pacific and Inland Northwest (e.g., Tague and Band, 2004; Garcia and Tague, 2015; Hanan et al., 2017, 2018, 2021; Lin et al., 2019; Son and Tague, 2019).
RHESSys represents a watershed using a hierarchical set of spatial units, including patches, zones, sub-basins, and the full basin, to simulate various hydrologic and biogeochemical processes occurring at these scales (Tague and Band, 2004). The patch is the finest spatial scale at which vertical soil moisture and soil biogeochemistry are simulated. In every patch, there are multiple canopy strata layers to simulate the biogeochemical processes related to plant growth and nutrient uptake. Meteorological forcing inputs (e.g., temperature, precipitation, humidity, wind speed, and solar radiation) are handled at the zone level and spatially interpolated and downscaled for each patch based on elevation, slope, and aspect. Sub-basins are closed drainage areas entering both sides of a single stream reach (the water budget is closed in sub-basins). The largest spatial unit is the basin, which aggregates the streamflow from sub-basins (Hanan et al., 2018; Tague and Band, 2004). In RHESSys, streamflow is the sum of overland flow and baseflow, and we consider the streamflow to be the water yield of each sub-basin.
RHESSys models vertical and lateral hydrologic fluxes, including canopy interception, plant transpiration, canopy evaporation/sublimation, snow accumulation, snowmelt and sublimation, soil evaporation, soil infiltration, and subsurface drainage. Canopy interception is based on the water-holding capacity of vegetation, which is also a function of plant area index (PAI). Both the canopy evaporation and transpiration are modeled using the standard Penman–Monteith equation (Monteith, 1965). Snow accumulation is calculated from incoming precipitation and is assumed to fall evenly across each zone. Snowmelt is based on a quasi-energy budget approach accounting for radiation input, sensible and latent heat fluxes, and advection. Soil evaporation is constrained by both energy and atmospheric drivers, as well as a maximum exfiltration rate controlled by soil moisture (Tague and Band, 2004). Vertical drainage and lateral flow are a function of topography and soil hydraulic conductivity, which decays exponentially with depth (Hanan et al., 2018; Tague and Band, 2004). Section S1 in the Supplement contains a more detailed synopsis of the soil hydrologic model.
Vegetation carbon and nitrogen dynamics are calculated separately for each canopy layer within each patch, while soil and litter carbon and nitrogen cycling are simulated at the patch level. Photosynthesis is calculated based on the Farquhar model, which considers the limitations of nitrogen, light, stomatal conductance (influenced by soil water availability), vapor pressure deficit, atmospheric CO2 concentration, radiation, and air temperature (Farquhar and von Caemmerer, 1982; Tague and Band, 2004). Maintenance respiration is based on Ryan (1991), in which respiration is computed as a function of nitrogen concentration and air temperature. Growth respiration is calculated as a fixed ratio of new carbon allocation for each vegetation component (Ryan, 1991; Tague and Band, 2004). Net photosynthesis is allocated to leaves, stems, and roots at daily steps based on the Dickinson partitioning method, which varies with each plant development stage (Dickinson et al., 1998). LAI is estimated from leaf carbon and specific leaf area for each vegetation type. The soil and litter carbon and nitrogen cycling (heterotrophic respiration, mineralization, nitrification, and denitrification, etc.) are modified from the BIOME_BGC and CENTURY-NGAS models (Parton, 1996; Tague and Band, 2004; White and Running, 1994). A detailed description of RHESSys model algorithms can be found in Tague and Band (2004).
3.2.2 Beetle effects model
Edburg et al. (2011) designed and developed a model of MPB effects on carbon and nitrogen dynamics for integration with the Community Land Model Version 4 (CLM4) (Lawrence et al., 2011, Fig. 4). We integrated this beetle effects model into RHESSys (Fig. 4). Beetles attack trees mainly during late summer, with needles turning from green to red at the beginning of the following summer. We simplified this process by prescribing that tree mortality occurred on 1 September when representing a beetle outbreak in a given year. The advantage of this integration is that RHESSys accounts for the lateral connectivity in water and nitrogen fluxes among patches, which is not represented in CLM4 (Fan et al., 2019). Our approach differs from other hydrologic models of beetle effects (e.g., VIC, CLM-ParFlow, and DHSVM) because it includes dynamic changes in plant carbon and nitrogen cycling caused by beetle attack, plant recovery, and their effects on hydrologic responses. Previous studies of hydrologic effects of beetle outbreaks have mainly focused on consequences of changes in LAI and stomatal resistance during each phase of mortality while missing feedbacks between carbon and nitrogen dynamics, vegetation recovery, and hydrology (Bennett et al., 2018; Livneh et al., 2015; Mikkelson et al., 2013; Penn et al., 2016; Sun et al., 2018).
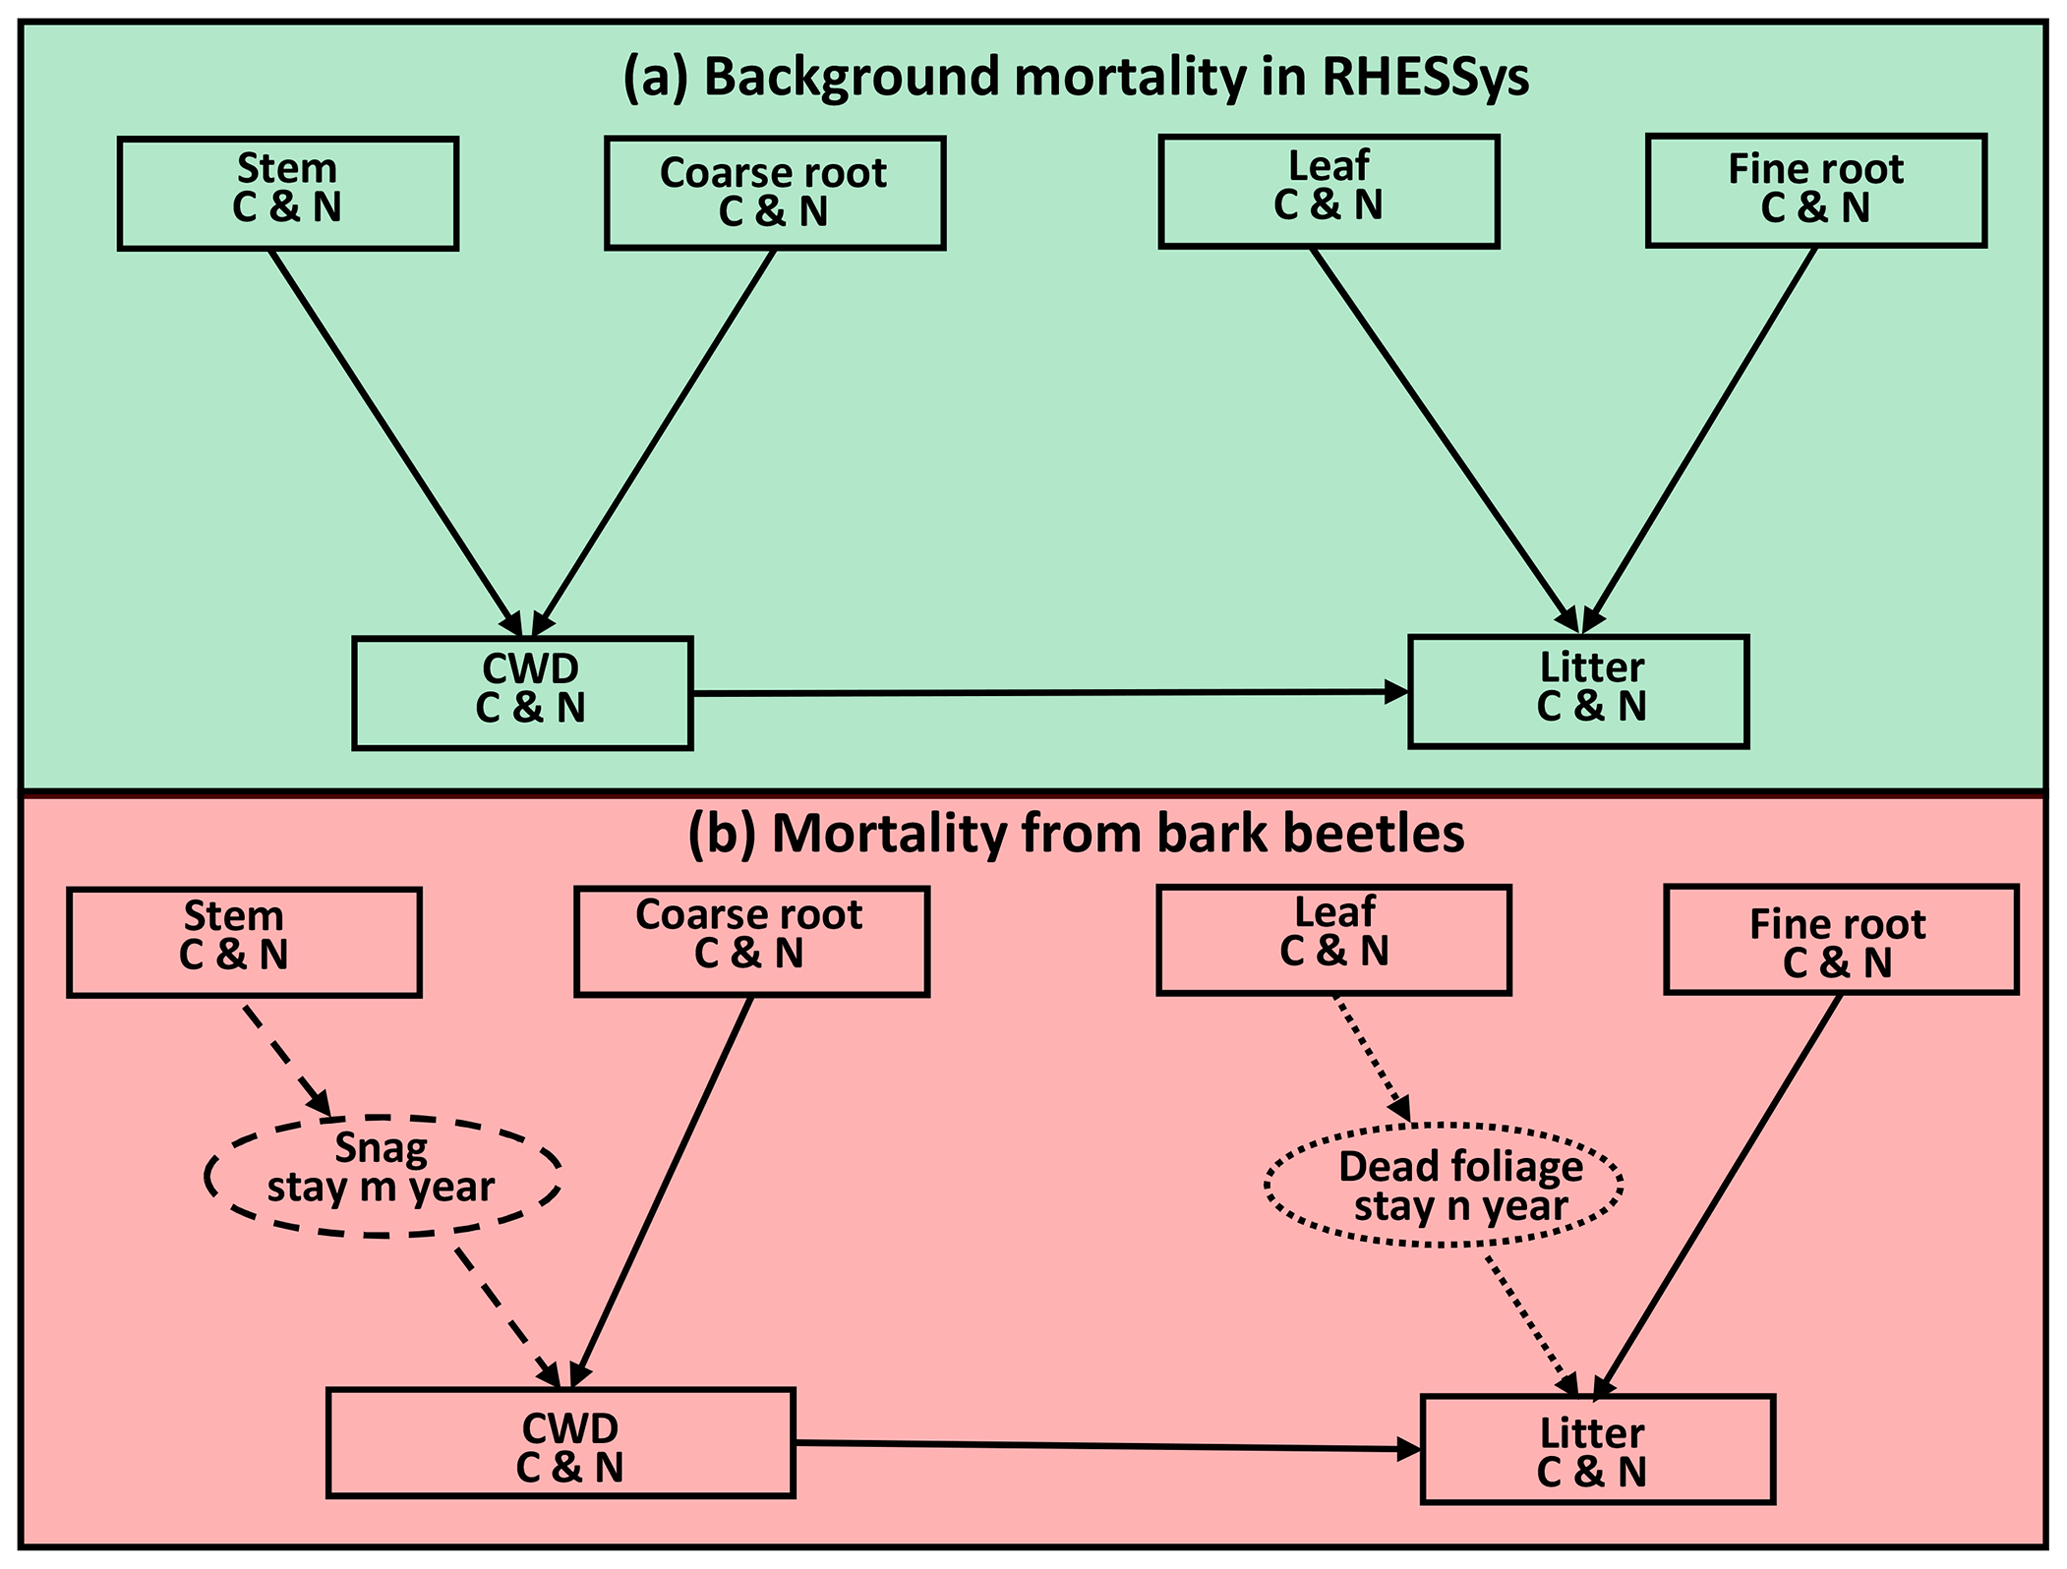
Figure 4Conceptual framework of the beetle effects model. (a) Normal background mortality routine in RHESSys before the beetle outbreak. (b) Mortality from bark beetles. We added a snag (standing dead tree) and a dead foliage (needles still on dead tree) pool, as shown in the dashed and dotted circle, respectively. After a beetle outbreak, carbon (C) and nitrogen (N) move from the stem to the snag pool (dashed arrow). After staying in the snag pool for m years, C and N move on to the coarse wood debris pool (CWD) with an exponential decay rate to represent the snag fall (dashed arrow). There is a similar process for leaf C and N, which move from leaf to dead foliage to litter pool (dotted arrow). Furthermore, C and N in the CWD and fine root pools move to the litter pool immediately after the outbreak. Figure modified from Edburg et al. (2011).
To better represent the effects of beetle-caused tree mortality, we added a snag pool (standing dead tree stems) and a dead foliage pool (representing the red needle phase) in RHESSys (Fig. 4). All leaf biomass (including carbon and nitrogen) become part of the dead foliage pool. After 1 year, the dead foliage is transferred to the litter pool at an exponential rate with a half-life of 2 years (Edburg et al., 2011, 2012; Hicke et al., 2012). Similarly, stem carbon and nitrogen are moved to the snag pool immediately after the outbreak. After 5 years, carbon and nitrogen in snags begin to move into the coarse woody debris (CWD) pool at an exponential decay rate with a half-life of 10 years (Edburg et al., 2011, 2012). After the outbreak, the coarse roots that are killed move to the CWD and fine roots move to the litter pool. To simplify, we assume a uniform mortality level for all evergreen patches across the landscape. Due to the limitations of land cover data, we cannot separate the pine and fir in these evergreen patches. However, this does not affect the interpretation of our results because we analyze them based on mortality level and evergreen vegetation coverage rather than based on species.
In the integrated model, the reductions in leaf carbon and nitrogen after a beetle outbreak can directly decrease LAI and canopy height, which consequently affects energy (i.e., longwave radiation and the interception of shortwave radiation) and hydrologic (i.e., transpiration and canopy interception) fluxes. The model calculates two types of LAI: live LAI (i.e., only live leaves are included), and total LAI (i.e., both live and dead leaves are included). Plant transpiration is a function of the live LAI, while other canopy properties, including interception and canopy evaporation, are a function of the total LAI. The calculation of canopy height includes living stems and the snag pool.
3.3 Input data
We used the US Geologic Survey (USGS) National Elevation Dataset (NED) at 10 m resolution to calculate the topographic properties of Trail Creek, including elevation, slope, aspect, basin boundaries, sub-basins, and patches. Using NED, we delineated 16705 patches with 100 m resolution within 72 sub-basins. We used the National Land Cover Database (NLCD) to identify five vegetation and land cover types, i.e., evergreen, grass/herbaceous, shrub, deciduous, and urban (Homer et al., 2015). We determined soil properties for each patch using the POLARIS database (probabilistic remapping of SSURGO; Chaney et al., 2016). Parameters for soil and vegetation were based on previous research and literature (Ackerly, 2004; Berner and Law, 2016; Hanan et al., 2016, 2021; Law et al., 2003; White et al., 2000).
Climate inputs for this study, including maximum and minimum temperatures, precipitation, relative humidity, radiation, and wind speed, were acquired from gridMET for the years from 1980 to 2018. GridMET provides daily high-resolution (∘ or ∼4 km) gridded meteorological data (Abatzoglou, 2013). This is a blended climate dataset that combines the temporal attributes of gauge-based precipitation data from NLDAS-2 (Mitchell et al., 2004) with the spatial attributes of gridded climate data from PRISM (Daly et al., 1994).
3.4 Simulation experiments
To quantify how water yield responds to beetle-caused mortality, we prescribed a beetle outbreak in September 1989, with the same mortality level (%) applied to all evergreen patches for each sub-basin. After the beetle outbreak, red needles remained on the trees for 1 year before they started to fall (i.e., were transferred to the litter pool) at an exponential rate with a half-life of 2 years. The snag pool remained as standing trees for 5 years and then began to fall and were added to the CWD pool, which decayed at an exponential rate with a half-life of 10 years.
To address Q1 (i.e., the role of interannual variability), we compared water yield responses during a dry water year, 1994 (i.e., 5 years after the beetle outbreak, with an annual precipitation of 611 mm), to responses during a wet year, 1995 (i.e., 6 years after the beetle outbreak, with an annual precipitation of 1394 mm). This enabled us to estimate the role of interannual climate variability in driving changes in water yield following a beetle attack. The dry year was selected from years that had precipitation below the 15th percentile of the annual precipitation data (1980–2018; Searcy, 1959; see Fig. S1 in the Supplement). During the early period after the beetle outbreak (e.g., 1994 and 1995), the forest experienced large changes in vegetation canopy cover, plant transpiration, and soil moisture. We chose these two successive years because their canopy and vegetation statuses were similar in terms of fallen dead foliage and residual vegetation regrowth, which makes this comparison reasonable. However, it is possible that antecedent climate conditions may affect the following year's response. For example, soil moisture can be depleted during a drought year, affecting initial conditions the following year. Moreover, under drought conditions, less reactive nitrogen is taken up by the plants or leaching is reduced, so more nitrogen will be left for the following year. Therefore, the difference in water yield response between 1994 and 1995 might be affected by not only climate variations but also the initial hydrologic and biogeochemical conditions. To consider the time lag effect (antecedent conditions affecting the current year's response), we also analyzed other dry and wet years.
To address Q2 (i.e., the role of vegetation mortality), we prescribed a range of beetle-caused mortality levels (i.e., from 10 % to 60 % in steps of 10 % in terms of the reduction in carbon, which was uniformly applied to all evergreen patches for each sub-basin) and a control run (no mortality). This enabled us to quantify how forest water yield responded to the level of vegetation mortality (for each sub-basin, vegetation mortality was the evergreen mortality multiplied by the evergreen coverage of that basin). The differences in water yield between each mortality level and the control run represent the effects of beetle kill: a positive value means that mortality increased water yield, and vice versa.
We quantified the water budget for each sub-basin to examine which hydrologic processes contribute to the water yield responses: water yield (Q), precipitation (P), canopy evaporation (Ecanopy: canopy evaporation and snow sublimation), transpiration (T), ground evaporation (Eground, which includes bare soil evaporation, pond evaporation, and litter evaporation), snow sublimation (Sublim, ground), soil storage change (), litter storage change (), snowpack storage change (), and canopy storage change (). We summarized these rate variables at annual time steps.
The storage components include soil, litter, and canopy. According to Eq. (1), if the storage increases, water yield decreases.
Q is the water yield (mm yr−1); P is the precipitation (mm yr−1); Ecanopy is the canopy evaporation (including the canopy snow sublimation; mm yr−1); Eground is the ground evaporation (including bare soil evaporation, pond evaporation, and litter evaporation; mm yr−1); T is the transpiration (mm yr−1); Sublim is the ground snow sublimation (mm yr−1); is the change in soil water storage calculated at yearly intervals (mm yr−1); is the change in litter water storage calculated at yearly intervals (mm yr−1); is the change in canopy water storage calculated at yearly intervals (mm yr−1), and is the change in snowpack water storage calculated at yearly intervals (mm yr−1).
Water balance differences between different mortality scenarios and control scenario results were calculated using Eq. (2). (Note that precipitation is a model input and is unaffected by mortality and so ΔP=0.)
To address Q3 (i.e., the role of long-term aridity), we calculated a long-term aridity index (PET/P, Fig. 3) across the basin and analyzed the relationship between long-term aridity index and hydrologic response. As mentioned earlier, the long-term aridity index is defined as the ratio of the mean annual potential ET (PET) to the annual precipitation (P) averaged over 38 years (water year 1980–2018) of historical meteorological data. Based on the long-term aridity index, we classified our sub-basins into three types (i.e., water limited, balanced, and energy limited; McVicar et al., 2012; Table 1).
4.1 Simulated vegetation response to a beetle outbreak at the basin scale
4.1.1 Vegetation response to a beetle outbreak
Figure 5 shows the basin-scale vegetation response after a beetle outbreak in 1989. The live LAI dropped immediately after the beetle outbreak, then gradually recovered to pre-outbreak levels during the following years (Fig. 5a). The total LAI (including dead foliage) slightly increased during the first 10 years after the beetle outbreak (1990–2000), which was due to the retention of dead leaves in the canopy and the simultaneous growth of the residual (unaffected) overstory and understory vegetation (Fig. 5b). The dead foliage pool (Fig. 5c) remained in place for 1 year and then began to fall to the ground (was converted to litter) exponentially with a half-life of 2 years, and the snag pool (Fig. 5d) remained in place for 5 years and then began to fall to the ground (was converted to CWD) exponentially with a half-life of 10 years. These behaviors of the dead foliage and snag pools are similar to those noted in Edburg et al. (2011), which demonstrates that the integrated model is simulating expected vegetation dynamics following a beetle outbreak.
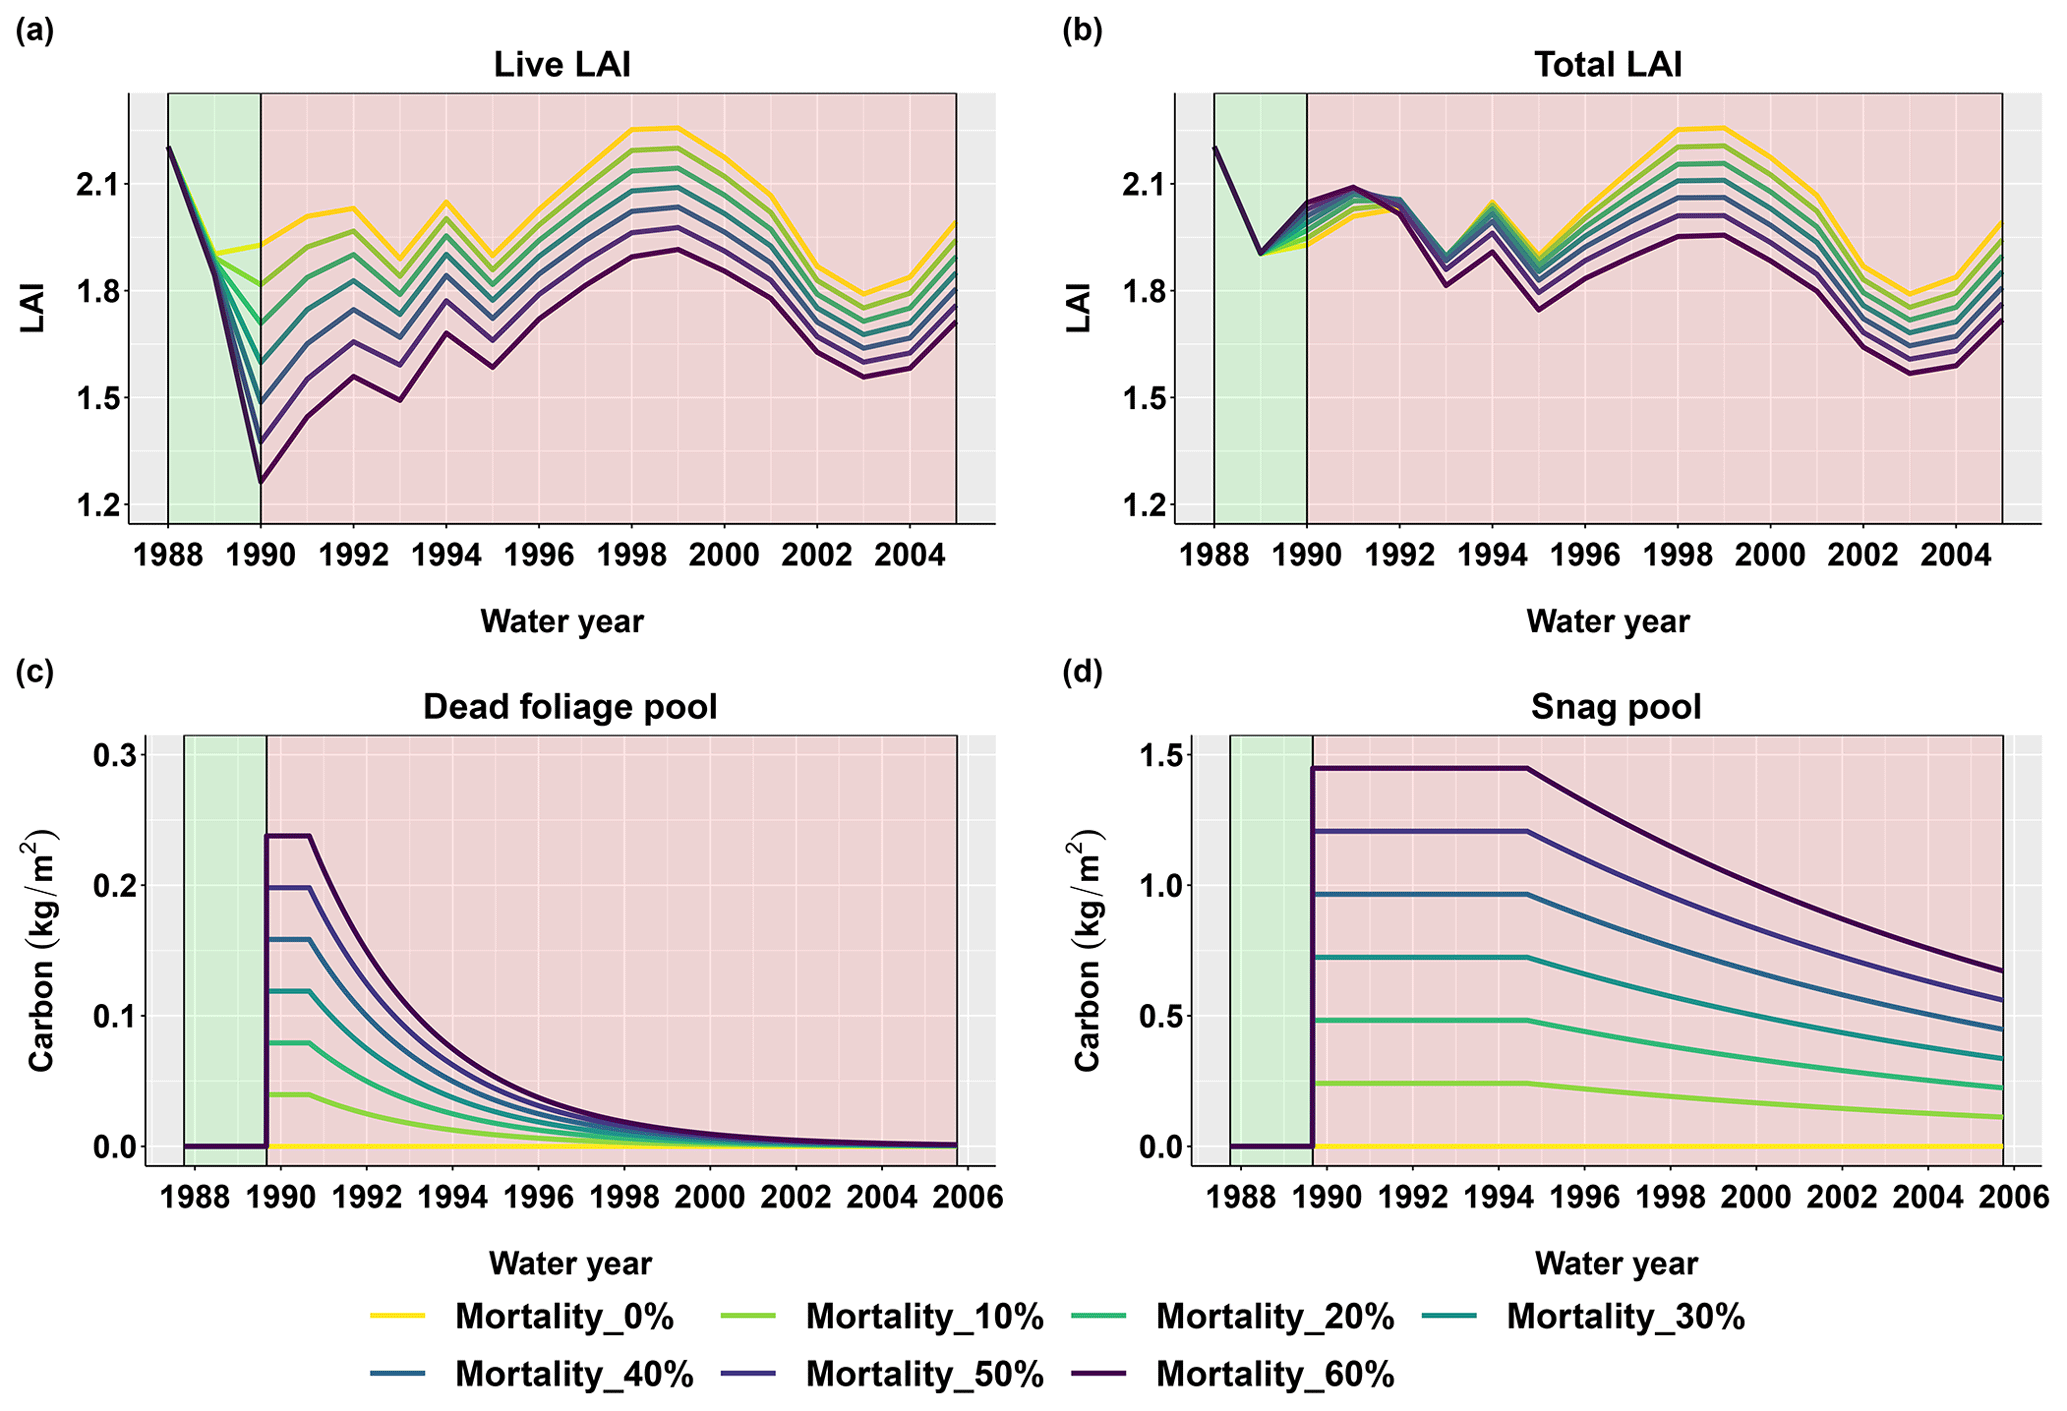
Figure 5Basin-scale vegetation responses after a beetle outbreak for different evergreen mortality levels. (a) Annual live leaf area index (live LAI), (b) annual total LAI (calculated including the dead foliage pool), (c) daily dead foliage pool, and (d) daily snag pool after the outbreak. The green and red background colors denote the periods before and after the beetle outbreak, respectively.
4.1.2 Time series of the hydrologic response to the beetle outbreak
Figure 6 shows the changes in simulated water fluxes and soil moisture over the basin after the beetle outbreak with various evergreen mortality levels. During the first 15 years after the beetle outbreak, scenarios where the evergreen mortality level was larger than zero had higher basin-scale water yields than the control scenario (where the evergreen mortality level was zero). This was especially true during wet years; however, there was no significant increase during dry years (i.e., 1992, 1994, 2001, and 2004; Fig. 6a). The year-to-year soil storage fluxes responded strongly in the first two years after the beetle outbreak and then stabilized to the pre-outbreak condition (Fig. 6b). Note that year-to-year soil storage change is not the same as soil water storage. After the beetle outbreak, the soil held some portion of the water that was not taken up by plants, but this was constrained by the soil water holding capacity. This phenomenon indicates that the soil has some resilience to vegetation change.
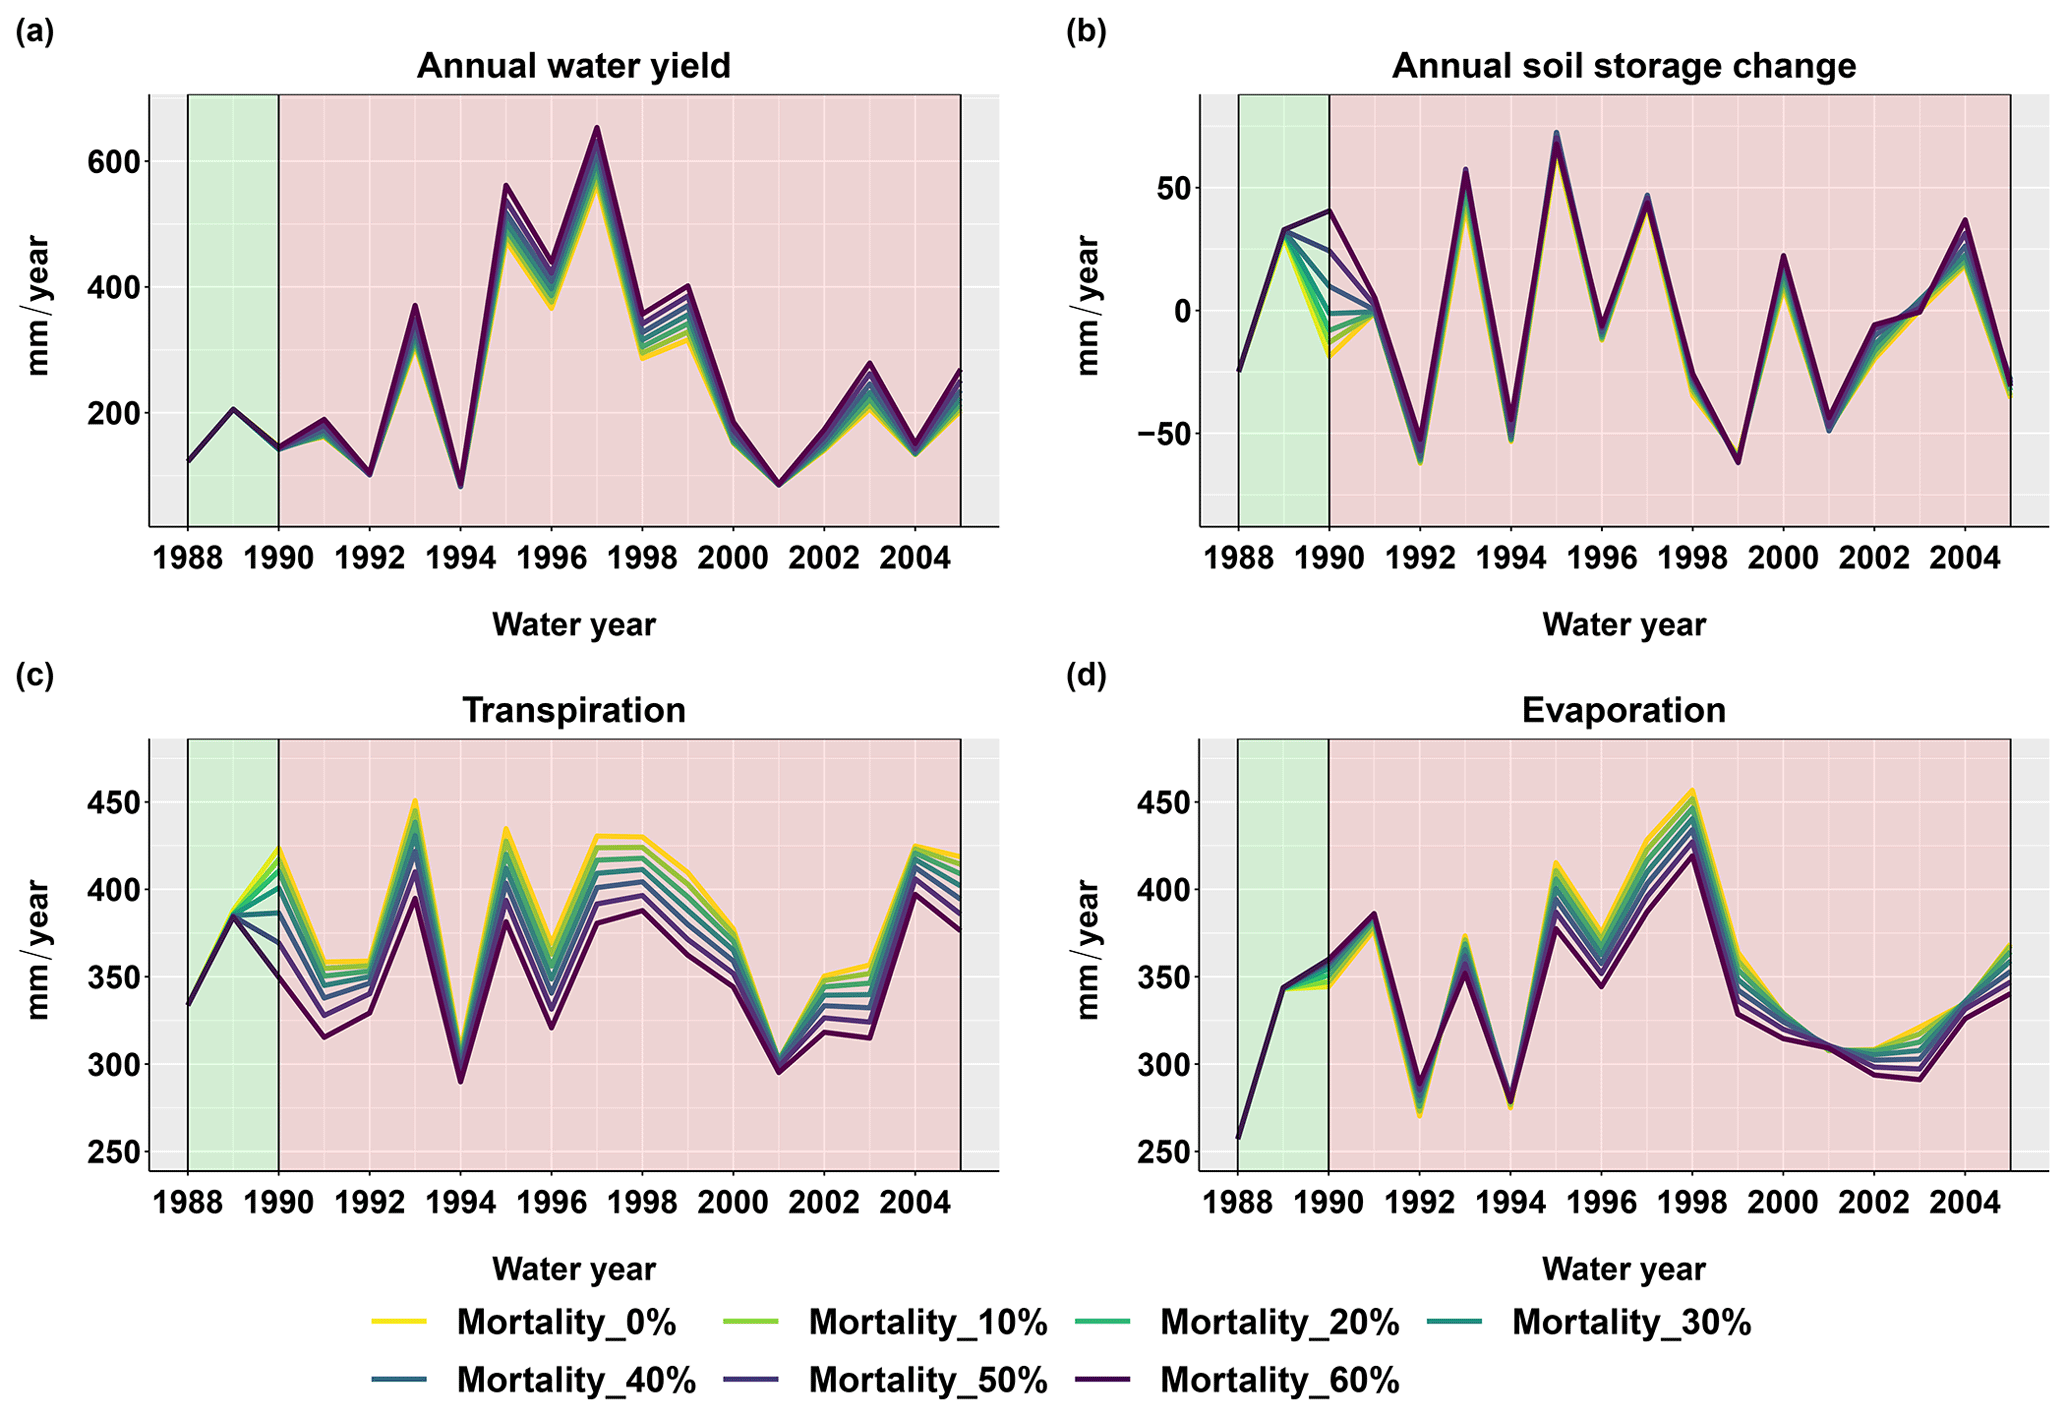
Figure 6Basin-scale annual sum of hydrologic flux responses after the beetle outbreak (1989) for different evergreen mortality levels. (a) Annual water yield calculated as the annual sum of the basin streamflow and (b) annual soil water storage change calculated as the soil water storage at the end of the water year minus the soil water storage at the beginning of the water year. (c) Transpiration is the annual sum of the transpiration for both the overstory and the understory. (d) Evaporation is calculated as the annual sum of canopy evaporation, ground evaporation, and snow sublimation.
The beetle outbreak reduced transpiration during wet years but did not have significant effects in dry years (Fig. 6c). This occurred because transpiration in dry years was water limited and therefore much lower than the potential rate (more water was partitioned to evaporation; similar to Biederman et al., 2014). Thus, killing more trees had little effect on stand-scale transpiration because the remaining trees used any water released by the dead trees in dry years. On the other hand, plant transpiration in wet years was close to the potential rate; therefore, decreases in canopy cover reduced transpiration. There was no apparent effect of the beetle outbreak on snowmelt.
Snow sublimation played an essential role in driving the evaporation responses we observed. In the Trail Creek watershed, snow sublimation accounted for around 50 % of the total evaporation (not shown in the figure), and around 60 % came from the canopy. Canopy sublimation accounted for an even larger proportion of the total sublimation during high snow years (Figs. S7d and S1). These results are similar to other western US forests, where 50–60 % of the total sublimation has been found to come from canopy sublimation, which is more sensitive to beetle kill than ground snow sublimation (Frank et al., 2019; Molotch et al., 2007). We also found that during the first three years after beetle outbreak, when dead foliage was still on the canopy, canopy sublimation increased by approximately 6 % due to an increase in the total LAI as new needles grew and dead foliage remained on the canopy. This increased canopy snow interception and subsequent sublimation (Fig. 5). However, when the dead foliage fell to the ground and snags began to fall, the canopy sublimation decreased by approximately 10 % for the most severe mortality scenario (60 % evergreen mortality) compared to the no-outbreak scenario. This occurred because the canopy total LAI decreased and there was less canopy interception (Fig. 5).
Ground snow sublimation was less sensitive to beetle kill (Fig. S7b). In the first 3 years after beetle kill (at 60 % mortality), ground snow sublimation increased by approximately 7.5 % due to an increase in aerodynamic conductance caused by the higher understory canopy height. However, from 1993 to 2002, there were no obvious changes in ground snow sublimation after beetle outbreak. When all dead foliage and more than 50 % of snags had fallen to the ground, ground snow sublimation decreased because snowmelt increased as the canopy opened (Figs. 5 and S7b). In general, for the 60 % mortality scenario, the ground snow sublimation first increased by approximately 5 % when dead foliage was still on the trees, and then decreased by approximately 6 % when the canopy was open.
The evaporation response was opposite in dry and wet years: evaporation increased in dry years, while it decreased in wet years (Fig. 6d). This phenomenon is caused by tradeoffs and interactions among multiple processes, as will be explained in more detail in the next section.
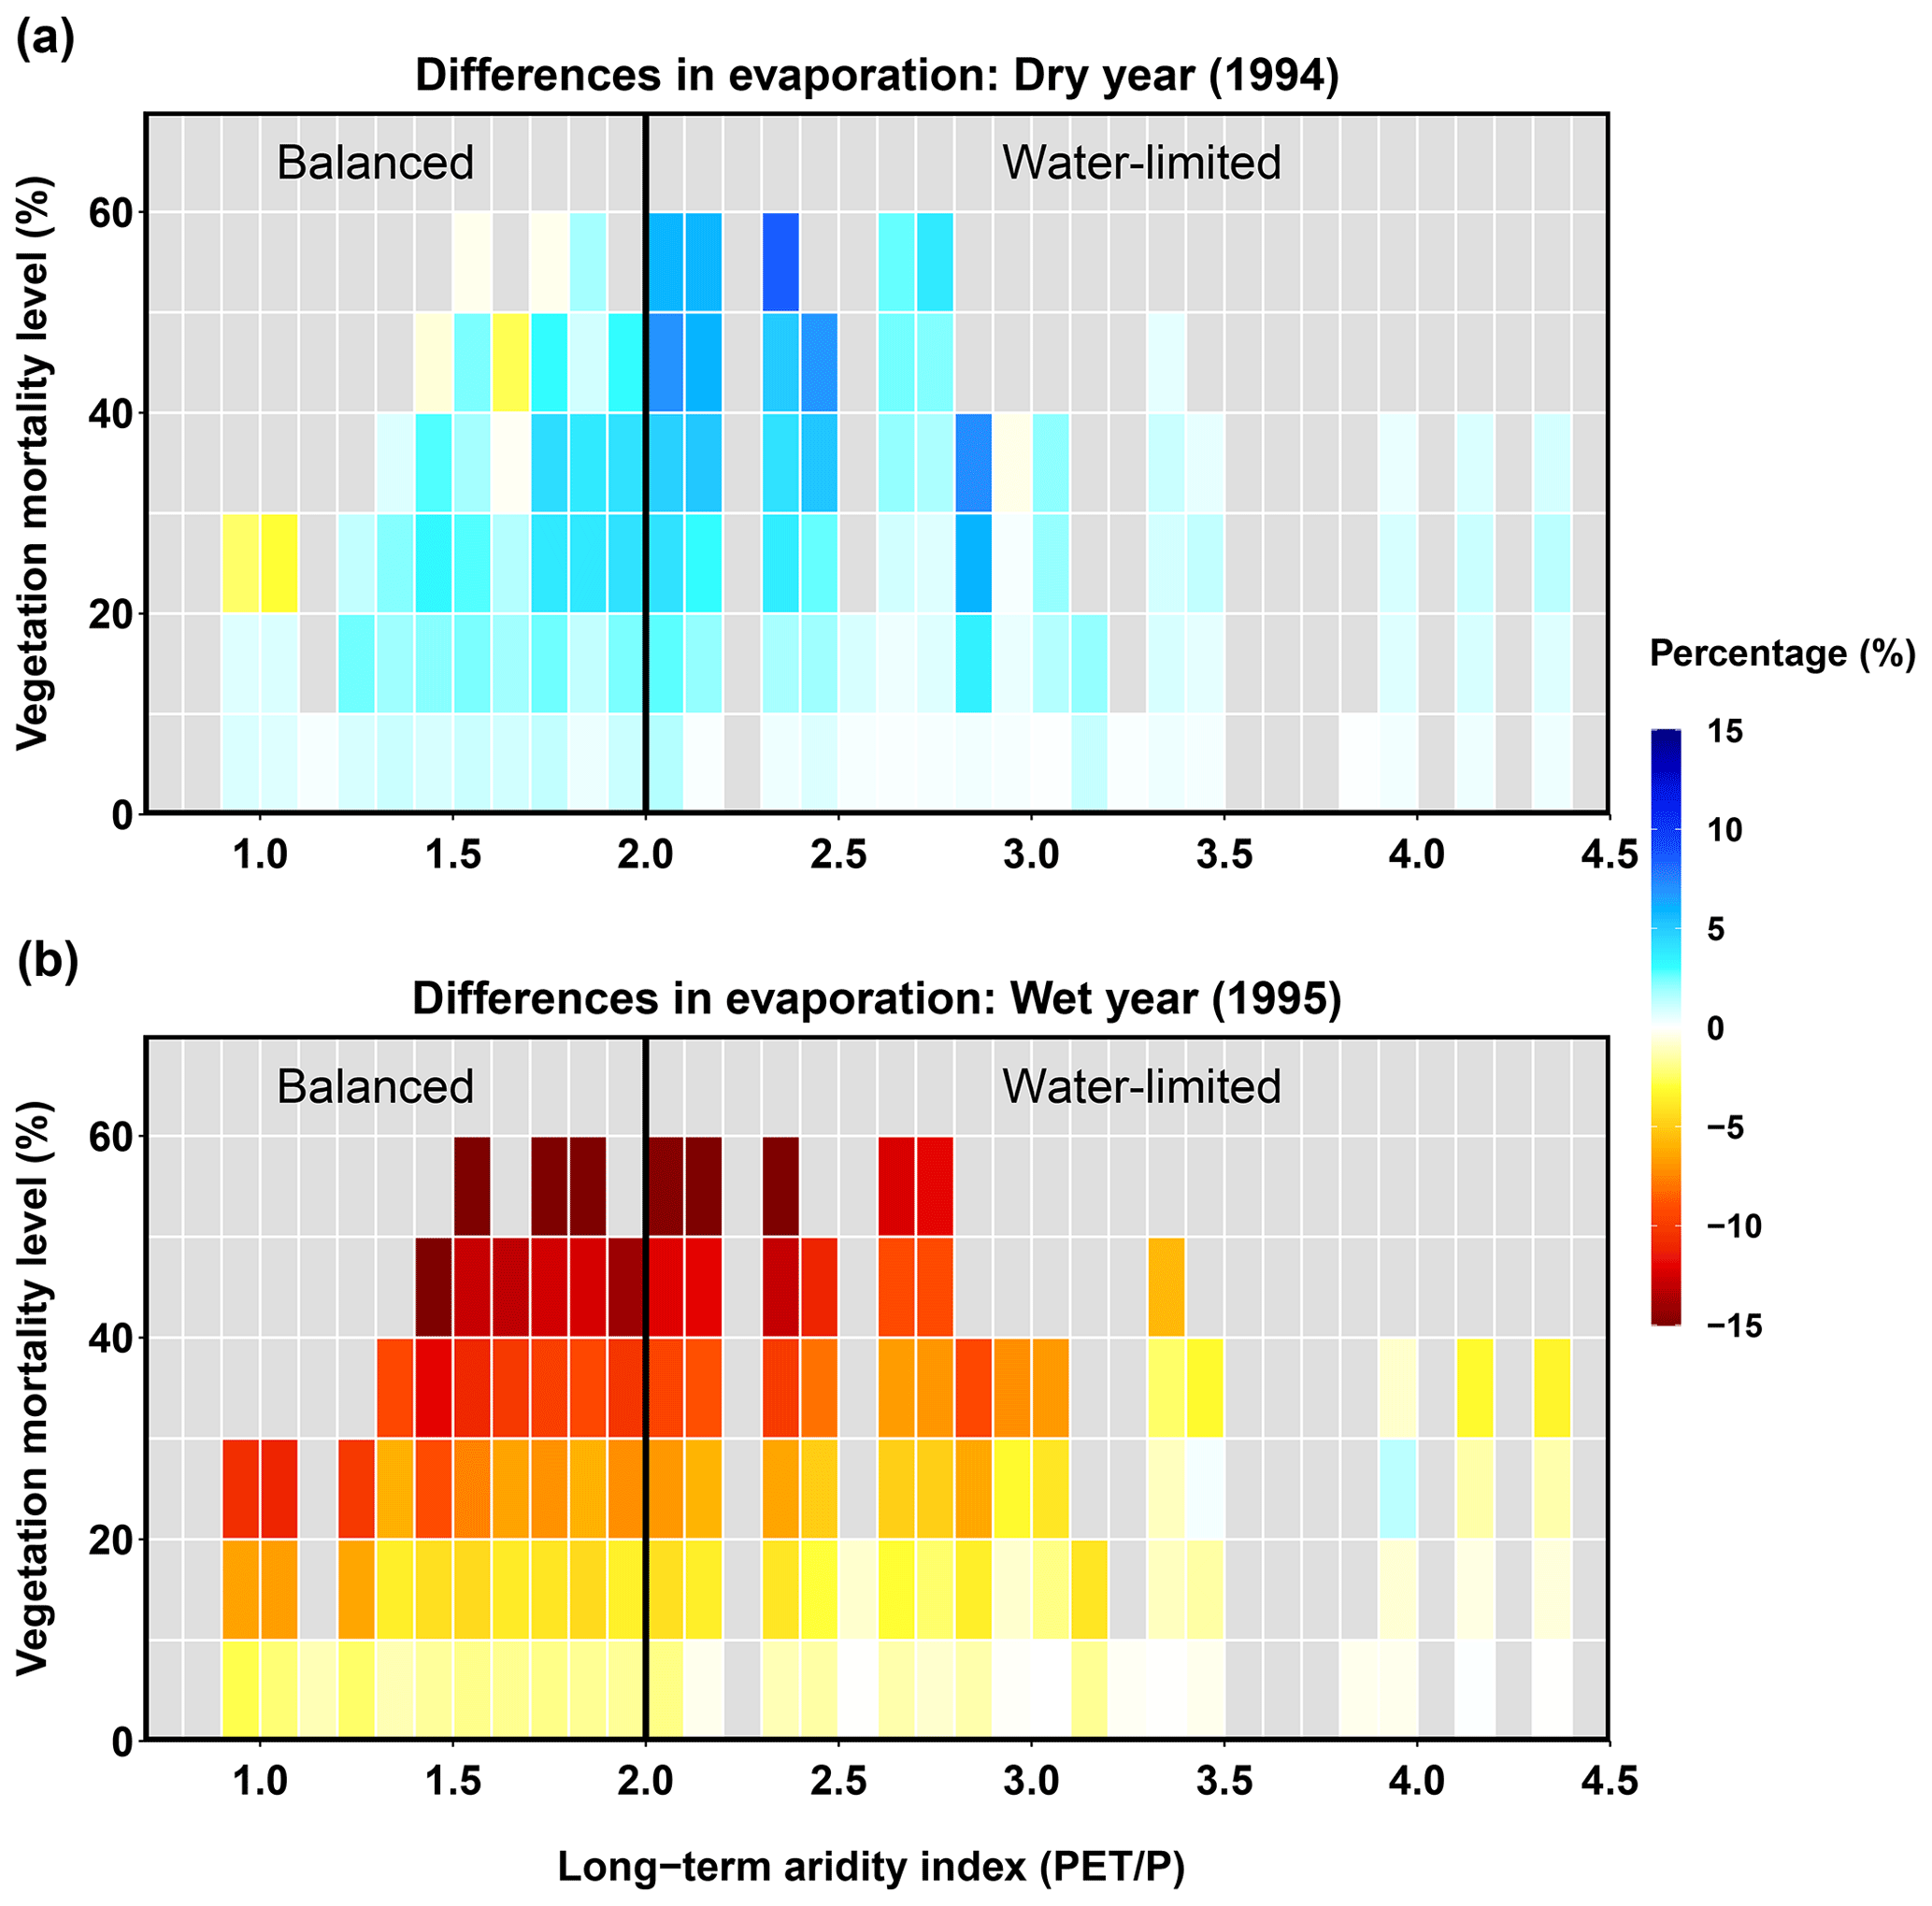
Figure 7Relationships between long-term aridity, vegetation mortality level, and differences in evaporation for a dry year (1994, a) and a wet year (1995, b). Differences are calculated as the normalized differences (%) in evaporation between each evergreen mortality scenario and the control run for no beetle outbreak. Vegetation mortality for each sub-basin is calculated as the percentage of evergreen patches multiplied by the level of evergreen mortality caused by beetles. Long-term aridity is defined as the temporally averaged (38 years) potential evapotranspiration relative to the precipitation.
4.2 The role of spatial heterogeneity in the water yield response
4.2.1 Spatial patterns of hydrologic response along the long-term aridity gradient
Evaporation
The beetle outbreak had opposite effects on evaporation in a dry year and in a wet year (Fig. 7). In the dry year, most sub-basins experienced higher evaporation for beetle outbreak scenarios than in the control scenario (Fig. 7a). This was the cumulative consequence of decreased canopy evaporation and increased ground (soil, litter, pond) evaporation due to decreases in the LAI (caused by mortality). In the dry year, the latter effect (i.e., increased ground evaporation) dominated over the former, leading to an overall increase in evaporation. When the vegetation mortality level (calculated as the percentage of evergreen patches in a sub-basin multiplied by the level of evergreen mortality caused by beetles) was higher than 20 %, a few sub-basins in the balanced (more mesic) area experienced a decrease in evaporation, indicating that the effects of decreasing canopy evaporation outstripped the effects of increasing ground evaporation. In the wet year, most of the sub-basins located in the balanced area (where canopy evaporation decreases dominated) experienced decreases in evaporation. The decrease in evaporation responded linearly to the level of vegetation mortality (Fig. 7b). However, sub-basins located in much drier regions (aridity > 3.5) had relatively minimal responses to the vegetation mortality level, and some even had slight increases in evaporation (where ground evaporation increases were dominant due to the drier long-term climate and lower canopy mortality resulted from less evergreen coverage).
Transpiration
The beetle outbreak decreased transpiration in both dry and wet years, and the decrease became larger with higher mortality levels (Fig. 8). However, during the dry year, the water-limited area experienced less change than the balanced area; some sub-basins even showed slight increases. This increase in the water-limited part of the basin occurred because, after the beetles have killed some overstory evergreen trees, the living trees and understory plants can together exhibit higher transpiration rates in dry years (Tsamir et al., 2019). In the wet year, when most canopies reach their potential transpiration rates (less competition for water), beetle outbreaks can reduce transpiration rates by decreasing the live LAI.
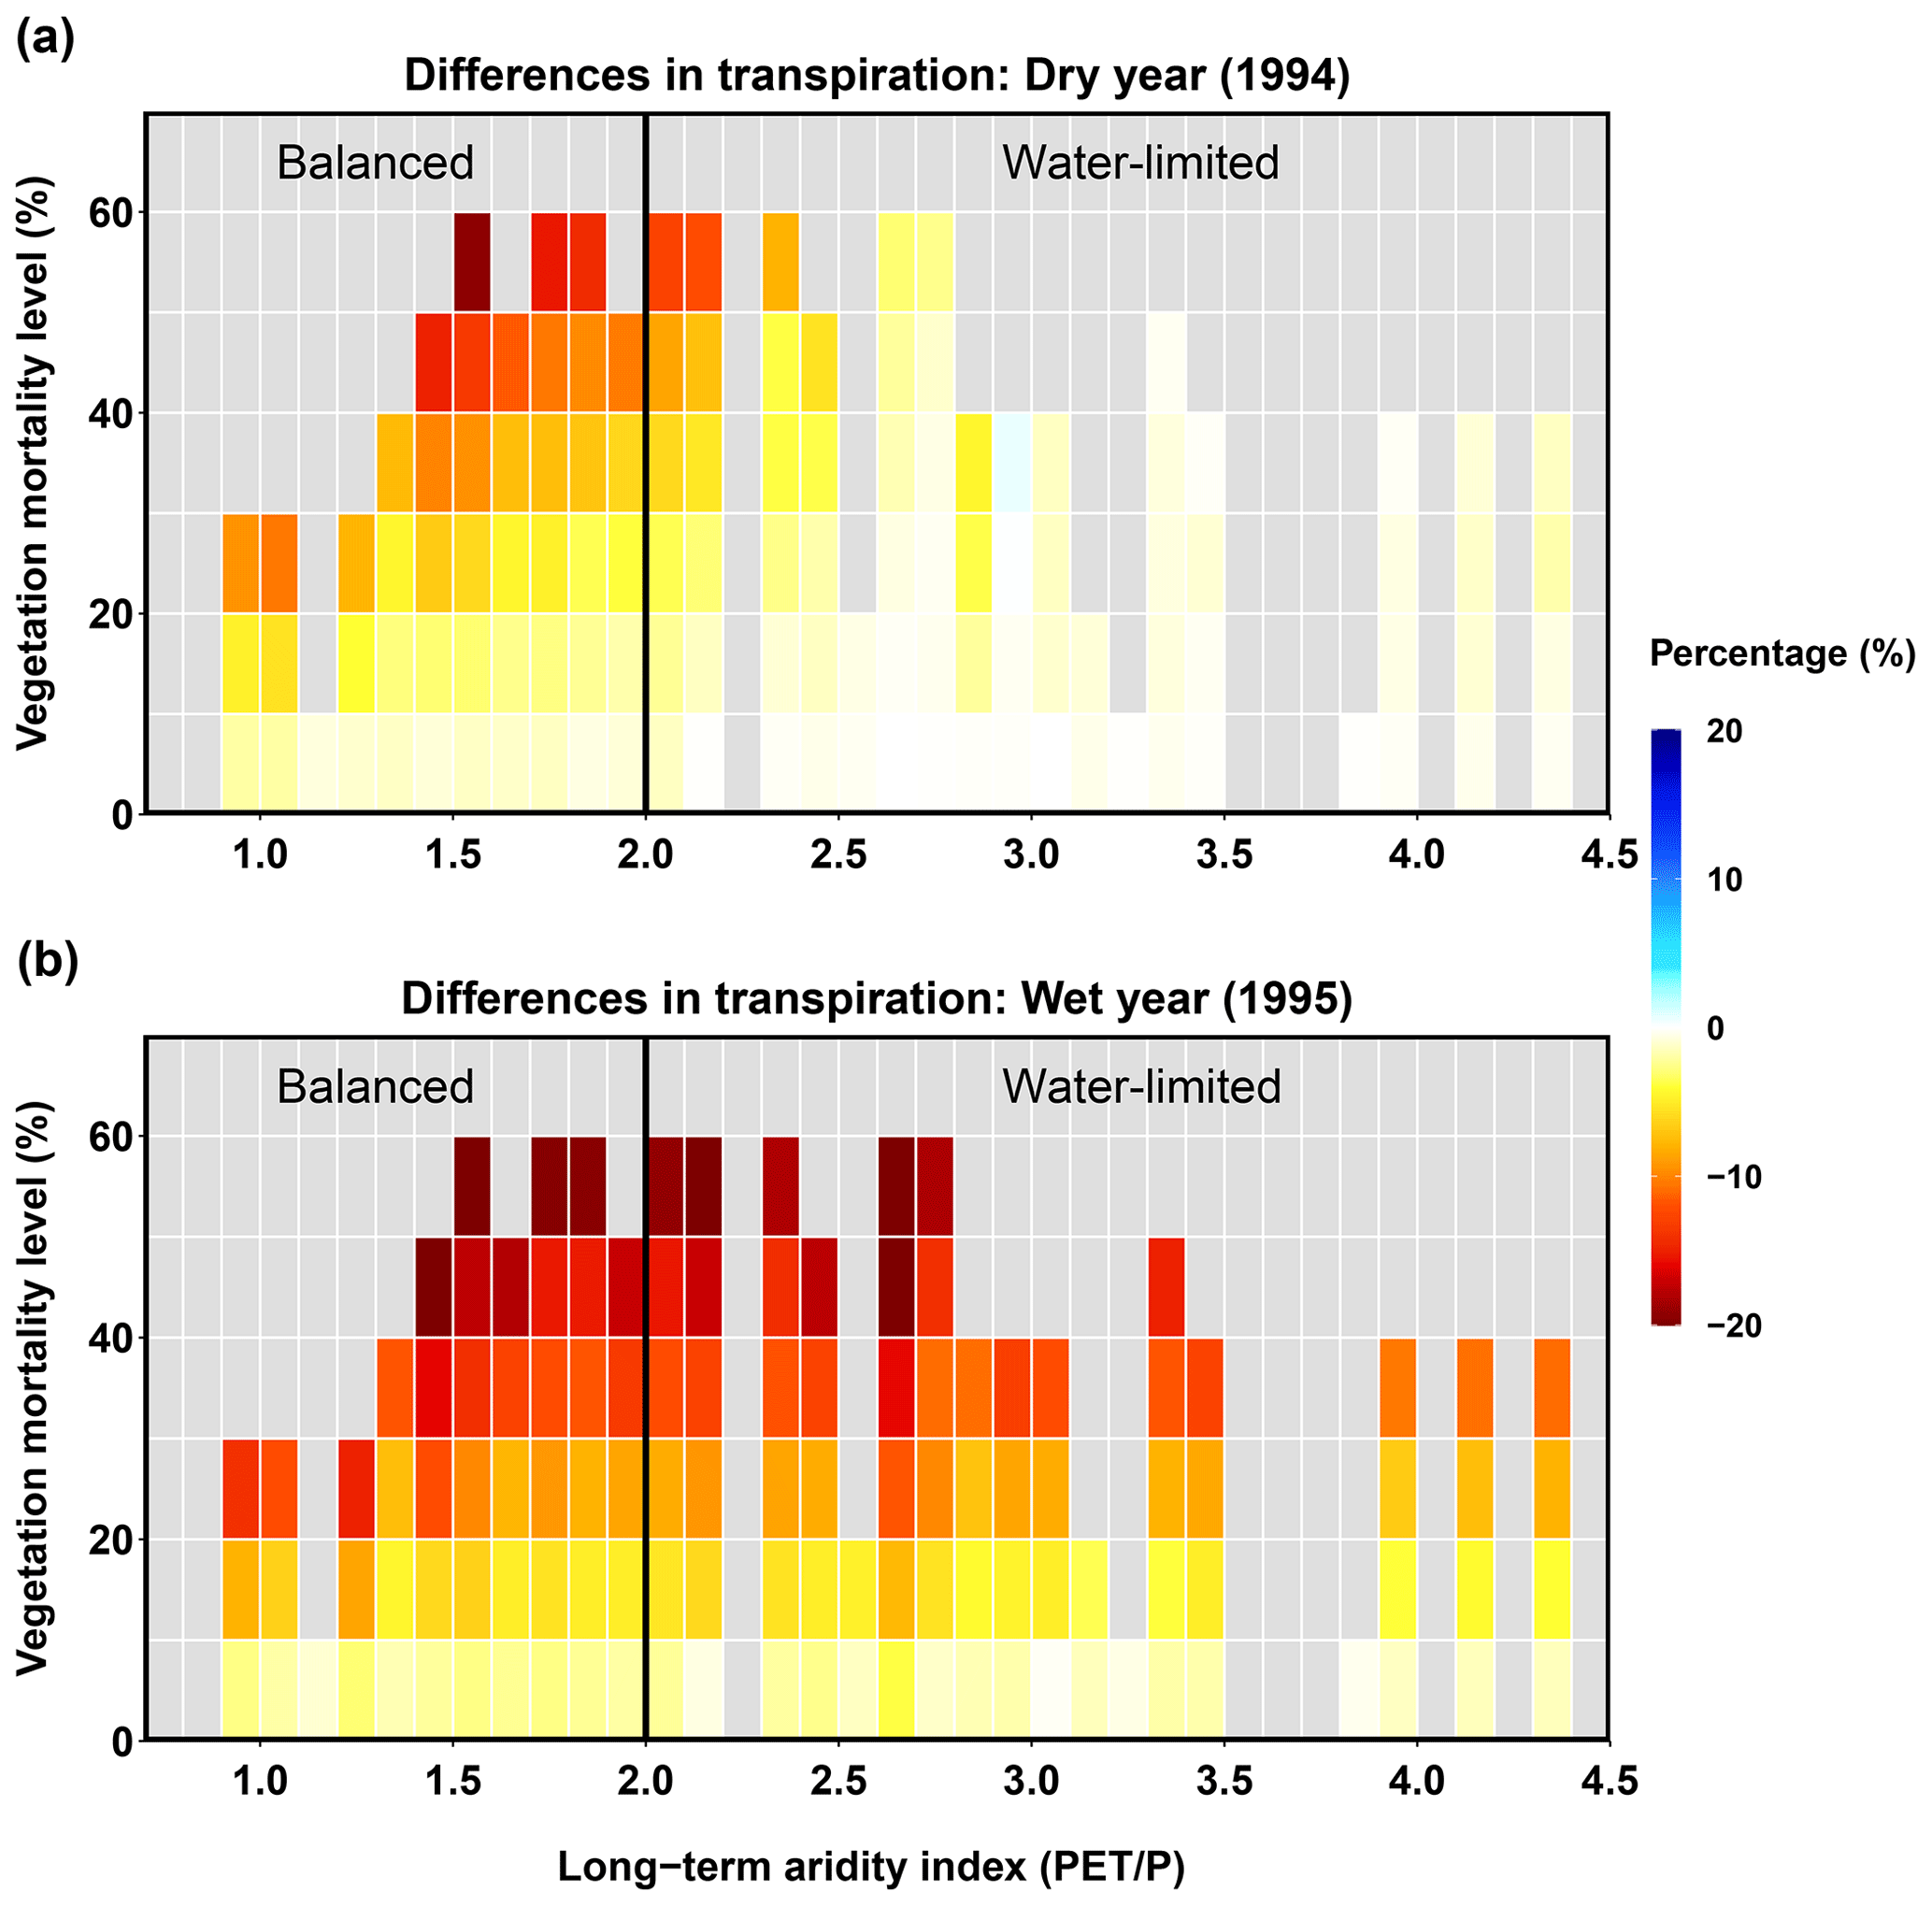
Figure 8Relationships between long-term aridity, vegetation mortality, and difference in transpiration for a dry year (1994, a) and a wet year (1995, b).
Total ET
In a dry year, the balanced and water-limited areas had opposite responses to mortality: the balanced area experienced a decrease in ET and the water-limited area experienced a slight increase (Fig. 9). In the balanced area, larger ET decreases occurred with higher mortality levels. However, increases in ET in water-limited regions were less sensitive to vegetation mortality level; even when mortality was high (>40 %), ET still increased (Fig. 9a). During the wet year, most sub-basins experienced decreasing ET after the beetle outbreak, and the magnitude was larger with higher vegetation mortality. The different responses of ET were driven by different hydrologic responses (transpiration, ground evaporation, and canopy evaporation) competing with each other; this competition was influenced by climate conditions, mortality level, and spatial heterogeneity in long-term aridity.
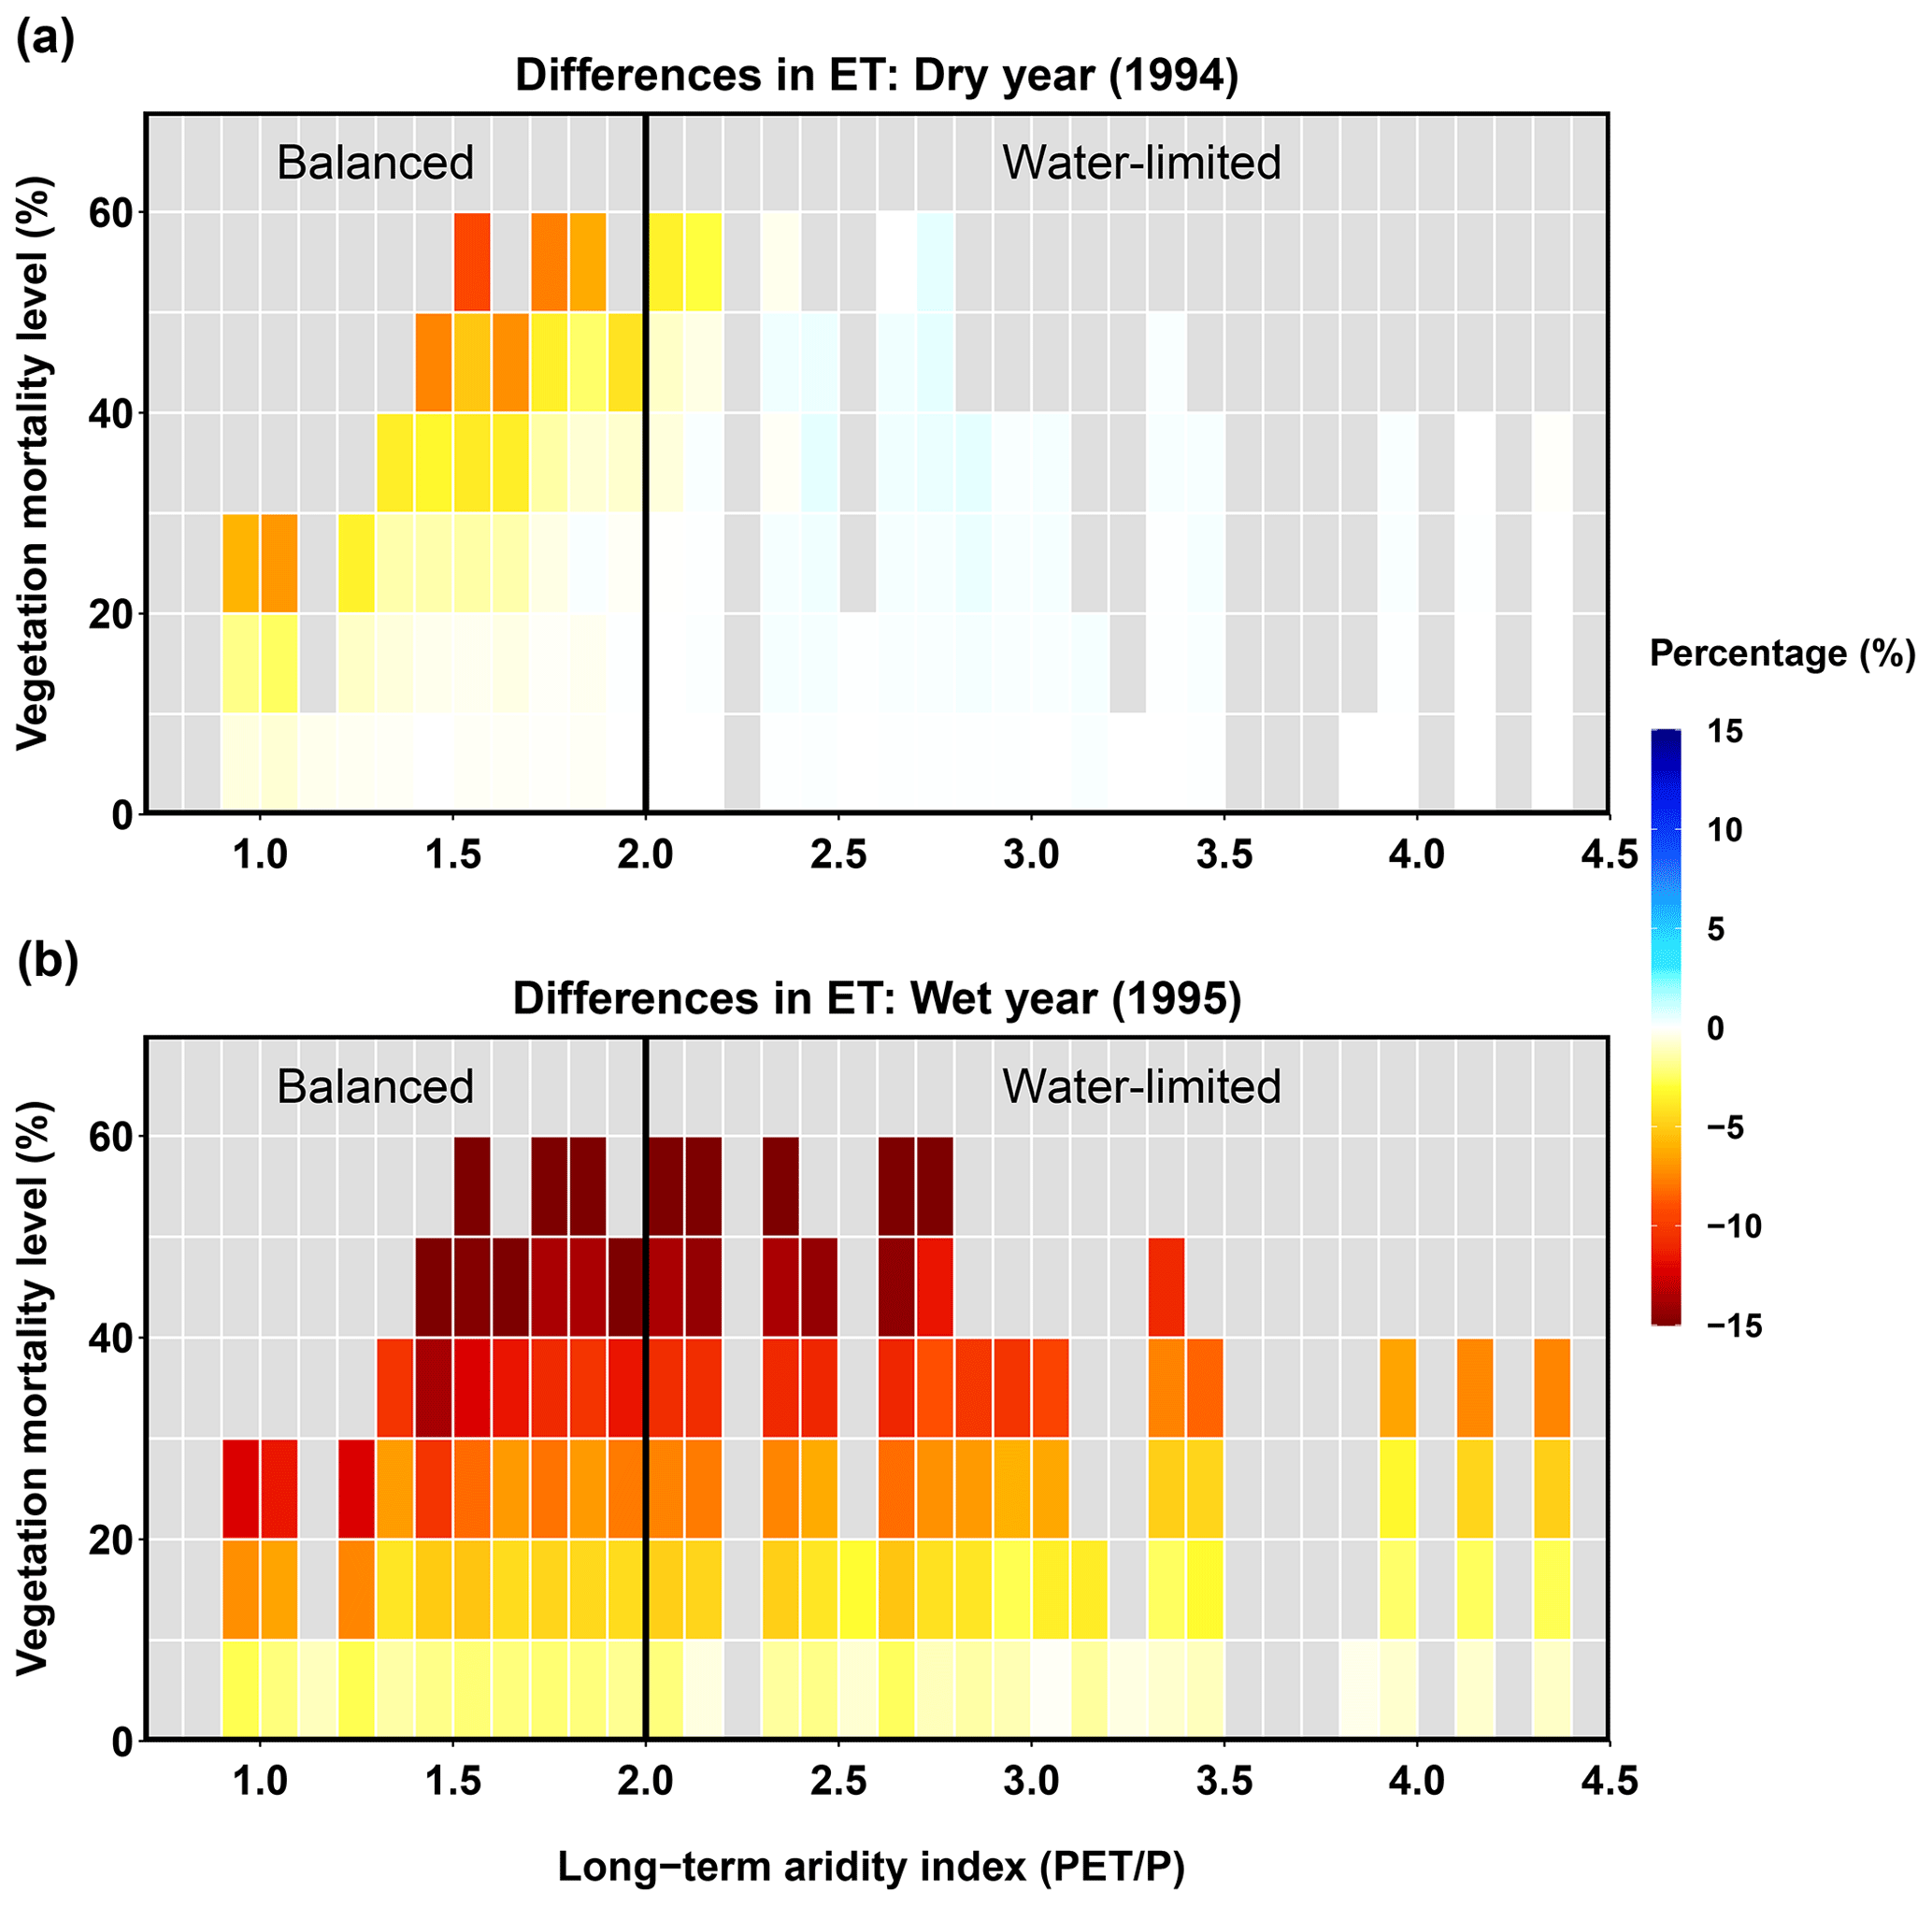
Figure 9Relationships between long-term aridity, vegetation mortality level, and difference in ET for a dry year (1994, a) and a wet year (1995, b).
Water yield
In the dry year (1994), beetle-caused vegetation mortality affected water yield (Fig. 10), but the responses differed between the balanced and water-limited areas. For the balanced area, most sub-basins showed slight decreases in water yield after the beetle outbreak (Fig. 10a). The water yield in sub-basins with low vegetation mortality levels (≤40 %) did not change significantly; however, with increased mortality, more sub-basins showed increases in water yield, particularly the sub-basins with vegetation mortality levels higher than 40 % (Fig. 10a). Moreover, the vegetation mortality threshold that changed the direction of water yield response was affected by long-term aridity, e.g., it was 40 % for an aridity of 2.0 but 20 % for an aridity of 1.0. For the water-limited area, the water yield decreased and was independent of the mortality level (Fig. 10a). In the wet year (1995), the water yield in most sub-basins increased after the beetle outbreak, and the water yield in the balanced area increased more significantly than that in the water-limited area. Furthermore, in the balanced area, higher mortality levels caused larger increases in water yield, which responded more linearly (Fig. 10b). In summary, for a wet year, increases in water yield occurred for most sub-basins, driven by a decrease in ET. However, during dry years, the water yield and ET responses were spatially heterogeneous, and the competing changes in evaporation and transpiration changed the direction and magnitude of ET and thus the water yield response. The competing effects of different hydrologic fluxes for a dry year are explored in more detail in the next section.
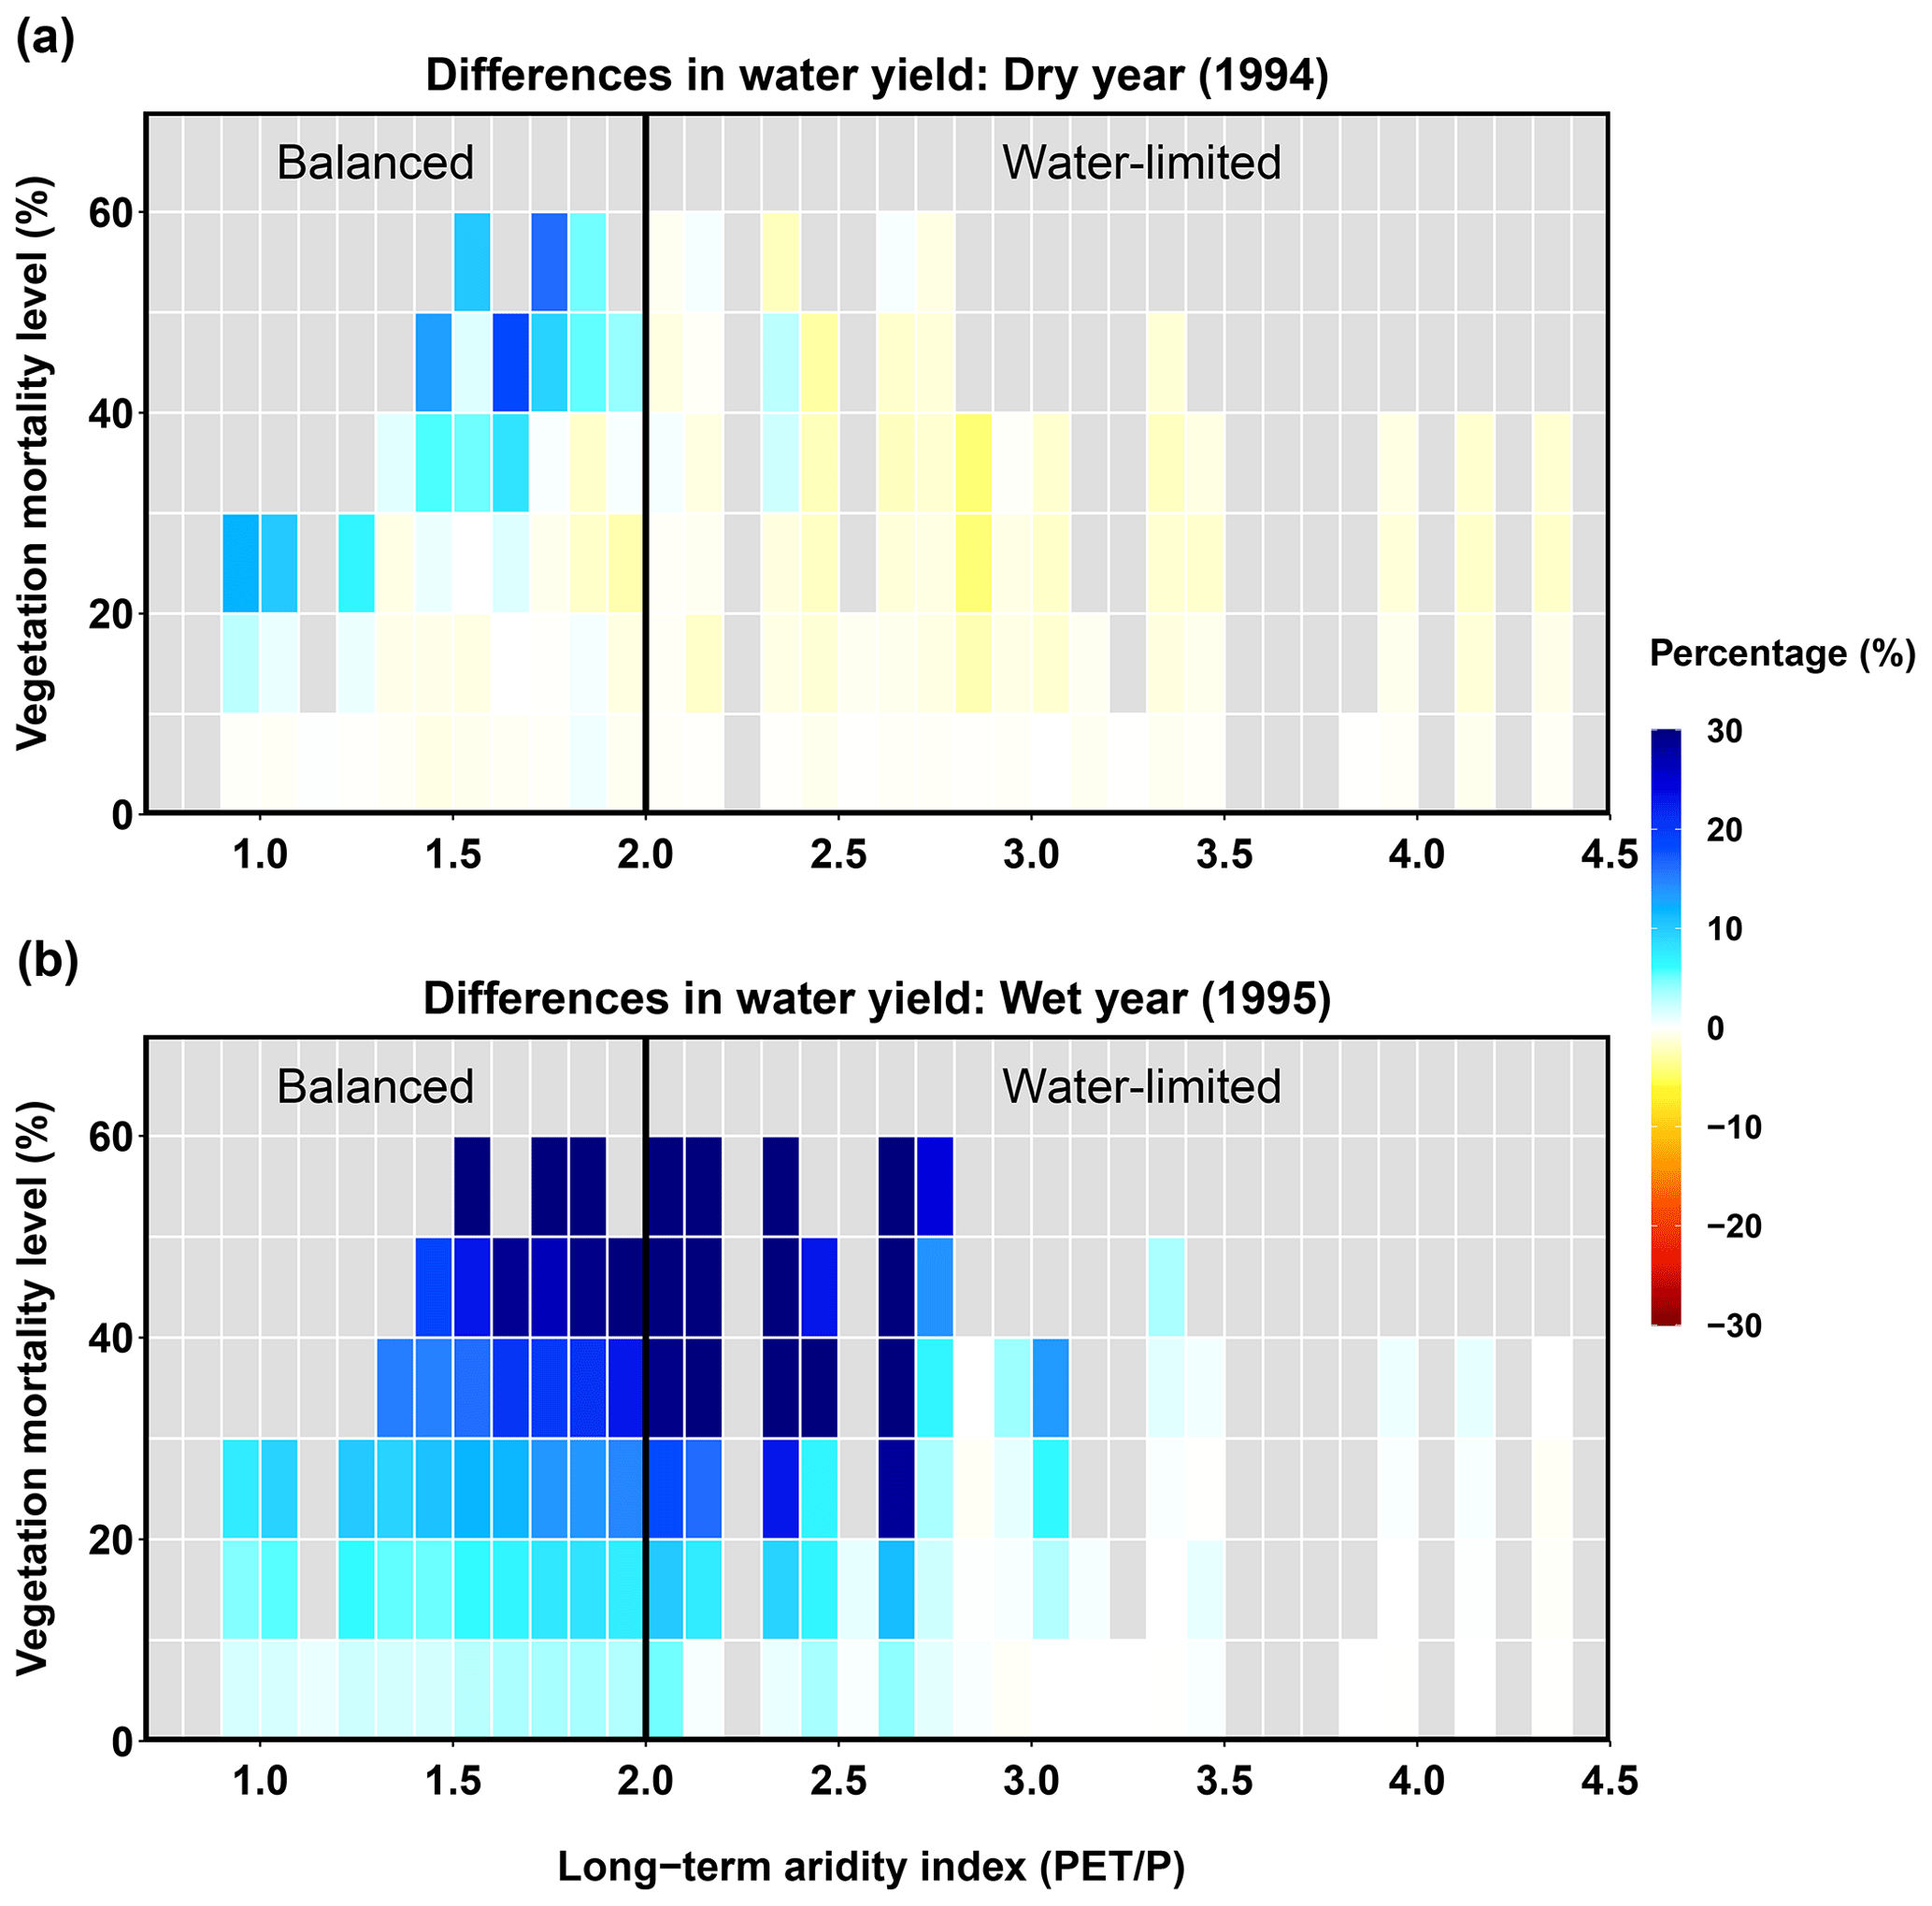
Figure 10Relationships between long-term aridity, vegetation mortality level, and difference in water yield for a dry year (1994, a) and a wet year (1995, b).
4.2.2 Analysis of water budgets to understand the decreasing water yield in the dry year
We analyzed the fluxes in a dry year (1994) in greater detail to understand the responses of the hydrologic fluxes and the resulting water yield. Based on Eq. (2), we identified four hydrologic fluxes that can potentially affect the water yield: canopy evaporation (canopy evaporation and canopy snow sublimation), ground evaporation (bare soil evaporation, ground snow sublimation, litter evaporation, pond evaporation), plant transpiration, and year-to-year storage change (soil, canopy, litter, snowpack). These three storage terms (canopy, litter, snowpack) were considered together with soil storage because their contribution was minor in comparison with other fluxes. Figure 11 summarizes different combinations of the four dominant processes during the dry year (1994) based on their directions (increase or decrease in water yield) after the beetle outbreak. In total, 14 combinations of changes in these fluxes (referred to as “response types”) were found. Five of those resulted in an increase in water yield; the others resulted in a decrease.
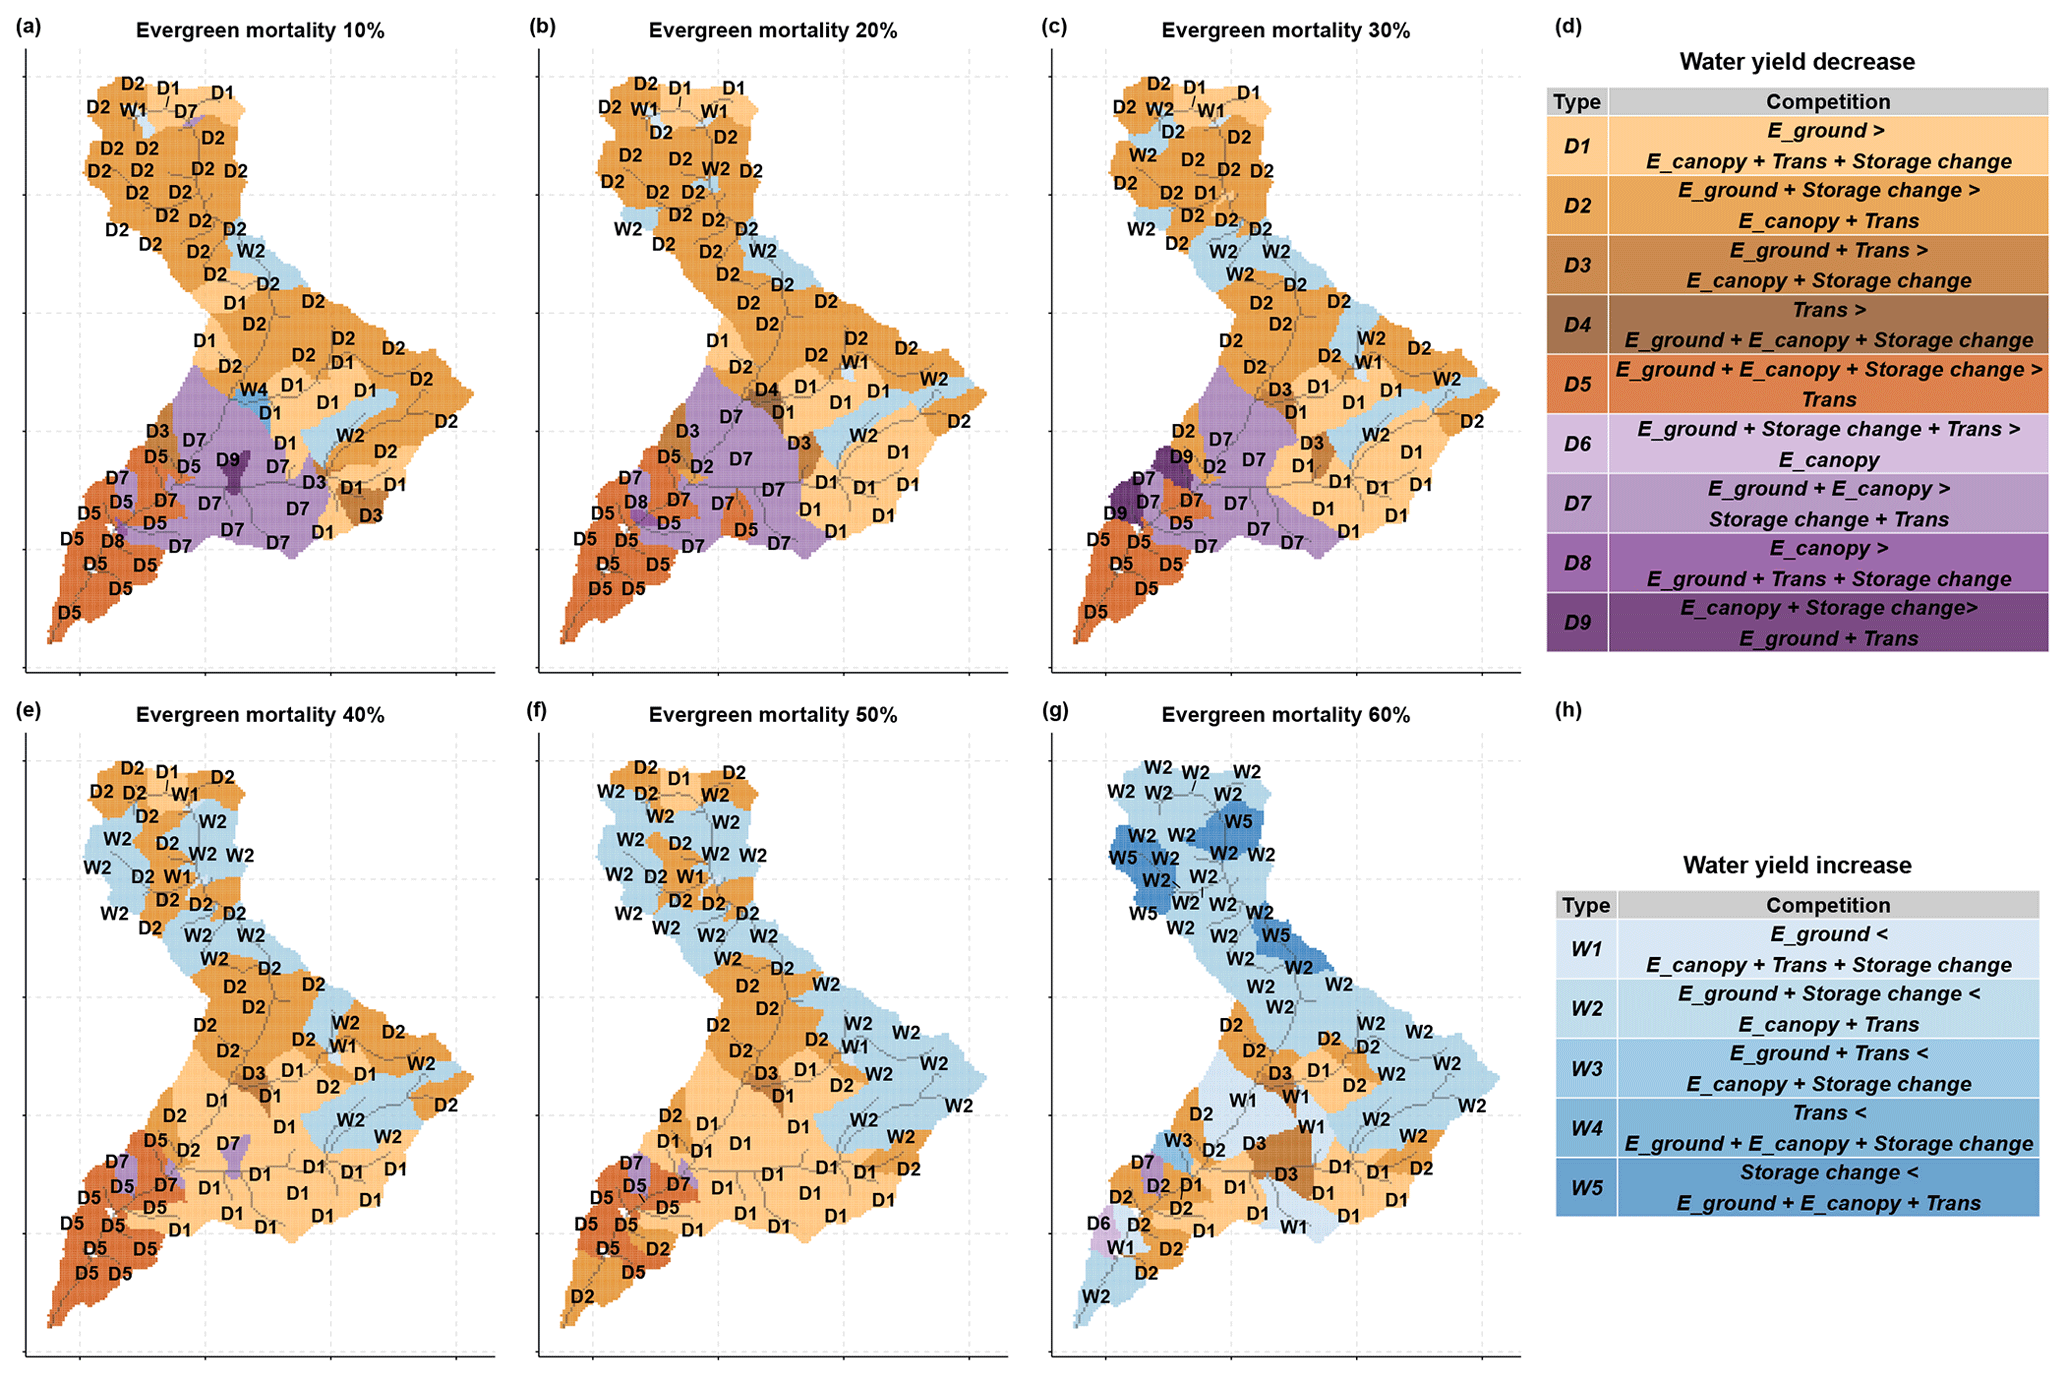
Figure 11Water yield response types after the beetle outbreak for different evergreen mortality scenarios compared with the control scenario. D1–D9 are water yield decrease types and W1–W5 are water yield increase types. In panels (d) and (h), the left side of each type are increasing fluxes that cause water yield decreases, and the right side of each type are decreasing fluxes that cause water yield increases. If the left side is larger than the right side, the water yield increases, and vice versa. (Note: this mortality is evergreen mortality, which is different from vegetation mortality.)
Water yield responses caused by competition between hydrologic fluxes showed different patterns across the aridity gradient (Figs. 3 and 10). For the balanced area (upper part of the basin) with low evergreen mortality (≤30 %), the major response types were D1 and D2, in which the increase in ground evaporation dominated over the decreases in transpiration and canopy evaporation (Fig. 11a–c). However, with higher evergreen mortality (>30 %), the major response type became W2, where the increase in ground evaporation did not exceed the decrease in canopy evaporation and transpiration (Fig. 11e–g). This indicates that, in a dry year, when more evergreen stands are killed, the increase in ground evaporation reaches a limit while transpiration and canopy evaporation continue to decrease with decreasing LAI. The increase in ground evaporation was triggered either by decreased total LAI and open canopy, which allowed more solar radiation to penetrate to the ground for evaporation (Fig. S5c), or by less transpiration from plants, which left more water available to evaporate (Fig. 8a). The decreases in plant transpiration and canopy evaporation were driven by a lower live LAI and a lower total LAI, respectively (Figs. S5a, c and 8a).
The decrease in water yield in the water-limited area (i.e., the lower part of the basin) was driven by differences in how competing hydrologic responses interacted at different mortality levels. When evergreen stand mortality level was low (30 %), the response types were D5 and D7, in which the increase in ground and canopy evaporation dominated over the decrease in transpiration (Fig. 11a–c). However, with high evergreen stand mortality (>30 %), the response types became D1 and D2 (Fig. 11e–g), in which the canopy evaporation changed from an increase to a decrease that was driven by a decrease in the total LAI (Fig. S5c). When mortality was low, the increased growth of residual plants and the understory outstripped the litter fall of dead foliage, thus increasing the total LAI, and vice versa when mortality was high.
5.1 Role of interannual climate variability
During the first 15 years after a beetle attack, various hydrologic processes oppose and/or reinforce one another to either increase or decrease the water yield: a decrease in live LAI can reduce transpiration, while a decrease in total LAI can enhance ground evaporation but diminish canopy evaporation (Montesi et al., 2004; Tsamir et al., 2019). Interannual climate variability plays an important role in determining which of these competing effects dominate, and therefore drives the direction of water yield response to beetle outbreak (Goeking and Tarboton, 2020; Winkler et al., 2014). Our results show that mainly decreases in water yield occurred in dry years, while the water yield increased in wet years. During a wet year, we found that plant ET reached its potential, so reductions in actual plant ET dominated over increases in ground evaporation, resulting in a net increase in water yield. During a dry year, the relative dominance of these competing effects had greater spatial heterogeneity because the water stress status of the plants varied across the basin (as explained in Sect. 4.2.2; Fig. 11).
However, the responses we observed in the dry year (1994) and in the wet year (1995) were also affected by the previous year's climate (mainly precipitation) and its effects on hydrologic and biogeochemical processes, which set the initial conditions for the dry and wet years (e.g., soil moisture and nitrogen availability). Therefore, we also analyzed other water years during the first 10 years after the beetle outbreak to examine whether our findings for dry and wet years followed a general pattern and to what extent they were influenced by antecedent conditions. Results indicate that our findings are robust throughout the study time period. For example, water yield generally decreased during dry years (1992, 1994, and 2001, see Figs. S1 and S2) and always increased during wet years (1993 and 1995–2000, see Figs. S1 and S2).
Adams et al. (2012) provide a threshold of precipitation under which the water yield increases after disturbances: at least 500 mm yr−1. The average annual precipitation over this study basin was 600–900 mm in dry years and higher than 900 mm in wet years. Recent field observations also suggest that annual climate variability can affect the magnitudes of evapotranspiration fluxes, which have the potential to change the water yield direction (Biederman et al., 2014). Our results corroborate those earlier studies by revealing that there are precipitation thresholds above which tree removal increases water yield (Figs. 10, S1, and S2).
5.2 Role of vegetation mortality
Vegetation mortality is another important factor that influences water yield response. We found that during the wet year, beetle outbreak increased water yield across the basin, and the magnitude of these increases grew linearly with the level of vegetation mortality (Fig. 10b). In the dry year, however, the response of water yield to the level of vegetation mortality was more complicated because mortality level influenced not only the magnitude of change but also the direction (Fig. 10a). These opposing results (due to mortality level) mainly occurred in the balanced northern part of the basin, where the competing effects of mortality (i.e., increases in ground evaporation versus decreases in transpiration) were more balanced (Fig. 11). The level of vegetation mortality played a less significant role in water yield changes in the southern water-limited area. Vegetation mortality level determined the magnitudes of the live LAI, total LAI, transpiration, canopy evaporation, and ground evaporation in such a way that it governed the directions of change in both ET and water yield. Thus, when the vegetation mortality level was higher than 40 %, its capacity to reduce transpiration became the dominant effect, whereas its capacity to increase soil evaporation became a minor effect (Fig. 11f and g; Guardiola-Claramonte et al., 2011).
Besides the precipitation threshold of at least 500 mm yr−1, Adams et al. (2012) also estimate that when at least 20 % of the vegetation cover is removed, the water yield can increase. According to our previous analysis (Sect. 4.1), for a dry year, water yield increases when more than 40 % of the vegetation is removed (Fig. 10a). Our model simulations indicate that there are similar mortality thresholds that drive water yield increases during the dry year, but we did not find evidence of such a threshold during wet years. These differences between dry and wet years suggest that the effects of mortality on water yield depend on climate variability. Similarly, other studies demonstrate that the relationship between mortality level and water yield response is complicated and nonlinear (Moore and Wondzell, 2005).
5.3 Role of the long-term aridity index (PET/P)
Long-term aridity indices can be used to predict where the water yield will decrease after a disturbance. We found that water yield always increased in a wet year, irrespective of the climatic aridity index (Fig. 10a). For dry years, the long-term aridity index was important in driving the direction of water yield responses to a beetle outbreak. In areas that were less water limited (balanced areas), the direction of water yield responses to a beetle outbreak in a dry year was mixed and depended on mortality level. For water-limited areas, in a dry year, water yield showed a more consistent decrease and was also less affected by mortality level. These results agree with previous studies which found that water yield decreases largely happen in semi-arid areas (Biederman et al., 2014; Guardiola-Claramonte et al., 2011).
The decrease in water yield for a water-limited area can be driven by increases in canopy evaporation and transpiration, in contrast to a hydrologically balanced area, where it was driven by increased ground evaporation. In the water-limited area, the increase in canopy evaporation was due to an increase in total LAI, which is a combined effect of delayed decay of dead foliage and fast growth of residual and understory plants (Fig. 11d, types D5, D7, D8, and D9; Fig. S5). The surviving and understory plants in the water-limited area also had higher transpiration rates after mortality (Fig. 11d, type D6; Fig. 8). Similarly, in field studies, Tsamir et al. (2019) found that photosynthesis and transpiration increased after thinning in a semi-arid forest. These findings illustrate that, in addition to top-down climate variability, the long-term aridity index (which also varies with bottom-up drivers such as vegetation and local topography) can be a useful indicator of how water yield will respond to disturbances.
In addition to evaporation and transpiration, snow sublimation can also influence the direction of hydrologic response. Similar to other process-based snow models, we found that once dead foliage fell to the ground, canopy sublimation decreased (e.g., Koeniger et al., 2008; Sexstone et al., 2018), which in turn increased the water yield relative to the period when dead needles remained on the trees (Figs. 5 and S7). In water-limited regions, the decrease in canopy sublimation was much smaller than in the balanced regions because there were smaller changes in total LAI (Fig. S5c and d). However, immediately after beetle outbreak (e.g., 1990–1992), we found that canopy sublimation increased in both regions due to an increase in total LAI (Fig. S7). This finding is supported by observational studies showing that canopy sublimation can increase with increasing leaf area (Koeniger et al., 2008).
We also found that ground/snowpack sublimation decreased when all dead foliage fell to the ground because snowmelt increased with the opening of the canopy. However, this finding differs from that of other studies suggesting that snowpack sublimation can increase with a more open canopy (Biederman et al., 2014; Harpold et al., 2014). The latter can occur because open canopies may allow more snow to reach the ground, which can increase sublimation. However, in our study, faster snowmelt appeared to dominate over increases in ground sublimation. These contrasts between our research and previous studies illustrate a sophisticated balance between canopy–atmosphere–environmental processes that must be accounted for when studying the sublimation response to disturbances (Edburg et al., 2012; Frank et al., 2019). Although RHESSys is a powerful tool for representing these complex interactions, some process representations warrant further analysis. For example, RHESSys currently ignores the effects of litter on ground albedo and snowmelt (Lundquist et al., 2013), which could affect actual ET and PET rates and therefore the long-term aridity index.
5.4 Uncertainties and recommendations for future research
We found the long-term (38 year) aridity index for our study region to be a key driver influencing hydrologic responses to beetle outbreaks. While this trend is likely to continue in the future as climate change intensifies aridity in the western US (Livneh and Badger, 2020), the classification of water-limited/balanced regions based on the 38 year aridity index may change. Thus, projecting how responses will change under future aridity scenarios requires further modeling research. We used historical 38 year (1980–2018) data to calculate the aridity index (PET/P). This method can be extended to project future responses to beetle outbreaks by using future climate data from generalized circulation models (GCMs) to drive the process-based ecohydrologic beetle effects model. Another consideration, however, is that as aridity continues to increase, vegetation may shift from evergreen to more drought-tolerant shrub or grass species. This would in turn alter beetle outbreak patterns and the corresponding water yield responses (Abatzoglou and Kolden, 2011; Bart et al., 2016). However, this process is not well understood and is not currently represented in our modeling framework. A key uncertainty in predicting future beetle effects is how vegetation will respond to climate change.
Another key uncertainty is how beetle attacks will change in the future. We used uniform mortality levels for all patches across the watershed and focused our analyses on potential beetle effects. However, in reality, beetles usually attack older trees first (Edburg et al., 2011). Thus, incorporating a more mechanistic understanding of beetle attack patterns with our beetle effects model could enable us to simulate more realistic outbreak scenarios moving forward. We also focused on water yield responses during the first 15 years after a beetle outbreak in a watershed that contained balanced or water-limited sub-basins. Future research should analyze long-term effects (e.g., after the ecosystem begins to recover) on forest hydrology and investigate wetter, energy-limited regions.
We tested a coupled ecohydrologic and beetle effects model of a semi-arid basin in southern Idaho to examine how the watershed hydrology responds to a beetle outbreak and how interannual climatic variability, vegetation mortality, and long-term aridity influence these responses. Simulation results indicate that each factor can play a discrete role in driving hydrologic processes (e.g., the directions and magnitudes of changes in plant transpiration, canopy and soil evaporation, soil and litter moisture, and snow sublimation). These combined effects determine the overall water budget and water yield of the basin. While interannual climate variability is the key factor driving the direction of change in water yield, vegetation mortality levels and long-term aridity modify water yield responses.
In dry years, the water yields of most sub-basins slightly decreased after the beetle outbreak when vegetation mortality was lower than 40 %, while they increased during wet years in most sub-basins. Our results show that long-term aridity index is a reliable indicator of the water yield decreases that occur during dry years due to the fact that there is a consistent decrease in water yield in the most water-limited portion of the basin. Generally, the effect of vegetation mortality on water yield during dry years is less uniform and depends on local aridity. During wet years, on the other hand, mortality typically causes increases in water yield. This illustrates that, together, interannual climate variability and mortality can have a stronger effect on the direction of water yield response in water-limited regions than interannual climate variability alone. Future studies to predict water yield response to disturbance should consider the interactions of these factors and capture the fluctuations of competing water fluxes and storage changes that control the overall water budget and water yield.
Using our novel RHESSys–beetle effects modeling framework, we have demonstrated that the direction of hydrologic response is a function of multiple factors (e.g., interannual climate variability, vegetation mortality level, and long-term aridity) and that these results do not necessarily conflict with each other but are representative of different conditions. The mechanisms behind these changes compete with each other, resulting in water yield increases or decreases (Fig. 1). Contradictory findings in previous studies may result from differing mortality levels or differences in aridity because the emergent drivers that dominate water yield responses differ. Disentangling these drivers is difficult or impossible using a purely empirical approach, where it can be challenging or cost prohibitive to experiment under a broad range of controlled conditions. Distributed process-based models, on the other hand, provide a useful tool for examining these dynamics.
This study can assist water supply stakeholders in risk management in beetle outbreak locations. For example, during wet years, more attention might be focused on balanced areas, i.e., wet regions, regarding flooding and erosion risks after beetle outbreaks, since these regions may experience large increases in runoff due to decreases in plant transpiration and increases in soil moisture. During dry years, attention might need to shift to water-limited areas for managing wildfire risk, since these regions will experience elevated ET and lower soil and litter moisture. Because multiple factors interact to influence hydrologic processes after a beetle outbreak, water and forest management must respond to spatial and temporal variations in climate, aridity, and vegetation mortality levels.
The coupled RHESSys model code is available online at: https://doi.org/10.17605/OSF.IO/NE4QU (Ren et al., 2021a).
The data used in this study are available at: https://doi.org/10.5281/zenodo.5156688 (Ren et al., 2021b).
The supplement related to this article is available online at: https://doi.org/10.5194/hess-25-4681-2021-supplement.
JR, JA, and JAH conceived the study. JR designed the study with support from JA, JAH, and EH. JR and EH developed RHESSys code for coupling with the beetle effects model and parallelizing model runs with help from JA, JAH, CLT, ML, CK, and JTA. JR performed model simulations and developed figures with help from all authors. ML and JTA generated downscaled meteorological data. JR wrote the manuscript with input from all authors.
The authors declare that they have no conflict of interest.
Publisher's note: Copernicus Publications remains neutral with regard to jurisdictional claims in published maps and institutional affiliations.
This article is part of the special issue “Data acquisition and modelling of hydrological, hydrogeological and ecohydrological processes in arid and semi-arid regions”. It is not associated with a conference.
The authors thank Insa Neuweiler, Pamela Nagler and one anonymous reviewer for their insightful comments that improved the manuscript. William Burke and Tung Nguyen provided helpful support for setting up the RHESSys model. We thank Jan Boll and Nicholas Engdahl for providing valuable suggestions on the earlier manuscript.
This research has been supported by the National Science Foundation of the United States under award numbers DMS-1520873 and DEB-1916658.
This paper was edited by Insa Neuweiler and reviewed by Pamela Nagler and one anonymous referee.
Abatzoglou, J. T.: Development of gridded surface meteorological data for ecological applications and modelling, Int. J. Climatol., 33, 121–131, https://doi.org/10.1002/joc.3413, 2013.
Abatzoglou, J. T. and Kolden, C. A.: Relationships between climate and macroscale area burned in the western United States, Int. J. Wildland Fire, 22, 1003, https://doi.org/10.1071/WF13019, 2013.
Ackerly, D. D.: Adaptation, niche conservatism, and convergence: comparative studies of leaf evolution in the California chaparral, Am. Nat., 163, 654–671, https://doi.org/10.1086/383062, 2004.
Adams, H. D., Luce, C. H., Breshears, D. D., Allen, C. D., Weiler, M., Hale, V. C., Smith, A. M. S., and Huxman, T. E.: Ecohydrological consequences of drought- and infestation-triggered tree die-off: insights and hypotheses, Ecohydrology, 5, 145–159, https://doi.org/10.1002/eco.233, 2012.
Anderegg, W. R. L., Kane, J. M., and Anderegg, L. D. L.: Consequences of widespread tree mortality triggered by drought and temperature stress, Nat. Clim. Change, 3, 30–36, https://doi.org/10.1038/nclimate1635, 2013.
Bart, R. R., Tague, C. L., and Moritz, M. A.: Effect of Tree-to-Shrub Type Conversion in Lower Montane Forests of the Sierra Nevada (USA) on Streamflow, PLOS One, 11, e0161805, https://doi.org/10.1371/journal.pone.0161805, 2016.
Bennett, K. E., Bohn, T. J., Solander, K., McDowell, N. G., Xu, C., Vivoni, E., and Middleton, R. S.: Climate-driven disturbances in the San Juan River sub-basin of the Colorado River, Hydrol. Earth Syst. Sci., 22, 709–725, https://doi.org/10.5194/hess-22-709-2018, 2018.
Bentz, B. J., Régnière, J., Fettig, C. J., Hansen, E. M., Hayes, J. L., Hicke, J. A., Kelsey, R. G., Negrón, J. F., and Seybold, S. J.: Climate Change and Bark Beetles of the Western United States and Canada: Direct and Indirect Effects, BioScience, 60, 602–613, https://doi.org/10.1525/bio.2010.60.8.6, 2010.
Berner, L. T. and Law, B. E.: Plant traits, productivity, biomass and soil properties from forest sites in the Pacific Northwest, 1999–2014, Sci. Data, 3, 1–14, https://doi.org/10.1038/sdata.2016.2, 2016.
Berner, L. T., Law, B. E., Meddens, A. J. H., and Hicke, J. A.: Tree mortality from fires, bark beetles, and timber harvest during a hot and dry decade in the western United States (2003–2012), Environ. Res. Lett., 12, 065005, https://doi.org/10.1088/1748-9326/aa6f94, 2017.
Bethlahmy, N.: More streamflow after a bark beetle epidemic, J. Hydrol., 23, 185–189, https://doi.org/10.1016/0022-1694(74)90001-8, 1974.
Biederman, J. A., Harpold, A. A., Gochis, D. J., Ewers, B. E., Reed, D. E., Papuga, S. A., and Brooks, P. D.: Increased evaporation following widespread tree mortality limits streamflow response, Water Resour. Res., 50, 5395–5409, https://doi.org/10.1002/2013WR014994, 2014.
Buhidar, B.: The big wood river watershed management plan, Twin Falls Regional Office, Twin Falls, Idaho, 2002.
Buma, B. and Livneh, B.: Key landscape and biotic indicators of watersheds sensitivity to forest disturbance identified using remote sensing and historical hydrography data, Environ. Res. Lett., 12, 074028, https://doi.org/10.1088/1748-9326/aa7091, 2017.
Chaney, N. W., Wood, E. F., McBratney, A. B., Hempel, J. W., Nauman, T. W., Brungard, C. W., and Odgers, N. P.: POLARIS: A 30-meter probabilistic soil series map of the contiguous United States, Geoderma, 274, 54–67, https://doi.org/10.1016/j.geoderma.2016.03.025, 2016.
Chen, F., Zhang, G., Barlage, M., Zhang, Y., Hicke, J. A., Meddens, A., Zhou, G., Massman, W. J., and Frank, J.: An Observational and Modeling Study of Impacts of Bark Beetle – Caused Tree Mortality on Surface Energy and Hydrological Cycles, J. Hydrometeorol., 16, 744–761, https://doi.org/10.1175/JHM-D-14-0059.1, 2014.
Daly, C., Neilson, R. P., and Phillips, D. L.: A Statistical-Topographic Model for Mapping Climatological Precipitation over Mountainous Terrain, J. Appl. Meteorol., 33, 140–158, https://doi.org/10.1175/1520-0450(1994)033<0140:ASTMFM>2.0.CO;2, 1994.
Dickinson, R. E., Shaikh, M., Bryant, R., and Graumlich, L.: Interactive Canopies for a Climate Model, J. Climate, 11, 2823–2836, https://doi.org/10.1175/1520-0442(1998)011<2823:ICFACM>2.0.CO;2, 1998.
Edburg, S. L., Hicke, J. A., Lawrence, D. M., and Thornton, P. E.: Simulating coupled carbon and nitrogen dynamics following mountain pine beetle outbreaks in the western United States, J. Geophys. Res.-Biogeo., 116, G04033, https://doi.org/10.1029/2011JG001786, 2011.
Edburg, S. L., Hicke, J. A., Brooks, P. D., Pendall, E. G., Ewers, B. E., Norton, U., Gochis, D., Gutmann, E. D., and Meddens, A. J.: Cascading impacts of bark beetle-caused tree mortality on coupled biogeophysical and biogeochemical processes, Front. Ecol. Environ., 10, 416–424, https://doi.org/10.1890/110173, 2012.
Fan, Y., Clark, M., Lawrence, D. M., Swenson, S., Band, L. E., Brantley, S. L., Brooks, P. D., Dietrich, W. E., Flores, A., Grant, G., Kirchner, J. W., Mackay, D. S., McDonnell, J. J., Milly, P. C. D., Sullivan, P. L., Tague, C., Ajami, H., Chaney, N., Hartmann, A., Hazenberg, P., McNamara, J., Pelletier, J., Perket, J., Rouholahnejad-Freund, E., Wagener, T., Zeng, X., Beighley, E., Buzan, J., Huang, M., Livneh, B., Mohanty, B. P., Nijssen, B., Safeeq, M., Shen, C., van Verseveld, W., Volk, J., and Yamazaki, D.: Hillslope Hydrology in Global Change Research and Earth System Modeling, Water Resour. Res., 55, 1737–1772, https://doi.org/10.1029/2018WR023903, 2019.
Farquhar, G. D. and von Caemmerer, S.: Modelling of Photosynthetic Response to Environmental Conditions, in: Physiological Plant Ecology II: Water Relations and Carbon Assimilation, edited by: Lange, O. L., Nobel, P. S., Osmond, C. B., and Ziegler, H., Springer, Berlin, Heidelberg, 549–587, https://doi.org/10.1007/978-3-642-68150-9_17, 1982.
Frank, J. M., Massman, W. J., Ewers, B. E., and Williams, D. G.: Bayesian Analyses of 17 Winters of Water Vapor Fluxes Show Bark Beetles Reduce Sublimation, Water Resour. Res., 55, 1598–1623, https://doi.org/10.1029/2018WR023054, 2019.
Frenzel, S. A.: Water Resources of the upper Big Wood River basin, Idaho, US Geological Survey, Boise, Idaho, 1989.
Fyfe, J. C., Derksen, C., Mudryk, L., Flato, G. M., Santer, B. D., Swart, N. C., Molotch, N. P., Zhang, X., Wan, H., Arora, V. K., Scinocca, J., and Jiao, Y.: Large near-term projected snowpack loss over the western United States, Nat. Commun., 8, 14996, https://doi.org/10.1038/ncomms14996, 2017.
Garcia, E. S. and Tague, C. L.: Subsurface storage capacity influences climate–evapotranspiration interactions in three western United States catchments, Hydrol. Earth Syst. Sci., 19, 4845–4858, https://doi.org/10.5194/hess-19-4845-2015, 2015.
Goeking, S. A. and Tarboton, D. G.: Forests and Water Yield: A Synthesis of Disturbance Effects on Streamflow and Snowpack in Western Coniferous Forests, J. Forest., 118, 172–192, https://doi.org/10.1093/jofore/fvz069, 2020.
Guardiola-Claramonte, M., Troch, P. A., Breshears, D. D., Huxman, T. E., Switanek, M. B., Durcik, M., and Cobb, N. S.: Decreased streamflow in semi-arid basins following drought-induced tree die-off: A counter-intuitive and indirect climate impact on hydrology, J. Hydrol., 406, 225–233, https://doi.org/10.1016/j.jhydrol.2011.06.017, 2011.
Hanan, E. J., Schimel, J. P., Dowdy, K., and D'Antonio, C. M.: Effects of substrate supply, pH, and char on net nitrogen mineralization and nitrification along a wildfire-structured age gradient in chaparral, Soil Biol. Biochem., 95, 87–99, https://doi.org/10.1016/j.soilbio.2015.12.017, 2016.
Hanan, E. J., Tague, C. (Naomi), and Schimel, J. P.: Nitrogen cycling and export in California chaparral: the role of climate in shaping ecosystem responses to fire, Ecol. Monogr., 87, 76–90, https://doi.org/10.1002/ecm.1234, 2017.
Hanan, E. J., Tague, C., Choate, J., Liu, M., Kolden, C., and Adam, J.: Accounting for disturbance history in models: using remote sensing to constrain carbon and nitrogen pool spin-up, Ecol. Appl. Publ. Ecol. Soc. Am., 28, 1197–1214, https://doi.org/10.1002/eap.1718, 2018.
Hanan, E. J., Ren, J., Tague, C. L., Kolden, C. A., Abatzoglou, J. T., Bart, R. R., Kennedy, M. C., Liu, M., and Adam, J. C.: How climate change and fire exclusion drive wildfire regimes at actionable scales, Environ. Res. Lett., 16, 024051, https://doi.org/10.1088/1748-9326/abd78e, 2021.
Harpold, A. A., Biederman, J. A., Condon, K., Merino, M., Korgaonkar, Y., Nan, T., Sloat, L. L., Ross, M., and Brooks, P. D.: Changes in snow accumulation and ablation following the Las Conchas Forest Fire, New Mexico, USA: Changes In Snow Following Fire, Ecohydrology, 7, 440–452, https://doi.org/10.1002/eco.1363, 2014.
Hicke, J. A., Johnson, M. C., Hayes, J. L., and Preisler, H. K.: Effects of bark beetle-caused tree mortality on wildfire, Forest Ecol. Manage., 271, 81–90, https://doi.org/10.1016/j.foreco.2012.02.005, 2012.
Homer, C. G., Dewitz, J., Yang, L., Jin, S., Danielson, P., Xian, G. Z., Coulston, J., Herold, N., Wickham, J., and Megown, K.: Completion of the 2011 National Land Cover Database for the conterminous United States – Representing a decade of land cover change information, Photogram. Eng. Remote Sens., 81, 345354, https://doi.org/10.14358/PERS.81.5.345, 2015.
Hubbart, J. A.: Timber Harvest Impacts on Water Yield in the Continental/Maritime Hydroclimatic Region of the United States, Forest Sci., 53, 169–180, https://doi.org/10.1093/forestscience/53.2.169, 2007.
Koeniger, P., Hubbart, J., Link, T., and Marshall, J.: Isotopic Variation of Snowcover and Streamflow in Response to Changes in Canopy Structure in a Snow-Dominated Mountain Catchment, Hydrol. Process., 22, 557–566, https://doi.org/10.1002/hyp.6967, 2008.
Law, B. E., Sun, O. J., Campbell, J., Van Tuyl, S., and Thornton, P. E.: Changes in carbon storage and fluxes in a chronosequence of ponderosa pine, Global Change Biol., 9, 510–524, https://doi.org/10.1046/j.1365-2486.2003.00624.x, 2003.
Lawrence, D. M., Oleson, K. W., Flanner, M. G., Thornton, P. E., Swenson, S. C., Lawrence, P. J., Zeng, X., Yang, Z.-L., Levis, S., Sakaguchi, K., Bonan, G. B., and Slater, A. G.: Parameterization improvements and functional and structural advances in Version 4 of the Community Land Model, J. Adv. Model. Earth Syst., 3, M03001, https://doi.org/10.1029/2011MS00045, 2011.
Lin, L., Band, L. E., Vose, J. M., Hwang, T., Miniat, C. F., and Bolstad, P. V.: Ecosystem processes at the watershed scale: Influence of flowpath patterns of canopy ecophysiology on emergent catchment water and carbon cycling, Ecohydrology, 0, e2093, https://doi.org/10.1002/eco.2093, 2019.
Livneh, B. and Badger, A. M.: Drought less predictable under declining future snowpack, Nat. Clim. Change, 10, 452–458, https://doi.org/10.1038/s41558-020-0754-8, 2020.
Livneh, B., Deems, J. S., Buma, B., Barsugli, J. J., Schneider, D., Molotch, N. P., Wolter, K., and Wessman, C. A.: Catchment response to bark beetle outbreak and dust-on-snow in the Colorado Rocky Mountains, J. Hydrol., 523, 196–210, https://doi.org/10.1016/j.jhydrol.2015.01.039, 2015.
Lundquist, J. D., Dickerson-Lange, S. E., Lutz, J. A., and Cristea, N. C.: Lower forest density enhances snow retention in regions with warmer winters: A global framework developed from plot-scale observations and modeling, Water Resour. Res., 49, 6356–6370, https://doi.org/10.1002/wrcr.20504, 2013.
McVicar, T. R., Roderick, M. L., Donohue, R. J., Li, L. T., Van Niel, T. G., Thomas, A., Grieser, J., Jhajharia, D., Himri, Y., Mahowald, N. M., Mescherskaya, A. V., Kruger, A. C., Rehman, S., and Dinpashoh, Y.: Global review and synthesis of trends in observed terrestrial near-surface wind speeds: Implications for evaporation, J. Hydrol., 416–417, 182–205, https://doi.org/10.1016/j.jhydrol.2011.10.024, 2012.
Meddens, A. J. H., Hicke, J. A., and Ferguson, C. A.: Spatiotemporal patterns of observed bark beetle-caused tree mortality in British Columbia and the western United States, Ecol. Appl., 22, 1876–1891, https://doi.org/10.1890/11-1785.1, 2012.
Mikkelson, K. M., Maxwell, R. M., Ferguson, I., Stednick, J. D., McCray, J. E., and Sharp, J. O.: Mountain pine beetle infestation impacts: modeling water and energy budgets at the hill-slope scale, Ecohydrology, 6, 64–72, https://doi.org/10.1002/eco.278, 2013.
Mitchell, K. E., Lohmann, D., Houser, P. R., Wood, E. F., Schaake, J. C., Robock, A., Cosgrove, B. A., Sheffield, J., Duan, Q., Luo, L., Higgins, R. W., Pinker, R. T., Tarpley, J. D., Lettenmaier, D. P., Marshall, C. H., Entin, J. K., Pan, M., Shi, W., Koren, V., Meng, J., Ramsay, B. H., and Bailey, A. A.: The multi-institution North American Land Data Assimilation System (NLDAS): Utilizing multiple GCIP products and partners in a continental distributed hydrological modeling system, J. Geophys. Res.-Atmos., 109, D07S90, https://doi.org/10.1029/2003JD003823, 2004.
Molotch, N. P., Blanken, P. D., Williams, M. W., Turnipseed, A. A., Monson, R. K., and Margulis, S. A.: Estimating sublimation of intercepted and sub-canopy snow using eddy covariance systems, Hydrol. Process., 21, 1567–1575, https://doi.org/10.1002/hyp.6719, 2007.
Monteith, J. L.: Evaporation and environment, Symp. Soc. Exp. Biol., 19, 205–234, 1965.
Montesi, J., Elder, K., Schmidt, R. A., and Davis, R. E.: Sublimation of Intercepted Snow within a Subalpine Forest Canopy at Two Elevations, J. Hydrometeorol., 5, 763–773, https://doi.org/10.1175/1525-7541(2004)005<0763:SOISWA>2.0.CO;2, 2004.
Moore, R. D. and Wondzell, S. M.: Physical Hydrology And The Effects Of Forest Harvesting In The Pacific Northwest: A Review, J. Am. Water. Resour. Assoc., 41, 763–784, 2005.
Morillas, L., Pangle, R. E., Maurer, G. E., Pockman, W. T., McDowell, N., Huang, C.-W., Krofcheck, D. J., Fox, A. M., Sinsabaugh, R. L., Rahn, T. A., and Litvak, M. E.: Tree Mortality Decreases Water Availability and Ecosystem Resilience to Drought in Piñon-Juniper Woodlands in the Southwestern U.S., J. Geophys. Res.-Biogeo., 122, 3343–3361, https://doi.org/10.1002/2017JG004095, 2017.
Nagler, P. L., Nguyen, U., Bateman, H. L., Jarchow, C. J., Glenn, E. P., Waugh, W. J., and van Riper, C.: Northern tamarisk beetle (Diorhabda carinulata) and tamarisk (Tamarix spp.) interactions in the Colorado River basin: Northern tamarisk beetle and tamarisk interactions, Restor. Ecol., 26, 348–359, https://doi.org/10.1111/rec.12575, 2018.
Paine, T. D., Raffa, K. F., and Harrington, T. C.: Interactions Among Scolytid Bark Beetles, Their Associated Fungi, and Live Host Conifers, Annu. Rev. Entomol., 42, 179–206, https://doi.org/10.1146/annurev.ento.42.1.179, 1997.
Parton, W. J.: The CENTURY model, in: Evaluation of Soil Organic Matter Models, Springer, Berlin, Heidelberg, 283–291, 1996.
Penn, C. A., Bearup, L. A., Maxwell, R. M., and Clow, D. W.: Numerical experiments to explain multiscale hydrological responses to mountain pine beetle tree mortality in a headwater watershed, Water Resour. Res., 52, 3143–3161, https://doi.org/10.1002/2015WR018300, 2016.
Perry, T. D. and Jones, J. A.: Summer streamflow deficits from regenerating Douglas-fir forest in the Pacific Northwest, USA: Summer streamflow deficits from regenerating Douglas-fir forest, Ecohydrology, 10, e1790, https://doi.org/10.1002/eco.1790, 2017.
Pomeroy, J., Fang, X., and Ellis, C.: Sensitivity of snowmelt hydrology in Marmot Creek, Alberta, to forest cover disturbance: Sensitivity Of Snowmelt Hydrology To Forest Disturbance, Hydrol. Process., 26, 1891–1904, https://doi.org/10.1002/hyp.9248, 2012.
Potts, D. F.: Hydrologic Impacts of a Large-Scale Mountain Pine Beetle (dendroctonus Ponderosae Hopkins) Epidemic1, J. Am. Water Resour. Assoc., 20, 373–377, https://doi.org/10.1111/j.1752-1688.1984.tb04719.x, 1984.
Ren, J., Adam, J. C., Hicke, J. A., Hanan, E. J., Tague, C. L., Liu, M., Kolden, C. A., and Abatzoglou, J. T.: Dataset for how does water yield respond to mountain pine beetle infestation in a semiarid forest, OSF [data set], https://doi.org/10.17605/OSF.IO/NE4QU, 2021a.
Ren, J., Adam, J. C., Hicke, J. A., Hanan, E. J., Tague, C. L., Liu, M., Kolden, C. A., and Abatzoglou, J. T.: Coupled beetle effect model and RHESSys model, Zenodo [code], https://doi.org/10.5281/zenodo.5156688, 2021b.
Robles, M. D., Marshall, R. M., O'Donnell, F., Smith, E. B., Haney, J. A., and Gori, D. F.: Effects of Climate Variability and Accelerated Forest Thinning on Watershed-Scale Runoff in Southwestern USA Ponderosa Pine Forests, PLOS One, 9, e111092, https://doi.org/10.1371/journal.pone.0111092, 2014.
Ryan, M. G.: Effects of Climate Change on Plant Respiration, Ecol. Appl., 1, 157–167, https://doi.org/10.2307/1941808, 1991.
Searcy, J. K.: Flow-duration curves, US Government Printing Office, Washington, DC, https://doi.org/10.3133/wsp1542A, 1959.
Sexstone, G. A., Clow, D. W., Fassnacht, S. R., Liston, G. E., Hiemstra, C. A., Knowles, J. F., and Penn, C. A.: Snow Sublimation in Mountain Environments and Its Sensitivity to Forest Disturbance and Climate Warming, Water Resour. Res., 54, 1191–1211, https://doi.org/10.1002/2017WR021172, 2018.
Skinner, K. D.: Post-fire debris-flow hazard assessment of the area burned by the 2013 Beaver Creek Fire near Hailey, central Idaho, US Geological Survey, Reston, VA, 2013.
Slinski, K. M., Hogue, T. S., Porter, A. T., and McCray, J. E.: Recent bark beetle outbreaks have little impact on streamflow in the Western United States, Environ. Res. Lett., 11, 074010, https://doi.org/10.1088/1748-9326/11/7/074010, 2016.
Smith, R. O.: Geohydrologic evaluation of streamflow records in the Big Wood River basin, Idaho, US Government Printing Office, Washington, DC, 1960.
Snyder, K. A., Scott, R. L., and McGwire, K.: Multiple year effects of a biological control agent (Diorhabda carinulata) on Tamarix (saltcedar) ecosystem exchanges of carbon dioxide and water, Agr. Forest Meteorol., 164, 161–169, https://doi.org/10.1016/j.agrformet.2012.03.004, 2012.
Son, K. and Tague, C.: Hydrologic responses to climate warming for a snow-dominated watershed and a transient snow watershed in the California Sierra, Ecohydrology, 12, e2053, https://doi.org/10.1002/eco.2053, 2019.
Sun, N., Wigmosta, M., Zhou, T., Lundquist, J., Dickerson-Lange, S., and Cristea, N.: Evaluating the functionality and streamflow impacts of explicitly modelling forest–snow interactions and canopy gaps in a distributed hydrologic model, Hydrol. Process., 32, 2128–2140, https://doi.org/10.1002/hyp.13150, 2018.
Tague, C. L. and Band, L. E.: RHESSys: Regional Hydro-Ecologic Simulation System – An Object-Oriented Approach to Spatially Distributed Modeling of Carbon, Water, and Nutrient Cycling, Earth Interact., 8, 1–42, https://doi.org/10.1175/1087-3562(2004)8<1:RRHSSO>2.0.CO;2, 2004.
Tague, C. L., Moritz, M., and Hanan, E.: The changing water cycle: The eco-hydrologic impacts of forest density reduction in Mediterranean (seasonally dry) regions, Wiley Interdisciplin. Rev. Water, 6, e1350, https://doi.org/10.1002/wat2.1350, 2019.
Tsamir, M., Gottlieb, S., Preisler, Y., Rotenberg, E., Tatarinov, F., Yakir, D., Tague, C., and Klein, T.: Stand density effects on carbon and water fluxes in a semi-arid forest, from leaf to stand-scale, Forest Ecol. Manage., 453, 117573, https://doi.org/10.1016/j.foreco.2019.117573, 2019.
White, J. D. and Running, S. W.: Testing scale dependent assumptions in regional ecosystem simulations, J. Veg. Sci., 5, 687–702, https://doi.org/10.2307/3235883, 1994.
White, M. A., Thornton, P. E., Running, S. W., and Nemani, R. R.: Parameterization and Sensitivity Analysis of the BIOME–BGC Terrestrial Ecosystem Model: Net Primary Production Controls, Earth Interact., 4, 1–85, https://doi.org/10.1175/1087-3562(2000)004<0003:PASAOT>2.0.CO;2, 2000.
Wine, M. L., Cadol, D., and Makhnin, O.: In ecoregions across western USA streamflow increases during post-wildfire recovery, Environ. Res. Lett., 13, 014010, https://doi.org/10.1088/1748-9326/aa9c5a, 2018.
Winkler, R., Boon, S., Zimonick, B., and Spittlehouse, D.: Snow accumulation and ablation response to changes in forest structure and snow surface albedo after attack by mountain pine beetle, Hydrol. Process., 28, 197–209, https://doi.org/10.1002/hyp.9574, 2014.
- Abstract
- Highlights
- Introduction
- Conceptual framework
- Model, data, and simulation experiment design
- Results
- Discussion
- Conclusion
- Code and data availability
- Author contributions
- Competing interests
- Disclaimer
- Special issue statement
- Acknowledgements
- Financial support
- Review statement
- References
- Supplement