the Creative Commons Attribution 4.0 License.
the Creative Commons Attribution 4.0 License.
 | 03 May 2021
Projected changes in Rhine River flood seasonality under global warming
Axel Bronstert
Gerd Bürger
Oldrich Rakovec
Climatic change alters the frequency and intensity of natural hazards. In order to assess potential future changes in flood seasonality in the Rhine River basin, we analyse changes in streamflow, snowmelt, precipitation and evapotranspiration at 1.5, 2.0 and 3.0 ∘C global warming levels. The mesoscale hydrological model (mHM) forced with an ensemble of climate projection scenarios (five general circulation models under three representative concentration pathways) is used to simulate the present and future climate conditions of both pluvial and nival hydrological regimes.
Our results indicate that future changes in flood characteristics in the Rhine River basin are controlled by increases in antecedent precipitation and diminishing snowpacks. In the pluvial-type sub-basin of the Moselle River, an increasing flood potential due to increased antecedent precipitation encounters declining snowpacks during winter. The decrease in snowmelt seems to counterbalance increasing precipitation, resulting in only small and transient changes in streamflow maxima. For the Rhine Basin at Basel, rising temperatures cause changes from solid to liquid precipitation, which enhance the overall increase in precipitation sums, particularly in the cold season. At the gauge at Basel, the strongest increases in streamflow maxima show up during winter, when strong increases in liquid precipitation encounter almost unchanged snowmelt-driven runoff. The analysis of snowmelt events for the gauge at Basel suggests that at no point in time during the snowmelt season does a warming climate result in an increase in the risk of snowmelt-driven flooding. Snowpacks are increasingly depleted with the course of the snowmelt season. We do not find indications of a transient merging of pluvial and nival floods due to climate warming. To refine attained results, next steps need to be the representation of glaciers and lakes in the model set-up, the coupling of simulations to a streamflow component model and an independent validation of the snow routine using satellite-based snow cover maps.
- Article
(7670 KB) - Full-text XML
- BibTeX
- EndNote


Current climatic changes entail changes in the frequency and intensity of natural hazards. Among other things, rising temperatures reinforce heatwaves (Meehl and Tebaldi, 2004; Della-Marta et al., 2007; Fischer and Schär, 2010) and dry spells (Blenkinsop and Fowler, 2007; Samaniego et al., 2018b; Grillakis, 2019), and more intense precipitation increases the risk posed by floods and landslides (Dankers and Feyen, 2008; Rojas et al., 2012; Alfieri et al., 2015; Crozier, 2010; Huggel et al., 2012). Fundamental changes are expected in snow-dominated regions (Hock et al., 2019); alpine climatic changes go along with declining seasonal snowpacks (Steger et al., 2013; Beniston et al., 2018; Hanzer et al., 2018), thawing permafrost (Serreze et al., 2000; Schuur et al., 2015; Elberling et al., 2013; Beniston et al., 2018) and retreating glaciers (Zemp et al., 2006; Huss, 2011; Radić and Hock, 2014; Hanzer et al., 2018). These cryospheric changes, in turn, impact water availability in and outside mountain areas (Barnett et al., 2005; Stewart, 2009; Junghans et al., 2011; Viviroli et al., 2011). The European Alps, for example, are the source region of numerous large rivers that form the basis of the economic and cultural development in various cities and communities (Beniston, 2012).
Recent studies suggest that rapid climatic changes have already altered flood characteristics in river systems across Europe. For example, Blöschl et al. (2019) indicate that during 1950–2010, increasing rainfall and soil moisture led to higher river flood discharges in northwestern Europe, while decreasing rainfall together with higher evapotranspiration rates decreased flood discharge in southern parts of the continent. Detected trends in flood magnitudes seem to align with trends in the spatial extent of the floods (Kemter et al., 2020). A further distinction of floods depending on return period and catchment area enables a detailed investigation of processes generating floods (Bertola et al., 2020). The most important mechanisms driving flooding in Europe are extreme precipitation, snowmelt and soil moisture excess (Berghuijs et al., 2019).
In large and diverse river basins, such as the Rhine River basin, all relevant mechanisms generating riverine floods can be detected. The southern part of the basin is influenced by snowmelt from the Alps and therefore commonly classified as nival (Belz et al., 2007; Speich et al., 2015). The runoff of a nival hydrological regime is primarily controlled by the accumulation and melt of a seasonal snow cover. Hence, runoff is low during winter and high during summer. The main tributaries of the Rhine River are rainfall-dominated. Runoff is high during winter and low during summer. Flooding in the rainfall-dominated tributaries usually occurs in winter and is driven by large-scale advective precipitation (Pfister et al., 2004; Bronstert et al., 2007).
Investigating changes in runoff seasonality and flood-generating mechanisms is important to assess challenges in future water resources management. Previous investigations conducted in Switzerland (e.g. Horton et al., 2006; Addor et al., 2014; Brunner et al., 2019), Austria (e.g. Kormann et al., 2015, 2016; Hanzer et al., 2018), Norway (e.g. Vormoor et al., 2015, 2016) and the United States (e.g. Brunner et al., 2020a, b) point at changes in snowmelt- and rainfall-generated runoff. For the Rhine River, studies have indicated that changes in both nival and pluvial flow alter hydrological regimes and their high-/low-flow characteristics (e.g. Middelkoop et al., 2001; Belz et al., 2007; Hurkmans et al., 2010; Huang et al., 2013; Alfieri et al., 2015; Stahl et al., 2016; Thober et al., 2018; Marx et al., 2018; Huang et al., 2018). Projections of discharge attained using hydrological models proved key in the attempt to assess the impact of climatic changes.
The aim of the present study is to investigate future changes in rainfall- and snowmelt-induced flooding in the Rhine River. We use the mesoscale hydrologic model (mHM; Samaniego et al., 2010; Kumar et al., 2013) forced with an ensemble of climate projection scenarios (five general circulation models under three representative concentration pathways) to assess projected changes in streamflow, snowmelt, rainfall and evapotranspiration characteristics under 1.5, 2.0, and 3.0 ∘C global warming. Special focus is on the hypothesis of a transient merging of nival and pluvial flow regimes by climate change, which suggests that in a warmer world, earlier snowmelt-induced floods originating from the Alps might overlap with more intense rainfall-induced runoff from pluvial-type tributaries, creating a new flood type with potentially disastrous consequences (Fig. 1).
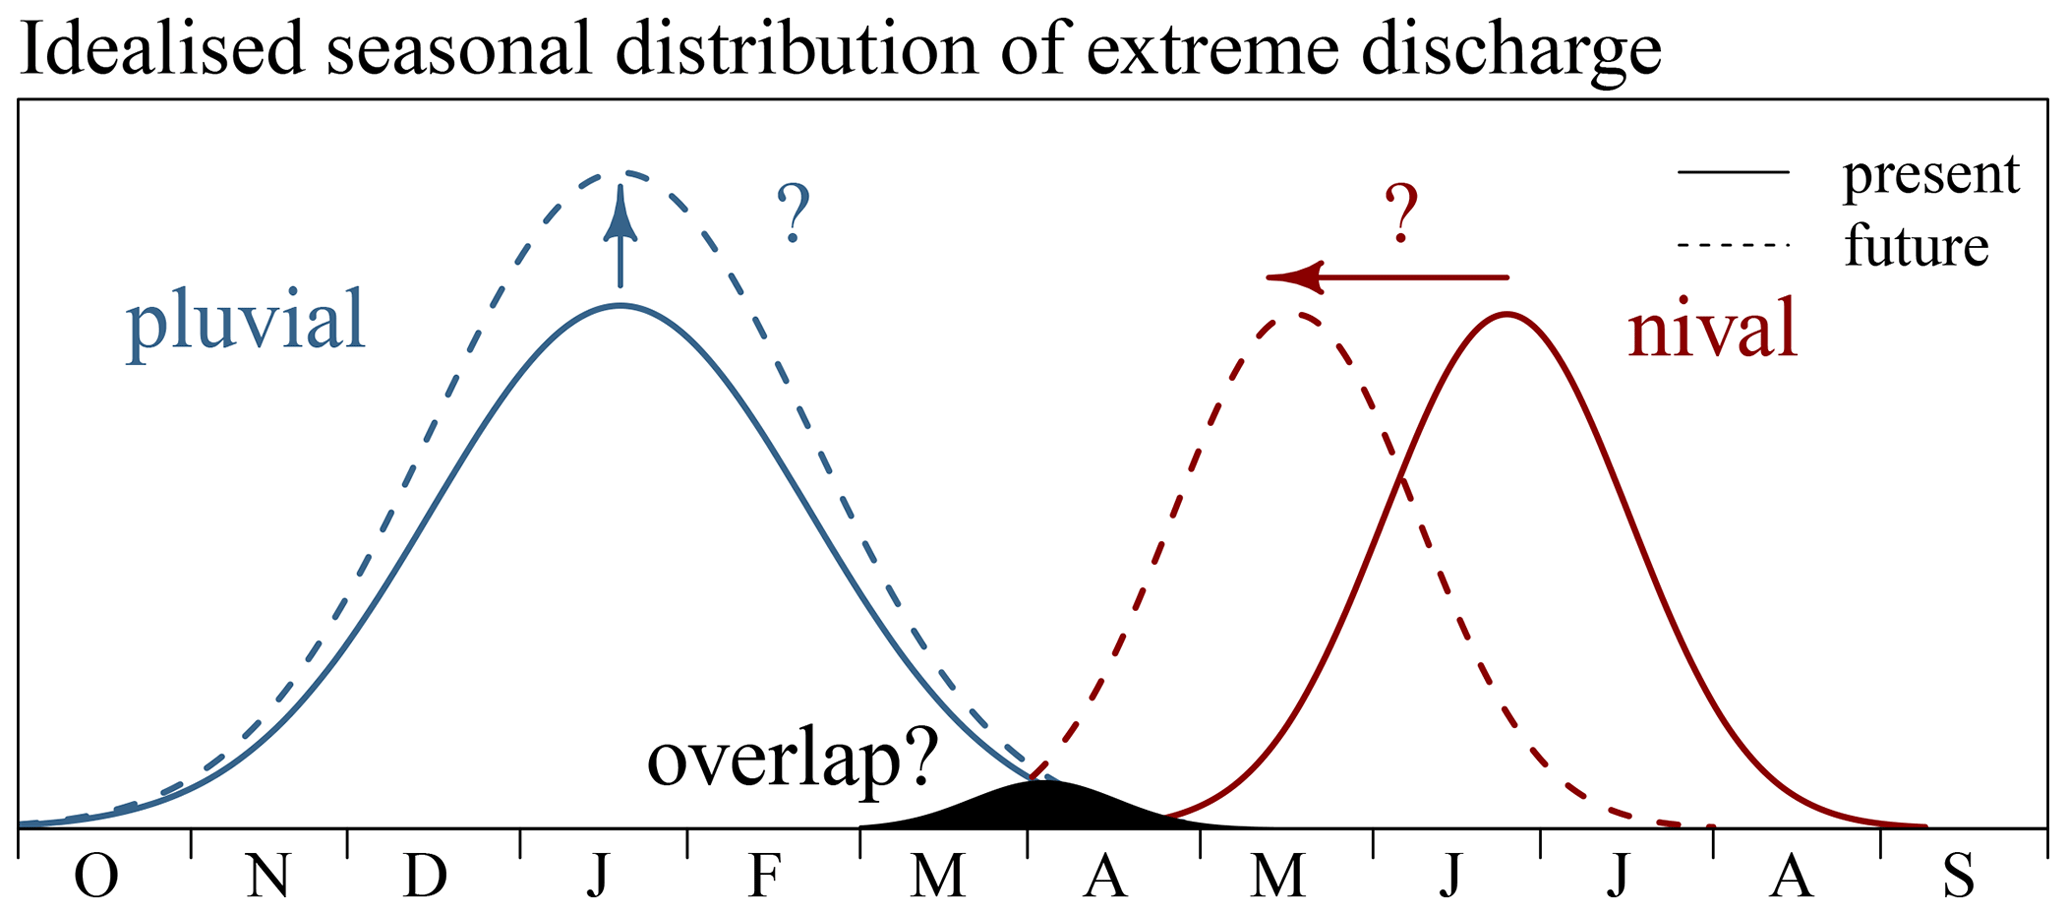
Figure 1Idealised seasonal distribution of nival and pluvial flood frequencies and potential overlap due to climate change.
2.1 Model set-up
The mesoscale hydrologic model (mHM) v.5.10 (Samaniego et al., 2010; Kumar et al., 2013; Samaniego et al., 2019a) is used to detect and assess projected changes in Rhine River floods under future climate conditions (Figs. 2 and 3). mHM is a spatially distributed hydrologic model based on grid cells. A key feature of mHM is the multiscale parameter regionalisation (MPR) technique, which allows subgrid variability to be accounted for and provides simulations in a seamless manner over multiple resolutions (e.g. Kumar et al., 2013; Rakovec et al., 2016; Samaniego et al., 2017). During MPR, high-resolution physiographic land surface descriptors are translated into model parameters in the two phases of MPR, i.e. regionalisation and upscaling. In the framework of this study, the high-resolution physiographical data sets describing the main features of the terrain, e.g. digital elevation model, aspect, slope, soil texture, geological formation type, land cover and leaf area index (LAI), are in 500 m resolution (Samaniego et al., 2019). The mHM model set-up distinguishes six soil layers up to a depth of 2 m based on Hengl et al. (2017). For each soil horizon the soil types are defined based on clay content, sand content and bulk density. We distinguish eight hydrogeological units. The baseflow recession parameters characterising each unit are determined during model calibration. Long-term climatologic monthly LAI maps are based on Mao and Yan (2019). Using a modified IGBP MODIS Noah classification scheme, 23 LAI classes are distinguished, whereby classes representing croplands, grassland, coniferous forest, mixed forest and mosaics of cropland and natural vegetation are the most common in the basin. More information on physiographical data sets, the mapping on a common 500 m × 500 m spatial resolution and underlying data sources is presented in Samaniego et al. (2019). All dominant hydrological processes are modelled at 5 km spatial resolution.
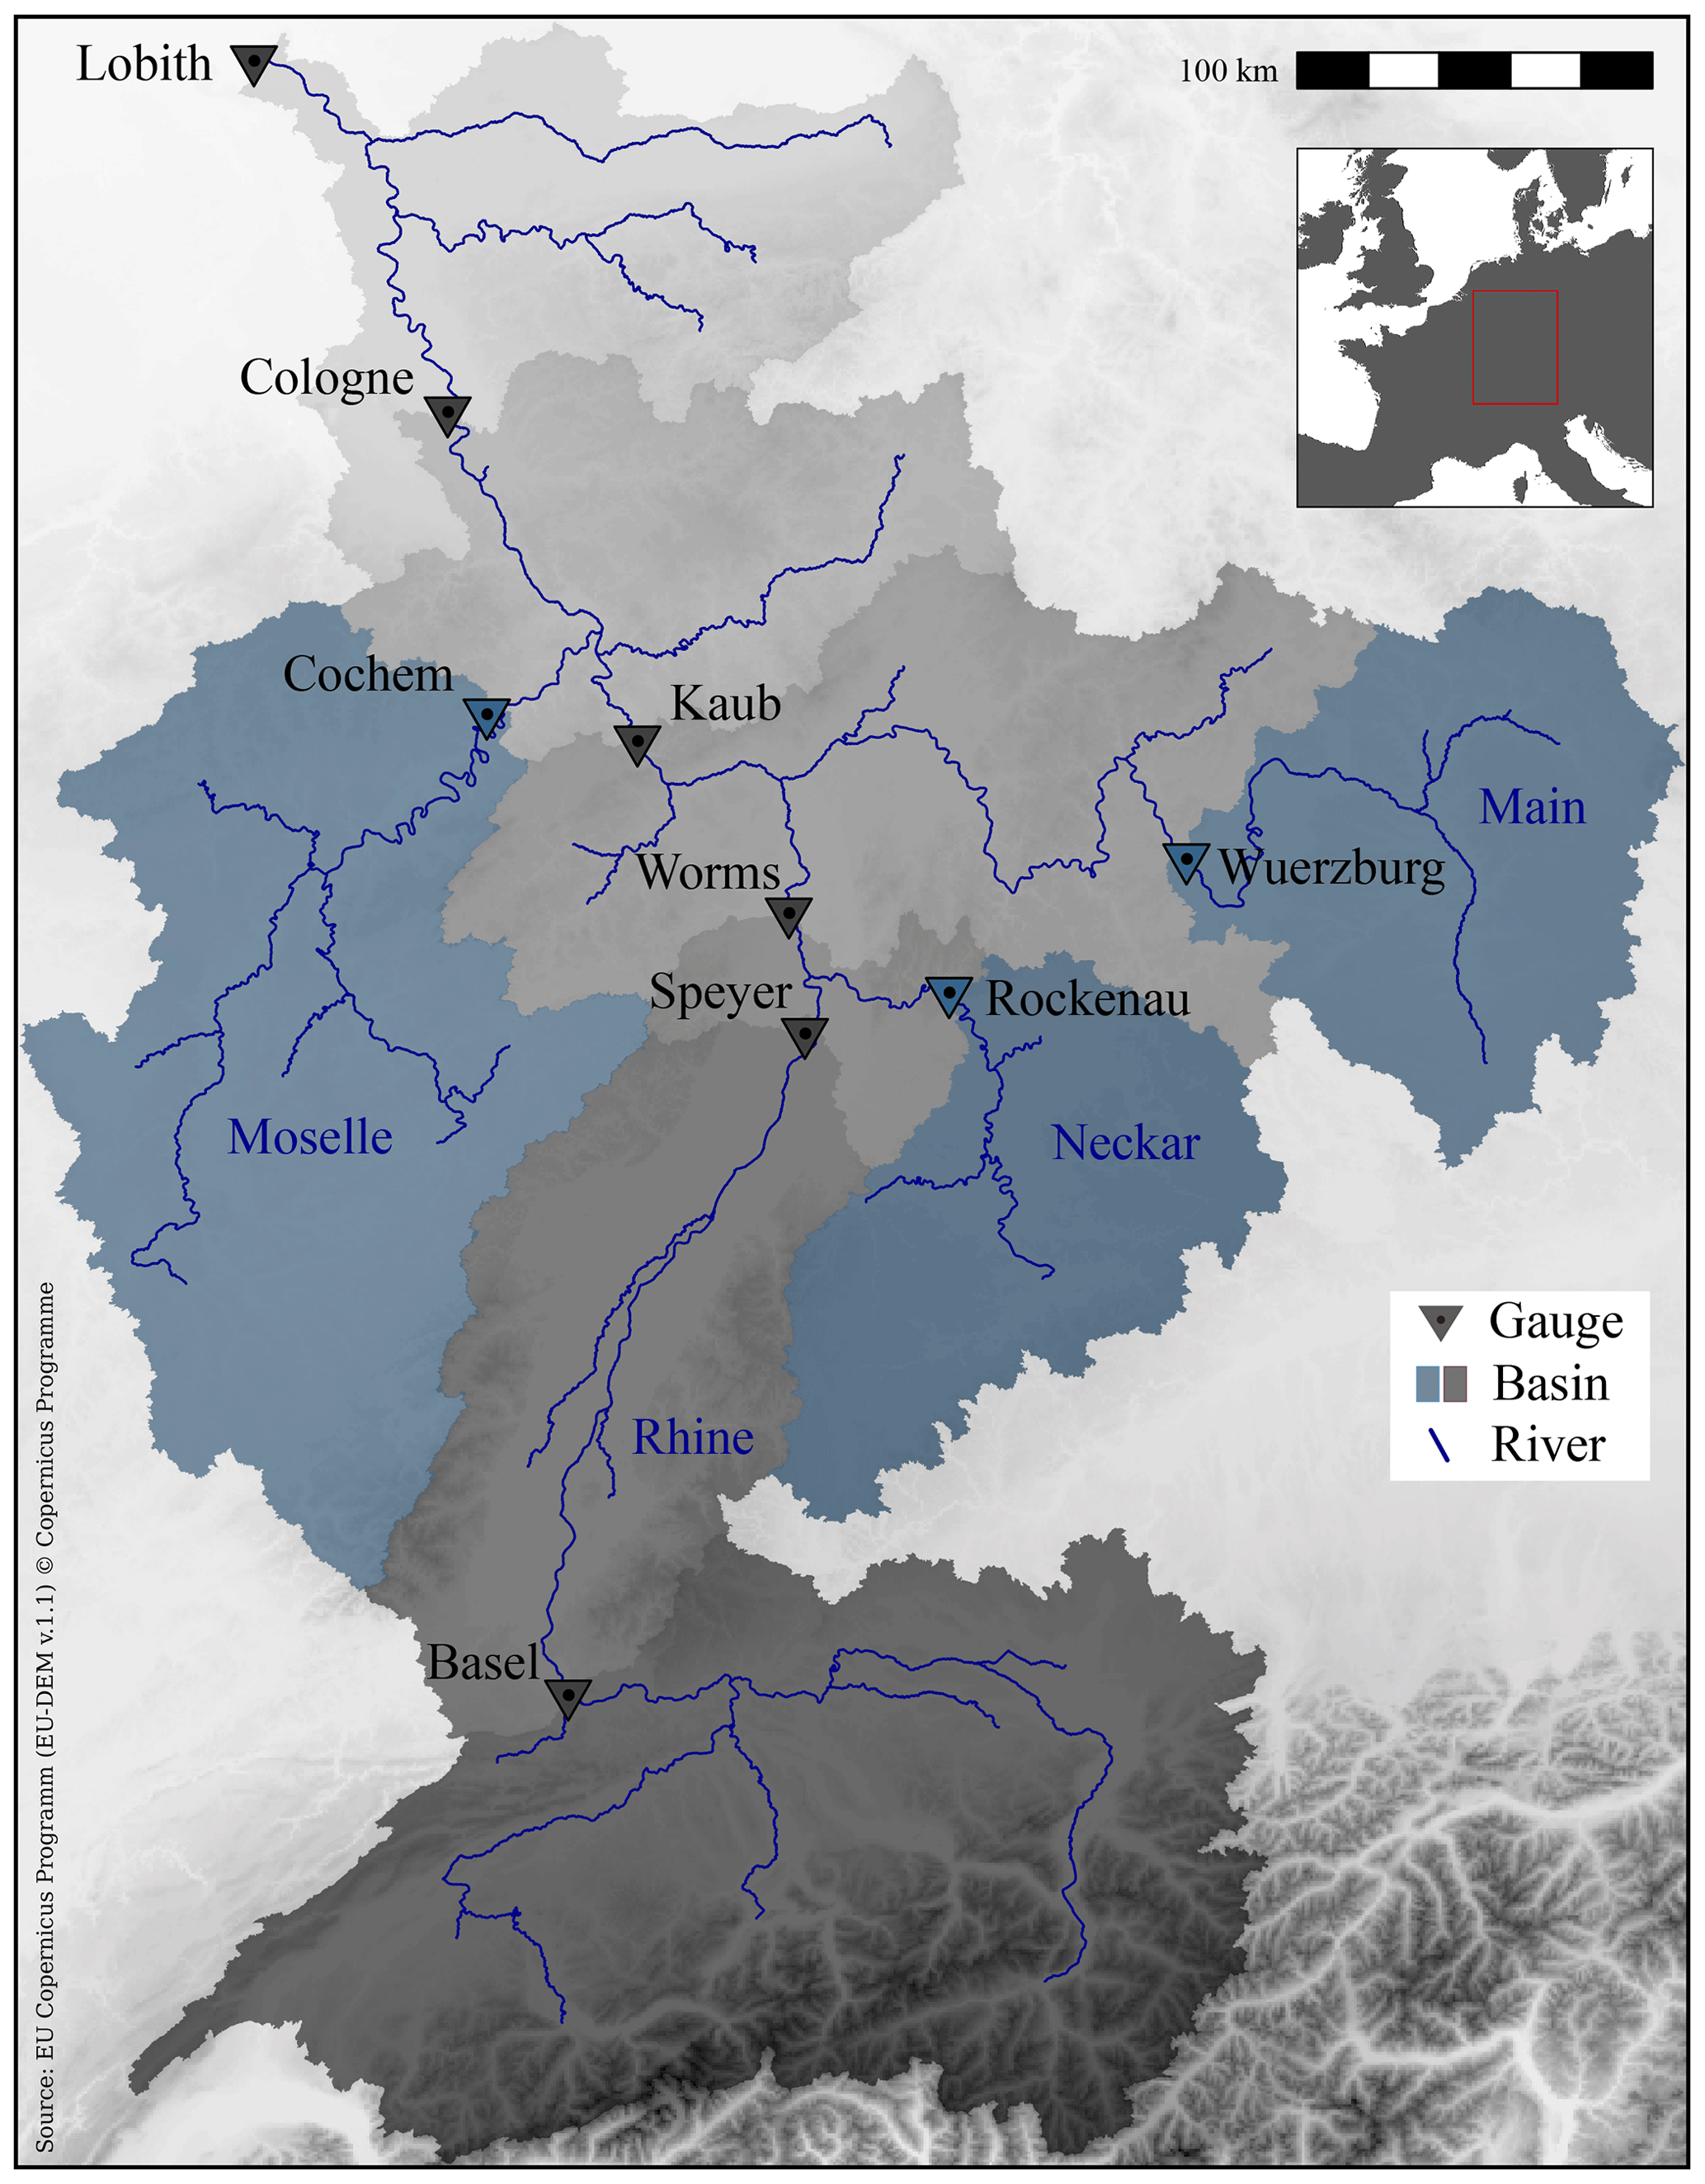
Figure 2Topographic map of the Rhine River basin at the gauge at Lobith with locations of all gauges and sub-basins investigated.
Meteorological forcing data of the model consist of daily average, maximum and minimum temperature and precipitation. Observational data sets are based on the E-OBS v12 gridded data sets (Haylock et al., 2008). Climate model data originate from the Inter-Sectoral Impact Model Intercomparison Project (ISI-MIP) (Hempel et al., 2013a, b; Warszawski et al., 2014). ISI-MIP is based on global climate model (GCM) runs performed during the fifth phase of the Coupled Model Intercomparison Project (CMIP5; Taylor et al., 2012). Within ISI-MIP, daily data from five global climate models (GCMs), i.e. GFDL-ESM2M, HadGEM2-ES, IPSL-CMSA-LR, MIROC-ESM-CHEM and NorESM1-M, were bias-corrected and bilinearly interpolated to a 0.5∘ × 0.5∘ grid. Bias correction of climate model data represents an indispensable step in climate change impact modelling applications. Systematic deviation, e.g. due to imperfect model representations of atmospheric processes or errors in the parameterisation chain, needs to be corrected (Ehret et al., 2012). A detailed description of the trend-preserving statistical bias correction method developed and applied within ISI-MIP, which includes an additive correction approach for temperature and a multiplicative correction for precipitation, is presented in Hempel et al. (2013b). GCM data used cover the period 1950–2099 and include three representative concentration pathways (RCPs), RCP2.6, RCP6.0 and RCP8.5. In the framework of the project “EDgE – End-to-end Demonstrator for improved decision making in the water sector in Europe” by order of the Copernicus Climate Service (http://edge.climate.copernicus.eu/, last access: 28 April 2021), meteorological data sets were interpolated to a 5 km grid using external drift kriging (Samaniego et al., 2019).
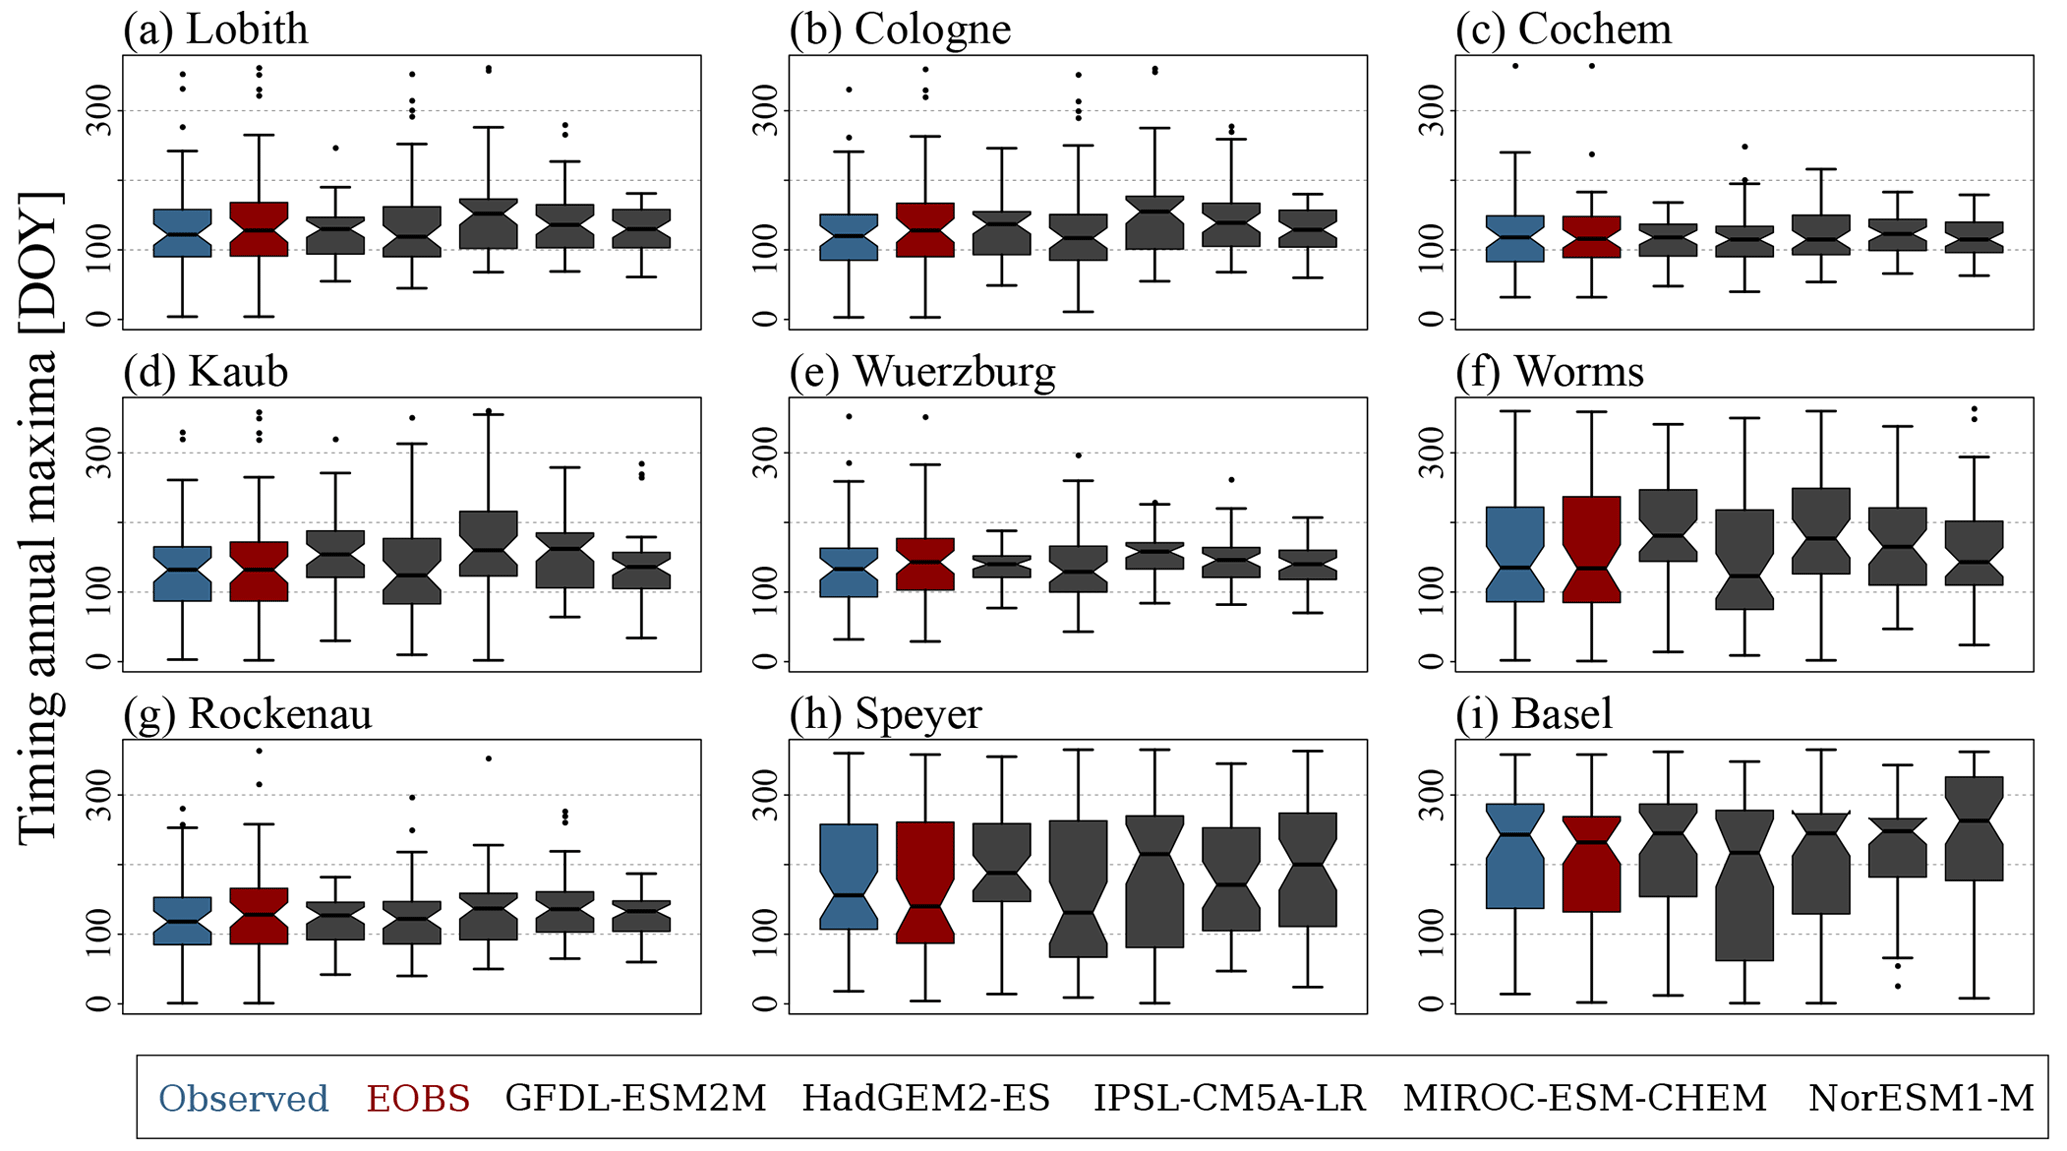
mHM forced with E-OBS meteorological data is calibrated for the Rhine Basin at the gauge at Lobith against observed streamflow at the three gauges at Lobith, Basel and Cochem during 1951–1975 using the dynamically dimensioned search algorithm (DDS; Tolson and Shoemaker, 2007) and the Nash–Sutcliffe efficiency (NSE; Nash and Sutcliffe, 1970). In the framework of this multi-basin calibration, we simultaneously optimise NSE values for the three gauges and attain one set of global parameters, which we apply to the entire basin. We use a multi-basin approach to ensure that rainfall- and snowmelt-triggered runoff from both nival- and pluvial-dominated sub-basins, as well as streamflow in the main channel of the Rhine River, is considered during calibration. MPR enables the sampling in a lower dimensional space, in turn speeding up the convergence of the optimisation algorithm (Samaniego et al., 2010). In total, we calibrate 47 global parameters using 1000 model iterations. A detailed overview of global parameters and their linkage with basin predictors in the regionalisation transfer functions are presented in Samaniego et al. (2010) and Kumar et al. (2013). In order to evaluate the model performance in all important sub-regions of the entire Rhine River, the mHM performance is evaluated at an additional six independent gauges (Fig. 2) and during an independent evaluation period (1976–2000) using the NSE and the Kling–Gupta efficiency (KGE; Gupta et al., 2009) (Table 1). Analyses evaluating streamflow simulations for the historic time frame 1951–2000 are given in the Appendix (Figs. A1, B1 and C1). Similar to investigations presented in the Supplement of Thober et al. (2018), we assess streamflow maxima and the 90 % streamflow quantile of the hydrological year. In addition, we evaluate the timing of annual streamflow maxima and 90 % streamflow quantiles on a monthly basis. All observational discharge times series are obtained from the Global Runoff Data Centre (GRDC).
Table 1River gauges investigated: location (WGS 84), GRDC identification number, catchment area, Nash–Sutcliffe efficiency (NSE) and Kling–Gupta efficiency (KGE) between observed and modelled runoff (NSE/KGE). The model has been calibrated against observation from the three gauges (Lobith, Basel and Cochem) with the NSE as an objective function during 1951–1975.

The multiscale routing model (mRM; Thober et al., 2019) is used for routing river runoff using the adaptive time step scheme (aTS). The kinematic wave equation (Lighthill and Whitham, 1955), a simplification of the Saint-Venant equation (de Saint-Venant, 1871), is solved using a finite difference scheme. The kinematic wave equation only needs little information on the river topography and assesses the advection and the attenuation of flood waves. The time step selected within aTS only depends on the spatial resolution and is independent of the temporal resolution of the meteorological forcing. In our model set-up, water is routed through the river network at a temporal resolution of 30 min. The high-resolution river network is based on a 500×500 m digital elevation map and is upscaled to operate on a 5 km routing resolution. Within the upscaling process, the flow direction in the lower resolution (routing resolution) is equal to the flow direction in the underlying high-resolution grid cell with the highest flow accumulation (Samaniego et al., 2010). The stream celerity is determined as a function of terrain slope (Thober et al., 2019).
All dominant hydrological processes are modelled at 5 km spatial resolution. We estimate reference crop evapotranspiration following the Hargreaves–Samani equation, an empirical approach using minimum climatological data (Hargreaves and Samani, 1985; Samani, 2000). The empirical coefficient of the equation is determined during calibration. The usage of this simple approach enables a consistent set-up across historical and future model space. The actual evapotranspiration is estimated based on the fraction of roots in the soil horizons and a stress factor for reducing potential values calculated based on the actual soil moisture. The stress factor is determined using the Feddes equation (Feddes et al., 1976). If the soil moisture is below the permanent wilting point, evapotranspiration is reduced to zero. In the case that the soil moisture is above field capacity, the evapotranspiration equals the fraction of roots. If the soil moisture is in between the permanent wilting point and field capacity, evapotranspiration is reduced by the fraction of roots times the stress factor. The mHM set-up distinguishes six soil layers up to a total depth of 2 m. Organic matter is possible until 0.3 m. In total, more than 2000 soil types with different clay content, sand content and bulk density are defined. Land surfaces with impervious cover are treated as free-water surfaces, and actual evapotranspiration is estimated with an additional evaporation coefficient. More details of the soil parameterisation in mHM can be found in Livneh et al. (2015).
The canopy interception is modelled with a maximum interception approach. The maximum interception capacity is estimated based on the given LAI values. Water can leave the interception storage as throughfall, which is estimated as a function of the current and maximum canopy water content and the incoming precipitation. Evaporation from the canopy storage depends on the current and maximum canopy water content and the potential values of evapotranspiration. We simulated snow using an empirical degree-day approach, whereby degree-day factors differ depending on the dominant land use class. In order to account for snowmelt following the energy input from liquid rainfall, degree-day factors are increased depending on the amount of liquid precipitation. Degree-day factors can only increase to a certain threshold value. Due to the spatial resolution of 5 km, our model set-up does not capture the highest elevations in the basin. To also capture the snow dynamics at mountain peaks, meteorological input data would need to be at higher spatial resolution, and more advanced snow and ice processes would need to be considered. Surface runoff from impervious areas is calculated based on a linear reservoir exceedance approach. Interflow from the unsaturated zone is determined using a non-linear reservoir with saturation excess. Groundwater is assumed to be a linear reservoir. mHM does not include glacier and lake modules yet.
The changes in mHM-based flood seasonality are further differentiated and scrutinised for three different warming levels: 1.5, 2.0 and 3.0 ∘C. Within each future model run, the 30-year time windows in which the warming levels (compared to the historic time window 1971–2000) are reached are determined. The period 1971–2000 is assumed to be warmer by 0.46 ∘C compared to pre-industrial levels already (Vautard et al., 2014). For example, when comparing 30-year running temperature means from the IPSL-CM5A-LR model run under RCP6.0, temperatures reach 1.5 ∘C warming compared to pre-industrial levels in the 30-year time window 2009–2038, 2.0 ∘C warming during 2028–2057 and a 3.0 ∘C warming in the period 2066–2095. A total of 14 GCM–RCP realisations reach 1.5 ∘C, 13 reach 2.0 ∘C and 8 reach 3.0 ∘C global warming. A detailed description of the determination of warming levels including a table with 1.5, 2.0 and 3.0 ∘C time periods of the GCM–RCP realisation is given in the Supplement (Table S1) of Thober et al. (2018).
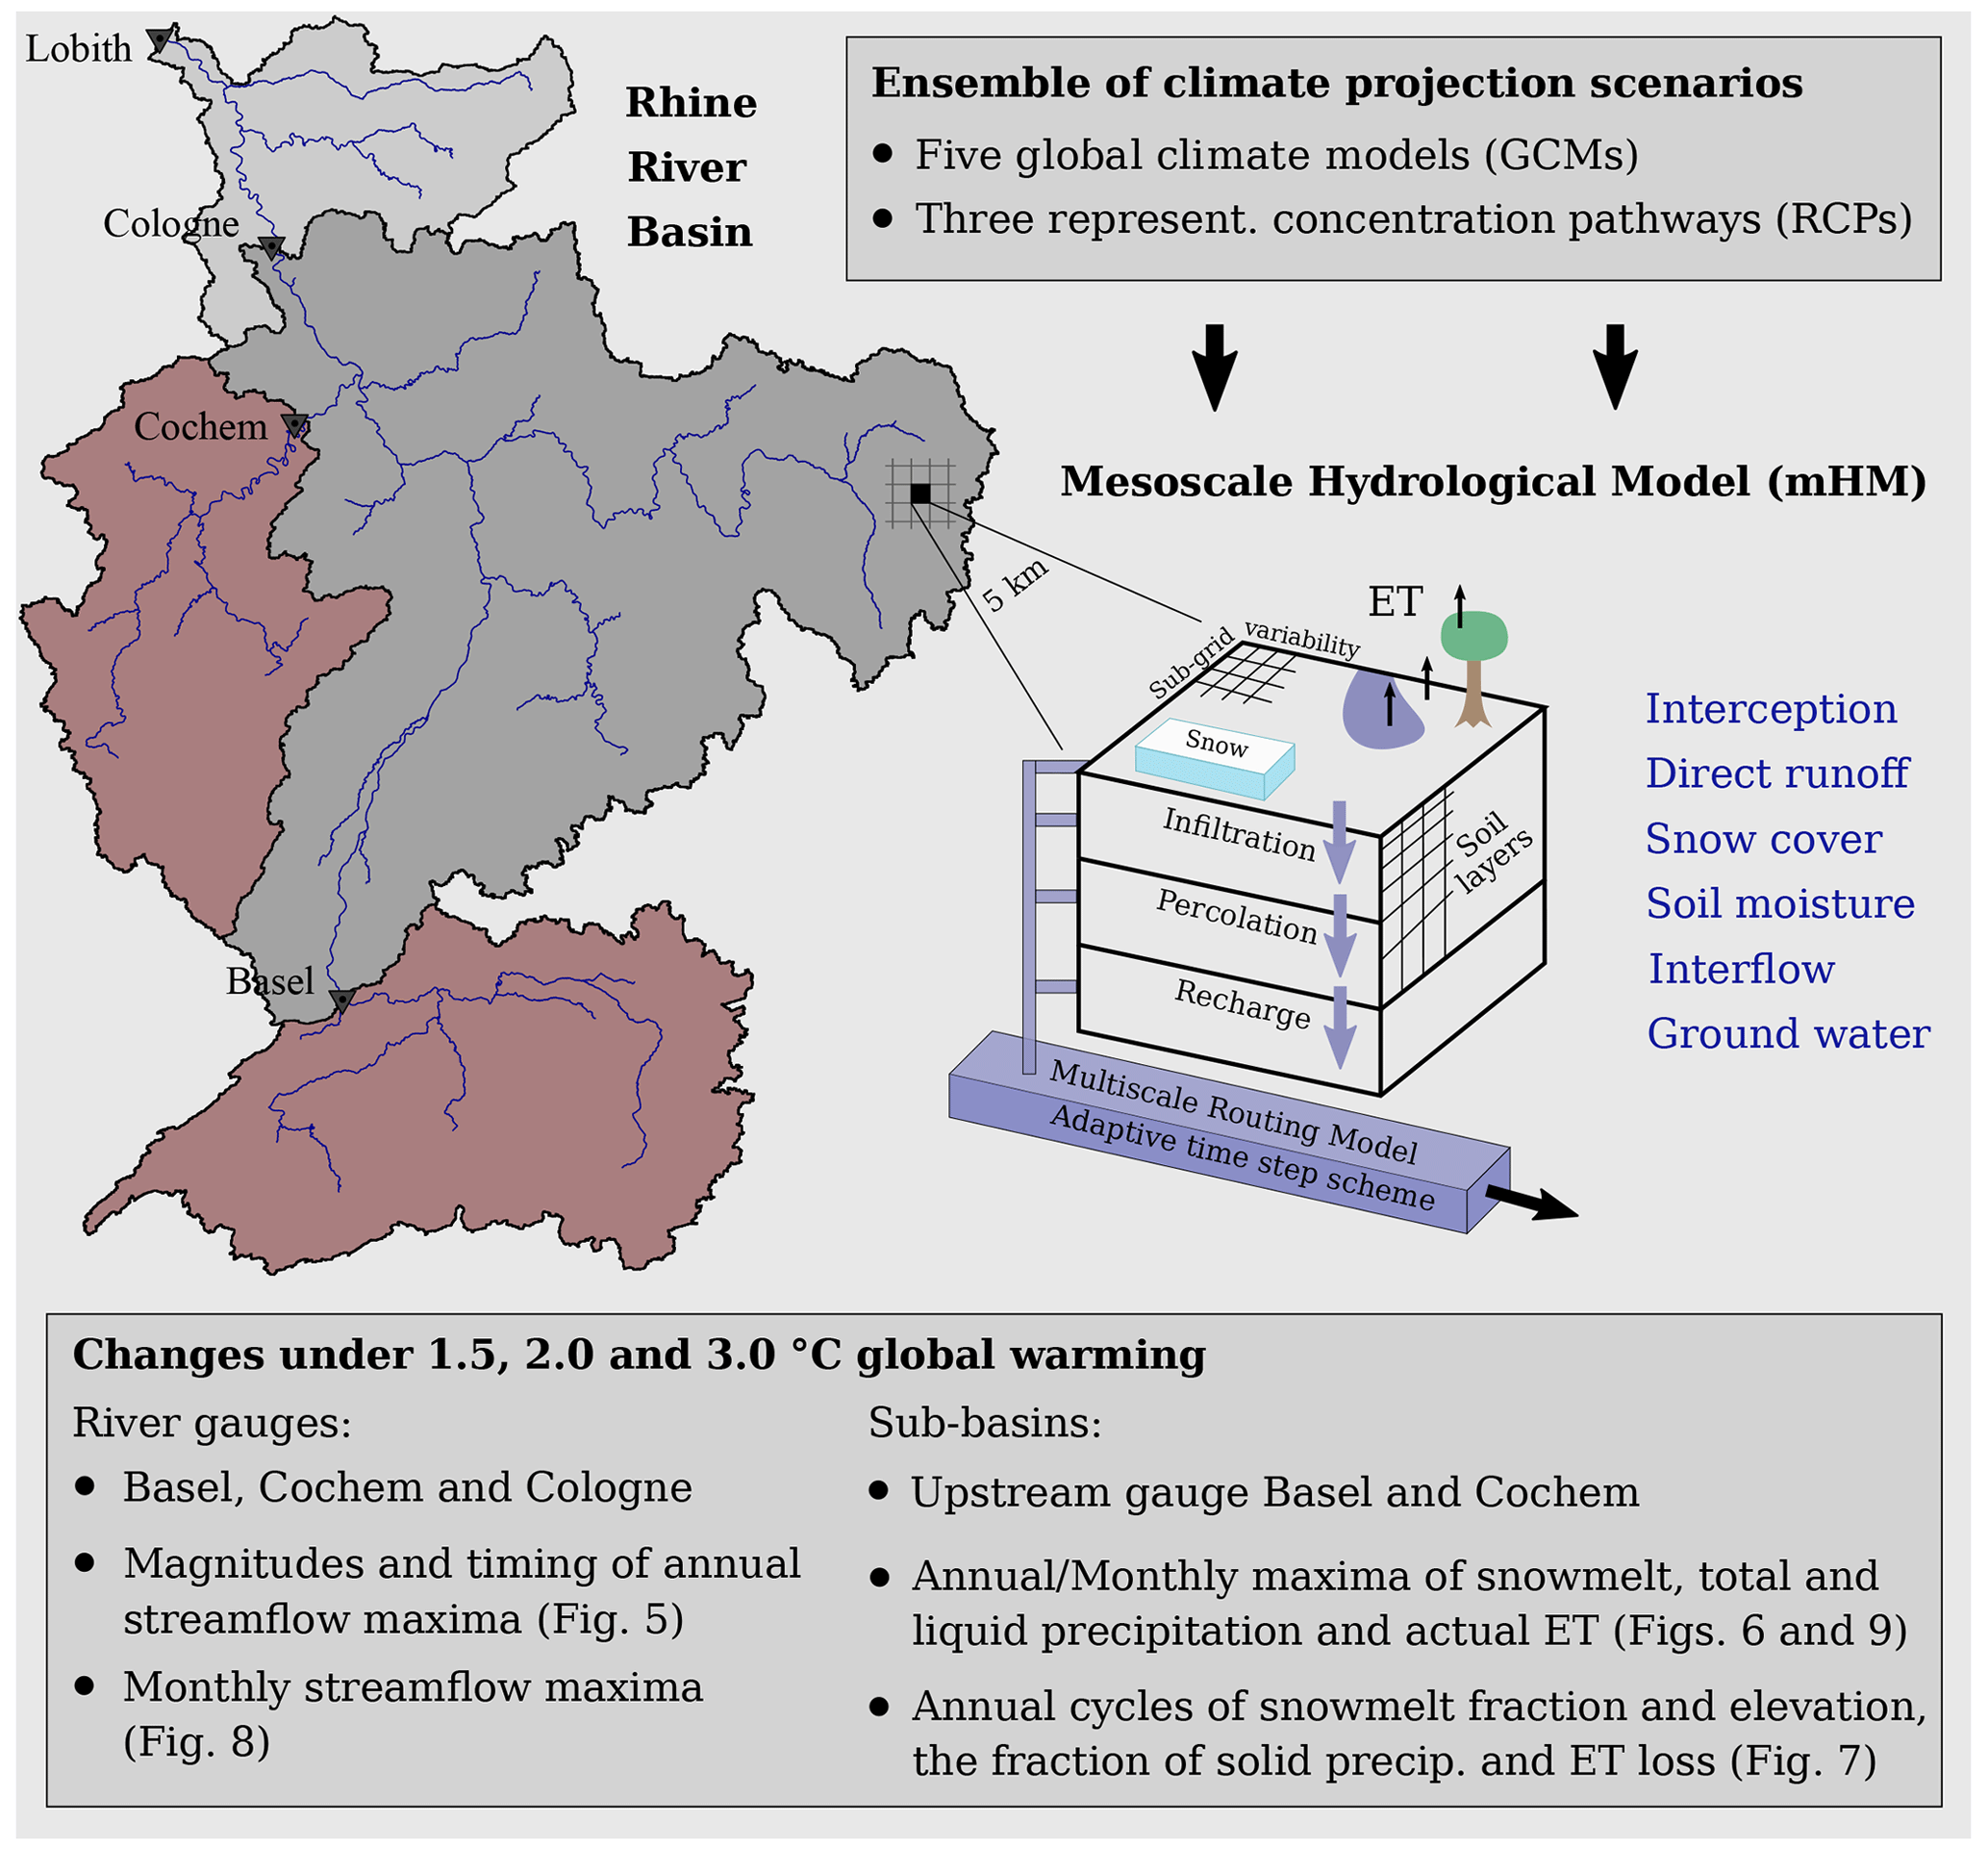
Figure 3Scheme of the analytical set-up depicting gauges (Basel, Cochem and Cologne) and sub-basins (at the gauges at Basel and Cochem) investigated in detail.
2.2 Changes in streamflow characteristics
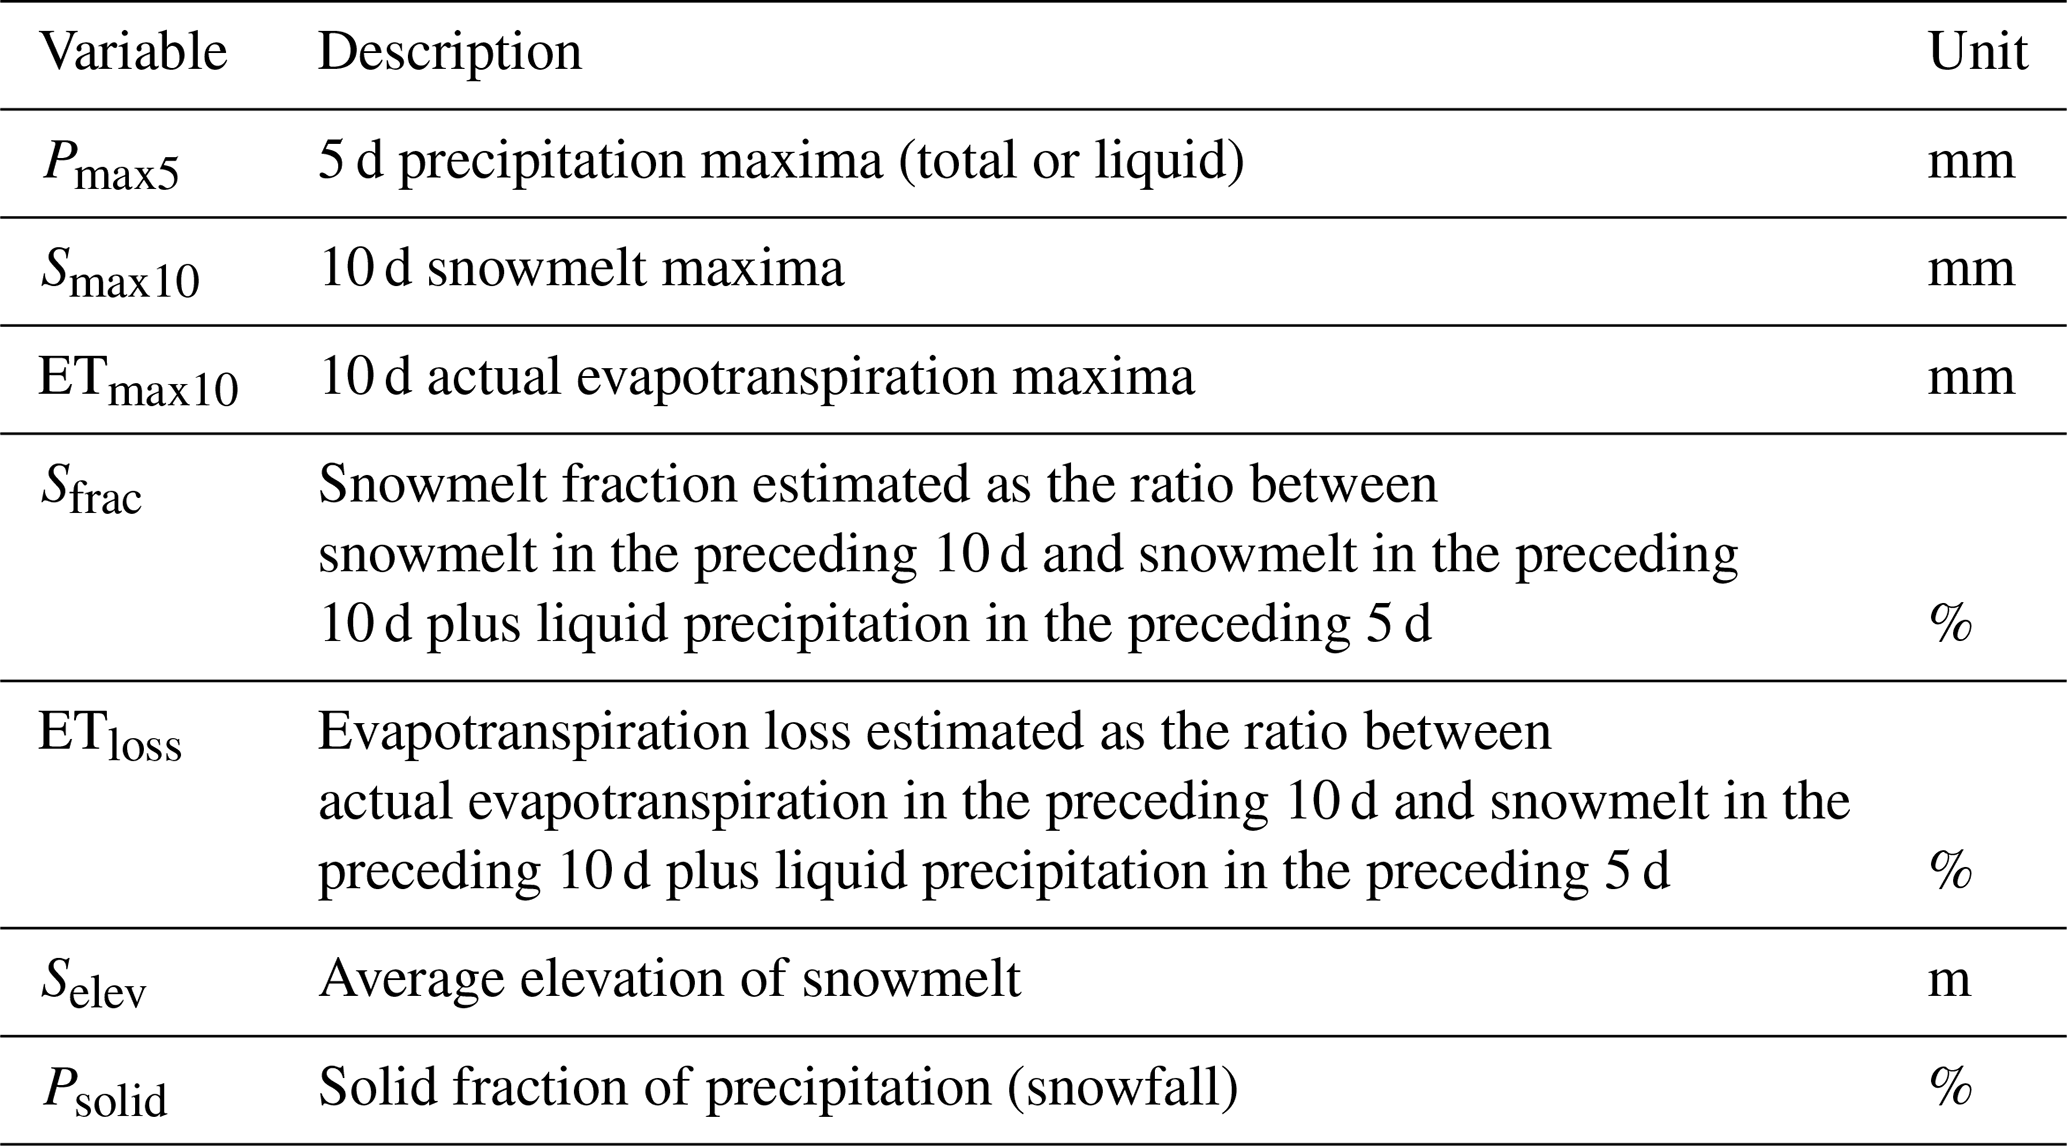
In order to assess the changes in flood characteristics, we determine the timing and magnitude of annual and monthly maxima of streamflow, precipitation (total and liquid), snowmelt and actual evapotranspiration for the hydrological year starting on 1 October (Table 2). In the case of precipitation, we investigate maxima of 5 d sums (Pmax5). Investigating thousands of annual streamflow maxima for different Swiss catchments with regard to flood-triggering precipitation, Froidevaux et al. (2015) conclude that precipitation 2 to 3 d before an event is an important determinant of flood magnitude. To account for larger catchment sizes and hence longer travel times in our study catchments, we chose a 5 d window. For snowmelt and evapotranspiration, we extend this time window to 10 d and assess the magnitude and timing of 10 d sums (Smax10 and ETmax10). We assume that in order to have substantial impact on streamflow, meteorological conditions favouring snowmelt or evapotranspiration need to prevail longer than only a few days. According to our experience, a 10 d window width provides a good estimate to assess potential impacts on streamflow.
In the case of annual maxima, we display the timing and magnitude as box plots and histograms. The length of the box plot whiskers is 1.5 times the interquartile range (IQR). However, if no data point exceeds this distance, the whiskers only reach until minimum/maximum value. The notches extend to , with n being the length of the data vector (McGill et al., 1978; R Core Team, 2019). The notches roughly represent 95 % confidence intervals for the difference in two medians. For visualisation purposes, we do not display whiskers and outliers of box plots displaying monthly maxima values. Histograms always depict the probability density and have a total area of 1. To estimate the importance of snowmelt during peak flow formation, we calculate the ratio between snowmelt in the preceding 10 d and snowmelt in the preceding 10 d plus precipitation in the preceding 5 d (Sfrac). Furthermore, we estimate evapotranspiration loss as the ratio between actual evapotranspiration in the preceding 10 d and snowmelt in the preceding 10 d plus precipitation in the preceding 5 d (ETloss). In addition, we determine mean average annual cycles of Sfrac, the average elevation of the snowmelt (Selev), the solid fraction of precipitation (Psolid) and the median average annual cycle of ETloss.
In the framework of the analysis, we focus on the three gauges: Basel, Cochem and Cologne (Fig. 3). Selected gauges and sub-basins enable a detailed insight into changes in pluvial and nival processes and changes in the main channel of the Rhine River. The gauge at Basel is located at the transition from the High to Upper Rhine. The basin upstream of the gauge at Basel encompasses large areas of high alpine character. Snowmelt during spring and early summer is an important runoff/flood-generating process (Wetter et al., 2011; Stahl et al., 2016). Runoff at the gauge at Cochem (Moselle River) is characterised by a pluvial flow regime, with high runoff during winter and low runoff during summer (Fig. 4). Flooding typically occurs in winter and early spring due to large-scale advective precipitation (Pfister et al., 2004; Bronstert et al., 2007). The gauge at Cologne is located in the Lower Rhine region after the confluences of the main tributaries Moselle, Neckar and Main (Fig. 2). Streamflow at the gauge at Cologne is characterised by a complex flow regime containing both nival and pluvial characteristics.
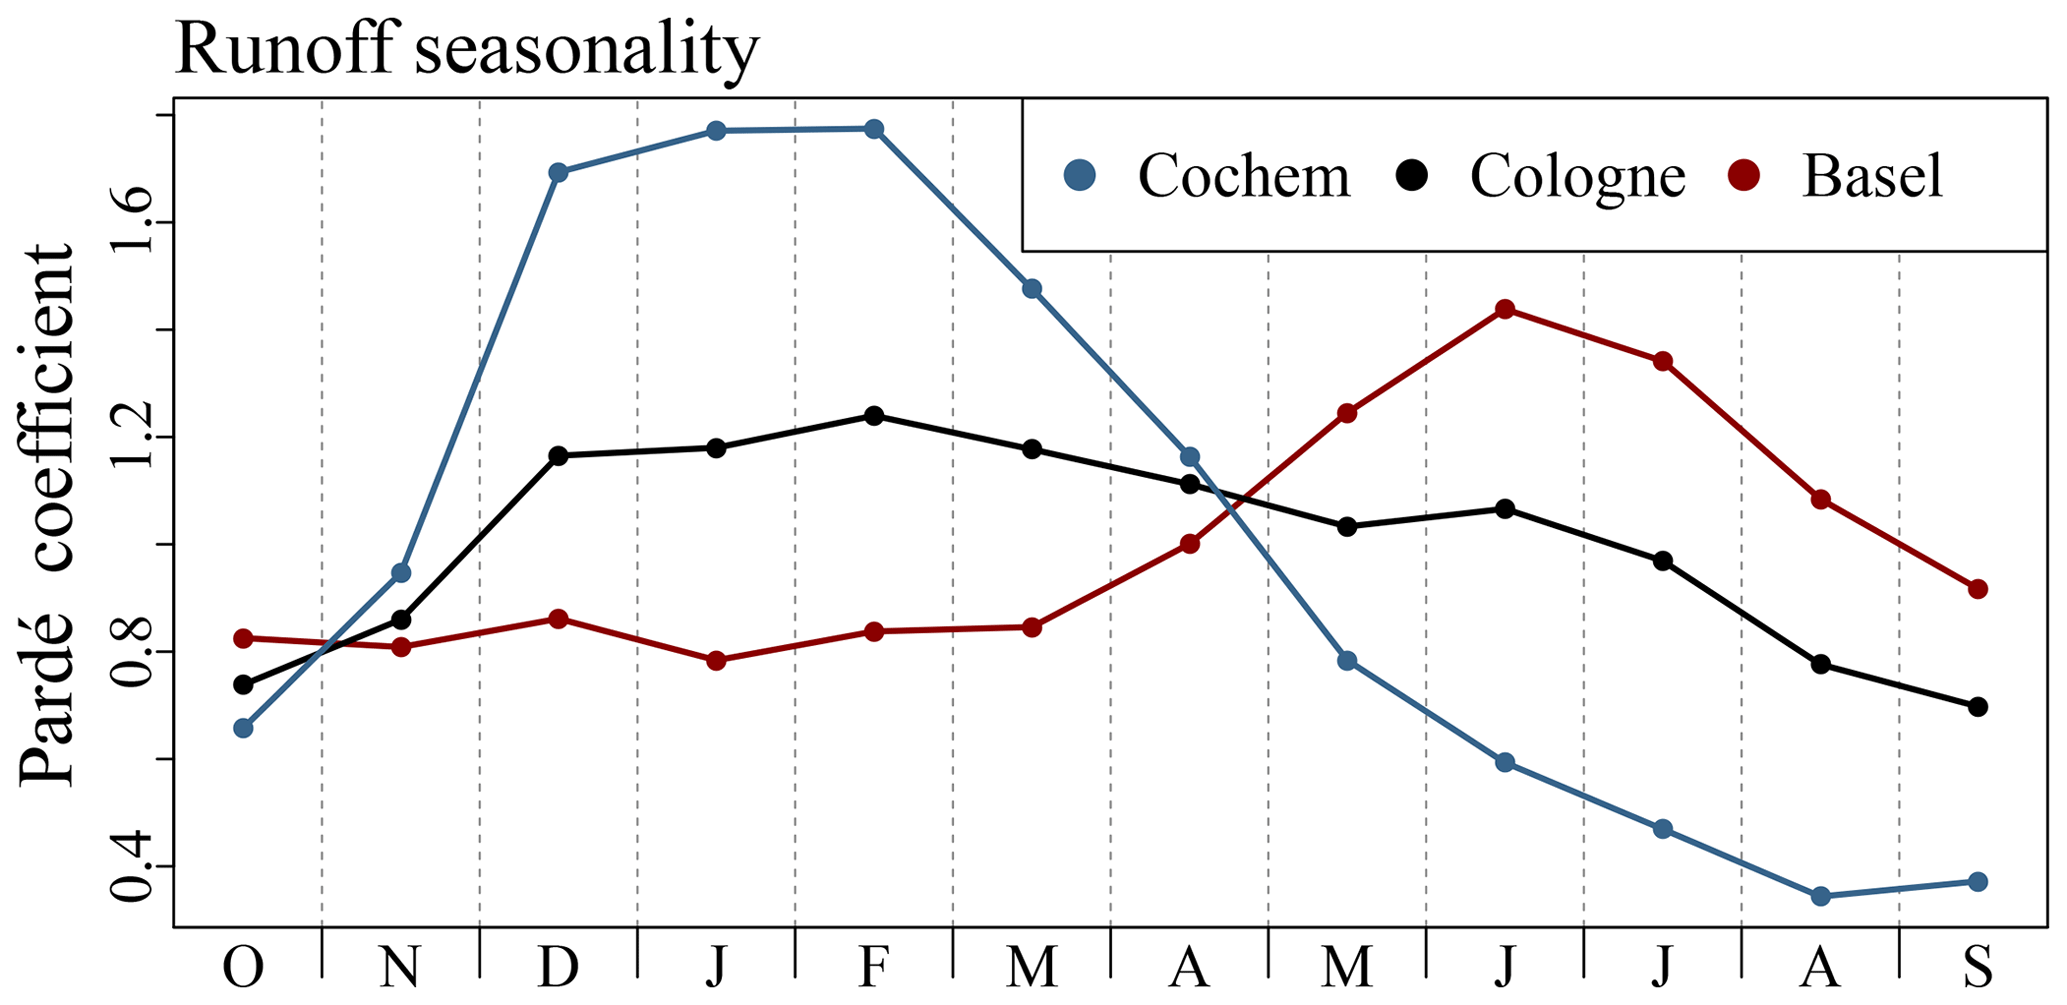
Figure 4Pardé coefficients (ratio of average monthly discharge and the mean annual discharge) (Pardé, 1933; Spreafico and Weingartner, 2005) for the gauges at Cochem, Basel and Cologne calculated based on measured discharge from the time frame 1971 to 2000.
Table 2Names/abbreviations, descriptions and units of variables investigated on sub-basin level.
3.1 Annual maxima
The magnitudes of annual streamflow maxima at the gauge at Basel increase with rising temperatures (Fig. 5a). However, this increase is not linear with the magnitude of the warming. The most prominent increase shows up between the historic time frame (1971–2000) and the 1.5 ∘C warming level. According to the model simulations, the median of annual streamflow maxima increases from 2557 m3 s−1 in the historic period to 2827 m3 s−1, supposing a warming of 1.5 ∘C. Among the different warming levels, we distinguish marginal differences (Fig. 5a). At the gauge at Basel, annual streamflow maxima occur throughout the year (Fig. 5d). In the historical period, runoff peaks cluster during spring and early summer (snowmelt season). In a warming climate, this cluster is more and more dispersed, and annual maxima are increasingly recorded during winter, in particular for the 3 ∘C warming level. At the gauge at Cochem, no clear signals of change are detected, neither for the magnitudes nor the timing of annual streamflow maxima (Fig. 5b and e). At the gauge at Cologne, streamflow maxima tend to be stronger at the selected warming levels compared to the historic time frame (Fig. 5c and f). Again, differences among warming levels are small.
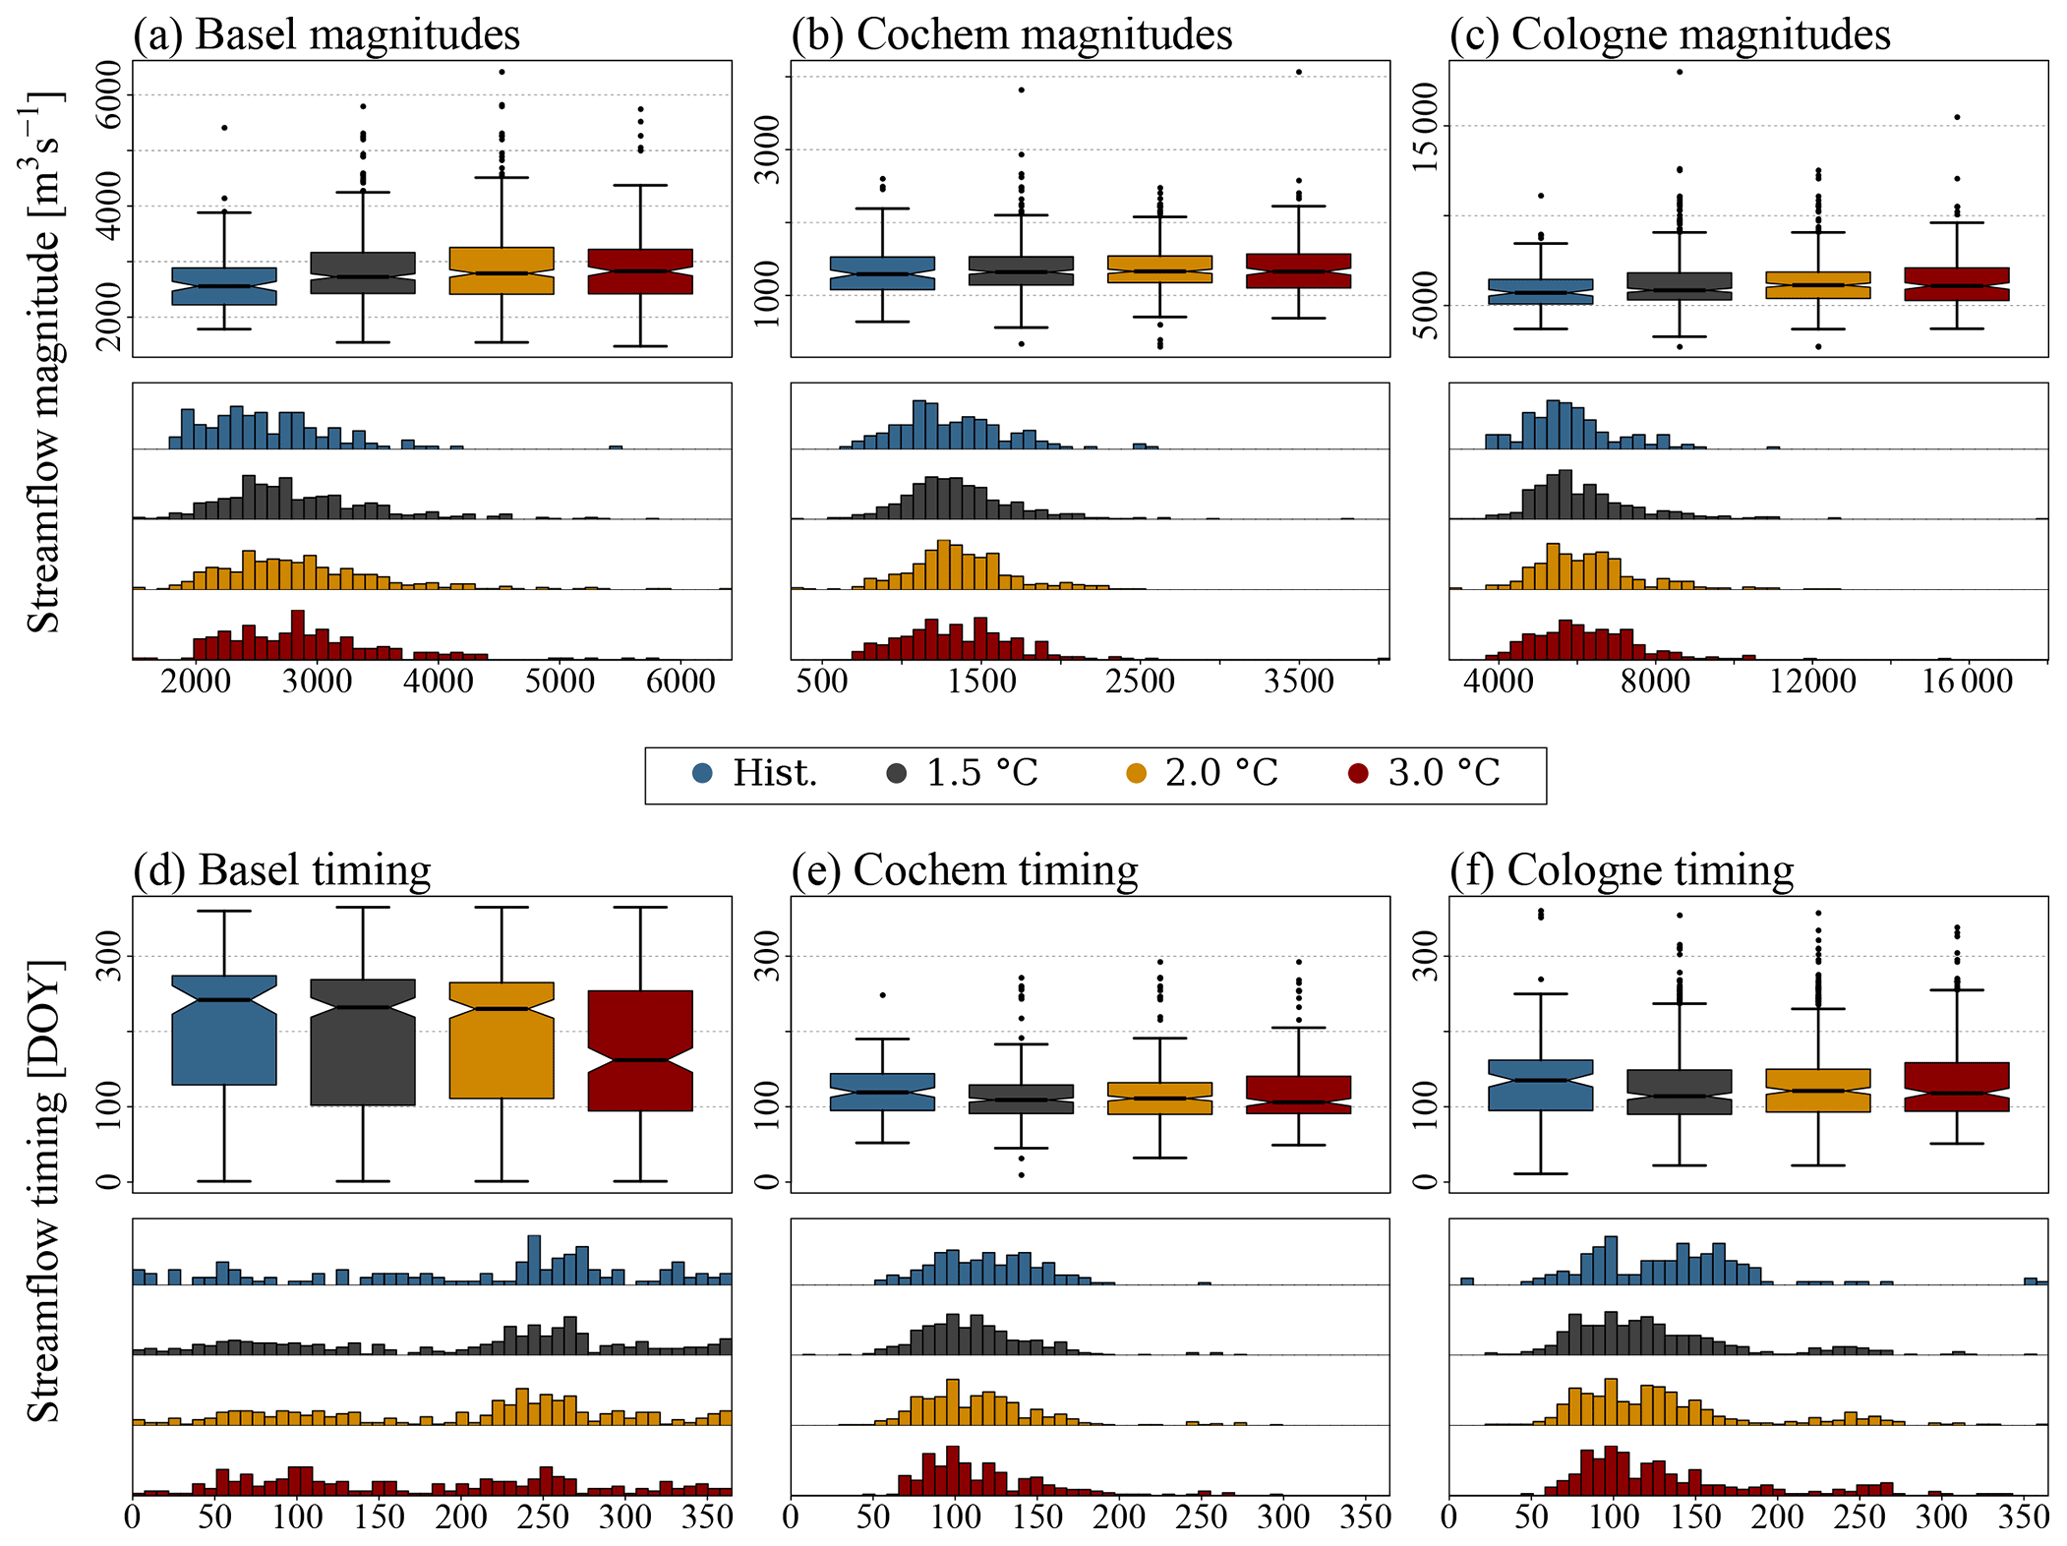
Figure 5Magnitudes and timing (hydrological year starting on 1 October) of annual streamflow maxima simulated for the gauges at Basel, Cochem and Cologne under selected warming levels (14 GCM–RCP realisations reach 1.5 ∘C, 13 reach 2 ∘C and 8 reach 3 ∘C warming) and displayed as box plots and histograms. Histograms depict probability density and have a total area of 1.
For both the gauges at Basel and Cochem, the amount of snowmelt compared to liquid precipitation during peak flow formation (Sfrac) strongly decreases with rising temperatures (Fig. 6a and b). At the gauge at Basel (Cochem), the median of Sfrac decreases from 15.7 % (23.0 %) during the historical time frame to 6.7 % (0.2 %) at a 3 ∘C warming. At a 3 ∘C warming, only 27.2 % (16.8 %) of the annual streamflow maxima have a Sfrac of more than 15 % at the gauge at Basel (Cochem). For both the gauges at Basel and Cochem, magnitudes of Smax10 diminish (Fig. 6c and d). The median of annual Smax10 for the gauge at Basel (Cochem) is around 32.6 mm (23.9 mm) in the historic time frame and is reduced to 20.6 mm (8.5 mm) at a 3 ∘C warming. At the gauge at Basel, the values of Smax10 do not only get weaker, but they also tend to be recorded earlier in the hydrological year (Fig. 6e). At the gauge at Cochem, the timing of annual 10 d snowmelt maxima (Smax10) remains unchanged (Fig. 6f). In both sub-basins, the values of liquid and total annual Pmax5 increase with rising temperatures (Fig. 6g, h, i, and j). At the gauge at Basel (Cochem), the median of liquid annual Pmax5 increases from 63.4 mm (43.9 mm) in the historic time frame to 74.4 mm (50.5 mm) at a 3 ∘C rise in temperature. The median of the estimated evaporation loss during the genesis of annual streamflow maxima (ETloss) is 21.8 % (9.2 %) at the gauge at Basel (Cochem) during the historic time period (Fig. 6k and l). At the gauge at Basel, ETloss remain fairly stable for moderate warming levels (1.5 and 2 ∘C) and strongly decreases to 15.4 mm at a 3.0 ∘C warming, as streamflow peaks more frequently are recorded during winter. At the gauge at Cochem, the median of ETloss remains almost unchanged and has a value of 9.4 % at a 3 ∘C warming. Magnitudes of annual ETmax10 increase with rising temperatures (Fig. 6m and n). At a 3 ∘C warming, the median of ETmax10 magnitudes increases by 11.7 % (6.2 %) for the gauge at Basel (Cochem) compared to the historic simulations.
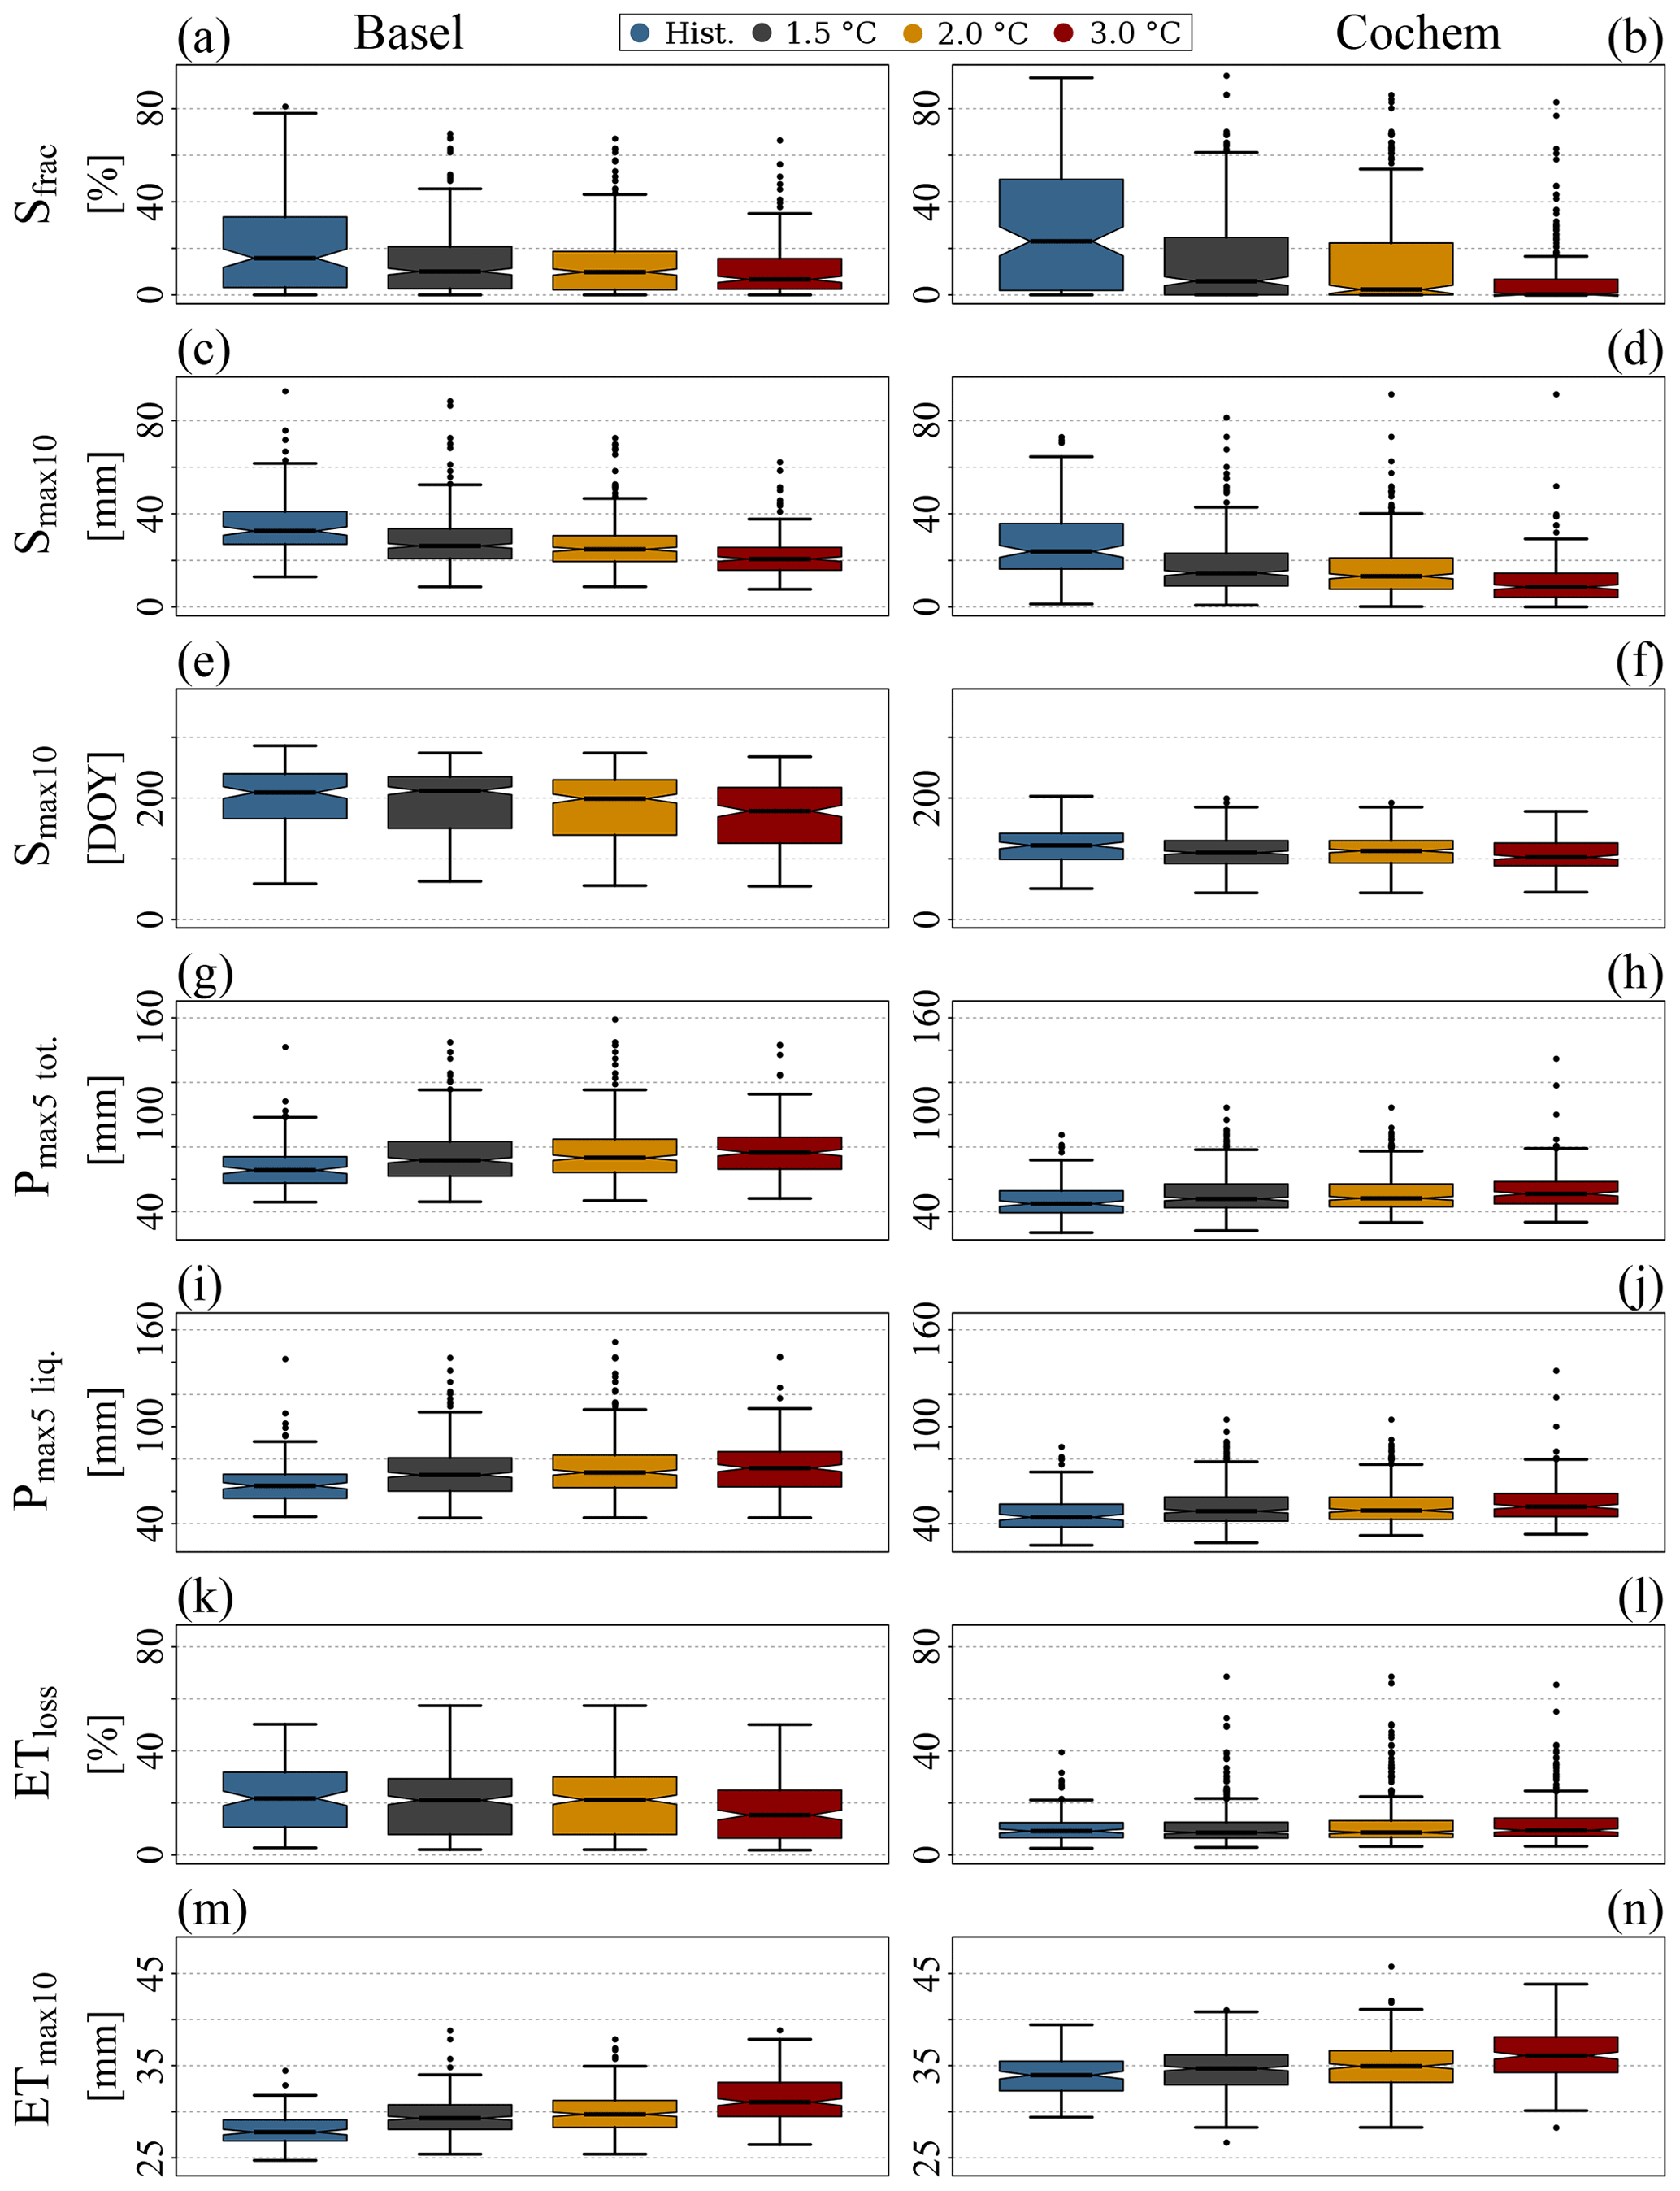
Figure 6Estimated importance of snowmelt during peak flow formation (Sfrac; a and b), magnitudes (c, d) and timing (e, f) of annual 10 d snowmelt maxima (Smax10), magnitudes of annual total (g, h) and liquid (i, j) 5 d precipitation maxima (Pmax5), estimated evapotranspiration loss during the genesis of annual streamflow maxima (ETloss; k and l) and magnitudes of annual 10 d actual evapotranspiration maxima (ETmax10; k and l) for sub-basins at Basel (left column) and Cochem (right column) under selected warming levels (14 GCM–RCP realisations reach 1.5 ∘C, 13 reach 2 ∘C and 8 reach 3 ∘C warming).
3.2 Annual cycles
At the gauge at Basel (Cochem), the solid fraction of precipitation (Psolid) reaches values of 69.9 % (43.9 %) during winter in the historic time frame (Fig. 7a and b). Our results indicate that at a 3 ∘C warming, on average, the fraction of solid precipitation will be reduced to less than 40 % (17 %) at the gauge at Basel (Cochem) in winter. At the gauge at Basel, the snowmelt fraction (Sfrac) reaches values up to 40 % during winter, spring and early summer (Fig. 7c). Strongest decreases in Sfrac show up in summer (Fig. 7c). In the Moselle catchment at the gauge at Cochem, Sfrac values strongly decrease during the cold season (Fig. 7d). Upstream of Basel, the average melt elevation (Selev) is moving up the elevation range throughout the year (Fig. 7e). On average, Selev is 359 m higher at 3 ∘C warming compared to the historic time period. At the gauge at Cochem, Selev is restricted to elevations below 1100 m (Fig. 7f). Simulation results hint at higher Selev, particularly at the beginning and end of the snow season. However, changes are less prominent compared to changes detected at the gauge at Basel. At the gauge at Basel, the estimated average evapotranspiration loss (ETloss) is below 100 % almost throughout the whole year (Fig. 7g). Only during summer months and more frequently with stronger warming do the values of ETloss reach above 100 %. At the gauge at Cochem, the values of ETloss are below 100 % between October and March (Fig. 7h). During the course of the summer, the average values of ETloss can reach up to almost 400 %.
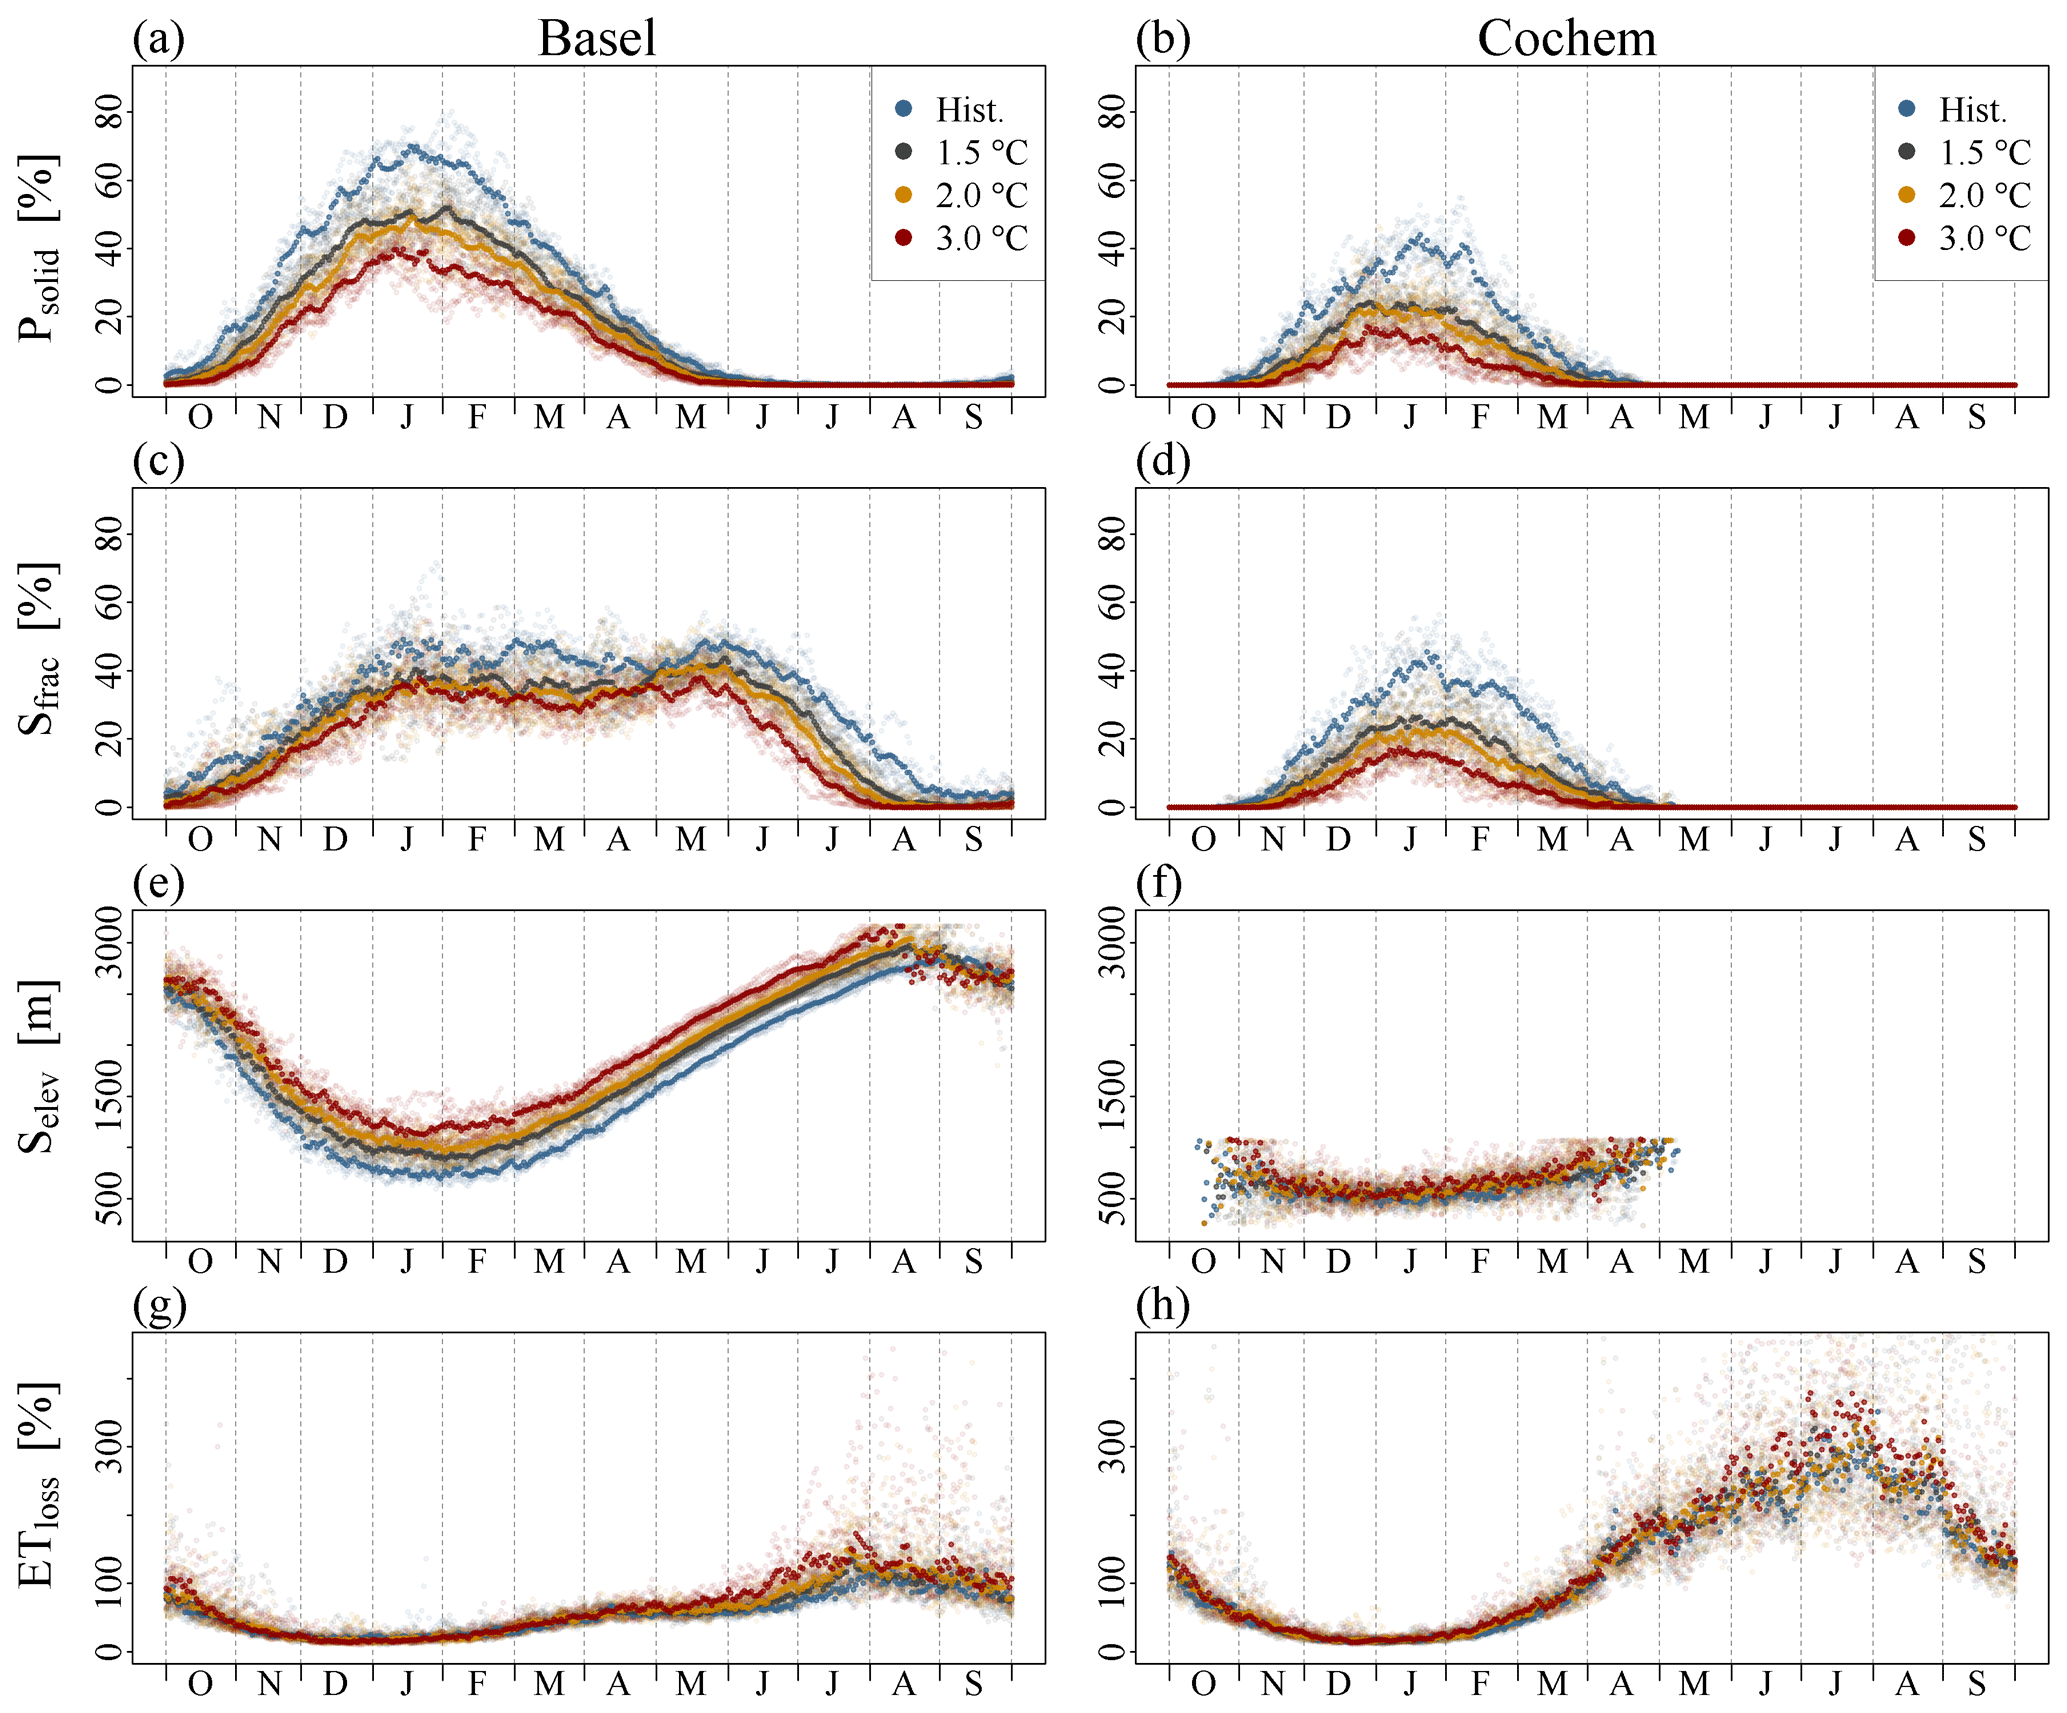
Figure 7Mean annual cycles of the fraction of solid precipitation (Psolid; a and b), estimated importance of snowmelt compared to liquid precipitation (Sfrac; c and d), average elevation of snowmelt (Selev; e and f) and estimated evapotranspiration loss (ETloss; g and h) for sub-basins at Basel and Cochem under selected warming levels (14 GCM–RCP realisations reach 1.5 ∘C, 13 reach 2 ∘C and 8 reach 3 ∘C warming).
3.3 Monthly maxima
At the gauge at Basel, monthly streamflow maxima generally increase during winter and decrease in late summer (Fig. 8a). Streamflow maxima in May and June seem to increase in magnitude at the more moderate warming levels (up to a warming of 2 ∘C) and decrease as warming progresses. A similar pattern of initial increases in monthly maxima and a subsequent stabilisation or even a decrease at higher warming levels shows up in December and January at the gauge at Cochem (Fig. 8b) and in all winter months at the gauge at Cologne (Fig. 8c). In general, patterns of change in monthly streamflow maxima at the gauge at Cologne seem to reflect an overlap of features visible at the gauges at Basel and Cochem.
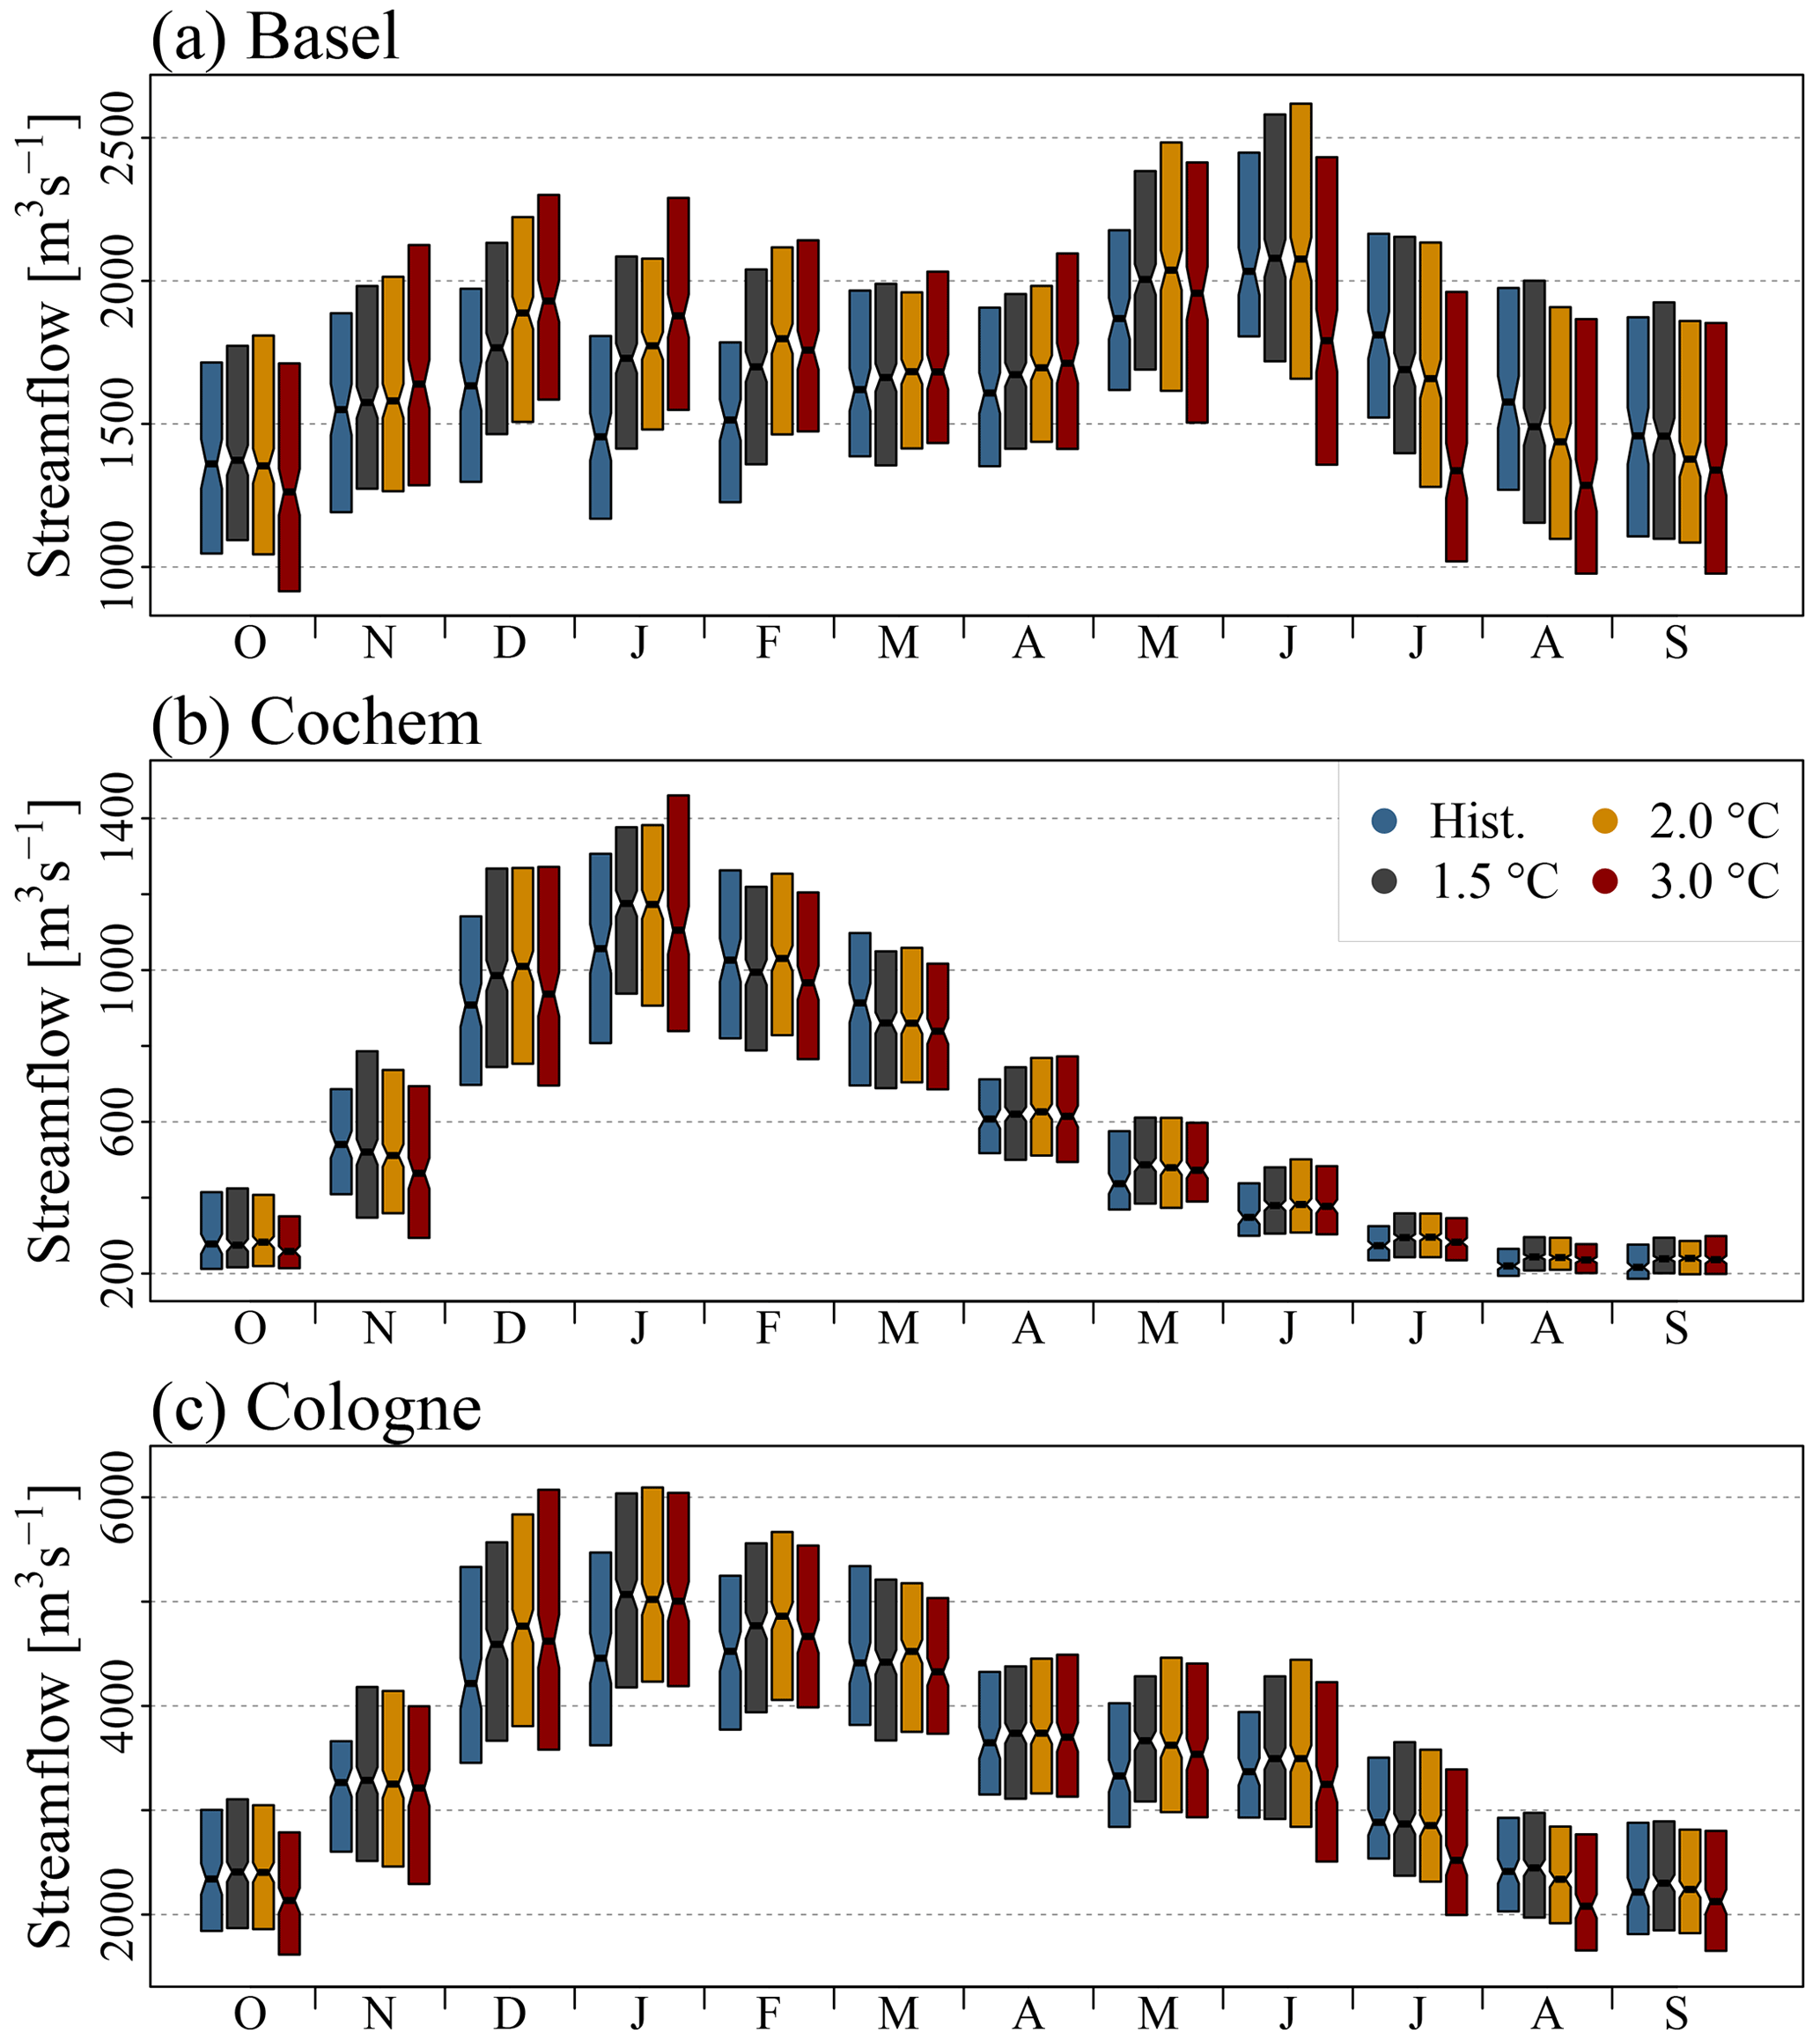
Figure 8Magnitudes of monthly streamflow maxima simulated for the gauges at (a) Basel, (b) Cochem and (c) Cologne under selected warming levels (14 GCM–RCP realisations reach 1.5 ∘C, 13 reach 2 ∘C and 8 reach 3 ∘C warming). Whiskers and outliers of the box plots are not displayed.
At the gauge at Basel, magnitudes of Smax10 remain fairly stable during winter (Fig. 9a). Strong decreases in Smax10 show up in spring and are most pronounced from May to July. In the Moselle catchment at the gauge at Cochem, values of Smax10 strongly decrease throughout the cold season (Fig. 9b). Values of Pmax5 tend to increase throughout the year (Fig. 9c, d, e and f). In the Moselle catchment, no big differences between changes in liquid and total Pmax5 are detected. In the Rhine Basin upstream of the gauge at Basel, rising temperatures seem to cause changes from solid to liquid precipitation, which enhance the overall increase in 5 d precipitation sums, particularly in the cold season (Fig. 9c and e). Our model simulation suggests that evapotranspiration only plays a minor role in the Rhine Basin during winter (Fig. 9g and h). We detect the highest values of ETmax10 reaching up to 35 mm for the sub-basin at Cochem during summer. Values of ETmax10 increase with rising temperatures.
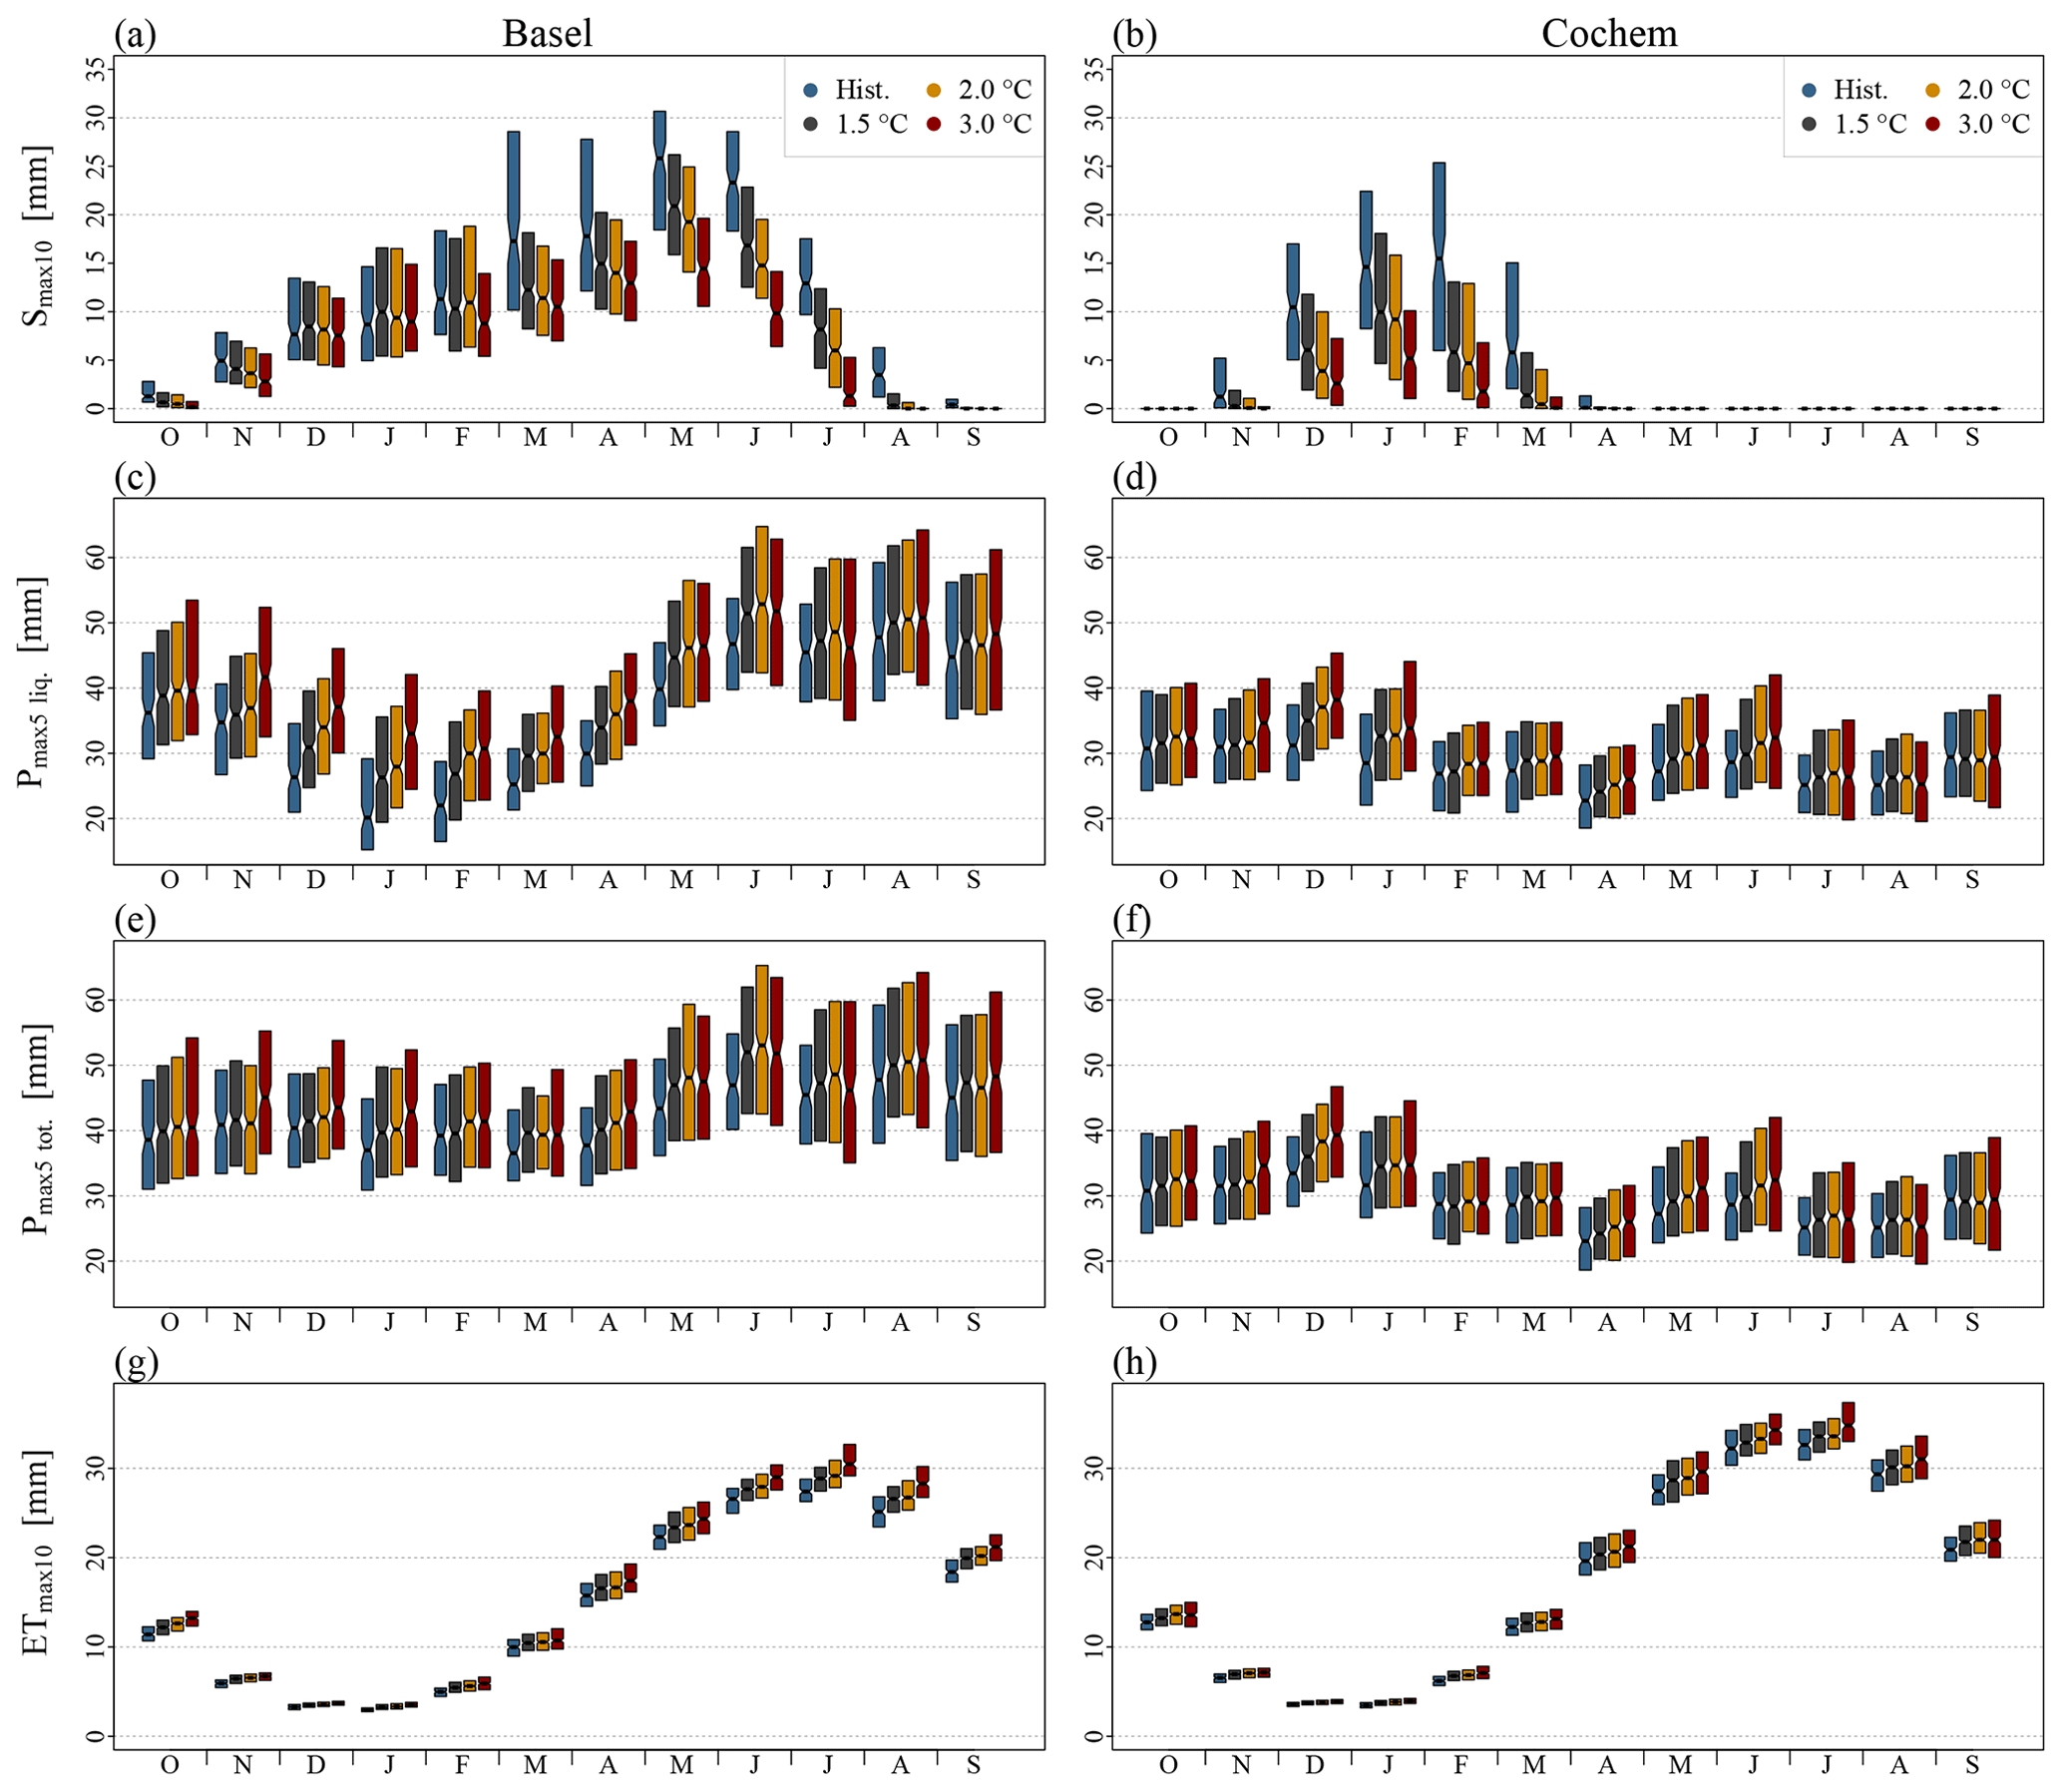
Figure 9Magnitudes of 10 d snowmelt maxima (Smax10; a and b), liquid (c, d) and total (e, f) 5 d precipitation (Pmax5) and 10 d actual evapotranspiration maxima (ETmax10; g and h) for sub-basins at Basel and Cochem under selected warming levels (14 GCM–RCP realisations reach 1.5 ∘C, 13 reach 2 ∘C and 8 reach 3 ∘C warming). Whiskers and outliers of the box plots are not displayed.
Rising temperatures diminish seasonal snow cover (see also Bavay et al., 2009; Rousselot et al., 2012; Schmucki et al., 2015; Beniston et al., 2018). As a result, the importance of snowmelt as a flood-generating process decreases (Fig. 6a, b, c and d). In the Rhine Basin at Basel, 10 d snowmelt maxima (Smax10) decrease for all months of spring and summer (Fig. 8a). At no point in time during the snowmelt season does a warming climate result in an increase in risk of snowmelt-driven flooding. Our results indicate that the detected earlier timing of the annual snowmelt maxima (Fig. 6e) is not due to an increase in snowmelt magnitudes earlier in the year. It rather seems that events early in the snowmelt season, even if weakened by rising temperatures, more often are the strongest of the year already, as snowpacks are increasingly depleted within the course of the snowmelt season. For the basin at Basel, we can not find indications that an earlier snowmelt due to rising temperatures shifts the risk of snowmelt-driven flooding forward in time. Despite the temporal shift forward of annual snowmelt maxima, flood hazard seems to decrease, as the temporal shift concurs with a strong decrease in snowmelt magnitudes (Fig. 6c). Our findings agree with results from Musselman et al. (2017), who suggest that a “shallower snowpack melts earlier, and at lower rates, than deeper, later-lying snow cover”. However, the disappearance of snowpacks and glaciers is likely to favour low-flow conditions along the Rhine River (Junghans et al., 2011; Stahl et al., 2016). Another factor having the potential to initiate or reinforce the low-flow situation is increasing values of evapotranspiration, particularly during summer (Fig. 9g and h).
Our results indicate that at Basel during winter, the lack of snowmelt from lower elevations, at least partly, is compensated for by snowmelt from areas located at higher elevations (Rottler et al., 2021) (Figs. 7c and e and 9a). This compensation effect seems to be increasingly insufficient as the snowmelt season progresses and the snowline moves upward. We suggest that in winter, the almost unchanged potential of snowmelt-induced runoff at Basel encounters increased antecedent precipitation (Fig. 9c), in turn resulting in a strong increase in streamflow maxima (Fig. 8a). The next step to improve the representation of snow accumulation and melt in the model set-up is the usage of satellite-based snow cover maps in a multi-criteria calibration and/or for an independent validation of the snow routine.
Our results confirm previous studies suggesting that rising temperatures might lead to stronger precipitation events (e.g. Lehmann et al., 2015; Alfieri et al., 2015; King and Karoly, 2017; Bürger et al., 2019; Rottler et al., 2020) (Figs. 6g–j and 9c–f) and a shift from solid to liquid rainfall (e.g. Allamano et al., 2009; Addor et al., 2014; Davenport et al., 2020) (Fig. 7a and b). In catchments that have mixed hydrological regimes with rainfall and snowmelt, rising temperatures seem to lead to a shift from snowmelt to rainfall as the most important flood-generating process (Vormoor et al., 2015, 2016). Reconstructing the largest floods in the High Rhine since 1268, Wetter et al. (2011) indicate that about half of all large events occurred during summer due to heavy precipitation combined with high baseflow from snowmelt and ice melt. Our results indicate that with rising temperatures, most flood events will occur in winter (Fig. 5d).
In March and April, the increase in rainfall amounts in the basin at Basel compares to increases in winter; the magnitudes of streamflow maxima, however, hardly change (Fig. 8a). We suggest that the increasing potential of rainfall-induced flooding is counterbalanced by decreasing snowmelt (Fig. 9a and c). Furthermore, our results hint at a transient increase in flood magnitudes during May and June (Fig. 8a). It seems that during those 2 months, snowmelt is still strong enough to support an increase in streamflow peaks due to increased antecedent precipitation at moderate warming levels (1.5 and 2.0 ∘C). With further rising temperatures, however, the magnitudes of streamflow maxima reduce along with declining snowmelt (Fig. 8a). The mHM model set-up that we use to simulate the Rhine River does not include a lake module. The simulation results attained for the Rhine Basin, particularly for the gauge at Basel, can be further refined by the representation of the large lakes located in Switzerland and southern Germany (Imhoff et al., 2020). The large storage volume and the possibility to regulate lake levels dampen streamflow peaks.
For the gauge at Cochem and the associated sub-basin of the Moselle River, we detect similar counterbalancing effects between snowmelt and rainfall: an increasing flood potential due to increased precipitation amounts encounters declining snowpacks. Again, decreases in snowmelt magnitudes seem to counterbalance increased precipitation, resulting in comparatively small and transient increases in streamflow maxima (Figs. 8b and 9b and d). As the highest mountains in the sub-basin only reach up to around 1300 m a.s.l., snowmelt compensation effects, i.e. snowmelt from higher elevations, at least partly, replacing the lack of snowmelt from lower elevation, only play a marginal role. Analysing changes in frequencies of rain-on-snow (RoS) events with flood-generating potential for large parts of Europe for the historic time frame 1950–2011, Freudiger et al. (2014) hint at similar processes changing flood hazard. Their analyses suggest an increase in flood hazard from RoS events in medium-elevation mountain ranges in the Rhine River basin in winter due to increased rainfall and a decrease in RoS events in spring due to decreases in snow cover. Although important Rhine tributaries, such as the Moselle River, often are characterised as pluvial-type rivers, the importance of snowmelt as a runoff component must not be underestimated. Simulating the Rhine River for the time frame 1901–2006, Stahl et al. (2016) suggest that at the gauge at Cochem, 26 % of the annual streamflow originates from snowmelt. During winter, this fraction increases up to almost 40 % (see also Fig. 7b). However, the inter-annual variability of annual streamflow and the relative fractions of streamflow components is high, particularly in pluvial-type tributaries of the Rhine River (Stahl et al., 2016). The simple estimate Sfrac, which is based on the amount of snowmelt and liquid precipitation, provides the first-order approximation of future changes in the importance of snowmelt during peak flow formation and as a streamflow component. However, to correctly quantify changes in streamflow components, the coupling of simulations to a streamflow component model is required (Stahl et al., 2016; Weiler et al., 2018).
In Cologne, which is located at the main stream after the confluence of all major tributaries, signals emerging from the different sub-basins overlap. Accordingly, we detect increases in runoff peaks during winter (Fig. 8c). Detected increases seem to level off as temperatures continue to rise beyond the 2 ∘C warming level. We do not find indications supporting the hypothesis describing the creation of a new flood type in the Rhine River basin due to a transient merging of nival and pluvial flood types. We detect counterbalancing effects between changes in snowmelt and precipitation within the sub-basins. Rising temperatures strongly reduce snowfall, snow accumulation and the snow volume available for melt. The reduction in snowmelt during flood genesis seems to impede the increase in streamflow peaks due to increases in antecedent precipitation. Caution has to be exercised labelling basins such as the Moselle catchment as pluvial-type or the Rhine Basin at Basel as nival-type. In both sub-basins, snowmelt and precipitation are important factors for flood generation. In the framework of this study, we mostly focus on changes in streamflow seasonality and analyse average changes in streamflow-generating mechanisms. A detailed analysis of isolated extremes simulated is still pending.
We investigate changes in flood seasonality in the Rhine River basin under 1.5, 2.0 and 3.0 ∘C warming using the spatially distributed hydrologic model mHM. In order to improve our understanding of changes in rainfall- and snowmelt-driven runoff, we carried out a detailed inspection of the Rhine River basin at Basel and the Moselle River basin at Cochem. We detect significant changes in both rainfall- and snowmelt-driven runoff peaks. Rising temperatures deplete seasonal snowpacks. As a consequence, the importance of snowmelt as a flood-generating process diminishes. At no time during the year does a warming climate result in an increase in the risk of snowmelt-driven flooding. Furthermore, solid precipitation (snowfall) strongly decreases during winter. The shift from solid to liquid precipitation further enhances the overall increase in antecedent precipitation.
Our results indicate that in order to understand changes in annual and monthly streamflow maxima, the examination of counterbalancing effects between changes in snowmelt- and rainfall-driven runoff is crucial. We suggest that future changes in flood characteristics in the Rhine River basin are controlled by increased precipitation amounts on the one hand and reduced snowmelt on the other hand. The nature of their interaction defines the type of change in runoff peaks. In the case of the Moselle River, increased rainfall amounts during winter, at least partly, are counterbalanced by reduced snowmelt contribution to the streamflow peaks, resulting in only small or transient changes. In the Rhine Basin at Basel, strong increases in antecedent liquid precipitation encounter almost unchanged snowmelt-driven runoff during winter. Hence, streamflow maxima increase strongly. During May and June, our results hint at a transient increase in streamflow magnitudes at the gauge at Basel (Fig. 8a). It seems that snowmelt is still strong enough to support an increase in streamflow peaks due to increased antecedent precipitation at moderate warming levels (1.5 and 2.0 ∘C). With further rising temperatures, however, the magnitudes of streamflow maxima reduce, along with declining snowmelt (Fig. 8a). In addition to a strong decline in snowpacks in the Alps, we detect an upward movement of the snowmelt elevation. It seems that during winter, snowmelt from higher elevations, at least partly, can replace snowmelt from elevations below (Rottler et al., 2021). Our findings confirm previous investigations suggesting a shift from snowmelt to precipitation as the most important flood-generating mechanism (Vormoor et al., 2015, 2016). We can not find indications of a transient merging of pluvial and nival flood types in the Rhine Basin.
The understanding of future changes in flood characteristics along the Rhine River and its tributaries is of great importance for water resources and flood management. Within this study, some progress has been made in assessing the importance of rainfall and snowmelt as flood-generating processes under different warming levels. However, only further studies pursuing the improvement of meteorological input data and hydrological modelling can ensure a comprehensive understanding of future flood characteristics in the Rhine River. The next steps could be the implementation and validation of a physically based snow routine and a glacier module in mHM in order to substantiate our current results regarding the relevance of snowmelt magnitude and timing for the generation of Rhine floods. The usage of satellite-based snow cover maps during model calibration and/or validation might further improve the simulation of the snow cover dynamics. A streamflow component model enabling the tracing of river-flow-originating processes (e.g. Stahl et al., 2016) might ameliorate the understanding of snowmelt and rainfall as flood-generating processes at different Rhine gauges. Furthermore, the representation of lakes (e.g. Imhoff et al., 2020) and reservoirs and their management might improve streamflow simulations, particularly during low-flow conditions.
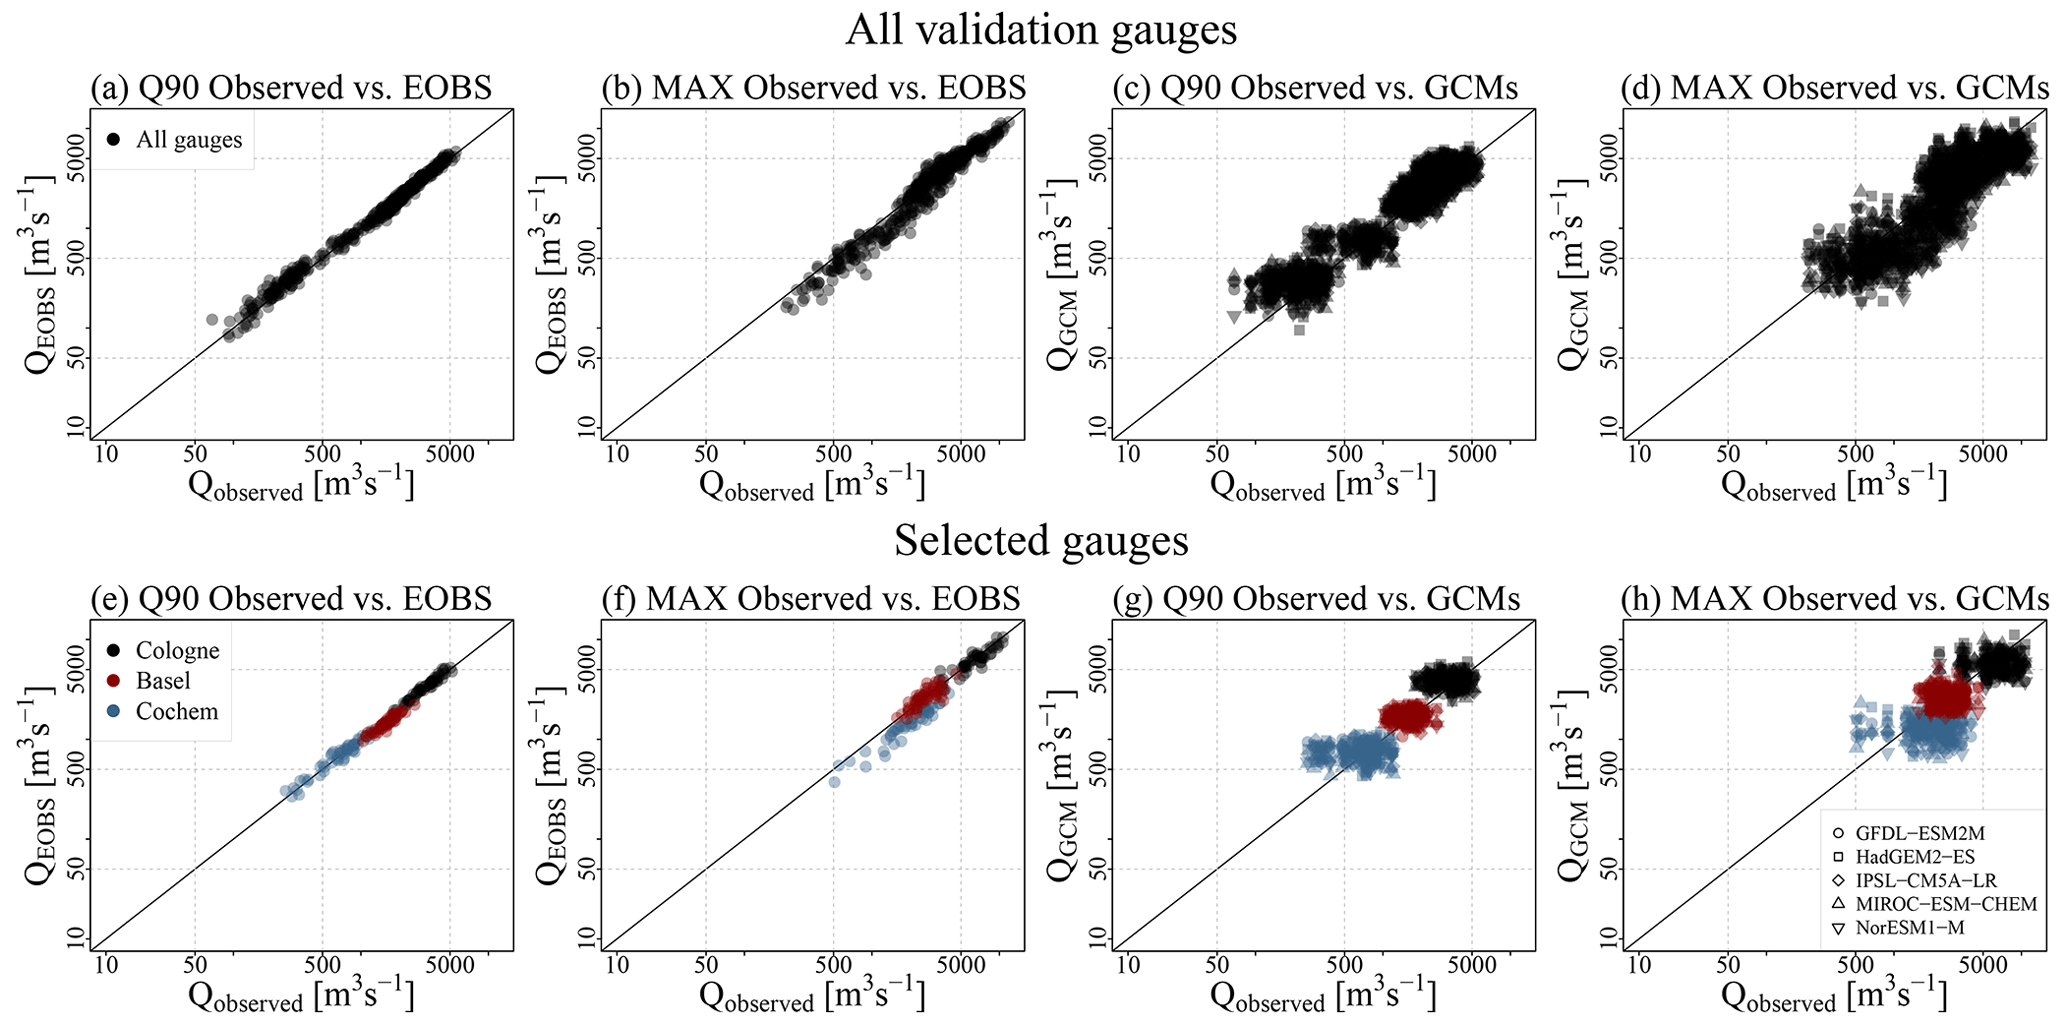
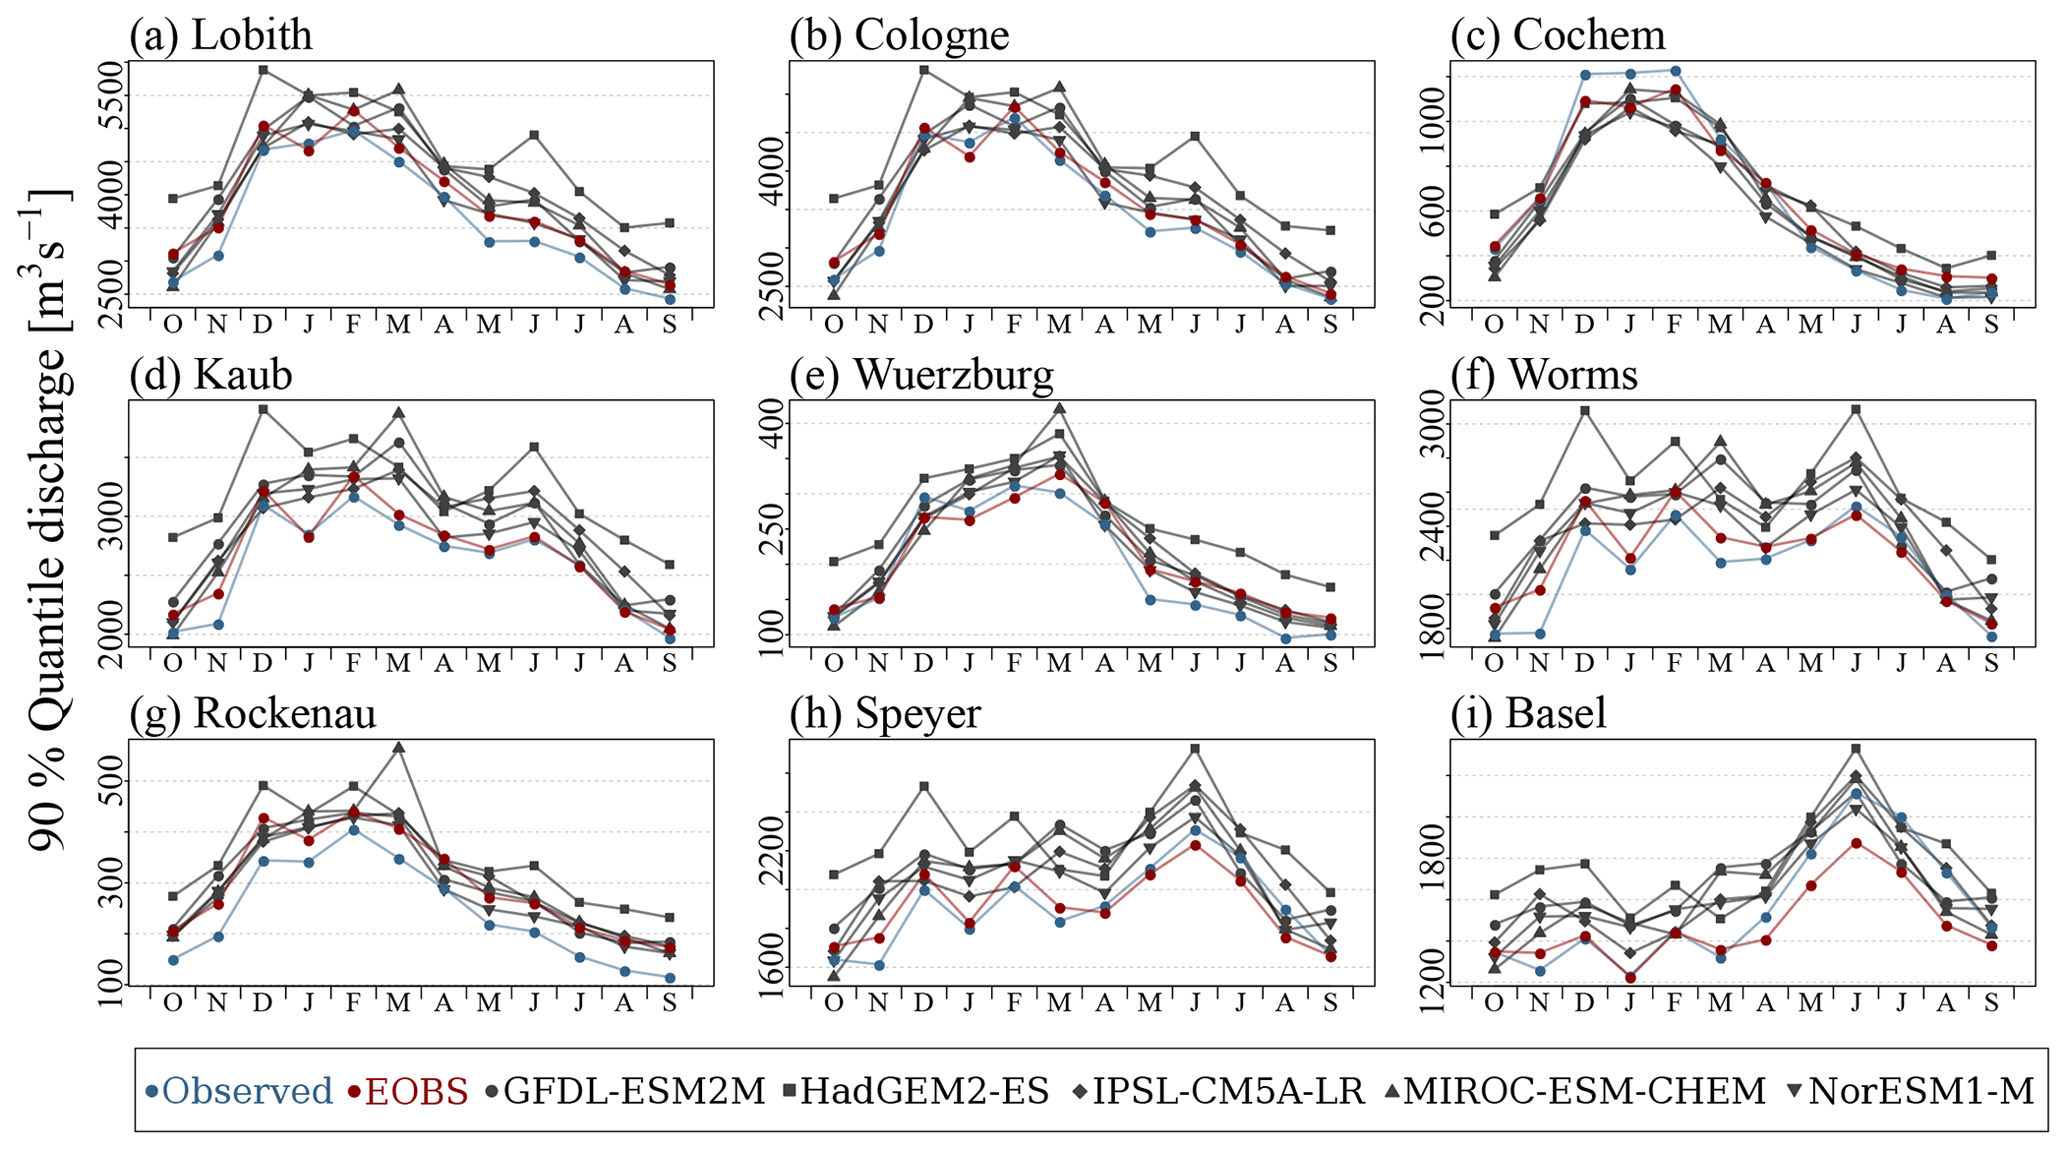
Figure A1Scatter plot of observed and simulated annual streamflow maxima (MAX) and the 90 % streamflow quantile (Q90) of the hydrological year starting 1 October for all validation gauges (a–d; Fig. 2) and for selected gauges (e–h). Panels (a), (b), (e) and (f) depict observed discharge and simulated discharge using E-OBS-based meteorological forcing. Panels (c), (d), (g) and (h) depict observed discharge and simulated discharge using climate model data from the ISI-MIP project. Time frame investigated: 1951–2000.
Source code of the hydrologic model mHM v.5.10 can be accessed at https://doi.org/10.5281/zenodo.3239055 (Samaniego et al., 2019a). R-scripts used to analyse simulation results are available at https://doi.org/10.5281/zenodo.4724950 (Rottler, 2021). Discharge data can be requested from the Global Runoff Data Centre (GRDC), 56068 Koblenz, Germany. Further data sets used can be made available upon request.
ER conducted the analysis and wrote the manuscript. AB, GB and OR provided support and guidance in the process of the model set-up, data analysis and preparation of the manuscript.
The authors declare that they have no conflict of interest.
We acknowledge the data sets generated in the EDgE proof-of-concept project performed under a contract for the Copernicus Climate Change Service (http://edge.climate.copernicus.eu, last access: 8 October 2020). ECMWF implements this service and the Copernicus Atmosphere Monitoring Service on behalf of the European Commission. We acknowledge EDgE colleagues Luis Samaniego, Rohini Kumar and Stephan Thober for establishing the mHM model set-up and performing the downscaling of the CMIP5 data sets. We acknowledge the E-OBS data set from the EU FP6 project ENSEMBLES (http://ensembles-eu.metoffice.com, last access: 28 April 2021) and the data providers of the ECA&D project (http://www.ecad.eu, last access: 28 April 2021). We acknowledge the ISI-MIP project for providing the bias-corrected CMIP5 climate model data. The Copernicus Land Monitoring Service, implemented by the European Environmental Agency, provided the European Digital Elevation Model (EU-DEM), version 1.1. We also acknowledge the HOKLIM project (https://www.ufz.de/hoklim, last access: 28 April 2021) by the German Ministry for Education and Research (grant no. 01LS1611A). We also thank various other organisations and projects for providing data used in this study, including JRC, ESA, NASA, USGS, GRDC, BGR, UNESCO, ISRIC and EEA. We thank the editor and four anonymous reviewers for their constructive comments, which improved the quality of the manuscript. We acknowledge the support of the Open Access Publishing Fund of the University of Potsdam.
This research has been supported by the Deutsche Forschungsgemeinschaft (grant no. GRK 2043/1-P2).
This paper was edited by Markus Weiler and reviewed by four anonymous referees.
Addor, N., Rössler, O., Köplin, N., Huss, M., Weingartner, R., and Seibert, J.: Robust changes and sources of uncertainty in the projected hydrological regimes of Swiss catchments, Water Resour. Res., 50, 7541–7562, https://doi.org/10.1002/2014WR015549, 2014. a, b
Alfieri, L., Burek, P., Feyen, L., and Forzieri, G.: Global warming increases the frequency of river floods in Europe, Hydrol. Earth Syst. Sci., 19, 2247–2260, https://doi.org/10.5194/hess-19-2247-2015, 2015. a, b, c
Allamano, P., Claps, P., and Laio, F.: Global warming increases flood risk in mountainous areas, Geophys. Res. Lett., 36, L24404, https://doi.org/10.1029/2009GL041395, 2009. a
Barnett, T. P., Adam, J. C., and Lettenmaier, D. P.: Potential impacts of a warming climate on water availability in snow-dominated regions, Nature, 438, 303–309, https://doi.org/10.1038/nature04141, 2005. a
Bavay, M., Lehning, M., Jonas, T., and Löwe, H.: Simulations of future snow cover and discharge in Alpine headwater catchments, Hydrol. Process., 23, 95–108, https://doi.org/10.1002/hyp.7195, 2009. a
Belz, J. U., Brahmer, G., Buiteveld, H., Engel, H., Grabher, R., Hodel, H., Krahe, P., Lammersen, R., Larina, M., Mendel, H.-G., Meuser, A., Müller, G., Plonka, B., Pfister, L., and van Vuuren, W.: Das Abflussregime Des Rheins Und Seiner Nebenflüsse Im 20. Jahrhundert, Analyse, Veränderungen Und Trends, Tech. Rep. Bericht Nr. I-22, Internationale Kommission fur die Hydrologie des Rheingebietes (KHR), Lelystad, Netherlands, 2007. a, b
Beniston, M.: Impacts of climatic change on water and associated economic activities in the Swiss Alps, J. Hydrol., 412-413, 291–296, https://doi.org/10.1016/j.jhydrol.2010.06.046, 2010, 2012. a
Beniston, M., Farinotti, D., Stoffel, M., Andreassen, L. M., Coppola, E., Eckert, N., Fantini, A., Giacona, F., Hauck, C., Huss, M., Huwald, H., Lehning, M., López-Moreno, J.-I., Magnusson, J., Marty, C., Morán-Tejéda, E., Morin, S., Naaim, M., Provenzale, A., Rabatel, A., Six, D., Stötter, J., Strasser, U., Terzago, S., and Vincent, C.: The European mountain cryosphere: a review of its current state, trends, and future challenges, The Cryosphere, 12, 759–794, https://doi.org/10.5194/tc-12-759-2018, 2018. a, b, c
Berghuijs, W. R., Harrigan, S., Molnar, P., Slater, L. J., and Kirchner, J. W.: The Relative Importance of Different Flood-Generating Mechanisms Across Europe, Water Resour. Res., 55, 4582–4593, https://doi.org/10.1029/2019WR024841, 2019. a
Bertola, M., Viglione, A., Lun, D., Hall, J., and Blöschl, G.: Flood trends in Europe: are changes in small and big floods different?, Hydrol. Earth Syst. Sci., 24, 1805–1822, https://doi.org/10.5194/hess-24-1805-2020, 2020. a
Blenkinsop, S. and Fowler, H. J.: Changes in European drought characteristics projected by the PRUDENCE regional climate models, Int. J. Climatol., 27, 1595–1610, https://doi.org/10.1002/joc.1538, 2007. a
Blöschl, G., Hall, J., Viglione, A., Perdigão, R. A. P., Parajka, J., Merz, B., Lun, D., Arheimer, B., Aronica, G. T., Bilibashi, A., Boháč, M., Bonacci, O., Borga, M., Čanjevac, I., Castellarin, A., Chirico, G. B., Claps, P., Frolova, N., Ganora, D., Gorbachova, L., Gül, A., Hannaford, J., Harrigan, S., Kireeva, M., Kiss, A., Kjeldsen, T. R., Kohnová, S., Koskela, J. J., Ledvinka, O., Macdonald, N., Mavrova-Guirguinova, M., Mediero, L., Merz, R., Molnar, P., Montanari, A., Murphy, C., Osuch, M., Ovcharuk, V., Radevski, I., Salinas, J. L., Sauquet, E., Šraj, M., Szolgay, J., Volpi, E., Wilson, D., Zaimi, K., and Živković, N.: Changing climate both increases and decreases European river floods, Nature, 573, 108–111, https://doi.org/10.1038/s41586-019-1495-6, 2019. a
Bronstert, A., Bárdossy, A., Bismuth, C., Buiteveld, H., Disse, M., Engel, H., Fritsch, U., Hundecha, Y., Lammersen, R., Niehoff, D., and Ritter, N.: Multi-scale modelling of land-use change and river training effects on floods in the Rhine basin, River Res. Appl., 23, 1102–1125, https://doi.org/10.1002/rra.1036, 2007. a, b
Brunner, M. I., Farinotti, D., Zekollari, H., Huss, M., and Zappa, M.: Future shifts in extreme flow regimes in Alpine regions, Hydrol. Earth Syst. Sci., 23, 4471–4489, https://doi.org/10.5194/hess-23-4471-2019, 2019. a
Brunner, M. I., Gilleland, E., Wood, A., Swain, D. L., and Clark, M.: Spatial Dependence of Floods Shaped by Spatiotemporal Variations in Meteorological and Land-Surface Processes, Geophys. Res. Lett., 47, e2020GL088000, https://doi.org/10.1029/2020GL088000, 2020a. a
Brunner, M. I., Melsen, L. A., Newman, A. J., Wood, A. W., and Clark, M. P.: Future streamflow regime changes in the United States: assessment using functional classification, Hydrol. Earth Syst. Sci., 24, 3951–3966, https://doi.org/10.5194/hess-24-3951-2020, 2020b. a
Bürger, G., Pfister, A., and Bronstert, A.: Temperature-Driven Rise in Extreme Sub-Hourly Rainfall, J. Climate, 32, 7597–7609, https://doi.org/10.1175/JCLI-D-19-0136.1, 2019. a
Crozier, M. J.: Deciphering the effect of climate change on landslide activity: A review, Geomorphology, 124, 260–267, https://doi.org/10.1016/j.geomorph.2010.04.009, 2010. a
Dankers, R. and Feyen, L.: Climate change impact on flood hazard in Europe: An assessment based on high-resolution climate simulations, J. Geophys. Res.-Atmos., 113, D19105, https://doi.org/10.1029/2007JD009719, 2008. a
Davenport, F. V., Herrera-Estrada, J. E., Burke, M., and Diffenbaugh, N. S.: Flood Size Increases Nonlinearly Across the Western United States in Response to Lower Snow-Precipitation Ratios, Water Resour. Res., 56, e2019WR025571, https://doi.org/10.1029/2019WR025571, 2020. a
Della-Marta, P. M., Haylock, M. R., Luterbacher, J., and Wanner, H.: Doubled length of western European summer heat waves since 1880, J. Geophys. Res.-Atmos., 112, D15103, https://doi.org/10.1029/2007JD008510, 2007. a
de Saint-Venant, A. J. C. B.: Théorie du mouvement non permanent des eaux, avec application aux crues des rivières et a l'introduction de marées dans leurs lits, Comptes Rendus des Séances de l'Académie des Sciences, Gauthier-Villars, Paris, France, 73, 1–11, 1871. a
Ehret, U., Zehe, E., Wulfmeyer, V., Warrach-Sagi, K., and Liebert, J.: HESS Opinions ”Should we apply bias correction to global and regional climate model data?”, Hydrol. Earth Syst. Sci., 16, 3391–3404, https://doi.org/10.5194/hess-16-3391-2012, 2012. a
Elberling, B., Michelsen, A., Schädel, C., Schuur, E. A., Christiansen, H. H., Berg, L., Tamstorf, M. P., and Sigsgaard, C.: Long-term CO2 production following permafrost thaw, Nat. Clim. Change, 3, 890–894, 2013. a
Feddes, R. A., Kowalik, P., Kolinska-Malinka, K., and Zaradny, H.: Simulation of field water uptake by plants using a soil water dependent root extraction function, J. Hydrol., 31, 13–26, https://doi.org/10.1016/0022-1694(76)90017-2, 1976. a
Fischer, E. M. and Schär, C.: Consistent geographical patterns of changes in high-impact European heatwaves, Nat. Geosci., 3, 398–403, 2010. a
Freudiger, D., Kohn, I., Stahl, K., and Weiler, M.: Large-scale analysis of changing frequencies of rain-on-snow events with flood-generation potential, Hydrol. Earth Syst. Sci., 18, 2695–2709, https://doi.org/10.5194/hess-18-2695-2014, 2014. a
Froidevaux, P., Schwanbeck, J., Weingartner, R., Chevalier, C., and Martius, O.: Flood triggering in Switzerland: the role of daily to monthly preceding precipitation, Hydrol. Earth Syst. Sci., 19, 3903–3924, https://doi.org/10.5194/hess-19-3903-2015, 2015. a
Grillakis, M. G.: Increase in severe and extreme soil moisture droughts for Europe under climate change, Sci. Total Environ., 660, 1245–1255, https://doi.org/10.1016/j.scitotenv.2019.01.001, 2019. a
Gupta, H. V., Kling, H., Yilmaz, K. K., and Martinez, G. F.: Decomposition of the mean squared error and NSE performance criteria: Implications for improving hydrological modelling, J. Hydrol., 377, 80–91, https://doi.org/10.1016/j.jhydrol.2009.08.003, 2009. a
Hanzer, F., Förster, K., Nemec, J., and Strasser, U.: Projected cryospheric and hydrological impacts of 21st century climate change in the Ötztal Alps (Austria) simulated using a physically based approach, Hydrol. Earth Syst. Sci., 22, 1593–1614, https://doi.org/10.5194/hess-22-1593-2018, 2018. a, b, c
Hargreaves, G. H. and Samani, Z. A.: Reference crop evapotranspiration from temperature, Appl. Eng. Agric., 1, 96–99, 1985. a
Haylock, M. R., Hofstra, N., Klein Tank, A. M. G., Klok, E. J., Jones, P. D., and New, M.: A European daily high-resolution gridded data set of surface temperature and precipitation for 1950–2006, J. Geophys. Res.-Atmos., 113, D20119, 2008. a
Hempel, S., Frieler, K., Warszawski, L., and Schewe, J.: Bias corrected GCM input data for ISIMIP Fast Track, available at: https://www.isimip.org/gettingstarted/fast-track-bias-correction/ (last access: 28 April 2021), 2013a. a
Hempel, S., Frieler, K., Warszawski, L., Schewe, J., and Piontek, F.: A trend-preserving bias correction – the ISI-MIP approach, Earth Syst. Dynam., 4, 219–236, https://doi.org/10.5194/esd-4-219-2013, 2013b. a, b
Hengl, T., Mendes de Jesus, J., Heuvelink, G. B. M., Ruiperez Gonzalez, M., Kilibarda, M., Blagotić, A., Shangguan, W., Wright, M. N., Geng, X., Bauer-Marschallinger, B., Guevara, M. A., Vargas, R., MacMillan, R. A., Batjes, N. H., Leenaars, J. G. B., Ribeiro, E., Wheeler, I., Mantel, S., and Kempen, B.: SoilGrids250m: Global gridded soil information based on machine learning, PLoS one, 12, e0169748, https://doi.org/10.1371/journal.pone.0169748, 2017. a
Hock, R., Rasul, G., Adler, C., Cáceres, B., Gruber, Hirabayashi, Y., Jackson, M., Kääb, A., Kang, S., Kutuzov, S., Milner, A., Molau, U., Morin, S., Orlove, B., and Steltzer, H.: High Mountain Areas, in: IPCC Special Report on the Ocean and Cryosphere in a Changing Climate, edited by: Pörtner, H. O., Roberts, D. C., Masson-Delmotte, V., Zhai, P., Tignor, M., Poloczanska, E., Mintenbeck, K., Alegria, A., Nicolai, M., Okem, A., Petzold, J., Rama, B., and Weyer, N. M., in press, available at: https://www.ipcc.ch/srocc/chapter/chapter-2/ (last access: 28 April 2021), 2019. a
Horton, P., Schaefli, B., Mezghani, A., Hingray, B., and Musy, A.: Assessment of climate-change impacts on alpine discharge regimes with climate model uncertainty, Hydrol. Process., 20, 2091–2109, https://doi.org/10.1002/hyp.6197, 2006. a
Huang, S., Hattermann, F. F., Krysanova, V., and Bronstert, A.: Projections of climate change impacts on river flood conditions in Germany by combining three different RCMs with a regional eco-hydrological model, Climatic Change, 116, 631–663, https://doi.org/10.1007/s10584-012-0586-2, 2013. a
Huang, S., Kumar, R., Rakovec, O., Aich, V., Wang, X., Samaniego, L., Liersch, S., and Krysanova, V.: Multimodel assessment of flood characteristics in four large river basins at global warming of 1.5, 2.0 and 3.0 K above the pre-industrial level, Environ. Res. Lett., 13, 124005, https://doi.org/10.1088/1748-9326/aae94b, 2018. a
Huggel, C., Clague, J. J., and Korup, O.: Is climate change responsible for changing landslide activity in high mountains?, Earth Surf. Proc. Land., 37, 77–91, https://doi.org/10.1002/esp.2223, 2012. a
Hurkmans, R., Terink, W., Uijlenhoet, R., Torfs, P., Jacob, D., and Troch, P. A.: Changes in Streamflow Dynamics in the Rhine Basin under Three High-Resolution Regional Climate Scenarios, J. Climate, 23, 679–699, https://doi.org/10.1175/2009JCLI3066.1, 2010. a
Huss, M.: Present and future contribution of glacier storage change to runoff from macroscale drainage basins in Europe, Water Resour. Res., 47, https://doi.org/10.1029/2010WR010299, 2011. a
Imhoff, R. O., van Verseveld, W. J., van Osnabrugge, B., and Weerts, A. H.: Scaling Point-Scale (Pedo)transfer Functions to Seamless Large-Domain Parameter Estimates for High-Resolution Distributed Hydrologic Modeling: An Example for the Rhine River, Water Resour. Res., 56, e2019WR026807, https://doi.org/10.1029/2019WR026807, 2020. a, b
Junghans, N., Cullmann, J., and Huss, M.: Evaluating the effect of snow and ice melt in an Alpine headwater catchment and further downstream in the River Rhine, Hydrolog. Sci. J., 56, 981–993, https://doi.org/10.1080/02626667.2011.595372, 2011. a, b
Kemter, M., Merz, B., Marwan, N., Vorogushyn, S., and Blöschl, G.: Joint Trends in Flood Magnitudes and Spatial Extents Across Europe, Geophys. Res. Lett., 47, e2020GL087464, https://doi.org/10.1029/2020GL087464, 2020. a
King, A. D. and Karoly, D. J.: Climate extremes in Europe at 1.5 and 2 degrees of global warming, Environ. Res. Lett., 12, 114031, https://doi.org/10.1088/1748-9326/aa8e2c, 2017. a
Kormann, C., Francke, T., Renner, M., and Bronstert, A.: Attribution of high resolution streamflow trends in Western Austria – an approach based on climate and discharge station data, Hydrol. Earth Syst. Sci., 19, 1225–1245, https://doi.org/10.5194/hess-19-1225-2015, 2015. a
Kormann, C., Bronstert, A., Francke, T., Recknagel, T., and Graeff, T.: Model-Based attribution of high-resolution streamflow trends in two alpine basins of Western Austria, Hydrology, 3, 7, https://doi.org/10.3390/hydrology3010007, 2016. a
Kumar, R., Samaniego, L., and Attinger, S.: Implications of distributed hydrologic model parameterization on water fluxes at multiple scales and locations, Water Resour. Res., 49, 360–379, https://doi.org/10.1029/2012WR012195, 2013. a, b, c, d
Lehmann, J., Coumou, D., and Frieler, K.: Increased record-breaking precipitation events under global warming, Climatic Change, 132, 501–515, https://doi.org/10.1007/s10584-015-1434-y, 2015. a
Lighthill, M. J. and Whitham, G. B.: On kinematic waves I. Flood movement in long rivers, P. Roy. Soc. Lond. A, 229, 281–316, https://doi.org/10.1098/rspa.1955.0088, 1955. a
Livneh, B., Kumar, R., and Samaniego, L.: Influence of soil textural properties on hydrologic fluxes in the Mississippi river basin, Hydrol. Process., 29, 4638–4655, https://doi.org/10.1002/hyp.10601, 2015. a
Mao, J. and Yan, B.: Global Monthly Mean Leaf Area Index Climatology, ORNL DAAC, Oak Ridge, Tennessee, USA, 1981–2015, https://doi.org/10.3334/ORNLDAAC/1653, 2019. a
Marx, A., Kumar, R., Thober, S., Rakovec, O., Wanders, N., Zink, M., Wood, E. F., Pan, M., Sheffield, J., and Samaniego, L.: Climate change alters low flows in Europe under global warming of 1.5, 2, and 3 ∘C, Hydrol. Earth Syst. Sci., 22, 1017–1032, https://doi.org/10.5194/hess-22-1017-2018, 2018. a
McGill, R., Tukey, J. W., and Larsen, W. A.: Variations of Box Plots, Am. Stat., 32, 12–16, https://doi.org/10.2307/2683468, 1978. a
Meehl, G. A. and Tebaldi, C.: More Intense, More Frequent, and Longer Lasting Heat Waves in the 21st Century, Science, 305, 994–997, https://doi.org/10.1126/science.1098704, 2004. a
Middelkoop, H., Daamen, K., Gellens, D., Grabs, W., Kwadijk, J. C. J., Lang, H., Parmet, B. W. A. H., Schädler, B., Schulla, J., and Wilke, K.: Impact of climate change on hydrological regimes and water resources management in the Rhine basin, Climatic Change, 49, 105–128, https://doi.org/10.1023/A:1010784727448, 2001. a
Musselman, K. N., Clark, M. P., Liu, C., Ikeda, K., and Rasmussen, R.: Slower snowmelt in a warmer world, Nat. Clim. Change, 7, 214–219, https://doi.org/10.1038/nclimate3225, 2017. a
Nash, J. E. and Sutcliffe, J. V.: River flow forecasting through conceptual models part I – A discussion of principles, J. Hydrol., 10, 282–290, https://doi.org/10.1016/0022-1694(70)90255-6, 1970. a
Pardé, M.: Fleuves et Rivières, Armand Colin, Paris, France, p. 224, 1933. a
Pfister, L., Kwadijk, J., Musy, A., Bronstert, A., and Hoffmann, L.: Climate change, land use change and runoff prediction in the Rhine–Meuse basins, River Res. Appl., 20, 229–241, https://doi.org/10.1002/rra.775, 2004. a, b
R Core Team: R: A Language and Environment for Statistical Computing, R Foundation for Statistical Computing, Vienna, Austria, available at: https://www.R-project.org/ (last access: 28 April 2021), 2019. a
Radić, V. and Hock, R.: Glaciers in the Earth’s Hydrological Cycle: Assessments of Glacier Mass and Runoff Changes on Global and Regional Scales, Surv. Geophys., 35, 813–837, https://doi.org/10.1007/s10712-013-9262-y, 2014. a
Rakovec, O., Kumar, R., Mai, J., Cuntz, M., Thober, S., Zink, M., Attinger, S., Schäfer, D., Schrön, M., and Samaniego, L.: Multiscale and Multivariate Evaluation of Water Fluxes and States over European River Basins, J. Hydrometeorol., 17, 287–307, https://doi.org/10.1175/JHM-D-15-0054.1, 2016. a
Rojas, R., Feyen, L., Bianchi, A., and Dosio, A.: Assessment of future flood hazard in Europe using a large ensemble of bias-corrected regional climate simulations, J. Geophys. Res.-Atmos., 117, D17109, https://doi.org/10.1029/2012JD017461, 2012. a
Rottler, E.: Sto-R-age: Projected changes in flood seasonality in the Rhine River basin, Zenodo, https://doi.org/10.5281/zenodo.4724950, 2021. a
Rottler, E., Francke, T., Bürger, G., and Bronstert, A.: Long-term changes in central European river discharge for 1869–2016: impact of changing snow covers, reservoir constructions and an intensified hydrological cycle, Hydrol. Earth Syst. Sci., 24, 1721–1740, https://doi.org/10.5194/hess-24-1721-2020, 2020. a
Rottler, E., Vormoor, K., Francke, T., Warscher, M., Strasser, U., and Bronstert, A.: Elevation-dependent compensation effects in snowmelt in the Rhine River Basin upstream gauge Basel, Hydrol. Res., 52, 536–557, https://doi.org/10.2166/nh.2021.092, 2021. a, b
Rousselot, M., Durand, Y., Giraud, G., Mérindol, L., Dombrowski-Etchevers, I., Déqué, M., and Castebrunet, H.: Statistical adaptation of ALADIN RCM outputs over the French Alps – application to future climate and snow cover, The Cryosphere, 6, 785–805, https://doi.org/10.5194/tc-6-785-2012, 2012. a
Samani, Z.: Estimating Solar Radiation and Evapotranspiration Using Minimum Climatological Data, J. Irrig. Drain. Eng., 126, 265–267, https://doi.org/10.1061/(ASCE)0733-9437(2000)126:4(265), 2000. a
Samaniego, L., Kumar, R., and Attinger, S.: Multiscale parameter regionalization of a grid-based hydrologic model at the mesoscale, Water Resour. Res., 46, W05523, https://doi.org/10.1029/2008WR007327, 2010. a, b, c, d, e
Samaniego, L., Kumar, R., Thober, S., Rakovec, O., Zink, M., Wanders, N., Eisner, S., Müller Schmied, H., Sutanudjaja, E. H., Warrach-Sagi, K., and Attinger, S.: Toward seamless hydrologic predictions across spatial scales, Hydrol. Earth Syst. Sci., 21, 4323–4346, https://doi.org/10.5194/hess-21-4323-2017, 2017. a
Samaniego, L., Kaluza, M., Kumar, R., Rakovec, O., Schüler, L., Schweppe, R., Shrestha, P. K,, Thober, S., and Attinger, S.: mesoscale Hydrologic Model, v5.10, Zenodo, https://doi.org/10.5281/zenodo.3239055, 2019a. a, b
Samaniego, L., Thober, S., Kumar, R., Wanders, N., Rakovec, O., Pan, M., Zink, M., Sheffield, J., Wood, E. F., and Marx, A.: Anthropogenic warming exacerbates European soil moisture droughts, Nat. Clim. Change, 8, 421, https://doi.org/10.1038/s41558-018-0138-5, 2018b. a
Samaniego, L., Thober, S., Wanders, N., Pan, M., Rakovec, O., Sheffield, J., Wood, E. F., Prudhomme, C., Rees, G., Houghton-Carr, H., Fry, M., Smith, K., Watts, G., Hisdal, H., Estrela, T., Buontempo, C., Marx, A., and Kumar, R.: Hydrological forecasts and projections for improved decision-making in the water sector in Europe, B. Am. Meteorol. Soc., 100, 2451–2471, https://doi.org/10.1175/BAMS-D-17-0274.1, 2019. a, b, c
Schmucki, E., Marty, C., Fierz, C., and Lehning, M.: Simulations of 21st century snow response to climate change in Switzerland from a set of RCMs, International J. Climatol., 35, 3262–3273, https://doi.org/10.1002/joc.4205, 2015. a
Schuur, E. A. G., McGuire, A. D., Schädel, C., Grosse, G., Harden, J. W., Hayes, D. J., Hugelius, G., Koven, C. D., Kuhry, P., Lawrence, D. M., Natali, S. M., Olefeldt, D., Romanovsky, V. E., Schaefer, K., Turetsky, M. R., Treat, C. C., and Vonk, J. E.: Climate change and the permafrost carbon feedback, Nature, 520, 171–179, 2015. a
Serreze, M. C., Walsh, J. E., Chapin, F. S., Osterkamp, T., Dyurgerov, M., Romanovsky, V., Oechel, W. C., Morison, J., Zhang, T., and Barry, R. G.: Observational evidence of recent change in the northern high-latitude environment, Climatic Change, 46, 159–207, https://doi.org/10.1023/A:1005504031923, 2000. a
Speich, M. J. R., Bernhard, L., Teuling, A. J., and Zappa, M.: Application of bivariate mapping for hydrological classification and analysis of temporal change and scale effects in Switzerland, J. Hydrol., 523, 804–821, https://doi.org/10.1016/j.jhydrol.2015.01.086, 2015. a
Spreafico, M. and Weingartner, R.: The Hydrology of Switzerland – Selected aspects and results, Water Series no. 7, FOWG Reports, Berne, 2005. a
Stahl, K., Weiler, M., Kohn, I., Freudiger, D., Seibert, J., Vis, M., Gerlinger, K., and Böhm, M.: The snow and glacier melt components of streamflow of the river Rhine and its tributaries considering the influence of climate change, Synthesis report I-25, International Commission for the Hydrology of the Rhine Basin, Lelystad, Netherlands, available at: https://www.chr-khr.org/sites/default/files/chrpublications/asg-rhein_synthesis_en.pdf (last access: 28 April 2021), 2016. a, b, c, d, e, f, g
Steger, C., Kotlarski, S., Jonas, T., and Schär, C.: Alpine snow cover in a changing climate: a regional climate model perspective, Clim. Dynam., 41, 735–754, 2013. a
Stewart, I. T.: Changes in snowpack and snowmelt runoff for key mountain regions, Hydrol. Process., 23, 78–94, https://doi.org/10.1002/hyp.7128, 2009. a
Taylor, K. E., Stouffer, R. J., and Meehl, G. A.: An Overview of CMIP5 and the Experiment Design, B. Am. Meteorol. Soc., 93, 485–498, https://doi.org/10.1175/BAMS-D-11-00094.1, 2012. a
Thober, S., Kumar, R., Wanders, N., Marx, A., Pan, M., Rakovec, O., Samaniego, L., Sheffield, J., Wood, E. F., and Zink, M.: Multi-model ensemble projections of European river floods and high flows at 1.5, 2, and 3 degrees global warming, Environ. Res. Lett., 13, 014003, https://doi.org/10.1088/1748-9326/aa9e35, 2018. a, b, c
Thober, S., Cuntz, M., Kelbling, M., Kumar, R., Mai, J., and Samaniego, L.: The multiscale routing model mRM v1.0: simple river routing at resolutions from 1 to 50 km, Geosci. Model Dev., 12, 2501–2521, https://doi.org/10.5194/gmd-12-2501-2019, 2019. a, b
Tolson, B. A. and Shoemaker, C. A.: Dynamically dimensioned search algorithm for computationally efficient watershed model calibration, Water Resour. Res., 43, W01413, https://doi.org/10.1029/2005WR004723, 2007. a
Vautard, R., Gobiet, A., Sobolowski, S., Kjellström, E., Stegehuis, A., Watkiss, P., Mendlik, T., Landgren, O., Nikulin, G., Teichmann, C., and Jacob, D.: The European climate under a 2 ∘C global warming, Environ. Res. Lett., 9, 034006, https://doi.org/10.1088/1748-9326/9/3/034006, 2014. a
Viviroli, D., Archer, D. R., Buytaert, W., Fowler, H. J., Greenwood, G. B., Hamlet, A. F., Huang, Y., Koboltschnig, G., Litaor, M. I., López-Moreno, J. I., Lorentz, S., Schädler, B., Schreier, H., Schwaiger, K., Vuille, M., and Woods, R.: Climate change and mountain water resources: overview and recommendations for research, management and policy, Hydrol. Earth Syst. Sci., 15, 471–504, https://doi.org/10.5194/hess-15-471-2011, 2011. a
Vormoor, K., Lawrence, D., Heistermann, M., and Bronstert, A.: Climate change impacts on the seasonality and generation processes of floods – projections and uncertainties for catchments with mixed snowmelt/rainfall regimes, Hydrol. Earth Syst. Sci., 19, 913–931, https://doi.org/10.5194/hess-19-913-2015, 2015. a, b, c
Vormoor, K., Lawrence, D., Schlichting, L., Wilson, D., and Wong, W. K.: Evidence for changes in the magnitude and frequency of observed rainfall vs. snowmelt driven floods in Norway, J. Hydrol., 538, 33–48, https://doi.org/10.1016/j.jhydrol.2016.03.066, 2016. a, b, c
Warszawski, L., Frieler, K., Huber, V., Piontek, F., Serdeczny, O., and Schewe, J.: The Inter-Sectoral Impact Model Intercomparison Project (ISI–MIP): Project framework, P. Natl. Acad. Sci. USA, 111, 3228–3232, https://doi.org/10.1073/pnas.1312330110, 2014. a
Weiler, M., Seibert, J., and Stahl, K.: Magic components – why quantifying rain, snowmelt, and icemelt in river discharge is not easy, Hydrol. Process., 32, 160–166, https://doi.org/10.1002/hyp.11361, 2018. a
Wetter, O., Pfister, C., Weingartner, R., Luterbacher, J., Reist, T., and Trösch, J.: The Largest Floods in the High Rhine Basin since 1268 Assessed from Documentary and Instrumental Evidence, Hydrolog. Sci. J., 56, 733–758, https://doi.org/10.1080/02626667.2011.583613, 2011. a, b
Zemp, M., Haeberli, W., Hoelzle, M., and Paul, F.: Alpine glaciers to disappear within decades?, Geophys. Res. Lett., 33, L13504, https://doi.org/10.1029/2006GL026319, 2006. a