the Creative Commons Attribution 4.0 License.
the Creative Commons Attribution 4.0 License.
 | 30 Mar 2021
A standardized index for assessing sub-monthly compound dry and hot conditions with application in China
Jun Li
Zhaoli Wang
Xushu Wu
Jakob Zscheischler
Shenglian Guo
Xiaohong Chen
Compound dry and hot conditions frequently cause large impacts on ecosystems and societies worldwide. A suite of indices is available for the assessment of droughts and heatwaves, yet there is no index available for incorporating the joint variability of dry and hot conditions at the sub-monthly scale. Here we introduce a daily-scale index, called the standardized compound drought and heat index (SCDHI), to assess compound dry-hot conditions. The SCDHI is based on a daily drought index (the standardized antecedent precipitation evapotranspiration index – SAPEI), the daily-scale standardized temperature index (STI), and a joint probability distribution method. The new index is verified against real-world compound dry and hot events and associated observed vegetation impacts in China. The SCDHI can not only capture compound dry and hot events at both monthly and sub-monthly scales, but is also a good indicator for associated vegetation impacts. Using the SCDHI, we quantify the frequency, severity, duration, and intensity of compound dry-hot events during the historical period and assess the ability of climate models to reproduce these characteristics in China. We find that compound events whose severity is at least light and which last longer than 2 weeks generally persisted for 20–35 d in China. Southern China suffered from compound events most frequently, and the most severe compound events were mainly detected in this region. Climate models generally overestimate the frequency, duration, severity, and intensity of compound events in China, especially for western regions, which can be attributed to a too strong dependence between the SAPEI and STI in those models. The SCDHI provides a new tool to quantify sub-monthly characteristics of compound dry and hot events and to monitor their initiation, development, and decay. This is important information for decision-makers and stakeholders to release early and timely warnings.
- Article
(11289 KB) - Full-text XML
-
Supplement
(2070 KB) - BibTeX
- EndNote


Compound dry-hot events are climate events during which dry and hot conditions occur simultaneously, and such events have been observed on all continents in recent decades (Hao et al., 2019; Mazdiyasni and AghaKouchak, 2015; Manning et al., 2019). Compound dry-hot events can lead to more devastating impacts on natural ecosystems and human society compared to droughts and heatwaves alone (Zscheischler et al., 2014; Chen et al., 2019; Hao et al., 2018a). For example, Russia was simultaneously struck by a severe drought and unprecedented temperature extremes in the summer of 2010, which caused large-scale crop failures, wildfires, and human mortality (Zscheischler et al., 2018). Droughts and heatwaves are expected to occur more frequently in the coming decades under global warming, which potentially results in more compound events in many parts of the world, especially for wet and humid regions (Wu et al., 2020; Swain et al., 2018; Zscheischler and Seneviratne, 2017). Therefore, understanding such events is of crucial importance to provide relevant information for disaster mitigation.
Many studies have investigated multivariate compound events in recent years (Zscheischler et al., 2020; Ridder et al., 2020). Utilizing thresholds to define concurrent climate extremes for a specific period, particularly the frequency of multivariate compound events, has received a lot of attention (Wu et al., 2019; Zhang et al., 2019; Ridder et al., 2020). However, for impacts, other compound-event characteristics such as duration, severity, and intensity may be at least as important and may help to compare compound-event characteristics across different climates (Wu et al., 2020). To overcome these limitations, several joint climate extreme indices have been proposed for analyzing characteristics of compound events beyond frequency. For instance, the standardized dry and hot index based on the ratio of the marginal probability distribution functions of precipitation and temperature was proposed to measure the extremeness of a compound drought and hot event (Hao et al., 2018a). Hao et al. (2019) recently proposed the standardized compound-event indicator and compound dry-hot index to assess the severity of compound dry and hot events by linking the marginal distribution of the standardized precipitation index (SPI) and standardized temperature index (STI) using copula theory. These two joint indices provide useful tools to improve our understanding of the frequency, spatial extent, and severity of compound dry-hot events. However, when extreme weather conditions (e.g., high temperature, low humidity, and sunny skies) occur within a short period, droughts can evolve rapidly in conjunction with heatwaves (Koster et al., 2019; Otkin et al., 2018; Yuan et al., 2019; Li et al., 2020a; Pendergrass et al., 2020). Despite their short duration, concurrent short-term drought and hot extremes can pose large socio-economic risks because the combination of both hazards can exacerbate their respective environmental and societal impacts (Kirono et al., 2017; Schumacher et al., 2019; Sedlmeier et al., 2018). For instance, even short-term concurrent dry and hot extremes can lead to significant agricultural loss if they occur within sensitive stages in crop development such as emergence, pollination, and grain filling (Haqiqi et al., 2021; Luan and Vico et al., 2021; Zhang et al., 2019). Under climate change, short-term concurrent dry and hot extremes are expected to increase (especially for humid regions), potentially causing substantial damage to natural ecosystems and society (Li et al., 2020b; Sun et al., 2019). To improve understanding of such short-term compound events and issue early and timely warnings, decision-makers and stakeholders require more detailed information such as the start time, severity, and the projected tendency for the coming days rather than the average state at a fixed monthly scale (Pendergrass et al., 2020). However, the above-mentioned indices often only allow for identification of compound dry-hot events at a relatively coarse (i.e., the monthly) temporal resolution (Hao et al., 2019), and the key characteristics of climate extremes may not be detectable at a monthly scale (Lu et al., 2014; Otkin et al., 2018). For instance, hot extremes generally occur at much finer timescales (e.g., days and weeks) (Zhang et al., 2019). Consequently, sub-monthly-scale indices for characterizing short-term compound dry and hot conditions are needed. In addition, through the influence of evapotranspiration, other meteorological variables that vary at short timescales (e.g., relative humidity, wind speed, and radiation) may be important drivers of drought and heatwave concurrences (Russo et al., 2019). Thus, the development of a compound drought and heat index should consider other important variables such as evapotranspiration.
Here we develop a compound drought and heat index, called the standardized compound drought and heat index (SCDHI), for monitoring compound dry and hot events at a sub-monthly scale. To achieve this aim, we combine a daily-scale drought index, the standardized antecedent precipitation evapotranspiration index (SAPEI), which simultaneously considers precipitation and potential evapotranspiration, with a daily-scale standardized temperature index (STI). The SCDHI provides a new tool to quantify various characteristics of compound dry-hot events and can be computed at multiple timescales (e.g., daily, weekly, and monthly).
Several studies have been carried out to study compound dry-hot events in China (Chen et al., 2019; Hao et al., 2019; Wu et al., 2020; Zhang et al., 2019), and these studies help to better understand such events. However, they mostly focused on the frequency and severity of the compound dry-hot event at a relatively coarse (i.e., the monthly) temporal resolution without considering their duration and intensity. In addition, the effect of climate model bias on the characteristics of compound dry-hot events in China remains unclear. Understanding climate model biases is a crucial step to assess the risk of future compound dry-hot events (Villalobos-Herrera et al., 2020). Recent compound dry-hot events have resulted in serious social and economic losses in China (Wu et al., 2020; Zhang et al., 2019), motivating further study of these potentially very damaging events. Using the SCDHI, here we investigate important characteristics such as frequency, duration, severity, and intensity of compound dry-hot events during the historical (1961–2018) period and evaluate the effect of climate model biases on compound-event characteristics in China.
The paper is organized as follows: Sect. 2 introduces the data used in this study, the development of the SCDHI. In Sect. 3, the validation of SAPEI and SCDHI is presented and characteristics of compound dry-hot events and the impact of climate model bias on its characteristics are investigated. The study is concluded in Sect. 4.
2.1 Data
Daily meteorological datasets covering 1961 to 2018 were collected from 2239 observational stations across the non-arid region in China (Fig. 1), which include precipitation, maximum air temperature, mean air temperature, minimum air temperature, relatively humidity, wind speed, and sunshine duration. The data with strict quality control are available from the China Meteorological Administration (http://data.cma.cn/) and the Resources and Environmental Science Data Center, Chinese Academy of Sciences (http://www.resdc.cn/, last access: 15 January 2021). The observational station data were interpolated to 0.25×0.25∘ gridded data by kriging, as it yields higher interpolation accuracy than the other commonly used methods, e.g., ordinary nearest neighbor and inverse distance weighting (Liu et al., 2016). In this study, we only focus the non-arid region in China, for three reasons: (1) replenishment of water resources across the Chinese arid region is mainly from melted glacial or perennially frozen soil but not from precipitation; (2) meteorological observations in the arid regions of China are too scarce to conduct robust analysis (Xu et al., 2015); (3) from a practical perspective, calculating climate extreme indices across arid regions and deserts is less meaningful.
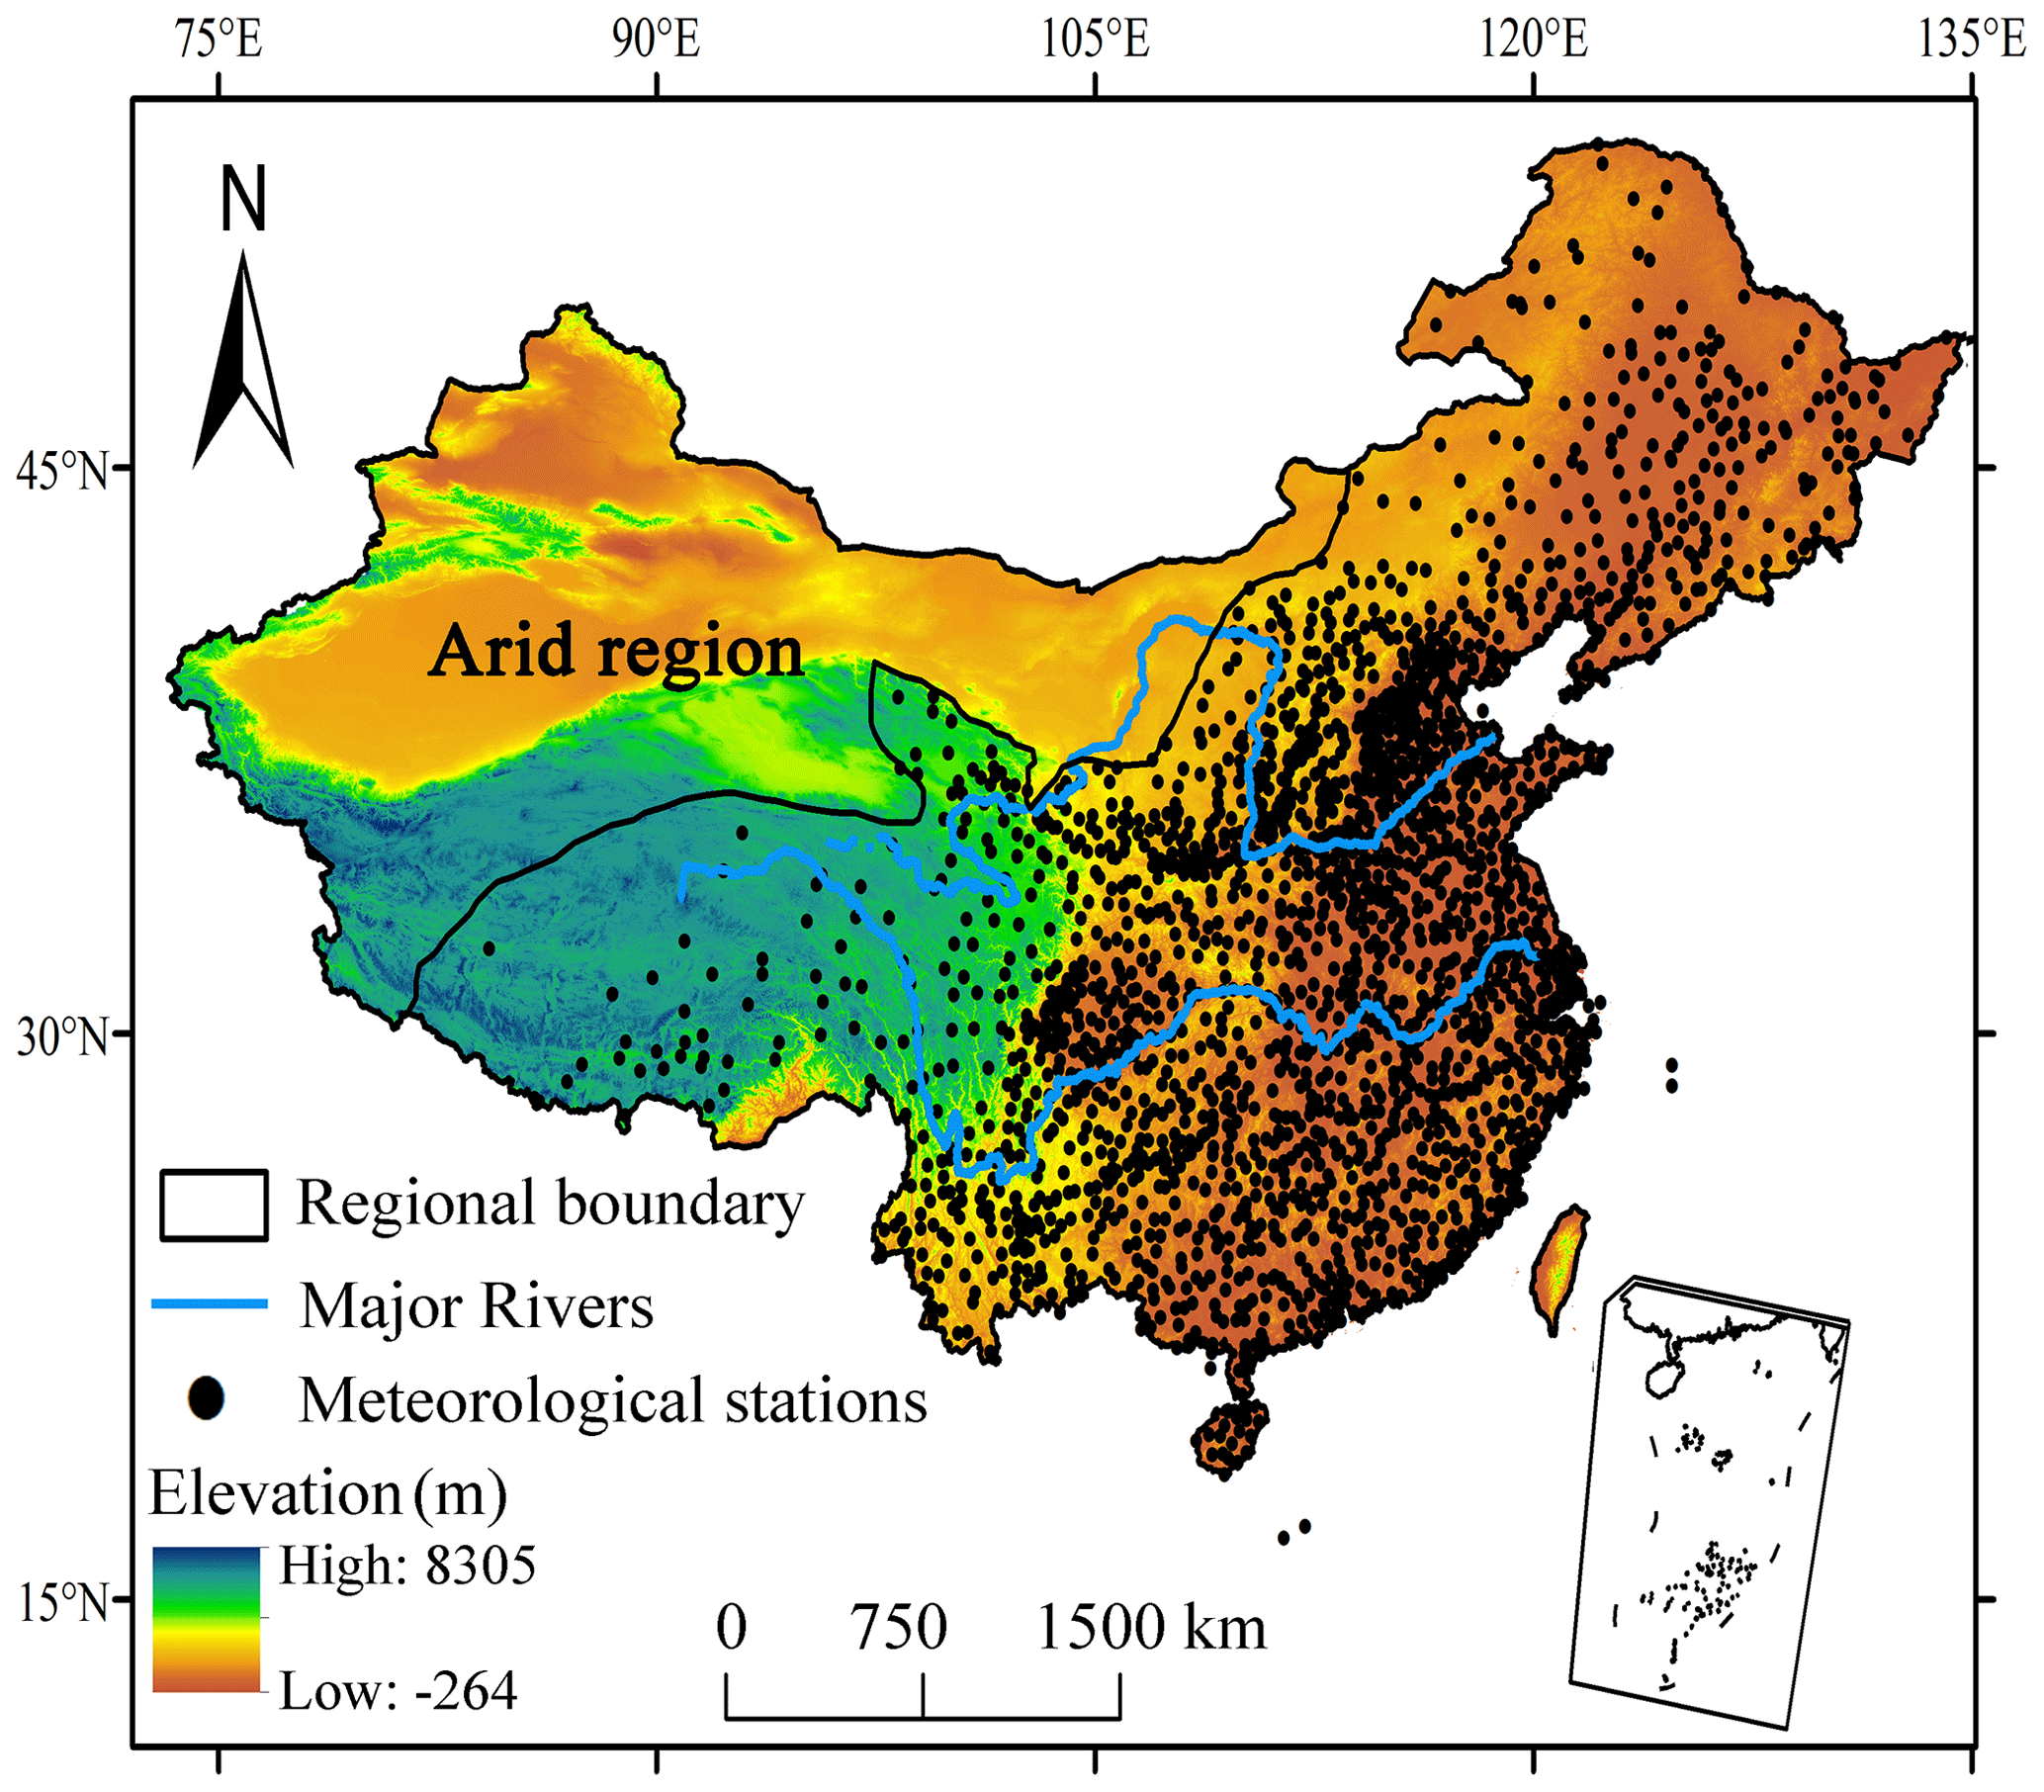
Figure 1Geographical position of China and meteorological stations.
The 0.25∘-daily root zone (0–100 cm) soil moisture dataset obtained from the Community Land Model of the Global Land Data Assimilation System (Li et al., 2018; Rodell et al., 2004) was also used in this study. The Community Land Model product does not have explicit vertical levels: instead, soil moisture is represented in the surface (0–2 cm) and root zone soil moisture (0–100 cm) (Li et al., 2018). Root zone soil moisture is chosen over the surface soil moisture on account of its appropriateness to characterize drought and lower noise relative to surface soil moisture (Hunt et al., 2009; Osman et al., 2021). The datasets from 1961 to 2014 were downloaded from the Goddard Earth Sciences Data and Information Services Center (https://disc.gsfc.nasa.gov/datasets/GLDAS_CLSM025_D_2.0/summary?keywords=GLDAS, last access: 12 December 2020). The soil moisture dataset from the Community Land Model captures dry and wet conditions in China well (Bi et al., 2016; Feng et al., 2016). To avoid the effect of seasonality, soil moisture was fitted by a Gamma distribution and subsequently standardized by normal quantile transformation (Herr and Krzysztofowicz, 2005). In addition, the 8 d leaf area index of the MOD15A2H from 2003 to 2018 was collected. After resampling to a 0.25∘ spatial resolution, we subtracted the local mean and divided by the local standard deviation to obtain normalized leaf area index anomalies.
We further used global climate models from the Coupled Model Intercomparison Project Phase 5 (https://esgf-node.llnl.gov/search/cmip5) to assess the effect of climate model biases on compound dry-hot events (Taylor et al., 2012). The global climate models used in this study include CanESM2, CNRM-CM5, CSIRO-Mk3.6, MIROC-ESM, MPI-ESM-LR, BCC-CSM1-1, IPSL-CM5A-LR, and MRI-CGCM3. These models exhibit good performance in their simulation of key features of precipitation and temperature in China (Jiang et al., 2016; Yang et al., 2019). We obtained daily climate variables (e.g., precipitation, temperature, relative humidity, and wind speed) for the historical (1961–2005) periods. All of the global climate models' outputs were based on the first ensemble member of each model. In this study, the bias-corrected climate imprint method, one of the delta statistical downscaling methods, was used to downscale the global climate model outputs to a spatial resolution of 0.25∘ (Werner and Cannon, 2016). The detailed information on these global climate models is shown in Table S1.
2.2 Development of the SCDHI
The SCDHI is a compound drought and heat index based on the SAPEI and the STI, both of which are briefly introduced in the following. Afterwards, the joint distribution method was employed to compute the SCDHI from the two univariate indices.
2.2.1 Formulation of daily-scale drought and heat indices
SAPEI was first introduced by Li et al. (2020b). However, the primary limitation of this index is that it has a fixed temporal scale (the number of considered antecedent days was equal to 100) and cannot reflect dry and wet conditions at different timescales. Given that drought is a multi-scalar phenomenon (Mckee et al., 1993; Vicente-Serrano et al., 2010), here we extended the SAPEI to a multiple timescale (i.e., 3-, 6-, 9-, and 12-month) daily drought index.
The Penman–Monteith method (Allen et al., 1998) was used to compute potential evapotranspiration. The daily difference between precipitation and potential evapotranspiration was then calculated to estimate the water balance. To reflect dry and wet conditions of a given day, the antecedent water surplus or deficit (WSD) was calculated through the following equation:
where n is the number of previous days, PET represents the potential evapotranspiration, and P represents precipitation. The WSD values can be aggregated at different timescales, such as 3, 6, 9 months, and so on. The daily WSD series was fitted to a log-logistic distribution. Subsequently, cumulative probabilities of the WSD series were obtained and transformed to standardized units using the classical approach of Abramovitz and Stegun (1965), resulting in the SAPEI.
The STI was computed in a similar fashion to the SPI, while it did not accumulate temperature in a fixed scale. The calculation of daily STI relied on daily temperature. A normal distribution was fitted to daily temperature at each day of the year, because temperature anomalies can be assumed to be normally distributed (Hansen et al., 2012; Zscheischler et al., 2014). The STI was then computed based on the cumulative distribution function G(x) listed below:
where x is temperature time series. x and σ are the mean and standard deviation parameters, respectively. q is the cumulative probability and φ is the standard normal distribution.
2.2.2 Construction of the SCDHI
The SCDHI was established using copula theory (a brief introduction to copula theory is given in the Supplement), which essentially models the dependence between the SAPEI and the STI to generate a bivariate distribution linking the two indices.
There are many copula families available, which have widely been used for modeling bivariate distributions (Terzi et al., 2019). Among them, Clayton, Gumbel, normal, t, and Frank copulas perform well for bivariate hydrometeorological variables (Ayantobo et al., 2018; Liu et al., 2019) and thus were tested to establish the bivariate joint probability distribution in this study. Assuming the two random variables X and Y, representing SAPEI and STI, respectively, the compound dry-hot event can be identified as one variable X less than or equal to a threshold x and the other variable Y higher than a threshold y at the same time. The joint probability p of the compound dry-hot event can then be expressed as
where u and v are the respective thresholds after transforming X and Y to uniform marginal distributions (Ayantobo et al., 2017), and c(u,v) is the joint probability distribution based on the fitted copula.
This joint cumulative probability p can then be treated as an indicator, where smaller p values denote more severe conditions of compound dry-hot conditions. However, because the marginal distributions usually vary across seasons and regions, the same value does not correspond to the same univariate exceedance thresholds across seasons and regions but rather refers to similar bivariate extremeness in the bivariate SAPEI–STI distribution. Transforming the joint probability p into a uniform distribution by fitting a distribution F and subsequently into a standard normal distribution results in an indicator to characterize compound dry-hot events. Hence, the SCDHI is computed by taking the inverse of the joint cumulative probability (p):
where φ is the standard normal distribution function and F is the marginal cumulative distribution, which remaps the joint probability to the uniform distribution (Yeo and Johnson, 2000).
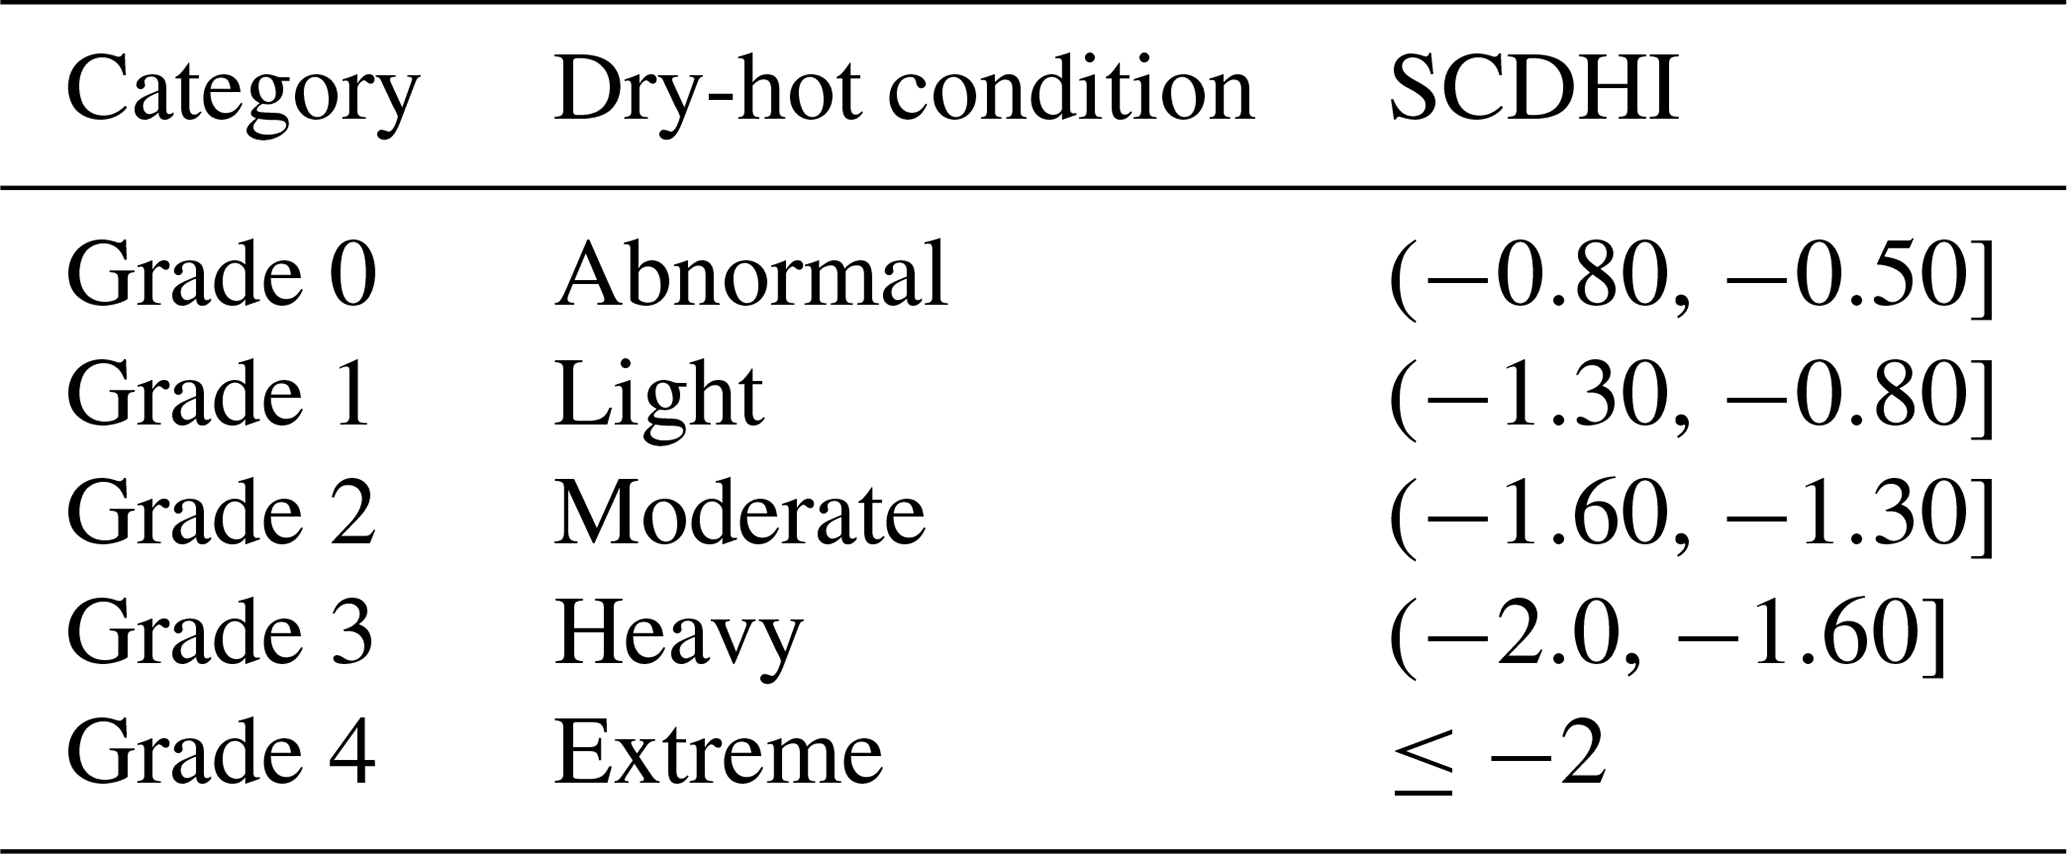
Following the categories of compound dry and hot conditions as suggested by Wu et al. (2020), we define five categories of compound dry and hot conditions, including abnormal, light, moderate, heavy, and extreme compound dry-hot, as shown in Table 1. The development of the SCDHI is illustrated in Fig. 2.
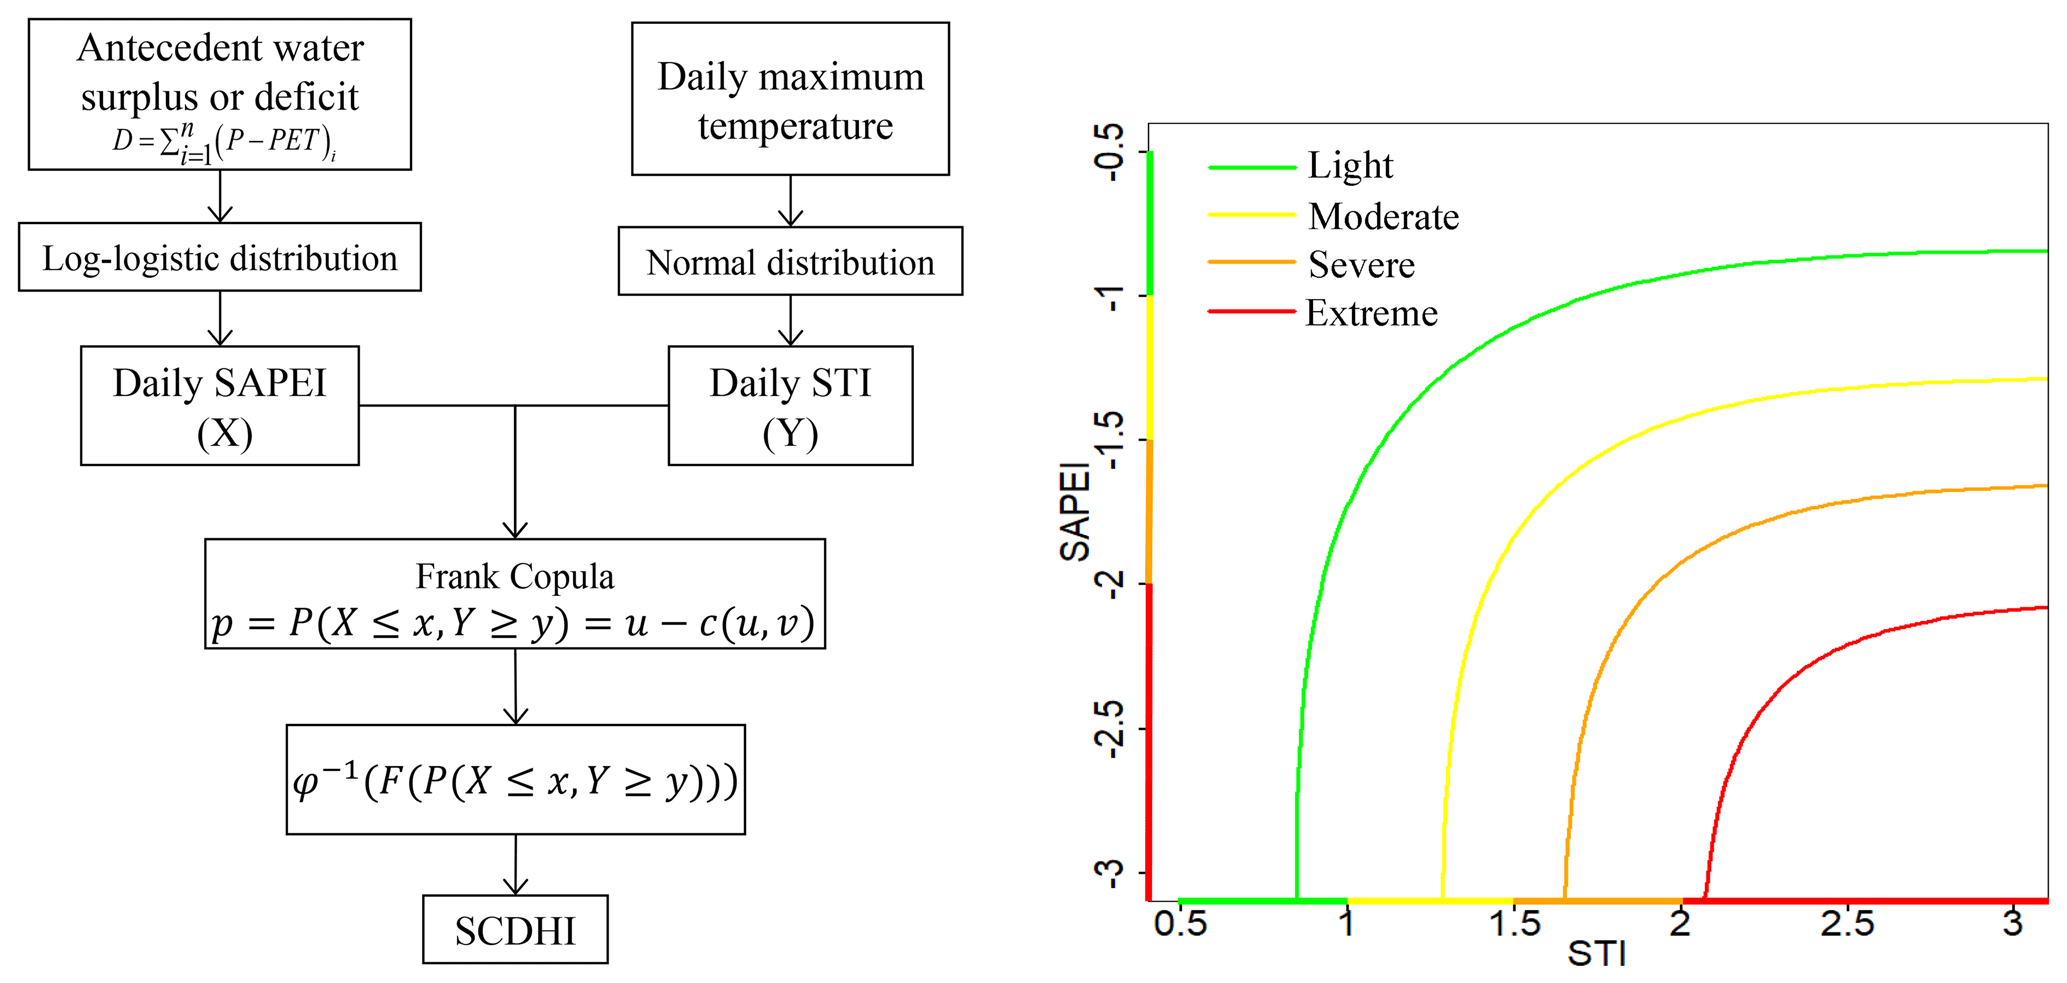
Figure 2The graphical illustration of the SCDHI construction and the relation between the STI and SAPEI under different severity levels of compound drought and hot conditions (given by the legend). Different colors in abscissa and ordinate represent different drought or hot conditions (i.e., light, moderate, severe, and extreme). The isolines are calculated from a specific calendar day, using the fitted Frank copula with the parameter being −1.31.
Table 1Categories of compound dry and hot conditions based on the SCDHI.
2.2.3 Evaluation metrics
We used the Akaike information criterion (AIC), Bayesian information criterion (BIC), and Kolmogorov–Smirnov (KS) statistics to select the most appropriate copula. The KS test indicates the goodness of fit between the empirical and theoretical distributions (Wu et al., 2018), while the BIC and AIC are relative measures of the quality of a model for a given set of data and help in model selection among a finite set of models (Li et al., 2013). The preferred model is the one with the lowest AIC and BIC values but highest p values in the KS test. These statistical measures have been commonly used for selecting appropriate copulas (Zscheischler et al., 2017; Zscheischler and Seneviratne, 2017; Liu et al., 2019; Terzi et al., 2019). The statistics of the three metrics are presented in Fig. S1–S3, indicating that the Frank copula showed lower AIC and BIC values but higher p values of the KS test compared to other copulas. Overall, all tests showed comparable results. The Frank copula was thus utilized to model the dependence between the SAPEI and STI and to construct the SCDHI as explained in Sect. 2.2.2.
2.3 Other drought indicators
The two commonly used drought indices, the monthly Palmer drought severity index (PDSI) and the SPEI, were employed for comparison against the SAPEI. The conventional PDSI was empirically derived using the meteorological data of the central USA with its semi-arid climate. The portability of the conventional PDSI to other regions in the world is thus relatively poor (Liu et al., 2017). In this study, the PDSI was calculated according to China's national standard of classification of meteorological drought (standard no. GB/T 20481-2017). The PDSI was built based on long-term meteorological data of in situ stations almost evenly distributed around China (Zhong et al., 2019a). The detailed calculations on the PDSI and SAPEI are presented in the Supplement.
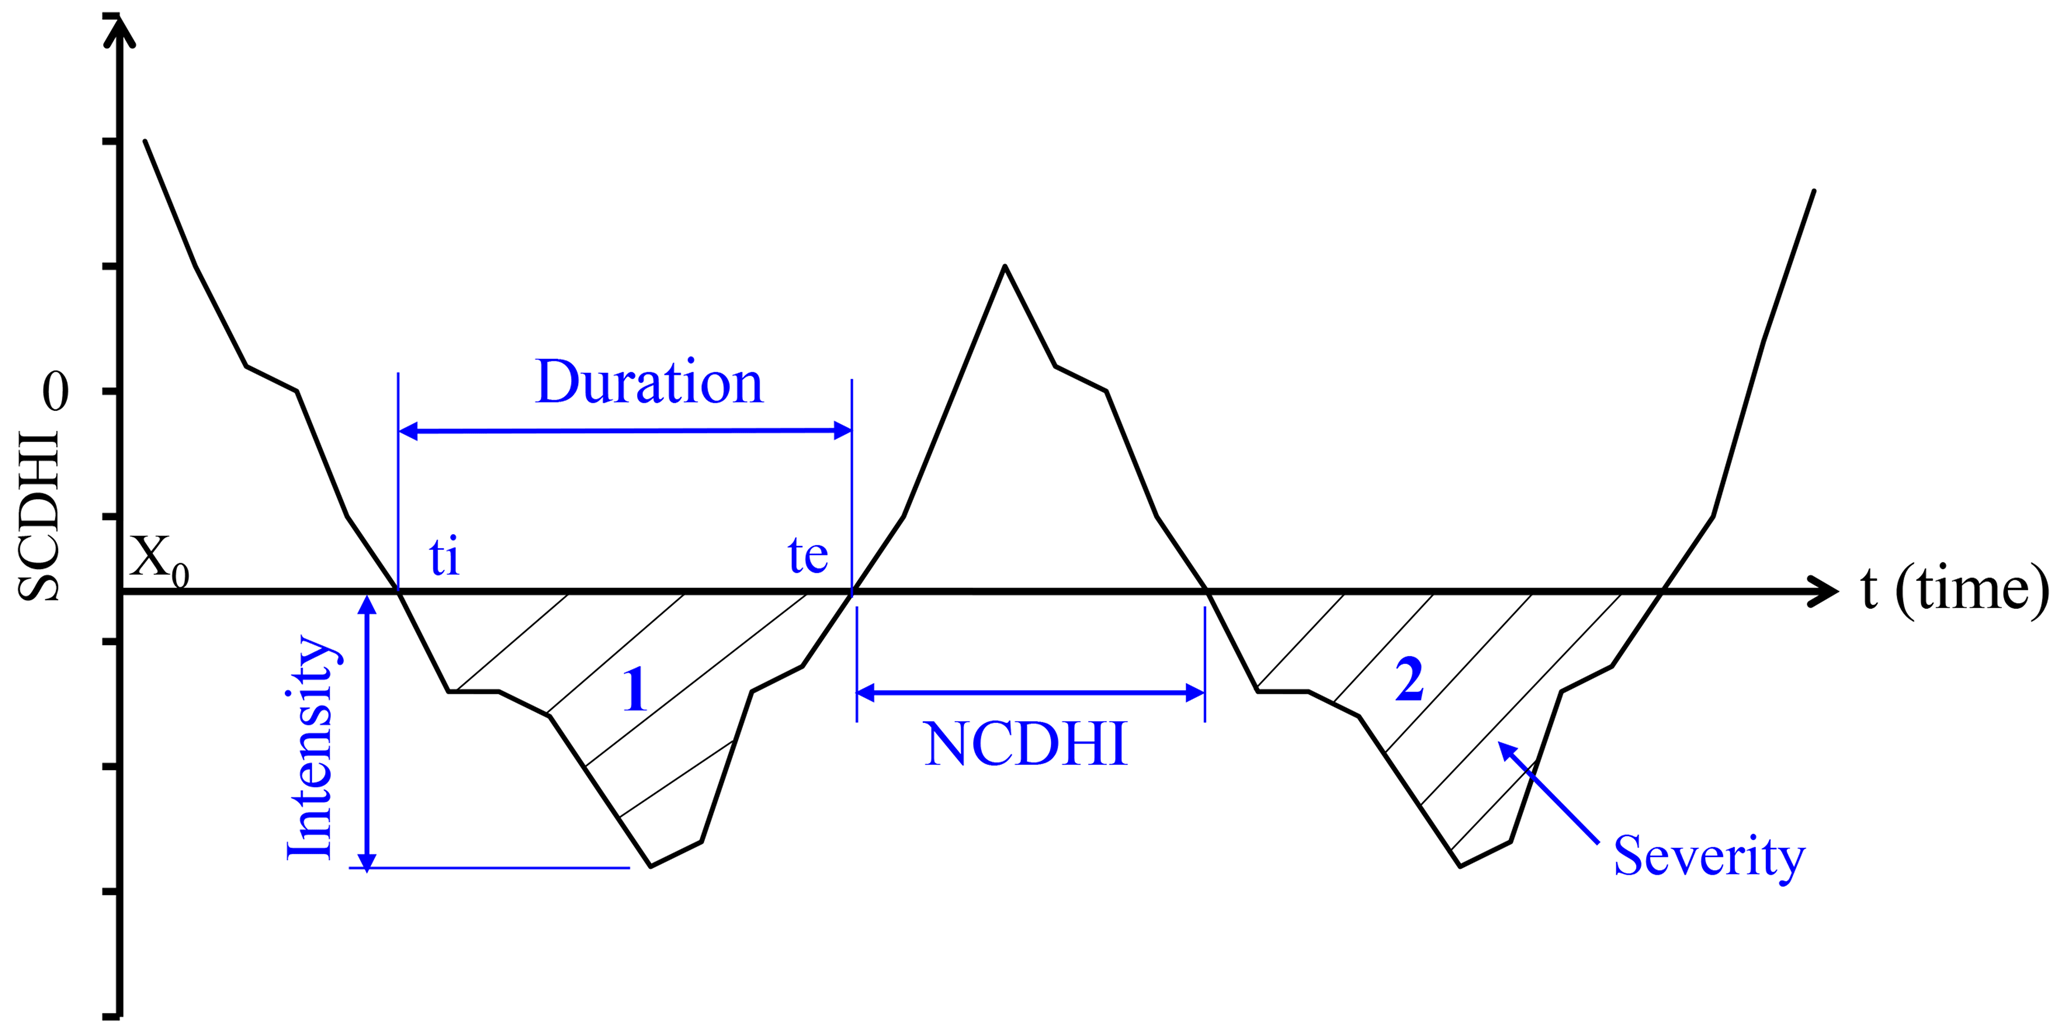
Figure 3Definition sketch of characteristics of a compound dry-hot event showing two events (labeled as 1 and 2) on the basis of run theory. Note: X0 is truncation level, NCDHC is non-compound dry and hot condition, ti is initiation time, and te is termination time.
2.4 Run theory to extract compound-event characteristics
Run theory was used to identify the frequency, duration, severity, and intensity of compound dry-hot events. A “run” is defined as a portion of the time series of a variable Xt in which all values are either below (i.e., negative run) or above (i.e., positive run) a selected truncation level of X0 (Ayantobo et al., 2017). Figure 3 illustrates an example with two compound dry-hot events, and each compound dry-hot event is characterized by its respective duration, severity, intensity, and non-compound dry-hot condition. Specifically, according to the truncation level X0, the number of consecutive intervals (days) where values remain below X0 defines duration, while the cumulative sum of values during a compound dry-hot period and the minimum value within a compound dry-hot period defines severity and intensity, respectively. Frequency is simply the number of events in the given time period. Duration and severity are thus defined as
where te is termination time, ti is initiation time, and D is duration. In this study, X0 was set to −0.8, −1.3, and −1.6 to assess the characteristics of compound dry-hot events under different thresholds. Furthermore, for the assessment of compound-event characteristics in this study, events shorter than 2 weeks were discarded.
3.1 Evaluation of SAPEI
The SCDHI was established based on the daily STI and the daily drought index SAPEI. However, no previous studies have tested the daily drought monitoring performance of the SAPEI at multiple timescales. Figure 4 shows the spatial distributions and probability densities of the correlations between the SAPEI and SPEI/PDSI/soil moisture across China. The monthly mean SAPEI at 3-, 6-, 9- and 12-month scales shows strong agreement with the SPEI in China, and correlation coefficients were typically higher than 0.8, indicating that the monthly SAPEI at multiple timescales calculated from daily values has a similar capability to monitor monthly drought to the SPEI. The 3-, 6-, 9- and 12-month SAPEI also generally showed high correlations with the PDSI: in particular, the 3-month SAPEI and PDSI are well correlated, with correlation coefficients higher than 0.6. For the daily SAPEI at a 12-month scale and soil moisture, a close correlation was detected in southern and northern China, while a relatively weak correlation was found in midwestern China. The correlation between the SAPEI and soil moisture increased in magnitude at timescales of 3 to 9 months. For the 12-month SAPEI, the mean correlation coefficient reached about 0.5 for all of China. These results indicate that the short timescale SAPEI is more sensitive to precipitation variability and thus could be more suitable for meteorological drought, while the long timescale (more than 5 months) SAPEI is more closely related to soil moisture and can thus be applied for agricultural drought monitoring. Overall, these analyses indicate that the SAPEI at daily and monthly scales is a reliable indicator for drought monitoring at different timescales.
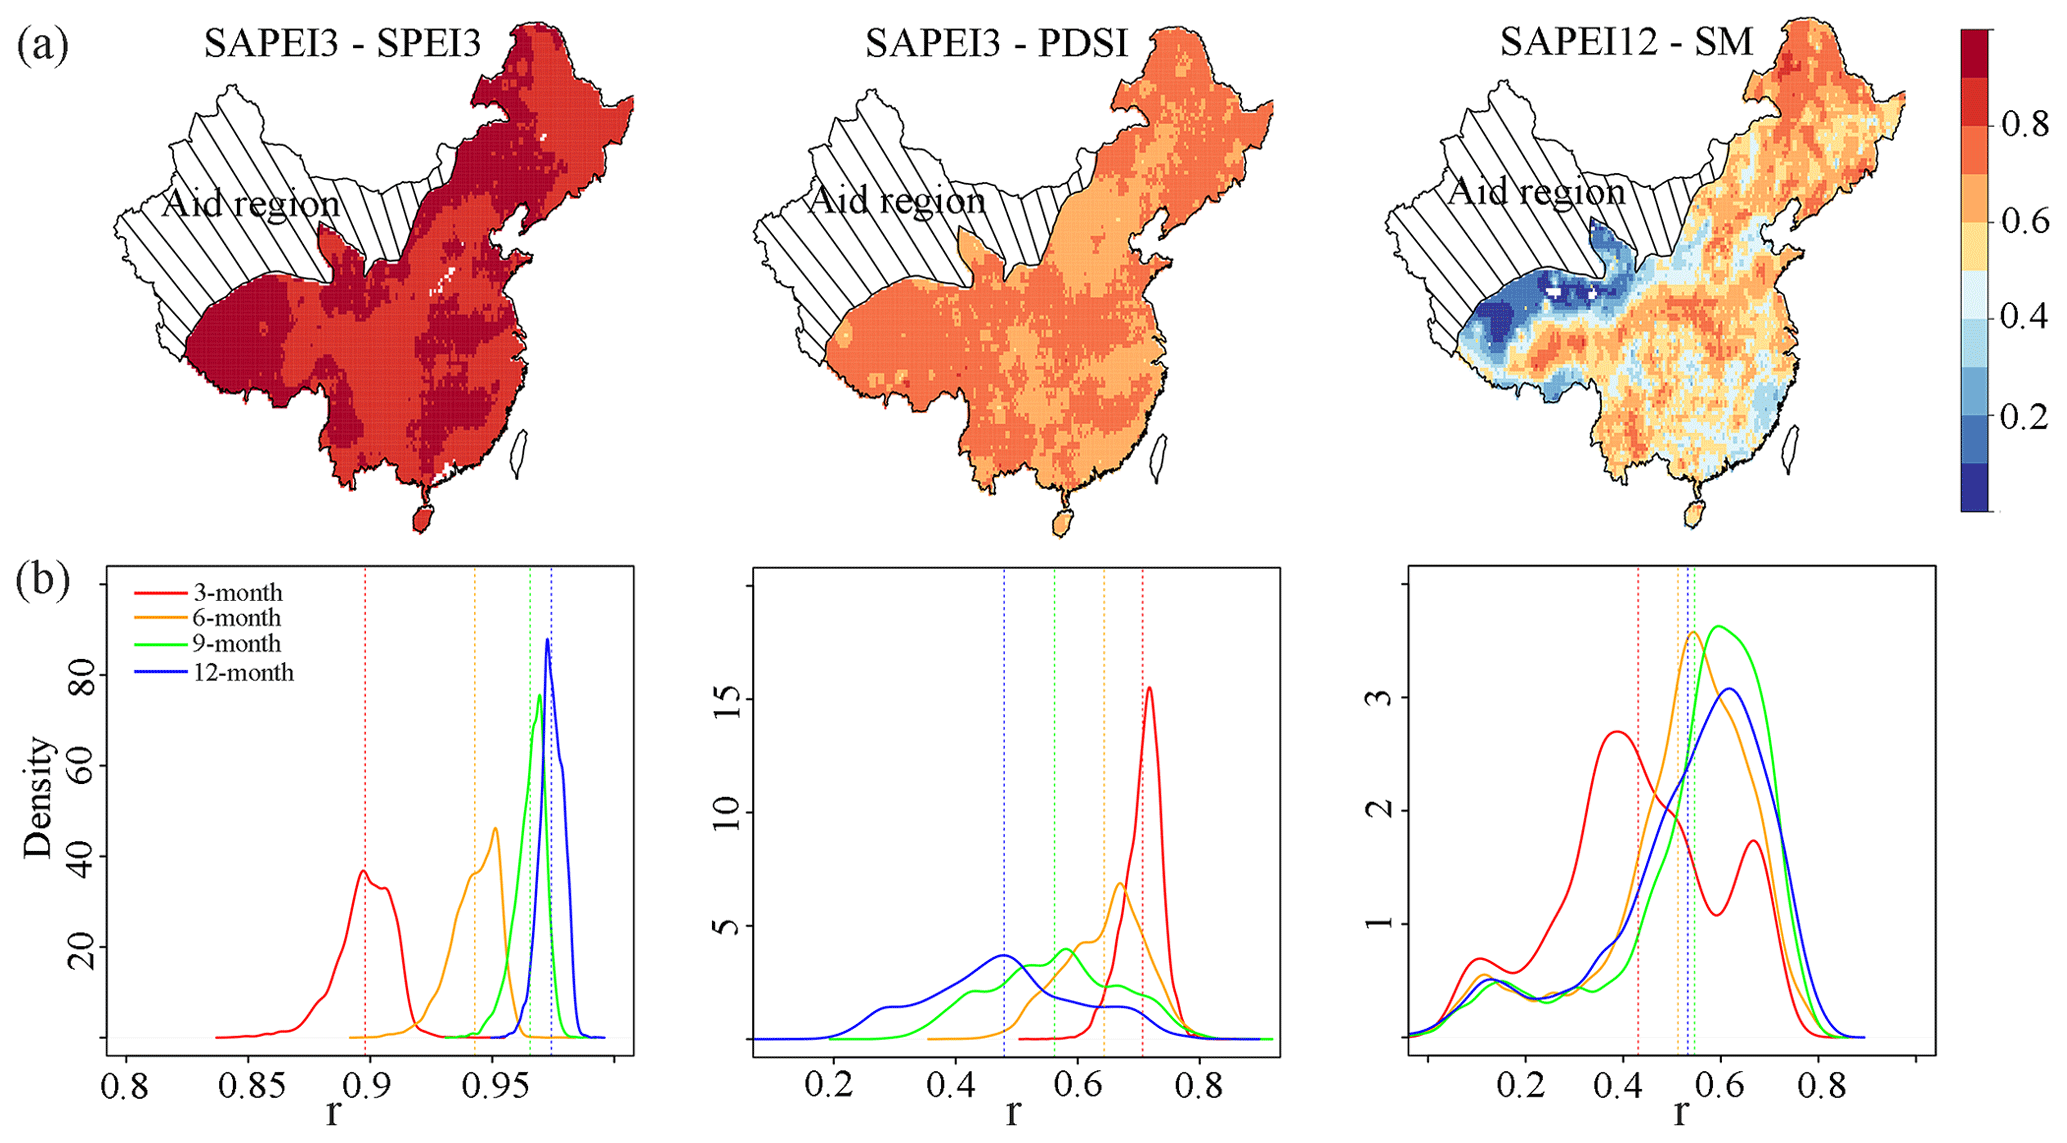
Figure 4(a) The spatial pattern of the correlations between the monthly SAPEI and SPEI/PDSI and between the daily SAPEI and soil moisture (SM). (b) The density plot for the correlation coefficients between the SAPEI and SPEI/PDSI/SM. The monthly SAPEI is computed by averaging the daily values in each month.
To further test the drought-monitoring performance of the SAPEI, typical drought events were chosen as case studies. We firstly showed the monthly evolution of these events by the monthly mean SAPEI, SPEI, and PDSI and then analyzed the temporal evolution of drought at a daily scale in the most affected areas according to the SAPEI and soil moisture.
Despite being located in the humid climate zone, southwestern China suffered from exceptional drought during the autumn of 2009 to the spring of 2010 (Lin et al., 2015). We selected this event in southwestern China as the first case study. As shown in Fig. S4, the monthly evolution in the 2009/2010 drought based on SAPEI was generally similar to that of the SPEI and PDSI. Figure 5 reveals the daily change of this event using the SAPEI and soil moisture. During September of 2009, the drought started to appear in the region, and dry conditions became worse and spread throughout nearly the entire southwest of China from 1 October to 15 November 2009. Severe dry conditions then stayed in the region for 152 d from 15 November to 15 April 2010, with high intensity. Afterwards, severe drought was gradually relieved from 15 April to 15 June. The drought diminished over time in most parts of southwestern China by the end of June.
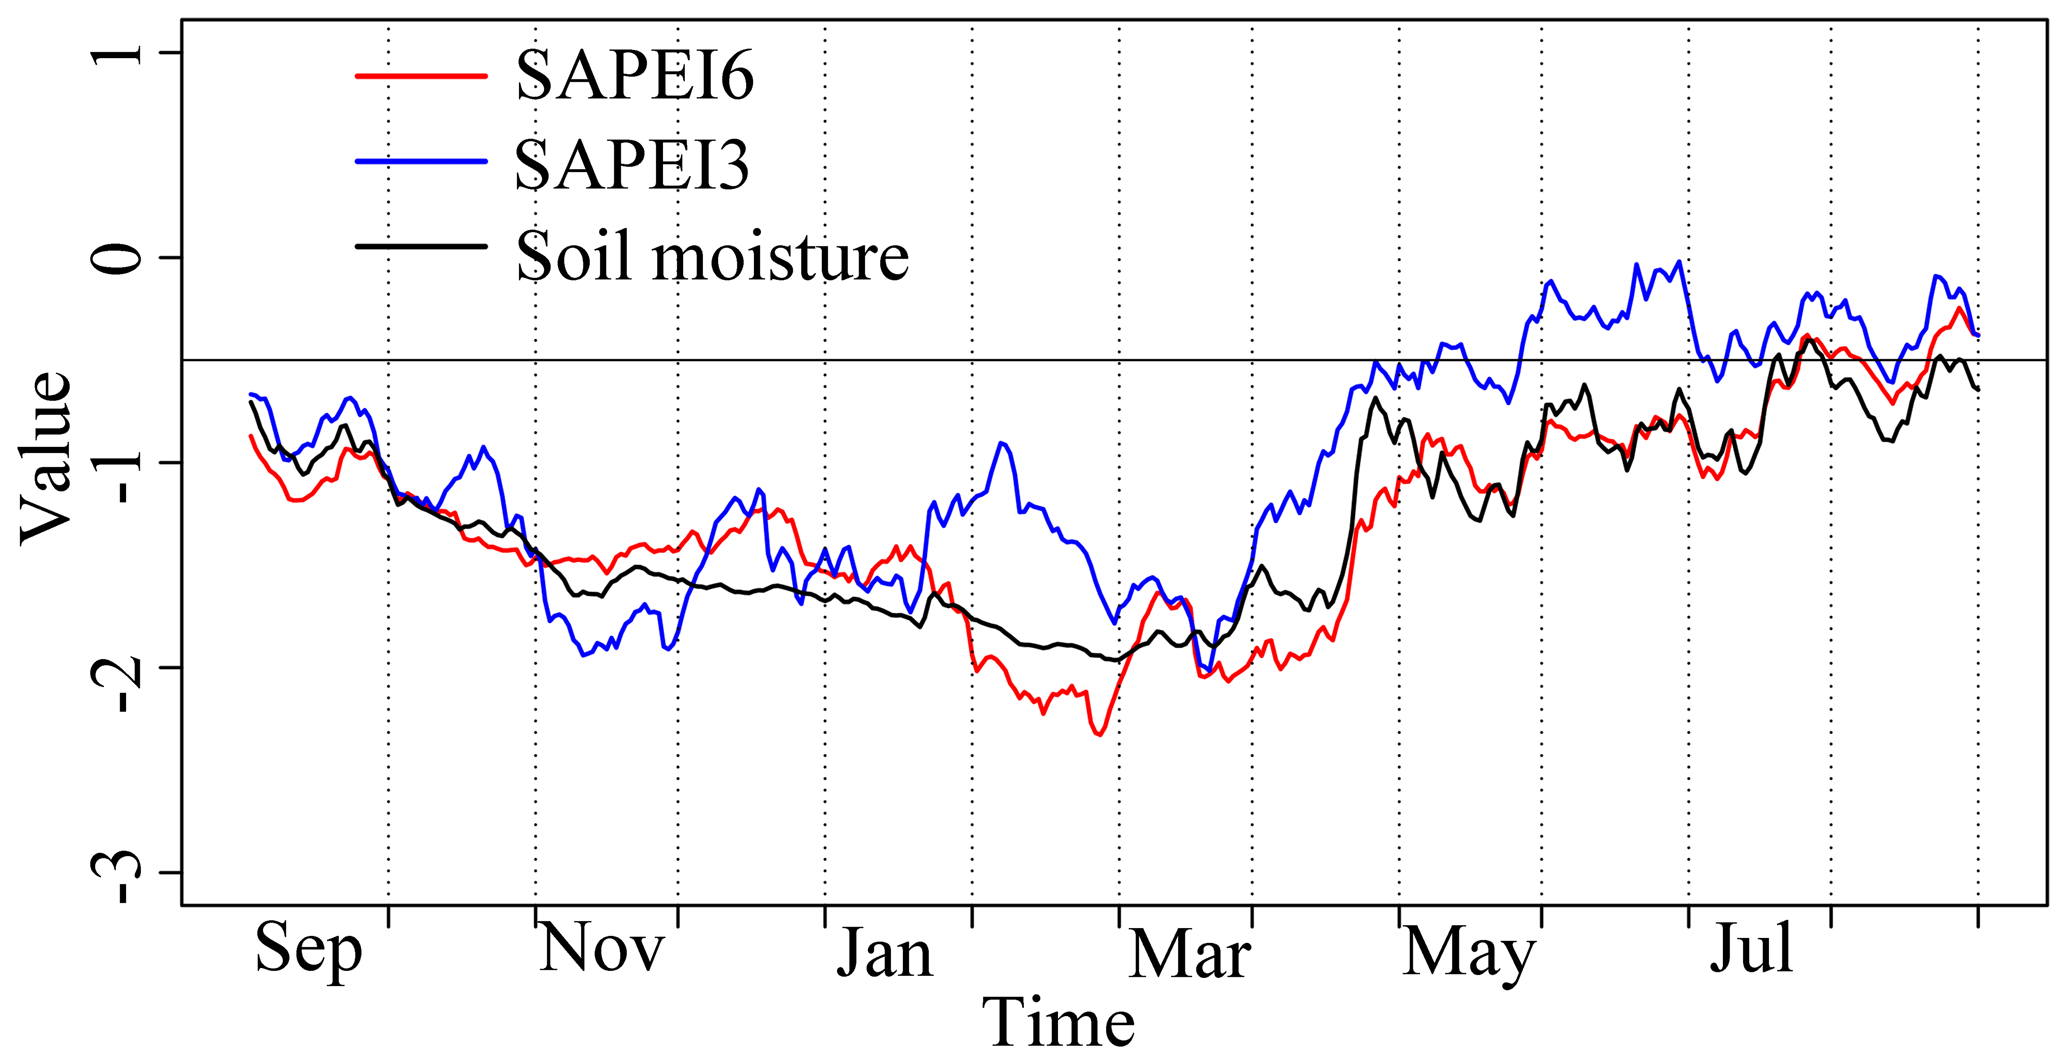
Figure 5SAPEI and soil moisture series during the 2009/2010 drought event over southwestern China. The spatially averaged series are shown. The value of the solid black line is at −0.5, indicating the distinction between drought and non-drought conditions.
In 2011, a particularly unusual drought event occurred in the middle and lower reaches of the Yangtze River basin (MLR-YRB). The MLR-YRB is generally in a wet condition. Nevertheless, it suffered its worst drought in the last 50 years during the spring of 2011. This drought caused shortage of drinking water for 4.2 million people, and 3.7 million hectares of crops were damaged or destroyed (Lu et al., 2014; Xu et al., 2015). As shown in Fig. S5, the monthly spatial evolution of the 2011 drought indicated by the SAPEI is broadly similar to those by the SPEI and PDSI. The temporal evolution of this event in MLR-YRB described by the daily SAPEI and soil moisture is shown in Fig. 6. The drought started to appear in the northern part of the MLR-YRB in early February 2011 and then gradually expanded to the whole MLR-YRB during early February until 15 March. A severe drought condition persisted in this region for 78 d (from 15 March to 31 May). Afterwards, drought conditions alleviated and most of the MLR-YRB continued to be under light and moderate drought conditions.
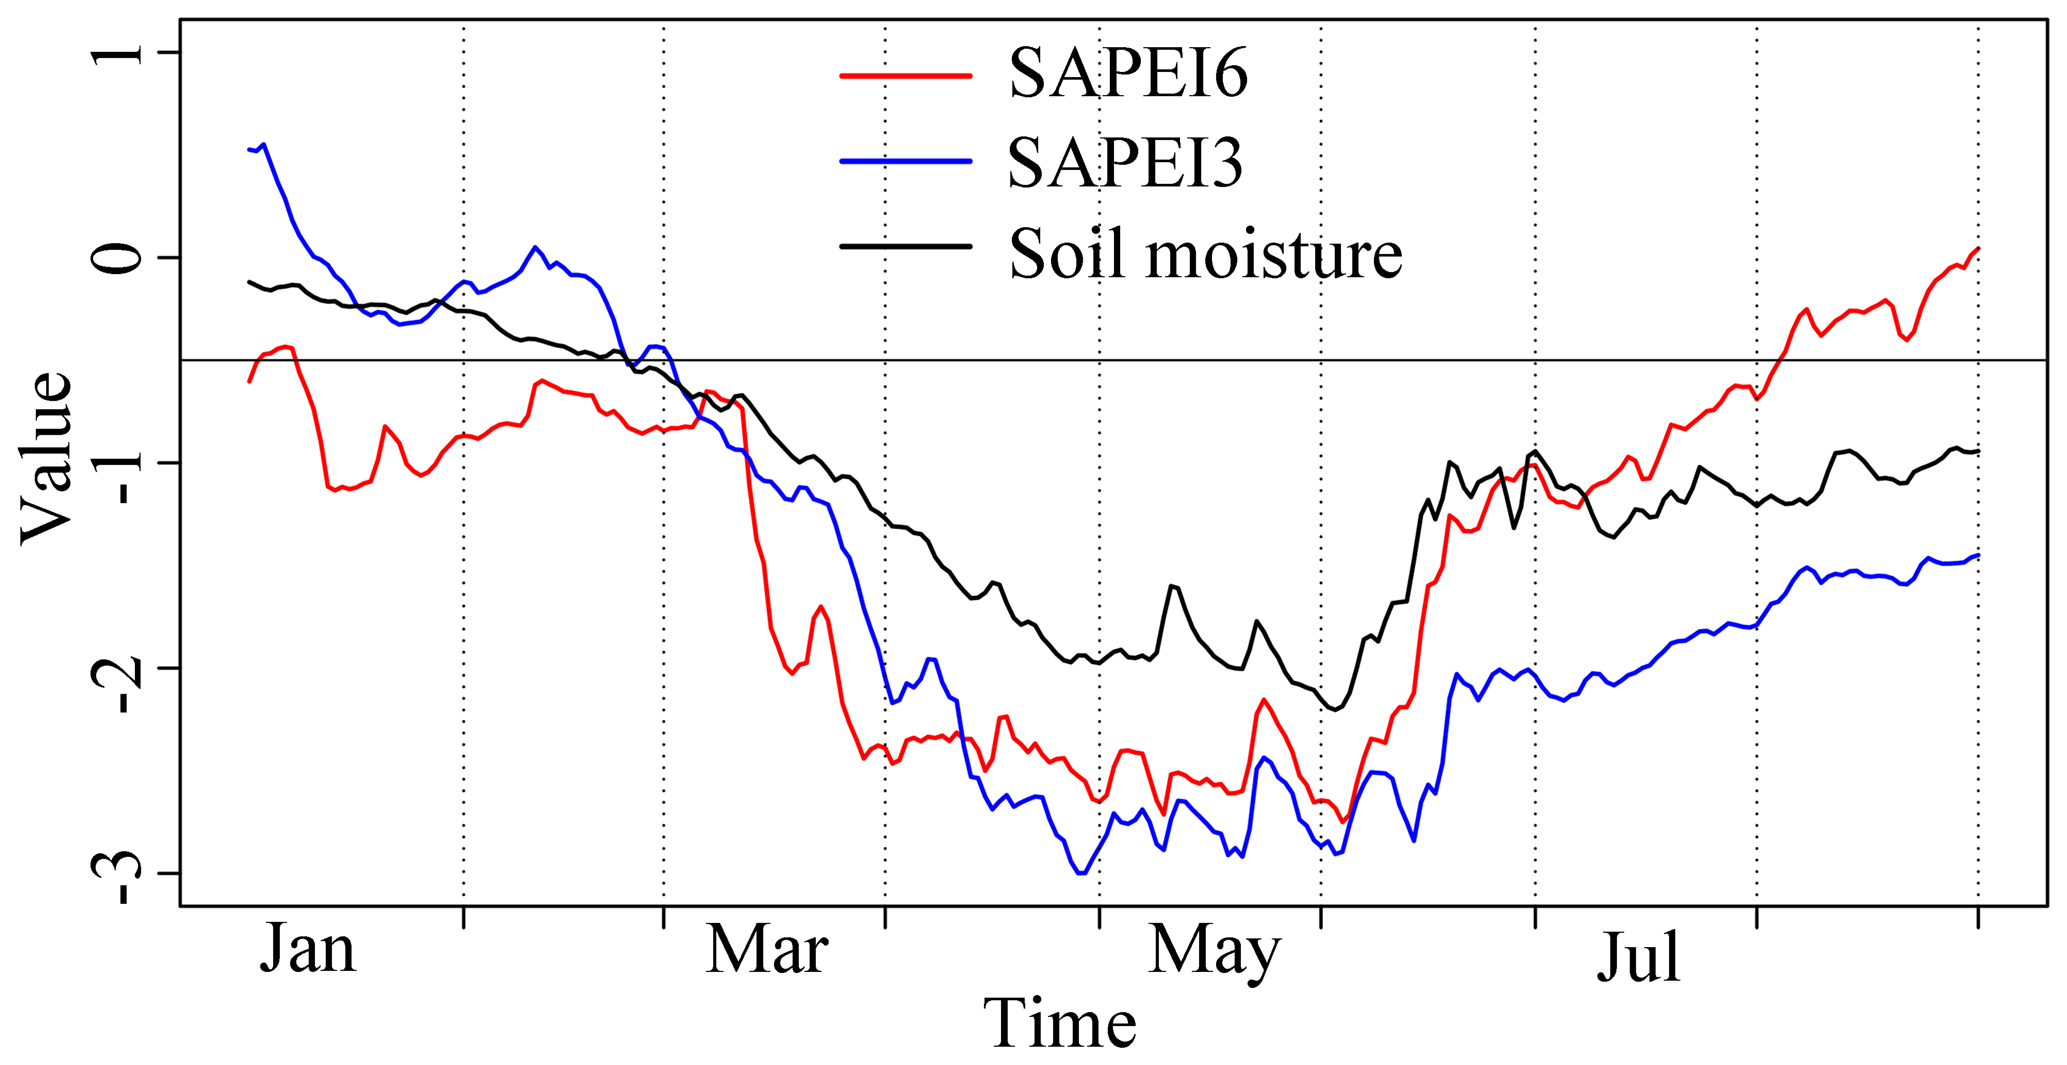
Figure 6SAPEI (3- and 6-month) and soil moisture series during the 2011 drought event over the middle and lower reaches of the Yangtze River. The spatially averaged series are shown. The value of the solid black line is at −0.5, indicating the distinction between drought and non-drought conditions.
Overall, similarly to the SPEI, the SAPEI includes multiple timescales (3-, 6-, 9-, and 12-month) to monitor drought at monthly resolution and is relatively sensitive to soil moisture variations. However, the SAPEI has the advantage of allowing for sub-monthly drought monitoring. Such an index could help fill a gap between science and applications in that it could be operationally used for detecting and monitoring both short-term and persistent droughts.
3.2 Evaluation of the SCDHI
The SCDHI was developed by linking the marginal distribution of the SAPEI and STI. Though the copula method has been widely utilized to connect two dependent distributions, the ability of the SCDHI to capture compound dry-hot events needs to be tested. Figure 7 shows the spatial distributions of the correlations between the SCDHI and SAPEI/STI at a daily scale across China. The SCDHI all showed strong (p < 0.01) correlation with the SAPEI at 3-, 6-, 9- and 12-month scales in China, with correlation coefficients higher than 0.7. A significant correlation (p < 0.01) was also detected between the STI and SCDHI at multiple scales. Hence, the SCDHI is overall well correlated with univariate variations in drought and heatwave occurrence.

Figure 7The correlation between the SAPEI/STI and SCDHI during the historical period (1961–2018).
To further test the drought-heat monitoring performance of the SCDHI, two typical compound dry-hot events were chosen as case studies according to the Yearbook of Meteorological Disasters in China. One is a well-known compound drought and heatwave striking the Sichuan–Chongqing region with serious consequences during the summer of 2006 (Wu et al., 2020), and the other occurred in southern China with adverse impacts on agriculture during July to September of 2009 (Wang et al., 2010). The Sichuan–Chongqing region experienced continuous extreme temperatures during mid-June to late August 2006. The duration and severity of this heatwave were the worst on the historical record. Simultaneously, a 100-year drought hit the region. During this compound event, a population of over 10 million was confronted with a drinking water shortage, about 20 000 km2 of cropland suffered serious losses, and more than 100 forest fires broke out. Local governments issued the most serious aridity warning (Zhang et al., 2008). The monthly spatial pattern of this compound event in the Sichuan–Chongqing region is shown in Fig. S6, indicating that the region experienced moderate to extreme compound dry and hot conditions based on the SCDHI during the 2006 summer. Figure 8 maps the spatial pattern of this compound event and its impact on vegetation from mid-June to late August at a weekly scale. The event started to appear in the Sichuan–Chongqing region in mid-June 2006 and gradually spread throughout the whole Sichuan–Chongqing region during 19 to 26 June. The moderate dry-hot conditions then persisted in the entire Sichuan–Chongqing region from 27 June to 5 August 2006, lasting for 40 d. Scattered negative leaf area index appeared in some of the dry-hot affected areas. During 6 to 21 August, the dry-hot event became more severe with the onset of extremely hot temperatures, causing negative vegetation anomalies in most of the affected areas.
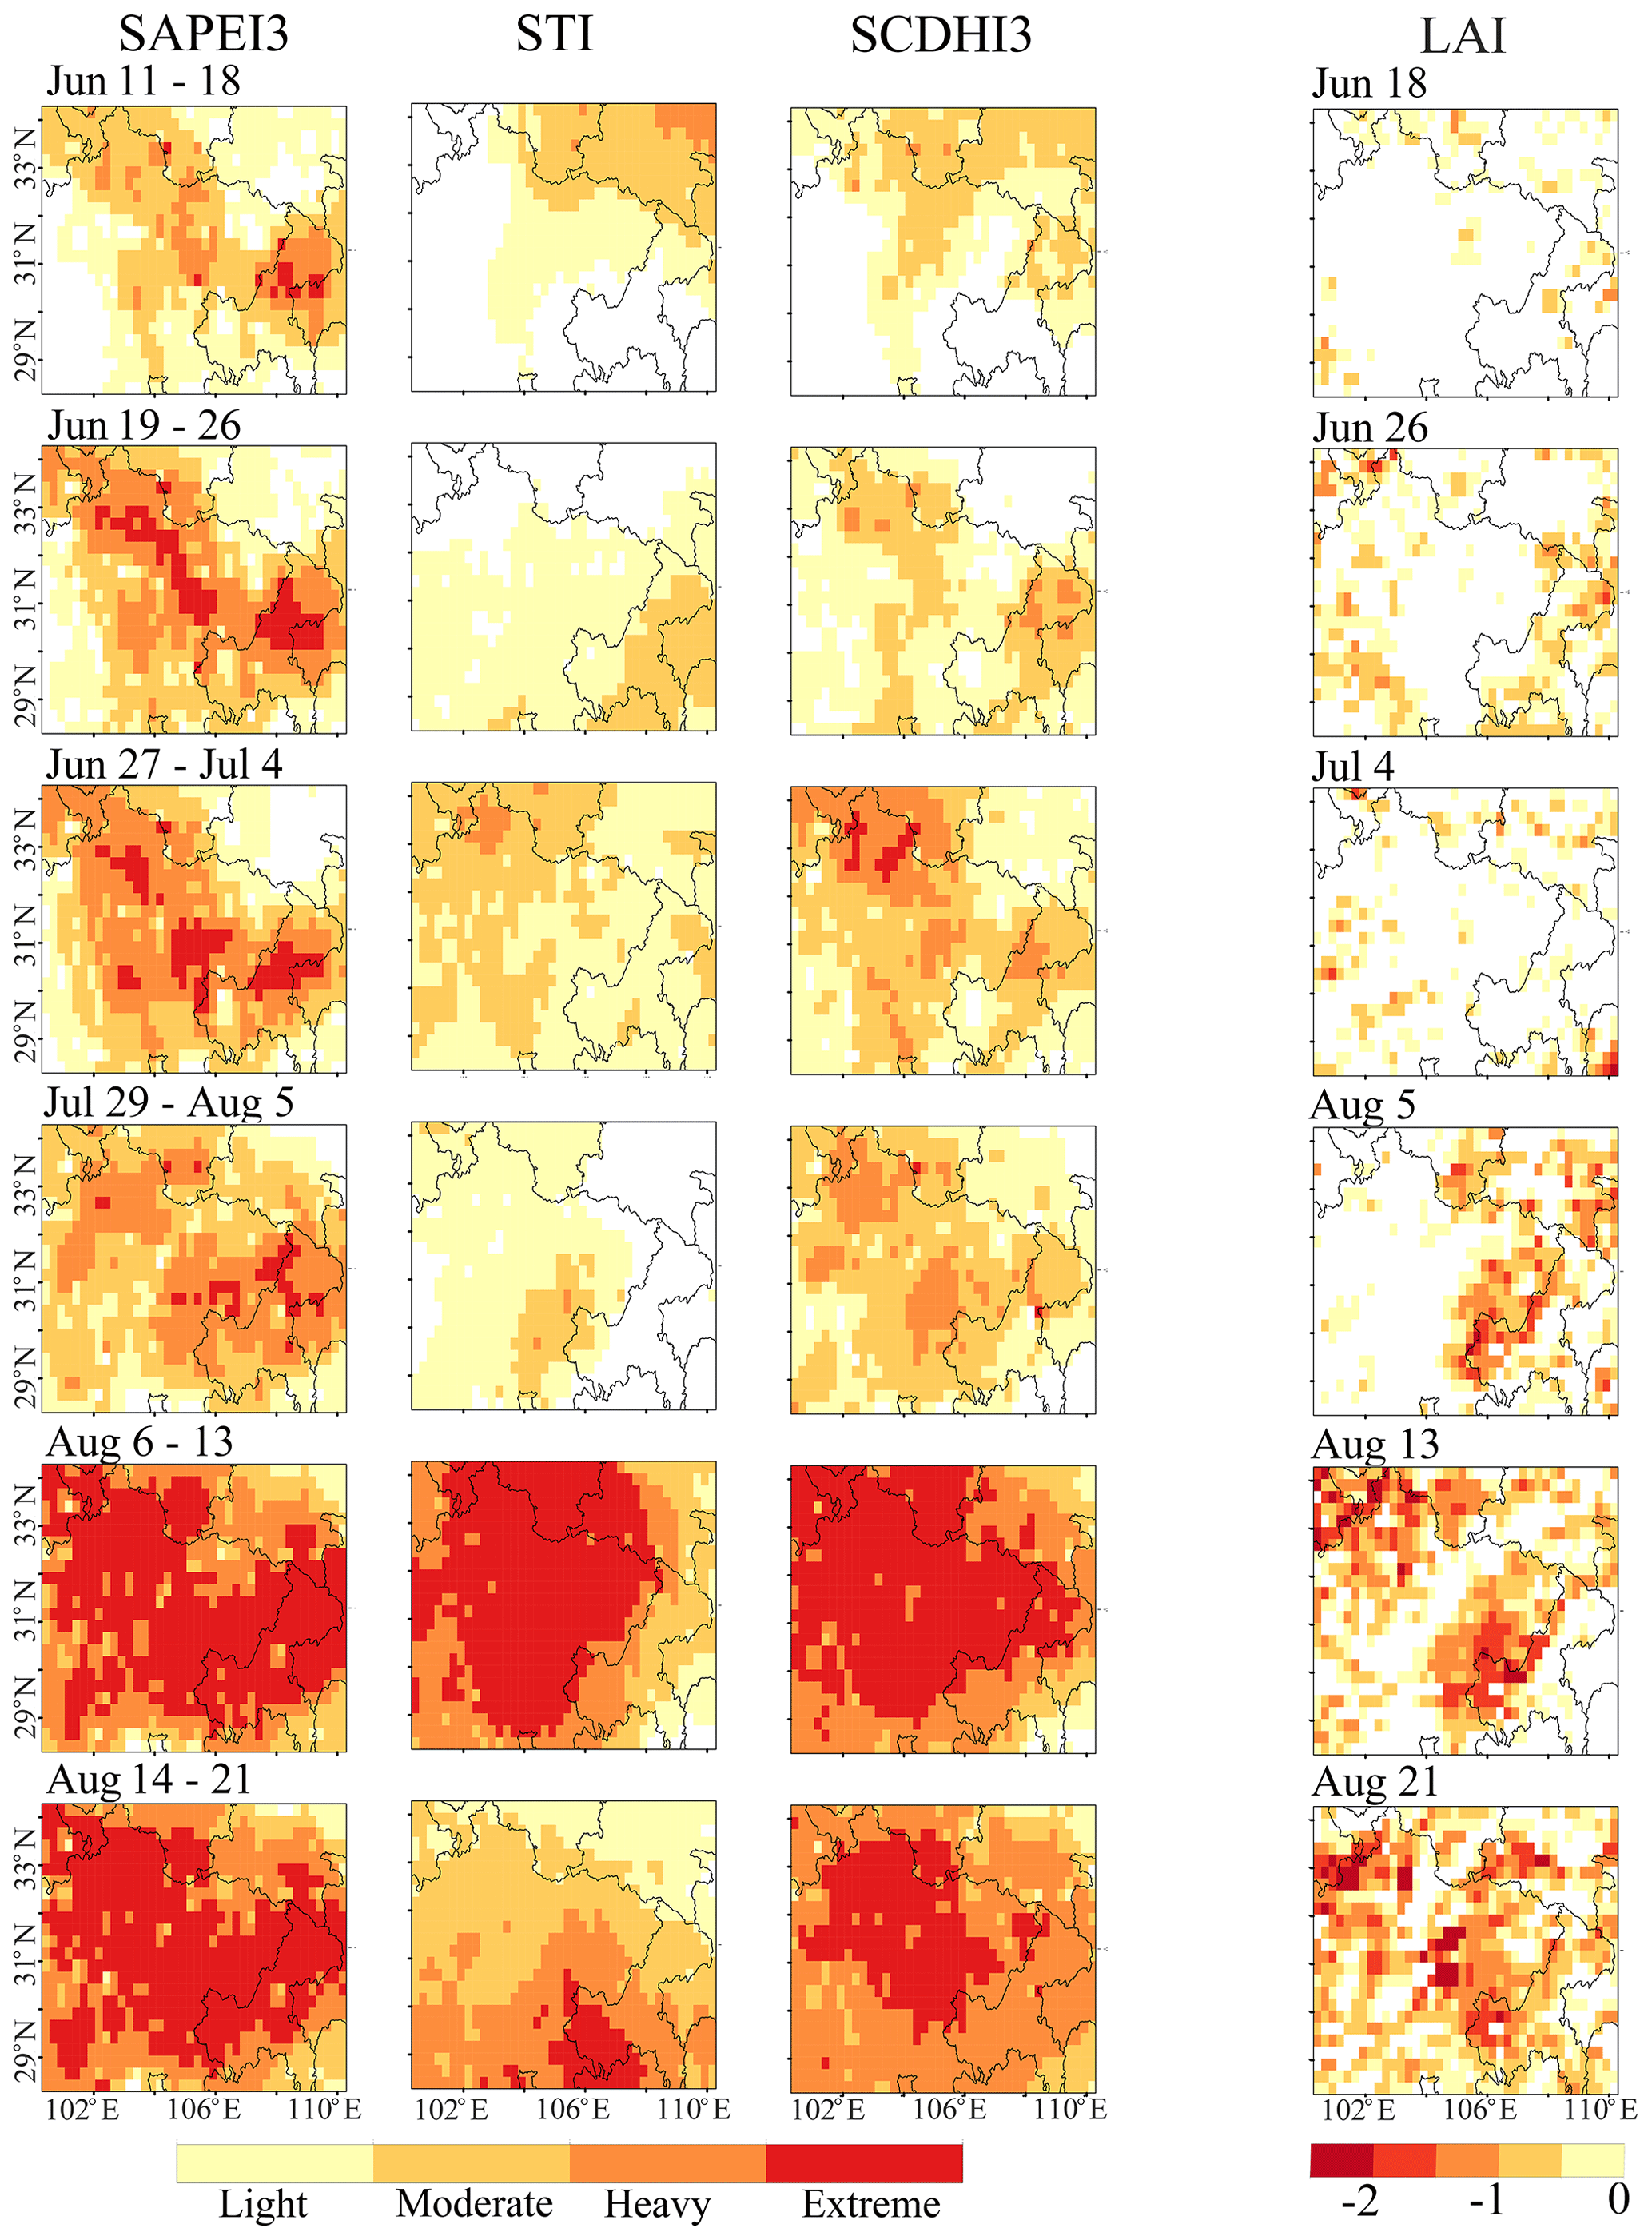
Figure 8The spatial evolutions of the compound dry and hot event over the Sichuan–Chongqing region in 2006 and its impact on vegetation as weekly averages.
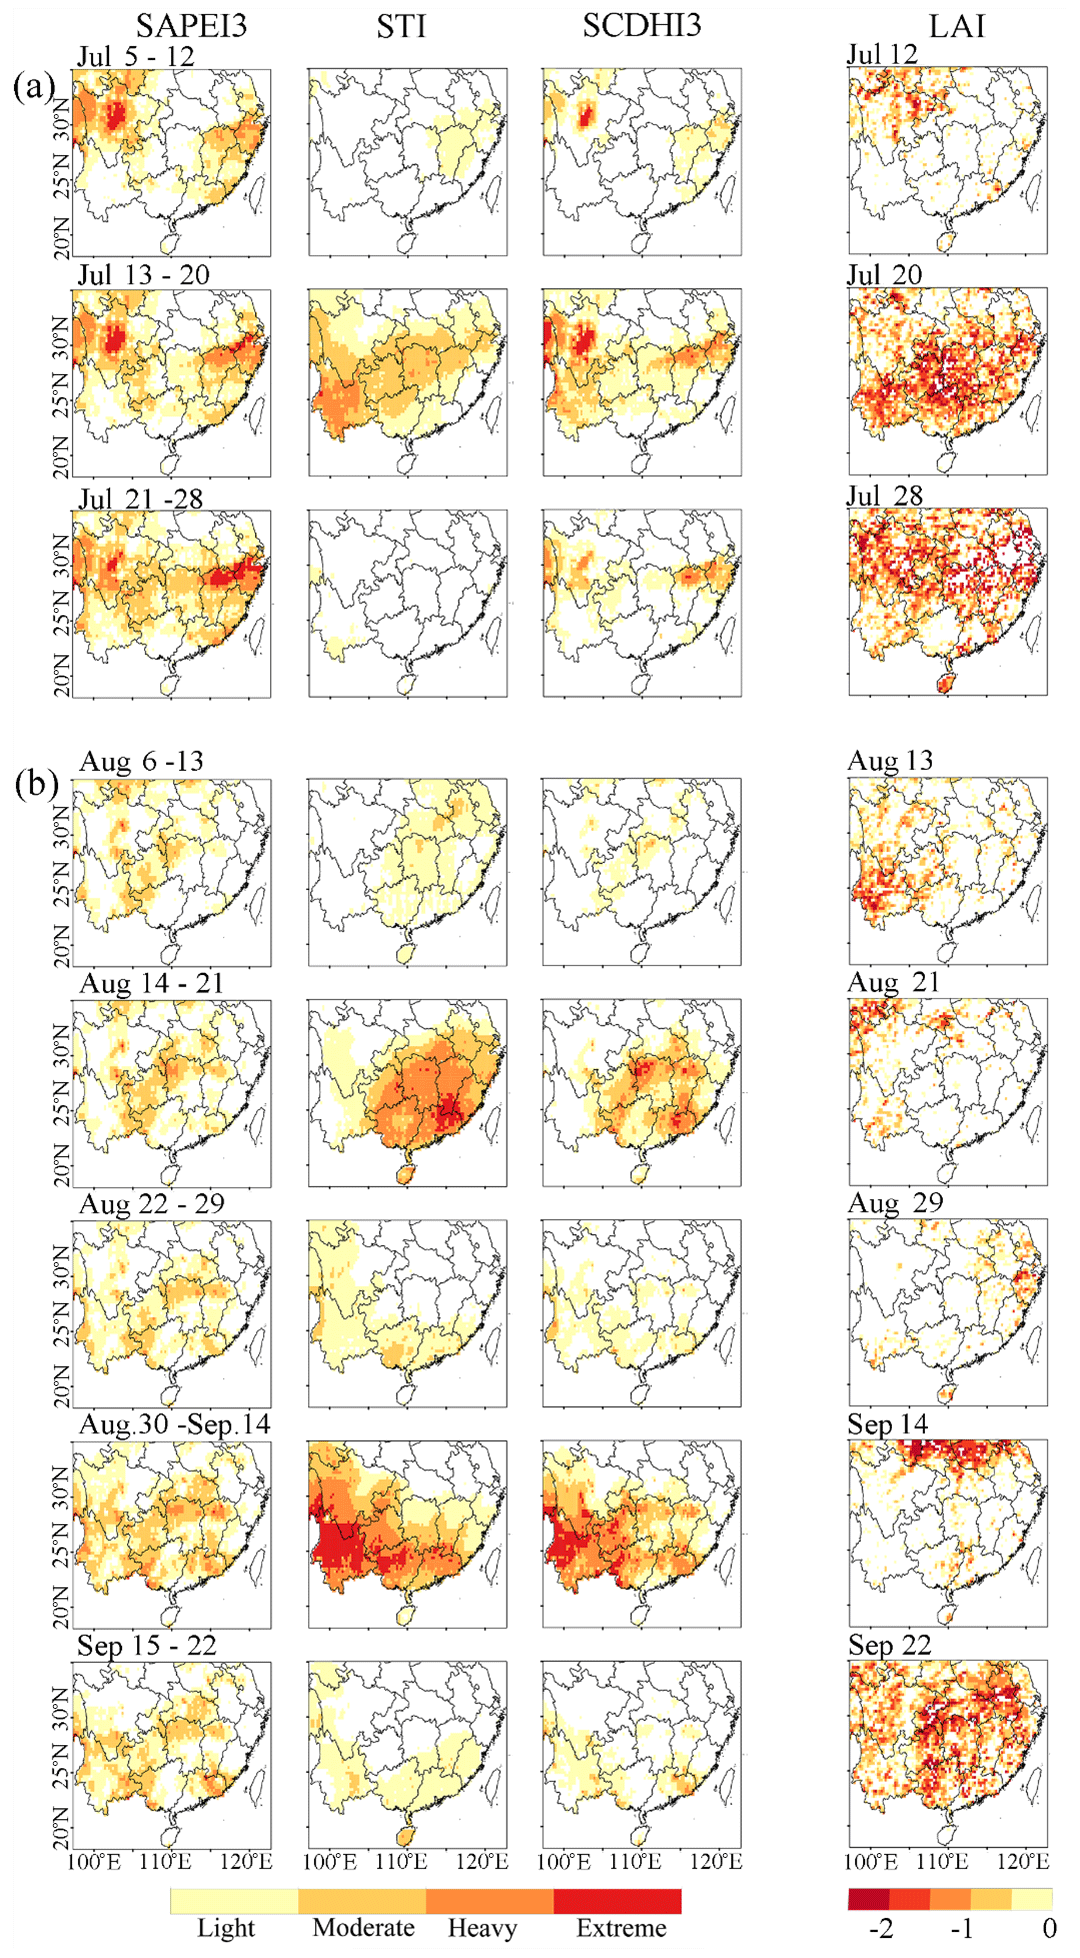
Figure 9The spatial evolutions of the compound dry and hot event over southern China in 2009 and its impact on vegetation as weekly averages.
The monthly spatial patterns of another compound event in southern China during July to September 2009 are shown in Fig. S7. Overall moderate to heavy compound dry and hot conditions are observed at the monthly scale in this region. However, the event showed large fluctuation at a weekly scale. According to the yearbook, the heatwave was divided into two periods: the first stage was from early to late July, and the other stage was from mid-August to early September. The fluctuating compound event caused adverse impacts on crop pollination and grain filling, resulting in decreased crop production. Figure 9 maps the spatial pattern of this event and its impact on the leaf area index at a weekly scale. In the first stage, the dry-hot event hit most of southern China during 5 to 12 July before it became more severe in the western part of southern China during 13 to 20 July. The heatwave suddenly disappeared between 21 and 28 July, leading to disappearance of the compound event in most of southern China (Fig. 9a). Afterward, the compound event hit this region again from 6 to 13 August, and its intensity was particularly strong from 14 to 21 August, with very hot conditions. Subsequently, the intensity and spatial extent of the compound event faded away in the north of southern China during 22 to 29 August. This event extended to most of this region again from 30 August to 14 September, with severe dry and hot conditions. The compound events still stayed in this region from 15 to 22 September (Fig. 9b). Despite the short-term event, reductions in vegetation activity were found in most of the dry-hot affected areas. This complex event indicates that monthly analyses of compound events can provide an overall situation but are unable to capture the serious compound dry and hot conditions caused by extreme climate anomalies at shorter timescales.
Overall, the changes in these two compound dry-hot events based on the SCDHI are consistent with the national weather records (http://www.weather.com.cn, last access: 10 January 2021) and the Yearbook of Meteorological Disasters in China 2010. In summary, the SCDHI is able to robustly and reliably capture compound dry-hot events at a sub-monthly scale and potentially provide a new tool to objectively and quantitatively analyze and monitor the characteristics of compound dry-hot events in time and space.
3.3 Application of the SCDHI in China
We evaluate and compare the spatiotemporal variation of characteristics of compound dry-hot events in China during the growing season (April–September) because such events can more easily cause adverse impact on agriculture and ecosystem during these periods (Hao et al., 2018b; Wu et al., 2019; Zscheischler and Fischer, 2020). More precisely, the compound dry-hot events and their characteristics (frequency, duration, severity, and intensity) were identified based on the 3-month scale SCDHI and run theory with different thresholds (Wu et al., 2018). We further assessed how well climate models are able to represent compound-event characteristics. Given that short-term concurrent dry and hot events often persist for at least weeks (Otkin et al., 2018), only events that lasted for more than 2 weeks are considered.
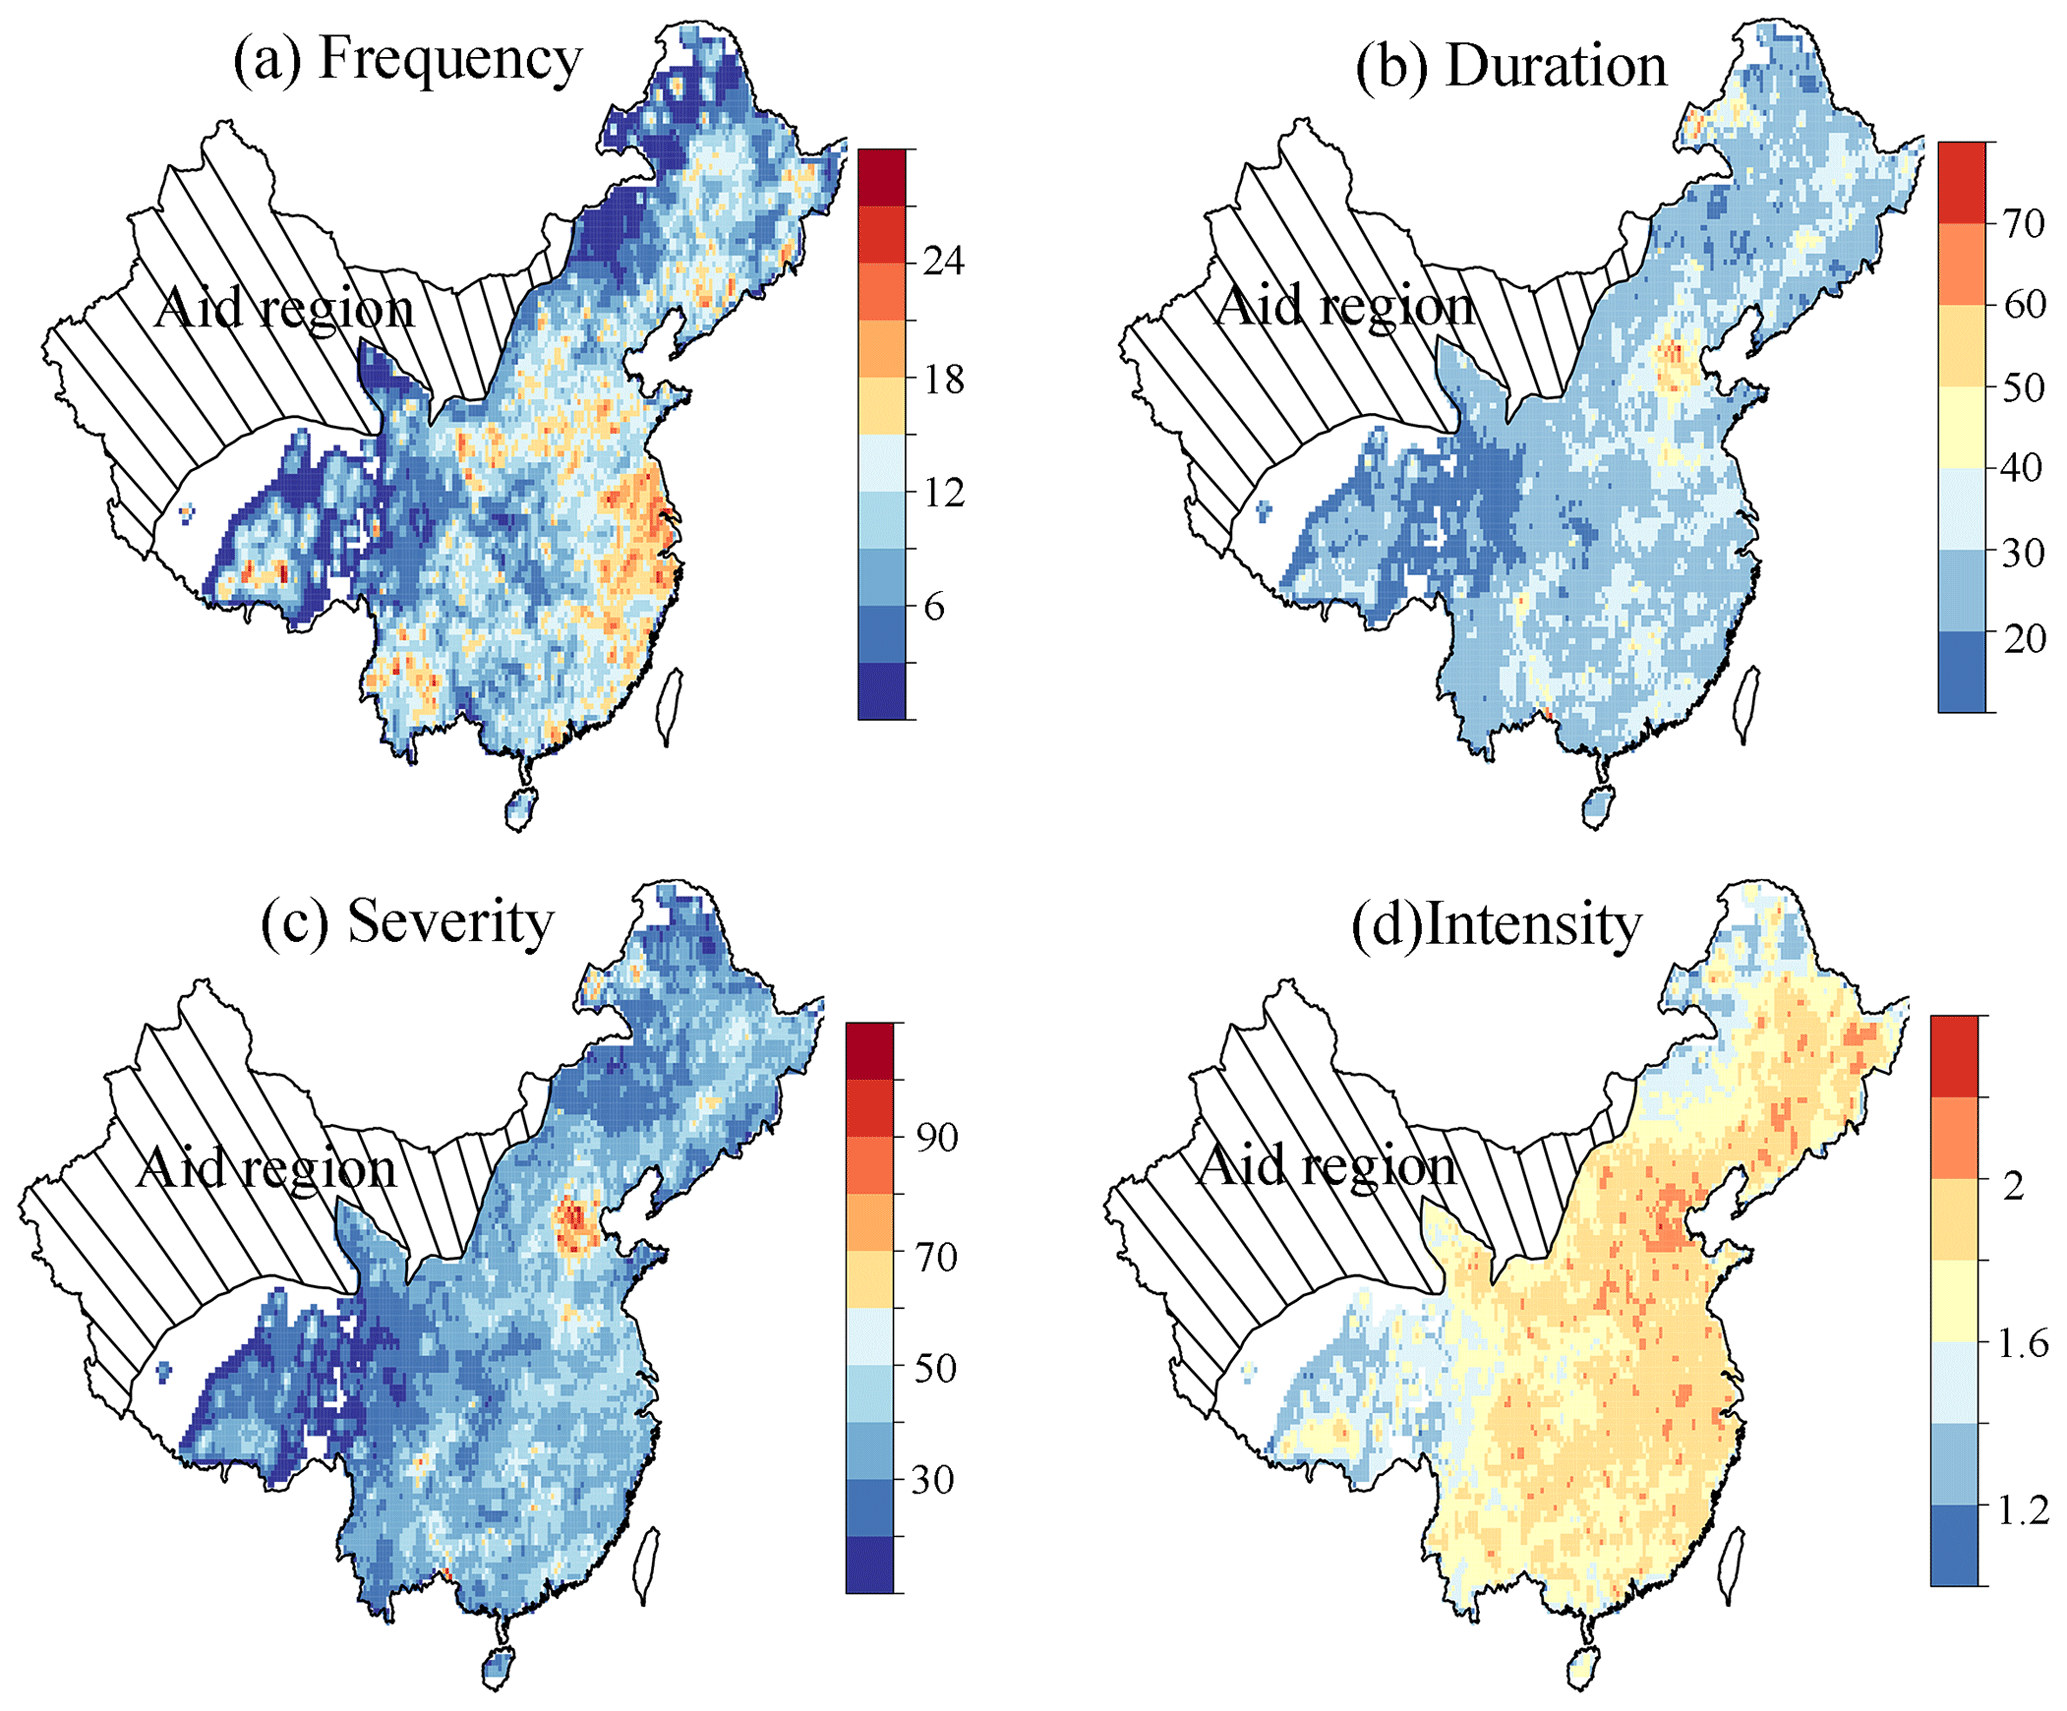
Figure 10The spatial pattern of the key characteristics of compound dry and hot events in China from 1961 to 2018, using the threshold of −0.8 in run theory. Frequency (a) refers to the total events during the historical period; duration (b), severity (c), and intensity (d) are the average values of all events. White color indicates there are no events. Only events lasting at least 2 weeks are considered.
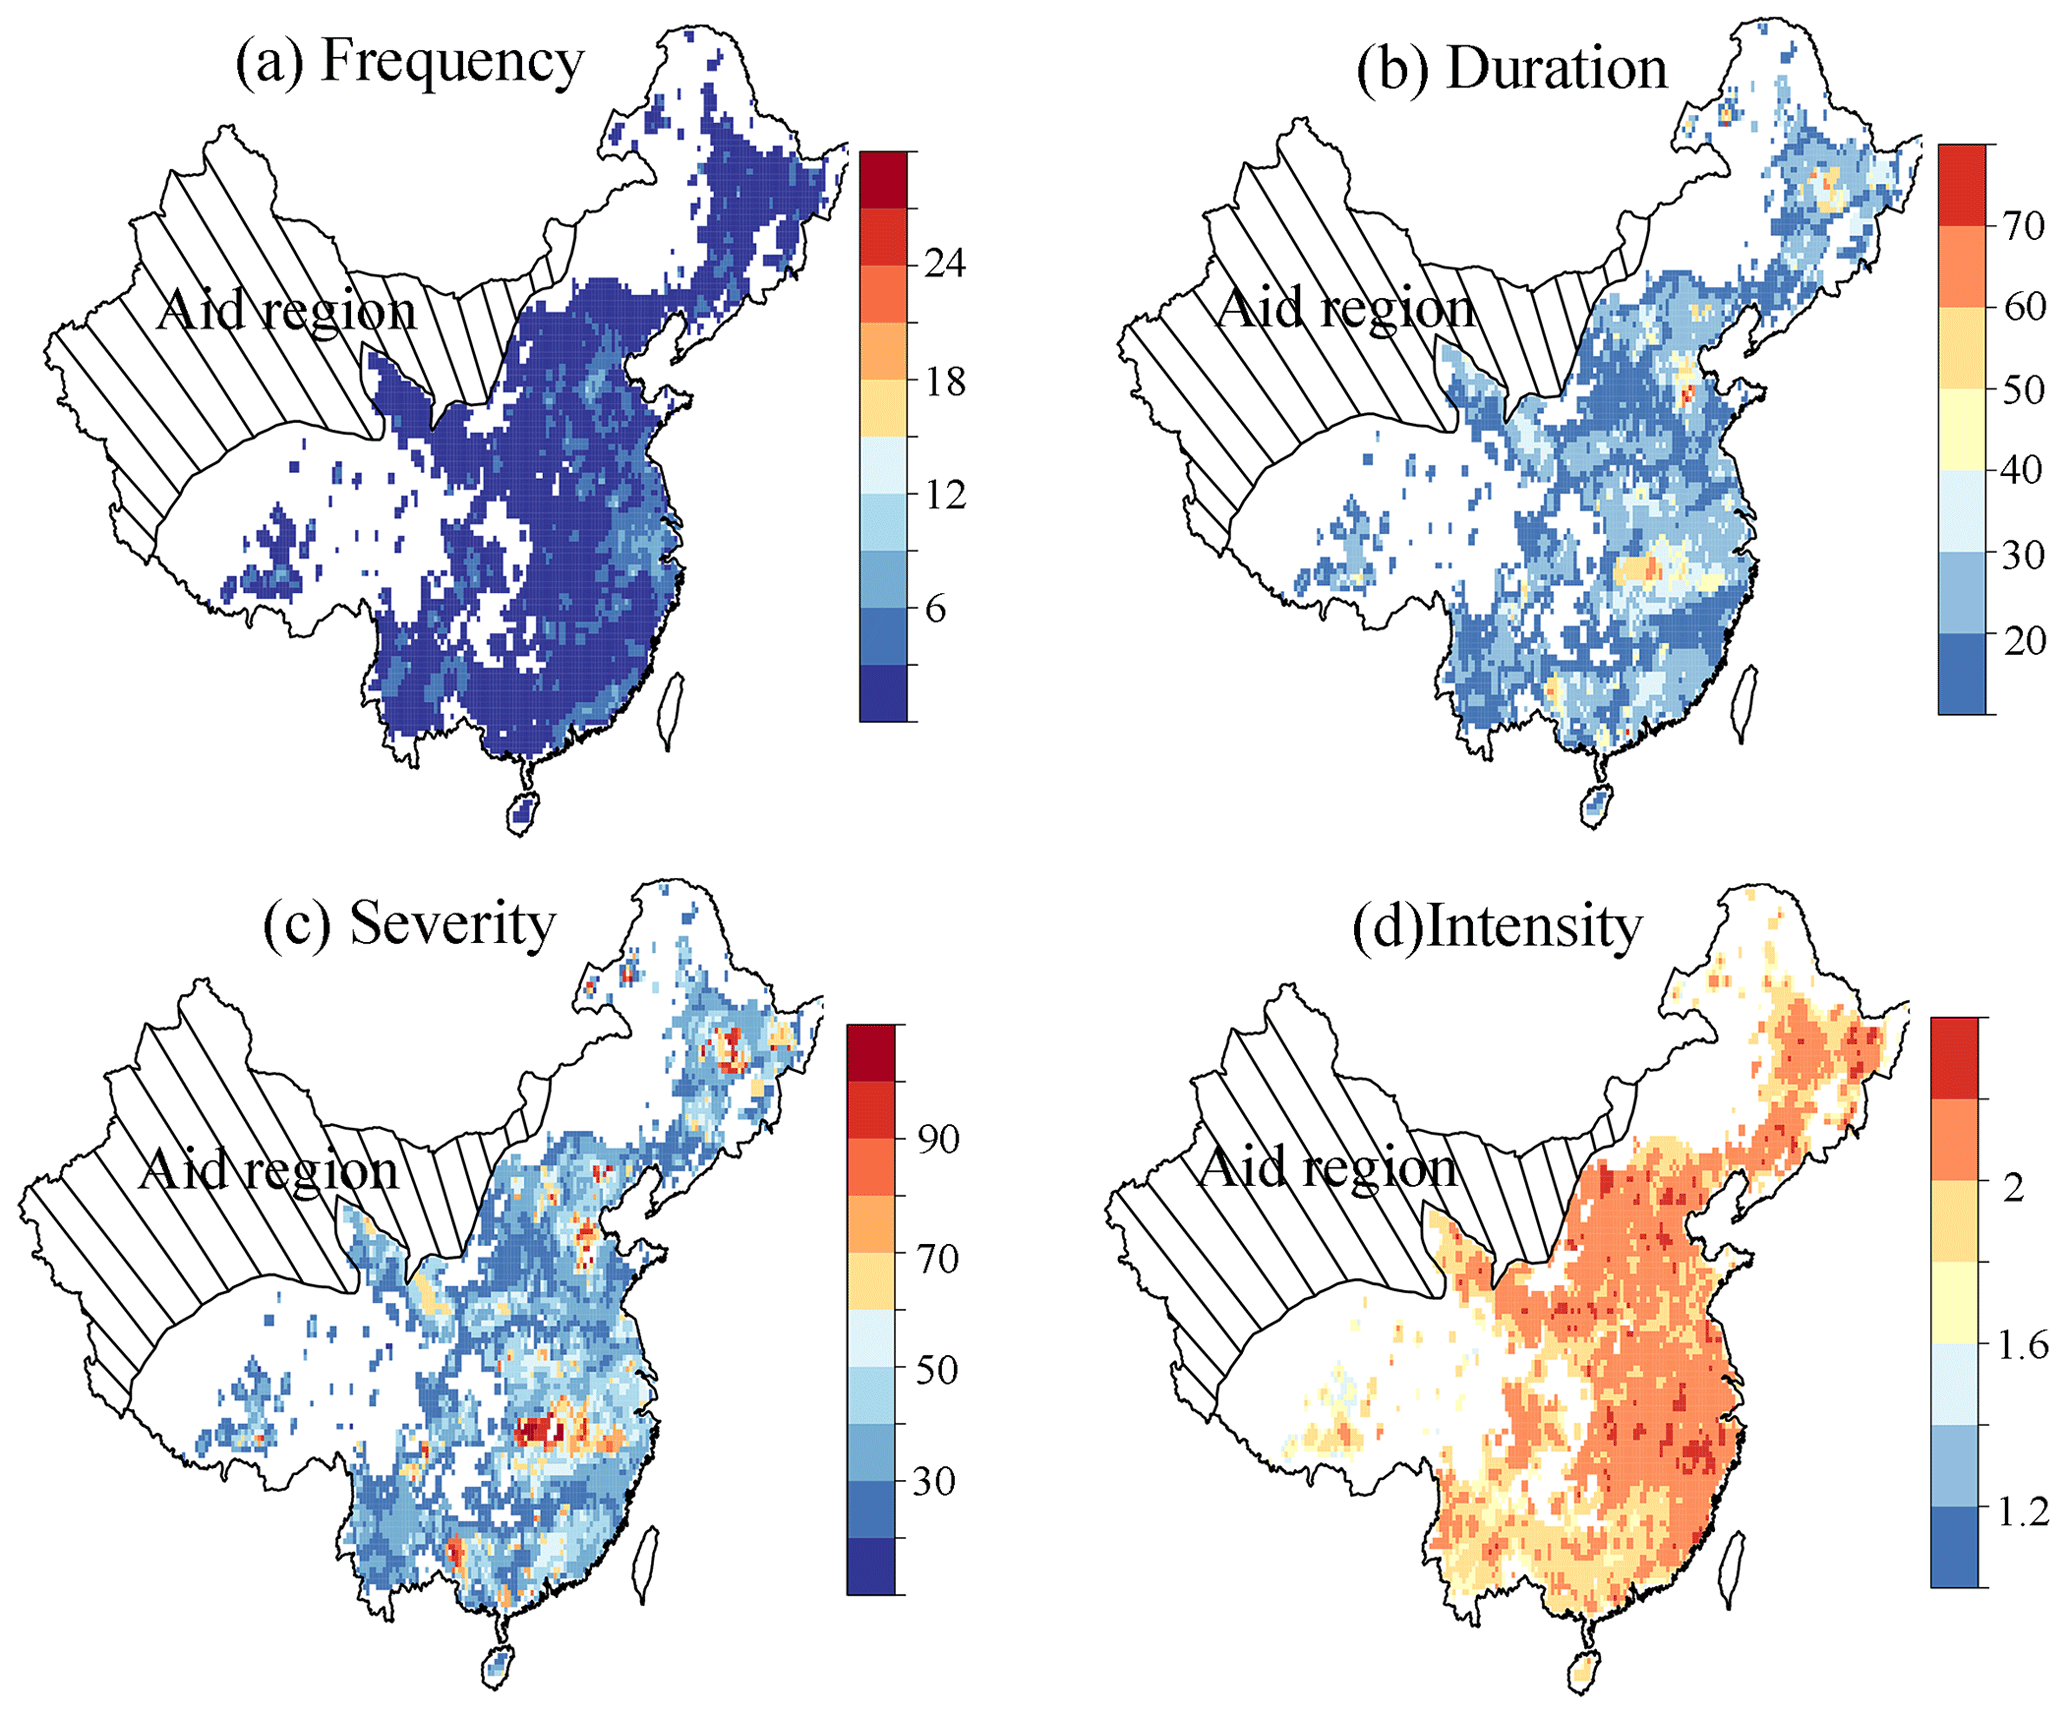
Figure 11The same as Fig. 10 but using the threshold of −1.3 in run theory. The definitions of the frequency, duration, severity, and intensity are the same as Fig. 10. White color indicates there are no events.
Figure 10 shows spatial patterns of key characteristics of the identified compound dry-hot events, with the threshold being set to −0.8 in run theory. A high frequency of compound events is detected in southern China, with occurrence of one event every 2 years on average. In contrast, the eastern Tibetan Plateau and northeastern China experienced fewer compound events (Fig. 10a), which was generally consistent with earlier studies (Liu et al., 2020; Wang et al., 2016). On average, compound dry-hot events generally lasted for about 20 to 35 d in most of China, while in the eastern Tibetan Plateau, a compound dry-hot event persisted for less than 20 d (Fig. 10b). Mean severity and intensity of compound dry-hot events show somewhat similar patterns in relative terms and highlight that most of eastern China experienced the highest severity and intensity (Fig. 10c–d). The spatial patterns are overall similar when using a threshold of −1.3 (Fig. 11) of −1.6 (Fig. S8) in run theory. As expected, frequency and duration tend to decrease, while severity stays similar and intensity tends to increase at more extreme thresholds. White areas indicate regions where no events longer than 2 weeks occurred.
Overall, southern China suffers more frequent compound dry-hot events, with higher severity and intensity. Southern China is a humid region where evapotranspiration is mainly controlled by energy supply because soil moisture is usually not limiting. In cases of low soil moisture at the beginning of a drought, evaporative demand can increase rapidly during a short period if strong, transient meteorological changes (such as extreme temperature) occur, which in turn deplete soil moisture and thus intensify drought conditions (Zhang et al., 2019; Otkin et al., 2018). Moreover, vegetation over southern China is usually abundant and plants tend to suck more water from the soil during high temperatures, causing evapotranspiration increase and soil moisture decline (Li et al., 2020c; Wang et al., 2016). As a consequence, the sensible heat flux increases, leading to increasing air temperatures (Mo and Lettenmaier, 2015, 2016). These land–atmosphere interactions cause the Bowen ratio to increase (Otkin et al., 2013, 2018), creating favorable conditions for short-term concurrence of droughts and heatwaves. Therefore, compound dry-hot events with high severity and intensity are more likely to occur in humid regions.
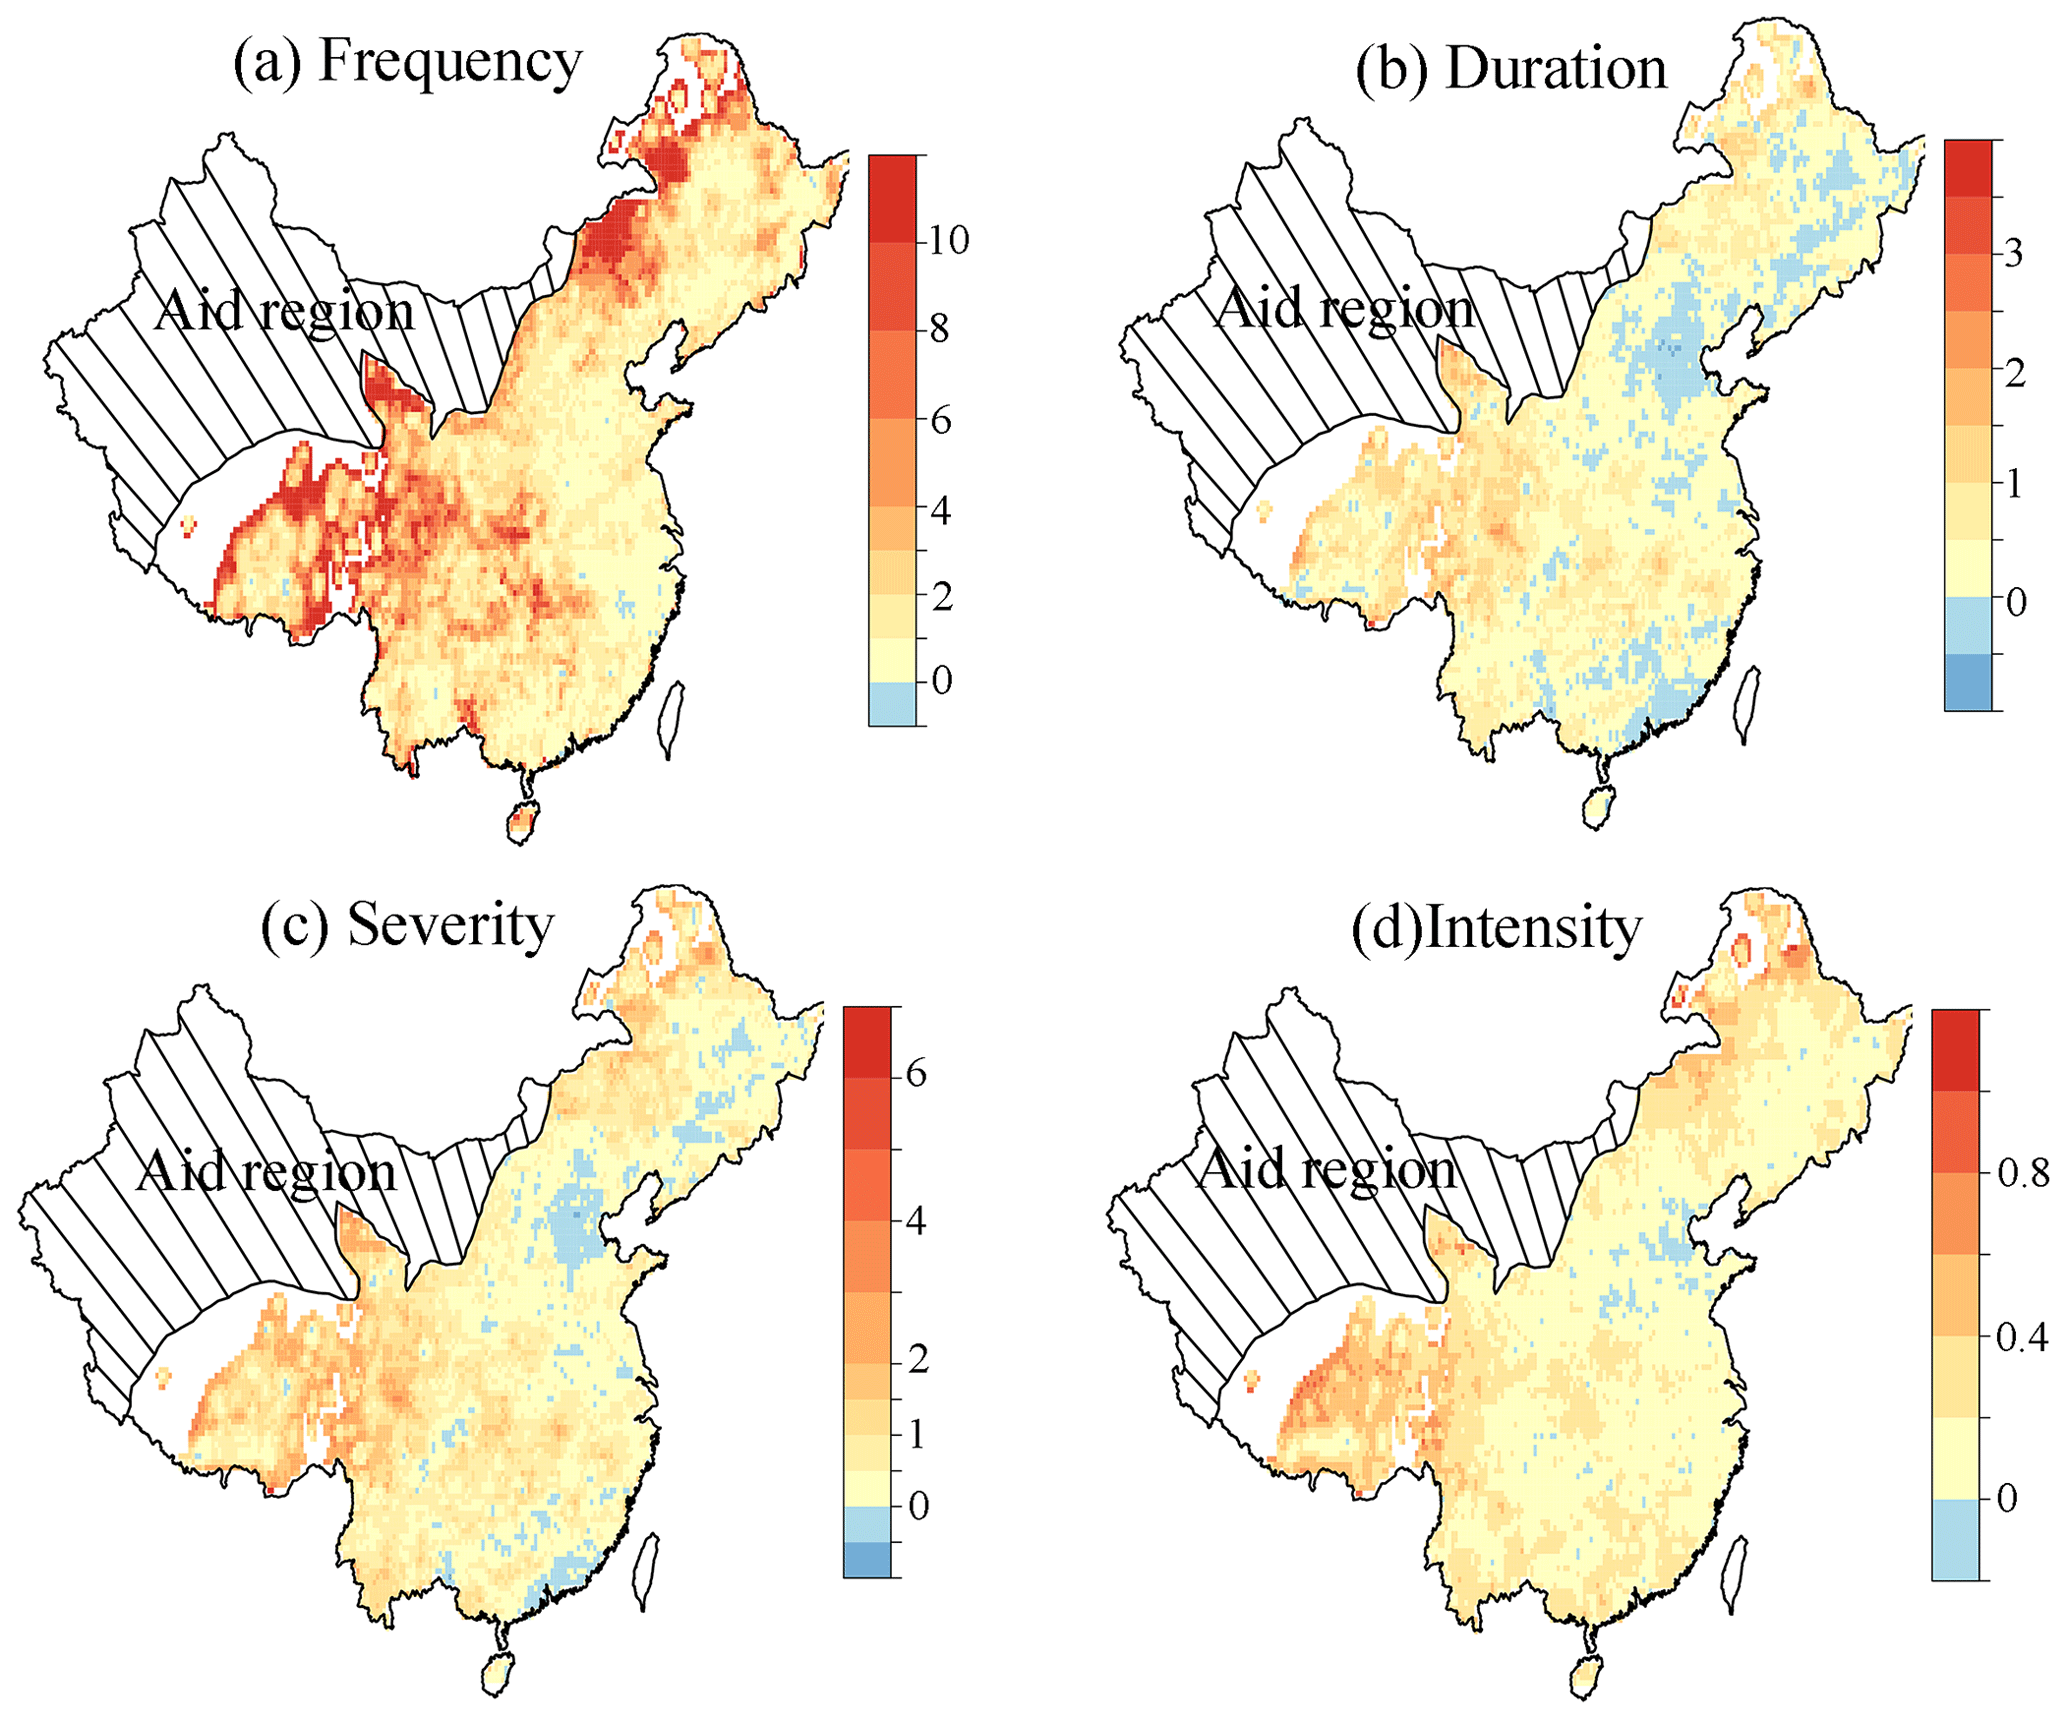
Figure 12Relative climate model biases in the characteristics of compound dry and hot events in China. The biases are computed as the ratio of the difference between model and observational values to the observational values. The definitions of the frequency, duration, severity, and intensity are the same as Fig. 10. White color indicates there are no events. The periods are from 1961 to 2005. The threshold in run theory is −0.8.
Figure 12 illustrates how well compound-event characteristics are captured by climate models. On average, climate models overestimate compound dry-hot frequency in particular for western China, suggesting frequencies that are up to 6 times higher than observations (Fig. 12a). In the east, biases are much smaller but still show an overestimation. Climate models also generally overestimate the duration of and severity of compound dry-hot events, in particular in the west of China, whereas both characteristics are better captured in the east (Fig. 12b, c). Relatively small biases are present for the intensity of compound dry-hot events (Fig. 12d). All in all, the climate models potentially strongly overestimate the occurrence of compound dry-hot events in China, especially for the western region, which is likely related to the climate models overestimating the strength of the dependence between the SAPEI and STI (Fig. S9).
Given the identified biases in climate models in the dependence between the SAPEI and STI in China, multivariate bias adjustment methods are required to reliably estimate future climate risk of compound events (François et al., 2020). Furthermore, this dependence may also change under warmer conditions. For instance, the negative correlation between seasonal mean summer temperature and precipitation is projected to intensify in many land regions, which could lead to more frequent dry and hot extremes in addition to long-term trends in temperature and precipitation (Kirono et al., 2017; Zscheischler and Seneviratne, 2017).
Short-term compound dry-hot events can cause substantial damage. Correspondingly, a compound drought and heat index should be able to monitor such an event at sub-monthly scales in order to reflect in a timely manner the evolution of concurrent dry and hot conditions. In this study, we developed a multiple-timescale (e.g., 3-, 6-, 9-, and 12-month) compound drought and heat index, termed the SCDHI, to monitor both short-term (e.g., days or weeks) and long-term (e.g., months) compound events. This index was established based on a daily drought index (SAPEI) and the standardized temperature index (STI) using a joint probability distribution method. Using the SCDHI, we quantified key characteristics (i.e., frequency, intensity, severity, and duration) of compound dry-hot events in China in the historical period (1961–2018) and investigated how well climate models simulate these characteristics. The main conclusions of this study are presented as follows: the SCDHI can well identify simultaneous dry and hot conditions during historic high-impact events. Hereby, the monthly SCDHI can provide an overall situation of the compound dry and hot conditions, whereas the sub-monthly SCDHI can well capture fluctuation of simultaneous droughts and heatwaves within a month. The SCDHI is further a good indicator of compound dry and hot conditions on vegetation health. In the case of China, the southern regions suffered compound dry-hot events most frequently, with generally higher severity and intensity. On average, compound dry-hot events exceeding the light category typically lasted for 20 to 35 d. Climate models tend to overestimate the frequency, duration, and severity of compound dry-hot events, particularly in the western region of China. In conclusion, the SCDHI offers a new tool to quantitatively measure the characteristics of compound dry-hot events and can provide detailed information on the initiation, development, and decay of such events for decision-makers and stakeholders.
The observed meteorological datasets are obtained from the China Meteorological Administration (http://data.cma.cn/; Yu et al., 2019). The CMIP5 datasets are obtained from the Coupled Model Intercomparison Project Phase 5 (https://esgf-node.llnl.gov/search/cmip5; Taylor et al., 2012).
The supplement related to this article is available online at: https://doi.org/10.5194/hess-25-1587-2021-supplement.
JL and XW conceived and designed the experiments. JL and XW performed the experiments. JL analyzed the data. JL, XW, ZW, JZ, SG, and XC wrote and edited the paper.
The authors declare that they have no conflict of interest.
This article is part of the special issue “Understanding compound weather and climate events and related impacts (BG/ESD/HESS/NHESS inter-journal SI)”. It is not associated with a conference.
The research is financially supported by the National Natural Science Foundation of China (51879107, 51709117), the Guangdong Basic and Applied Basic Research Foundation (2021A1515010935, 2019A1515111144), and the Water Resource Science and Technology Innovation Program of Guangdong Province (2020-29). Jakob Zscheischler is grateful to the Swiss National Science Foundation (grant no. 179876) and the Helmholtz Initiative and Networking Fund (Young Investigator Group COMPOUNDX, grant agreement VH-NG-1537).
This research has been supported by the National Natural Science Foundation of China (grant nos. 51879107 and 51709117), the Guangdong Basic and Applied Basic Research Foundation (grant nos. 2021A1515010935 and 2019A1515111144), the Water Resource Science and Technology Innovation Program of Guangdong Province (grant no. 2020-29), the Swiss National Science Foundation (grant no. 179876), and the Helmholtz Initiative and Networking Fund (Young Investigator Group COMPOUNDX, grant agreement VH-NG-1537).
This paper was edited by Bart van den Hurk and reviewed by three anonymous referees.
Allen, R. G., Pereira, L. S., Raes, D., and Smith, M.: Crop evapotranspiration: Guidelines for computing crop requirements, Irrig. Drain. Pap. No. 56, FAO, https://doi.org/10.1016/j.eja.2010.12.001, 1998.
Ayantobo, O. O., Li, Y., Song, S., Javed, T., and Yao, N.: Probabilistic modelling of drought events in China via 2-dimensional joint copula, J. Hydrol., 559, 373–391, https://doi.org/10.1016/j.jhydrol.2018.02.022, 2018.
Abramovitz, M. and Stegun, I. A.: Handbook of Mathematical Functions with Formulas, Graphs and Mathematical Tables, J. R. Stat. Soc. Ser. A, 128, 593–594, https://doi.org/10.2307/2343473, 1965.
Bi, H., Ma, J., Zheng, W., and Zeng, J.: Comparison of soil moisture in GLDAS model simulations and in situ observations over the Tibetan Plateau, J. Geophys. Res.-Atmos., 121, 2658–2678, https://doi.org/10.1002/2015JD024131, 2016.
Chen, L., Chen, X., Cheng, L., Zhou, P., and Liu, Z.: Compound hot droughts over China: Identification, risk patterns and variations, Atmos. Res., 227, 210–219, https://doi.org/10.1016/j.atmosres.2019.05.009, 2019.
Feng, X., Fu, B., Piao, S., Wang, S., Ciais, P., Zeng, Z., Lü, Y., Zeng, Y., Li, Y., Jiang, X., and Wu, B.: Revegetation in China's Loess Plateau is approaching sustainable water resource limits, Nat. Clim. Change, 6, 1019–1022, https://doi.org/10.1038/nclimate3092, 2016.
François, B., Vrac, M., Cannon, A. J., Robin, Y., and Allard, D.: Multivariate bias corrections of climate simulations: which benefits for which losses?, Earth Syst. Dynam., 11, 537–562, https://doi.org/10.5194/esd-11-537-2020, 2020.
Hansen, J., Sato, M., and Ruedy, R.: Perception of climate change. P. Natl. Acad. Sci. USA, 109, E2415–E2423, 2012.
Hao, Z., Hao, F., Singh, V. P., Xia, Y., Shi, C., and Zhang, X.: A multivariate approach for statistical assessments of compound extremes, J. Hydrol., 565, 87–94, https://doi.org/10.1016/j.jhydrol.2018.08.025, 2018a.
Hao, Z., Hao, F., Singh, V. P., and Zhang, X.: Quantifying the relationship between compound dry and hot events and El Niño–southern Oscillation (ENSO) at the global scale, J. Hydrol., 567, 332–338, https://doi.org/10.1016/j.jhydrol.2018.10.022, 2018b.
Hao, Z., Hao, F., Singh, V. P., and Zhang, X.: Statistical prediction of the severity of compound dry-hot events based on El Niño-Southern Oscillation, J. Hydrol., 572, 243–250, https://doi.org/10.1016/j.jhydrol.2019.03.001, 2019.
Haqiqi, I., Grogan, D. S., Hertel, T. W., and Schlenker, W.: Quantifying the impacts of compound extremes on agriculture, Hydrol. Earth Syst. Sci., 25, 551–564, https://doi.org/10.5194/hess-25-551-2021, 2021.
Herr, H. D. and Krzysztofowicz, R.: Generic probability distribution of rainfall in space: The bivariate model, J. Hydrol., 306, 234–263, 2005.
Hunt, E. D., Hubbard, K. G., Wilhite, D. A., Arkebauer, T. J., and Dutcher, A. L.: The development and evaluation of a soil moisture index. Int. J. Climatol., 29, 747–759, https://doi.org/10.1002/joc.1749, 2009.
Jiang, D., Tian, Z., and Lang, X.: Reliability of climate models for China through the IPCC Third to Fifth Assessment Reports, Int. J. Climatol., 36, 1114–1133, https://doi.org/10.1002/joc.4406, 2016.
Kirono, D. G. C., Hennessy, K. J., and Grose, M. R.: Increasing risk of months with low rainfall and high temperature in southeast Australia for the past 150 years, Clim. Risk Manag., 16, 10–21, https://doi.org/10.1016/j.crm.2017.04.001, 2017.
Koster, R. D., Schubert, S. D., Wang, H., Mahanama, S. P., and Deangelis, A. M.: Flash drought as captured by reanalysis data: Disentangling the contributions of precipitation deficit and excess evapotranspiration, J. Hydrometeorol., 20, 1241–1258, https://doi.org/10.1175/JHM-D-18-0242.1, 2019.
Li, C., Singh, V. P., and Mishra, A. K.: A bivariate mixed distribution with a heavy-tailed component and its application to single-site daily rainfall simulation, Water Resour. Res., 49, 767–789, 2013.
Li, B., Beaudoing, H., and Rodell, M.: NASA/GSFC/HSL, GLDAS Catchment Land Surface Model L4 daily 0.25 × 0.25 degree V2.0, Greenbelt, Maryland, USA, Goddard Earth Sciences Data and Information Services Center (GES DISC), https://doi.org/10.5067/LYHA9088MFWQ, 2018.
Li, J., Wang, Z., Wu, X., Chen, J., Guo, S., and Zhang, Z.: A new framework for tracking flash drought events in space and time, Catena, 194, 104763, https://doi.org/10.1016/j.catena.2020.104763, 2020a.
Li, J., Wang, Z., Wu, X., Xu, C.-Y., Guo, S., and Chen, X.: Toward Monitoring Short-Term Droughts Using a Novel Daily-Scale, Standardized Antecedent Precipitation Evapotranspiration Index, J. Hydrometeorol., 21, 891–908, https://doi.org/10.1175/jhm-d-19-0298.1, 2020b.
Li, J., Wang, Z., Wu, X., Guo, S., and Chen, X.: Flash droughts in the Pearl River Basin, China: Observed characteristics and future changes, Sci. Total Environ., 707, 136074, https://doi.org/10.1016/j.scitotenv.2019.136074, 2020c.
Lin, W., Wen, C., Wen, Z., and Gang, H.: Drought in Southwest China: A Review, Atmos. Ocean. Sci. Lett., 8, 339–344, https://doi.org/10.3878/AOSL20150043, 2015.
Liu, Y., Zhu, Y., Ren, L., Singh, V. P., Yang, X., and Yuan, F.: A multiscalar Palmer drought severity index, Geophys. Res. Lett., 44, 6850–6858, https://doi.org/10.1002/2017GL073871, 2017.
Liu, Y., Zhu, Y., Ren, L., Yong, B., Singh, V. P., Yuan, F., Jiang, S., and Yang, X.: On the mechanisms of two composite methods for construction of multivariate drought indices, Sci. Total Environ., 647, 981–991, https://doi.org/10.1016/j.scitotenv.2018.07.273, 2019.
Liu, Y., Zhu, Y., Zhang, L., Ren, L., Yuan, F., Yang, X. and Jiang, S.: Flash droughts characterization over China: From a perspective of the rapid intensification rate, Sci. Total Environ., 704, 135373, https://doi.org/10.1016/j.scitotenv.2019.135373, 2020.
Liu, Z., Wang, Y., Shao, M., Jia, X., and Li, X.: Spatiotemporal analysis of multiscalar drought characteristics across the Loess Plateau of China, J. Hydrol., 534, 281–299, https://doi.org/10.1016/j.jhydrol.2016.01.003, 2016.
Lu, E., Cai, W., Jiang, Z., Zhang, Q., Zhang, C., Higgins, R. W., and Halpert, M. S.: The day-to-day monitoring of the 2011 severe drought in China, Clim. Dynam., 43, 1–9, https://doi.org/10.1007/s00382-013-1987-2, 2014.
Luan, X. and Vico, G.: Canopy temperature and heat stress are increased by compound high air temperature and water stress and reduced by irrigation – a modeling analysis, Hydrol. Earth Syst. Sci., 25, 1411–1423, https://doi.org/10.5194/hess-25-1411-2021, 2021.
Manning, C., Widmann, M., Bevacqua, E., Van Loon, A. F., Maraun, D., and Vrac, M.: Increased probability of compound long-duration dry and hot events in Europe during summer (1950–2013), Environ. Res. Lett., 14, 094006, https://doi.org/10.1088/1748-9326/ab23bf, 2019.
Mazdiyasni, O. and AghaKouchak, A.: Substantial increase in concurrent droughts and heatwaves in the United States, P. Natl. Acad. Sci. USA, 112, 11484–11489, https://doi.org/10.1073/pnas.1422945112, 2015.
McKee, T. B., Doesken, N. J., and Kleist, J.: The relationship of drought frequency and duration to time scales, Proceedings of the 8th Conference on Applied Climatology, 17, 179–183, 1993.
Mo, K. C. and Lettenmaier, D. P.: Heat wave flash droughts in decline, Geophys. Res. Lett., 42, 2823–2829, https://doi.org/10.1002/2015GL064018, 2015.
Mo, K. C. and Lettenmaier, D. P.: Precipitation deficit flash droughts over the United States, J. Hydrometeorol., 17, 1169–1184, https://doi.org/10.1175/JHM-D-15-0158.1, 2016.
Osman, M., Zaitchik, B. F., Badr, H. S., Christian, J. I., Tadesse, T., Otkin, J. A., and Anderson, M. C.: Flash drought onset over the contiguous United States: sensitivity of inventories and trends to quantitative definitions, Hydrol. Earth Syst. Sci., 25, 565–581, https://doi.org/10.5194/hess-25-565-2021, 2021.
Otkin, J. A., Anderson, M. C., Hain, C., Mladenova, I. E., Basara, J. B., and Svoboda, M.: Examining rapid onset drought development using the thermal infrared-based evaporative stress index, J. Hydrometeorol., 14, 1057–1074, https://doi.org/10.1175/JHM-D-12-0144.1, 2013.
Otkin, J. A., Svoboda, M., Hunt, E. D., Ford, T. W., Anderson, M. C., Hain, C., and Basara, J. B.: Flash droughts: A review and assessment of the challenges imposed by rapid-onset droughts in the United States, B. Am. Meteorol. Soc., 99, 911–919, https://doi.org/10.1175/BAMS-D-17-0149.1, 2018.
Pendergrass, A. G., Meehl, G. A., Pulwarty, R., Hobbins, M., Hoell, A., AghaKouchak, A., and Woodhouse, C. A.: Flash droughts present a new challenge for subseasonal-to-seasonal prediction. Nat. Clim. Change, 10, 191–199, 2020.
Ridder, N. N., Pitman, A. J., Westra, S., Ukkola, A., Do Hong, X., Bador, M., and Zscheischler, J.: Global hotspots for the occurrence of compound events, Nat. Commun., 11, 1–10, 2020.
Rodell, M., Houser, P. R., Jambor, U., Gottschalck, J., Mitchell, K., Meng, C. J., Arsenault, K., Cosgrove, B., Radakovich, J., Bosilovich, M., Entin, J. K., Walker, J. P., Lohmann, D., and Toll, D.: The Global Land Data Assimilation System, B. Am. Meteorol. Soc., 85, 381–394, https://doi.org/10.1175/BAMS-85-3-381, 2004.
Russo, A., Gouveia, C. M., Dutra, E., Soares, P. M. M., and Trigo, R. M.: The synergy between drought and extremely hot summers in the Mediterranean, Environ. Res. Lett., 14, 014011, https://doi.org/10.1088/1748-9326/aaf09e, 2019.
Schumacher, D. L., Keune, J., van Heerwaarden, C. C., Vilà-Guerau de Arellano, J., Teuling, A. J., and Miralles, D. G.: Amplification of mega-heatwaves through heat torrents fuelled by upwind drought, Nat. Geosci., 12, 712–717, https://doi.org/10.1038/s41561-019-0431-6, 2019.
Sedlmeier, K., Feldmann, H., and Schädler, G.: Compound summer temperature and precipitation extremes over central Europe, Theor. Appl. Climatol., 131, 1493–1501, https://doi.org/10.1007/s00704-017-2061-5, 2018.
Sun, C. X., Huang, G. H., Fan, Y., Zhou, X., Lu, C., and Wang, X. Q.: Drought Occurring With Hot Extremes: Changes Under Future Climate Change on Loess Plateau, China, Earths Future, 7, 587–604, https://doi.org/10.1029/2018EF001103, 2019.
Swain, D. L., Langenbrunner, B., Neelin, J. D., and Hall, A.: Increasing precipitation volatility in twenty-first-century California, Nat. Clim. Change, 8, 427–433, https://doi.org/10.1038/s41558-018-0140-y, 2018.
Taylor, K. E., Stouffer, R. J., and Meehl, G. A.: An overview of CMIP5 and the experiment design, B. Am. Meteorol. Soc., 93, 485–498, https://doi.org/10.1175/BAMS-D-11-00094.1, 2012 (data available at: https://esgf-node.llnl.gov/search/cmip5, last access: 3 January 2021).
Terzi, S., Torresan, S., Schneiderbauer, S., Critto, A., Zebisch, M., and Marcomini, A.: Multi-risk assessment in mountain regions: A review of modelling approaches for climate change adaptation, J. Environ. Manage., 232, 759–771, https://doi.org/10.1016/j.jenvman.2018.11.100, 2019.
Vicente-Serrano, S. M., Beguería, S., and López-Moreno, J. I.: A multiscalar drought index sensitive to global warming: The standardized precipitation evapotranspiration index, J. Climate, 23, 1696–1718, https://doi.org/10.1175/2009JCLI2909.1, 2010.
Villalobos-Herrera, R., Bevacqua, E., Ribeiro, A. F. S., Auld, G., Crocetti, L., Mircheva, B., Ha, M., Zscheischler, J., and De Michele, C.: Towards a compound event-oriented climate model evaluation: A decomposition of the underlying biases in multivariate fire and heat stress hazards, Nat. Hazards Earth Syst. Sci. Discuss. [preprint], https://doi.org/10.5194/nhess-2020-383, in review, 2020.
Wang, L., Yuan, X., Xie, Z., Wu, P., and Li, Y.: Increasing flash droughts over China during the recent global warming hiatus, Sci. Rep.-UK, 6, 1–8, https://doi.org/10.1038/srep30571, 2016.
Wang, W., Wang, W. J., Li, J. S., Wu, H., Xu, C., and Liu, T.: The impact of sustained drought on vegetation ecosystem in southwest China based on remote sensing, Procedia Environ. Sci., 2, 1679–1691, 2010.
Werner, A. T. and Cannon, A. J.: Hydrologic extremes – an intercomparison of multiple gridded statistical downscaling methods, Hydrol. Earth Syst. Sci., 20, 1483–1508, https://doi.org/10.5194/hess-20-1483-2016, 2016.
Wu, J., Chen, X., Yao, H., Liu, Z., and Zhang, D.: Hydrological Drought Instantaneous Propagation Speed Based on the Variable Motion Relationship of Speed-Time Process, Water Resour. Res., 54, 9549–9565, https://doi.org/10.1029/2018WR023120, 2018.
Wu, X., Hao, Z., Hao, F., and Zhang, X.: Variations of compound precipitation and temperature extremes in China during 1961–2014, Sci. Total Environ., 663, 731–737, https://doi.org/10.1016/j.scitotenv.2019.01.366, 2019.
Wu, X., Hao, Z., Zhang, X., Li, C., and Hao, F.: Evaluation of severity changes of compound dry and hot events in China based on a multivariate multi-index approach, J. Hydrol., 583, 124580, https://doi.org/10.1016/j.jhydrol.2020.124580, 2020.
Xu, K., Yang, D., Yang, H., Li, Z., Qin, Y., and Shen, Y.: Spatio-temporal variation of drought in China during 1961–2012: A climatic perspective, J. Hydrol., 526, 253–264, https://doi.org/10.1016/j.jhydrol.2014.09.047, 2015.
Yang, Y., Bai, L., Wang, B., Wu, J., and Fu, S.: Reliability of the global climate models during 1961–1999 in arid and semiarid regions of China, Sci. Total Environ., 667, 271–286, https://doi.org/10.1016/j.scitotenv.2019.02.188, 2019.
Yeo, I. N. K. and Johnson, R. A.: A new family of power transformations to improve normality or symmetry, Biometrika, 87, 954–959, https://doi.org/10.1093/biomet/87.4.954, 2000.
Yu, H., Zhang, Q., Xu, C. Y., Du, J., Sun, P., and Hu, P.: Modified palmer drought severity index: model improvement and application, Environ. Int., 130, 104951, https://doi.org/10.1016/j.envint.2019.104951, 2019 (data available at: http://data.cma.cn/, last access: 10 February 2021).
Yuan, X., Wang, L., Wu, P., Ji, P., Sheffield, J., and Zhang, M.: Anthropogenic shift towards higher risk of flash drought over China, Nat. Commun., 10, 1–8, https://doi.org/10.1038/s41467-019-12692-7, 2019.
Zhang, W. J., Lu, Q. F., Gao, Z. Q., and Peng, J.: Response of remotely sensed normalized difference water deviation index to the 2006 drought of eastern Sichuan Basin, Sci. China Ser. D, 51, 748–758, https://doi.org/10.1007/s11430-008-0037-0, 2008.
Zhang, Y., You, Q., Mao, G., Chen, C., and Ye, Z.: Short-term concurrent drought and heatwave frequency with 1.5 and 2.0 ∘C global warming in humid subtropical basins: a case study in the Gan River Basin, China, Clim. Dynam., 52, 4621–4641, https://doi.org/10.1007/s00382-018-4398-6, 2019.
Zhong, R., Chen, X., Lai, C., Wang, Z., Lian, Y., Yu, H., and Wu, X.: Drought monitoring utility of satellite-based precipitation products across mainland China, J. Hydrol., 568, 343–359, https://doi.org/10.1016/j.jhydrol.2018.10.072, 2019a.
Zscheischler, J. and Fischer, E. M.: The record-breaking compound hot and dry 2018 growing season in Germany, Weather Clim. Ext., 29, 100270, https://doi.org/10.1016/j.wace.2020.100270, 2020.
Zscheischler, J. and Seneviratne, S. I.: Dependence of drivers affects risks associated with compound events, Sci. Adv., 3, 1–11, https://doi.org/10.1126/sciadv.1700263, 2017.
Zscheischler, J., Michalak, A. M., Schwalm, C., Mahecha, M. D., and Zeng, N.: Impact of large-scale climate extremes on biospheric carbon fluxes: An intercomparison based on MsTMIP data, Global Biogeochem. Cy., 28, 585–600, https://doi.org/10.1002/2014GB004826, 2014.
Zscheischler, J., Orth, R., and Seneviratne, S. I.: Bivariate return periods of temperature and precipitation explain a large fraction of European crop yields, Biogeosciences, 14, 3309–3320, https://doi.org/10.5194/bg-14-3309-2017, 2017.
Zscheischler, J., Westra, S., Van Den Hurk, B. J. J. M., Seneviratne, S. I., Ward, P. J., Pitman, A., Aghakouchak, A., Bresch, D. N., Leonard, M., Wahl, T., and Zhang, X.: Future climate risk from compound events, Nat. Clim. Change, 8, 469–477, https://doi.org/10.1038/s41558-018-0156-3, 2018.
Zscheischler, J., Martius, O., Westra, S., Bevacqua, E. and Raymond, C.: A typology of compound weather and climate events, Nat. Rev. Earth Environ., 1, 333–347, https://doi.org/10.1038/s43017-020-0060-z, 2020.