the Creative Commons Attribution 4.0 License.
the Creative Commons Attribution 4.0 License.
 | 13 May 2020
Sensitivity of hydrologic and geologic parameters on recharge processes in a highly heterogeneous, semi-confined aquifer system
Stephen R. Maples
Laura Foglia
Graham E. Fogg
Reed M. Maxwell
An increasing reliance on groundwater resources has been observed worldwide during the past 50–70 years and has led to unsustainable groundwater abstraction in many regions, especially in semi-arid and arid alluvial groundwater basins. Managed aquifer recharge (MAR) has been promoted to replenish overdrafted groundwater basins and augment surface water supply. However, MAR feasibility in alluvial groundwater basins is complicated by complex geologic architecture that typically includes laterally continuous, fine-texture confining units that can impede both recharge rates and regional propagation of increases in the hydraulic head. A greater feasibility of MAR hinges on identifying locations where rapid, high-volume recharge that provides regional increases in pressure head are possible, but relatively little research has evaluated the factors that control MAR feasibility in alluvial groundwater basins. Here, we combine a transition probability Markov chain geostatistical model of the subsurface geologic heterogeneity of the eastern side of the northern Central Valley, California, with the three-dimensional, variably saturated water flow code ParFlow to explore the variability of MAR feasibility in this region. We use a combination of computationally efficient local- and global-sensitivity analyses to evaluate the relative importance of factors that contribute to MAR feasibility. A novel proxy parameter approach was used to describe the configuration and proportions of subsurface hydrofacies and the water table depth for sensitivity analyses, and results suggest that recharge potential is relatively more sensitive to the variability of this proxy parameter than to the variability of individual hydrofacies hydraulic properties. Results demonstrate that large variability of MAR feasibility is typical for alluvial aquifer systems and that outsized recharge rates are possible in select locations where interconnected, coarse-texture hydrofacies occur.
- Article
(10651 KB) - Full-text XML
- BibTeX
- EndNote


Geologic heterogeneity strongly affects both the movement of water in the subsurface and the exchange of water between subsurface and surface stores; however, rarely are enough data available to explicitly represent heterogeneous geologic features in groundwater models (Koltermann and Gorelick, 1996; De Marsily et al., 2005). Instead, models typically simplify and/or upscale heterogeneity to represent subsurface flows for purposes of regional-scale water resources management (e.g., Fogg, 1986; Phillips and Belitz, 1991). Upscaling methods have been the focus of numerous studies (e.g., Renard and De Marsily, 1997; Fogg et al., 2000; Neuman and Di Federico, 2003; Fleckenstein and Fogg, 2008), and coarse-resolution models with upscaled (i.e., effective) hydrologic properties are often adequate for regional-scale flow studies but typically lack enough detail to reliably capture some phenomena, like recharge and transport processes, that are strongly influenced by geologic heterogeneity.
To represent the influence of geologic heterogeneity on flow and transport phenomena, many approaches have relied on stochastic methods, like transition-probability-based indicator geostatistics which can represent heterogeneous features while honoring measured data (Carle and Fogg, 1996; Weissmann and Fogg, 1999; Weissmann et al., 1999). These approaches represent geologic heterogeneity with hydrogeologic facies categories, each of which is assigned effective values or probability densities for estimates of hydraulic properties. By categorizing facies according to depositional environment rather than texture alone, the predictable geometries (i.e., facies mean lengths, proportions, and juxtapositions) of these features can be more accurately represented with sparse data. Studies that rely on these methods show the strong influence of subsurface heterogeneity on groundwater–surface-water interactions and recharge processes (Lee, 2004; Fleckenstein et al., 2006; Engdahl et al., 2010; Liu, 2014), including managed aquifer recharge (MAR; Maples et al., 2019), especially for instances when the mean lengths and proportions of high-permeability facies allow for percolation, i.e., formation of connected networks (Fogg et al., 2000; Harter, 2005).
Accurately assigning aquifer properties in models can be a challenge because they are scale-dependent attributes that are challenging to measure and can vary over many orders of magnitude in typical aquifer systems (e.g., Sudicky, 1986; Gelhar et al., 1992; Weissmann and Fogg, 1999). While aquifer tests can accurately constrain estimates of hydraulic conductivity (K) for high-permeability facies, they are typically unreliable for estimating K of low-permeability (i.e., aquitard) facies (Fogg, 1986; Fogg et al., 1998), which have been shown to influence pumping response (Fogg et al., 2000) and be important for accommodating recharge (Maples et al., 2019). Reconciling typically sparse measurements of aquifer properties from aquifer tests with the representation of effective values in models is often the source of large uncertainty because parameterization of the properties in models is scale dependent (Sudicky and Huyakorn, 1991) and is typically achieved through model calibration.
The contaminant transport community has long recognized the strong influence of K scaling and geologic heterogeneity on transport processes (e.g., Gelhar et al., 1992; Sudicky and Huyakorn, 1991; Koltermann and Gorelick, 1996), and recent work has extended these concepts to assess their role on runoff generation, evapotranspiration (ET), and feedbacks between subsurface and land-surface water in integrated hydrologic models (Srivastava et al., 2014; Gilbert et al., 2016; Foster and Maxwell, 2019), but relatively little research has focused on the influence of these factors for MAR processes specifically. Recent work has highlighted the importance of connected networks of high-K facies for MAR (Maples et al., 2019), but to our knowledge the sensitivity of MAR processes to these heterogeneous geologic features as compared to other uncertain hydraulic properties has not been formally evaluated. Here, we simulate variably saturated MAR dynamics in a highly resolved representation of complex subsurface geologic heterogeneity of a clastic, unconsolidated sedimentary aquifer system that includes both interconnected, high-K sand and gravel deposits intermingled with silt- and clay-dominated sediments. We use a combination of local- and global-sensitivity analyses to provide insight into the relative importance of the subsurface geologic facies configuration and parameterization of subsurface hydraulic properties on MAR processes. This work provides insight into important factors to consider when investigating potential MAR sites and also highlights the utility of a combination of computationally frugal local- and global-sensitivity analyses for computationally intensive hydrologic models.
2.1 Local hydrogeology and domain extent
The model domain covers about 1640 m2 of the eastern side of the northern Central Valley, California, near the convergence of the lower portions of the American and Cosumnes rivers with the Sacramento River (Fig. 1). The domain comprises a low-angle alluvial fan complex that is typical of the Central Valley, where previous studies have documented the presence of deposits that are favorable for recharge (Shlemon, 1967; Meirovitz, 2010), including massive, interconnected, highly permeable sand and gravel deposits known as incised valley fill (IVF; Weissmann et al., 2004, 2005) that form from river incision and deposition events during cyclic Pliocene–Pleistocene Sierra Nevada glaciation. In places, multiple IVF deposits have been shown to overlap and interconnect from the land surface into the deeper aquifer system, forming massive, coarse-texture, relatively high-permeability pathways for recharge that bypass local, otherwise laterally extensive confining units. These features have been shown to accommodate recharge volumes that are orders of magnitude greater than would be possible over the rest of the landscape (Maples et al., 2019). Other studies have shown that IVF features likely occur on river fans throughout the Central Valley (Weissmann et al., 2005) and in similar glacially influenced rivers (Pierce and Scott, 1983) but are still largely undocumented.
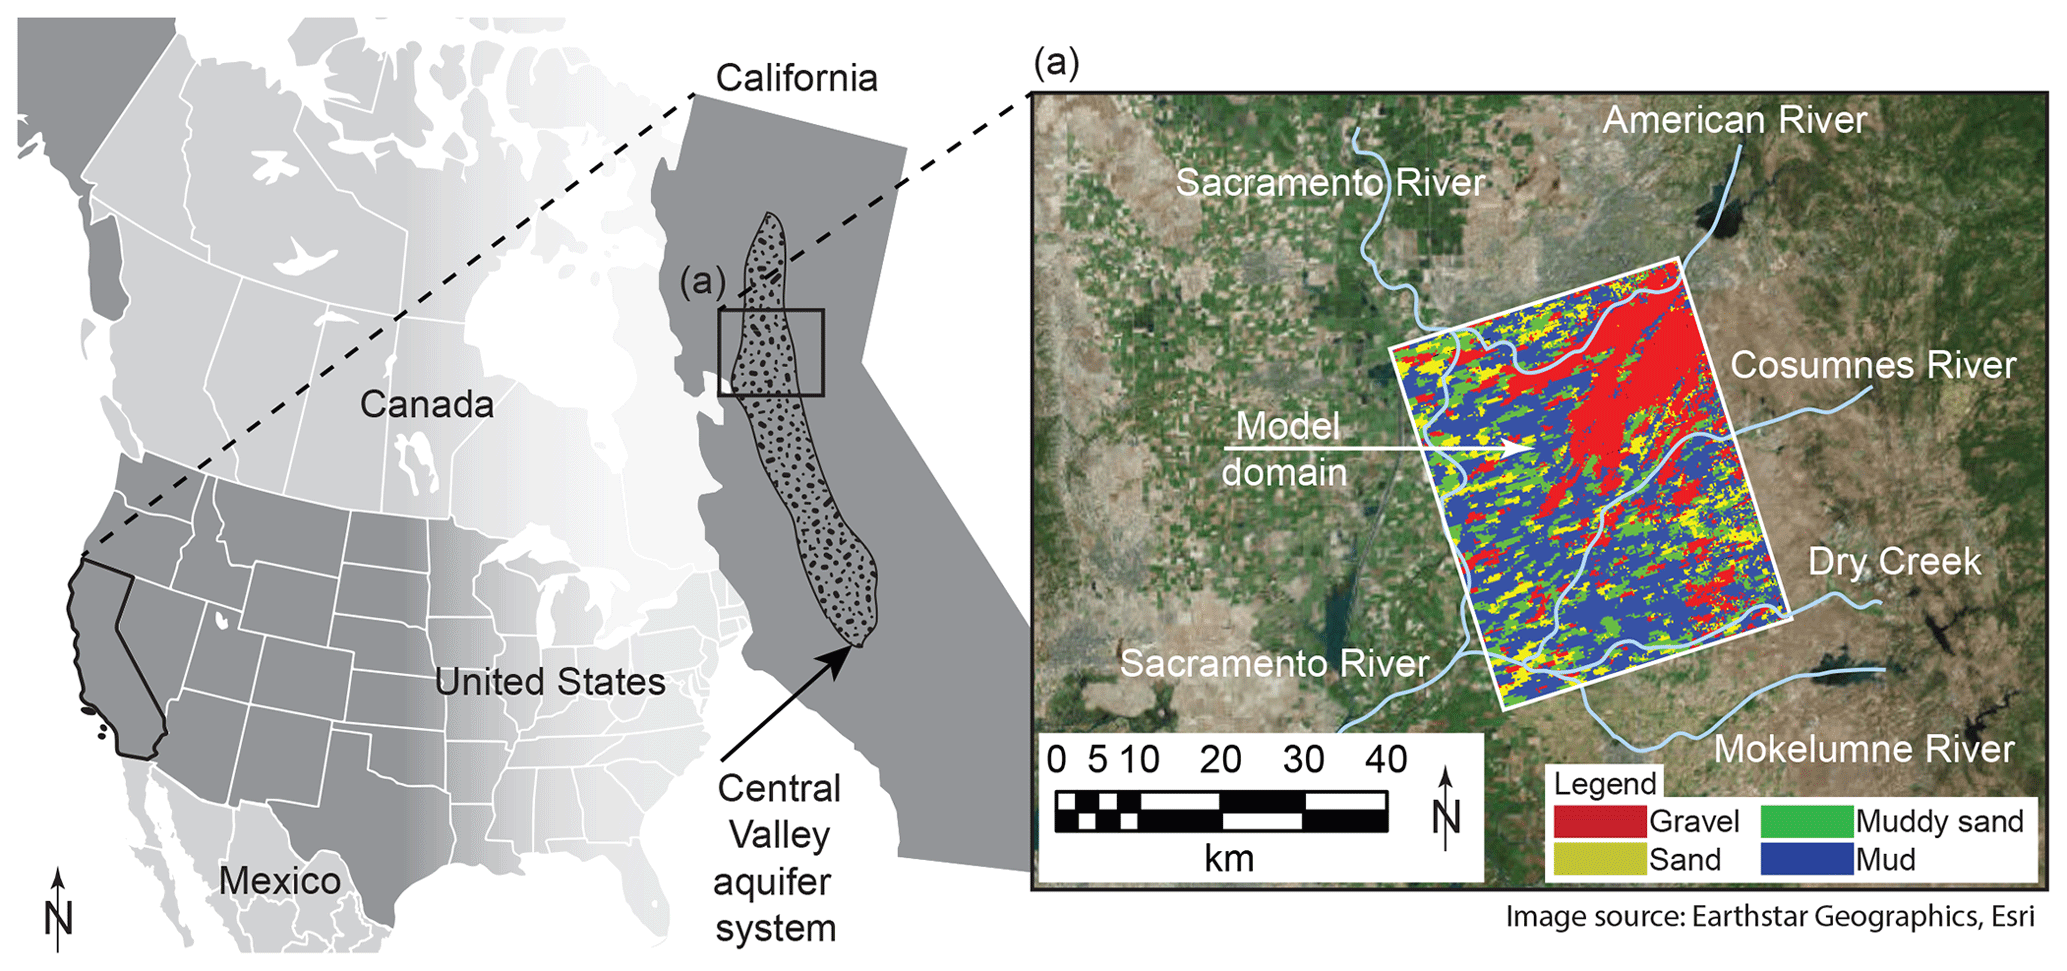
Figure 1Location of the model domain in the Central Valley aquifer system in California and (a) inset of the uppermost layer of the model hydrofacies overlain over aerial imagery of the Central Valley and local river systems (Maples et al., 2019). Imagery is derived from Earthstar Geographics, copyright © Esri. All rights reserved (https://www.esri.com/en-us/home, last access: 8 April 2020).
The local hydrostratigraphy of the area is described in detail by Meirovitz (2010) and Maples et al. (2019). In general, the two major rivers intersecting the domain, the American and Cosumnes rivers, have markedly different depositional characteristics. The American River drains a large (>4000 km2), high-elevation catchment that extends to the Sierra Nevada crest (>3000 m a.m.s.l. – above mean sea level). As a result, the American River was greatly influenced by cyclic Pliocene–Pleistocene glaciation that deposited IVF in the domain area. Conversely, the Cosumnes River catchment is smaller (900 km2) and lower in elevation. As a result, deposits from the Cosumnes River do not contain IVF and are typically finer in texture. In some locations in the domain area, Quaternary and Holocene channel avulsion of the American River resulted in a more southwestern course that intersects the current path of the Cosumnes River, creating complex overlapping stratigraphy in that area. Cross-cutting IVF and overlapping paleochannel networks in the domain area result in an aquifer system that is typically unconfined (and sometimes perched) or semi-confined at shallow depths and increasingly confined with depth (Fleckenstein et al., 2006; Liu, 2014; Niswonger and Fogg, 2008). Groundwater pumping in the region typically occurs at depths >30 m in the deeper semi-confined or confined portion of the aquifer system (Liu, 2014).
2.2 Hydrofacies model development
Transition probability Markov chain geostatistics (TPROGS; Carle and Fogg, 1996, 1997; Carle, 1999) was used to simulate the subsurface distribution of hydrofacies in the domain area (Fig. 2). Model development is described in detail by Meirovitz (2010) and Maples et al. (2019). Conditioning data for the TPROGS model included about 1200 well logs, soil surveys, geologic cross sections, and mapped paleochannels. Geologic data were binned into four textural categories: gravel, sand, muddy sand, and mud (undifferentiated silt and/or clay; Table 1; Fleckenstein et al., 2004; Meirovitz, 2010). “Mud” refers to undifferentiated silt and clay because most of the subsurface data available only identify the fine-grained sediments and are not sufficiently detailed to distinguish silt from clay. From these data the proportions for each facies were calculated directly. Additional parameters were estimated describing the mean lengths of each hydrofacies along the principal directions and the embedded transition probabilities to represent cross-correlation between different facies. Because the depositional characteristics of the American and Cosumnes fans were markedly different, individual models of each were produced and subsequently combined by Meirovitz (2010).
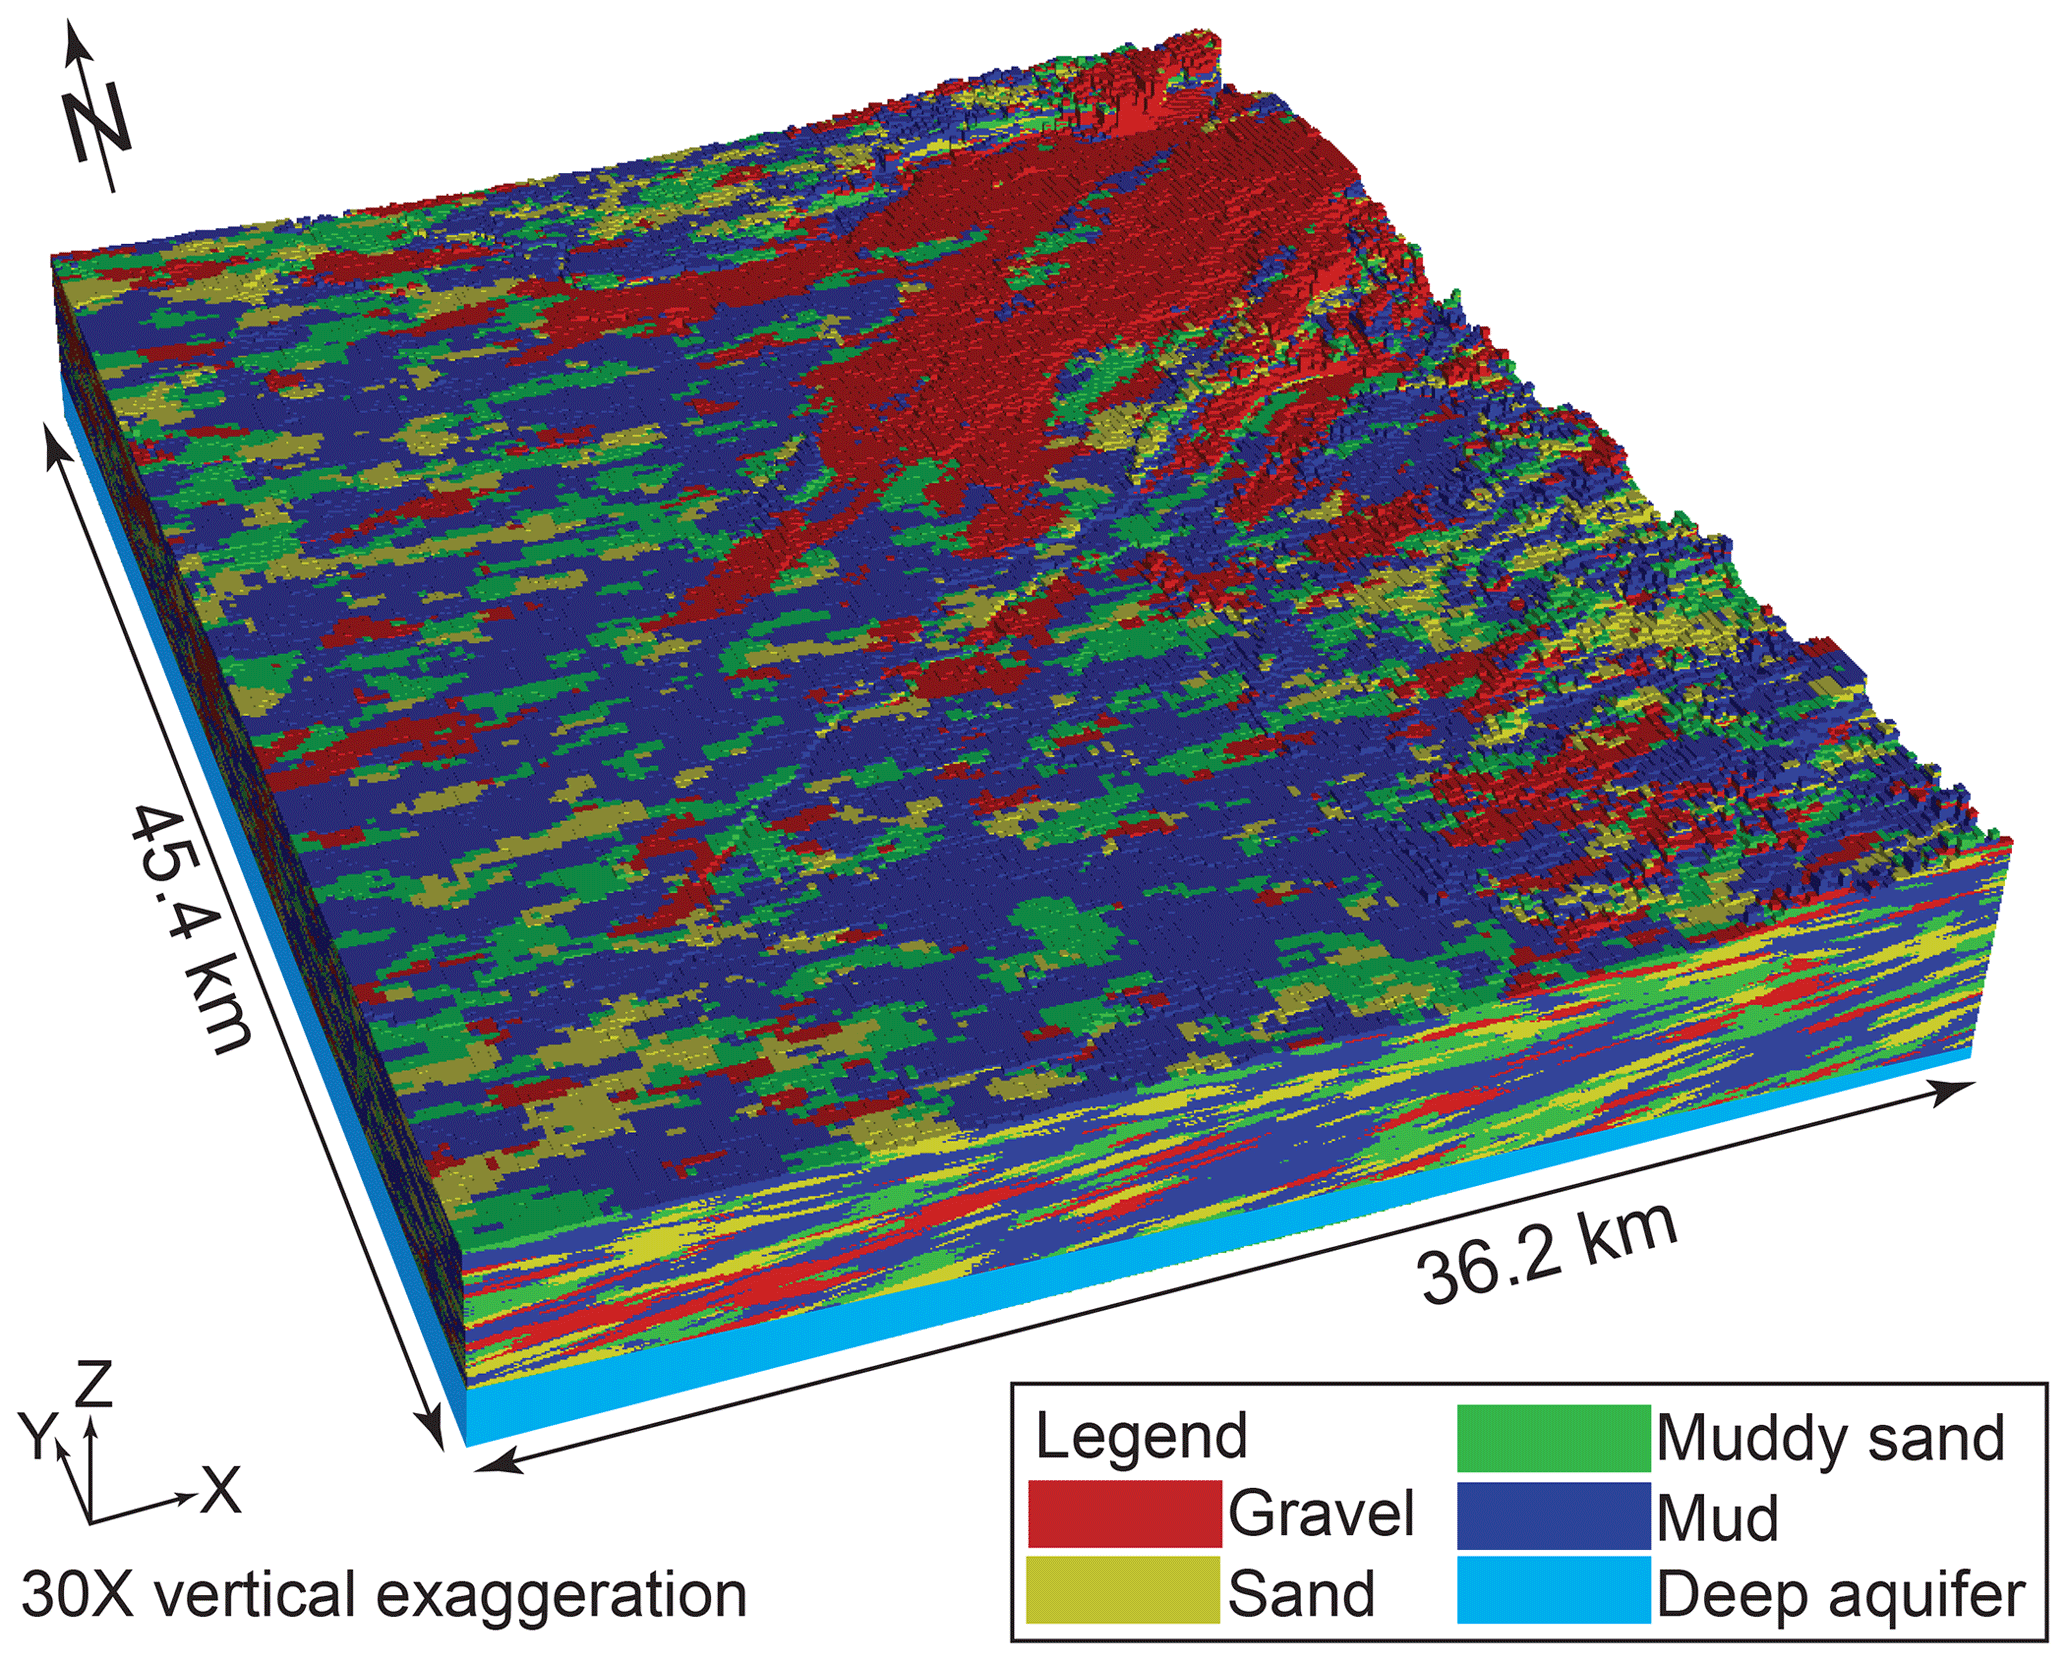
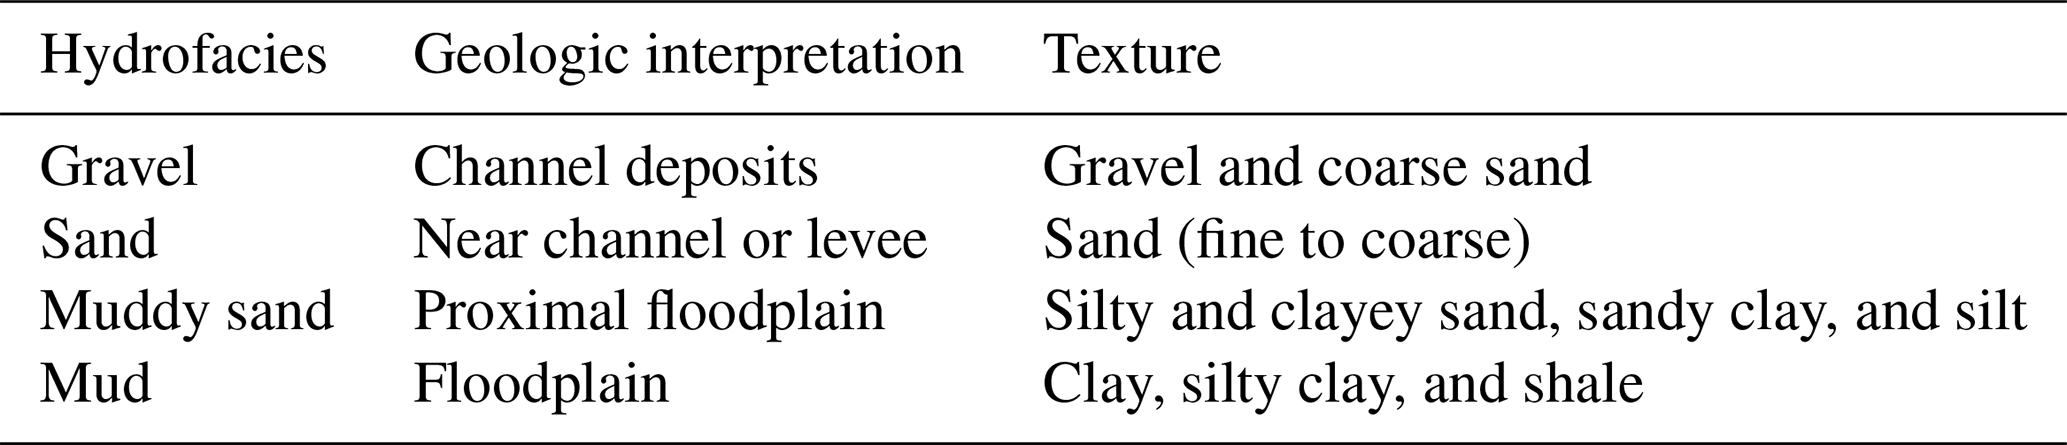
Table 1Textural classification of hydrofacies designations (Fleckenstein et al., 2004).
The model uses an orthogonal grid geometry with 181 cells × 227 cells × 265 cells in the x, y, and z directions, respectively. The x and y directions of the grid were rotated 17.85∘ counterclockwise from the cardinal directions, and the z direction was oriented vertically. Cell sizes were 200 m × 200 m × 1 m. The total domain size is 36.2 km × 45.4 km × 0.265 km in the x, y, and z directions, respectively. Cells located above the land surface were designated as inactive in the model, resulting in about 7.3 million active cells in the domain area.
2.3 Hydrologic model development
2.3.1 Governing equations
Three-dimensional, variably saturated water flow was simulated with the hydrologic modeling code ParFlow (Ashby and Falgout, 1996; Jones and Woodward, 2001; Kollet and Maxwell, 2006), which couples surface and subsurface flow with the two-dimensional diffusive- or kinematic-wave equation and solves the three-dimensional mixed form of Richards' equation for variably saturated subsurface flow:
where
In these equations Ss is specific storage (L−1), Sw is relative saturation (–), h is the pressure head (L), t is time (T), ϕ is porosity (–), q is the Darcy flux (L T−1), qr is a source or sink term (T−1), z is elevation (L), v is the subsurface flow velocity (L T−1), Ks(x) is the saturated hydraulic conductivity tensor (L T−1), and kr is relative permeability (–). The van Genuchten relations (Van Genuchten, 1980) describe Sw and kr as a function of h in the unsaturated zone, with parameters for air entry pressure α (L−1), pore size distribution n (–), and residual saturation Sres (–).
2.3.2 Boundary conditions
Model boundary conditions are discussed in greater detail in Liu (2014) and Maples et al. (2019). The locations of domain boundaries were chosen to simplify the assignment of boundary conditions for the flow model. The eastern boundary roughly coincides with the Sierra Nevada foothills, and the northern, southern, and western boundaries roughly coincide with local surface water bodies (Fig. 1). A specified head boundary condition was applied for the eastern boundary to coincide with the local groundwater head distribution estimated from local monitoring well data (Liu, 2014). A general head boundary of 0 m a.m.s.l. was set 1 km beyond the western boundary to approximate the Sacramento River and Sacramento–San Joaquin Delta along the northwestern and southwestern portions of the western boundary, respectively. No-flow boundary conditions were applied along the northern, southern, and bottom boundaries because the regional groundwater flow direction is generally from east to west.
Model spinup and recharge simulations used combinations of specified-flux and specified-head upper boundary conditions. An initial potentiometric surface was specified using interpolated groundwater level data. Monthly estimated urban and agricultural groundwater pumping rates were applied as specified fluxes representing wells screened in lower portions of the domain that coincide with typical screened intervals of municipal and agricultural pumping wells in the region. Dominant sources of recharge for the region include stream recharge from the American River, Cosumnes River, and Deer Creek, as well as deep percolation from agricultural and urban return flows. Weekly estimates of the spatially distributed river stage for the streams were applied as specified heads along coincident land-surface cells. Monthly estimates of urban and agricultural recharge volumes were applied as a specified-flux boundary condition across the top of the domain to simulate deep percolation of agricultural and urban return flows and to equilibrate soil moisture conditions in the near-surface unsaturated-zone (UZ) cells.
2.3.3 Model spinup and calibration
The model spinup and calibration are described in greater detail in Liu (2014) and Maples et al. (2019). To summarize, a 16-year simulation period was used to bring the simulated hydrology into dynamic equilibrium. Water budget components, including groundwater discharge, recharge, and boundary flows along with facies hydraulic properties were estimated and adjusted manually to simulate a realistic water budget, water table configuration, and vertical hydraulic gradients during the calibration process. Hydraulic properties for each facies category were calibrated manually (Table 2) and are consistent with the range of literature values for the Central Valley, California, and for similar alluvial systems (Anderson et al., 2015; Botros et al., 2009; Fleckenstein et al., 2004; Frei et al., 2009; Maserjian, 1993; Niswonger and Fogg, 2008; Sager, 2012).

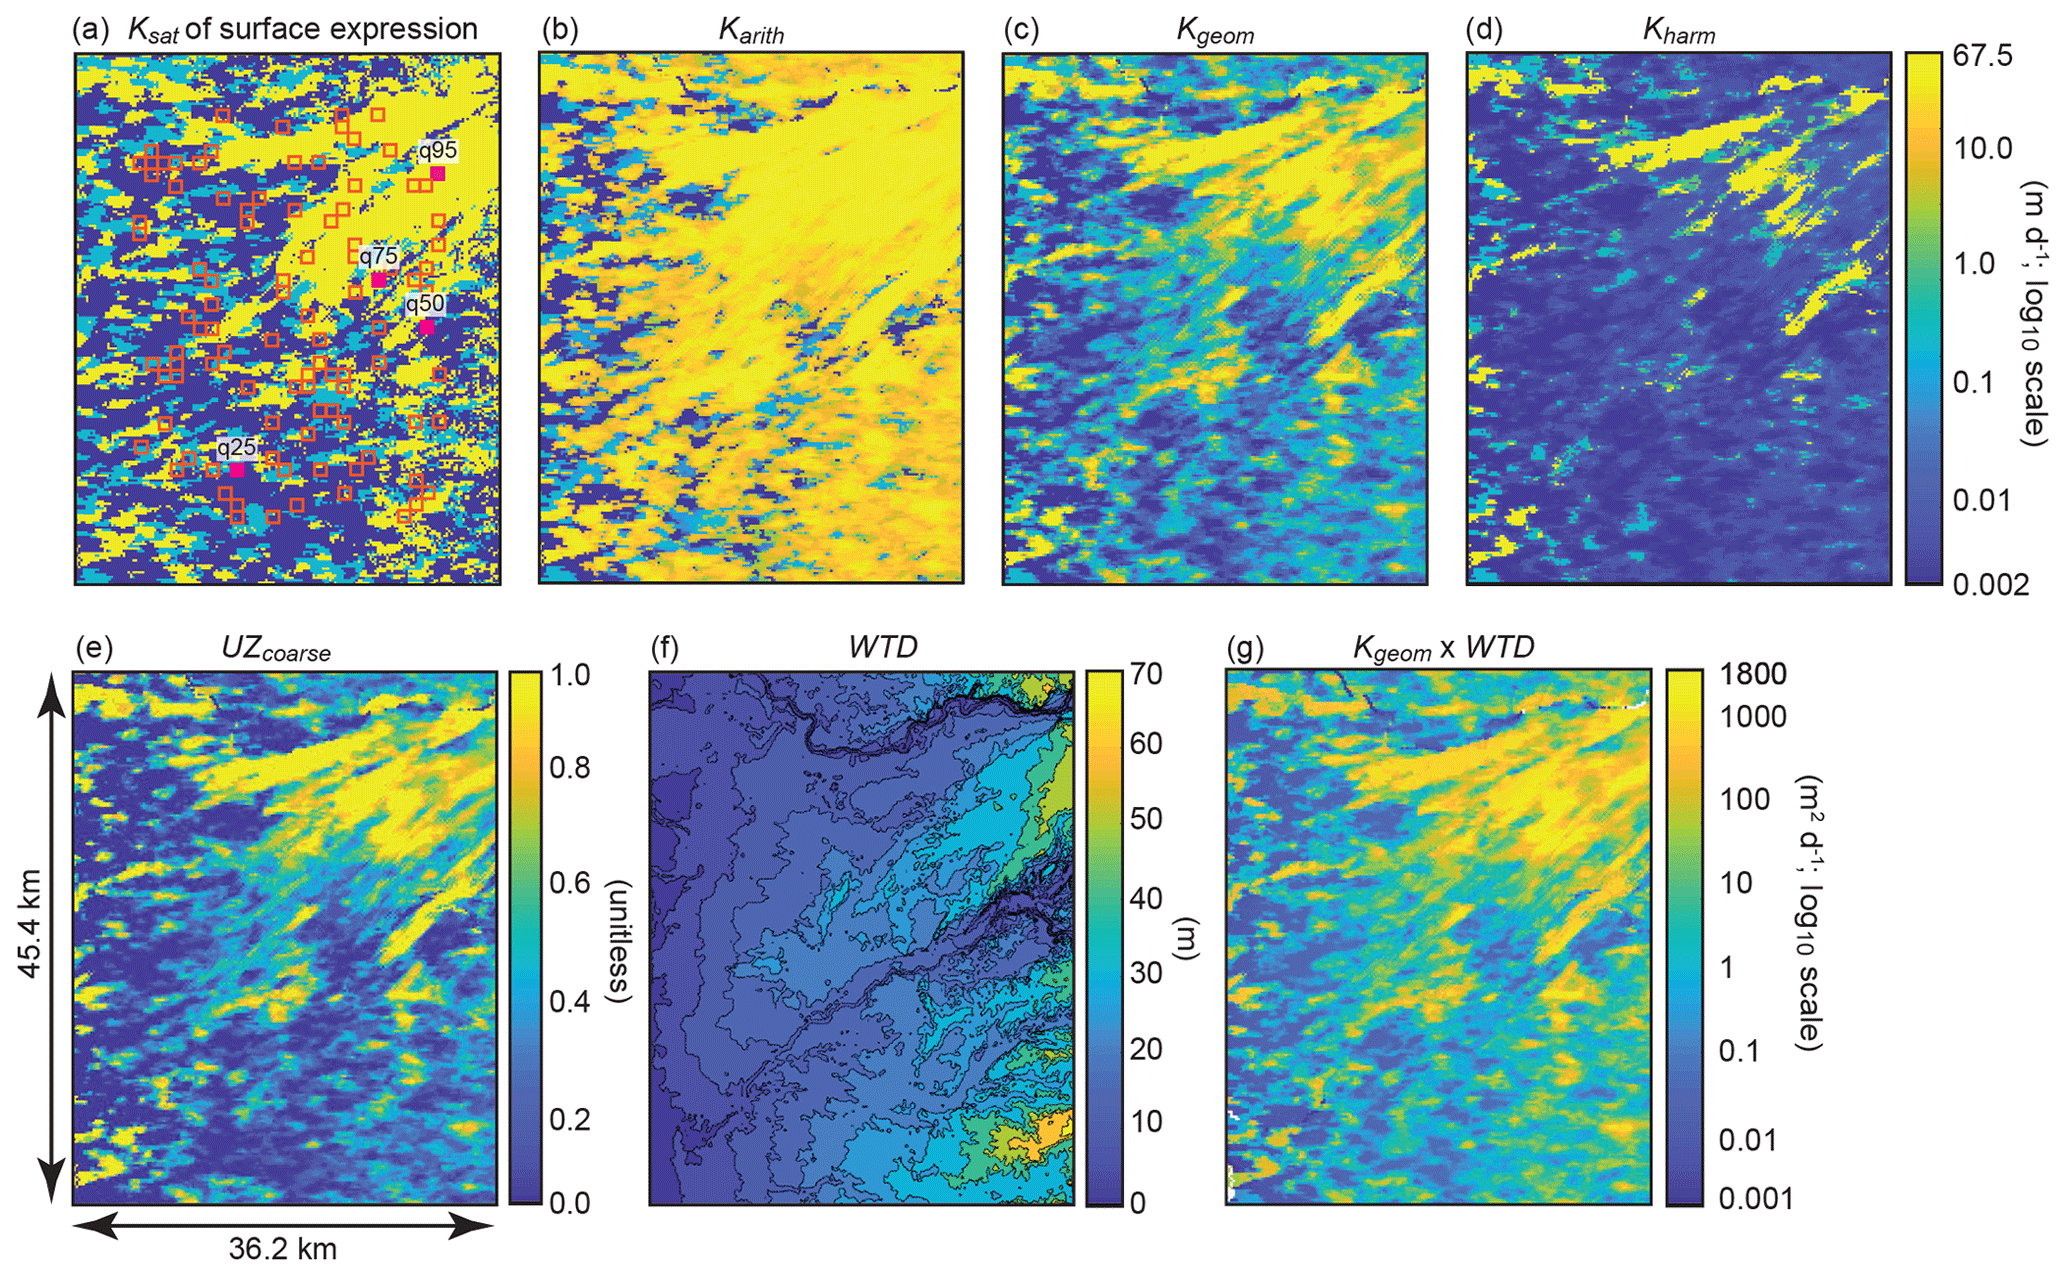
Figure 3Plan view of the model domain, where the first row shows (a) Ksat of the uppermost model layer (i.e., the surface expression) overlaid with the locations of 100 randomly sampled 1 km2 exploratory recharge sites (red squares) randomly chosen from 910 potential locations as well as the four sites chosen for sensitivity analyses (q95, q75, q50, and q25; solid violet squares), along with the (b) arithmetic, (c) geometric, and (d) harmonic mean of vertical Ksat for unsaturated-zone (UZ) facies (i.e., Karith, Kgeom, and Kharm, respectively). The second row shows (e) the coarse-texture (gravel and sand) fraction of UZ facies (UZcoarse), (f) the simulated initial depth to water (WTD), and (g) Kgeom multiplied by WTD (Kgeom × WTD). Locations > 5 km from the lateral domain boundaries were excluded from the potential sites to avoid interference with boundary conditions.
All simulations were performed using the Cheyenne high-performance cluster at the National Center for Atmospheric Research (NCAR) Computational and Information Systems Laboratory (https://doi.org/10.5065/D6RX99HX). The numerical problem was distributed on 540 cores for each simulation. Approximately 450 model evaluations were required for the exploratory simulations, local-sensitivity analyses, and global-sensitivity analyses described in subsequent sections, which required approximately 400 000 core hours of computing time in total. The large computational expense for each simulation (890 core hours per simulation, on average) required that computationally resources be allocated efficiently.
2.4 Exploratory simulations
2.4.1 Site selection
A total of 100 1 km2 recharge sites, each encompassing 25 upper-boundary cells, were chosen to approximate hypothetical MAR infiltration basins (Fig. 3a). Each site was randomly selected from a 910 km2 region within the domain that excluded locations within 5 km of lateral domain boundaries to minimize the influence of boundary conditions. The 100 exploratory sites encompass roughly 6 % of the total domain area, which was deemed sufficient to sample the variability of site characteristics observed across the domain. The size of each site was chosen to reflect a regional-scale MAR site, which can range from large networks of basins >25 km2 in size (e.g., Kern Water Bank Authority, 2018) to individual infiltration basins over several hectares or smaller (e.g., Beganskas and Fisher, 2017) in California.
2.4.2 Site characteristics
Maples et al. (2019) highlighted that the (1) relative proportions and degree of vertical interconnection of coarse-texture facies (sand and gravel) and (2) unsaturated-zone thickness beneath recharge sites are important factors for recharge feasibility. In this study, we sought to develop site characteristics to describe recharge feasibility at the 100 exploratory sites across the domain. First, we use a heuristic approach of simple averages to bound the expected range of effective (i.e., upscaled) vertical Ks values at all 41 087 x, y cell locations across the domain, where the arithmetic and harmonic means (Karith and Kharm) are the upper and lower bounds, respectively, and the geometric mean (Kgeom) is an intermediate value. Karith and Kharm are typically used to approximate groundwater flow parallel and perpendicular to layering, respectively, in anisotropic systems (Freeze and Cherry, 1979). This concept has been generally been extended to variably saturated flow (Mualem, 1984; Yeh et al., 1985a, b; Assouline and Or, 2006). Fogg et al. (2000) showed that vertical groundwater flow in systems with vertically connected networks of permeable facies tends toward values between Karith and Kgeom. For each x, y cell location across the domain, Karith, Kgeom, and Kharm are given as
where n is the number of vertically coincident cells from the land surface to the initial water table depth (i.e., the unsaturated-zone cells) for each x, y cell location. In addition, the initial unsaturated-zone thickness (water to depth; WTD) and proportion of coarse-texture sand and gravel unsaturated-zone facies (UZcoarse) at each x, y cell location across the domain were included as metrics. Additional metrics were developed for each x, y cell location by combining individual metrics; i.e., WTD was used as a multiplier for Karith, Kgeom, Kharm, Surfcoarse, and UZcoarse. Spatial distributions of select metrics at all x, y cell locations are shown in Fig. 3.
Site characteristics were calculated for the 100 1 km2 exploratory sites from these metrics by determining the average and maximum value of Karith, Kgeom, and Kharm for the 25 x, y cell locations encompassing each site. In addition, the proportion of coarse-texture facies at the land surface (Surfcoarse) were calculated for each site. Site characteristics are described in detail in Table 3. Each site was further evaluated according to whether there was vertical connectivity (i.e., percolation) of coarse-texture facies from the land surface to the aquifer system. Percolation was evaluated for a control volume encompassing all cells from the land surface to the initial water table depth (i.e., unsaturated-zone cells) at the 25 x, y cell locations encompassing each site. Percolation was defined within each site control volume by a six-connectivity metric (Pardo-Iguzquiza and Dowd, 2003), in which neighboring gravel and sand cells are said to be connected if they intersect along a face. Coarse-texture facies were said to percolate if any combination of gravel and sand facies were interconnected within the control volume from the land surface to the initial water table.
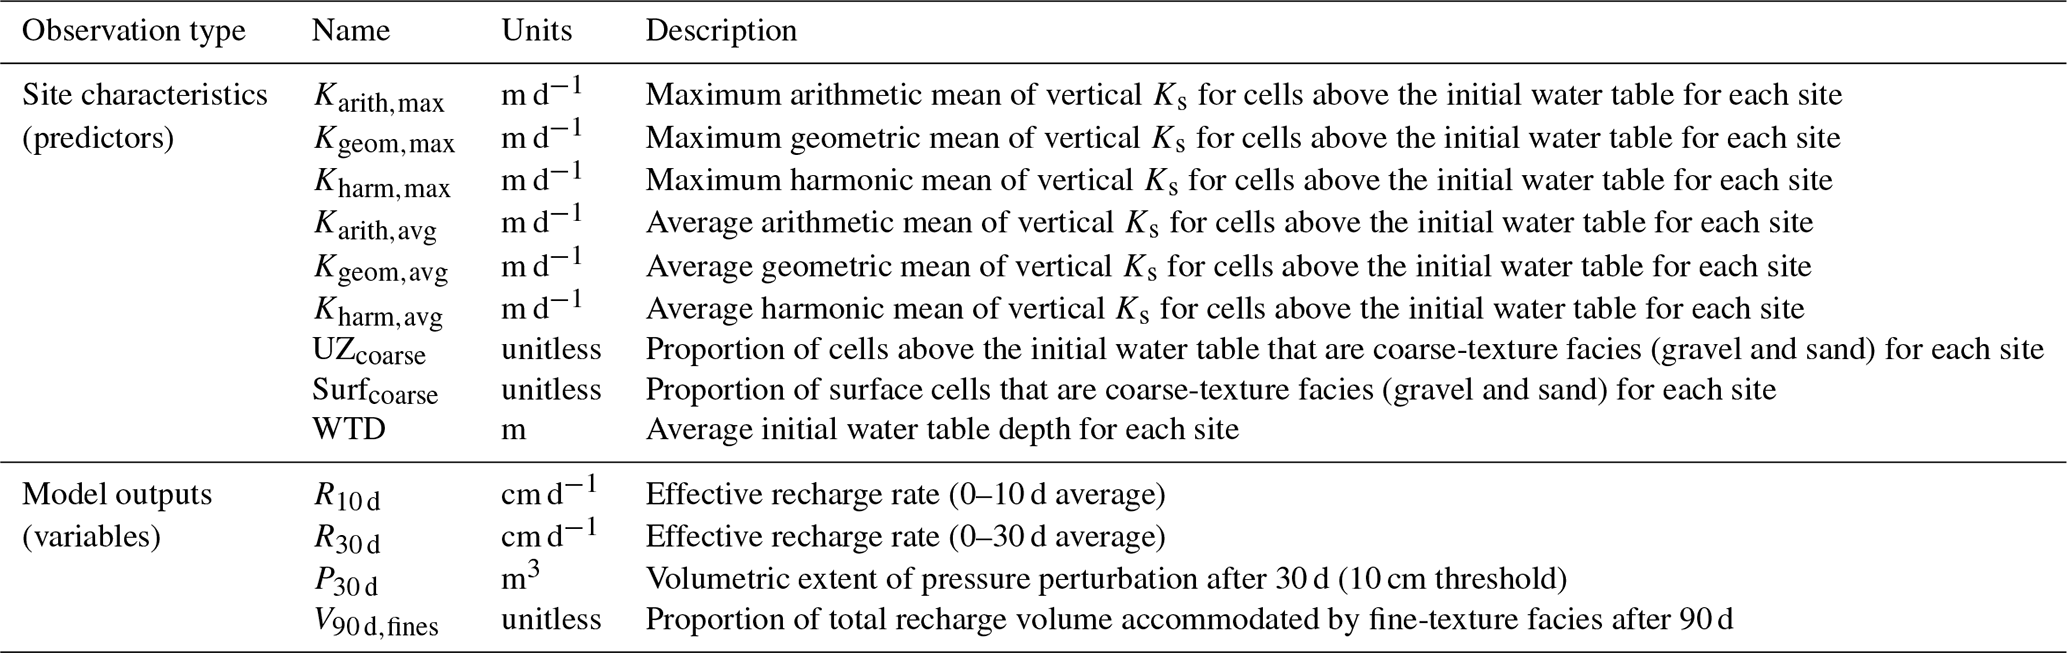
Table 3Descriptions of site characteristics (variables) and model outputs (predictors).
2.4.3 Recharge scenarios and model postprocessing
To evaluate the system response to recharge stress and recovery, 90 d recharge scenarios were run individually at each site, wherein recharge was simulated during the initial 30 d period followed by a 60 d recovery period. Surface ponding was approximated by a specified head boundary condition representing 10 cm of ponding at the 25 upper-boundary cells coincident with each recharge site, with no recharge specified for the remaining upper-boundary cells. An additional simulation was run in which no recharge was specified for all upper-boundary cells, i.e., as a no-recharge scenario. The initial condition for all recharge and no-recharge scenarios was the h distribution from the end of the model spinup. Results were output at 5 d intervals for all simulations.
Following Maples et al. (2019), recharge responses were isolated from other model stimuli by differencing h and total subsurface water storage (TSS) from each colocated cell at each time step, in each recharge and no-recharge simulation. In this way, perturbations in h and TSS result from the recharge stress alone, while other stimuli, including transient model response to regional boundary condition effects, are eliminated. For each simulation, h perturbations were evaluated at a 10 cm threshold. Domain-wide perturbations in h and TSS from recharge stress were evaluated for all 100 sites at t=30 d to calculate the volumetric extent of subsurface pressure perturbation P30 d (L3) and the effective recharge rate R30 d (L T−1) respectively, at the end of the 30 d recharge stress period for each site. Similarly, domain-wide perturbations in TSS were evaluated at t=90 d and were further delineated according to whether the change in storage occurred in fine-texture (muddy sand and mud) or coarse-texture (sand and gravel) facies so that the proportion of the total recharge volume accommodated by fine-texture facies Vfines,90 d (–) could be evaluated. Previous work has highlighted the importance of fine-texture facies for accommodating recharge, especially during late time (e.g., Maples et al., 2019). All model outputs used for subsequent analyses are shown in Table 3.
2.4.4 Relations between site characteristics and recharge potential
To better understand the relationships between site characteristics (predictors) and model outputs (variables), correlations (Pearson's r, Spearman's ρ, and Kendall's τ) were evaluated between all variable and predictor pairs across all 100 sites. Variables and predictors are described in Table 3. The purpose of evaluating correlations between variables and predictors was to determine if any site characteristics could be used to reasonably predict model outputs with empirical relations. The log 10 data transformations were selectively performed on variables and predictors to improve the normality prior to the calculation of Pearson's r. Transformations were not performed for Spearman's ρ and Kendall's τ, as neither require normal distributions for prediction.
2.4.5 Development of a geologic proxy parameter for recharge potential
To incorporate descriptions of the geologic configuration in sensitivity analyses of recharge potential, development of a geologic proxy parameter (GPP) was required. Correlations between select variables (R30 d, P30 d, and Vfines,90 d) and predictor pairs described in Sect. 2.4.4 were ranked, and a GPP value was determined for each by developing empirical regression relations between those variables and the highest ranked predictor. Unlike other parameters, GPP cannot be directly varied at each site, and instead it was approximated either with linear regression of recharge response and GPP or by relocating the recharge site within the domain to a location with the corresponding GPP value. Previous studies have shown the importance of geologic heterogeneity on MAR feasibility (e.g., Maples et al., 2019), and the novel proxy parameter methodology described here is analogous to a transfer function (e.g., Wösten et al., 2001) in that it describes the influence of complex geologic heterogeneity on recharge processes with relatively easily derived site characteristics. By using this approach in sensitivity analyses, we are able to both capture this geologic complexity and also reduce the overall computational expense, albeit with some predictive uncertainty related to the regression relations.
2.5 Sensitivity analyses using fit-independent statistics
Realistic ranges of model parameters describing six hydraulic properties for four facies types (n=24 model parameters) are shown in Table 4 along with an estimated range of GPP. Ranges for model parameters were chosen from literature values for the Central Valley, California, and for similar alluvial systems (Anderson et al., 2015; Botros et al., 2009; Fleckenstein et al., 2004; Frei et al., 2009; Maserjian, 1993; Niswonger and Fogg, 2008; Sager, 2012). Model parameters were assumed to be distributed uniformly within each of these ranges for simplicity. The range of GPP was determined from the range observed from the 100 exploratory sites described in Sect. 2.4. The distribution GPP was observed to be approximately log-normal, so a log 10 data transformation was performed for subsequent sensitivity analyses.
Table 4Parameter ranges, along with baseline and DSS perturbed parameter values for hydraulic properties and the geologic proxy parameter (GPP).
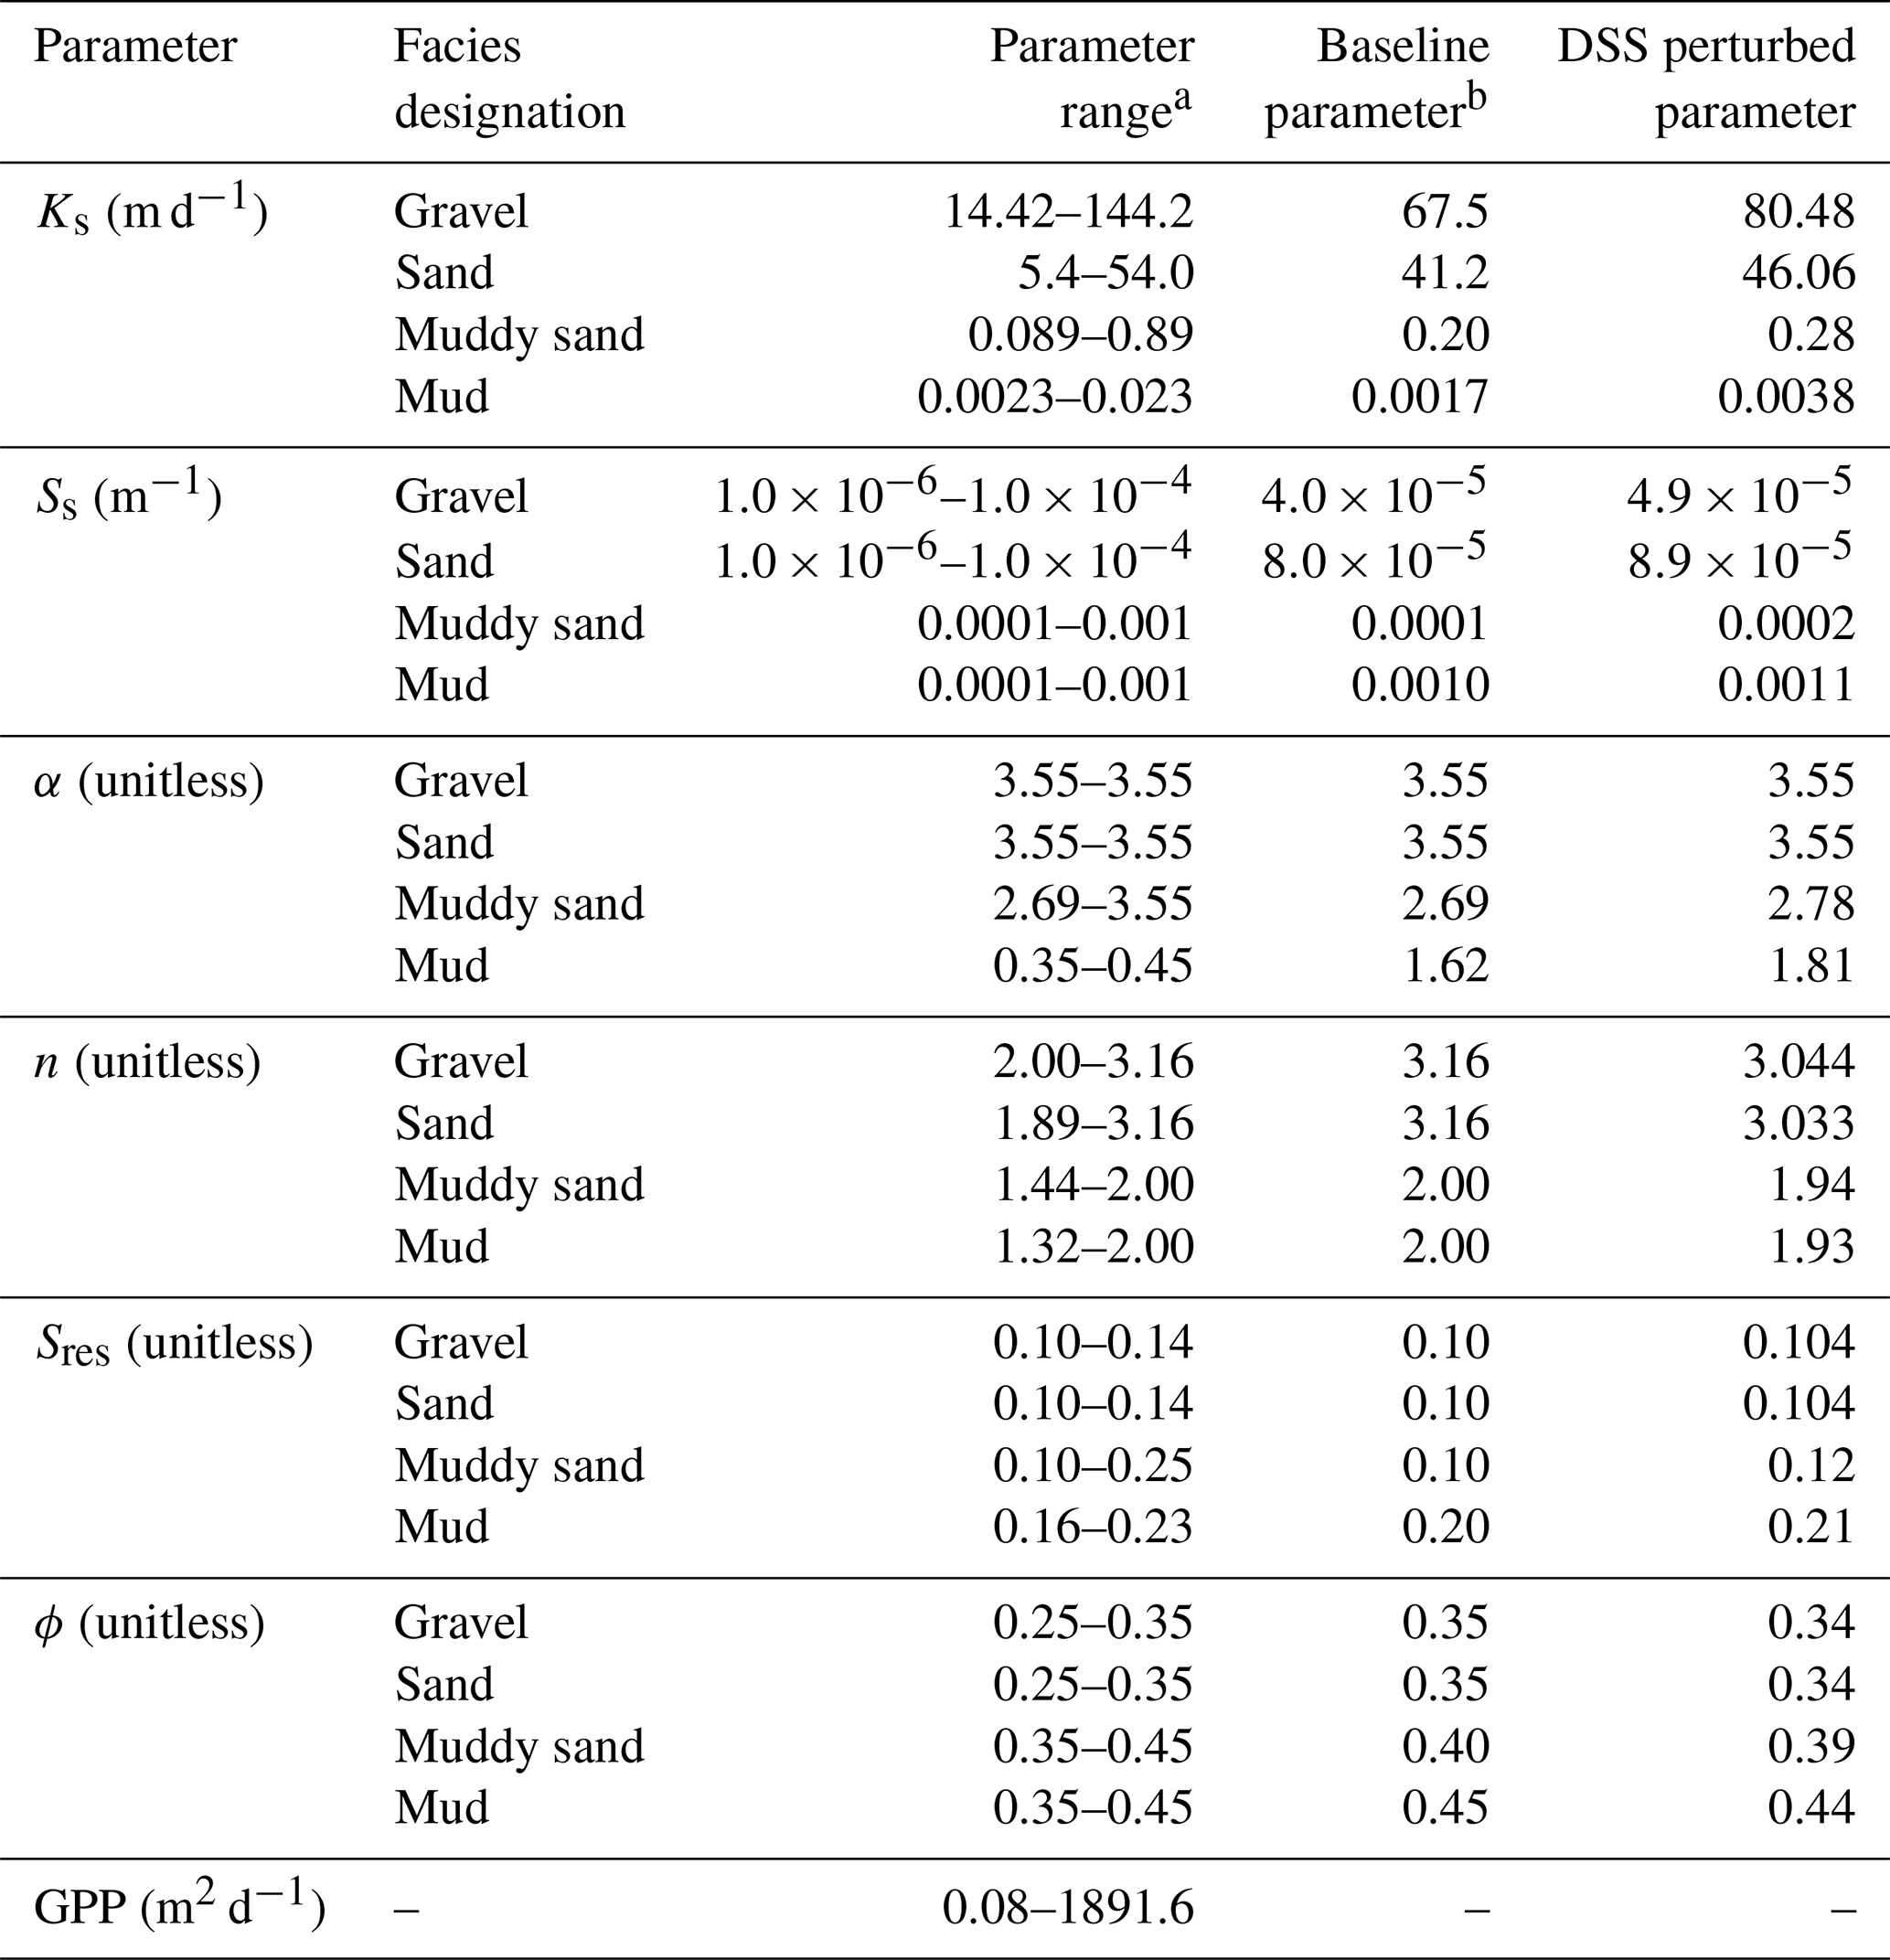
a Ranges of hydraulic properties for each facies category were derived from literature values for the Central Valley, California, and for similar alluvial systems (Anderson et al., 2015; Botros et al., 2009; Fleckenstein et al., 2004; Frei et al., 2009; Maserjian, 1993; Niswonger and Fogg, 2008; Sager, 2012). b Baseline hydraulic properties were calibrated manually by Liu (2014).
All sensitivity scenarios were initialized with the h distribution from the end of the model spinup and were simulated and postprocessed following the approach outlined in Sect. 2.4.3. In this way, each scenario required that two simulations be run with the same parameter sets (i.e., a recharge and no-recharge simulation), which were then differenced to isolate recharge stresses from other model stimuli, including transient model responses to changes in parameter values.
2.5.1 Local-sensitivity analyses
Parameter sensitivities were evaluated locally using the metrics of dimensionless-scaled sensitivity (DSS) and composite-scaled sensitivity (CSS), which are computationally frugal screening methods used to compare the relative importance of different parameters to the estimation of a simulated model output (Hill and Tiedeman, 2007). DSS for simulated output i and parameter j is calculated as
where is the ith simulated output, bj is the jth estimated parameter, is the derivative (i.e., the sensitivity) of the simulated output with respect to the jth parameter, b is the vector of parameter values at which sensitivities are evaluated, and is the weight of the ith simulated output. For this work, the simulated outputs P30 d, R30 d, Vfines,90 d were weighted equally at unity.
Composite-scaled sensitivities (CSS) were calculated to estimate the total amount of sensitivity provided by each parameter across multiple sites and for multiple model outputs as
where DSSij is from Eq. (6) and n is the total number of simulated outputs i associated with parameter j.
DSS was estimated for the select model outputs R30 d, P30 d and Vfines,90 d (Table 3) by perturbing each hydraulic-property parameter (n=24) by 10 % of its total range (Table 4). Results from the exploratory simulations show that recharge response is highly dependent on site choice, so DSS was evaluated at four representative sites which span a large range of recharge potential. Each of the four representative sites was chosen to correspond with the 25th, 50th, 75th, and 95th percentile of recharge potential, as estimated by GPP. These sites are hereto referred to as q25, q50, q75, and q95, respectively. A total of 96 model evaluations were required to estimate DSS on the three model outputs (R30 d, P30 d and Vfines,90 d) for all 24 parameters (Table 4) at these four sites. To incorporate GPP in DSS analyses, an approach was developed using the predictive regression relation between GPP and R30 d. For example, DSS requires the perturbation of a parameter (i.e., ∂bj) by a percentage of the parameter range (e.g., by 10 %). A corresponding 10% perturbation in R30 d (i.e., ) was approximated using the predictive regression relation between GPP and R30 d rather than by performing an additional model evaluation.
CSS was calculated for R30 d, P30 d, and Vfines,90 d (Table 3) by combining DSS estimates for each model output across sites q25, q50, q75, and q95 for each of 24 model parameters. The same approach was used to calculated CSS for GPP but was only estimated for R30 d and not for P30 d and Vfines,90 d.
2.5.2 Global-sensitivity analyses
A measure of global sensitivity was provided by the method of Morris (1991), which relies on the calculation of elementary effects, i.e., local derivatives sampled one at a time (OAT) on a grid that covers the parameter space. The method of Morris creates a trajectory through the parameter space by perturbing each parameter xj along a grid by a step Δj. A sequence of p perturbations is required to obtain a one trajectory for a model with p parameters. For each trajectory, the elementary effect for a single parameter EEj is calculated as the ratio of the perturbation in model output to the perturbation of the parameter as
where f(x) is the evaluation of the function at the prior point in the trajectory. Calculating the elementary effects for p parameters using a single trajectory requires p+1 model evaluations. Because the elementary effect for any single trajectory does not account for interactions between parameters and depends strongly on the location of the initial point x in the parameter space, the method of Morris performs the OAT approach over multiple trajectories N within the parameter space using a factorial sampling approach. A variation of the original approach was employed to resolve issues related to the opposite signs of elementary effects affecting the calculation of total-order sensitivity (Campolongo et al., 2007), in which the total-order sensitivity of each parameter was calculated as the mean of the absolute values of N elementary effects as
Unlike DSS approaches, the method of Morris required significantly greater computational resources for an equivalent number of parameters. Computational expense was reduced by pairing parameters, i.e., Ks of gravel and sand and of muddy sand and mud, effectively reducing these four parameters into two describing “coarse-” and “fine-texture” facies, respectively. By pairing parameters, Ks of gravel and sand (and of muddy sand and mud) are perturbed within their respective parameter ranges together. In total, three parameters were included in the Morris approach, including Ks values of coarse-texture facies, Ks of fine-texture facies, and GPP. Sensitivity indices were calculated using a sample size of N=20, resulting in a total of 80 model evaluations. Herman et al. (2013) demonstrated that the method of Morris with N=20 trajectories produced similar sensitivity results to the Sobol' method (Sobol, 2001) with >2 orders of magnitude fewer model evaluations.
To further reduce the computational expense, the total simulation time was reduced from 90 to 10 d, during which recharge was applied for the entire simulation. Sensitivity indices, Morris , were only evaluated with respect to the effective recharge rate at the end the 10 d simulation period R10 d (cm d−1). Morris was not evaluated with respect to other model outputs describing pressure perturbation or the volume of recharge accommodated by fines because GPP was determined to be an inadequate predictor of these model outputs.
To incorporate GPP in the Morris framework, a novel approach was developed in which the location of the sampling site was varied to correspond with the requisite GPP parameter choice. For example, if a hypothetical sensitivity analysis required the evaluation of the model with GPP at the 50th quantile (q50; i.e., the median value), the model would be run using the site with the nearest corresponding GPP value from the 100 exploratory sites described in Sect. 2.4. In this way, the variability of GPP as identified in the exploratory simulations can be sampled directly by simply varying the location of the recharge site within the domain. The Morris approach was implemented with an open-source library developed by Herman and Usher (2017)
3.1 Exploratory simulations
Results from the exploratory simulations at the 100 selected sites show a wide range of R30 d, P30 d, and Vfines,90 d values across sites (Fig. 4). R30 d values varied over 2 orders of magnitude and were non-normally distributed, with a maximum, minimum, and mean value of 66.4, 0.5, and 8.6 cm d−1. P30 d values were similarly non-normally distributed and also showed a large range, varying over 4 orders of magnitude. Maximum, minimum, and mean P30 d values were 1.6×10⁵, 33, and 1.9×10³ m3, respectively. These results highlight that a small number of sites have outsized recharge potential compared with most of the landscape. R30 d and P30 d values were positively correlated (r>0.70), indicating that these recharge benefits are physically related. The proportion of recharge accommodated by fine-texture facies (Vfines,90 d) also showed large variability across sites, ranging from 0.13 to 1.00, with a mean value of 0.69. The high proportion of Vfines,90 d values observed here is consistent with previous findings that suggest that fine-texture facies are the largest reservoir for MAR in this aquifer system (Maples et al., 2019). Vfines,90 d was negatively correlated with both R30 d and P30 d (), which indicates that when interconnected, coarse-texture pathways are present, a greater proportion of MAR is accommodated in the coarse-texture aquifer system.
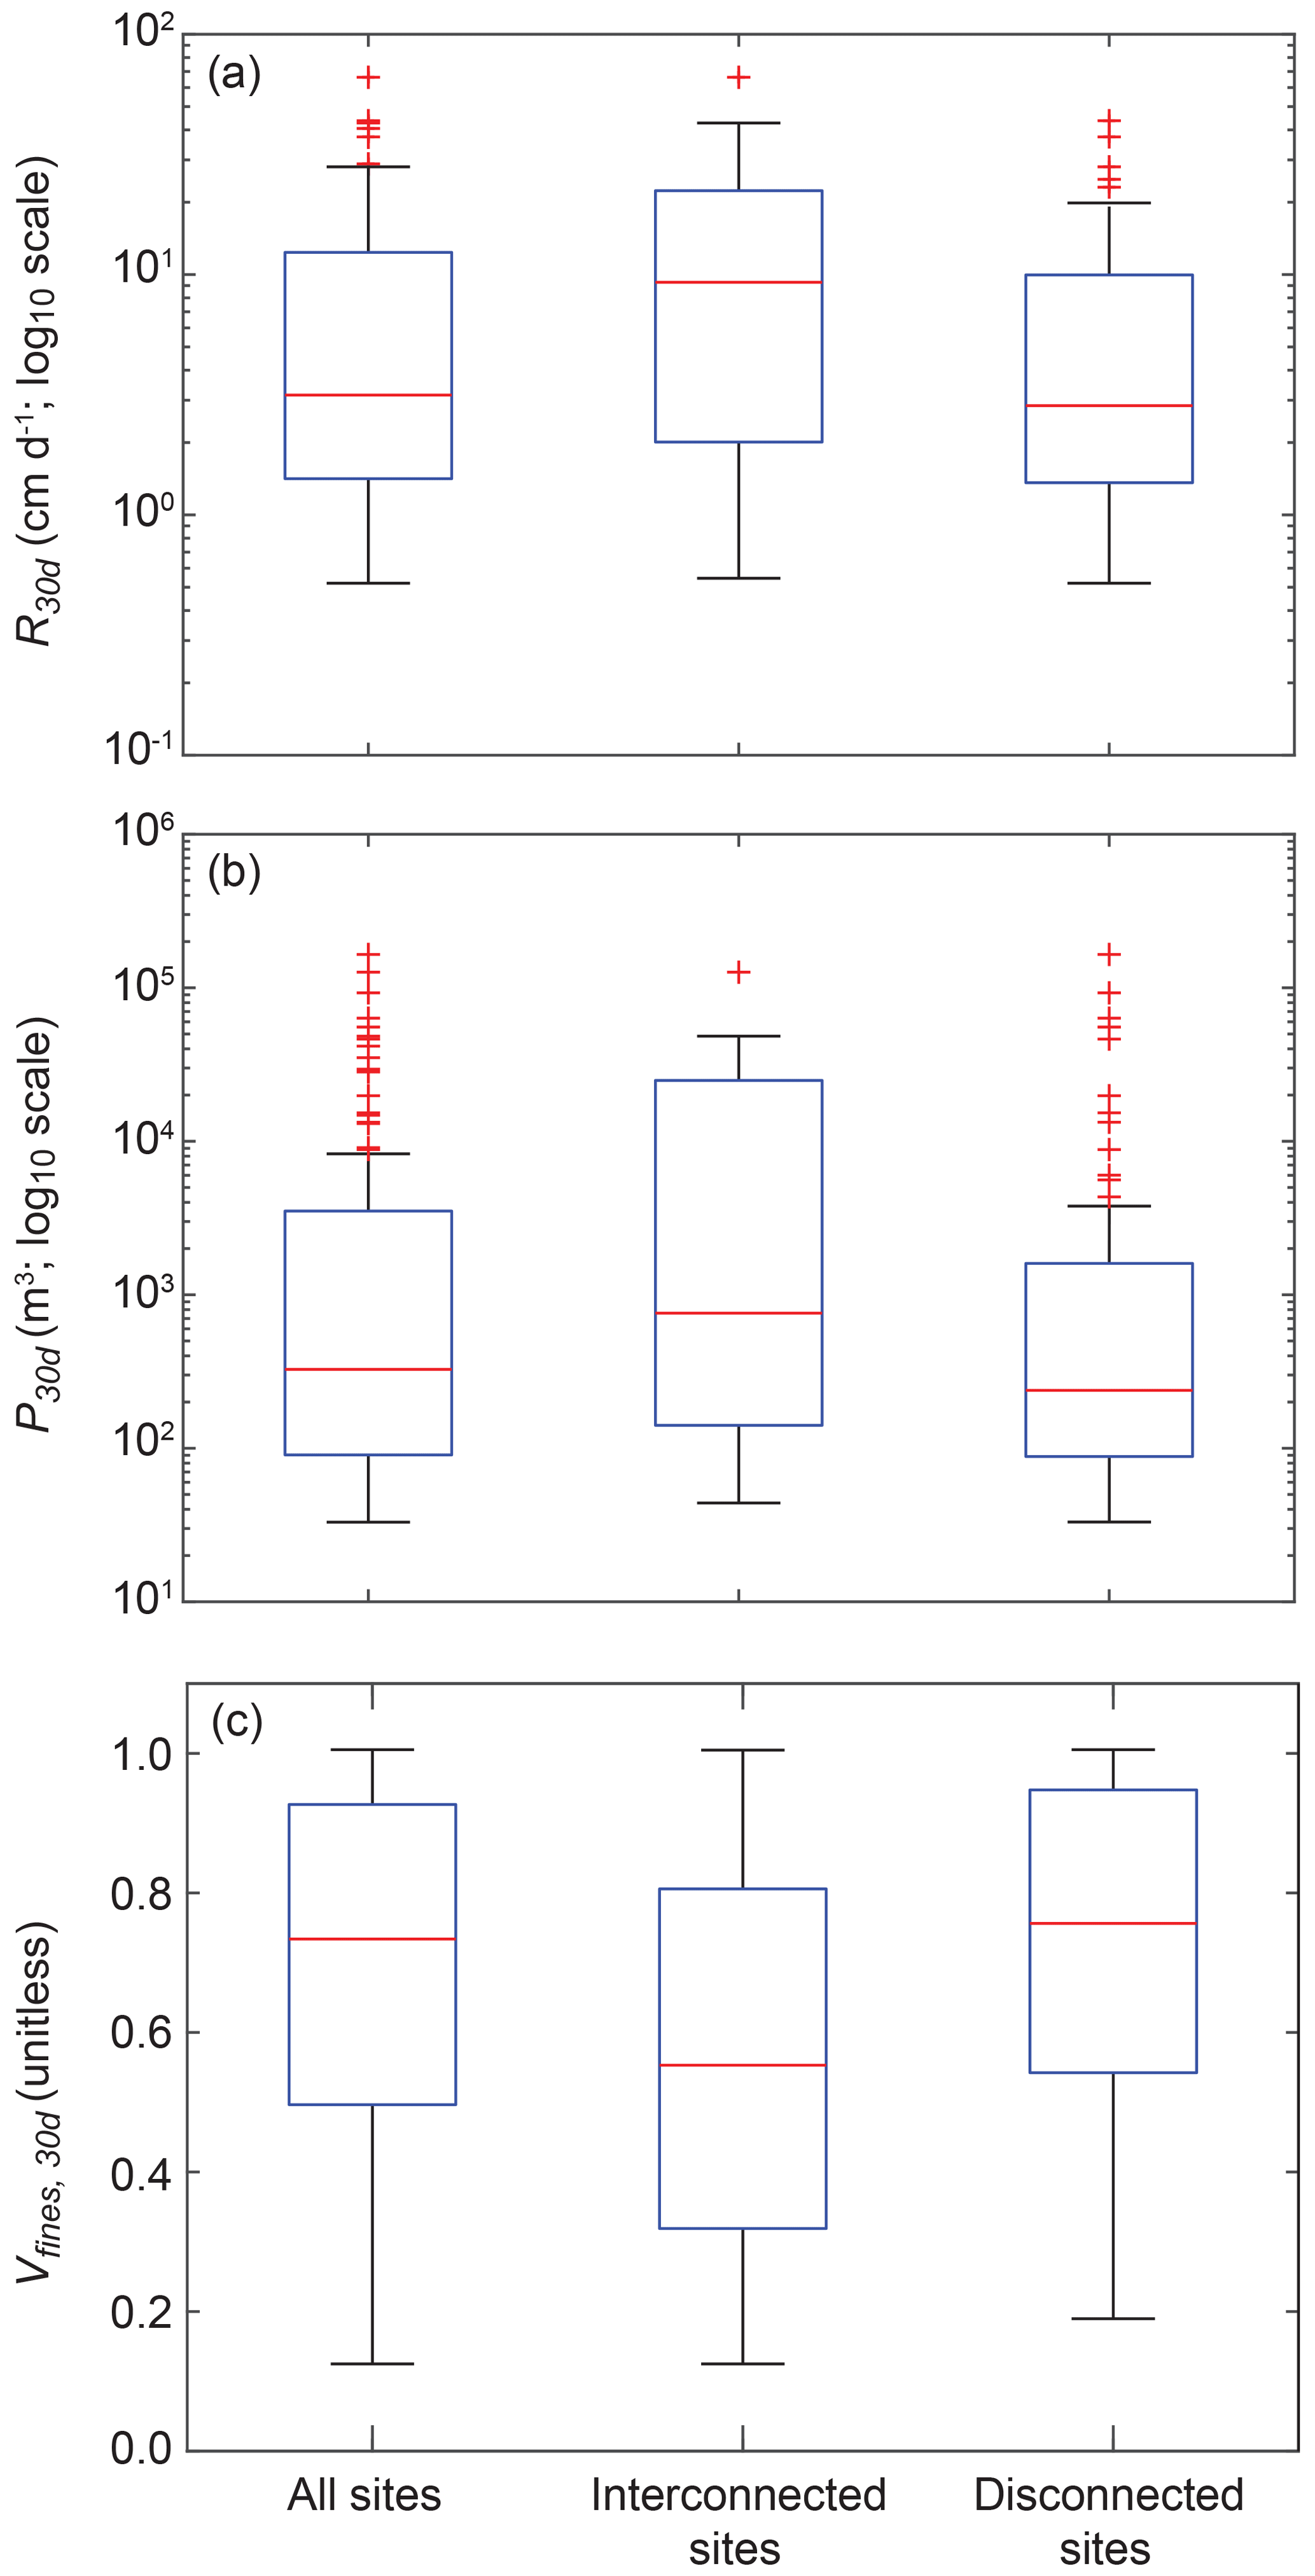
Figure 4Box plots of the (a) 30 d average recharge rate R30 d and (b) 30 d pressure perturbation area of influence R30 d for all exploratory simulations (n=100). Additionally, sites were parsed according to whether there was a vertical interconnection of coarse-texture facies from the land surface to the initial water table depth (i.e., interconnected sites; n=23) or whether sites did not have an interconnection of coarse-texture facies (i.e., disconnected sites; n=77).
3.1.1 Influence of coarse-texture connectivity
Of the 100 exploratory sites, 23 were shown to have interconnected coarse-texture gravel and sand facies from the land surface to the initial water table depth. R30 d, P30 d, and Vfines,90 d were parsed according to whether they were interconnected (Fig. 4). Results show that mean R30 d and P30 d were 2.2 and 2.3 times greater, respectively, for interconnected sites than for non-interconnected sites (14.7 cm d−1 vs. 6.7 cm d−1 and m3 vs. 6.9×10³ m3, respectively). Mean Vfines,90 d values were 1.3 times greater for non-interconnected sites than for interconnected sites. Distributions of R30 d and P30 d for interconnected and non-interconnected sites differed significantly according to the two-sample Kolmogorov–Smirnov test. Interconnected and non-interconnected distributions of Vfines,90 d were not significantly different.
These results indicate that sites with interconnected coarse-texture facies have greater R30 d and P30 d potential. However, this metric is not entirely diagnostic of recharge potential. As shown in Fig. 4a and b, some interconnected sites exhibited low R30 d and P30 d values. This is likely because some interconnected sites with shallow water table depths have limited unsaturated pore volume to accommodate large recharge volumes. In addition, the interconnection metric described herein only describes the vertical interconnection of coarse-texture facies for unsaturated-zone cells that are vertically coincident with the recharge site and does not consider whether these coarse facies connect with the greater aquifer network outside of the unsaturated-zone control volume. Results also show that some seemingly disconnected sites have a large recharge potential. Indeed, the interconnection metric described here does not account for any lateral interconnection from the land surface to the greater aquifer network, which could explain this behavior. In reality, the simplified estimator of connectivity used here likely underestimates the number of interconnected sites.
3.2 Recharge metrics
3.2.1 Correlation matrices
A matrix of correlations (absolute value of Pearson's r) of pairs of site characteristics and simulated outputs for the 100 exploratory simulations was generated to better understand the relationships between variables (Fig. 5). Simulated outputs R10 d, R30 d, and P30 d were all positively correlated with all simulated outputs, while Vfines,90 d was generally negatively correlated with simulated outputs. A strong correlation () was observed for 6 of 52 pairs of site characteristics and simulated outputs. A strong correlation was also observed among many site characteristics and among the majority of simulated outputs (i.e., collinearity), which can make the choice of an optimal proxy parameter more challenging. Site characteristics that include Kharm were not shown in the correlation matrix because we were not able to improve the normality of the distribution of these data with a log 10 data transformation; however, additional correlation metrics (Fig. 6) indicate that site characteristics that include Kharm may also be strongly correlated.
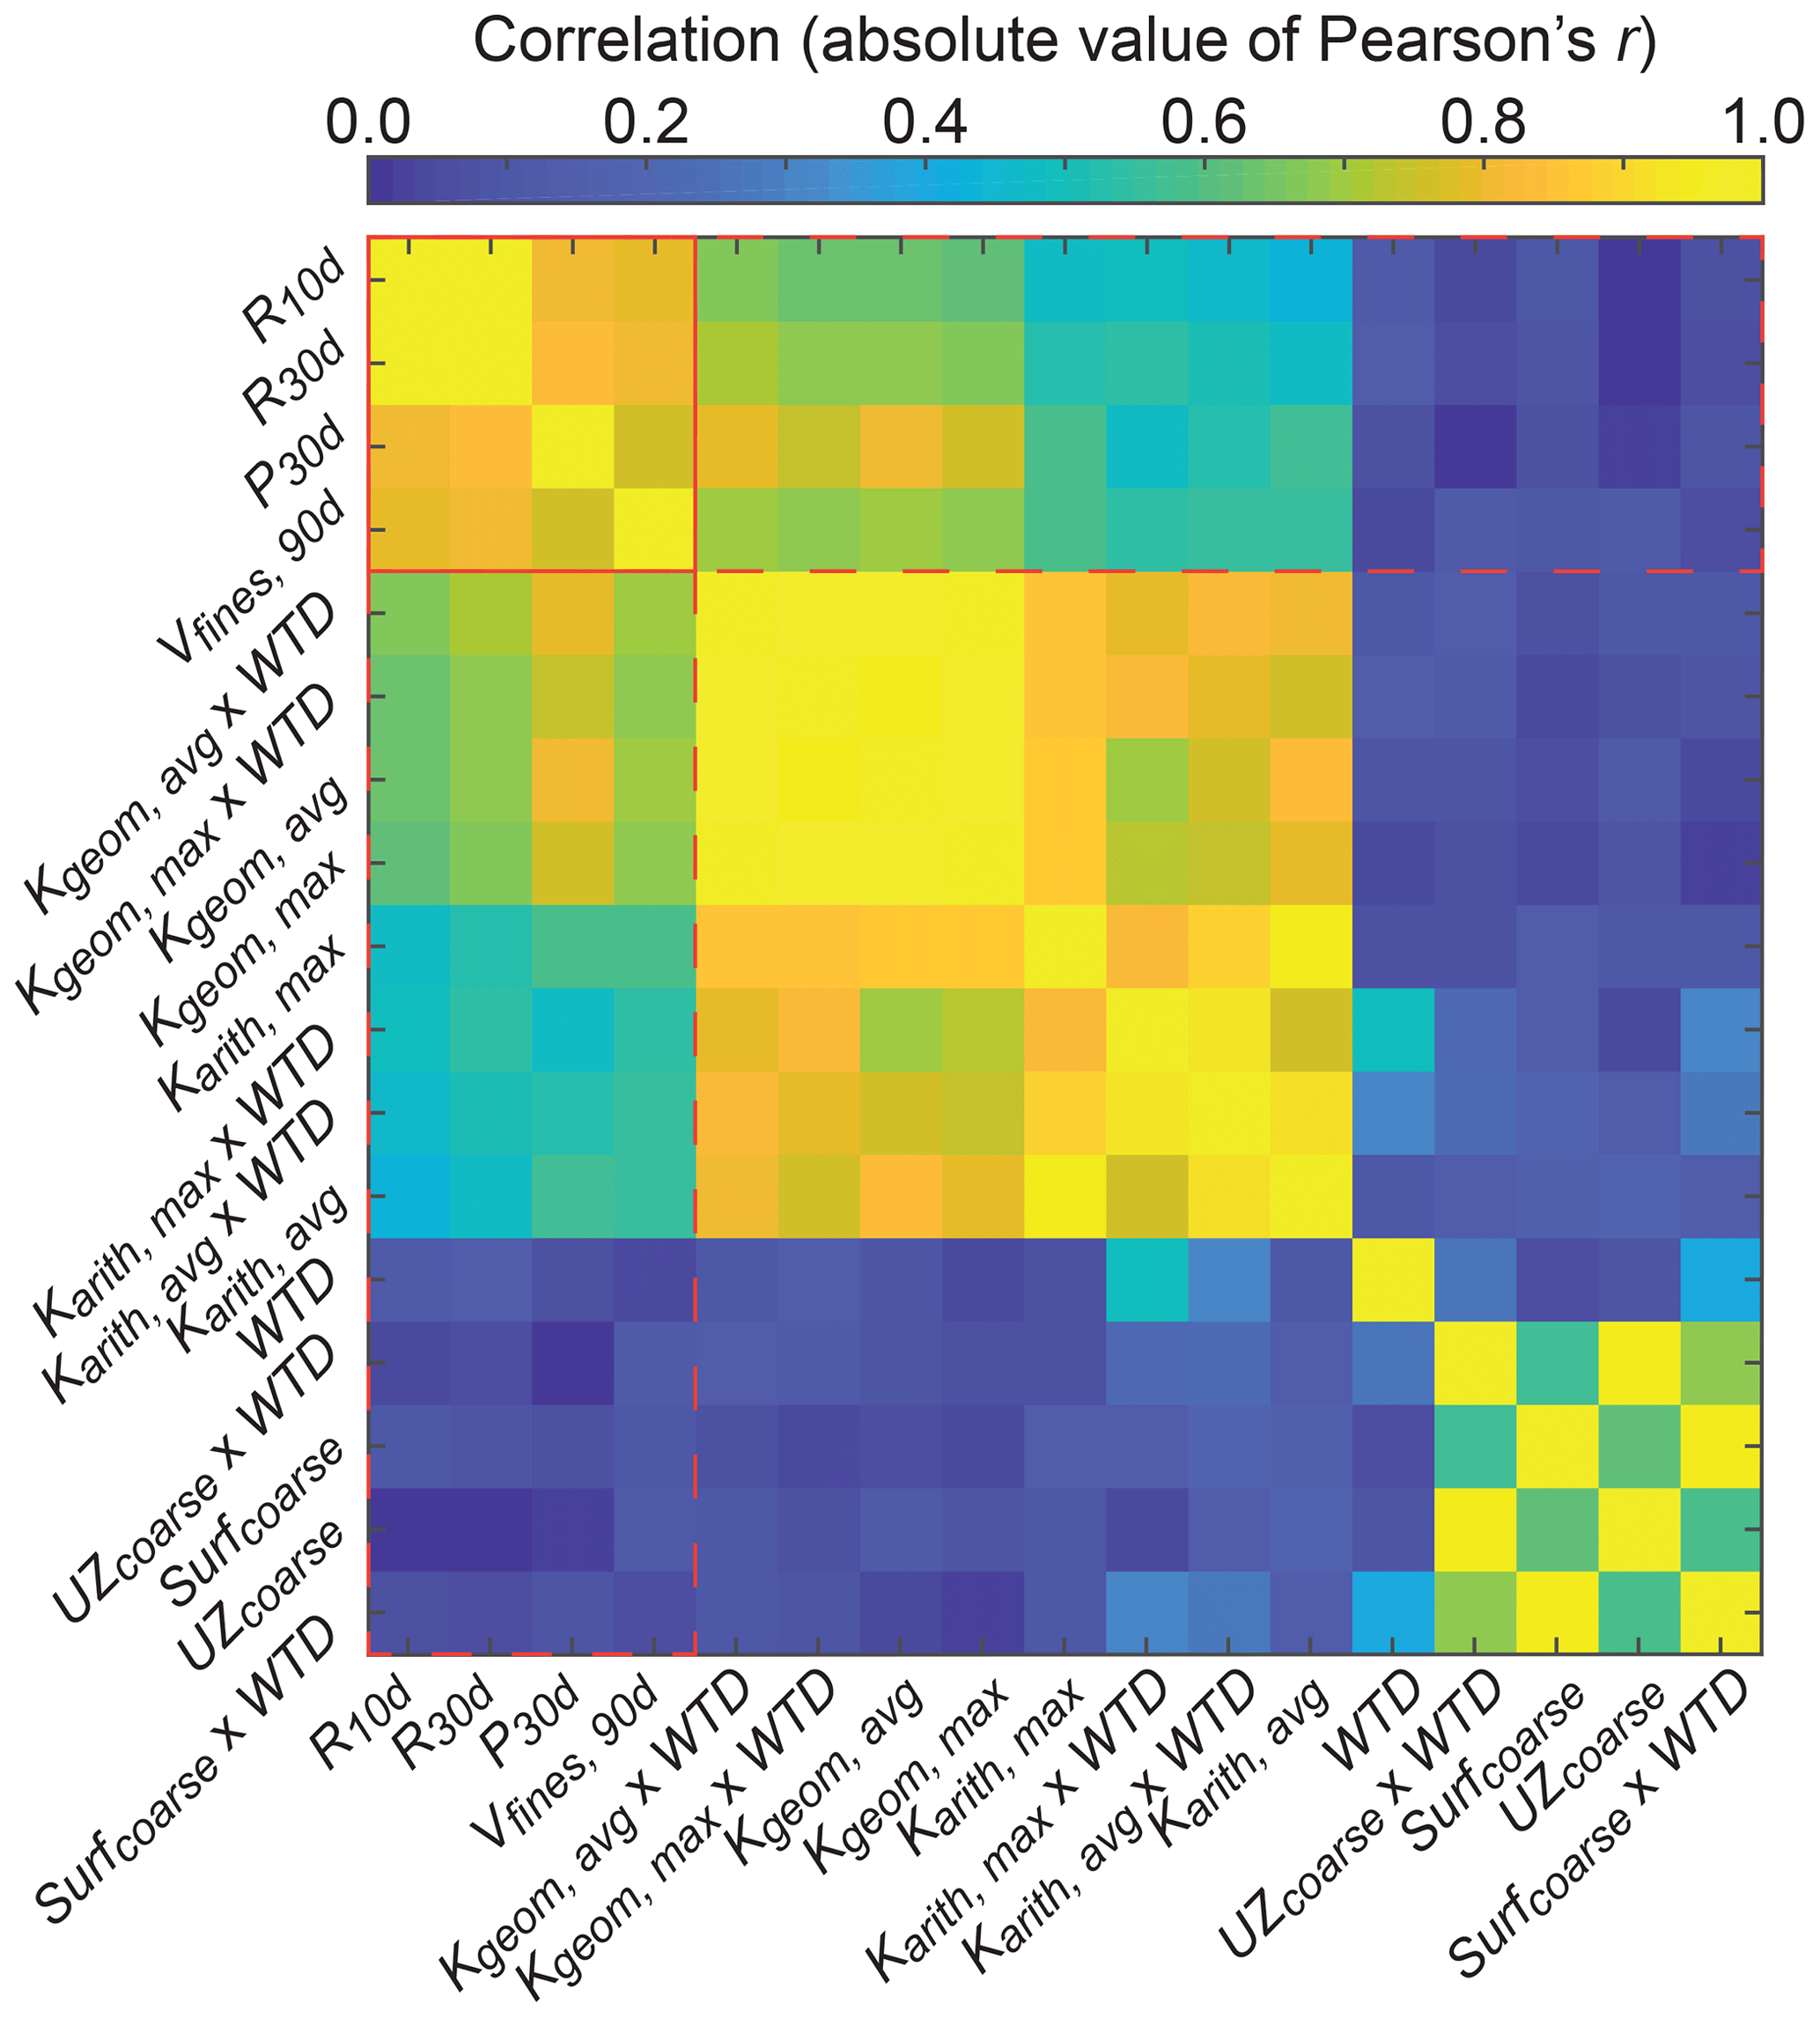
Figure 5Correlations (absolute value of Pearson's r) for all combinations of site characteristics and model outputs. Correlations among site characteristics are bounded by a solid red box, and correlations between site characteristics and model outputs are bounded by a dashed red box.

Figure 6Ranked correlations (Pearson's r, Spearman's ρ, and Kendall's τ) of site characteristics with 30 d average recharge rate (R30 d). † Pearson's r was not evaluated for site characteristics where the normality of the distribution could not be improved with a log 10 data transformation.
3.2.2 Ranked correlations
Additional correlation metrics (Pearson's r, Spearman's ρ, and Kendall's τ) between R30 d and site characteristics were ranked and are shown in Fig. 6. Results show that site characteristics that include some variation of Karith, Kgeom, or Kharm were, in general, more correlated with R30 d than site characteristics that only include WTD, UZcoarse, and Surfcoarse. Kgeom×WTD was, on average, most correlated with R30 d.
In general, site characteristics that included Kgeom and Kharm were slightly more correlated with R30 d than site characteristics that included Karith. We speculate that this behavior is related to the dominantly vertical flow direction of recharge across typically horizontal facies configurations. Previous work has shown that Kgeom and Kharm best describe upscaled K for these flow configurations in this domain (Yunjie Liu, personal communication, 2016; Fogg, 1986).
Interestingly, site characteristics that included only WTD, UZcoarse, and Surfcoarse were poorly correlated (r<0.20) with R30 d. This finding has important implications for determining MAR site suitability because many geographic-information-system-derived (GIS-derived) indices of recharge suitability rely solely on soil and/or surface geology to determine geologic suitability for recharge. These results suggest that even more detailed geologic descriptions that estimate deeper fractions of coarse-texture facies may not fully capture recharge potential. Instead, metrics that include some description of upscaled vertical K appear to be most diagnostic of recharge potential.
3.3 Recharge extrapolation
The relation between site-averaged Kgeom×DTW and R30 d was determined to be the best predictor and was used to predict R30 d for subsequent sensitivity analyses by treating Kgeom×DTW as a GPP value (Fig. 7a). The linear regression relation between Kgeom×DTW and R30 d was highly significant (p<0.01), and correlation coefficients (r2) showed that empirical regression explained 70 % of the variation in the data. Linear regression relations for Kgeom×DTW and P30 d and Vfines,90 d were deemed insufficient for prediction (r2<0.40) and were not incorporated in sensitivity analyses.
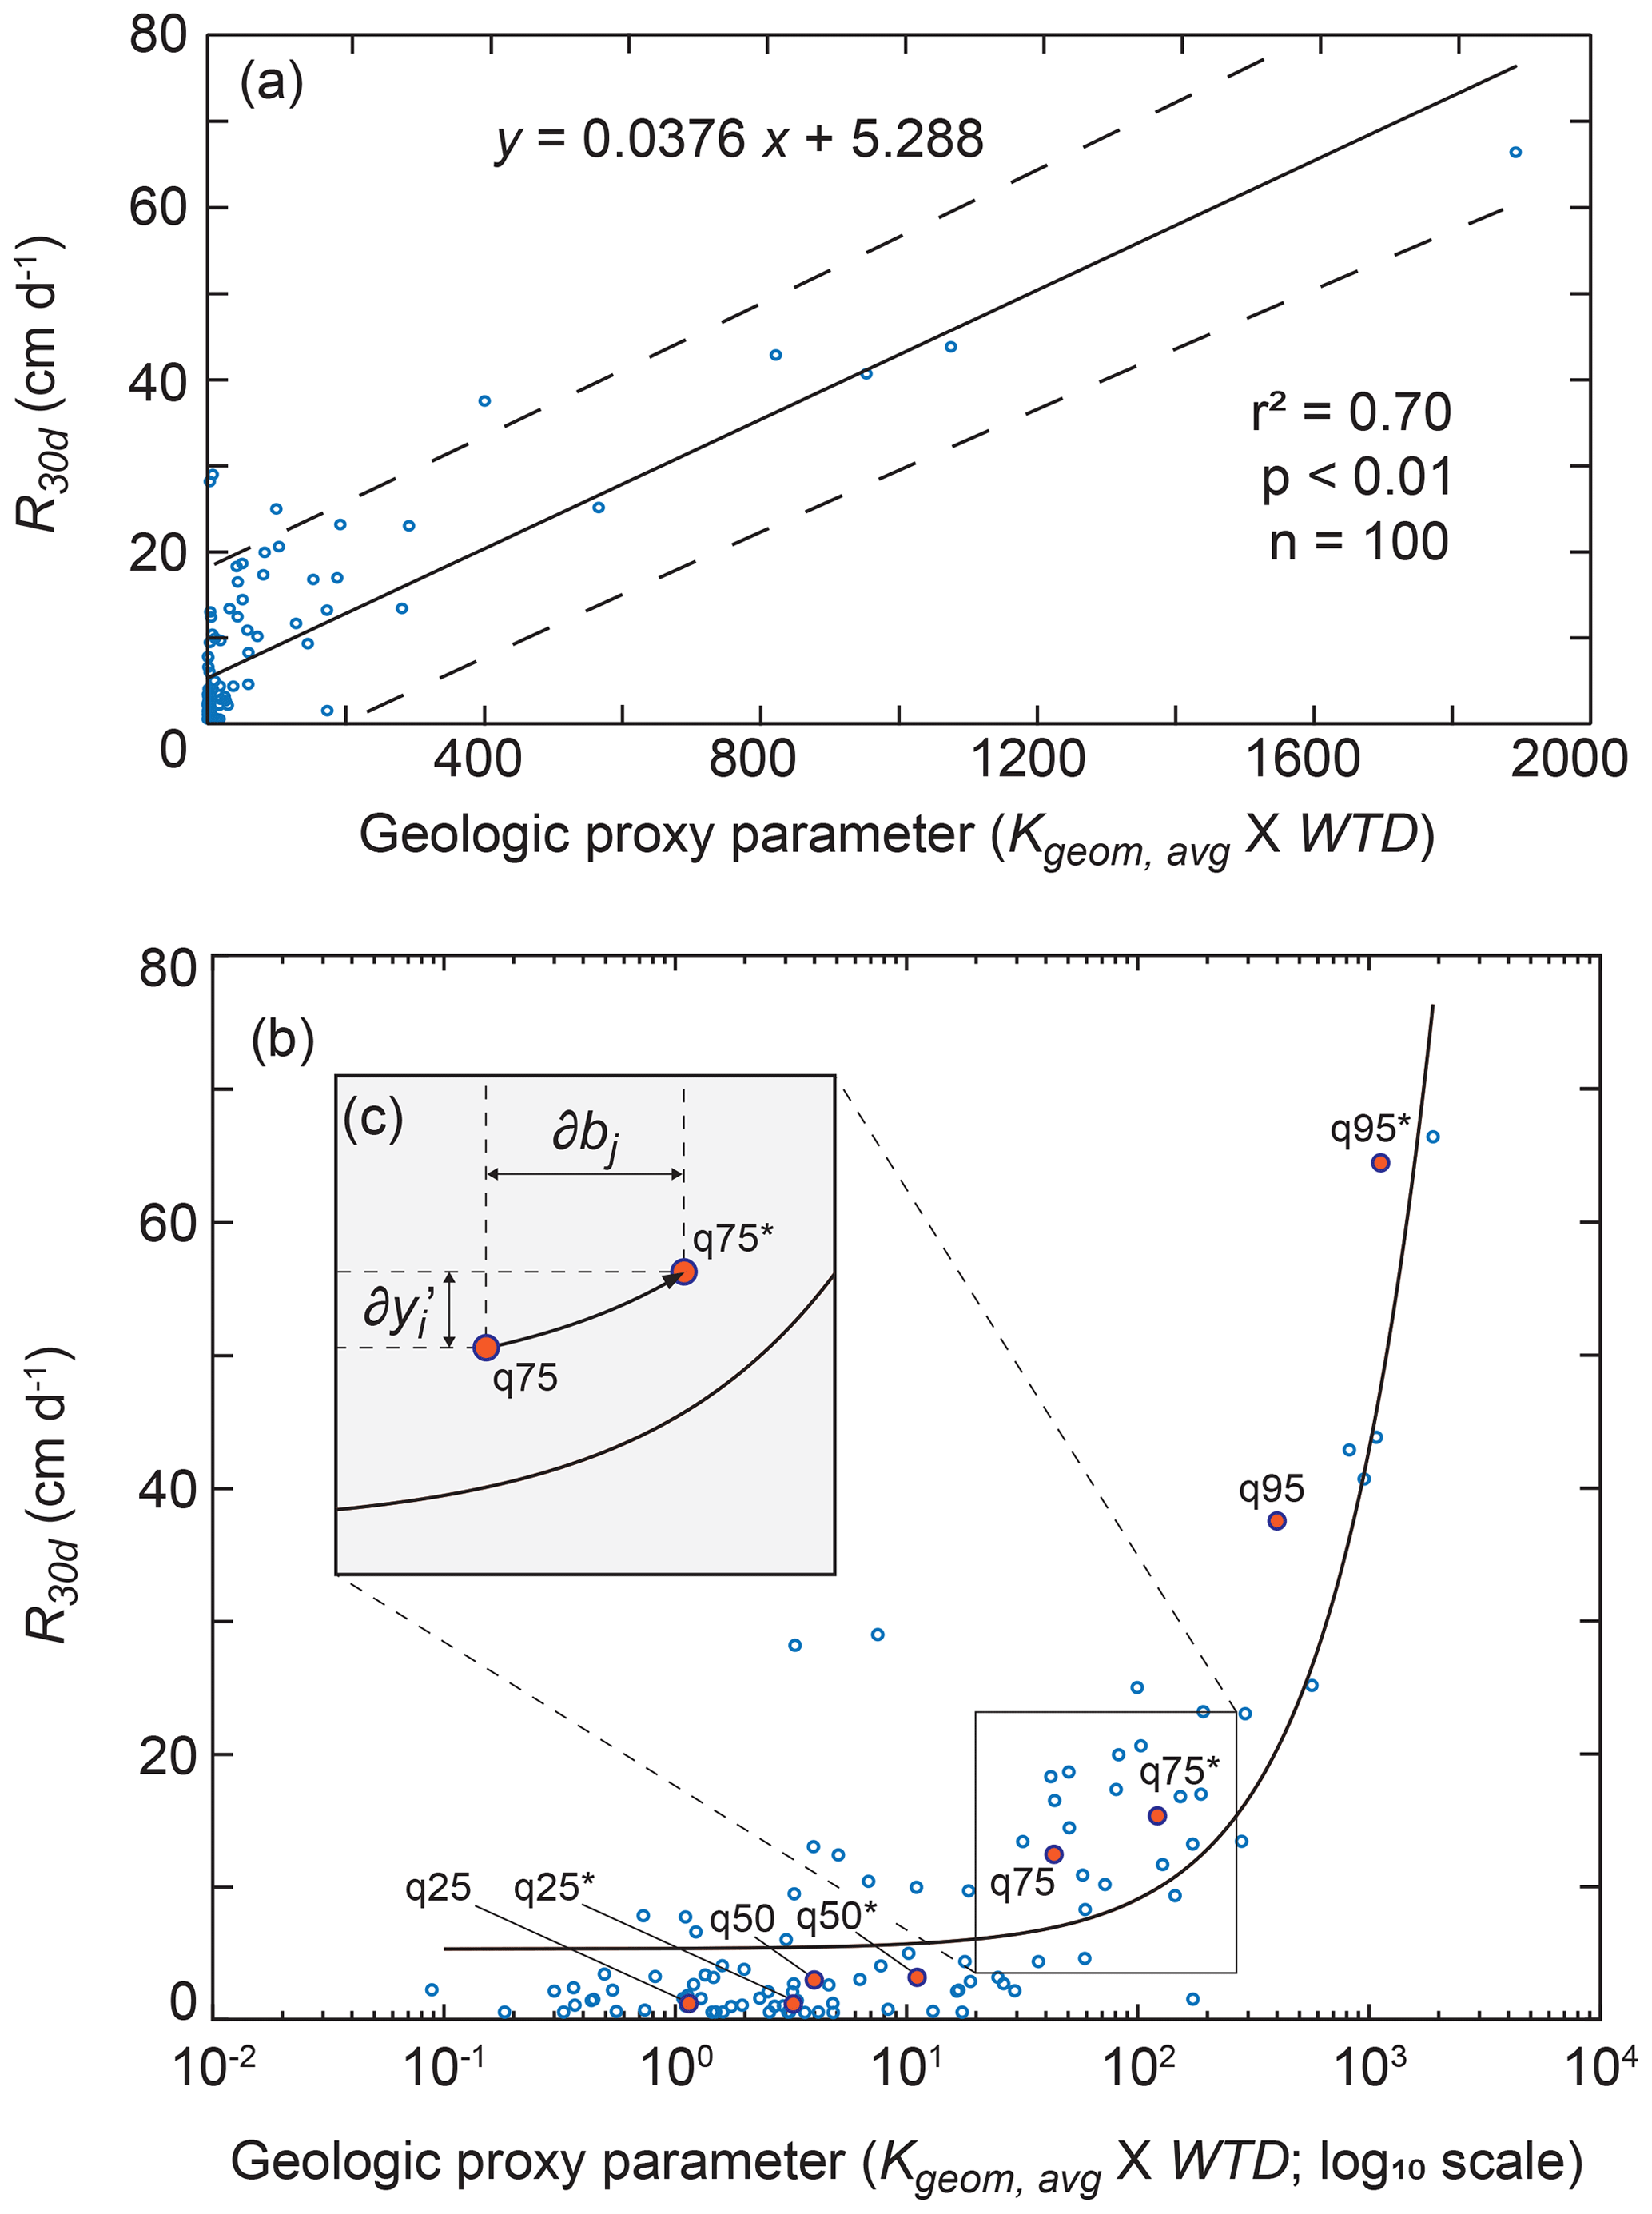
Figure 7(a) Regression relation between the geologic proxy parameter (Kgeom×WTD) and the 30 d average recharge rate (R30 d) for all exploratory simulations shown with a solid black line, where dashed lines indicate the upper and lower 95 % confidence intervals. (b) The relation is shown with Kgeom×WTD on a log 10 scale, where red circles indicate the original and perturbed sites at which dimensionless scaled sensitivity (DSS) was estimated. (c) The inset illustrates the procedure for estimating the perturbed site (e.g., q75*) from the original site (e.g., q75) for DSS, using the regression relation, where is the change in Kgeom×WTD and ∂bj is the estimated corresponding change in R30 d.
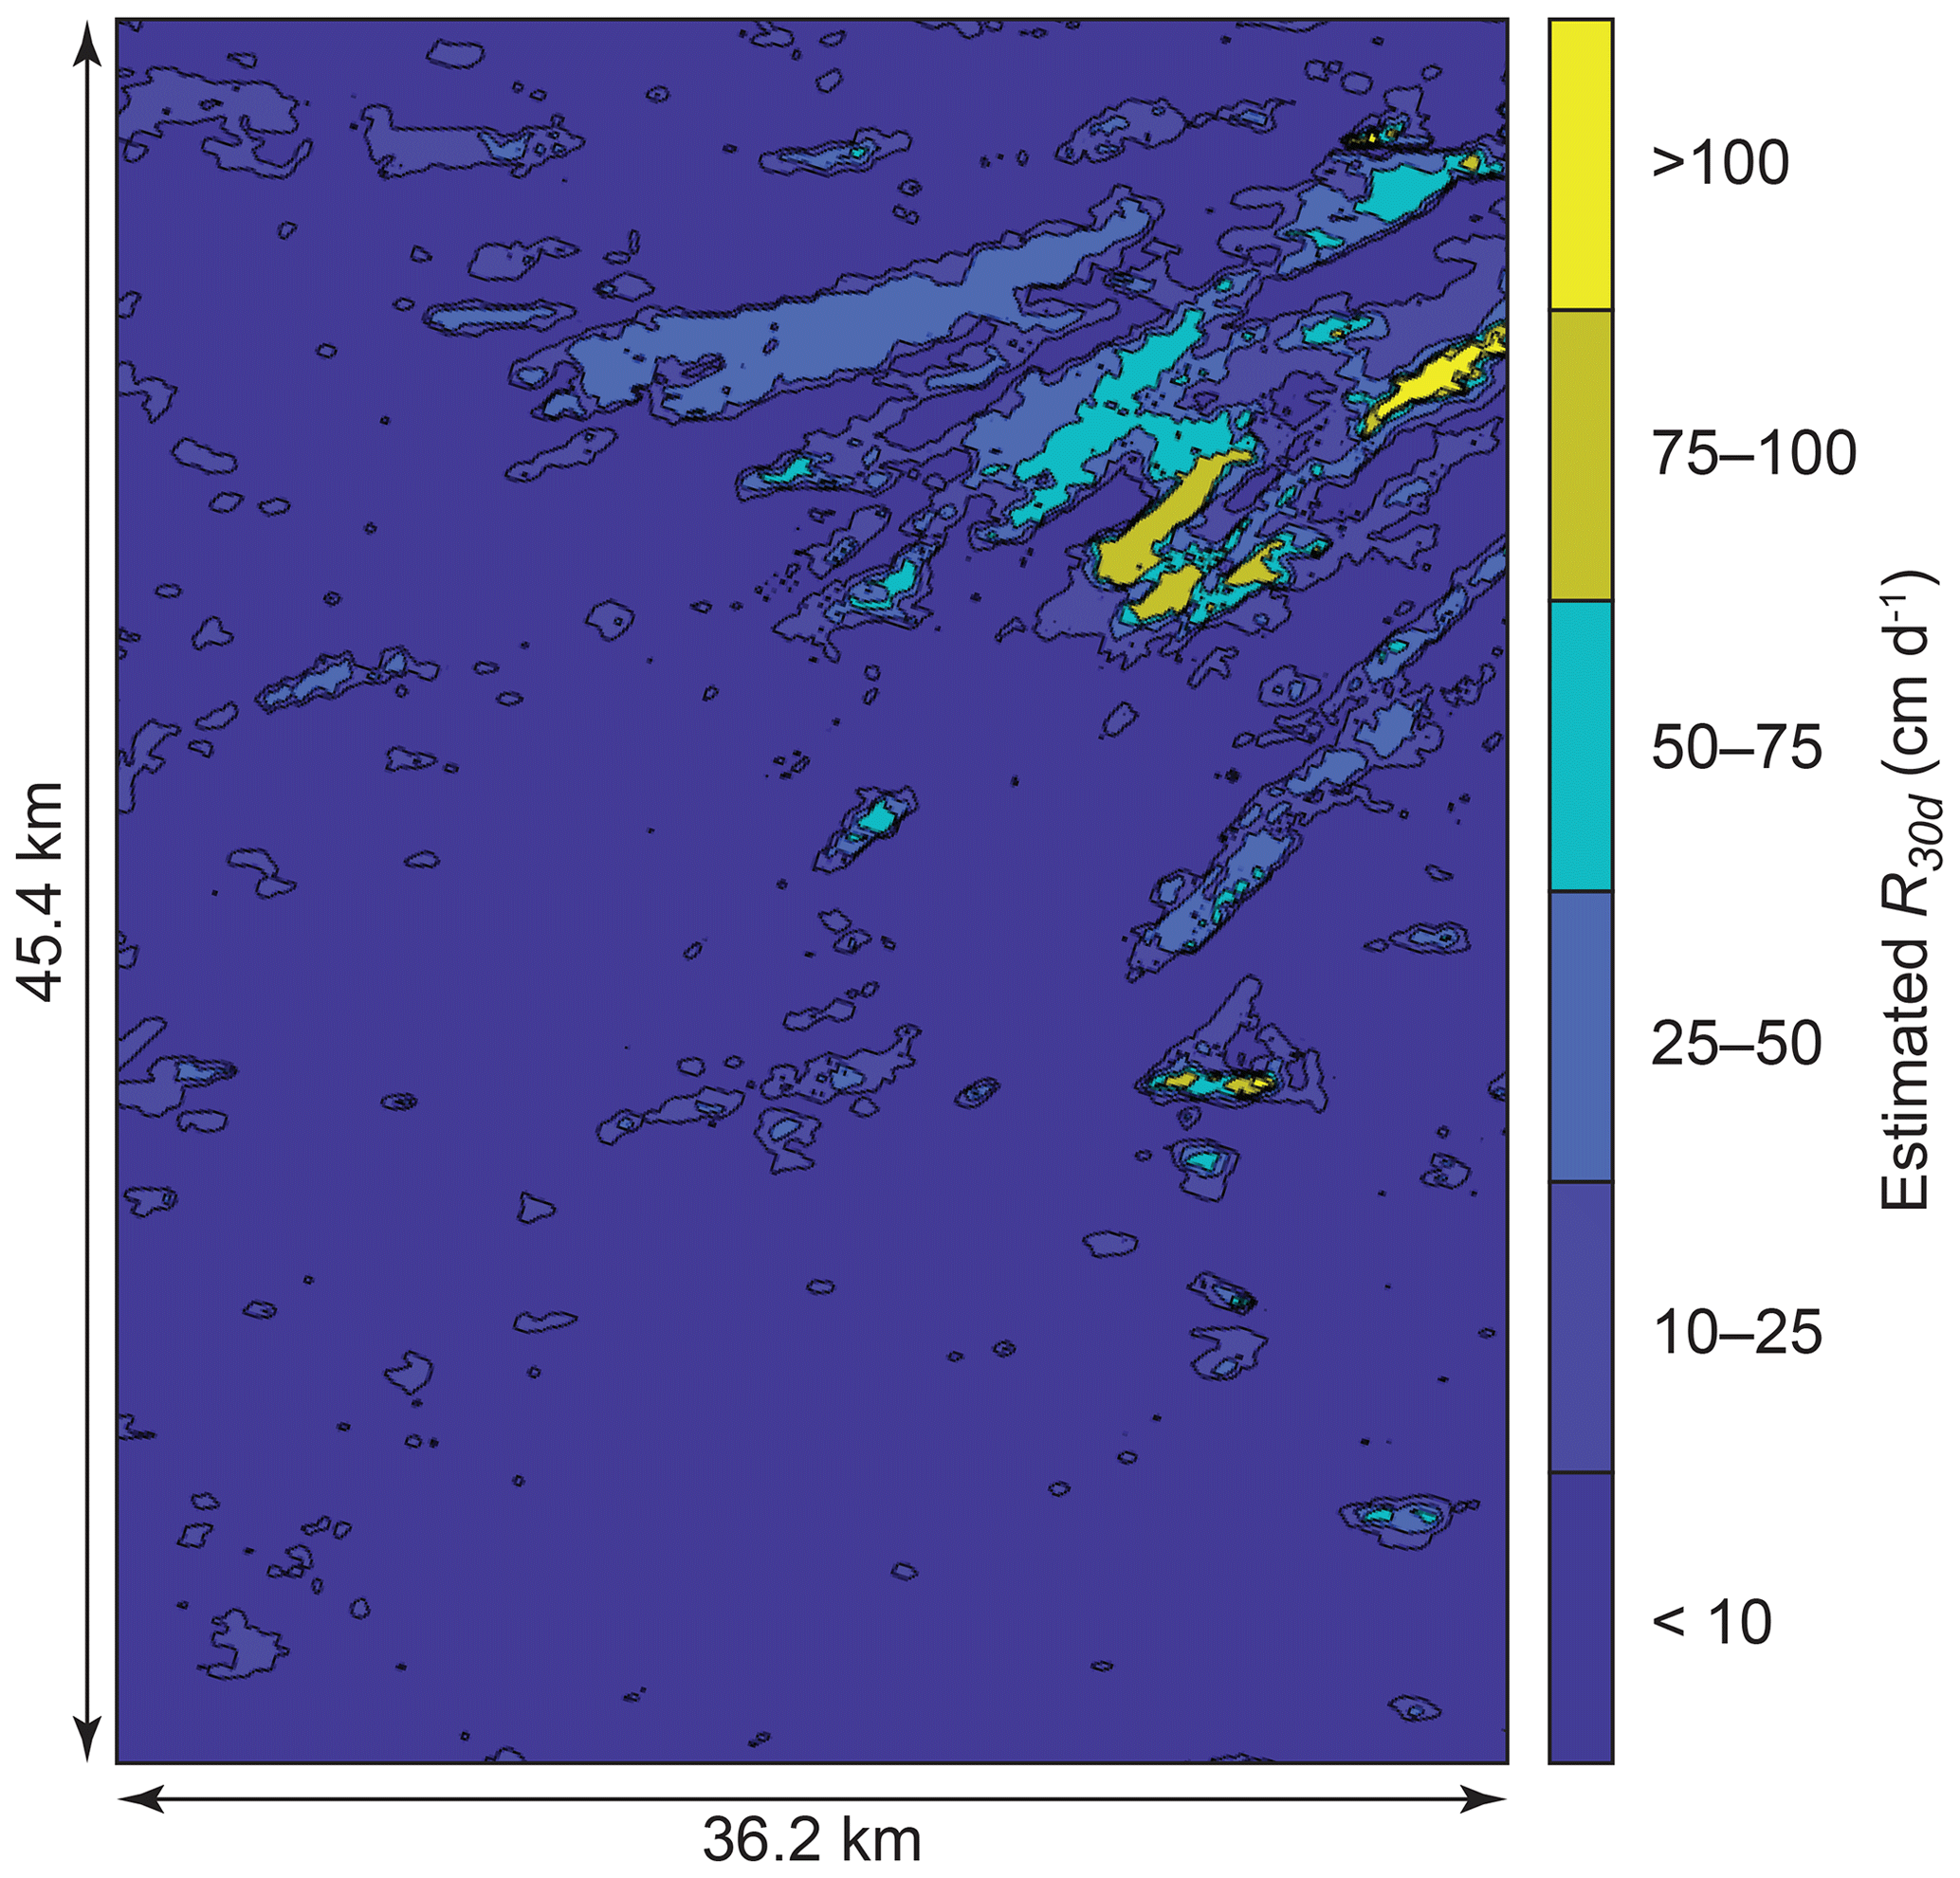
Domain-wide Kgeom×WTD was converted to R30 d using the predictive relation described above (Fig. 8). Results show that 84 % of the domain has an R30 d potential < 10 cm d−1, while 6 % of the domain has an R30 d potential > 25 cm d−1, and a small portion of the domain has an R30 d potential > 150 cm d−1. These results show a large contrast between locations with a high recharge potential and those with a low recharge potential, which supports previous findings indicating that a small fraction of the landscape has a recharge potential that is orders of magnitude greater than the rest of the landscape (Maples et al., 2019; Fleckenstein et al., 2006). The deposition of IVF within the domain area has been documented by Meirovitz (2010) and explains the presence of these high recharge potential locations.
3.4 Sensitivity analyses
3.4.1 Local-sensitivity analyses
GPP perturbations to estimate DSS for sites q25, q50, q75, and q95 using predictive regression relations are illustrated in Fig. 7b and c. DSS and CSS results for each model parameter and GPP with respect to R30 d is shown in Fig. 9. DSS results (Fig. 9a) show that for low-recharge-potential sites q25 and q50, Ks of mud and muddy sand facies were the most sensitive parameters with respect to R30 d. For high-recharge-potential sites q75 and q95, GPP was the most sensitive parameter. These findings demonstrate that Ks of fine-texture facies is the dominant driver of recharge potential for low-recharge-potential sites and the configuration of facies and water table depth is relatively less important. However, for high-recharge-potential sites, which presumably have a higher proportion of coarse-texture facies, the configuration of facies and water depth becomes the dominant driver of recharge potential. In general, the DSS values of all parameters were greater for sites with higher recharge potential than for sites with low recharge potential.

Figure 9(a) Dimensionless scaled sensitivities (DSS) evaluated for each model parameter and model output R30 d at sites q25, q50, q75, and q95 and (b) composite scaled sensitivities (CSS) evaluated for each parameter and model output at all sites. DSS and CSS of parameters were scaled to the range [0, 1] (i.e., normalized). † DSS and CSS values below 0.001 are not shown.
CSS results for R30 d (Fig. 9b) show that, in general, GPP was the most sensitive parameter for R30 d when aggregated across all four sites. In general, Ks and ϕ were also sensitive with respect to R30 d. It is unsurprising that ϕ is sensitive to R30 d because specific yield (Sy), which is not explicitly parameterized in ParFlow, is closely related to ϕ. Moreover, Maples et al. (2019) showed that the majority of recharge volume in this alluvial system is accommodated by the filling unsaturated-zone pore volume, which is controlled primarily by Sy, and by association in this model, by ϕ. Empirical fitting parameters describing unsaturated-zone texture and soil water retention, α, n, and Sres, were relatively insensitive, especially for sites q75 and q95. This suggests that while unsaturated pore volume is important for recharge, the unsaturated flow processes are not particularly important, at least when considering the infiltration of ponded water, which typically allows for rapid wetting-front advancement through the unsaturated zone, especially for high-recharge-potential sites. Results suggest that saturated storage properties, i.e., Ss, were also relatively unimportant. This likely because most recharge volume is accommodated by filling unsaturated pore volume and is thus more dependent on ϕ (and Sy) than on Ss.
Normalized DSS values for sites q25, q50, q75, and q95 and normalized CSS values for all sites are shown in Fig. 10. DSS values were scaled to the range [0, 1] (i.e., normalized) for each group of parameters for a given site and a given model output. For example, all DSS values at q25 for R30 d were normalized to the maximum value of DSS for that group of parameters. CSS values were similarly scaled for each group of parameters for a given model output. Because DSS and CSS values are influenced by the units of each model output, normalization allows for comparison of their relative magnitudes between model outputs. Results show similar sensitivity importance for each model output, wherein Ks and ϕ are generally the most sensitive parameters, while Ss, α, n, and Sres are all relatively unimportant, except for n of q95 for Vfines,90 d, which was shown to be important. DSS and CSS values of GPP were not evaluated for P30 d and Vfines,90 d because regression relations between site characteristics and these outputs were generally poor compared to those for R30 d, as noted in Sect. 3.3.
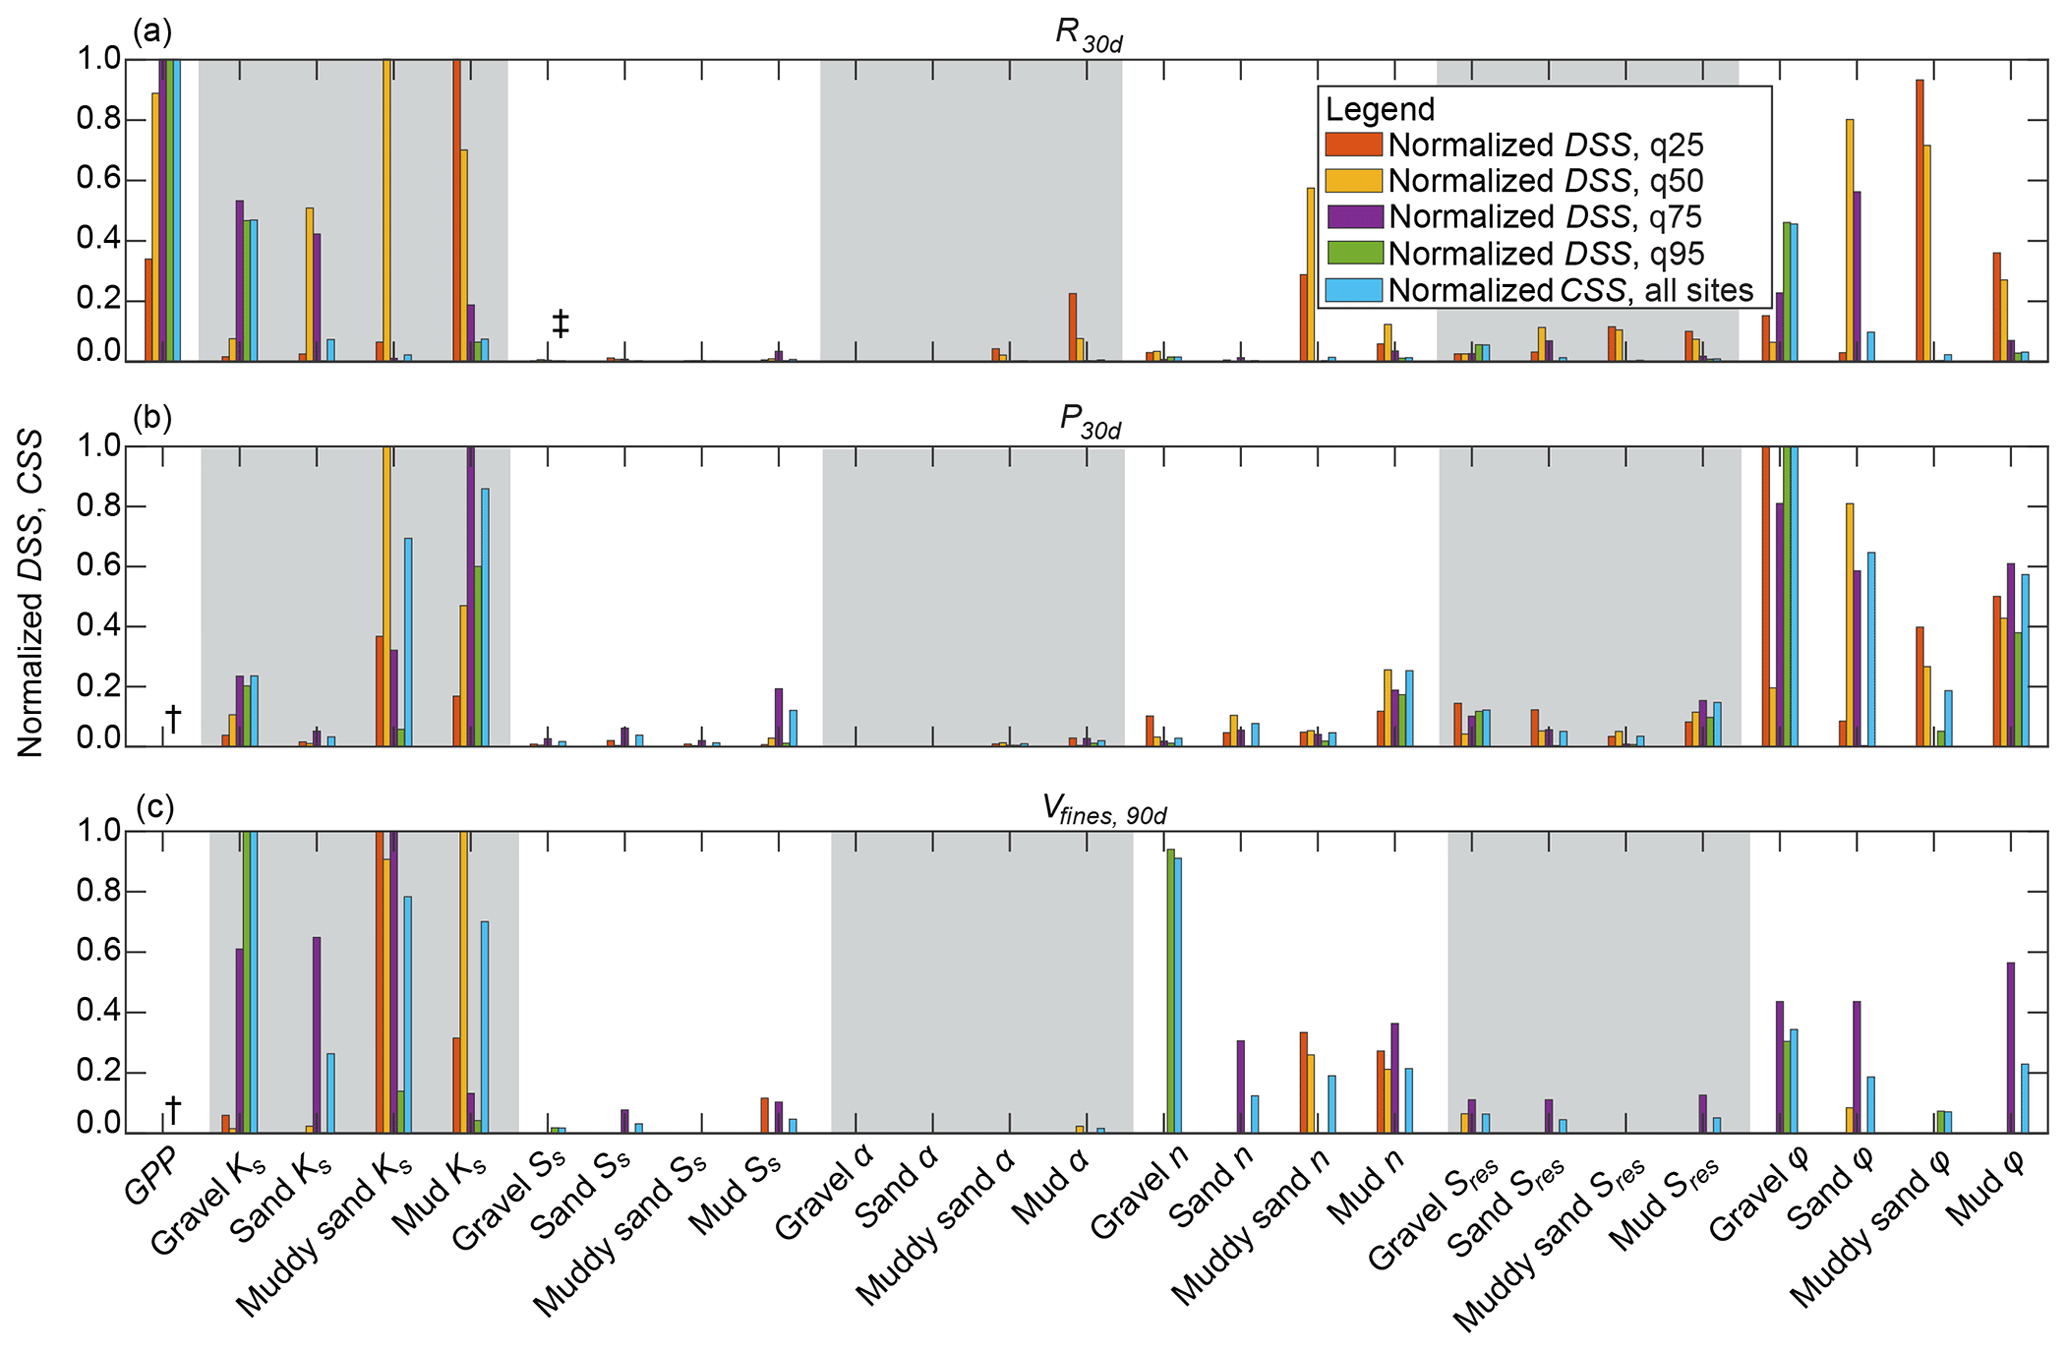
Figure 10Normalized dimensionless scaled sensitivities (DSS) evaluated for each model parameter and model outputs (a) R30 d, (b) P30 d, and (c) Vfines,90 d at sites q25, q50, q75, and q95 and normalized composite scaled sensitivities (CSS) evaluated for each parameter and model output at all sites. DSS and CSS of parameters were scaled to the range [0, 1] (i.e., normalized). † DSS and CSS of GPP were not evaluated for P30 d and Vfines,30 d. ‡ DSS and CSS values below 0.01 are not shown.
DSS and CSS results for GPP demonstrate the novel usage of empirical regression relations in a local-sensitivity analysis framework. By perturbing GPP in this way, the constancy of other parameters can be maintained in a way that would be otherwise difficult if GPP was perturbed by changing the location of the recharge site. Performing local-sensitivity analyses at multiple sites spanning a range of recharge potential allowed for the comparison of DSS sensitivities across sites and highlights differences of parameter sensitivities for low- and high-recharge-potential sites. Our findings demonstrate that (1) facies permeability and unsaturated-zone storage properties are important factors for recharge potential and (2) the configuration of subsurface geology and water table depth is particularly important for the total recharge volume that can be accommodated at a particular site, especially for high-recharge-potential sites.
3.4.2 Global-sensitivity analyses
Results from global-sensitivity analyses are shown in Fig. 11. Morris μ* values indicate that GPP is the most sensitive parameter when compared with Ksat of coarse- and fine-texture facies. These results are consistent with findings from local-sensitivity analyses which also showed that GPP was the most important parameter with respect to R30 d. Unlike DSS and CSS results, which compared GPP to model parameters for each facies, Morris analysis combined Ks parameters for coarse- and fine-texture facies which, in turn, increased the influence of those parameters on R30 d relative to GPP. Even so, results indicate that GPP is the most important parameter with respect to R30 d. These results further highlight the importance of the configuration of subsurface geology and water table depth for groundwater recharge potential.

Figure 11Morris μ* value of R10 d for GPP and Ksat of coarse-texture (gravel and sand) and fine-texture (muddy sand and mud) facies, where bars represent each μ* estimate and whiskers represent the respective 95 % confidence interval of the estimate.
Morris results demonstrate a novel incorporation of GPP within a global-sensitivity analysis framework and were unique compared to the incorporation of GPP in local-sensitivity analyses described in Sect. 3.4.1. Unlike the local methods, which used an empirical relation to incorporate an estimate of GPP sensitivity, the method used for the Morris approach directly varied GPP within the parameter space by moving the recharge site to the location with the requisite GPP parameter value. Unlike the local approaches, which required constancy among all other parameters as each parameter is perturbed and thus required the usage of an empirical relation to perturb GPP, the Morris approach varies all parameters globally, which allowed for GPP to be included explicitly within the approach. The consistency of the results of the local and global approaches despite these methodological differences for incorporating GPP highlights the robustness of these findings.
Sensitivity analyses are a fundamental diagnostic tool to provide insight into the relative importance of the parameterization of aquifer properties among other inputs in complex hydrologic models (Saltelli et al., 2004). Sensitivity analyses can be broadly categorized as local or global methods, where local methods provide sensitivity evaluation at a single location in the parameter space (Hill and Tiedeman, 2007), while global approaches explore sensitivities throughout a multidimensional parameter space (Saltelli et al., 2008). Many studies have shown the diagnostic utility of local approaches (e.g., Foglia et al., 2009); however, local approaches are generally less robust than global approaches, especially for nonlinear models (Saltelli et al., 2008). On the other hand, global methods are typically orders of magnitude more computationally expensive than local approaches. Many studies have evaluated the sensitivity of diffuse recharge in hydrologic and landscape models (e.g., Hartmann et al., 2017; McCallum et al., 2010). Other studies have evaluated sensitivities related to subsurface heterogeneity and permeability upscaling in variably saturated flow models (e.g., Gilbert et al., 2016; Foster and Maxwell, 2019; Srivastava et al., 2014) and on MAR specifically (e.g., Rahman et al., 2013; Heilweil et al., 2015), but to our knowledge, this is the first study to use a three-dimensional variably saturated water flow code with a detailed representation of geologic heterogeneity to evaluate the importance of hydraulic properties and geologic configuration on MAR dynamics with a combination of local- and global-sensitivity analyses.
Our approach includes the novel incorporation of geologic architecture as a geologic proxy parameter (i.e., GPP). Of the many approaches to develop a GPP of recharge potential from descriptions of subsurface geologic and hydrologic characteristics, our results show that a GPP which combines metrics related to upscaled vertical Ks and unsaturated-zone thickness was most diagnostic of recharge potential. In addition, results from local- and global-sensitivity analyses indicate that this GPP is equally or more important for characterizing the hydraulic properties of any particular facies for recharge potential. The consistency of results for both local and global approaches shows that these findings are reasonably robust and highlights the importance of accurately characterizing the subsurface configuration of coarse-texture facies in clastic sedimentary aquifer systems. While a GPP was shown to be the most important parameter with both approaches, we also show that parameters related to unsaturated-zone storage and facies permeability (i.e., ϕ and Ks, respectively) were also important for MAR. In contrast, we show that parameters related to unsaturated-zone geologic texture and soil water retention, along with saturated-zone storage properties (i.e., α, n, Sres, and Ss), were relatively unimportant. We speculate that these parameters are relatively unimportant because our simulations typically showed that surface ponding initiated rapid downward wetting-front advancement through the unsaturated zone, quickly developing fully saturated conditions from the land surface to the water table. In systems dominated by diffuse recharge, these parameters may be more sensitive.
Findings presented here for a semi-confined alluvial aquifer system show large spatial variability of recharge rates that are dependent primarily on subsurface geologic configuration. We show that select locations in the domain area are capable of accommodating recharge benefits orders of magnitude greater than would be possible over the rest of the landscape. These findings are consistent with previous studies that indicate that favorable site characteristics, including connect networks of coarse-texture IVF, are present in the American–Cosumnes river area of the Central Valley, California (Meirovitz, 2010; Maples et al., 2019), but likely occur over a small fraction of the domain area. Other studies have shown that IVF deposits occur elsewhere in California's Central Valley (e.g., Weissmann et al., 2005) and in other major river fans that drain high-elevation, glacially influenced catchments (e.g., Pierce and Scott, 1983). Identifying sites that can accommodate large MAR volumes during short windows is especially valuable in places like California, where excess surface water available for recharge typically occurs from a few precipitation events (Dettinger et al., 2011) during short (<10 d) windows (Kocis and Dahlke, 2017).
Our results show that cursory investigations of soil or surficial geology are likely insufficient to adequately characterize MAR favorability. Instead, our findings indicate that more thorough investigations of subsurface geologic architecture and aquifer configuration are needed to accurately characterize MAR feasibility. We found that metrics that consider the geologic configuration of facies and provide some measure of upscaled vertical Ks are the best predictors of recharge feasibility. We show that connectivity metrics that determine whether coarse-texture facies interconnect from the land surface to the saturated zone are also helpful but not fully diagnostic of recharge potential. Interestingly, our results show that metrics describing the unsaturated-zone thickness, fraction of coarse-texture facies at the land surface, and fraction of coarse-texture unsaturated-zone facies are insufficient when each is considered alone. This finding has important implications because several GIS-derived metrics of recharge potential describing recharge suitability of surficial soils have been developed for California and elsewhere (O'Geen et al., 2015; Adham et al., 2010; Ghayoumian et al., 2007). We consider these products to be valuable, albeit incomplete metrics that are likely complemented by more detailed investigations of deeper subsurface geologic architecture.
Existing MAR siting efforts in California have mostly relied on surficial mapping rather than the characterization of deeper three-dimensional subsurface geologic architecture because these complex subsurface investigations are typically prohibitively labor- and cost-intensive. In the past, these subsurface investigations relied primarily on gathering and interpreting geologic texture from typically sparse well-log data. However, emerging geophysical approaches using airborne time-domain electromagnetic methods (AEM; Knight et al., 2018) and ground-based transient towed electromagnetic methods (tTEM; Behroozmand et al., 2019; Auken et al., 2018) are promising new approaches to directly image subsurface geologic texture. Pilot studies have shown the efficacy of these approaches for mapping geologic texture up to 500 m in depth to efficiently identify regional aquifer configuration and potential MAR locations in the Central Valley (Knight et al., 2018) and mapping favorable MAR locations in high resolution at the field scale (Behroozmand et al., 2019). The authors present this work, in part, to motivate the scientific community to develop and adopt new, cost-effective approaches for identifying favorable geology for MAR.
Importantly, no single GPP described herein was a fully diagnostic metric of recharge potential at all sites. This result is not surprising given the complexity of the geologic architecture and variability of aquifer configuration sampled across sites in the domain, which are challenging to fully capture with a single metric. For example, all site characteristics described here were developed only for those model cells that are vertically coincident with each site footprint and do not account for possible preferential pathways in adjacent cells outside of the immediate site footprint. We acknowledge that further research into this phenomena could provide additional insight into developing site-specific GPP, but this is outside the immediate scope of this work. We also acknowledge some limitations of our sensitivity analyses. For example, reliance on imperfect empirical regression relations to include measures of geologic configuration in local methods likely introduced uncertainty to DSS and CSS estimates for this parameter. In addition, the inclusion of all model parameters describing facies hydraulic properties in the Morris approach would have been valuable but was infeasible given the computational resources for the simulations required. In addition, parameter-range uncertainty contributes some uncertainty to the rankings of parameter importance.
Our simulations also do not consider some subsurface geologic conditions that influence MAR. Clastic sedimentary aquifer systems are typically replenished naturally over longer timescales (Taylor et al., 2013) because even productive aquifer systems are commonly composed mostly of fine-texture sediments (e.g., Fogg, 1986; Fogg et al., 2000) that form nearly ubiquitous, multiple confining layers that inhibit direct recharge of the interconnected sand and gravel body networks that comprise the aquifer system. The presence of laterally continuous aquitard facies has been well documented for portions of the southern Central Valley (Phillips and Belitz, 1991; Faunt et al., 2009) and in other unconsolidated alluvial aquifer systems in California (e.g., Fisher, 1964). While not present within the domain area, these features have been shown to uniformly impede recharge to confined aquifer systems where they are present. In addition, we do not consider some surface conditions that affect real-world MAR, like topographic site limitations, evaporative losses, and clogging effects (Bouwer, 2002). We emphasize that this study is not a thorough site investigation of the American–Cosumnes area. The TPROGS approach is inherently stochastic, and conditioning data to inform the model are sparse in places (Maples et al., 2019). In addition, the single TPROGS realization used for our simulations provides only a single representation of possible facies distributions within the domain. Our findings are presented as a proof of concept to explore the importance of geologic heterogeneity on MAR in a hypothetical but physically realistic domain. Finally, we acknowledge some potential limitations when applying the differencing approach used to isolate recharge stresses from other model stimuli for the nonlinear model presented here. The potential for errors with this approach for nonlinear models have been noted in several studies (e.g., Reilly et al., 1984; Nadler et al., 2018). However, spurious recharge stresses or unrealistic model noise were not encountered when isolating recharge stresses with the differencing approach in this study.
Our findings have important implications for assessing MAR feasibility and for understanding MAR processes in clastic alluvial aquifer systems in California and globally, where accelerating groundwater overdraft and increasing water scarcity are observed (Scanlon et al., 2012; Famiglietti et al., 2011; Wada et al., 2011). Our results highlight the importance of identifying and cataloging locations with favorable geology for recharge, especially in light of recently passed groundwater management legislation in California that mandates limiting both the “chronic lowering of groundwater levels” and “significant and unreasonable reductions in groundwater storage” (Kiparsky et al., 2016). While studies have shown that the implementation of MAR can lead to more sustainable groundwater management (e.g., Niswonger et al., 2017), the widespread adoption of MAR is still hampered by a number of challenges, including institutional barriers to water-rights transference and water accounting uncertainty (Asano, 2016), infrastructure limitations, including land acquisition and water conveyance costs (Gailey, 2018), and water quality considerations (Hartog and Stuyfzand, 2017). Our approach, which combines a detailed representation of subsurface geology with physically realistic water flow physics in a sensitivity analysis framework, can (1) help guide site investigations and data collection methods for proposed MAR projects and (2) improve the representation of recharge processes in management-focused, typically coarse-resolution groundwater models.
This research explores the sensitivity of hydraulic properties and subsurface geologic architecture on MAR processes with the variably saturated water flow code ParFlow in a highly heterogeneous geologic domain that reflects the complex, unconsolidated alluvial geologic architecture of the northern Central Valley, California, that is consistent with many alluvial aquifer systems. This work comprises two fundamental components. First, exploratory simulations were performed at 100 randomly sampled sites across the domain to evaluate the correlation between 17 geologic and hydrologic site characteristics and simulated recharge benefits. Results from the exploratory simulations show that site characteristics representing subsurface geologic configuration by upscaling vertical K can produce good correlations with the average 30 d recharge rate (R30 d). Regression relations between site-averaged Kgeom×WTD and R30 d were shown to be the most correlated (r=0.70, p<0.01, r2=0.70). Conversely, site characteristics describing the unsaturated-zone thickness (WTD), fraction of coarse-texture unsaturated-zone facies (UZcoarse), and fraction of coarse-texture surface facies (Surfcoarse) alone were all poorly correlated with R30 d. These results highlight the value of characterizing subsurface geologic configuration through K upscaling. For subsequent sensitivity analyses, Kgeom×WTD was designated as a geologic proxy parameter (GPP) for recharge potential using the aforementioned predictive regression relation.
Subsequent local- and global-sensitivity analyses were performed for model hydraulic properties and GPP to evaluate the relative importance of these parameters on recharge potential. Results from local-sensitivity analyses indicated that GPP is the most sensitive parameter for R30 d, more so than any parameter describing hydraulic properties of each facies. Sensitivity analyses also indicated that permeability and unsaturated-zone pore volume (i.e., Ks and ϕ, respectively) were relatively more important than other hydraulic properties, including unsaturated-zone geologic texture, soil water retention, and saturated-zone storage properties (i.e., α, n, Sres, and Ss) for R30 d. Results from global-sensitivity analyses were consistent with local-sensitivity analyses, indicating that GPP is relatively more important than the Ks value of coarse- and fine-texture facies for R30 d. The agreement of local and global approaches regarding the importance of GPP shows a degree of robustness of these findings. The results presented here demonstrate the importance of thoroughly characterizing subsurface geologic configuration when considering recharge feasibility. To our knowledge, this study is the first of its kind to incorporate a measure of geologic configuration with a geologic proxy parameter in formal sensitivity analyses. Our approach outlines a novel combination of subsurface site characterization with simulations of variably saturated water flow physics within a sensitivity analysis framework to (1) improve understanding the role of geologic heterogeneity on MAR processes and (2) provide insight into potential strategies to characterize subsurface geologic heterogeneity when considering recharge feasibility.
All relevant data and code are available at https://github.com/stephenmaples/Parflow_HESS (last access: 10 May 2020) (Maples et al., 2019) or by contacting by Stephen R. Maples (srmap@ucdavis.edu).
SRM, LF, GEF, and RMM conceptualized the project. SRM performed the analysis and wrote the original draft of the paper. SRM, LF, GEF, and RMM reviewed and edited the paper. SRM, LF, GEF, and RMM acquired the funding for this project.
The authors declare no conflict of interest. The funders had no role in the design of the study; in the collection, analyses or interpretation of data; in the writing of the paper; or in the decision to publish the results.
We gratefully thank Jon Herman, Mary Hill, Robert Reinecke, Lauren Thatch, Mary Michael Forester, Nick Engdahl, and Thomas Harter for their assistance, along with the anonymous reviewers for helpful comments on the paper. We would like to acknowledge support from the University of California Water (UC Water) Security and Sustainability Research Initiative and high-performance computing support from Cheyenne (https://doi.org/10.5065/D6RX99HX), provided by NCAR's Computational and Information Systems Laboratory, which was sponsored by NSF.
This research has been supported by the US National Science Foundation Climate Change, Water, and Society Integrative Graduate Education and Research Traineeship (grant no. DGE-1069333) and the US National Science Foundation Graduate Research Fellowship Program (grant no. 1650042).
This paper was edited by Insa Neuweiler and reviewed by two anonymous referees.
Adham, M., Jahan, C., Mazumder, Q., Hossain, M., and Haque, A.-M.: Study on groundwater recharge potentiality of Barind tract, Rajshahi district, Bangladesh using GIS and remote sensing technique, J. Geol. Soc. India, 75, 432–438, https://doi.org/10.1007/s12594-010-0039-3, 2010. a
Anderson, M. P., Woessner, W. W., and Hunt, R. J.: Applied groundwater modeling: simulation of flow and advective transport, Academic Press, London, UK, 2015. a, b, c
Asano, T.: Artificial recharge of groundwater, Elsevier, Boston, Massachusetts, USA, 2016. a
Ashby, S. F. and Falgout, R. D.: A parallel multigrid preconditioned conjugate gradient algorithm for groundwater flow simulations, Nucl. Sci. Eng., 124, 145–159, https://doi.org/10.13182/NSE96-A24230, 1996. a
Assouline, S. and Or, D.: Anisotropy factor of saturated and unsaturated soils, Water Resour. Res., 42, W12403, https://doi.org/10.1029/2006WR005001, 2006. a
Auken, E., Foged, N., Larsen, J. J., Lassen, K. V. T., Maurya, P. K., Dath, S. M., and Eiskjær, T. T.: tTEM – A towed transient electromagnetic system for detailed 3D imaging of the top 70 m of the subsurface, Geophysics, 84, E13–E22, https://doi.org/10.1190/geo2018-0355.1, 2018. a
Beganskas, S. and Fisher, A. T.: Coupling distributed stormwater collection and managed aquifer recharge: Field application and implications, J. Environ. Manage., 200, 366–379, https://doi.org/10.1016/j.jenvman.2017.05.058, 2017. a
Behroozmand, A. A., Auken, E., and Knight, R.: Assessment of Managed Aquifer Recharge Sites Using a New Geophysical Imaging Method, Vadose Zone J., 18, 180184, https://doi.org/10.2136/vzj2018.10.0184, 2019. a, b
Botros, F. E., Harter, T., Onsoy, Y. S., Tuli, A., and Hopmans, J. W.: Spatial variability of hydraulic properties and sediment characteristics in a deep alluvial unsaturated zone, Vadose Zone J., 8, 276–289, https://doi.org/10.2136/vzj2008.0087, 2009. a, b, c
Bouwer, H.: Artificial recharge of groundwater: hydrogeology and engineering, Hydrogeol. J., 10, 121–142, https://doi.org/10.1007/s10040-001-0182-4, 2002. a
Campolongo, F., Cariboni, J., and Saltelli, A.: An effective screening design for sensitivity analysis of large models, Environ. Model. Softw., 22, 1509–1518, https://doi.org/10.1016/j.envsoft.2006.10.004, 2007. a
Carle, S. F.: T-PROGS: Transition probability geostatistical software, University of California, Davis, CA, USA, 1999. a
Carle, S. F. and Fogg, G. E.: Transition probability-based indicator geostatistics, Math. Geol., 28, 453–476, https://doi.org/10.1007/BF02083656, 1996. a, b
Carle, S. F. and Fogg, G. E.: Modeling spatial variability with one and multidimensional continuous-lag Markov chains, Math. Geol., 29, 891–918, https://doi.org/10.1023/A:1022303706942, 1997. a
De Marsily, G., Delay, F., Gonçalvès, J., Renard, P., Teles, V., and Violette, S.: Dealing with spatial heterogeneity, Hydrogeol. J., 13, 161–183, https://doi.org/10.1007/s10040-004-0432-3, 2005. a
Dettinger, M. D., Ralph, F. M., Das, T., Neiman, P. J., and Cayan, D. R.: Atmospheric rivers, floods and the water resources of California, Water, 3, 445–478, https://doi.org/10.3390/w3020445, 2011. a
Engdahl, N. B., Vogler, E. T., and Weissmann, G. S.: Evaluation of aquifer heterogeneity effects on river flow loss using a transition probability framework, Water Resour. Res., 46, W01506, https://doi.org/10.1029/2009WR007903, 2010. a
Famiglietti, J., Lo, M., Ho, S., Bethune, J., Anderson, K., Syed, T., Swenson, S., De Linage, C., and Rodell, M.: Satellites measure recent rates of groundwater depletion in California's Central Valley, Geophys. Res. Lett., 38, LO3403, https://doi.org/10.1029/2010GL046442, 2011. a
Faunt, C. C., Hanson, R., and Belitz, K.: Groundwater availability of the Central Valley aquifer, California, US Geological Survey Reston, VA, 2009. a
Fisher, H.: Coachella Valley Investigation, Tech. Rep. Bulletin 108, California Department of Water Resources, Sacramento, California, USA, 1964. a
Fleckenstein, J. H. and Fogg, G. E.: Efficient upscaling of hydraulic conductivity in heterogeneous alluvial aquifers, Hydrogeol. J., 16, 1239, https://doi.org/10.1007/s10040-008-0312-3, 2008. a
Fleckenstein, J. H., Anderson, M., Fogg, G., and Mount, J.: Managing surface water-groundwater to restore fall flows in the Cosumnes River, J. Water Resour. Plan. Manage., 130, 301–310, https://doi.org/10.1061/(ASCE)0733-9496(2004)130:4(301), 2004. a, b, c, d, e
Fleckenstein, J. H., Niswonger, R. G., and Fogg, G. E.: River-aquifer interactions, geologic heterogeneity, and low-flow management, Groundwater, 44, 837–852, https://doi.org/10.1111/j.1745-6584.2006.00190.x, 2006. a, b, c
Fogg, G. E.: Groundwater flow and sand body interconnectedness in a thick, multiple-aquifer system, Water Resour. Res., 22, 679–694, https://doi.org/10.1029/WR022i005p00679, 1986. a, b, c, d
Fogg, G. E., Noyes, C. D., and Carle, S. F.: Geologically based model of heterogeneous hydraulic conductivity in an alluvial setting, Hydrogeol. J., 6, 131–143, https://doi.org/10.1007/s100400050139, 1998. a
Fogg, G. E., Carle, S. F., and Green, C.: Connected-network paradigm for the alluvial aquifer system, Special Papers, Geological Society of America, Boulder, Colorado, USA, 25–42, 2000. a, b, c, d, e
Foglia, L., Hill, M. C., Mehl, S. W., and Burlando, P.: Sensitivity analysis, calibration, and testing of a distributed hydrological model using error-based weighting and one objective function, Water Resour. Res., 45, W06427, https://doi.org/10.1029/2008WR007255, 2009. a
Foster, L. M. and Maxwell, R. M.: Sensitivity analysis of hydraulic conductivity and Manning's n parameters lead to new method to scale effective hydraulic conductivity across model resolutions, Hydrol. Process., 33, 332–349, https://doi.org/10.1002/hyp.13327, 2019. a, b
Freeze, R. A. and Cherry, J. A.: Groundwater, Englewood Cliffs, New Jersey, 1979. a
Frei, S., Fleckenstein, J., Kollet, S., and Maxwell, R.: Patterns and dynamics of river–aquifer exchange with variably-saturated flow using a fully-coupled model, J. Hydrol., 375, 383–393, https://doi.org/10.1016/j.jhydrol.2009.06.038, 2009. a, b, c
Gailey, R. M.: Approaches for Groundwater Management in Times of Depletion and Regulatory Change, PhD thesis, University of California, Davis, 2018. a
Gelhar, L. W., Welty, C., and Rehfeldt, K. R.: A critical review of data on field-scale dispersion in aquifers, Water Resour. Res., 28, 1955–1974, https://doi.org/10.1029/92WR00607, 1992. a, b
Ghayoumian, J., Saravi, M. M., Feiznia, S., Nouri, B., and Malekian, A.: Application of GIS techniques to determine areas most suitable for artificial groundwater recharge in a coastal aquifer in southern Iran, J. Asian Earth Sci., 30, 364–374, https://doi.org/10.1016/j.jseaes.2006.11.002, 2007. a
Gilbert, J. M., Jefferson, J. L., Constantine, P. G., and Maxwell, R. M.: Global spatial sensitivity of runoff to subsurface permeability using the active subspace method, Adv. Water Resour., 92, 30–42, https://doi.org/10.1016/j.advwatres.2016.03.020, 2016. a, b
Harter, T.: Finite-size scaling analysis of percolation in three-dimensional correlated binary Markov chain random fields, Phys. Rev. E, 72, 026120, https://doi.org/10.1103/PhysRevE.72.026120, 2005. a
Hartmann, A., Gleeson, T., Wada, Y., and Wagener, T.: Enhanced groundwater recharge rates and altered recharge sensitivity to climate variability through subsurface heterogeneity, P. Natl. Acad. Sci. USA, 114, 2842–2847, https://doi.org/10.1073/pnas.1614941114, 2017. a
Hartog, N. and Stuyfzand, P. J.: Water quality considerations on the rise as the use of managed aquifer recharge systems widens, Water, 9, 808, https://doi.org/10.3390/w9100808, 2017. a
Heilweil, V. M., Benoit, J., and Healy, R. W.: Variably saturated groundwater modelling for optimizing managed aquifer recharge using trench infiltration, Hydrol. Process., 29, 3010–3019, https://doi.org/10.1002/hyp.10413, 2015. a
Herman, J. and Usher, W.: SALib: an open-source python library for sensitivity analysis, J. Open Source Softw., 2, 97, https://doi.org/10.21105/joss.00097, 2017. a
Herman, J., Kollet, J., Reed, P., and Wagener, T.: Method of Morris effectively reduces the computational demands of global sensitivity analysis for distributed watershed models, Hydrol. Earth Syst. Sci., 17, 2893–2903, https://doi.org/10.5194/hess-17-2893-2013, 2013. a
Hill, M. C. and Tiedeman, C. R.: Effective groundwater model calibration with analysis of data, sensitivities, and uncertainty, John Wiley & Sons, Hoboken, New Jersey, USA, 2007. a, b
Jones, J. E. and Woodward, C. S.: Newton–Krylov-multigrid solvers for large-scale, highly heterogeneous, variably saturated flow problems, Adv. Water Resour., 24, 763–774, https://doi.org/10.1016/S0309-1708(00)00075-0, 2001. a
Kern Water Bank Authority: Water Bank Frequently Asked Questions, available at: http://www.kwb.org/index.cfm/fuseaction/Pages.Page/id/352, last access: 5 September 2018. a
Kiparsky, M., Owen, D., Green Nylen, N., Doremus, H., Christian-Smith, J., Cosens, B., Fisher, A., and Milman, A.: Designing effective groundwater sustainability agencies: criteria for evaluation of local governance options, Wheeler Water Institute, Center for Law, Energy, and the Environment, University of California, Berkeley, School of Law, Berkeley, California, USA, 2016. a
Knight, R., Smith, R., Asch, T., Abraham, J., Cannia, J., Viezzoli, A., and Fogg, G.: Mapping aquifer systems with airborne electromagnetics in the Central Valley of California, Groundwater, 56, 893–908, https://doi.org/10.1111/gwat.12656, 2018. a, b
Kocis, T. N. and Dahlke, H. E.: Availability of high-magnitude streamflow for groundwater banking in the Central Valley, California, Environ. Res. Lett., 12, 084009, https://doi.org/10.1088/1748-9326/aa7b1b, 2017. a
Kollet, S. J. and Maxwell, R. M.: Integrated surface–groundwater flow modeling: A free-surface overland flow boundary condition in a parallel groundwater flow model, Adv. Water Resour., 29, 945–958, https://doi.org/10.1016/j.advwatres.2005.08.006, 2006. a
Koltermann, C. E. and Gorelick, S. M.: Heterogeneity in sedimentary deposits: A review of structure-imitating, process-imitating, and descriptive approaches, Water Resour. Res., 32, 2617–2658, https://doi.org/10.1029/96WR00025, 1996. a, b
Lee, S.-Y.: Heterogeneity and Transport: Geostatistical Modeling, Non-Fickian Transport, and Efficiency of Remediation Methods, University of California, Davis, 2004. a
Liu, Y.: Modeling Study of Groundwater and Surface Water Interaction Using High Resolution Integrated Model, University of California, Davis, 2014. a, b, c, d, e, f, g, h, i
Maples, S. R.: Parflow_HESS, available at: https://github.com/stephenmaples/Parflow_HESS, last access: 10 May 2020. a
Maples, S. R., Fogg, G. E., and Maxwell, R. M.: Modeling Managed Aquifer Recharge Processes in a Highly Heterogeneous, Semi-Confined Aquifer System, Hydrogeol. J., 27, 2869–2888, https://doi.org/10.1007/s10040-019-02033-9, 2019. a, b, c, d, e, f, g, h, i, j, k, l, m, n, o, p, q, r
Maserjian, L. A.: Hydrogeologic Analysis of the Unsaturated Zone, Northern Salinas Valley, California, University of California, Davis, 1993. a, b, c
McCallum, J., Crosbie, R., Walker, G., and Dawes, W.: Impacts of climate change on groundwater in Australia: a sensitivity analysis of recharge, Hydrogeol. J., 18, 1625–1638, https://doi.org/10.1007/s10040-010-0624-y, 2010. a
Meirovitz, C. D.: Influence of American River incised valley fill on Sacramento County hydrogeology, University of California, Davis, 2010. a, b, c, d, e, f, g, h
Morris, M. D.: Factorial sampling plans for preliminary computational experiments, Technometrics, 33, 161–174, https://doi.org/10.1080/00401706.1991.10484804, 1991. a
Mualem, Y.: Anisotropy of Unsaturated Soils 1, Soil Sci. Soc. Am. J., 48, 505–509, 1984. a
Nadler, C., Allander, K., Pohll, G., Morway, E., Naranjo, R., and Huntington, J.: Evaluation of bias associated with capture maps derived from nonlinear groundwater flow models, Groundwater, 56, 458–469, https://doi.org/10.1111/gwat.12597, 2018. a
Neuman, S. P. and Di Federico, V.: Multifaceted nature of hydrogeologic scaling and its interpretation, Rev. Geophys., 41, 1014, https://doi.org/10.1029/2003RG000130, 2003. a
Niswonger, R. G. and Fogg, G. E.: Influence of perched groundwater on base flow, Water Resour. Res., 44, W03405, https://doi.org/10.1029/2007WR006160, 2008. a, b, c, d
Niswonger, R. G., Morway, E. D., Triana, E., and Huntington, J. L.: Managed aquifer recharge through off-season irrigation in agricultural regions, Water Resour. Res., 53, 6970–6992, https://doi.org/10.1002/2017WR020458, 2017. a
O'Geen, A., Saal, M., Dahlke, H., Doll, D., Elkins, R., Fulton, A., Fogg, G., Harter, T., Hopmans, J., Ingels, C., et al.: Soil suitability index identifies potential areas for groundwater banking on agricultural lands, California Agricult., 69, 75–84, https://doi.org/10.3733/ca.v069n02p75, 2015. a
Pardo-Iguzquiza, E. and Dowd, P.: CONNEC3D: a computer program for connectivity analysis of 3D random set models, Comput. Geosci., 29, 775–785, 2003. a
Phillips, S. P. and Belitz, K.: Calibration of a Texture-Based Model of a Ground-Water Flow System, Western San Joaquin Valley, California a, Groundwater, 29, 702–715, https://doi.org/10.1111/j.1745-6584.1991.tb00562.x, 1991. a, b
Pierce, K. L. and Scott, W. E.: Pleistocene episodes of alluvial-gravel deposition, southeastern Idaho, Idaho Bureau of Mines and Geology, Moscow, Idaho, USA, 1983. a, b
Rahman, M. A., Rusteberg, B., Uddin, M. S., Lutz, A., Saada, M. A., and Sauter, M.: An integrated study of spatial multicriteria analysis and mathematical modelling for managed aquifer recharge site suitability mapping and site ranking at Northern Gaza coastal aquifer, J. Environ. Manage., 124, 25–39, https://doi.org/10.1016/j.jenvman.2013.03.023, 2013. a
Reilly, T. E., Franke, O. L., and Bennett, G. D.: The principle of superposition and its application in ground-water hydraulics, Tech. rep., US Geological Survey, Reston, Virginia, USA, 1984. a
Renard, P. and De Marsily, G.: Calculating equivalent permeability: a review, Adv. Water Resour., 20, 253–278, 1997. a
Sager, J. C.: Effects of Subsurface Heterogeneity on Floodplain Recharge and Subsurface Storage of Water, University of California, Davis, 2012. a, b, c
Saltelli, A., Tarantola, S., Campolongo, F., and Ratto, M.: Sensitivity analysis in practice: a guide to assessing scientific models, John Wiley & Sons, Chichester, England, 2004. a
Saltelli, A., Ratto, M., Andres, T., Campolongo, F., Cariboni, J., Gatelli, D., Saisana, M., and Tarantola, S.: Global sensitivity analysis: the primer, John Wiley & Sons, Chichester, UK, 2008. a, b
Scanlon, B. R., Faunt, C. C., Longuevergne, L., Reedy, R. C., Alley, W. M., McGuire, V. L., and McMahon, P. B.: Groundwater depletion and sustainability of irrigation in the US High Plains and Central Valley, P. Natl. Acad. Sci. USA, 109, 9320–9325, https://doi.org/10.1073/pnas.1200311109, 2012. a
Shlemon, R.: Landform-soil relationships in northern Sacramento County, California, PhD thesis, University of California, Berkeley, 1967. a
Sobol, I. M.: Global sensitivity indices for nonlinear mathematical models and their Monte Carlo estimates, Math. Comput. Simul., 55, 271–280, 2001. a
Srivastava, V., Graham, W., Muñoz-Carpena, R., and Maxwell, R. M.: Insights on geologic and vegetative controls over hydrologic behavior of a large complex basin–global sensitivity analysis of an integrated parallel hydrologic model, J. Hydrol., 519, 2238–2257, 2014. a, b
Sudicky, E. A.: A natural gradient experiment on solute transport in a sand aquifer: Spatial variability of hydraulic conductivity and its role in the dispersion process, Water Resour. Res., 22, 2069–2082, https://doi.org/10.1029/WR022i013p02069, 1986. a
Sudicky, E. A. and Huyakorn, P.: Contaminant migration in imperfectly known heterogeneous groundwater systems, Rev. Geophys., 29, 240–253, https://doi.org/10.1002/rog.1991.29.s1.240, 1991. a, b
Taylor, R. G., Scanlon, B., Döll, P., Rodell, M., van Beek, R., Wada, Y., Longuevergne, L., Leblanc, M., Famiglietti, J., Edmunds, M., Konikow, L., Green, T., Chen, J., Taniguchi, M., Bierkens, M., MacDonald, A., Fan, Y., Maxwell, R., Yechieli, Y., Gurdak, J., Allen, D., Shamsudduha, M., Hiscock, K., Yeh, P., Holman, I., and Treidel, H.: Ground water and climate change, Nat. Clim. Change, 3, 322–329, https://doi.org/10.1038/NCLIMATE1744, 2013. a
Van Genuchten, M. T.: A closed-form equation for predicting the hydraulic conductivity of unsaturated soils 1, Soil Sci. Soc. Am. J., 44, 892–898, https://doi.org/10.2136/sssaj1980.03615995004400050002x, 1980. a
Wada, Y., Van Beek, L., and Bierkens, M. F.: Modelling global water stress of the recent past: on the relative importance of trends in water demand and climate variability, Hydrol. Earth Syst. Sci., 15, 3785–3805, https://doi.org/10.5194/hess-15-3785-2011, 2011. a
Weissmann, G. S. and Fogg, G. E.: Multi-scale alluvial fan heterogeneity modeled with transition probability geostatistics in a sequence stratigraphic framework, J. Hydrol., 226, 48–65, https://doi.org/10.1016/S0022-1694(99)00160-2, 1999. a, b
Weissmann, G. S., Carle, S. F., and Fogg, G. E.: Three-dimensional hydrofacies modeling based on soil surveys and transition probability geostatistics, Water Resour. Res., 35, 1761–1770, https://doi.org/10.1029/1999WR900048, 1999. a
Weissmann, G. S., Zhang, Y., Fogg, G. E., and Mount, J. F.: Influence of incised-valley-fill deposits on hydrogeology of a stream-dominated alluvial fan, Aquifer Characterization, Spec. Publ. Soc. Sediment. Geol., 107, 15–28, 2004. a
Weissmann, G. S., Bennett, G., and Lansdale, A.: Factors controlling sequence development on Quaternary fluvial fans, San Joaquin Basin, California, USA, Spec. Publ. Geol. Soc. Lond., 251, 169–186, 2005. a, b, c
Wösten, J., Pachepsky, Y. A., and Rawls, W.: Pedotransfer functions: bridging the gap between available basic soil data and missing soil hydraulic characteristics, J. Hydrol., 251, 123–150, 2001. a
Yeh, T.-C. J., Gelhar, L. W., and Gutjahr, A. L.: Stochastic analysis of unsaturated flow in heterogeneous soils: 1. Statistically isotropic media, Water Resour. Res., 21, 447–456, https://doi.org/10.1029/WR021i004p00447, 1985a. a
Yeh, T.-C. J., Gelhar, L. W., and Gutjahr, A. L.: Stochastic analysis of unsaturated flow in heterogeneous soils: 3. Observations and applications, Water Resour. Res., 21, 465–471, https://doi.org/10.1029/WR021i004p00465, 1985b. a