the Creative Commons Attribution 4.0 License.
the Creative Commons Attribution 4.0 License.
WHAT-IF: an open-source decision support tool for water infrastructure investment planning within the water–energy–food–climate nexus
Mikkel Kromann
Silvio Pereira-Cardenal
Kenneth Marc Strzepek
Peter Bauer-Gottwein
Water infrastructure investment planning must consider the interdependencies within the water–energy–food nexus. Moreover, uncertain future climate, evolving socio-economic context, and stakeholders with conflicting interests, lead to a highly complex decision problem. Therefore, there is a need for decision support tools to objectively determine the value of investments, considering the impacts on different groups of actors, and the risks linked to uncertainties. We present a new open-source hydro-economic optimization model, incorporating in a holistic framework, representations of the water, agriculture, and power systems. The model represents the joint development of nexus-related infrastructure and policies and evaluates their economic impact, as well as the risks linked to uncertainties in future climate and socio-economic development. We apply the methodology in the Zambezi River basin, a major African basin shared by eight countries, in which multiple investment opportunities exist, including new hydropower plants, new or resized reservoirs, development of irrigation agriculture, and investments into the power grid. We show that it is crucial to consider the links between the different systems when evaluating the impacts of climate change and socio-economic development, which will ultimately influence investment decisions. We find that climate change could induce economic losses of up to USD 2.3 billion per year in the current system. We show that the value of the hydropower development plan is sensitive to future fuel prices, carbon pricing policies, the capital cost of solar technologies, and climate change. Similarly, we show that the value of the irrigation development plan is sensitive to the evolution of crop yields, world market crop prices, and climate change. Finally, we evaluate the opportunity costs of restoring the natural floods in the Zambezi Delta; we find limited economic trade-offs under the current climate, but major trade-offs with irrigation and hydropower generation under the driest climate change scenario.
- Article
(8537 KB) - Full-text XML
-
Supplement
(472 KB) - BibTeX
- EndNote
Having established integrated water resources management plans, many countries and river basins around the world are now planning to formulate water infrastructure development plans. These plans will help countries and regions realize the potential of their water resources – including agriculture, energy generation, and tourism – while preserving the environment. Infrastructure investments will contribute to multiple Sustainable Development Goals (UN General Assembly, 2015), such as “No Poverty” (1), “Zero Hunger” (2), “Clean water and sanitation” (6), “Affordable and clean energy” (7), “Decent work and economic growth” (8), and “Climate action” (13). However, formulating these investment plans is a complex process involving competing objectives, upstream–downstream trade-offs, interactions between investments, multiple stakeholders, and uncertainty related to socio-economic changes and future climate. In particular, it requires evaluating the interactions in the water–energy–food (WEF) nexus.
The WEF nexus is an expanding topic in the literature. Albrecht et al. (2018) provide a systematic review of nexus approaches; Bazilian et al. (2011), McCarl et al. (2017), and Miralles-Wilhelm (2016) consider modelling and research challenges, and Khan et al. (2017) focus on the water and energy sectors. Nexus studies cover resource use efficiency, institutional analysis, decision-making, and policy integration, using a broad range of methods such as integrated models, input–output analysis, life cycle assessment, and stakeholder engagement. In general, they aim to identify trade-offs between the different sectors and to support the development of cross-sectorial solutions, which produce additional benefits in comparison with single-resource assessments (Albrecht et al., 2018). There are two strategies to model the interdependencies in the nexus: one is to couple well-established single-system models where the output of one feeds the input of the other in a one-way or iterative process (e.g. Howells et al., 2013 and Kraucunas et al., 2015); another is the holistic approach which internally represents all interactions within a single model (e.g. Kahil et al., 2018 and Khan et al., 2018). The advantage of coupling models is that it simplifies communication among stakeholders in different areas, who can use their respective tools, and enables a more detailed representation of single systems, whereas the holistic approach better represents interrelations and is more effective in an optimization framework. A challenge in both cases is to represent the diversity of the scales (spatial, temporal, and political) at which interactions occur (McCarl et al., 2017). While there is no approach that can fit all purposes, few models consider a spatial and temporal scale that can represent the interactions of water infrastructure with the WEF nexus.
Hydro-economic optimization models (HOM) have developed into potential decision support tools for basin-scale water resources management over the past decade (see reviews by Bauer-Gottwein et al., 2017 and Harou et al., 2009). They have been used to analyse water infrastructure investments, reservoir release scheduling, and transboundary resources sharing problems. (e.g. Dogan et al., 2018; Draper et al., 2003; Goor et al., 2010, and Tilmant and Kinzelbach, 2012). Models include a representation of the regional-scale flow network as well as water availability, water uses, and willingness to pay. By associating an economic impact with each decision, the complex multi-objective management problem becomes a simpler single-objective problem. Traditionally, agricultural and energy water users are represented by an exogenous demand and willingness to pay for water (Bauer-Gottwein et al., 2017). Therefore, classic hydro-economic models are able to analyse trade-offs and synergies between water users, but are not as effective in terms of representing dynamic interactions between infrastructure, policies, and commodity markets. For example, increased production of a commodity may lead to a lower market price for the commodity and, thus, to a lower willingness to pay for water. Conversely, nexus models, particularly energy-centred models, e.g. OSeMOSYS (Howells et al., 2011) and TIAM-FR (Dubreuil et al., 2013), tend to ignore the spatial and temporal scale of water availability and may therefore overlook water scarcity problems (Khan et al., 2017).
Over the past 20 years, an increasing amount of legal and policy frameworks for transboundary water management have been implemented in internationally shared water courses (Qwist-Hoffmannn and McIntyre, 2016). River basin organizations are intended to facilitate the application of such mechanisms. In the Southern African Development Community (SADC), a state willing to implement a project needs to notify potentially affected riparian states, including a description of the project and its potential impacts (SADC, 2000). Furthermore, most international financial institutions (e.g. AfDB, World Bank) require “no-objection” from riparian states to fund projects. Therefore, there is the need for decision support tools to objectively determine the impacts of WEF-related projects on transboundary watersheds.
In this study, we developed a new open-source decision support tool for water infrastructure investment planning: WHAT-IF – Water, Hydropower, Agriculture Tool for Investment and Financing. The novelty of the tool is that it combines a hydro-economic optimization framework, with a nexus representation of the agriculture and food systems. The tool can represent political boundaries, the joint development of WEF infrastructure and policies, and uncertainty in future climate and socio-technical changes. It aims to provide quantitative answers to the following prototypical questions:
-
What is the economic impact of a given project or set of projects? Which is the best alternative among different investment plans?
-
What are the synergies or trade-offs between investments and/or policies in different sectors? (e.g. what are the trade-offs between hydropower, irrigation development plans, and ecosystem preservation)
-
What are the risks linked to uncertainty in future climate and socio-economic changes? Which investments and policies will be more robust to a range of future conditions?
This article is structured as follows. Firstly, Sect. 2 presents the general modelling framework and details the representations of the water, energy, and food systems, and the economic optimization. Secondly, we illustrate an application of the model to the Zambezi River basin, where water resources of the eight riparian countries play a central role in the regional economy and are critical to sustainable economic growth and poverty reduction. Section 3 shows the input dataset for the study case, as well as the investment opportunities, such as new hydropower plants, new or resized reservoirs, the development of irrigation agriculture, and investments into the power grid. In Sect. 4, we show how the model answers the previous questions to assist in decision-making. Finally, we discuss the limitations and improvement opportunities of the modelling approach in Sect. 5.
Figure 1 provides an overview of the decision support tool methodology, with the representation of the WEF subsystems and their main components. Subsystem representations are based on the concepts used in models such as WEAP (Yates et al., 2005) for the hydrology and water management, OSeMOSYS (Howells et al., 2011) for energy systems, and IMPACT (Robinson et al., 2015) for agriculture. Subsystems are presented as blocks for explanation purposes only; the model internally represents the interrelations in the nexus. The core component is the economic optimization framework, using a single-objective function and taking the different production costs, transaction costs, and supply benefits of the different WEF commodities into account. In welfare economic terms, the objective function maximizes the sum of the total consumer and producer surpluses, where the consumer surplus is the difference between the consumers' willingness to pay and the market price, and the producer surplus is the difference between the market price and the producers' production costs (Krugman and Wells, 2005). In contrast to simulation models that are rule-based (such as WEAP), the model finds the optimal water, agriculture, and energy management decisions, considering trade-offs and synergies between them. The optimization framework simulates adaptation to new infrastructure and policies, climate change, and socio-economic development. Conversely, in a rule-based simulation framework, allocation rules are usually based on the current socio-economic conditions or new rules are estimated, which may lead to suboptimal allocation decisions and an underestimation of project benefits (Pereira-Cardenal et al., 2016). The optimization approach is based on a perfect foresight formulation, assuming that optimal decisions are found with full knowledge of the planning period; limitations of this common approach in sectoral planning models are discussed in Sect. 5. The main outputs are economic indicators (such as market prices and consumer and producer surpluses), as well as water, energy, and agriculture management decisions (such as supply, consumption, storage, production, and transport). To calculate the economic impacts of an investment plan or a specific project, “with/without” analyses are performed, and different options can be compared. With/without analyses tend to overestimate benefits when no alternative is represented, particularly in growing economies (Griffin, 2008). Therefore, the model also integrates capacity expansion representations for the energy system and alternative supply sources for agriculture, such as import or rainfed agriculture. To represent uncertainties linked to future climate or socio-economic development, the same investment plan or infrastructure is evaluated for different scenarios defined by the user. Hence, the decision support tool can be used as a discussion platform for stakeholders, answering questions such as “What are the economic impacts of the projects on producers and consumers of crops, energy, and water?”, “What if available water resources are reduced because of climate change in the future?”, or “How robust is a plan considering uncertainties in socio-economic development?”.
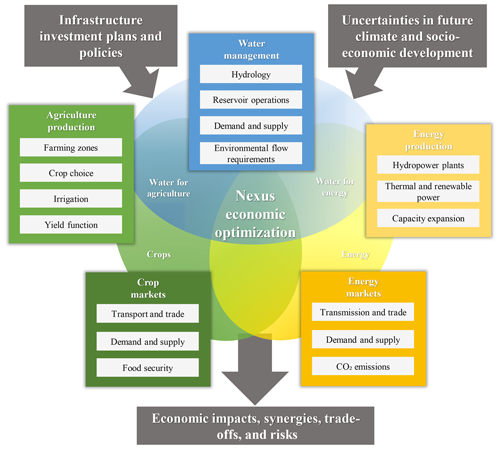
Figure 1Conceptual framework of the decision support tool. The water, agriculture, and energy system are connected in the economic optimization framework. The blocks represent the different processes used in the model to represent the water, energy, and food systems, while the circle contains the economic and physical interactions. The block representation is for explanatory purposes only; interactions are solved using a holistic approach.
The model is open-source and coded in the python programming language, using the Pyomo modelling framework (Hart et al., 2017). The code and installation instructions can be found on Github (https://github.com/RaphaelPB/WHAT-IF, last access: 27 September 2019). The model can be connected to different open-source or commercial solvers; input data and output results are organized in MS Excel spreadsheets. We adopt a general framework that is study case independent. Depending on the context, the availability of data, and the questions that the decision support tool is supposed to answer, some components may be relevant and others may not. For this reason, the model is holistic in its resolution but modular in its formulation; thus, users can activate or deactivate different modules, and new modules representing relevant interrelations are easy to add. Mcintosh et al. (2011) describes some of the challenges and best practices of developing an environmental decision support system, including the following: start simple and small with a modular approach; plan for longevity with a framework that is easy to update; design for ease of use, including a user-friendly interface; and design for usefulness by including stakeholders' input. Following these recommendations, the flexibility of the framework and its open-source character will enable the tool to evolve with user and stakeholder inputs and additional features will be added such as GIS visualization and data acquisition modules.
In the following sections, we describe the individual modules represented in Fig. 1. All of the parameters, equations, and decision variables are detailed in the Supplement. For the practical implementation of the modules and their parametrization, the reader is referred to Sect. 3 for the Zambezi study case.
2.1 Water management
The water module represents hydrology and water management. The basic hydrological timescale is at monthly time steps, but this is not a fixed requirement. The river network is described by a node-based approach, where the modelled area is divided into catchments with corresponding precipitation, evapotranspiration, surface runoff, and groundwater recharge. Water transfer channels form additional links to the river network. The water is stored and released from reservoirs and is allocated to water users, while lakes and groundwater are represented as linear reservoirs. Evaporative losses take place in the river network, reservoirs, and lakes. Water supply costs and losses are also considered. Water users can be defined with a water demand and an associated marginal value; however, agriculture users and hydropower have a dynamic demand and marginal value detailed in the agriculture and energy modules.
The water resource can have an important value for activities that are not directly represented in the model, such as ecosystems, tourism, fishing, and transportation. Rather than giving it an economic value that may be hard to define and very uncertain (Loucks and Van Beek, 2005), the environmental flows module enables the definition of minimum flow requirements that have to be guaranteed in the river. For methods to quantify environmental flow requirements, see Tharme (2003).
2.2 Agriculture production
The agriculture module computes local water demand for agriculture and production of crops depending on water allocation and rainfall. Farming zones represent agriculture areas with a specific farm type, have a limited area, and belong to a catchment and a country. Farm types can represent different soil qualities, fertilizer/pesticides inputs, and availability of irrigation and drainage systems. Farm types define the potential yields, cultivation, and infrastructure costs, and they can be used to represent different kinds of agriculture, such as rainfed, irrigated, and subsistence agriculture or differences among the countries/regions depending on available data and the user's interest. Crops (as a traded commodity) are produced at a yearly time step by cultures. Cultures are divided into growth phases (e.g. initial, crop development, mid-season, and late season) which take place during a specific period of the year. Water requirements by cultures are estimated using the FAO 56 method (Allen et al., 1998), with the reference evapotranspiration as well as a culture- and phase-specific crop coefficient. The relation between water allocated to cultures and yield is estimated using the additive yield water response function based on the FAO 33 method (Doorenbos and Kassam, 1979). In a farming zone, the same area can be used by several cultures during different periods of the year, representing multiple harvests per year; the schedules are defined by the user. The model either finds the optimal crop choice per year or assumes a fixed crop distribution for the entire simulation period. However, additional constraints such as maximum area per culture and farming zone can be used to represent physical, institutional, or economic constraints which are otherwise not included in the modelling framework. Crop production costs represent the costs of infrastructure, machinery, labour, land, chemicals, and fertilizers, depending on the culture and farm type.
2.3 Crop markets
The crop market module represents the local demand, transport, and trade of crops. Crop markets are characterized by a demand, a marginal value, and a demand elasticity for the different crops. A minimum supply requirement can be defined to represent food security constraints. Crops produced in the farming zones are transported between crop markets via transport routes, with associated costs and losses. External markets can be introduced to represent imports and exports out of the study area. These markets behave in the same manner as the other crop markets, but their crop production is represented through an external crop production function which does not depend on farming zones (the function is assumed to be infinite and perfectly inelastic).
2.4 Energy production
The energy modules focus on electric energy, also called the “power system”, and do not consider fuels for transportation, cooking, or heating. Power is produced by hydropower turbines and other power plants (such as thermal, solar, wind, and biomass). Hydropower turbines are either linked to a reservoir or are run-off-the-river and have associated operation costs and water-energy equivalent factors. Other power plants are defined by their efficiency, fuel use, operational costs, and production capacity. In addition, generic power technologies represent an additional capacity that can be invested in, similarly to capacity expansion models (e.g. Howells et al., 2011). They have associated capacity construction costs, fixed and variable operational costs, fuel use, and efficiencies that can be defined for every power market (see Sect. 2.5 for power markets). “Other power plants” and “generic power technologies” are represented in a similar way; the main difference is that the first can be used to represent specific existing or planned power production units, whereas the second represents potential technologies available to the capacity expansion model. Fuels represent the different natural resources that can be used to produce energy (e.g. coal, gas, or sun); fuel consumption is determined by the power plant's efficiency and a fuel price can be defined per power market. CO2 emissions are associated with different fuels, which lead to CO2 emission costs if a carbon cost is defined.
2.5 Energy markets
The power market module accounts for the power network and the power demand. Power markets define the resolution of the power network and the power demand, and they can be defined nationally or regionally. As for crop markets, they are characterized by a demand and marginal value for power, although demand is assumed to be perfectly inelastic. Transmission lines carry energy between power markets with associated costs and losses and a limited capacity. This corresponds to a “transport model” or “transhipment model”, which does not consider reactive power flows and voltage angles, but is commonly used for planning energy systems as it requires less data and computation time than AC or DC power flow models (Krishnan et al., 2016). The base timescale for the power system is, as for the hydrology, the monthly time step. However, the power demand can be divided into different load segments (such as peak and base, day and night) defined by the user. Load segments are commonly used in energy models with large time steps to better represent the effects of peaking demand (Palmintier, 2013). Some generic power technologies can have a limited capacity during specific load segments, and this feature serves to represent renewable energies such as solar or wind (e.g. no solar energy is available at night, windy or less windy segments can be defined).
2.6 Economic optimization
The economic module is the objective function of the optimization model. The equations are solved to find the optimal water, agriculture, and energy management decision variables minimizing the costs (maximizing the benefits) resulting from previous modules while respecting the physical, political, and economic constraints. In welfare economic terms, this corresponds to the maximization of the total consumer and producer surplus for all commodities represented: water, crops, and energy (see Krugman and Wells, 2005 for details on consumer and producer surplus). According to the second welfare economic theorem, any Pareto-optimal allocation can be reached by a competitive market. This means that the “centrally planned” solution from the economic optimization module is the same as the individual profit maximization solution, assuming that water, energy, and crops could be traded on perfect markets.
The objective function φ to be maximized is expressed as follows:
where WSB represents the water supply benefits; WSC is the water supply costs; CSB is the crop supply benefits; CSC is the crop supply costs; CPC is the crop production costs; ESB is the energy supply benefit; ETC is the energy transmission costs; and EPC is the energy production costs, which are the sum of the energy operational costs, fuel consumption and CO2 emission costs, and the capacity expansion costs (see the Supplement for the complete description of the equations).
The main link in the nexus, is the water resource for which hydropower, irrigation, and ecosystems compete (Fig. 2). The energy markets provide a dynamic value to hydropower production, while the crop markets provide a dynamic value of irrigation. Therefore, the markets are indirectly linked via the water trade-offs between hydropower and irrigation. Exogenous drivers on these markets such as new policies and technological and socio-economic changes, indirectly affect the water trade-offs and, in turn, all markets.
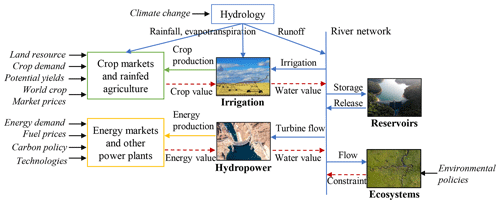
Figure 2Main feedback loops in the water–energy–food nexus representation. All flows are holistically solved to maximize total economic surplus, and the water, energy, and crop values are the resulting dual values of the mass balance constraints. The figure does not show the temporal and spatial scale of the nexus problem. Factors in italic represent exogenous inputs to the nexus representation.
The main outputs of the economic optimization are the optimal decisions in terms of water, energy, and agricultural management and the resulting economic impacts on different groups of actors. Equally important outputs are the shadow prices of the constraints (also called dual values) that reveal the equilibrium prices of the different commodities and give information about capacity constraints (e.g. the marginal value of additional storage or transmission capacity) that can help identify bottlenecks in the systems (Harou et al., 2009).
The Zambezi River plays a central role in the regional economy and is shared by eight riparian countries: Angola, Botswana, Malawi, Mozambique, Namibia, Tanzania, Zambia, and Zimbabwe. The countries formed the Zambezi Watercourse Commission (ZAMCOM) in 2014, which is the river basin organization supporting transboundary water management. The water resource supports agriculture, fisheries, hydropower production, water supply and sanitation, navigation, tourism, industries, and mining. The basin extends over almost 1.4×10⁶ km2, sustaining the basic needs of 40 million people and a rich and diverse natural environment. In the river basin, 77 % of the population has access to a safe and adequate water supply and 60 % has access to adequate sanitation, which is above the southern African average (SADC et al., 2015). The area is mainly covered by forest and bush (75 %); cropland represents only 13 % of the area and is mainly rainfed, as less than 5 % of this agricultural land is irrigated (SADC et al., 2015). The main source of energy is biomass, fulfilling 80 % of the demand; a limited share of the population has access to grid electricity, ranging from 12 % in Zambia to 40 % in Zimbabwe (SADC et al., 2015). The population is expected to grow rapidly, reaching 51 million in 2025 and 70 million by 2050, which will increase the demand for water, food, and energy (SADC et al., 2015). Therefore, the water resources in the river basin are critical for sustainable economic growth and poverty reduction in the region.
The World Bank carried out a “Multi-Sector Investment Opportunities Analysis” (MSIOA) study (World Bank, 2010), which analysed the value of the hydropower and irrigation projects and trade-offs between them. The study found that the hydropower development plan is able to meet the region's current energy demand and that the implementation of the irrigation development plan would reduce the current hydropower production by 9 %. Tilmant et al. (2012) also investigated trade-offs between hydropower and irrigation development in the Zambezi River basin, using a stochastic hydro-economic optimization formulation. The study found that some of the upstream irrigation projects are not viable if the downstream hydropower projects are developed. However, the study used an exogenous price for hydropower and irrigation water, and, as in the World Bank study, it did not consider climate or socio-economic changes. Beilfuss (2012) points out that most of the planned hydropower projects were evaluated using historical hydrologic data and did not consider climate change; therefore, they may not be economically viable. Furthermore, the study highlights the lack of consideration of the impact of large hydropower projects on ecosystems. In a further World Bank study, Cervigni et al. (2015) assessed the potential impacts of climate change on water infrastructure in sub-Saharan Africa. For the Zambezi, the study found that hydropower production could decline by up to 60 % and unmet irrigation demand could increase by up to 25 % in the driest scenario. Focused on the power system, the IRENA (2013) study shows that 80 % of capacity addition between 2010 and 2030 in the South African Power Pool (SAPP) could be renewable technologies. This tendency is confirmed by Spalding-Fecher et al. (2017b), who analysed the electricity supply and demand scenarios for the SAPP power pool until 2070. By combining the previous study with data from Cervigni et al. (2015), Spalding-Fecher et al. (2017a) found that hydropower production could decline by 10 % to 20 % in a drying climate which could increase generation costs by 20 % to 30 % in the most hydropower-dependent countries. The agriculture system is, however, not part of the integrated analysis. In a broader perspective, the Zambezi Environment Outlook 2015 study (SADC et al., 2015), presents an integrated analysis of the Zambezi River considering ecological, social, and economic issues.
3.1 Hydrology, reservoirs, and environmental flows
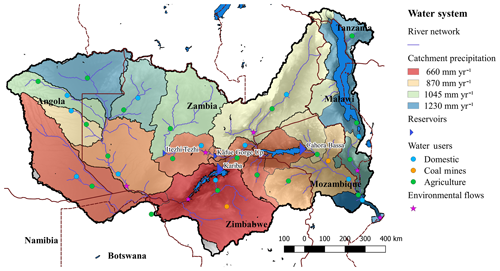
The hydrologic data used in this study are the same as the data used in Cervigni et al. (2015). The historical climate dataset is from Sheffield et al. (2006), and runoff is given by a lumped rainfall–runoff model from Strzepek et al. (2011). As the annual flow follows long-term cycles, we use a 40-year time series, from 1960 to 1999: the years 1982–1998 are significantly below average and the years 1960–1982 are above average (Beilfuss, 2012). The rainfall–runoff model exogenously considers the effect of wetlands that evaporate part of the river flow. Therefore, the impact of reservoir operations on wetland dynamics is not represented; however, only the Kafue Flats are located downstream of a major reservoir (Itezhi-Tezhi) and upstream of other water users. According to World Bank (2010), groundwater is not overexploited in the river basin; furthermore, there are almost no data available concerning groundwater. Therefore, as in similar studies in the basin, groundwater is ignored in this study. The main reservoirs of the Zambezi River, Itezhi-Tezhi, and Kariba and Cahora Bassa dams (Fig. 3) have a total active storage capacity of 127 000×106 m3, which is slightly higher than the mean annual flow. Evaporation from the reservoirs is the main consumptive water use, ranging from 7800 to 16 989×106 m3 yr−1 depending on the studies (Beilfuss, 2012; Euroconsult and Mott MacDonald, 2008; Tilmant et al., 2012), see Sect. 4.1 for more details. The volume–area relationships used to compute evaporation are derived from World Bank (2010). The main non-agricultural water users are the Gokwe and Moatize coal mines with 622×106 m3 yr−1, whereas other industrial and domestic water consumption is relatively small and represents only 175×106 m3 yr−1 (World Bank, 2010). Waters of the Zambezi sustain some fragile ecosystems, among them are the Kafue Flats and the Barotse Plain in Zambia, the Mana Pools in Zambia and Zimbabwe, and the Zambezi Delta in Mozambique. We do not represent the economic value of these, but use environmental flow requirements from World Bank (2010), which are based on two assumptions: flow should not drop below the low-flow level in dry years and average annual flow should not drop below 60 % of the mean average annual flow. This constraint is applied at the Barotse Plain, the Kafue Flats, the Luangwa River, the Lower Shire, and the Zambezi Delta (Fig. 3).
3.2 Energy
The national power utilities of the Zambezi River basin are members of the Southern African Power Pool (SAPP), which is the institution overseeing the power sector in southern Africa. The goal of the SAPP is to develop a competitive electricity market in which power is traded in bilateral, forward physical, day ahead and intra-day markets. The SAPP is dominated by South Africa, which represents roughly 80 % of the demand and production (SAPP, 2015). Coal is the main source of power production (77 %), followed by hydropower in the Zambezi and Congo river basins (21 % of installed capacity), with nuclear, gas, and renewables representing only a minor share (SAPP, 2015). The members of the SAPP are interconnected by transmission lines, except for Angola, Malawi, and Tanzania which are isolated. The demand for electricity is growing rapidly, and in recent years power shortfalls have become common, particularly in Mozambique, Malawi, South Africa, Zambia, and Zimbabwe (World Bank, 2010). Figure 4 shows an overview of the energy system representation.
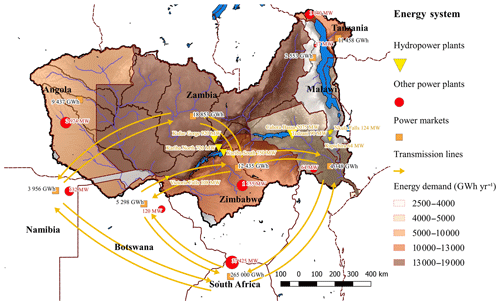
Figure 4The energy system representation. Hydropower plants are represented individually, whereas the remaining generation capacity is aggregated into a single power plant per country. Transmission lines among the countries permit power exchanges. Additional power generation capacity can be added in every power market by investing in one of the generic power technologies (coal, gas, or solar).
3.2.1 Energy markets
To represent the energy system, we consider one power market per country (Fig. 4), including South Africa which is the main power exchanger with the Zambezi River basin. National power demands are found in SAPP (2015). We assume unsatisfied power demand is compensated for by running fuel generators, so power curtailment costs are estimated at USD 240 MWh−1. The monthly energy demand is divided in two load segments: a base demand and a peak demand. Based on SAPP (2015), the peak load is during the day and covers 70 % of the total demand, whereas the base load is during the night and covers 30 % of the demand; both are assumed to cover half of the monthly time step. Energy demand is assumed to be perfectly inelastic, as most consumers do not have hour-by-hour metering, and the price signal from the marginal cost of production is assumed to not reach the consumer. The transmission network is represented by aggregated transmission lines among countries that are connected, and the transmission capacity and loss rate are found in IRENA (2013), SAPP (2018), and World Bank (2010).
3.2.2 Energy production
We depict the existing hydropower plants and one aggregated power plant per country (Fig. 4), which represents the total non-hydropower generation capacity, using data from World Bank (2010). For hydropower plants, the water-energy equivalent factor is derived from turbine capacity in cubic metres per second (m3 s−1) and power output in megawatts (MW) from World Bank (2010). In addition, three generic technologies are available for additional investments: supercritical coal, combined cycle gas turbines (CCGT), and solar photovoltaic. Investment costs, fix and variable operation and maintenance costs, lifetime, and efficiency of these technologies are found in IRENA (2013), and we assume the same parameters for all countries. However, gas and coal (fuel) costs vary among countries, depending on their local availability (IRENA, 2013). To represent intermittency constraints in a simplified way, solar energy is assumed to be unavailable during the base load segment (night), and the peak load segment (day) is divided in two: days where solar energy can be produced and days where it cannot. The length of these two load segments is adjusted to fit the load factor of 25 % used in IRENA (2013) for solar photovoltaic energy.
3.3 Agriculture
According to FAO (2018), the total production value of the agricultural sector in the Zambezi River basin is around USD 6.7 billion per year (the numbers are estimated by downscaling national statistics from 2010 to 2016 with the population ratio). Among these, USD 1.7 billion is from exports and half of the exports are tobacco. The crop imports represent USD 1.2 billion per year, with wheat and rice being the most imported crops. Agricultural markets are heavily regulated by policies such as import or export bans and crop prices fixed by the governments; therefore, little trade occurs among the Zambezi countries. The trade among Zambezi countries accounts for only USD 320 million per year, and almost half of this is exports of maize and tobacco from Zambia to Zimbabwe.
3.3.1 Main crops and cultures
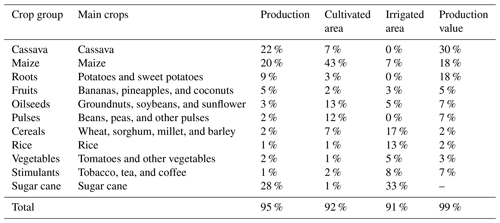
To represent the most significant crops in the agricultural module different aspects should be considered. The cultivated area per crop has the strongest impact on water demands for agriculture; however, the value of agricultural production indicates which crops have the biggest economic impact. Another factor is which crops are mainly used for irrigated agriculture, as these will have a larger impact on the nexus and irrigation projects. To simplify the model, some crops are grouped, which makes the assumption that crops in the same group are fully substitutable and have the same value. Table 1 shows all of the selected crops; cassava, maize, and roots represent more than half of crop production, cultivated area, and value of production. However, for irrigated agriculture, the most important crops are cereals, rice, sugar cane, and stimulants. Some of the crops can be produced by different cultures (e.g. summer and winter); the cultures represented are as follows: cassava, potato (roots); wheat and sorghum (cereals); summer and winter maize, vegetables, sugar cane, summer and winter rice, fruits, groundnuts, and soybeans (oilseeds); stimulants and summer and winter beans (pulses).
Table 1Represented crops and their importance in the agricultural sector. The modelled crops represent more than 90 % of the crop production, cultivated and irrigated area, and of the production value. The production value excludes meat and dairy products. Some crops have a moderate impact on the global economy (e.g. cereals, rice, and stimulants) but are important for irrigated agriculture. The share of irrigated area is taken from World Bank (2010), other indicators are taken from FAO (2018) averaged over the period from 2010 to 2016.
Potential yields of the different cultures are estimated as the maximum observed yield in each country from the FAO (2018) “Production quantity” and “Area harvested” data between the years 2000 and 2016. This assumes the maximum yield was obtained due to optimal hydrologic conditions, with all other inputs being equal. In general, yields in Zambezi countries are lower than the average expected yields due to very low inputs (World Bank, 2010). We consider four growing phases for all cultures (initial, crop development, mid-season, and late season). The corresponding crop coefficients (Kc) and yield water response coefficients (kY) used in the model to calculate the water requirements and the resulting yields are found in FAO 56 (Allen et al., 1998), World Bank (2010), and FAO 33 (Doorenbos and Kassam, 1979). Average irrigation losses in the Zambezi area are estimated at 55 % between gravity and sprinkler irrigation systems, considering conveyance, distribution, and application losses (World Bank, 2010). Return flows are estimated at 30 % for all cultures and catchments. Cultivation costs per hectare for different cultures are derived from the respective “Social Accounting Matrix” of Malawi, Mozambique, and Tanzania (IFPRI, 2014, 2015, 2017a). Cultivation costs include seeds, fertilizers, chemicals, labour, and capital costs, and the cost per hectare is calculated by dividing the total economic flow by the area cultivated the corresponding year. As few data are available, we consider a different cost per culture but use an average cost over all countries. The land costs are not included, as the model internally represents a market for agricultural land use. We consider two farming zones per catchment, representing irrigated and rainfed land. Available area for rainfed and irrigated agriculture is obtained from the spatial data of the SPAM model (IFPRI and IIASA, 2017) and from World Bank (2010). For irrigated agriculture, the crop choice is constrained by the observed area for each culture; this is to avoid the over production of very profitable cash crops and takes non-represented physical, socio-economic, or political constraints into account.
3.3.2 Crop markets, demands, and values
To represent demand for crops, we consider one crop market per country, as data are usually at a national level. Demand per country is derived from the “food supply quantity” data (in crops primary equivalent) from FAO (2018) that is averaged over the years 2010–2016. National data are then downscaled by the ratio of population within the Zambezi River basin to get the local demand. As no data were available, we assume the demand to be perfectly inelastic. To represent imports and exports out of the Zambezi area, we also consider an international market that has an infinite demand for cash crops like sugar cane and stimulants. Willingness to pay for crops in each crop market is evaluated as the “value of agricultural production” divided by the “production quantity” from FAO (2018). International market crop prices are the average import price for the southern African market, calculated as the “value of import” divided by “import quantity” from FAO (2018). The same value is used for external supply costs from the international market, meaning that crop markets in the Zambezi can import crops at this price. As few data on transport and transaction costs are available, we assume that the transaction costs for imports from the international market are the difference between the international market price and the observed import price in each country from FAO (2018). Similarly, for exports towards the international market, the transaction costs are estimated as the difference between the international market price and the observed export price in each country. Transaction costs among countries are set as the difference between the import prices.
3.4 Development plans
3.4.1 Hydropower development plan
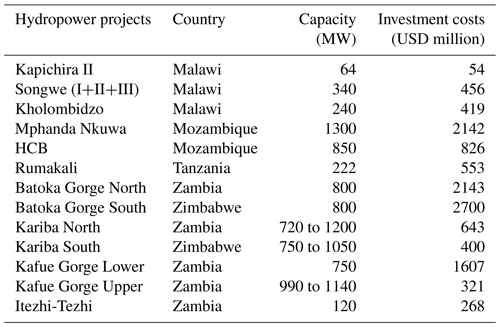
To respond to the rapidly increasing demand, SAPP countries are planning new or refurbished hydropower and thermal power plants, as well as new transmission lines. We refer to the “hydropower development plan” or “HDP” as the ensemble of projects described in World Bank (2010), which includes 15 projects with 7.2 GW of new operating capacity (Fig. 5, Table 2). Investment costs in the hydropower projects range from USD 837 kW−1 for Kapichira II to USD 3375 kW−1 for the Batoka Gorge South project; the total investment costs of these projects reach USD 12.5 billion, and the fixed annual operating costs are estimated at USD 56 million (IRENA, 2013). Transmission line projects are not considered as part of the HDP but are considered in future scenarios. Other power generation projects are not considered individually; however, the representation of generic power technologies simulates additional investments in power generation.
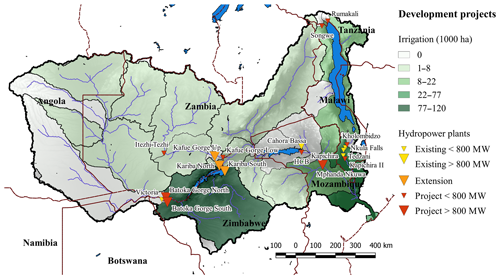
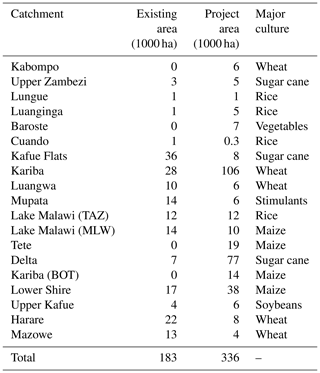
Figure 5Hydropower and irrigation development projects. The major irrigation development projects are located at Kariba Lake (Zimbabwe), in the Zambezi Delta (Mozambique), and in the Lower Shire (Malawi). The major hydropower projects are Batoka Gorge North and Batoka Gorge South with 800 MW in Zambia and 800 MW in Zimbabwe, respectively, and Mphanda Nkuwa with 1300 MW in Mozambique.
3.4.2 Irrigation development plan
We consider the irrigation development projects formulated in World Bank (2010), referred to as “irrigation development plan” or “IDP”. With almost 100 identified irrigation projects aggregated per catchment, the IDP adds around 336 000 ha of equipped area to the existing 182 000 ha (Fig. 5, Table 3). “Equipped area” refers to the actual land use, while “irrigated area” usually double counts winter and summer crops on the same land. The total investment costs of the IDP are evaluated at USD 2.5 billion (World Bank, 2010). The most important cultures in terms of area are sugar cane (23 %), rice (17 %), wheat (15 %), and maize (14 %). The crop choice for the irrigated areas is constrained to the planned crops using data from World Bank (2010). We assume that irrigation projects replace existing rainfed areas as long as the irrigated area does not exceed the total available area.
3.5 Climate change, future scenarios, and uncertainty analysis
The Zambezi River basin was classified by IPCC as being severely threatened by the potential effects of climate change (Thornes, 2002); according to World Bank (2010), the runoff might be reduced by 12 % to 34 % depending on the region. Furthermore, the population is expected to grow from 40 million to 70 million by 2050 (SADC et al., 2015). This will drastically increase energy and food demand and accentuate the pressure on ecosystems. As the investment plans involve infrastructure with a long lifetime, over 50 years for hydropower plants, it is crucial to consider the potential future climate and socio-economic scenarios. Table 4 offers an overview of the scenarios considered.
Table 4Main scenarios. The table presents trends in the water, energy, and agriculture sectors for the three main scenarios: 2010, 2030, and 2050. The sub-scenarios are relative to the 2030 scenario, to evaluate the sensitivity of the results to climate change, world market crop prices, CO2 pricing policies, capital costs of solar photovoltaic capacity, and environmental flow policy.

a The price variation is only for the world market. b Flood level restoration at the Zambezi Delta during the month of February.
We consider four climate change scenarios from Cervigni et al. (2015): dry, semi-dry, semi-wet, and wet for the period from 2001 to 2050. The scenarios are derived using bias correction and spatial downscaling from the general circulation models (GCM) of the Climate Model Intercomparison Project – Phase 5 (Brekke et al., 2013), which is applied to historical climate data. Figure 6 shows how the different climate change scenarios impact the average evapotranspiration, precipitation, and runoff in the Zambezi River basin. As in World Bank (2010), we consider different flood restoration policies in the Zambezi Delta: 4500, 7000, and 10 000 m3 s−1 in February as sub-scenarios of the 2030 scenario.
Expected energy demand growth rates range from 0.7 % (Zambia) to 5.1 % (Tanzania) per year in the coming decades (SAPP, 2015), meaning that demand will more than double in some countries towards 2030. We consider a continuous growth rate of the demand for the 2030 and 2050 scenarios. Carbon pricing policies might have an important impact on energy generation; IRENA (2013) uses a carbon tax of USD 25 t CO2eq−1 in 2030. Thus, fuel prices would increase drastically: coal prices would double, while gas prices would increase by 30 % (IRENA, 2013). We consider the expected USD 25 t CO2eq−1 carbon price for the 2030 and 2050 scenarios, and measure the sensitivity of this policy by varying the carbon tax from USD 0 t CO2eq−1 to USD 50 t CO2eq−1 in the 2030 scenario. Capital costs of solar photovoltaic are expected to be halved by 2030 (IRENA, 2013), and we consider a capital cost of USD 1000 kW−1 in the 2030 and 2050 scenarios, and vary it from USD 2000 kW−1 to USD 500 kW−1 in the 2030 scenario. Future transmission lines, between Malawi and Mozambique, Tanzania and Zambia and Namibia and Angola (SAPP, 2015) are considered to be constructed in the 2030 and 2050 scenarios.
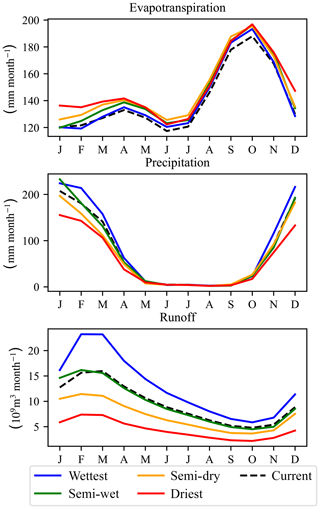
Figure 6Impact of climate change on hydrologic parameters. The average yearly pattern of evapotranspiration, precipitation, and runoff is shown for the four climate change scenarios and the current climate.
Crop demand is expected to increase by 10 % (roots and tuber in Angola) to 140 % (fruits and vegetables in Zambia) by 2030, depending on crops and countries (IFPRI, 2017b). We consider demand growth in the 2030 and 2050 scenarios, using projected demands for 2030 and 2050 from IFPRI (2017b). According to OECD and FAO (2017), yields will increase by 0.5 % (roots in Mozambique) to 3.8 % (rice in Zambia) per year; we consider this in the 2030 and 2050 scenarios, assuming continuous growth. However, this might be optimistic, as FAO (2018) data show that yields for some crops (e.g. rice, wheat, and sugar cane) in the Zambezi countries have been stable for the past 20 years. Thus, we also consider no yield growth for the sensitivity analysis of the 2030 scenario. National- and crop-specific yield data are available for Mozambique, Tanzania, and Zambia, whereas the sub-Saharan average is used for the other countries. Similarly, rainfed area should increase by 1.2 % (Tanzania) to 2 % (Mozambique) per year (OECD and FAO, 2017), and we include these changes in the 2030 and 2050 scenarios. As no data were available, we assume world market crop prices remain stable in the future scenarios. However, we test the sensitivity of this assumption by varying world market crop prices by ±20 % in the 2030 scenario.
In this section, we illustrate how the Zambezi model can be used to answer questions such as “What are the potential impacts of climate change on the agriculture and energy systems?”, “What are the benefits of the hydropower and agricultural development plans?”, “What is the sensitivity of these benefits regarding uncertainties in policies, future climate, and socio-economic development?”, “What are the synergies and trade-offs between the irrigation and hydropower development plan?”, and “What are the opportunity costs of restoring flood regimes in the Zambezi Delta?”
Table 5Water balance of the reference scenario. Results are presented as the average for the 40-year simulation. The amount of runoff and reservoir evaporation varies significantly depending on the studies. Average yearly runoff might be influenced by the historical period considered.

a It is not clear if the cited studies report reservoir evaporation as net (including rainfall) or gross values, which might explain differences. b The publication reports an average runoff of 130 300×106 m3 yr−1; however, this is believed to be a reporting mistake (Kenneth Marc Strzepek, personal communication, 2019), and the average runoff used in the calculations is 107 000×106 m3 yr−1.
4.1 Model validation
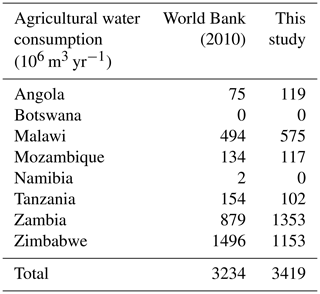
To validate the model, we show the overall results of the 2010 scenario, which is the situation in the Zambezi River basin around the year 2010. The water balance for the Zambezi River basin (Table 5) shows that the main water consumption is evaporative losses from reservoirs (mainly the Kariba and Cahora Bassa dams). The total water consumption reaches around 10 % of the total available water. Agricultural uses represent only around 25 % of the total water consumption, and domestic and industrial consumption around 5 %. The average runoff and reservoir evaporation varies significantly among the different studies (Table 5), and it is unclear if the studies report net or gross evaporation (including or excluding rainfall on the reservoir area). For the average runoff, the difference is most likely due to different reference periods; according to our data, the average yearly runoff from 1960 to 1980 was 129 000×106 m3, while from 1980 to 2000 it was only 100 600×106 m3.
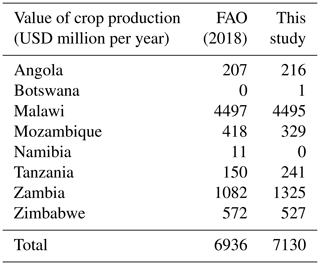
The model reproduces the patterns of agricultural water consumption per country (Table 6), with some differences between Zambia and Zimbabwe. These differences may be explained by differences in the aggregation of agricultural areas at the border between Zambia and Zimbabwe between this work and the World Bank (2010) study. The modelled value of crop production (Table 7) is in accordance with observations; main production is in Malawi, followed by Zambia and Zimbabwe. The “observed” value is obtained by downscaling national statistics assuming a constant per capita value, and is therefore not a precise number. Hydro-economic models often valuate agriculture by considering a willingness to pay for water by agriculture users, or by representing crop production and valuating crops at the farm level (Bauer-Gottwein et al., 2017; Harou et al., 2009). Non-market approaches include the following limitations: (1) crop demand is not represented; (2) crop trade, transaction costs, and losses are not represented; (3) food security constraints cannot be represented; (4) the interactions with rainfed agriculture cannot be represented; and (5) it requires the calculation of an exogenous willingness to pay for water or crops for each considered socio-economic development scenario potentially affecting the crop markets. In this study we use a market approach valuating crops at the consumer level. Non-market and market approaches can be similar if irrigated crops are a marginal share of the total production, and if supply, demand, and trade of crops remain stable. In the Zambezi, irrigated crops are a small share of the total production. However, we analyse the potential impacts of climate change, significantly affecting rainfed production, and therefore crop supply and food security constraints, in the context of an increasing crop demand. Thus, the market approach is necessary to perform the analysis of this study.
Table 7Value of crop production in the Zambezi River basin. Data from FAO (2018) are at a national level, and are downscaled to the Zambezi River basin assuming constant per capita value; therefore, the data might not be fully representative of the actual regional value.
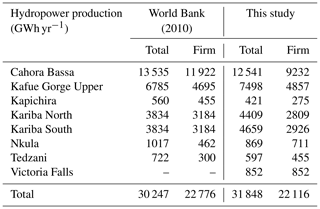
Hydropower production per plant (Table 8) is similar to World Bank (2010), with small variations linked to differences in the modelling approach and hydrologic data. A common approach to value hydropower production is to use the concepts of firm and secondary power and value them differently to indirectly represent the power market. In the World Bank (2010) study, firm power is calculated as the power production available 99 % of the time (at the monthly scale) at a single plant, whereas secondary power is the remaining power production. Indeed, assuming a constant power demand at the monthly timescale, firm power can replace investments in thermal power capacity, whereas secondary power needs to be balanced by thermal capacity. Thus, secondary power only saves fuel costs but does not save on ramping and capacity investment costs and therefore has a lower value. In this study we do not use the firm power concept but simulate the power market instead. Although the hydropower plant production is not optimized for firm power, we find similar results to the World Bank (2010) study (Table 8). The reasons for this are as follows: (1) we do not consider seasonal variations in the availability of a power source (e.g. solar capacity has a diurnal variation but seasonal variation is assumed to be negligible); (2) low- and high-flow seasons occur at the same time of the year throughout the basin, reducing the benefit of coordinating hydropower production in different subbasins; and (3) reservoirs have a high storage capacity enabling hydropower plants to operate with relatively stable monthly releases. Although the firm power and market approaches give similar results in this case, the firm power approach has some limitations: (1) it does not represent transmission constraints which are considered to be important in the SAPP power system (Spalding-Fecher et al., 2017b); (2) it does not consider the power demand; (3) it does not enable coordination between several hydropower plants to balance fluctuations in production at individual plants; (4) it does not enable the representation of the benefits of hydropower as a peak power source, satisfying peak demand or balancing an unstable power source such as solar or wind; and (5) it cannot be used to evaluate the impact of carbon tax policies, capital costs of renewable technologies, and future energy demand, which would require an exogenous model to calculate firm and secondary power values for each scenario.
Table 8Hydropower production. Simulated hydropower production is compared to the results of the MSIOA study (World Bank, 2010). Firm power is calculated as the power production available 99 % of the time (at the monthly scale) at a single plant.
In general, the model reproduces the trends observed in the reference scenario for the water, energy, and agriculture systems, but some differences appear. Therefore, in the following analysis, most of results are not shown as absolute values, but as relative changes between different scenarios.
Table 9Impact of climate change on the water–energy–food system. The results show the difference in key indicators with and without the four climate change scenarios for the 2030 scenario without infrastructure development plans.

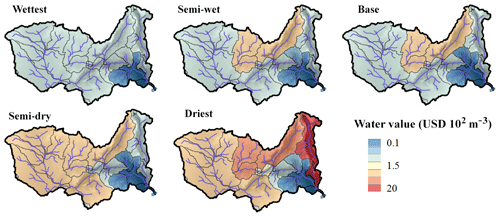
Figure 7Average water value under climate change scenarios. The “water value” is the result of the shadow prices/dual values of the constraint of the hydro-economic model; it represents the potential economic benefits of an additional cubic metre (m3) of water in the river. The increased water value is a sign of increased water scarcity.
4.2 Potential impacts of climate change
Climate change is found to have important potential impacts, inducing losses of more than USD 2.3 billion per year in the driest scenario to increasing benefits by USD 400 million per year in the wettest scenario (Table 9). In the driest scenario, average runoff is more than halved, reducing current hydropower production by 50 %. This causes economic losses to the energy sector of more than USD 700 million per year. In the wettest scenario, the average runoff increases by 35 %, increasing hydropower production by almost 5000 GWh yr−1, resulting in an increased benefit of USD 220 million per year for the energy sector. The agricultural sector is particularly sensitive, as it mainly relies on rainfed agriculture. The driest scenario seems to be a critical threshold where an important portion of rainfed cultures show low yields. Indeed, from the semi-dry to the driest scenario the induced economic losses rise from USD 200 million per year to USD 1640 million per year and the crop price index from +4 % to +33 %. Similarly, the value of water in the Shire River (Malawi) is not affected in the semi-dry scenario but rises considerably in the driest scenario (Fig. 7). In fact, in the semi-dry scenario Malawi observes losses of only USD 8 million per year, but in the driest scenario, losses reach more than USD 800 million per year (mostly to the agriculture sector).
4.3 Hydropower development plan
The hydropower development plan (HDP) is found to produce an extra 28 000 to 33 000 GWh yr−1 (Table 10), which is in accordance with World Bank (2010; 30 400 GWh yr−1). For the 2030 scenario, the resulting value is around USD 1932 million per year. Considering the total investment costs of USD 12.5 billion as well as the fix annual operating costs and a lifetime of 50 years for the hydropower projects, this represents an internal rate of return of 14.7 % (assuming overnight construction of the hydropower projects, excluding cost and benefits linked to non-represented elements such as fishing, tourism, flood regulation, navigation, and ecosystem services). The main benefits occur in countries with new major hydropower projects (Zambia, Zimbabwe, Mozambique, and Malawi), although even countries that do not have any projects (e.g. Namibia) benefit from cheaper power imports (Table 11). While Zambia and Zimbabwe use most of the additional energy for own supply, Malawi exports half and Mozambique exports all of it. The impact of the HDP on the electricity price is relatively small as an important share of the demand is satisfied through thermal power. Therefore, the economic impact is mainly producer surplus, while consumer surplus is limited (Table 10). However, this varies locally, and in Malawi the HDP makes the country almost independent of thermal power, lowering electricity prices by USD 16 MW h−1 and generating important consumer surplus (Table 11).
Table 10Impacts of the hydropower development plan. Results are shown as the difference with and without the hydropower development plan for the 2010, 2030, and 2050 scenarios. Sector benefits exclude construction costs.
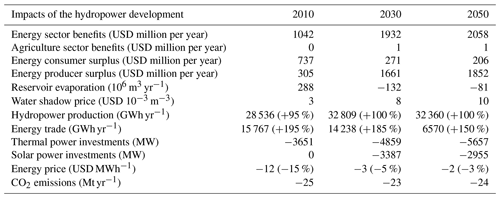
Table 11Country-scale impacts of the hydropower development plan. Results are shown as the difference with and without the hydropower development plan for the 2030 scenario. The added value excludes construction costs.

Hydropower production is around 4000 GWh yr−1 lower in the 2010 than in the 2030 scenario (Table 10); this can be explained by demand limits and the fact that Malawi is not connected to the SAPP grid and cannot export over production of its run-off-the-river hydropower plants in the 2010 scenario. In fact, under the HDP in the 2030 scenario, power transmission among SAPP countries is considerably increased, including transfers from Malawi to Mozambique (Fig. 8). In the practical implementation of the HDP, projects would be implemented gradually, and the demand constraint would probably not be a problem; however, in this study we do not consider the timing and sequencing of the projects. The main difference between the 2010 and the 2030 scenarios is the generated benefits. The driving factor is the potential carbon pricing policy, as it will considerably affect fuel costs and, therefore, the cost of generating power with thermal power plants (Fig. 9). We consider carbon price as a cost, although it could also be considered as a tax and, thus, have no effect on the welfare (being a money transfer from producers to states). However, the principle of a carbon price/tax is to compensate for CO2 emissions, which will therefore result in a cost. Thus, the price of electricity for consumers increases from USD 53 MW h−1 in the 2010 scenario to USD 73 MW h−1 in the 2030 scenario, increasing the value of developing hydropower.
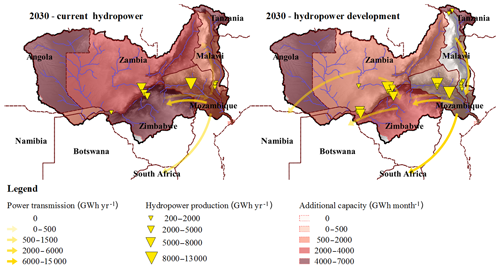
Figure 8Power transmission, hydropower production, and additional capacity investments before and after implementation of the hydropower investment plan. The implementation of the hydropower development plan is found to considerably increase the power exchanges among the SAPP countries and reduce the need to invest in additional power generation capacity.
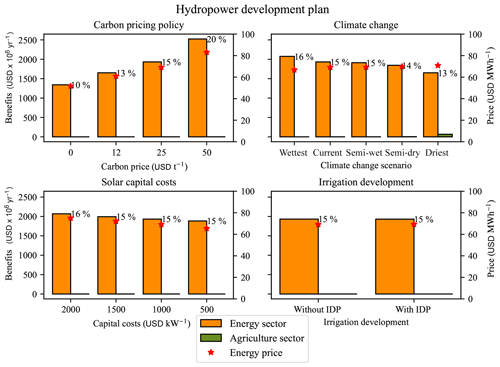
Figure 9Sensitivity of the hydropower development plan benefits to uncertainties in future climate and socio-economic development. Benefits are calculated from with/without analyses of the hydropower development in variations of the 2030 scenario, and percentages indicate the internal rate of return. The value of the hydropower development plan is found to be most sensitive to the carbon pricing policy, climate change, and the capital cost of solar photovoltaic. The current carbon price is USD 0 t−1, and USD 25 t−1 is used in the 2030 scenario; the current solar capital cost is USD 2000 kW−1, and USD 1000 kW−1 is used in the 2030 scenario.
The HDP has no impact on the agricultural system (Table 10), neither positive nor negative, and vice versa, the development of the irrigation development plan has almost no affect on its value (Fig. 9). The value of the HDP is relatively sensitive to climate change; it varies from USD 1651 million per year to USD 2075 million per year for the driest to the wettest scenarios. The additional hydropower production is severely impacted in the driest scenario, producing only 25 000 GWh yr−1 in comparison with 37 000 GWh yr−1 for the wettest scenario. However, climate change has more impact on the current hydropower plants, where the driest climate change scenario is found to halve current power production (Table 9). Another influencing parameter for the value of the HDP is the capital cost of solar photovoltaic power, as this affects the cost of producing alternative energy. With solar capital costs ranging from USD 2000 kW−1 to USD 500 kW−1, the electricity consumer price varies from USD 80 MWh−1 to USD 70 MWh−1, and the value of the HDP from USD 2070 million per year to USD 1880 million per year. Excluding solar photovoltaic technology from the simulation results in the same value for the HDP in the 2030 scenario. Solar power has a twofold effect on the value of hydropower plants: on the one hand, it reduces electricity prices and, in turn, the value of hydropower energy; on the other hand, it increases the intermittency of the power system and, thus, the value of flexible hydropower generation. As there is already an important hydropower capacity available in the Zambezi River basin, both effects compensate for one another in this case.
4.4 Irrigation development plan
The irrigation development plan (IDP) is valued at between USD 650 million per year and USD 1220 million per year depending on the scenario (Table 12). Considering investment costs of USD 2.5 billion and a lifetime of 20 years for the infrastructure, this corresponds to an internal rate of return of 26 % to 49 % (ignoring maintenance costs). The important variation can be explained by the expected growth in yields that should more than double between the 2010 and 2050 scenarios (OECD and FAO, 2017). This assumption might be optimistic given that according to FAO (2018) data, yields for several crops have been relatively stable over the past 20 years. The implementation of the IDP more than doubles irrigated area (+430 000 ha), as well as water consumption ( m3 yr−1). Because of the increased water consumption, the benefits of the IDP for the agriculture sector are counterbalanced to a limited extent by losses in the energy sector. In fact, around 5 % of the benefits are lost because of resulting hydropower shortages of about 1200 GWh yr−1 (Table 12). This is a lower level of trade-offs than in World Bank (2010), which estimated hydropower shortages of around 2700 GWh yr−1. The most affected country is Mozambique (−650 GWh yr−1); because it is the most downstream country, its hydropower production is affected by the water consumption in Zimbabwe, Zambia, and Malawi (Table 13, Fig. 10). More than 80 % of the value of the IDP is generated through crop trade (Table 12, Fig. 10); thus, world market crop prices are a very sensitive parameter (Fig. 11). A reduction of 20 % in world market crop prices would reduce the value of the IDP by 25 %. As most of the profits are linked to exports, the IDP has a relatively small impact on crop prices, and, therefore, benefits mostly occur as producer surplus rather than consumer surplus (Table 12). A drier climate has a twofold impact on the IDP (Fig. 11): it reduces rainfed production and increases the value of irrigation, but it also increases trade-offs with the energy sector. In fact, in the current climate scenario, the IDP saves USD 48 million per year of import value from the world crop market to satisfy food security constraints, whereas in the driest scenario, it saves USD 95 million per year of import value. This shows the importance of representing rainfed agriculture to assess the value of irrigation projects. However, hydropower shortages induced by additional water consumption range from 515 GWh yr−1 in the wettest scenario to 1600 GWh yr−1 in the driest scenario, inducing losses in the range of USD 24 million per year to USD 104 million per year (representing over 10 % of the benefits), which counterbalance the import substitution effect in the crop market. The trade-offs are limited because the water consumption is a small share of the available water (around 15 % including the irrigation development). Implementation of the hydropower development plan is not found to increase trade-offs between irrigation and hydropower and has no impact on the value of the IDP (Fig. 11).
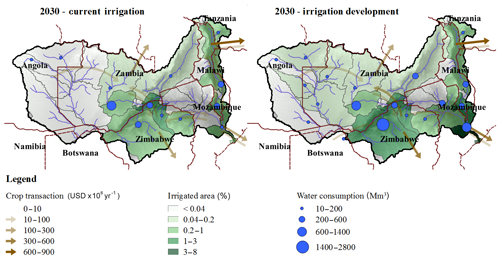
Figure 10Crop trade and irrigation water consumption before and after the implementation of the irrigation development plan (IDP). Implementation of the IDP is found to increase crop exports to the world market and more than double water consumption. The “crop transactions” towards the exterior of the Zambezi area represent exports to the world market.
Table 12Impacts of the irrigation development plan. Results are shown as the difference with and without the irrigation development plan for the 2010, 2030, and 2050 scenarios. Sector benefits exclude project development costs.
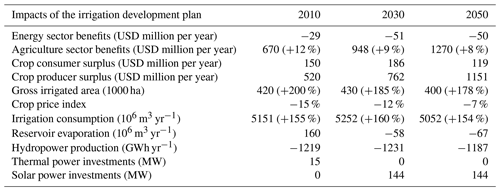
Table 13Country-scale impacts of the irrigation development plan. Results are shown as the difference with and without the irrigation development plan for the 2030 scenario. The added value excludes construction costs.

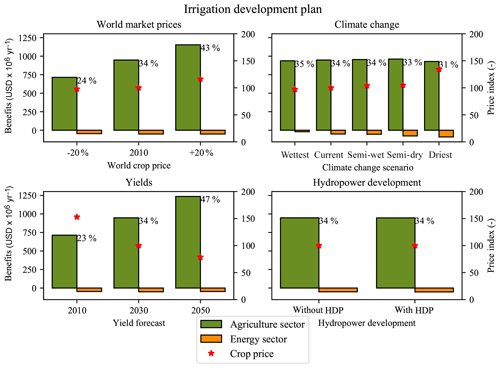
Figure 11Sensitivity of the irrigation development plan to uncertainties in future climate and socio-economic development. Benefits are calculated from with/without analyses of the irrigation development in variations of the 2030 scenario, and the percentages show the internal rate of return. The value of the irrigation development plan is found to be very sensitive to crop yields, world market crop prices, and less sensitive to the climate change scenario. The crop price index is proportional to the weighted average crop price of supplied crops within the Zambezi, and 100 is the reference value for the 2030 scenario.
4.5 Restoration of flood regimes
Natural flooding in the wetlands and the Zambezi Delta was severely affected by the construction of the Kariba and Cahora Bassa dams. As thermal power plants have a stable production at the monthly scale, hydropower production is more valuable when it is as constant as possible; thus, dams tend to stabilize the water releases throughout the year. Nevertheless, floods play an important role for ecosystems in the wetlands; therefore, a potential policy is to restore the natural floods (World Bank, 2010). Figure 12 shows the opportunity costs of restoring floods in February for three flood levels and the four climate change scenarios, considering a 100 % (the constraint is fulfilled every year) and an 80 % compliance (the constraint must be fulfilled 4 out of 5 years). Opportunity costs of the “base” environmental flow policy are almost zero except for the driest climate change scenario. The restoration of the natural floods induces increasing costs with the flood level target: costs reach up to more than USD 800 million per year for the driest scenario and the highest flood level, but stay under USD 150 million per year for the semi-wet and wettest scenarios. This is in accordance with Tilmant et al. (2012), who found opportunity costs of USD 104 million per year for restoring floods under current climate. Here, we only consider opportunity costs of the policy as trade-offs with hydropower production and irrigation, but not benefits linked to direct and indirect use and non-use values of ecosystems or costs linked to population displacement. More than half of the population depends directly on wetland ecosystems (SADC et al., 2015); therefore, benefits linked to the protection of ecosystems might be important and a complete cost–benefit analysis would reveal the value of such environmental policies.
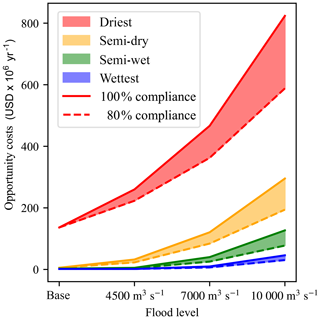
Figure 12Opportunity costs of restoring flooding regimes in the Zambezi Delta. The opportunity costs of the different flood level targets are calculated for the four different climate scenarios assuming the hydropower and irrigation development plans are implemented. The “base” flood level corresponds to environmental flow constraint without including flood restoration. A 100 % compliance means the flood level is ensured every year, whereas an 80 % compliance means the environmental flow constraint must be achieved 4 out of 5 years.
By connecting the water, energy, and food systems in a holistic framework and using an economic optimization approach we showed how we could evaluate the development plans in the Zambezi River basin considering different scenarios. Here, we list some limitations of the model and avenues for further development that could be particularly interesting.
Depending on the context, additional interrelations in the water–energy–food nexus, which are currently not simulated in the framework, could play an important role, such as energy consumption for water treatment or desalinization (Dubreuil et al., 2013), energy for water pumping in the agricultural or domestic sector (Bauer-Gottwein et al., 2016; Dubreuil et al., 2013), water for cooling purposes of thermal power plants (Payet-Burin et al., 2018; Van Vliet et al., 2016), and production of crops for biofuels (Mirzabaev et al., 2015). For study cases where these interactions have an important impact, they can be added to the modelling framework.
In the next decades, renewables such as solar or wind energy will be crucial in the southern African power sector (IRENA, 2013) and intermittence constraints will be a key element of future power systems. Hydropower plants have a lifetime of more than 50 years and will therefore evolve among these future conditions. Hence, valuation of hydropower projects using a fixed price (e.g. Tilmant et al., 2012) or the concept of “firm energy” (e.g. World Bank, 2010) might no longer be appropriate (Palmintier, 2013). In this study, using the concept of “load segments” (sometimes called “time slices”), we took a step towards the representation of intermittent energy systems, but a more detailed representation (considering e.g. ramping constraints, minimum loads, and sun or wind profiles) will be key for correctly valuing hydropower projects.
In this study, we only considered the water resource in terms of quantity, although water quality may have an important impact for water treatment, irrigation, fishing, and tourism. Different approaches could be considered: Boehlert et al. (2015) combined a water management model with a water quality model, considering chemicals and reactions, and represent advection among river branches, whereas Martinsen et al. (2018) considered water quality classes, with the associated treatment costs and quality requirements for the demands, in a hydro-economic optimization framework.
We presented the economic values of the development plans and their sensitivity to different sets of parameters but did not perform a complete cost–benefit analysis of the projects. Costs and benefits linked to impacts on ecosystems, fishing, flood control, tourism, sedimentation, and navigation need to be considered separately to complete a full cost–benefit analysis of the infrastructure projects. Besides, some studies claim that the evaluation of investment costs, including financing, construction, and resettlement costs, are systematically and significantly underestimated (Ansar et al., 2014; Awojobi and Jenkins, 2015), which adds to the uncertainty in the net present value of the infrastructure projects.
By evaluating the development plans in the 2010, 2030, and 2050 scenarios, we showed that the timing of the investments plays an important role in an evolving socio-economic context. Furthermore, not all projects which are part of the development plans may be profitable. Therefore, an important analysis would be the selection of the optimal projects, as well as timing and sequencing of investments, considering gradual changes in the socio-economic and climatic context.
The optimization framework of the model assumes full cooperation among different political and sectorial entities (e.g. upstream farmers in Zimbabwe may forgo some water abstractions to benefit Mozambique's downstream hydropower production). The practical implementation of such trade-offs might be possible by using compensation payments (Tilmant et al., 2009), while another approach is to consider trade-offs between efficiency and equity by using a multi-objective optimization (Hu et al., 2016). However, as this may be institutionally and politically complicated, decision makers might be interested in knowing the impacts on the planned projects if one or several countries do not cooperate. This could be implemented in the current modelling framework by solving the management decisions using a local objective function from upstream to downstream.
Finally, we use a perfect foresight approach which is common to sectorial planning models (e.g. Kahil et al., 2018; Khan et al., 2018). This means that optimal management decisions will anticipate future conditions such as droughts by storing additional water or cultivating crops with lower water requirements, leading to overestimation of system performance. In reality, water planners and managers will not have perfect foresight, and will be limited by the availability and skill of existing forecasting systems. The validation of the model against observed indicators shows that the bias due to perfect foresight assumption is not excessive. Furthermore, part of the bias is cancelled by carrying out relative analysis (e.g. with and without infrastructure development, with and without climate change scenario). However, as droughts have important economic impacts (SADC et al., 2015), a more realistic way of modelling reservoir operations and agriculture decisions could improve the reliability of the results. One way to implement this in the current modelling framework is to use model predictive control and iteratively solve the optimal management decisions in each time step with limited knowledge of the future (Sahu, 2016).
We presented a new open-source decision support tool for economic valuation of water infrastructure and policies in the water–energy–food–climate nexus. The tool fills a gap in the existing planning tools, which are mostly single-resource focused, or do not have an optimization framework. Based on a hydro-economic optimization framework, the tool considers synergies and trade-offs among WEF infrastructure and policies and can be used to evaluate different scenarios.
In the Zambezi River basin, we show how the integrated analysis of the energy, agriculture, and water systems, including commodity markets, provides additional insights into the economic impacts of infrastructure and policies. This may lead to different investment decisions to those based on models that do not consider the nexus or market effects. We show that it is crucial to consider risks linked to these uncertainties in a rapidly evolving socio-economic context and under potential pressure from climate change. In the driest climate change scenario, decrease in runoff reduces the hydropower production by 50 %, causing losses of USD 700 million per year, while rainfed agriculture is severely impacted by increased evapotranspiration and reduced rainfall, causing losses of about USD 1.6 billion per year. The benefits of the hydropower development plan are found to be around USD 1.9 billion per year but are sensitive to future fuel prices or carbon pricing policies, capital costs of solar technologies, and climate change. Climate change is the main factor impacting hydropower production as it affects the water resource availability. A carbon pricing policy could have a significant impact on fuel prices and, thus, on power production costs and is therefore the main driver of the hydropower production value. The development of solar capacity will increase the intermittency in the power system and, thus, the value of flexible hydropower, although it will decrease the cost of power production, and thus potentially counterbalance the first effect. Similarly, the benefits of the irrigation development plan are found to be sensitive to the evolution of crop yields, world crop market prices, and climate change. The potential improvements in yields could have significant positive impact on the crop production, although the increase is uncertain as past data do not show a clear improving trend. As most of the value of the irrigation development is generated through exports, the development plan is very sensitive to world crop market prices. A dryer climate will reduce the availability of water and, thus, the potential benefits; however a dryer climate also increases the value of crops during dry years as rainfed crops will be affected. The development of irrigation infrastructure will decrease hydropower production, leading to reduced benefits. As the total water consumption is a limited share of the available water, trade-offs represent only 5 % of the value of the development plan. However, this effect could be exacerbated by climate change. Restoring natural flooding in the Zambezi Delta involves limited economic trade-offs in the current climate, although under climate change it could result in major trade-offs with irrigation and hydropower generation.
The decision support tool WHAT-IF v1.0 (Payet-Burin, 2019a) is available under the GNU General Public License version 3 (GPLv3) and can be downloaded with the input data for the Zambezi study case from Github (https://github.com/RaphaelPB/WHAT-IF, last access: 27 September 2019). The study case data are also available at https://doi.org/10.5281/zenodo.2646476 (Payet-Burin, 2019b), including the detailed sources.
The supplement related to this article is available online at: https://doi.org/10.5194/hess-23-4129-2019-supplement.
SPC, MK, KS, and PBG designed the study. MK and RPB developed the computer model. RPB performed the analysis and wrote the paper. All authors contributed to the interpretation of results and commented on the paper.
The authors declare that they have no conflict of interest.
Innovation Fund Denmark, COWIfonden, and COWI A/S funded the industrial PhD project in which this research was carried out. The authors also thank Charles Fant for providing the data from the rainfall–runoff model.
This research has been supported by the Innovation Fund Denmark (grant no. 7038-00015B).
This paper was edited by Nadia Ursino and reviewed by two anonymous referees.
Albrecht, T. R., Crootof, A., and Scott, C. A.: The Water-Energy-Food Nexus?: A systematic review of methods for nexus assessment OPEN ACCESS The Water-Energy-Food Nexus?: A systematic review of methods for nexus assessment, Environ. Res. Lett., 13, 043002, https://doi.org/10.1088/1748-9326/aaa9c6, 2018.
Allen, R. G., Pereira, L. S., Raes, D., and Smith, M.: Crop evapotranspiration: guidelines for computing crop water requirements, FAO Irrigation and Drainage Paper No. 56, FAO, Rome, Italy, 1998.
Ansar, A., Flyvbjerg, B., Budzier, A., and Lunn, D.: Should we build more large dams? The actual costs of hydropower megaproject development, Energ. Policy, 69, 43–56, https://doi.org/10.1016/j.enpol.2013.10.069, 2014.
Awojobi, O. and Jenkins, G. P.: Were the hydro dams financed by the World Bank from 1976 to 2005 worthwhile?, Energ. Policy, 86, 222–232, https://doi.org/10.1016/j.enpol.2015.06.040, 2015.
Bauer-Gottwein, P., Schneider, R., and Davidsen, C.: Optimizing Wellfield Operation in a Variable Power Price Regime, Groundwater, 54, 92–103, https://doi.org/10.1111/gwat.12341, 2016.
Bauer-Gottwein, P., Riegels, N., Pulido-Velazquez, M., Harou, J. J., Cai, X., Davidsen, C., and Pereira-Cardenal, S. J.: Hydroeconomic Analysis, in: Handbook of Applied Hydrology, edited by: Singh, V., McGraw-Hill, 36/1–36/7, 2017.
Bazilian, M., Rogner, H., Howells, M., Hermann, S., Arent, D., Gielen, D., Steduto, P., Mueller, A., Komor, P., Tol, R. S. J., and Yumkella, K. K.: Considering the energy, water and food nexus: Towards an integrated modelling approach, Energ. Policy, 39, 7896–7906, https://doi.org/10.1016/j.enpol.2011.09.039, 2011.
Beilfuss, R.: A Risky Climate for Southern African Hydro: Assessing hydrological risks and consequences for Zambezi River Basin dams, International Rivers, CA, USA, 1–60, https://doi.org/10.13140/RG.2.2.30193.48486, 2012.
Boehlert, B., Strzepek, K. M., Chapra, S. C., Fant, C., Gebretsadik, Y., Lickley, M., Swanson, R., McCluskey, A., Neumann, J. E., and Martinich, J.: Climate change impacts and greenhouse gas mitigation effects on U.S. water quality, J. Adv. Model. Earth Sy., 7, 1326–1338, https://doi.org/10.1002/2014MS000400, 2015.
Brekke, L., Thrasher, B., Wood, A., and Pruitt, T.: Downscaled CMIP3 and CMIP5 Climate Projections: Release of Downscaled CMIP5 Climate Projections, Comparison with preceding Information, and Summary of User Needs, available at: https://gdo-dcp.ucllnl.org/downscaled_cmip_projections/techmemo/BCSD5HydrologyMemo.pdf (last access: 27 September 2019), 2013.
Cervigni, R., Liden, R., Neumann, J. E., and Strzepek, K. M.: Enhancing the Climate Resilience of Africa's Infrastructure: The Power and Water Sectors, World Bank, Washington, DC, available at: https://openknowledge.worldbank.org/handle/10986/21875 (last access: 27 September 2019), 2015.
Dogan, M. S., Fefer, M. A., Herman, J. D., Hart, Q. J., Merz, J. R., Medellín-Azuara, J., and Lund, J. R.: An open-source Python implementation of California's hydroeconomic optimization model, Environ. Model. Softw., 108, 8–13, https://doi.org/10.1016/j.envsoft.2018.07.002, 2018.
Doorenbos, J. and Kassam, A. H.: Yield response to water, FAO Irrigation and Drainage Paper No. 33, Food and Agricultural Organisation of the United Nations, Rome, 1979.
Draper, A. J., Jenkins, M. W., Kirby, K. W., Lund, J. R., and Howitt, R. E.: Economic-Engineering Optimization for California Water Management, J. Water Res. Pl.-ASCE, 129, 155–164, https://doi.org/10.1061/(ASCE)0733-9496(2003)129:3(155), 2003.
Dubreuil, A., Assoumou, E., Bouckaert, S., Selosse, S., and Maïzi, N.: Water modeling in an energy optimization framework – The water-scarce middle east context, Appl. Energ., 101, 268–279, https://doi.org/10.1016/j.apenergy.2012.06.032, 2013.
Euroconsult and Mott MacDonald: Integrated water resources management strategy and implementation plan for the Zambezi River Basin, Lusaka, Zambia, available at: http://www.zambezicommission.org/sites/default/files/clusters_pdfs/Zambezi River_Basin_IWRM_Strategy_ZAMSTRAT.pdf (last access: 27 September 2019), 2008.
FAO: FAOSTAT, available at: http://www.fao.org/faostat/en/#data/QC, last access: 27 July 2018.
Goor, Q., Halleux, C., Mohamed, Y., and Tilmant, A.: Optimal operation of a multipurpose multireservoir system in the Eastern Nile River Basin, Hydrol. Earth Syst. Sci., 14, 1895–1908, https://doi.org/10.5194/hess-14-1895-2010, 2010.
Griffin, R. C.: Benchmarking in water project analysis, Water Resour. Res., 44, W11418, https://doi.org/10.1029/2008WR006868, 2008.
Harou, J. J., Pulido-Velazquez, M., Rosenberg, D. E., Medellín-Azuara, J., Lund, J. R., and Howitt, R. E.: Hydro-economic models: Concepts, design, applications, and future prospects, J. Hydrolog., 375, 627–643, https://doi.org/10.1016/j.jhydrol.2009.06.037, 2009.
Hart, W. E., Laird, C. D., Watson, J.-P., Woodruff, D. L., Hackebeil, G. A., Nicholson, B. L., and Siirola, J. D.: Pyomo — Optimization Modeling in Python, Springer International Publishing, New York, USA, 2017.
Howells, M., Rogner, H., Strachan, N., Heaps, C., Huntington, H., Kypreos, S., Hughes, A., Silveira, S., DeCarolis, J., Bazillian, M., and Roehrl, A.: OSeMOSYS: The Open Source Energy Modeling System. An introduction to its ethos, structure and development, Energ. Policy, 39, 5850–5870, https://doi.org/10.1016/j.enpol.2011.06.033, 2011.
Howells, M., Hermann, S., Welsch, M., Bazilian, M., Segerström, R., Alfstad, T., Gielen, D., Rogner, H., Fischer, G., Van Velthuizen, H., Wiberg, D., Young, C., Alexander Roehrl, R., Mueller, A., Steduto, P., and Ramma, I.: Integrated analysis of climate change, land-use, energy and water strategies, Nat. Clim. Change, 3, 621–626, https://doi.org/10.1038/nclimate1789, 2013.
Hu, Z., Chen, Y., Yao, L., Wei, C., and Li, C.: Optimal allocation of regional water resources: From a perspective of equity-efficiency tradeoff, Resour. Conserv. Recy., 109, 102–113, https://doi.org/10.1016/j.resconrec.2016.02.001, 2016.
IFPRI: Tanzania Social Accounting Matrix (SAM), 2009, Harvard Dataverse, https://doi.org/10.7910/DVN/28540, 2014.
IFPRI: Mozambique Social Accounting Matrix, 2007, Harvard Dataverse, https://doi.org/10.7910/DVN/28556, 2015.
IFPRI: 2014 Social Accounting Matrix for Malawi, Harvard Dataverse, https://doi.org/10.7910/DVN/REUCQR, 2017a.
IFPRI: IMPACT Projections of Demand for Agricultural Products: Extended Country-level Results for 2017 GFPR Annex IMPACT Trend 1, Harvard Dataverse, https://doi.org/10.7910/DVN/BKMBNU, 2017b.
IFPRI and IIASA: Global Spatially-Disaggregated Crop Production Statistics Data for 2005 Version 3.2, Harvard Dataverse, https://doi.org/10.7910/DVN/DHXBJX, 2017.
IRENA: Southern African Power Pool: Planning and Prospects for Renewable Energy, available at: https://www.irena.org/-/media/Files/IRENA/Agency/Publication/2013/SAPP.pdf (last access: 27 September 2019), 2013.
Kahil, T., Parkinson, S., Satoh, Y., Greve, P., Burek, P., Veldkamp, T. I. E., Burtscher, R., Byers, E., Djilali, N., Fischer, G., Krey, V., Langan, S., Riahi, K., Tramberend, S., and Wada, Y.: A continental-scale hydro-economic model for integrating water-energy-land nexus solutions, Water Resour. Res., 54, 7511–7533, https://doi.org/10.1029/2017WR022478, 2018.
Khan, Z., Linares, P., and García-González, J.: Integrating water and energy models for policy driven applications. A review of contemporary work and recommendations for future developments, Renew. Sust. Energ. Rev., 67, 1123–1138, https://doi.org/10.1016/j.rser.2016.08.043, 2017.
Khan, Z., Linares, P., Rutten, M., Parkinson, S., Johnson, N., and García-González, J.: Spatial and temporal synchronization of water and energy systems: Towards a single integrated optimization model for long-term resource planning, Appl. Energ., 210, 499–517, https://doi.org/10.1016/j.apenergy.2017.05.003, 2018.
Kraucunas, I., Clarke, L., Dirks, J., Hathaway, J., Hejazi, M., Hibbard, K., Huang, M., Jin, C., Kintner-Meyer, M., van Dam, K. K., Leung, R., Li, H. Y., Moss, R., Peterson, M., Rice, J., Scott, M., Thomson, A., Voisin, N., and West, T.: Investigating the nexus of climate, energy, water, and land at decision-relevant scales: the Platform for Regional Integrated Modeling and Analysis (PRIMA), Clim. Change, 129, 573–588, https://doi.org/10.1007/s10584-014-1064-9, 2015.
Krishnan, V., Ho, J., Hobbs, B. F., Liu, A. L., McCalley, J. D., Shahidehpour, M., and Zheng, Q. P.: Co-optimization of electricity transmission and generation resources for planning and policy analysis: review of concepts and modeling approaches, Energ. Syst., 7, 297–332, 2016.
Krugman, P. and Wells, R.: Microeconomics, edited by: Bleyer, C. and Woods, C., available at: https://www.academia.edu/27915897/Paul_Krugman_Robin_Wells_Microeconomics?auto=download (last access: 27 September 2019), 2005.
Loucks, D. P. and Van Beek, E.: Water Resources Systems Planning and Management and Applications: An Introduction to Methods, Models and Applications, UNESCO and WL| Delft Hydraulics, Paris, France and Delft, the Netherlands, available at: https://unesdoc.unesco.org/ark:/48223/pf0000143430 (last access: 27 September 2019), 2005.
Martinsen, G., Liu, S., Mo, X., and Bauer-Gottwein, P.: Joint optimization of water allocation and water quality management in Haihe River basin, Sci. Total Environ., 654, 72–84, https://doi.org/10.1016/j.scitotenv.2018.11.036, 2018.
McCarl, B. A., Yang, Y., Schwabe, K., Engel, B. A., Mondal, A. H., Ringler, C., and Pistikopoulos, E. N.: Model Use in WEF Nexus Analysis: a Review of Issues, Curr. Sustain. Energy Reports, 4, 144–152, https://doi.org/10.1007/s40518-017-0078-0, 2017.
Mcintosh, B. S., Ii, J. C. A., Twery, M., Chew, J., Elmahdi, A., Haase, D., Harou, J. J., Hepting, D., Cuddy, S., Jakeman, A. J., Chen, S., Kassahun, A., Lautenbach, S., Matthews, K., Merritt, W., Quinn, N. W. T., Rodriguez-roda, I., Sieber, S., Stavenga, M., Sulis, A., Ticehurst, J., Volk, M., Wrobel, M., Delden, H. Van, El-sawah, S., Rizzoli, A., and Voinov, A.: Environmental decision support systems (EDSS) development – Challenges and best practices, Environ. Modell. Softw., 26, 1389–1402, https://doi.org/10.1016/j.envsoft.2011.09.009, 2011.
Miralles-Wilhelm, F.: Development and application of integrative modeling tools in support of food-energy-water nexus planning – a research agenda, Journal of Environmental Studies and Sciences, 6, 3–10, https://doi.org/10.1007/s13412-016-0361-1, 2016.
Mirzabaev, A., Guta, D., Goedecke, J., Gaur, V., Börner, J., Virchow, D., Denich, M., and von Braun, J.: Bioenergy, food security and poverty reduction: trade-offs and synergies along the water–energy–food security nexus, Water Int., 40, 772–790, https://doi.org/10.1080/02508060.2015.1048924, 2015.
OECD and FAO: OECD-FAO Agricultural Outlook 2017-2026, available at: https://stats.oecd.org/index.aspx?queryid=76858 (last access: 13 December 2018), 2017.
Palmintier, B. S.: Incorporating operational flexibility into electric generation planning?: impacts and methods for system design and policy analysis, PhD thesis, Massachusetts Institute of Technology, available at: http://hdl.handle.net/1721.1/79147 (last access: 27 September 2019), 2013.
Payet-Burin, R.: WHAT-IF: Water, Hydropower, Agriculture Tool for Investment and Financing, https://doi.org/10.5281/zenodo.3387308, 2019a.
Payet-Burin, R.: Zambezi dataset to “WHAT-IF: an open-source decision support tool for water infrastructure investment planning within the Water-Energy-Food-Climate Nexus”, Zenodo, https://doi.org/10.5281/zenodo.2646476, 2019b.
Payet-Burin, R., Bertoni, F., Davidsen, C., and Bauer-Gottwein, P.: Optimization of regional water – power systems under cooling constraints and climate change, Energy, 155, 484–494, https://doi.org/10.1016/j.energy.2018.05.043, 2018.
Pereira-Cardenal, S. J., Mo, B., Gjelsvik, A., Riegels, N. D., Arnbjerg-Nielsen, K., and Bauer-Gottwein, P.: Joint optimization of regional water-power systems, Adv. Water Resour., 92, 200–207, https://doi.org/10.1016/j.advwatres.2016.04.004, 2016.
Qwist-Hoffmannn, P. and McIntyre, O.: Transboundary water law and policy : exchanging experiences across African River Basin Organisations, Eschborn, Germany, available at: https://transboundarywaters.science.oregonstate.edu/sites/transboundarywaters.science.oregonstate.edu/files/Publications/GIZ 2016 Water Law and Policy in Transboundary Basins.pdf (last access: 27 September 2019), 2016.
Robinson, S., Mason-D'croz, D., Islam, S., Sulser, T. B., Robertson, R., Zhu, T., Gueneau, A., Pitois, G., and Rosegrant, M.: The International Model for Policy Analysis of Agricultural Commodities and Trade (IMPACT): Model Description for Version 3, IFPRI Discussion Paper 1483, International Food Policy Research Institute (IFPRI), Washington, D.C., available at: http://ebrary.ifpri.org/cdm/ref/collection/p15738coll2/id/129825 (last access: 27 September 2019), 2015.
SADC: Southern African Development Community Revised Protocol on Shared Watercourses, Revised Protocol on Shared Watercourses in the Southern African Development Community (SADC), 1–12, available at: http://www.internationalwaterlaw.org/documents/regionaldocs/Revised-SADC-SharedWatercourse-Protocol-2000.pdf (last access: 27 September 2019), 2000.
SADC, ZAMCOM and SARDC: Zambezi Environmental Outlook, Harare, Gaborone, 2015.
Sahu, R. K.: Optimal Reservoir Operation using Stochastic Model Predictive Control, Signature redacted Co-Director, Computation for Design and Optimization Program, Massachusetts Institute of Technology, Libraries Archives, 2016.
SAPP: South African Power Pool, Annual Report 2015, Harare, Zimbabwe, available at: http://www.sapp.co.zw/annual-reports (last access: 27 September 2019), 2015.
SAPP: Transfer Limits – Southern African Power Pool, available at: http://www.sapp.co.zw/transfer-limits, last access: 31 July 2018.
Sheffield, J., Goteti, G., and Wood, E. F.: Development of a 50-year high-resolution global dataset of meteorological forcings for land surface modeling, J. Climate, 19, 3088–3111, https://doi.org/10.1175/JCLI3790.1, 2006.
Spalding-Fecher, R., Joyce, B., and Winkler, H.: Climate change and hydropower in the Southern African Power Pool and Zambezi River Basin: System-wide impacts and policy implications, Energ. Policy, 103, 84–97, https://doi.org/10.1016/j.enpol.2016.12.009, 2017a.
Spalding-Fecher, R., Senatla, M., Yamba, F., Lukwesa, B., Himunzowa, G., Heaps, C., Chapman, A., Mahumane, G., Tembo, B., and Nyambe, I.: Electricity supply and demand scenarios for the Southern African power pool, Energ. Policy, 101, 403–414, https://doi.org/10.1016/j.enpol.2016.10.033, 2017b.
Strzepek, K., McCluskey, A., Boehlert, B., Jacobsen, M., and Fant IV, C.: Climate Variability and Change: A basin scale indicator approach to understanding the risk of climate variability and change: to water resources development and management, World Bank, Washington, DC, 1–139, 2011.
Tharme, R. E.: A global perspective on environmental flow assessment: Emerging trends in the development and application of environmental flow methodologies for rivers, River Res. Appl., 19, 397–441, https://doi.org/10.1002/rra.736, 2003.
Thornes, J. E.: IPCC, 2001: Climate change 2001: impacts, adaptation and vulnerability, Contribution of Working Group II to the Third Assessment Report of the Intergovernmental Panel on Climate Change, edited by: McCarthy, J. J., Canziani, O. F., Leary, N. A., Dokken, D. J., and White, K. S., Int. J. Climatol., 22, 1285–1286, https://doi.org/10.1002/joc.775, 2002.
Tilmant, A. and Kinzelbach, W.: The cost of noncooperation in international river basins, Water Resour. Res., 48, W01503, https://doi.org/10.1029/2011WR011034, 2012.
Tilmant, A., Goor, Q., and Pinte, D.: Agricultural-to-hydropower water transfers: sharing water and benefits in hydropower-irrigation systems, Hydrol. Earth Syst. Sci., 13, 1091–1101, https://doi.org/10.5194/hess-13-1091-2009, 2009.
Tilmant, A., Kinzelbach, W., Juizo, D., Beevers, L., Senn, D., and Casarotto, C.: Economic valuation of benefits and costs associated with the coordinated development and management of the Zambezi river basin, Water Policy, 14, 490–508, https://doi.org/10.2166/wp.2011.189, 2012.
UN General Assembly: Transforming our world: the 2030 Agenda for Sustainable Development, available at: https://sustainabledevelopment.un.org/content/documents/21252030 Agenda for Sustainable Development web.pdf (last access: 27 September 2019), 2015.
Van Vliet, M. T. H., Wiberg, D., Leduc, S., and Riahi, K.: Power-generation system vulnerability and adaptation to changes in climate and water resources, Nat. Clim. Change, 6, 375–380, https://doi.org/10.1038/nclimate2903, 2016.
World Bank: The Zambezi River Basin, World Bank, 4, 1–202, https://doi.org/10.4324/9781315282053, 2010.
Yates, D., Sieber, J., Purkey, D., and Huber-Lee, A.: WEAP21 – A demand-, priority-, and preference-driven water planning model. Part 1: Model characteristics, Water Int., 30, 487–500, https://doi.org/10.1080/02508060508691893, 2005.
- Abstract
- Introduction
- Methodology of the decision support tool
- The Zambezi River basin study case
- Results and discussion
- Limitations and further research
- Conclusion
- Code and data availability
- Author contributions
- Competing interests
- Acknowledgements
- Financial support
- Review statement
- References
- Supplement


