the Creative Commons Attribution 4.0 License.
the Creative Commons Attribution 4.0 License.
 | 19 Oct 2018
Future hot-spots for hydro-hazards in Great Britain: a probabilistic assessment
Shaun Harrigan
Christel Prudhomme
Giuseppe Formetta
Lindsay Beevers
In an increasing hydro-climatic risk context as a result of climate change, this work aims to identify future hydro-hazard hot-spots as a result of climate change across Great Britain. First, flood and drought hazards were defined and selected in a consistent and parallel approach with a threshold method. Then, a nation-wide systematic and robust statistical framework was developed to quantify changes in frequency, magnitude, and duration, and assess time of year for both droughts and floods, and the uncertainty associated with climate model projections. This approach was applied to a spatially coherent statistical database of daily river flows (Future Flows Hydrology) across Great Britain to assess changes between the baseline (1961–1990) and the 2080s (2069–2098). The results showed that hydro-hazard hot-spots are likely to develop along the western coast of England and Wales and across north-eastern Scotland, mainly during the winter (floods) and autumn (droughts) seasons, with a higher increase in drought hazard in terms of magnitude and duration. These results suggest a need for adapting water management policies in light of climate change impact, not only on the magnitude, but also on the timing of hydro-hazard events, and future policy should account for both extremes together, alongside their potential future evolution.
- Article
(5127 KB) - Full-text XML
-
Supplement
(1203 KB) - BibTeX
- EndNote


Hydrological extremes, floods and droughts, cause significant economic damages and pose risks to lives worldwide (Quesada-Montana et al., 2018). In the United Kingdom (UK), the government has estimated that annual flood damages of GBP 1.1 billion are anticipated and, maintaining the current levels of flood defense, would cost up to as much as GBP 27 billion by 2080 (UK Parliament, 2013). At the same time, the UK's vulnerability to drought hazard has reached the warning threshold for the Water Exploitation Index that defines it as a water-stressed country (EEA, 2008), and the financial impact of the recent drought of 2011/12 was GBP 70–165 million. These risks, alongside their likely exacerbation associated with the future climate, have been recognized by the UK Government Water White Paper (HM Government, 2011), which highlights that “drought conditions are likely to be more common”. These concerns are reflected in the Environment Agency research priorities (Environment Agency, 2014) where “understanding of hydro-hazards and their impact on people” within a changing climate is an area of critical importance to the nation. More recently, the Committee on Climate Change identified flooding and water supply shortage as two of the UK's most important climate change risks (ASC, 2016), their future high-magnitude risks estimated with high confidence, suggesting that more action is urgently needed to face these issues.
Hydrological hazards are influenced by climatic and hydrological factors (e.g. rainfall patterns and intensity, land use, soil and bedrock); accounting for their potential future changes into new development is hence essential to design resilient cities and their supporting infrastructure (Bai et al., 2018). However, detecting changes in observed records is complex. For example, observed records show increases in extreme precipitation over the past 50–60 years across the UK (Maraun et al., 2008) and in high river flows in western Britain (Hannaford and Marsh, 2008; Harrigan et al., 2018), but no substantial changes were found for flood magnitude (Hannaford and Marsh, 2012). In parallel, potential evapotranspiration has increased in all regions of Great Britain between 1961 and 2012, mainly driven by rising air temperature, with the strongest increases in spring and for England (Robinson et al., 2017). Rainfall intensity has increased in the winter and to a lesser extent during spring and autumn, while summer intensities have reduced. Historic precipitation records in the UK show diverging seasonal trends (increasing winter and decreasing summer precipitations; see Burt et al., 2016) and later winter storms across the North Sea (Blöschl et al., 2017). Trends in extreme river flow (frequency and magnitude) have strong regional and geographical patterns, with low-flow magnitude between 1963 and 2014 showing a prominent spatial gradient with increases in the northwest and decreases in the southeast (Harrigan et al., 2018). Whilst trends are not always statistically significant everywhere, these changing patterns make future water management decisions difficult.
Evidence of trends in the past hydro-climatic records suggests a non-stationary regime. This means that using historic records is unlikely to be sufficiently robust when planning water resource management several decades ahead. Future planning should consider the possible evolution of the climate when estimating future hydro-hazards. Climate models are tools designed to provide scenarios of possible future precipitation and temperature patterns, which can be used to drive hydrological models and understand potential evolution of future hydro-hazards (Augustin et al., 2008; Arnell and Gosling, 2016; Roudier et al., 2016; Collet et al., 2017). Studies suggest that climate change is expected to increase return period flow magnitude (e.g. Kay et al., 2014a, b; Collet et al., 2017, 2018; Kundzewicz et al., 2017), but there is significant uncertainty associated with these projections, partly due to the uncertainties in the climate signal and the impact modelling chain (Kundzewicz et al., 2018). Drought patterns are also expected to be impacted, for example due to projected increases in dry spells and potential evapotranspiration (Trenberth, 2011; Fischer et al., 2013). Future changes in meteorological drought (Rahiz and New, 2013) and hydrological drought (Prudhomme et al., 2012a) in Great Britain show a mixed pattern, with increases found for both across the country in the summer, but largest in the north and west.
In the UK, most regions suffer from both floods and droughts, and can even be impacted simultaneously (e.g. the 2010–2012 hydrological transformation in the southern UK; see Parry et al., 2013). Recent work on changes in observed floods and droughts using different approaches (e.g. the return-period method across the UK in Burt et al., 2016, and the threshold level approach on one catchment at the monthly time step in Quesada-Montano et al., 2018) shows a growing need for and interest in understanding changes in hydrological dynamics across the full flow regime. Moreover, understanding the possible future evolution of both hydro-hazards is critical for building resilient solutions to climate change. This is particularly important for regions expected to become even more at risk of both floods and droughts, as these would be “hot-spots” where resilience to hydro-hazards must be strengthened and water management plans adapted to anticipate climatic changes. However, floods and droughts are generally considered independently in water management planning. To our knowledge there is no analysis to date investigating possible future changes in the frequency, magnitude, and duration of both hazards in Great Britain using a consistent methodology, nor investigating whether increases in both floods and droughts are expected in the same part of the country or whether the hazards are geographically distinct.
This work aims to identify future hot-spots across Great Britain expected to be impacted by an increase in both floods and droughts. We develop and apply a nation-wide systematic, consistent and robust statistical framework to quantify changes in frequency, magnitude, duration, and time of year of both drought and flood, and their associated uncertainty.
2.1 The Future Flows Hydrology dataset
The Future Flows Hydrology (FFH) database (Prudhomme et al., 2013) is currently the only nation-wide, consistent, probabilistic future transient hydrological projection available for the UK. Future Flows Hydrology is derived from the Future Flows Climate (Prudhomme et al., 2012b), a national, 11-member ensemble projection derived from the UK Met Office Hadley Centre's HadRM3-PPE ensemble projection. HadRM3-PPE-UK was developed as part of the derivation of the UKCP09 scenarios (Murphy et al., 2007) and designed to represent parameter uncertainty in climate change projections through a parameter variant experiment, and was run under the SRES A1B emissions scenario (see Murphy et al., 2009, which details the climate model perturbations). Future Flows Climate was used as forcing for three hydrological models (CERF – Griffiths et al., 2006; PDM – Moore, 2007; and CLASSIC – Crooks and Naden, 2007) to create the Future Flows Hydrology database, which contains an 11-member ensemble of transient projections of daily river flow for 281 catchments from January 1951 to December 2098. Each FFH member is associated with a single realization from a different variant of HadRM3, each member representing an equally probable, plausible realization of the future (Murphy et al., 2007).

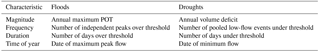
Figure 1Selection and characterization in terms of frequency, magnitude, duration, and time of year of (a) floods (HF: high-flow event, AMAX: annual maximum POT) and (b) droughts (LF: low-flow event).
2.2 Hydro-hazard analytical framework: event extractions
Each daily river flow series was analysed across the 11 ensemble members to detect changes in high and low flows between two time periods: the baseline (1961–1990) and the 2080s (2069–2098). A threshold-based method was applied to both flood and drought hazards, to ensure consistency and comparability of results (see Fig. 1 and Table 1). For floods we used the peak over the threshold (POT) series (Stedinger el al., 1993; Robson and Reed, 1999) and for droughts its equivalent, the Inter-event time and volume Criterion (IC) method (see e.g. Gustard and Demuth, 2009). High- and low-flow thresholds were defined to obtain on average three independent events per year on the baseline period, with the same threshold applied for the 2080s period.
Flood characteristics (frequency, magnitude, duration, and time of year; see Table 1) were analysed following the peak-over-threshold method of Bayliss and Jones (1993). Here, each ensemble member discharge simulation was treated independently, with a threshold selected for each member so that an average of three independent flood events per year could be identified during the baseline period, a flood event being the period when the daily discharge curve is continuously above the threshold (dashed line in Fig. 1a; see for example high-flow event number 1). The mean number of three POTs per year has been fixed to compute the threshold in the baseline period, and the same threshold is used in the 2080s; hence, the mean number of independent events in the 2080s could change. For each independent flood event, peak magnitude (highest daily discharge within the period), duration (number of days of the event) and date of highest peak (high-flow event number 2 in Fig. 1a) were extracted.
Drought characteristics (frequency, magnitude, duration, and time of year; see Table 1) were analysed following the method from Gustard and Demuth (2009) using R package “lfstat” (available at https://cran.r-project.org/web/packages/lfstat/index.html, last access: 10 October 2018, R version 3.4.4 and lfstat package version 0.9.4). As for floods, each ensemble member was treated independently. Here, after a sensitivity analysis on drought event frequency, a daily varying Q90 threshold (i.e. the flow which was equalled or exceeded 90 % of the time over each Julian day across the 30-year baseline) was applied to select on average three independent low-flow events per year on the baseline (see grey line in Fig. 1b). Dependent events were pooled together applying the IC method (Gustard and Demuth, 2009) using a minimum of 5 days' inter-event time, and a 0.1 ratio between inter-event excess volume and preceding deficit volume. For each pooled low-flow event, magnitude (water volume deficit, i.e. the amount of water between the daily Q90 threshold and the daily discharge; see grey areas), duration (number of days the daily discharge curve is below the daily Q90 curve; see low-flow event number 2) and dates (date of the minimum discharge during a low-flow event; see low-flow event number 3) were extracted (see Fig. 1b and Table 1). Since the threshold used to detect low flows varies at a daily time step, both summer and winter events were selected. This supports the need to understand water volume deficit across the year to comprehend drought risk. Indeed, summer water deficits clearly became stronger in the twentieth century in Great Britain as a result of increasing temperatures mainly, although winter rainfall – and potentially winter flows – influences groundwater recharge and reservoir supply particularly in England and Wales (Marsh et al., 2007; Fowler and Kilsby, 2002).
Finally, summary characteristics for each flood and drought series were calculated for both the baseline and 2080s periods (see Table 1): frequency as the mean number of independent events per year; magnitude as the mean annual maximum POT (floods) and annual cumulative water deficit (droughts); duration as the mean annual cumulative duration of all events. In addition, two time of year metrics were extracted from dates of max/min flows using circular statistics following the approach of Bayliss and Jones (1993) and the Institute of Hydrology (1999): (i) the “mean day of year” of events and (ii) the concentration of dates around the mean day of year, known as “seasonality”, with values ranging between 0 for when floods/droughts are widely dispersed throughout the year (no concentration) and 1 when floods/droughts occur on the same day each year in the record (see e.g. Formetta et al., 2018, calculation detailed in the Supplement).
2.3 Hydro-hazard hot-spot assessment
Hydro-hazard hot-spots were selected based on changes in flood and drought characteristics from the baseline to the 2080s. First, the frequency, magnitude, duration, and time of year were computed for each ensemble member for both the baseline and 2080s periods. Changes in floods and droughts in terms of frequency, magnitude, and duration were quantified as the differences between the baseline and 2080s values, which were computed for the 10th, 50th, and 90th percentiles of the 11-member distributions (Fig. 2). Uncertainty in the signal of change was quantified as the range of changes computed across the three investigated percentiles.
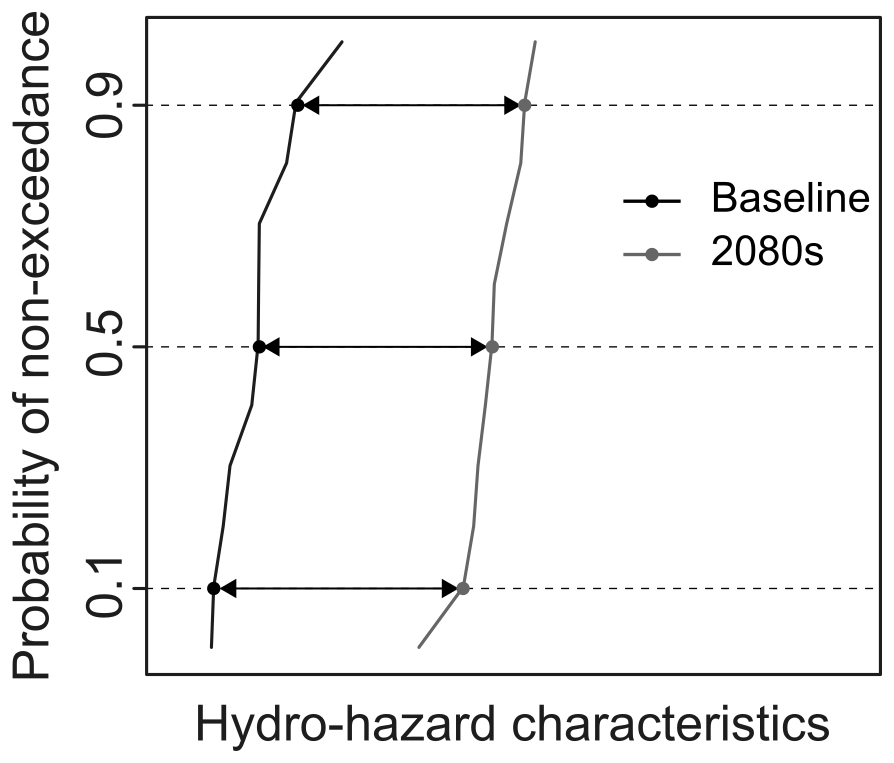
Figure 2Quantification of signal of change in a hydro-hazard characteristic, as the difference between the baseline and 2080s cumulative distribution functions for the 10th, 50th, and 90th percentiles (dotted lines).
Next, hot-spots were identified across the UK based on prominent changes in flood and drought characteristics for each of the 10th, 50th, and 90th percentiles (see Fig. 3). A catchment was defined as a hot-spot if, for both floods and droughts, it showed an increase in
-
frequency (above +1 day year−1; see Fig. 3a),
-
AND in magnitude (above 5 %; see Fig. 3b),
-
AND in duration (above +1 day year−1 for floods, above +5 days year−1 for droughts; see Fig. 3c).
These thresholds were chosen after a sensitivity analysis (not shown here) to find an acceptable number of catchments for each percentile (e.g. a too-high threshold would reduce the number of catchments corresponding to the 10th percentile and a too-low threshold would not discriminate hot-spot catchments, increasing their numbers to a majority for the 90th percentile). Note that in terms of duration, since floods are by nature shorter events, an increase in duration by 1 day year−1 was found to be a reasonable discriminator, whereas a larger increase in duration of drought events was necessary to characterize changes in these events. The resulting catchments were mapped for each percentile and the changes in each characteristic were analysed spatially. The hot-spot definition aims to clarify the question “Where should we anticipate an increase in hydro-hazards as a result of climate change and adapt our water resource management?” By doing so, we assume locations with a high probability of hydro-hazards under the current climate are already managed, known as at-risk by decision-makers, and hence do not require highlighting. Instead, our methodology aims to focus on locations where these risks would intensify or emerge in a changing climate.
Finally, the times of year (i.e. the mean day of year and seasonality) of these events in the 2080s were mapped for the hot-spot catchments, for each percentile. This shows the month when these hydro-hazards would happen in order to analyse how the hydrological regime would change with climate change, i.e. characterizing when these extremes would intensify across the year.
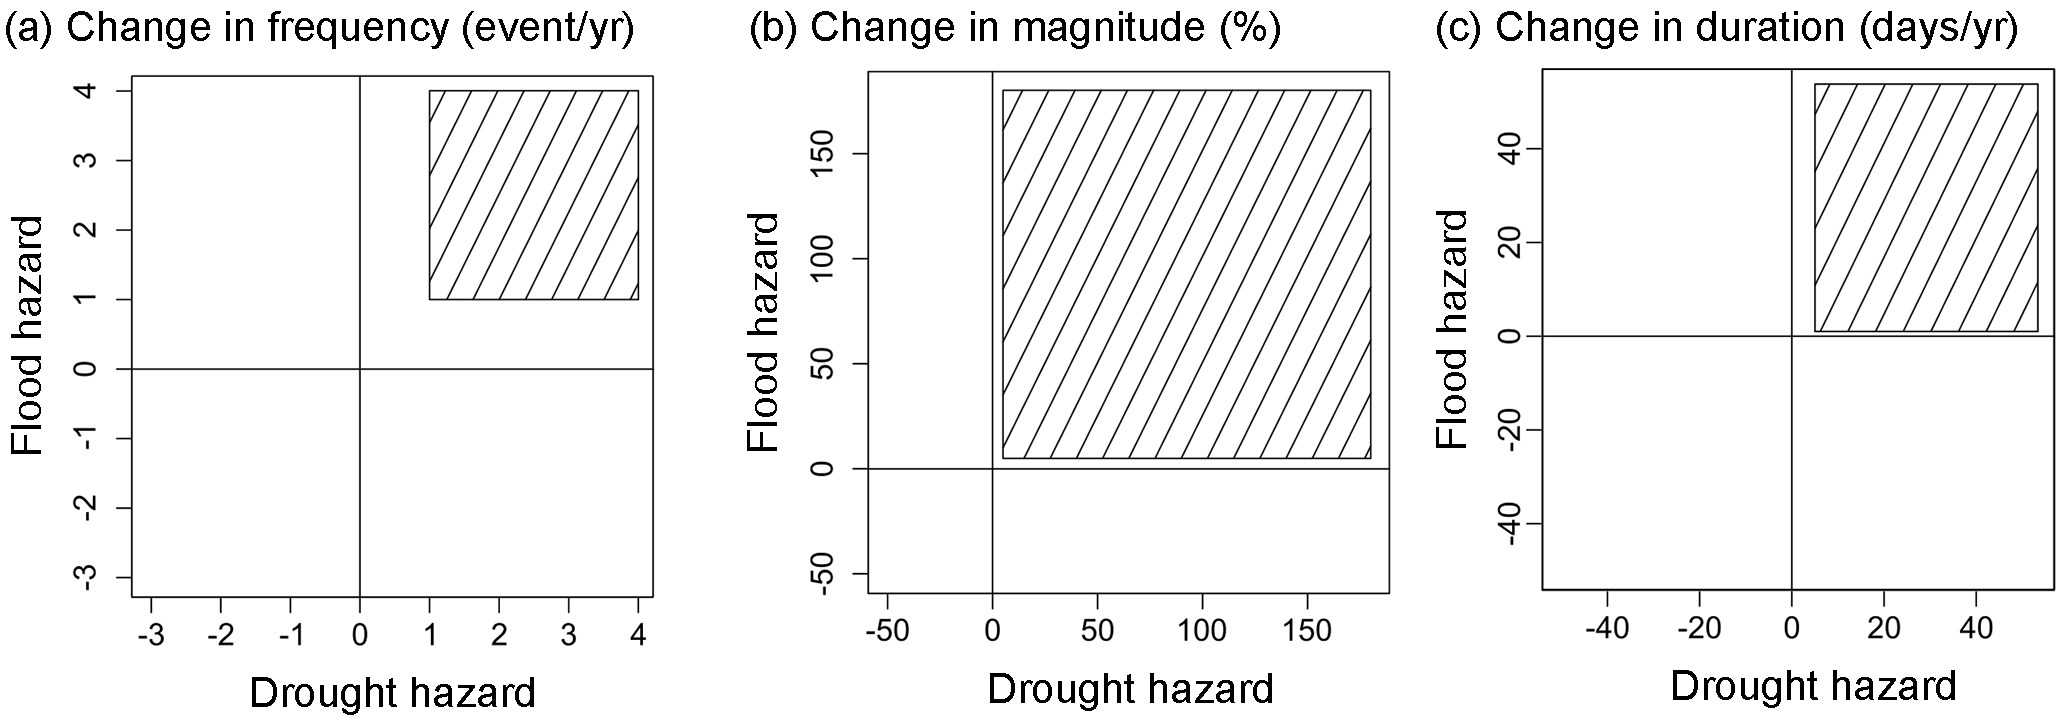
Figure 3Selection of hot-spots based on changes in (a) frequency, (b) magnitude, and (c) duration of both flood and drought hazards (dashed areas).
3.1 Hydro-hazard hot-spots
Figure 4 shows the catchments identified as hydro-hazard hot-spots in Great Britain for the 10th (Fig. 4a), 50th (Fig. 4b), and 90th (Fig. 4c) percentiles across the 11 ensemble members of the Future Flows Hydrology database. Only two catchments were identified for the 10th percentile (Fig. 4a) in Wales (Gwili River at Glangwili) and Scotland (Ruchill Water at Cultybraggan). For the 50th percentile, representing the median trend across the 11 climatic projection ensemble members, 48 catchments are defined as hot-spots (Fig. 4b), mainly located on the western coast and in the northeast of Scotland. The 90th percentile shows 135 catchments (Fig. 4c) spread throughout Great Britain. These hot-spots are the result of a combination of changes in drought and flood characteristics, which are detailed in the following sections.
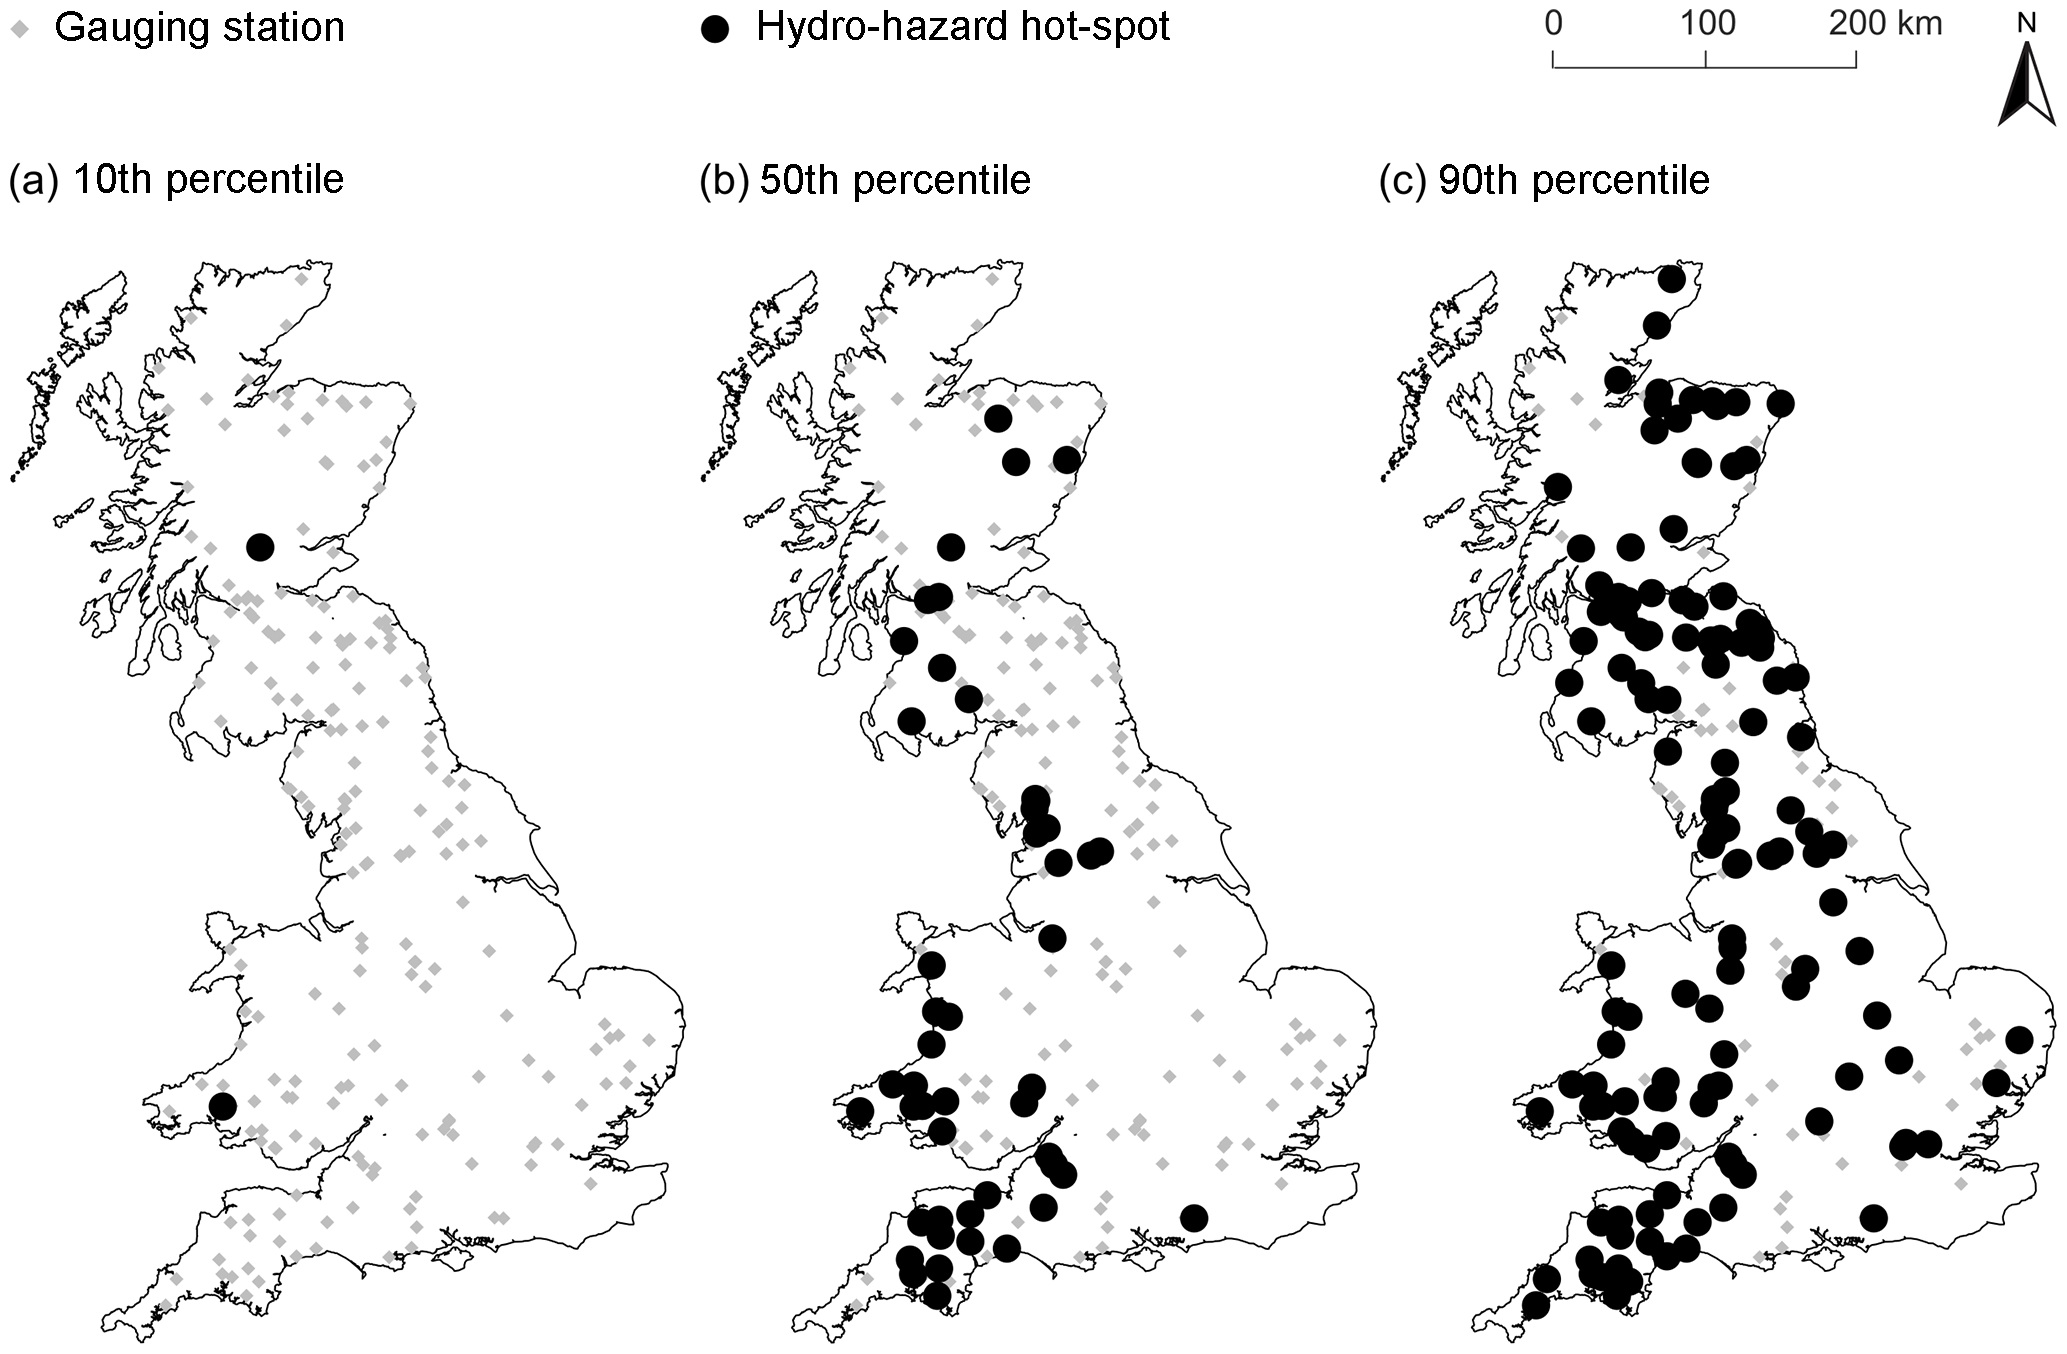
Figure 4Hydro-hazard hot-spots in Great Britain for the (a) 10th, (b) 50th, and (c) 90th percentiles.

Figure 5Changes in frequency of the hydro-hazards for the hot-spots in Great Britain for the (a) 10th, (b) 50th, and (c) 90th percentiles.
3.2 Changes in frequency
Figure 5 shows the changes in frequency of the hydro-hazard for the hot-spots across Great Britain depicted in Fig. 4. For the 10th percentile, the two hot-spot sites show increases in the frequency of floods and droughts of between one and two events per year by the 2080s (see Fig. 5a). For the 50th percentile, the majority of the 48 identified hot-spots show an increase in frequency of floods and droughts of one to two events per year (see Fig. 5b). Three sites (two in the southwest of England and one in Wales) show an increasing frequency of two to three events per year for floods only and one site in Wales shows the same increase for droughts only. For the 90th percentile, sites in the southwest of England, Wales, and the northeast of Scotland show a greater increase (two to three events per year) for flood events than for drought (see Fig. 5c). Three sites in the southwest of England and one in the southwest of Scotland suggest an increase in frequency by three to four events per year for floods, while droughts at the same location increase in frequency by one to two events per year. The spatial distribution of increasing frequency of droughts is different, with increases (two to three events per year) notable across the central belt in Scotland, central England, and Wales, whilst flood increases are generally lower, at one to two events per year. In general there is reasonable agreement across the ensemble members for the hot-spots, suggesting constrained uncertainty in frequency increases.
3.3 Changes in magnitude
Figure 6 shows the changes in hydro-hazard magnitude for the identified hot-spots across Great Britain. For the 10th percentile, both hot-spot sites show contrasting results (see Fig. 6a). For the Scottish site both floods and droughts are likely to experience an increase in magnitude of between 5 % and 20 %, while for the Welsh site floods increase by a much lower magnitude (5 %–20 %) than droughts (100 %–150 %). For the 50th percentile, a clear trend in more severe droughts is emerging (see Fig. 6b). The hot-spot sites suggest an increase in drought magnitude in southwestern and northwestern England, Wales, and northeastern Scotland of between 50 % and 150 %, whilst flood magnitude increases are significantly less with the majority of sites, increasing by 5 %–20 % and only 11 sites showing an increase in magnitude of 20 %–50 %. For the 90th percentile (Fig. 6c), all hot-spot sites suggest an increasing drought magnitude above 20 % (with the exception of four stations in the south of England). Drought magnitude increases are most notable in the west of Great Britain, across the central belt, and in the northeast of Scotland. Flood magnitudes are more constrained, with all hot-spot sites suggesting an increase in magnitude of below 50 %. These results suggest that the increase in hydro-hazard magnitude may be more strongly evident in droughts in the future, although the uncertainty associated with this projection is higher (greater range in results at each station) for droughts than for floods.

Figure 6Changes in magnitude of the hydro-hazards for the hot-spots in Great Britain for the (a) 10th, (b) 50th, and (c) 90th percentiles.
3.4 Changes in duration
Figure 7 shows the changes in duration of the hydro-hazards for the hot-spots across Great Britain. Due to the nature of drought (i.e. its longer temporal signature) the level at which changes were screened was +5 days for drought and +1 day for floods (see Sect. 2.3). With that in mind, for the 10th percentile (Fig. 7a), both hot-spots suggest an increase in flood duration of 1–5 days per year, and an increase in droughts of 5–30 days per year. For the 50th percentile (Fig. 7b), the majority of the 48 identified hot-spots suggest an increase in droughts of between 5 and 30 days per year. Nine stations suggest a higher increase of between 30 and 55 days. These stations are located in southwestern England (7), Wales (1) and northeastern Scotland (1). All but two stations suggest an increase in flood duration of between 1 and 5 days per year. One station on the southern coast and one in Wales suggest a more severe increase in flood duration of between 5 and 30 days per year. For the 90th percentile (Fig. 7c), increases to drought duration are split between 5–30 days and 30–55 days. The more severe increases in duration are experienced in northeastern Scotland, northeastern England, through central England, Wales, and the southwest. Increases in flood duration remain predominantly between 1 and 5 days per year. Only a few stations suggest an increase above 5 days per year, and these are located in the southwest of England, peninsular Wales, one in central England, and one in northeastern Scotland. In general the increase in duration of flood events is much more constrained than for droughts. This is partly due to the longer temporal signature of drought phenomena, rather than floods, but is also due to the fact that Great Britain is a relatively small island, with small catchments and relatively short flood events.

Figure 7Changes in duration of the hydro-hazards for the hot-spots in Great Britain for the (a) 10th, (b) 50th, and (c) 90th percentiles.
3.5 Time of year of hydro-hazards in the 2080s
Figure 8 shows the hydro-hazard time of year for the identified hot-spots across Great Britain in the 2080s. For the 10th percentile (Fig. 8a), the mean day of year of floods falls in early winter (December), while droughts occur in early (September for the Scottish hot-spot) and late (November for the Welsh hot-spot) autumn. In the 2080s, the seasonality is much stronger for floods (0.4–0.6) than for droughts (below 0.4), suggesting flood events would more consistently occur in winter-time and the droughts' mean day of year is not significant for this percentile. For the 50th percentile (Fig. 8b), the majority of catchments show flood events occurring in winter-time (December or January) while droughts occur in autumn. Only eight hot-spots in northern Wales, northern England, and Scotland show floods and droughts both in autumn and one site in the northwest of England shows drought events in early spring. This shows that mean days of year are more consistent for floods than for droughts in the 2080s since the seasonality shows higher values for the former than the latter. The seasonality of these hot-spots is higher for floods (75 % of hot-spots above 0.6) than droughts (94 % of hot-spots below 0.4), showing flood events more concentrated in the winter-time, while droughts would be more spread out across the year. For the 90th percentile (Fig. 8c), Wales, England, and the southwest and northeast of Scotland show winter floods coupled with autumn droughts, while the northern and central belt of Scotland shows both floods and droughts in autumn. There is a national split with earlier events in the northwest of the country (late autumn for floods and early autumn for drought) and later events in the southeast of England (late winter for floods and late autumn for droughts). Once again the seasonality of these events is higher for floods (69 % of hot-spots above 0.6) than droughts (71 % of hot-spots below 0.4). For the identified hot-spots, the time of year is consistent across the ensemble members, showing a low uncertainty in this variable in the forcing signal from the regional climate model.
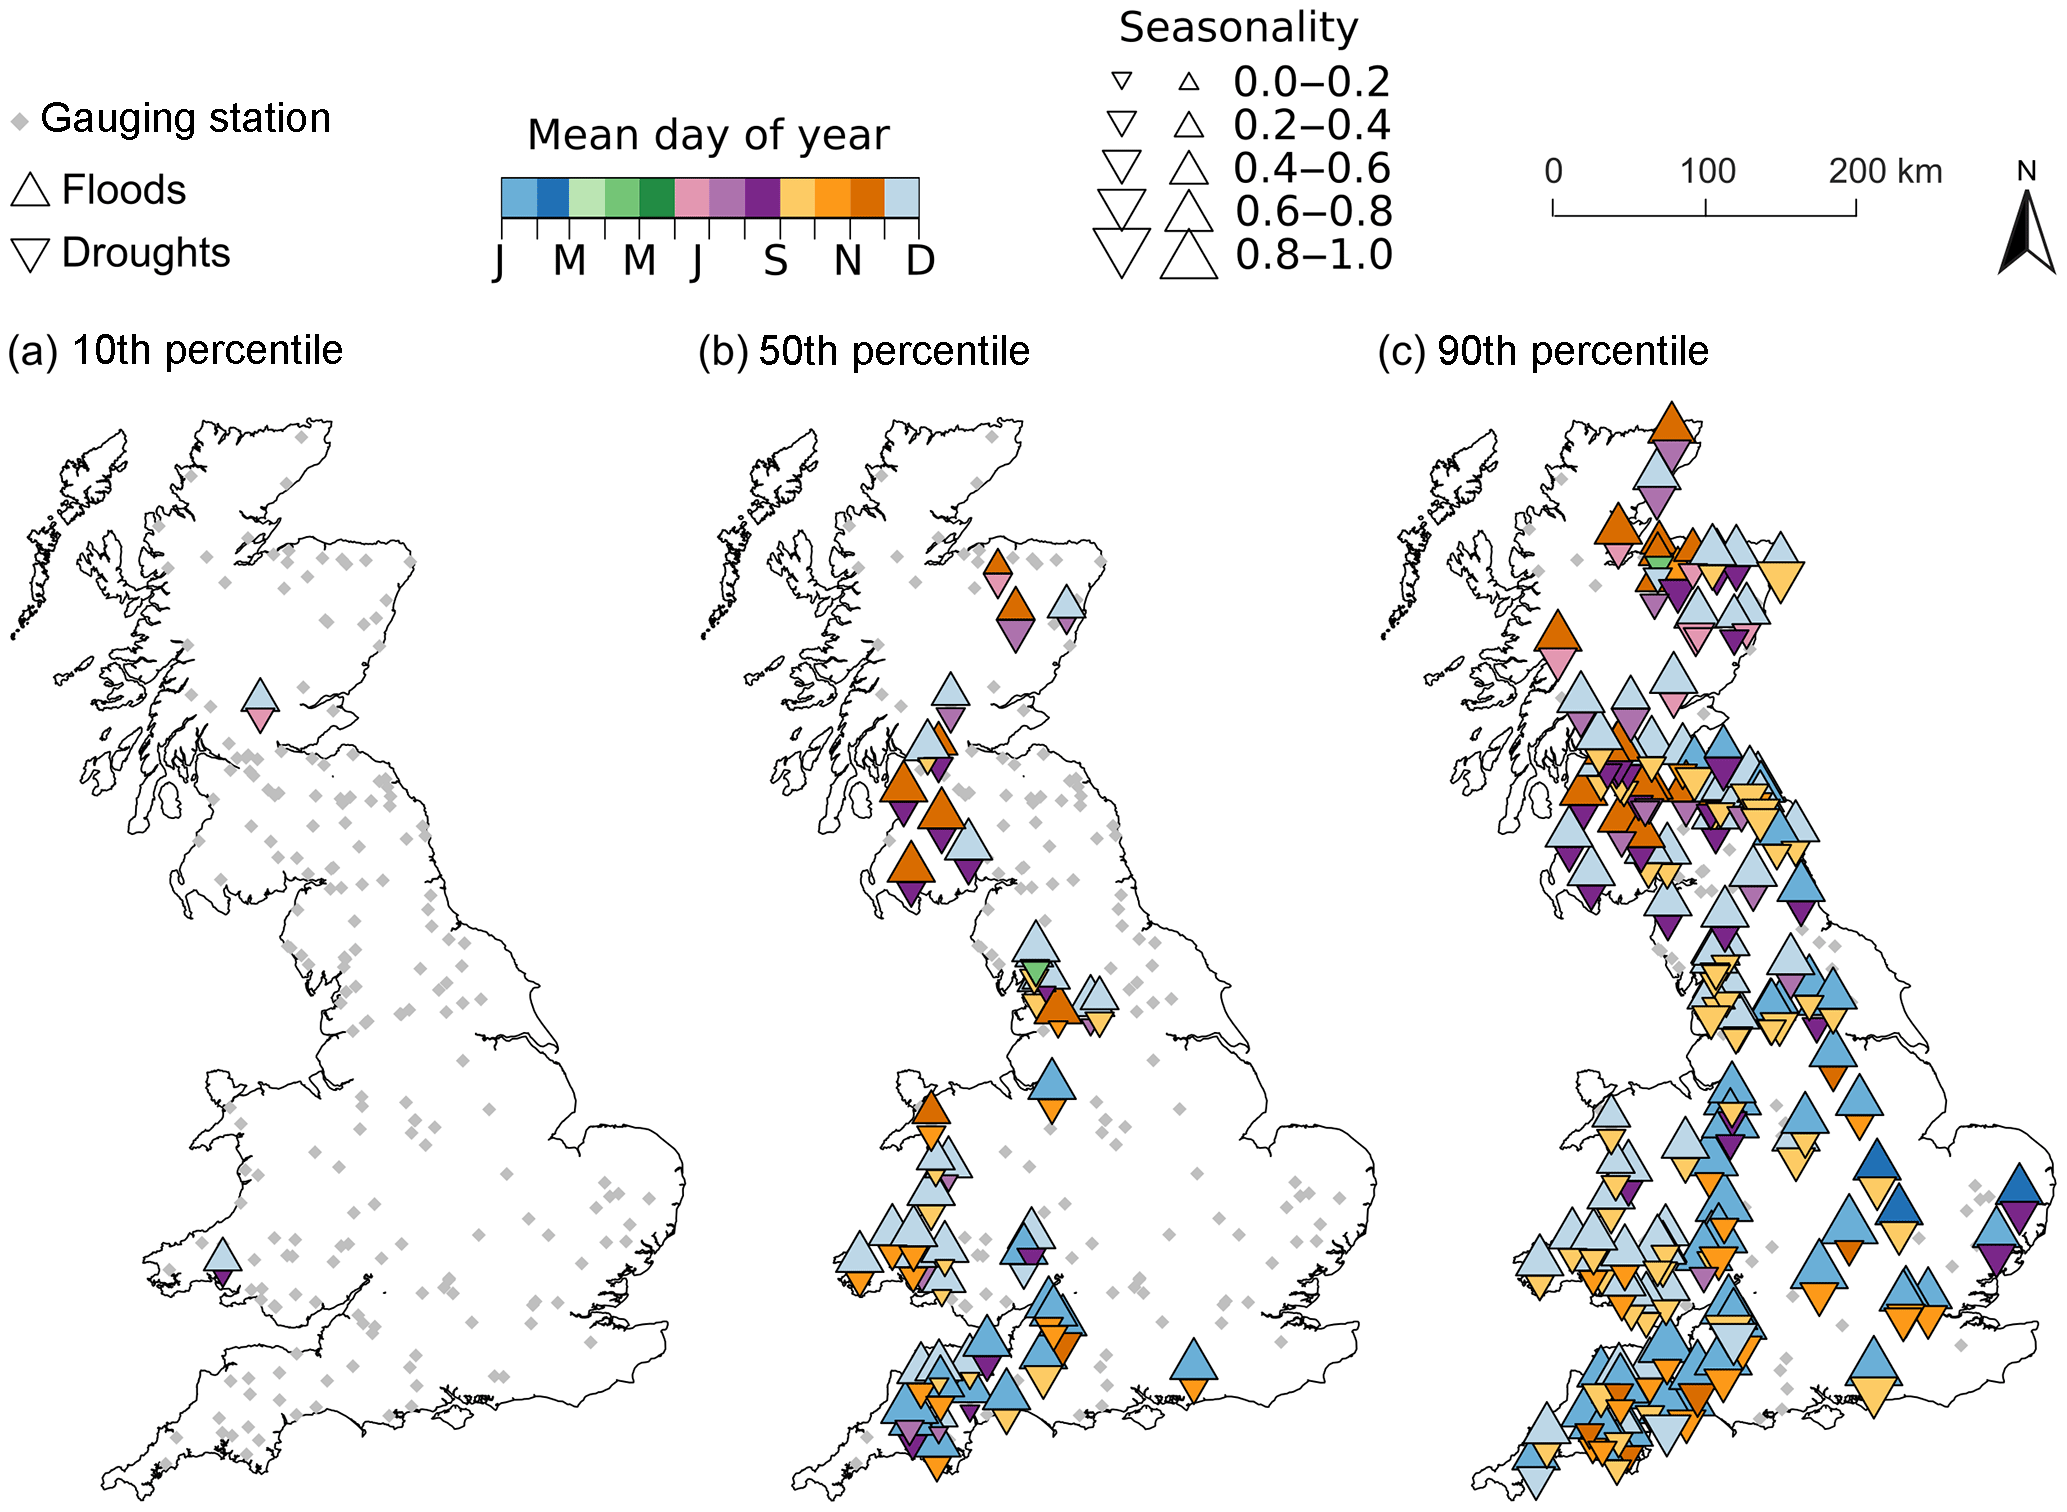
Figure 8Time of year (mean day of year in colour scale and seasonality in size scale) of the hydro-hazards for the hot-spots in Great Britain in the 2080s for the (a) 10th, (b) 50th, and (c) 90th percentiles.
4.1 Understanding hydro-hazard hot-spots
British hydro-hazard hot-spots are identified mainly along the western coast and in northern Scotland. Indeed, results show a marked northwest–southeast gradient across Great Britain for changes in both droughts and floods according to the FFH database. The western coast shows smaller but more likely increases in flood hazard in the 2080s (in terms of frequency, magnitude, and duration), and a higher increase in magnitude and duration in drought hazard from the baseline to the 2080s. In the baseline (see Fig. 9), the seasonality of droughts is very low (below 0.2 for all the stations of the 10th and 50th percentiles and below 0.4 for all the stations of the 90th percentile), showing that the mean day of year is not representative of these events, while for floods seasonality is high (above 0.6), showing these events occur mainly in late autumn (western coast and northeast of Scotland) and winter on the baseline. In the 2080s, while floods would still occur mainly during the late autumn and winter seasons, drought events would be more concentrated in autumn, with a significantly higher seasonality. This shows a likely intensification of hydrological extremes in this part of Great Britain that would imply a need to adjust water management plans for both hydro-hazards.
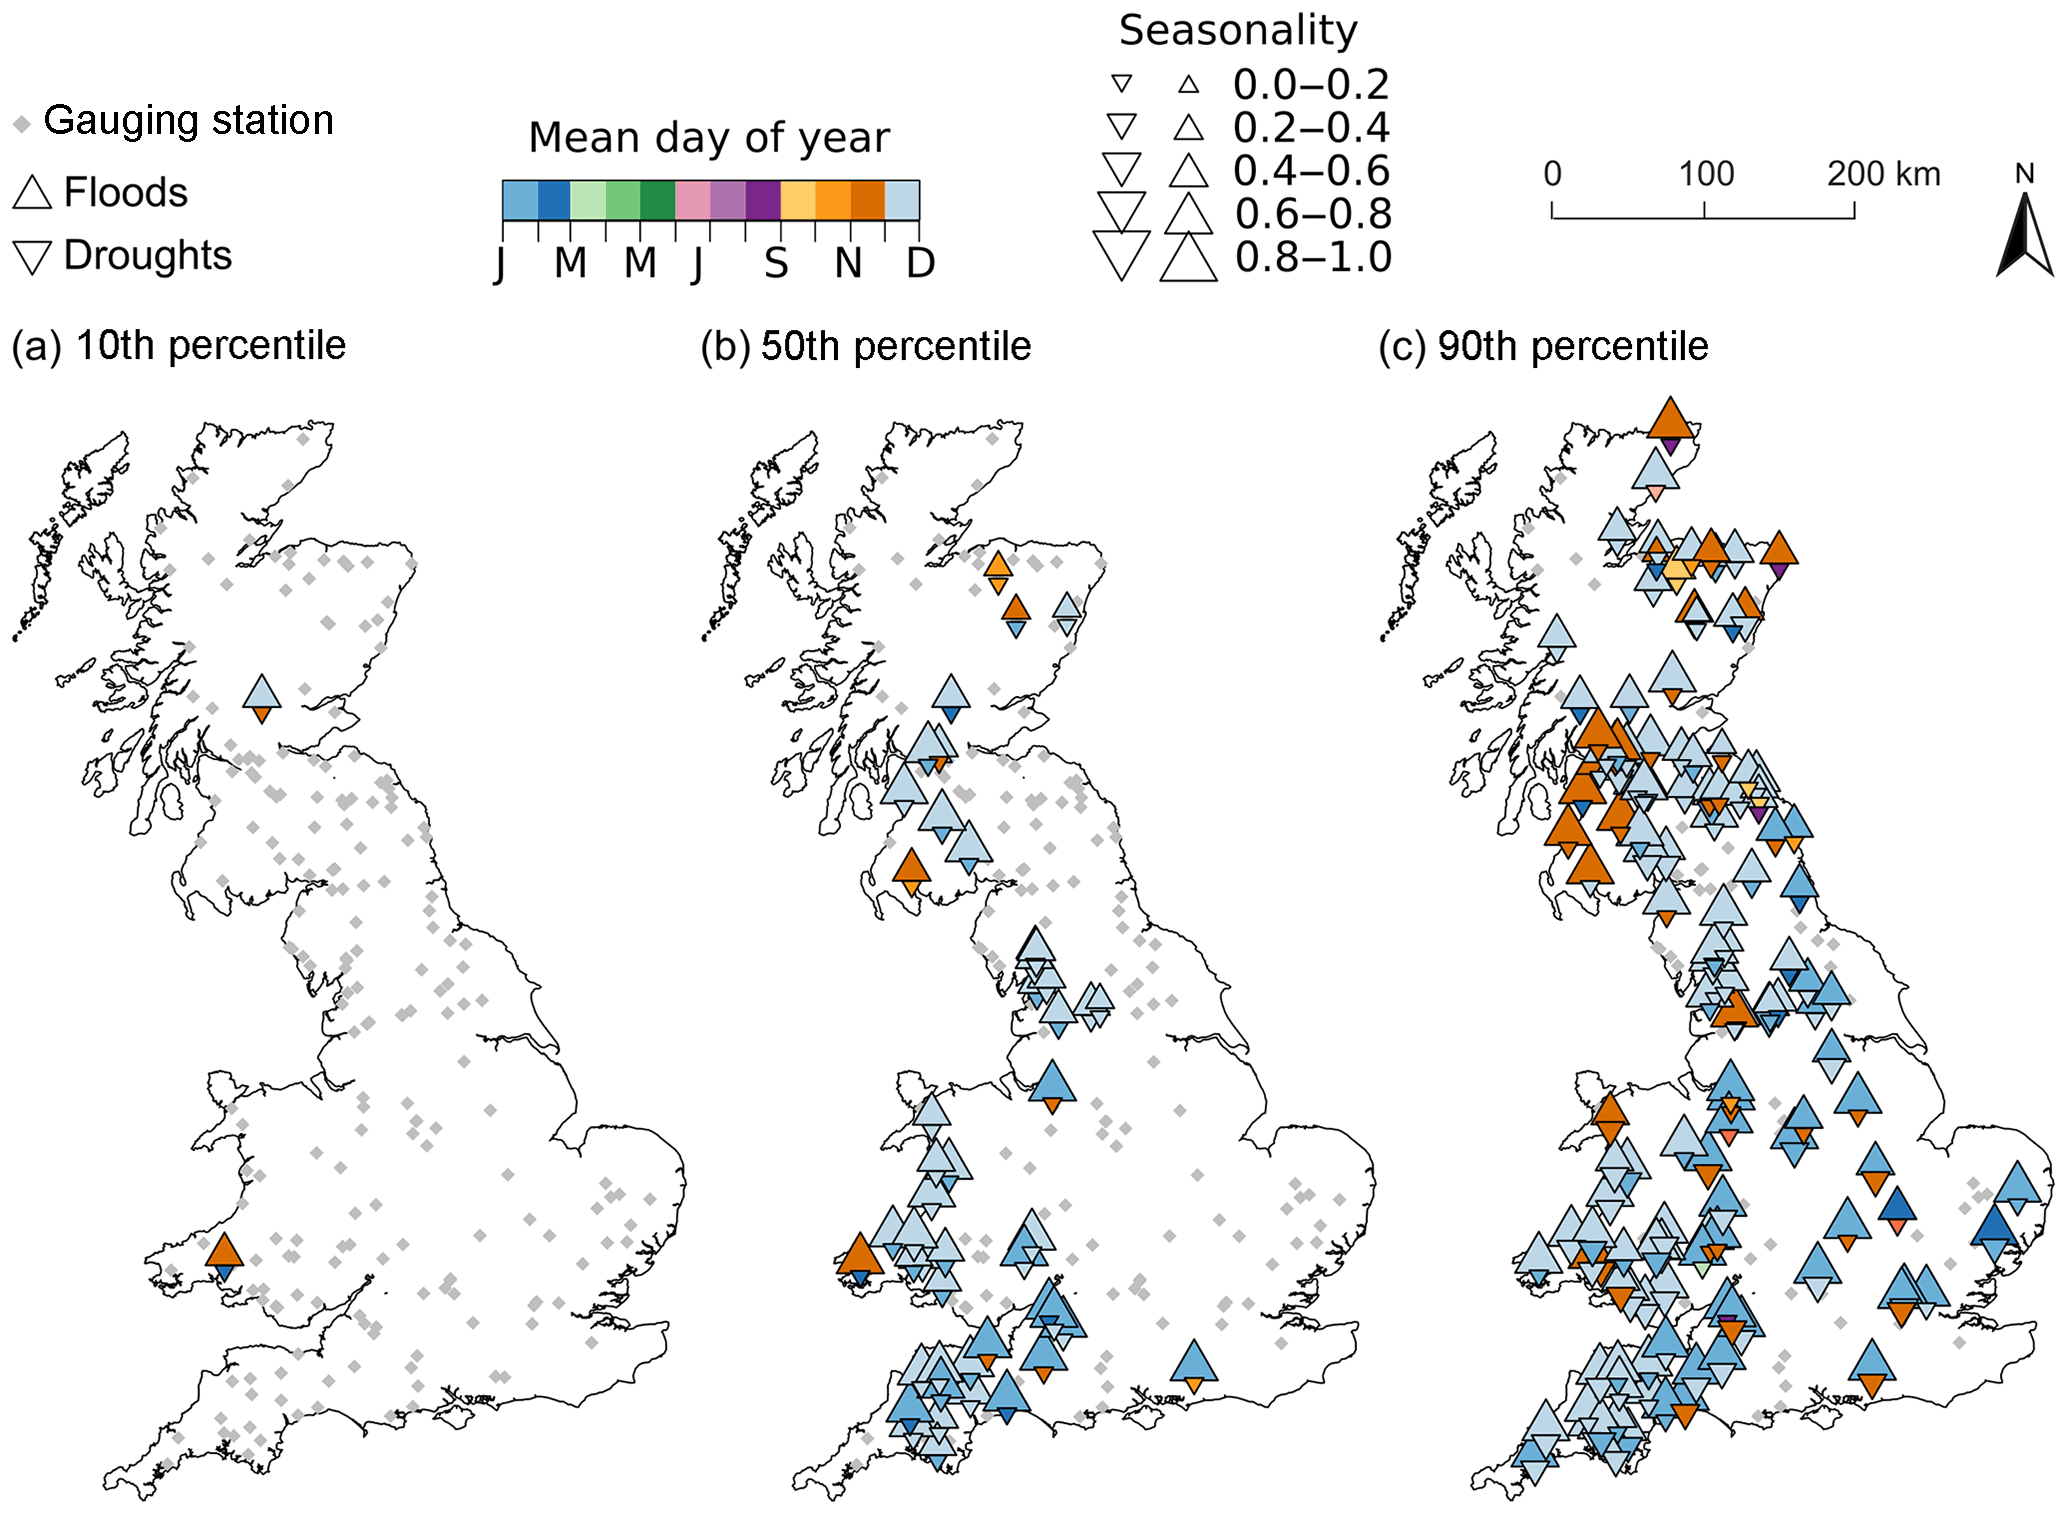
Figure 9Time of year (mean day of year in colour scale and seasonality in size scale) of the hydro-hazards for the hot-spots in Great Britain on the baseline for the (a) 10th, (b) 50th, and (c) 90th percentiles.
Increases in multi-day and extreme precipitations are expected as a result of climate change in the north and west of Great Britain (Wilby et al., 2008), which would translate into rising high-flow magnitude. Changes in 1:100-year return period events as a result of climate change showed a higher increase in the southeast of England (Collet et al., 2017), which is consistent with the spatial distribution of results in this study. These future changes would be the continuity of observed trends found in the literature. Harrigan et al. (2018) showed a significant increase in observed high flows over 1965–2014 across near-natural catchments in the United Kingdom, particularly in Scotland, which is explained by wetter winter and autumn seasons, and Blöschl et al. (2017) showed temporal shifts of observed floods to an earlier winter season in Scotland and northern England.
The changes in low flows are highly constrained by the Future Flows Climate (FFC) dataset, which was used to generate Future Flows Hydrology (Prudhomme et al., 2012b). Drought propagation from the meteorological signal to the hydrological signal can show a fair linearity in temperate climates, such as the British oceanic climate, being mainly driven by precipitation and temperature patterns (Van Loon et al., 2014), particularly for catchments with low influence from groundwater dynamics. For the medium scenario (A1B), the UKCP09 projections in the 2080s result in winter precipitations that suggest a higher increase in the southeast of England than on the western coast, while future summer precipitations range from a significant decrease to a slight increase, with a wider uncertainty in the south and southeast of England. Rahiz and New (2013) analysed changes in monthly precipitation series of the HadRM3-PPE-UK database, the same ensemble of regional climatic projections that were then downscaled to create the FFC dataset. Maps of drought intensity (DI) in the 2080s calculated based on the 6-month drought severity index show that the increase in hydrological drought found in their study for the west of Great Britain is mainly explained by an increase in DI in summer.
When analysing changes in each criterion (frequency, magnitude, and duration) separately (Figs. S1 for floods and S2 for droughts), we can see that for floods the increase in frequency is stronger on the western coast and in the southwest of England, while the increase in magnitude is more prominent in the south and southwest of England and duration shows very little changes compared to the other criteria, with the highest increases in the south of England and Wales and the north of Scotland (for the 90th percentile only). For droughts, changes in frequency show a similar spatial distribution (mainly along the western coast), and there is a strong gradient of changes in magnitude (that shows the highest increases compared to the other criteria) and duration, which are strongly correlated, with the highest increases in the diagonal going from the southwest of England up to the northeast of Scotland along the western coast of Wales and England. Interestingly, when applying the hot-spot analysis separately to each hazard (see Fig. S3), we can see that severe hot-spots (i.e. catchments selected for the three percentiles) are shown in the southwest of England and Wales and eastern Scotland for floods, and for droughts on the western coast of Wales, England, and Scotland, with two catchments on the eastern coast of Scotland. While there is roughly the same number of hot-spots for both hazards separately, catchments do not necessarily match when floods and droughts are analysed together.
Through a consistent analysis of changes in both the high and low extremes in terms of frequency, magnitude, duration, and time of year, this study brings new insights into plausible climate change impacts on hydro-hazards. This systematic approach across Great Britain highlights how both hazards evolve spatially in the future and quantifies the magnitude and temporal shifts of these changes. These outputs show a holistic overview of changes in hydrological seasonal variation. The statistical approach provides a direct insight into the uncertainty related to climatic projections and helps quantify the likelihood of such projections over the long term. These insights are crucial to anticipate future climate change impacts on the hydrological regime, and can help prepare improved adaptation plans in the context of increasing hydro-climatic risk. Consequently such analyses can inform water managers' future adaptation strategies and assist in anticipating new water infrastructure scheduling and timing.
4.2 Implications for water resource management
Results of this study showed that changes in high-flow magnitude and duration would vary spatially across Great Britain. This spatial distribution needs to be acknowledged by authorities for better flood risk management plans. Across Europe flood policy has generally adopted a risk-based approach through the EU Floods Directive 2007/60/EC to deal with future changes in flood hazard. As part of the directive, member states have prepared flood hazard maps and risk management plans in their region to anticipate changes in peak flows (Kundzewicz et al., 2012). In the UK, until 2016, climate change safety factors of 10 %–20 % (by 2025 and 2080 respectively) were adopted across the country (Reynard et al., 2017), which would underestimate the possible increase in high flows for many catchments. In 2016 these factors were updated to reflect the regional influence of geographic, geological, and hydrological factors on the climate change response across England and Wales (Scotland and Northern Ireland are in the process of changing their guidance). This new guidance recognizes the uncertainty in climate projections and subsequent responses by providing a range of uplift factors for different time periods and catchment regions (Kay et al., 2014a).
Moreover, changes in the hydrological cycle dynamics can lead to changes in the physical system and response of the river to meteorological events. An increase in frequency, as well as magnitude, of peak flows can significantly change the morphology of the river channel, through sediment transport (Pender et al., 2016). Changing flow regimes influence sediment transport rates, erosion, and depositional zones. These links mean that not only could more out of bank events occur, but that they may additionally trigger a change in river morphological response, resulting in areas of deposition in constrained urban channels. In turn this may change the channel shape and hence result in changes to flood protection design being overtopped, as the morphological considerations of channel change tend not to be included in flood risk assessments. Possible changes in both extreme flood and drought risks need to be investigated and monitored in local management plans to better anticipate future changes in the water cycle at the catchment scale.
While this study focused mainly on identifying locations of increasing hydro-hazard hot-spots, Fig. S2 also shows that climatic projections could induce a decreasing drought hazard, particularly in terms of magnitude and duration in the southeast of England and northern Scotland. Such “positive” changes, i.e. where water deficit would decrease under climate change, would also imply a readjustment of water policies. For example, in the southeast of England where drought is historically the most frequent observed and managed hydro-hazard, the FFH shows there would be a need to shift hazard management to flood protection, since this region would see an increase in flood frequency, magnitude, and duration, and at the same time a decrease in drought hazard.
Finally, as stated before, the time of year is strongly dependent on the chosen threshold. In this study the threshold calculated on the baseline was applied to the 2080s series. For high flows, a constant threshold was selected, and no significant change in time of year was found from the baseline to the 2080s. However, regarding low flows, the baseline daily varying threshold suggests a certain seasonal variation of river flows, which can be accounted for in water management plans. According to the FFH database no particular time of the year is emphasized on the baseline. However, when compared to the baseline, results suggest that there would be more water deficit in autumn and winter in the 2080s. These trends could result in multi-seasonal drought (or “wet-to-dry-season drought”, as defined by Van Loon and Van Lanen, 2012) if occurring after a significant summer low flow, as recharge would not fully recover in winter as expected, which could also result in a more severe low flow in the following summer season. Indeed, in England and Wales winter rainfall is key to groundwater recharge, which is the principal source of river flow in summer, showing these regions are particularly vulnerable to winter droughts (Marsh et al., 2007). These results suggest a need for adapting water management policies in light of climate change impact, not only on the magnitude, but also on the timing of low-flow events. This should be considered in the full context of hydro-hazards and water management where large infrastructure is part of the river basin. For example, reservoir rule curves which account for flood management storage over winter may need to be revisited in order to assess the potential to manage for dual purposes.
4.3 Limits of the study
Some limits of this study are related to the use of the Future Flow database. As reported by Prudhomme et al. (2013), three hydrological models are used to simulate river flow with the emphasis of calibration on different parts of the flow regime. The CERF model was calibrated mainly on the representation of the water balance and low flows, while for PDM and CLASSIC the emphasis is on the upper part of the flow regime and peak flows. For the gauging stations calibrated with the CERF model, the high flows might thus be underestimated, while for the gauging stations calibrated with the PDM and CLASSIC models, the low flows might be overestimated.
Moreover, this study investigates the uncertainty related to one climate model only (HadRM3), under one forcing scenario (SRES A1B). The FFH database is based on a downscaled subset of the UKCP09 database, the HadRM3-PPE-UK, which does not capture the full range of the climate variable space projected by UKCP09 (Prudhomme and Williamson, 2013). For example, when using outputs from the UKCP09 weather generator (Murphy et al., 2009) with a range of different emission scenarios, changes in peak flows show a different spatial distribution (higher increase in 1:20-year return period events in the west), with a wider uncertainty (Kay et al., 2014a, b). However, Prudhomme et al. (2012c, Sect. IV) showed that the statistical range and distribution of hydrological changes in the FFH was generally consistent with the fuller uncertainty described by UKCP09-derived hydrological changes for the 2050s horizon. Investigating hydrological data derived from climatic projections forced by a wider range of emission scenarios would thus probably lead to a larger range of possible changes in high and low flows (Wilby and Dessai, 2010). Finally, using outputs from diverse general circulation models (GCMs) would allow the inclusion of a wider set of possible futures in impact studies to assess the probability and uncertainties related to these models and scenarios (Wilby, 2010). However, when comparing UKCP09 to the Coupled Model Inter-Comparison Project Phase 5 (CMIP5) projections, which were used in the Intergovernmental Panel on Climate Change 5th assessment (IPCC AR5), and reflecting on the uncertainties related to the GCM structure, the current recommendation is that UKCP09 provides consistent results for future changes to summer and winter temperature and winter rainfall (Met Office Hadley Centre, 2016). The main differences were found for future summer rainfall changes: while both experiments agree on a likely future reduction over the long term, CMIP5 suggests a smaller likelihood of substantial future reductions, especially for England and Wales.
In the context of increasing hydro-climatic risk arising from climate change, this paper aims to characterize the changes in flood and drought hazards spatially, temporally, and by magnitude in a consistent and parallel approach. It also embraces the uncertainties related to climatic projections and provides a framework to quantify the likelihood of these changes. A systematic approach is thus developed and applied to a spatially coherent statistical database of daily river flows (Future Flows Hydrology) across Great Britain to assess changes between the baseline (1961–1990) and the 2080s (2069–2098). This method characterizes changes in frequency, magnitude, duration, and time of year of flood and drought hazards consistently, and identifies future hot-spots across the country. Results showed that the FFH projects hydro-hazard hot-spots along the western coast of England and Wales and in Scotland, mainly during the winter (floods) and autumn (droughts) seasons, with a higher increase in drought hazard in terms of magnitude and duration. Some limits to this study relate to the ability of the hydrological models (used to produce the FFH database) to reproduce extreme high and low flows, while others are associated with FFH's limitation to one single climate model and emission scenario (SRES A1B). However, this paper sets out a novel approach to characterize both flood and drought hazards in a consistent manner across a large territory and in a probabilistic framework.
This paper presents a robust methodological approach to identify hydro-hazard hot-spots over a large spatial domain. The FFH database is a unique spatially coherent national-wide statistical river flow database, and presents an opportunity to develop methods to quantify climate change impacts (and its associated uncertainty) on hydrological extremes. It can be transferred to other large-scale statistical hydrological products that are emerging, such as the End-to-end Demonstrator for improved decision-making in the water sector in Europe experiment (EDgE, http://edge.climate.copernicus.eu/, last access: 10 October 2018), which shows a growing interest towards large-scale impacts of climate change on the hydrological cycle by stakeholders and a need for practical end-user available data on this matter. Moreover, the upcoming UKCP18 (http://ukclimateprojections.metoffice.gov.uk/24125, last access: 10 October 2018) based on IPCC AR5 should also provide appropriate downscaled climatic projections for the UK, the development of these new climate scenarios being driven by both the climatic and the end-user communities. This work is not an attempt to present the most state-of-the-art climate change projection chain, but rather to develop a novel methodological approach to characterize changes in both hydrological extremes as a result of climate change. This method is thus now transferable to these upcoming new databases to understand climate change impact on hydro-hazards and ultimately inform stakeholders and decision-makers. The output maps can be used to select case studies and investigate changes in floods and droughts in a risk assessment framework. Moreover, the effect of different catchment characteristics like urbanization and soil type on hydro-hazards could explain the changes in future projections. Recent work (e.g. Miller and Brewer, 2018) suggests that urbanization may have a significant effect on runoff characteristics and hence on flood and drought risks. In addition, soil characteristics were found to constrain the spatial distribution of changes in extreme peak flow magnitude in Scotland the most (Collet et al., 2018). Further work could then investigate these aspects through a regional analysis including different physical catchment characteristics. Finally, cascading uncertainties into impact studies has been investigated for vulnerability, resilience, and risk assessment. However, the literature shows this has been studied separately for flood (see e.g. Di Baldassarre et al., 2009; Masood and Takeuchi, 2012) and drought (see e.g. Borgomeo et al., 2015; Collet et al., 2015) risks. Building upon the work presented here, future risk assessments should consider both flood and drought hazards in a common and coherent framework.
The Future Flows Hydrology dataset is associated with digital object identifier https://doi.org/10.5285/f3723162-4fed-4d9d-92c6-dd17412fa37b. This must be referenced fully for every use of the Future Flows Hydrology data as Haxton T., Crooks S., Jackson C. R., Barkwith, A. K. A. P., Kelvin, J., Williamson, J., Mackay, J. D., Wang, L., Davies, H., Young, A., and Prudhomme, C.: Future Flows Hydrology, https://doi.org/10.5285/f3723162-4fed-4d9d-92c6-dd17412fa37b, 2012. All Future Flows Hydrology files are available through the CEH Environmental Informatics Data Centre Gateway under special licensing conditions (https://gateway.ceh.ac.uk/, CEH, 2018a, or https://doi.org/10.5285/bad1514f-119e-44a4-8e1e-442735bb9797). They are also available through the National River Flow Archive (http://nrfa.ceh.ac.uk/data/search?db=nrfa_public&stn=categories%3A%2AFUTUREFLOWS%2A, CEH, 2018b) and the National Groundwater Level Archive (http://www.bgs.ac.uk/research/groundwater/change/FutureFlows/home.html, British Geological Survey, 2018) where metadata associated with each study site and hydrological observation can be found.
Future Flows Hydrology is available under a licensing condition agreement. For non-commercial use, the products are available free of charge. For commercial use, the data might be made available conditional on a fee to be agreed to with NERC CEH and NERC BGS licensing teams, owners of the IPR of the datasets and products.
The supplement related to this article is available online at: https://doi.org/10.5194/hess-22-5387-2018-supplement.
LC and GF developed the codes and performed the data analysis. LC prepared the manuscript with contributions from all co-authors.
The authors declare that they have no conflict of interest.
This work was carried out as part of the EPSRC EP/NE30419/1 project “Water
Resilient Cities”. Acknowledgement is also given to the NERC-CEH Water
Resources Science Area.
Edited by: Nadia Ursino
Reviewed by: three anonymous referees
Arnell, N. W. and Gosling, S. N.: The impacts of climate change on river flood risk at the global scale, Climatic Change, 134, 387–401, https://doi.org/10.1007/s10584-014-1084-5, 2016.
ASC: UK Climate Change Risk Assessment 2017 Synthesis Report: priorities for the next five years, Adaptation Sub-Committee of the Committee on Climate Change, London, 2016.
Augustin, N., Beevers, L., and Sloan, W.: Predicting river flows for future climates using an autoregressive multinomial logit model, Water Resour. Res., 44, W07403, https://doi.org/10.1029/2006WR005127, 2008.
Bai, X., Dawson, R., Ürge-Vorsatz, D., Delgado, G., Salisu Barau, A., Dhakal, S., Dodman, D., Leonardsen, L., Masson-Delmotte, V., Roberts, D., and Schultz, S.: Six research priorities for cities and climate change, Nature, 555, 23–25, https://doi.org/10.1038/d41586-018-02409-z, 2018.
Bayliss, A. C. and Jones, R. C.: Peaks-over-threshold flood database: Summary statistics and seasonality, IH Report No. 121, 68 pp., Institute of Hydrology, Crowmarsh Gifford, UK, 1993.
Blöschl, G., Hall, J., Parajka, J., Perdigão, R. A. P., Merz, B., Arheimer, B., Aronica, G. T., Bilibashi, A., Bonacci, O., Borga, M., Canjevac, I., Castellarin, A., Chirico, G. B., Claps, P., Fiala, K., Frolova, N., Gorbachova, L., Gül, A., Hannaford, J., Harrigan, S., Kireeva, M., Kiss, A., Kjeldsen, T. R., Kohnová, S., Koskela, J. J., Ledvinka, O., Macdonald, N., Mavrova-Guirguinova, M., Mediero, L., Merz, R., Molnar, P., Montanari, A., Murphy, C., Osuch, M., Ovcharuk, V., Radevski, I., Rogger, M., Salinas, J. L., Sauquet, E., Sraj, M., Szolgay, J., Viglione, A., Volpi, E., Wilson, D., Zaimi, K., and Zivkovic, N.: Changing climate shifts timing of European floods, Science, 357, 588–590, https://doi.org/10.1126/science.aan2506, 2017.
Borgomeo, E., Farmer, C. L., and Hall, J. H.: Numerical rivers: A synthetic streamflow generator for water resources vulnerability assessments, Water Resour. Res., 51, 5382–5405, https://doi.org/10.1002/2014WR016827, 2015.
British Geological Survey: Future Flows and Groundwater Levels: projections for the 21st century, available at: http://www.bgs.ac.uk/research/groundwater/change/FutureFlows/home.html, last access: 10 October 2018.
Burt, T. P., Howden, N. J. K., and Worrall, F.: The changing water cycle: hydroclimatic extremes in the British Isles, WIREs Water, 3, 854–870, https://doi.org/10.1002/wat2.1169, 2016.
CEH: Environmental Informatics Data Centre, available at: https://gateway.ceh.ac.uk/, last access: 10 October 2018a.
CEH: National River Flow Archive, available at: http://nrfa.ceh.ac.uk/data/search?db=nrfa_public&stn=categories%3A%2AFUTUREFLOWS%2A, last access: 10 October 2018b.
Collet, L., Ruelland, D., Borrell-Estupina, V., Dezetter, A., and Servat, E.: Water Supply sustainability and adaptation strategies under anthropogenic and climatic changes of a meso-scale Mediterranean catchment, Sci. Total Environ., 536, 589–602, 2015.
Collet, L., Beevers, L., and Prudhomme, C.: Assessing the Impact of Climate Change and Extreme Value Uncertainty to Extreme Flows across Great Britain, Water, 9, 103, https://doi.org/10.3390/w9010103, 2017.
Collet, L., Beevers, L., and Stewart, M. D.: Decision-making and flood risk uncertainty: Statistical data set analysis for flood risk assessment, Water Resour. Res., 54, WR022024, https://doi.org/10.1029/2017WR022024, 2018.
Crooks, S. M. and Naden, P. S.: CLASSIC: a semi-distributed rainfall-runoff modelling system, Hydrol. Earth Syst. Sci., 11, 516–531, https://doi.org/10.5194/hess-11-516-2007, 2007.
Di Baldassarre, G., Castellarin, A., Montanari, A., and Brath, A.: Probability-weighted hazard maps for comparing different flood risk management strategies: A case study, Nat. Hazards, 50, 479–496, 2009.
Environment Agency: Collaborative research priorities, available at: https://www.gov.uk/government/publications/collaborative-research-priorities-for-the-environment-agency-2015-to-2019 (last access: 22 May 2015), 2014.
EEA: Water abstraction, available at: http://www.eea.europa.eu/themes/water/water-resources/water-abstraction (last access: 9 August 2015), 2008.
Fischer, E. M., Beyerle, U., and Knutti, R.: Robust spatially aggregated projections of climate extremes, Nat. Clim. Change, 3, 1033–1038, https://doi.org/10.1038/nclimate2051, 2013.
Formetta, G., Bell, V., and Stewart, E.: Use of flood seasonality in pooling-group formation and quantile estimation: an application in Great Britain, Water Resour. Res., 54, 1127–1145, https://doi.org/10.1002/2017WR021623, 2018.
Fowler, H. J. and Kilsby, H. J.: A weather-type approach to analysing water resource drought in the Yorkshire region from 1881 to 1998, J. Hydrol., 262, 177–192, https://doi.org/10.1016/S0022-1694(02)00034-3, 2002.
Griffiths, J., Young, A. R., and Keller, V.: Continuous Estimation of River Flows (CERF) – Technical Report: Task 1.3: Model Scheme for Representing Rainfall Interception and Soil Moisture, p. 45, CEH: Wallingford, UK, 2006.
Gustard, A. and Demuth, S. (Eds): Manual on Low-flow Estimation and Prediction, Operational Hydrology Report No. 50, WMO-No. 1029, 136 pp., Chairperson, Publications Board World Meteorological Organization (WMO), Geneva, Switzerland, 2009.
Hannaford, J. and Marsh, T. J.: High-flow and flood trends in a network of undisturbed catchments in the UK, Int. J. Climatol., 28, 1325–1338, https://doi.org/10.1002/joc.1643, 2008.
Hannaford, J. and Hall, J. W.: Flood risk in the UK: evidence of change and management responses, in: Changes in flood risk in Europe, edited by: Kundzewicz, Z. W. and Zbigniew, W., IAHS Press, IAHS Special Publication, Wallingford, 10, 344–361, 2012.
Harrigan, S., Hannaford, J., Muchan, K., and Marsh, T.: Designation and trend analysis of the updated UK Benchmark Network of river flow stations: The UKBN2 dataset, Hydrol. Res., 49, nh2017058, https://doi.org/10.2166/nh.2017.058, 2018.
Haxton, T., Crooks, S., Jackson, C. R., Barkwith, A. K. A. P., Kelvin, J., Williamson, J., Mackay, J. D., Wang, L., Davies, H., Young, A., and Prudhomme, C.: Future flows hydrology data, NERC Environmental Information Data Centre, https://doi.org/10.5285/f3723162-4fed-4d9d-92c6-dd17412fa37b, 2012.
HM Government: Water for Life (Water White Paper) Crown Copyright, Controller of Her Majesty's Stationery Office, UK, 2011.
Institute of Hydrology: Flood Estimation Handbook, Vol. 3: Statistical procedures for flood frequency estimation, Centre for Ecology & Hydrology, Wallingford, UK, 1999.
Kay, A. L., Crooks, S. M., Davies, H. N., and Reynard, N. S.: Probabilistic impacts of climate change on flood frequency using response surfaces I: England and Wales, Reg. Environ. Change, 14, 1215–1227, https://doi.org/10.1007/s10113-013-0563-y, 2014a.
Kay, A. L., Crooks, S. M., Davies, H. N., and Reynard, N. S.: Probabilistic impacts of climate change on flood frequency using response surfaces II: Scotland, Reg. Environ. Change, 14, 1243–1255, https://doi.org/10.1007/s10113-013-0564-x, 2014b.
Kundzewic, Z. (Ed.): Changes in Flood Risk in Europe, IAHS Special Publication, CRC Press, Wallingford, Oxfordshire, UK, 2012.
Kundzewicz, Z. W., Krysanova, V., Dankers, R., Hirabayashi, Y., Kanae, S., Hattermann, F. F., Huang, S., Milly, P. C. D., Stoffel, M., Driessen, P. P. J., Matczak, P., Quevauviller, P., and Schellnhuber, H.-J.: Differences in flood hazard projections in Europe – their causes and consequences for decision making, Hydrol. Sci. J., 62, 1–14, https://doi.org/10.1080/02626667.2016.1241398, 2017.
Kundzewicz, Z. W., Krysanova, V., Benestad, R. E., Hov, Ø., Piniewski, M., and Otto, I. M.: Uncertainty in climate change impacts on water resources, Environ. Sci. Policy, 79, 1–8, https://doi.org/10.1016/j.envsci.2017.10.008, 2018.
Maraun, D., Osborn, T. J., and Gillett, N. P.: United Kingdom Daily Precipitation Intensity: Improved Early Data, Error Estimates and an Update from 2000 to 2006, Int. J. Climatol., 28, 833–842, https://doi.org/10.1002/joc.1672, 2008.
Marsh, T., Cole, G., and Wilby, R.: Major droughts in England and Wales, 1800–2006, Weather, 62, 87–93, https://doi.org/10.1002/wea.67, 2007.
Masood, M. and Takeuchi, K.: Assessment of flood hazard, vulnerability and risk of mid-eastern Dhaka using DEM and 1D hydrodynamic model, Nat. Hazards., 61, 757–770, https://doi.org/10.1007/s11069-011-0060-x, 2012.
Met Office Hadley Centre, Department for Environment Food & Rural Affaires, Department of Energy and Climate Change, Environment Agency: Is UKCP09 still an appropriate tool for adaptation planning? Land Projections, Technical report, 11 pp., available at: http://ukclimateprojections.metoffice.gov.uk/media.jsp?mediaid=88738&filetype=pdf (last access: 10 October 2018), 2016.
Miller, J. and Brewer, T.: Refining flood estimation in urbanized catchments using landscape metrics, Landscape Urban Plan., 175, 34–49, https://doi.org/10.1016/j.landurbplan.2018.02.003, 2018.
Moore, R. J.: The PDM rainfall-runoff model, Hydrol. Earth Syst. Sci., 11, 483–499, https://doi.org/10.5194/hess-11-483-2007, 2007.
Murphy, J. M., Booth, B. B. B., Collins, M., Harris, G. R., Sexton, D. M. H., and Webb, M. J.: A methodology for probabilistic predictions of regional climate change from perturbed physics ensembles, Philos. T. Roy. Soc. A, 365, 1993–2028, https://doi.org/10.1098/rsta.2007.2077, 2007.
Murphy, J. M., Sexton, D. M. H., Jenkins, G. J., Boorman, P. M., Booth, B. B. B., Brown, C. C., Clark, R. T., Collins, M., Harris, G. R., Kendon, E. J., Betts, R. A., Brown, S. J., Howard, T. P., Humphrey, K. A., McCarthy, M. P., McDonald, R. E., Stephens, A., Wallace, C., Warren, R., Wilby, R., and Wood, R. A.: UK Climate Projections Science Report: Climate change projections, Met Office Hadley Centre, Exeter, UK, 2009.
Parry, S., Marsh, T., and Kendon, M.: 2012: from drought to floods in England and Wales, Weather, 68, 268–274, https://doi.org/10.1002/wea.2152, 2013.
Pender, D., Patidar, S., Hassan, K., and Haynes, H.: Method for Incorporating Morphological Sensitivity into Flood Inundation Modeling, J. Hydrol. Eng., 142, 04016008, https://doi.org/10.1061/(ASCE)HY.1943-7900.0001127, 2016.
Prudhomme, C. and Williamson, J.: Derivation of RCM-driven potential evapotranspiration for hydrological climate change impact analysis in Great Britain: a comparison of methods and associated uncertainty in future projections, Hydrol. Earth Syst. Sci., 17, 1365–1377, https://doi.org/10.5194/hess-17-1365-2013, 2013.
Prudhomme, C., Young, A., Watts, G., Haxton, T., Crooks, S., Williamson, J., Davies, H., Dadson, S., and Allen, S.: The drying up of Britain? A national estimate of changes in seasonal river flows from 11 Regional Climate Model simulations, Hydrol. Process., 26, 1115–1118, https://doi.org/10.1002/hyp.8434, 2012a.
Prudhomme, C., Dadson, S., Morris, D., Williamson, J., Goodsell, G., Crooks, S., Boelee, L., Davies, H., Buys, G., Lafon, T., and Watts, G.: Future Flows Climate: an ensemble of 1-km climate change projections for hydrological application in Great Britain, Earth Syst. Sci. Data, 4, 143–148, https://doi.org/10.5194/essd-4-143-2012, 2012b.
Prudhomme, C., Crooks, S., Jackson, C., Kelvin, J., and Young, A.: Future flows and Groundwater Levels, Final Technical Report Science Report/Project Note – SC090016/PN9, CEH Wallingford, 118 pp., 2012c.
Prudhomme, C., Haxton, T., Crooks, S., Jackson, C., Barkwith, A., Williamson, J., Kelvin, J., Mackay, J., Wang, L., Young, A., and Watts, G.: Future Flows Hydrology: an ensemble of daily river flow and monthly groundwater levels for use for climate change impact assessment across Great Britain, Earth Syst. Sci. Data, 5, 101–107, https://doi.org/10.5194/essd-5-101-2013, 2013.
Quesada-Montano, B., Baldassarre, G. D., Rangecroft, S., and Van Loon, A. F.: Hydrological change: Towards a consistent approach to assess changes on both floods and droughts, Adv. Water Resour., 111, 31–35, https://doi.org/10.1016/j.advwatres.2017.10.038, 2018.
Rahiz, M. and New, M.: 21st Century Drought Scenarios for the UK, Water Resour Manag., 27, 1039–1061, https://doi.org/10.1007/s11269-012-0183-1, 2013.
Reynard, N., Kay, A., Anderson, M., Donovan, B., and Duckworth, C.: The evolution of climate change guidance for fluvial flood risk management in England, Prog. Phys. Geog., 41, 222–237, https://doi.org/10.1177/0309133317702566, 2017.
Robinson, E. L., Blyth, E. M., Clark, D. B., Finch, J., and Rudd, A. C.: Trends in atmospheric evaporative demand in Great Britain using high-resolution meteorological data, Hydrol. Earth Syst. Sci., 21, 1189–1224, https://doi.org/10.5194/hess-21-1189-2017, 2017.
Robson, A. J. and Reed, D. W.: Flood Estimation Handbook, Institute of Hydrology, Wallingford, UK, 1999.
Roudier, P., Andersson, J. C. M., Donnelly, C., Feyen, L., Greuell, W., and Ludwig, F.: Projections of future floods and hydrological droughts in Europe under a +2 ∘C global warming, Climatic Change, 135, 341–355, https://doi.org/10.1007/s10584-015-1570-4, 2016.
Stedinger, J. R., Vogel, R. M., and Foufoula-Georgiou, E.: Frequency analysis of extreme events, in: Handbook of hydrology, edited by: Maidment, D., McGraw-Hill, New York, 1993.
Trenberth, K.: Changes in precipitation with climate change, Clim. Res., 47, 123–138, 2011.
UK Parliament: Current Parliamentary Material Available on Flooding, available at: http://www.parliament.uk/topics/Flooding.htm, last access: 16 August 2013.
Van Loon, A. F. and Van Lanen, H. A. J.: A process-based typology of hydrological drought, Hydrol. Earth Syst. Sci., 16, 1915–1946, https://doi.org/10.5194/hess-16-1915-2012, 2012.
Van Loon, A. F., Tijdeman, E., Wanders, N., Van Lanen, H. A. J., Teuling, A. J., and Uijlenhoet, R.: How climate seasonality modifies drought duration and deficit, J. Geophys. Res.-Atmos., 119, 4640–4656, https://doi.org/10.1002/2013JD020383, 2014.
Wilby, R. L., Beven, K. J., and Reynard, N. S.: Climate change and fluvial flood risk in the UK: more of the same?, Hydrol. Process., 22, 2511–2523, https://doi.org/10.1002/hyp.6847, 2008.
Wilby, R. L.: Evaluating climate model outputs for hydrological applications, Hydrol. Sci. J., 55, 1090–1093, 2010.
Wilby, R. L. and Dessai, S.: Robust adaptation to climate change, Weather, 65, 180–185, 2010.