the Creative Commons Attribution 4.0 License.
the Creative Commons Attribution 4.0 License.
 | 02 May 2018
Demonstrating the “unit hydrograph” and flow routing processes involving active student participation – a university lecture experiment
Reinhard Burgholzer
Daniel Klotz
Johannes Wesemann
Mathew Herrnegger
The unit hydrograph (UH) has been one of the most widely employed hydrological modelling techniques to predict rainfall–runoff behaviour of hydrological catchments, and is still used to this day. Its concept is based on the idea that a unit of effective precipitation per time unit (e.g. mm h−1) will always lead to a specific catchment response in runoff. Given its relevance, the UH is an important topic that is addressed in most (engineering) hydrology courses at all academic levels. While the principles of the UH seem to be simple and easy to understand, teaching experiences in the past suggest strong difficulties in students' perception of the UH theory and application.
In order to facilitate a deeper understanding of the theory and application of the UH for students, we developed a simple and cheap lecture theatre experiment which involved active student participation. The seating of the students in the lecture theatre represented the “hydrological catchment” in its size and form. A set of plastic balls, prepared with a piece of magnetic strip to be tacked to any white/black board, each represented a unit amount of effective precipitation. The balls are evenly distributed over the lecture theatre and routed by some given rules down the catchment to the “catchment outlet”, where the resulting hydrograph is monitored and illustrated at the black/white board.
The experiment allowed an illustration of the underlying principles of the UH, including stationarity, linearity, and superposition of the generated runoff and subsequent routing. In addition, some variations of the experimental setup extended the UH concept to demonstrate the impact of elevation, different runoff regimes, and non-uniform precipitation events on the resulting hydrograph.
In summary, our own experience in the classroom, a first set of student exams, as well as student feedback and formal evaluation suggest that the integration of such an experiment deepened the learning experience by active participation. The experiment also initialized a more experienced based discussion of the theory and assumptions behind the UH. Finally, the experiment was a welcome break within a 3 h lecture setting, and great fun to prepare and run.
- Article
(2776 KB) - Full-text XML
- BibTeX
- EndNote


1.1 Background
The prediction of catchment rainfall–runoff behaviour is an important prerequisite of any effective flood risk and water resources management practice. Rainfall–runoff modelling has a long history with a starting point that can been dated back at least 150 years to the work of Mulvaney (1951), or perhaps even further (see e.g. Biswas, 1970). Mulvaney (1951) first introduced a simple linear relationship between peak discharge and maximum catchment average rainfall intensity that is dependent on catchment size and an empirical coefficient that effectively represents all other catchment characteristics (Beven, 2012). It is known as the rational method in engineering hydrology and with modification is still used today (e.g. Hromadka and Whitley, 1994; Plate et al., 1988).
The first attempt to develop a spatially distributed hydrological model can be attributed to Ross (1921). In his approach, the catchment is split-up into zones of equal travel times to the catchment outlet, and runoff production is calculated for each area, dependent on the antecedent conditions and rainfall rates. The resulting time–area diagrams represent the delays for runoff from each part of the catchment.
While it has been long known that flow velocities change in a non-linear way with flow rate or flow depth, the Ross approach relies on the assumption of linearity in routing the runoff to the catchment outlet. This assumption of linearity, however, has been shown to be less critical when compared to the problem of estimating the effective rainfall for each event (Beven, 2012). The effective precipitation is thereby the part of the total precipitation contributing to runoff during an event. The estimation of this proportion is generally a non-linear process depending on the antecedent catchment conditions, including soil moisture and interception storage conditions, possible snow cover, as well as rainfall intensities. Common approaches to calculate effective precipitation are the constant loss rate (φ-index) method, the constant proportion method, or infiltration based methods as suggested by Horton (1933).
Another major difficulty with the Ross approach was deciding which areas of the catchment would contribute to the different time zones, since there was almost no information available on flow velocities and pathways in the different soil compartments (surface runoff, interflow) and on different environmental conditions (soil moisture, climate). The unit hydrograph (UH) method developed by Sherman (1932) tried to avoid these difficulties by representing the various time delays for runoff generated within the catchment by a stationary time distribution that does not necessarily have any direct link to a particular location. The principal idea of the method is that assuming a linear routing procedure, this distribution could be normalized to represent the response to a unit of runoff production, or effective rainfall, generated over the catchment in one time step. In other words, the UH represents a discrete transfer function for effective rainfall to reach the basin outlet, lumped to the scale of the catchment.
The UH has been one of the most widely employed hydrological modelling techniques to predict rainfall–runoff behaviour of hydrological catchments, and is still used in current generations of hydrological forecasting systems (see e.g. Samaniego et al., 2010 who use a simple triangular UH to convolute runoff that is produced in each cell to represent spatially variable runoff production. The routing between cells in the catchment, however, is done differently).
Given the importance of the UH in the historical development of rainfall–runoff models, and the fact that its basic principles are still included in current spatially distributed hydrological models, the UH is an important subject in any of the academic hydrology courses at the undergraduate and graduate level. The UH theory and principles include general concepts of catchment hydrology that form the foundation for further, more advanced topics and therefore need to be introduced in an understandable way.
1.2 Teaching situation
The principles of runoff generation processes and the basic concepts of rainfall–runoff modelling are essential parts of the third semester “Hydrology and Water Resources Management 1” course which is mandatory within the “Civil Engineering and Water Management (H033231)” program at the University of Natural Resources and Life Sciences (BOKU), Vienna. All students in the program have previously attended introductory courses in mathematics, physics, statistics, mechanics, hydraulics, and have gone through an introduction into hydrography and hydrometry. While in theory the students' previous knowledge seems to be more than sufficient and adequate to understand and grasp the central ideas behind the UH, exam results over the last few years consistently and repeatedly demonstrated significant gaps in understanding. While the concept of “effective precipitation” contributing to catchment runoff did not seem to cause any difficulties, it was the interpretation of the UH within a hydrological system context and its use as a prediction tool in particular that were identified as problem areas. This included the interpretation of the UH as a transfer function which describes the “generation” of a hydrograph given a unit of effective precipitation in a catchment. As a first attempt we included (for the case of a uniform distribution of effective precipitation) an interpretation of the UH as a distribution of travel times (similar to time–area histograms). It seemed insufficient, however, as still a large number of students were unable to formulate the functioning and interpretation of an UH properly.
Therefore, in addition to the standard slide presentation of the theory, we decided to additionally visualize the concept of the unit hydrograph, its underlying assumptions, and the linear routing principles in a lecture theatre experiment in the winter semester 2016/2017. The main goal was to stimulate student interest and to help them in their scientific learning. The positive effect of experimental demonstrations on deeper understanding and learning has been found in a number of studies in a variety of natural sciences disciplines (e.g. Roberts et al., 2005; Savec et al., 2005).
In our experiment, students and the location they were sitting in represented a hydrological catchment in the lecture theatre, and they were actively involved in routing an effective precipitation event to a fictive runoff gauge in the room. This gauge was “monitored” over time and the resulting runoff data was visualized in an illustrative way. The setup of this experiment, the material required and its preparation, as well as variants of the experiments and possible follow-up discussions to interpret these experiments will be described in some detail in the following.
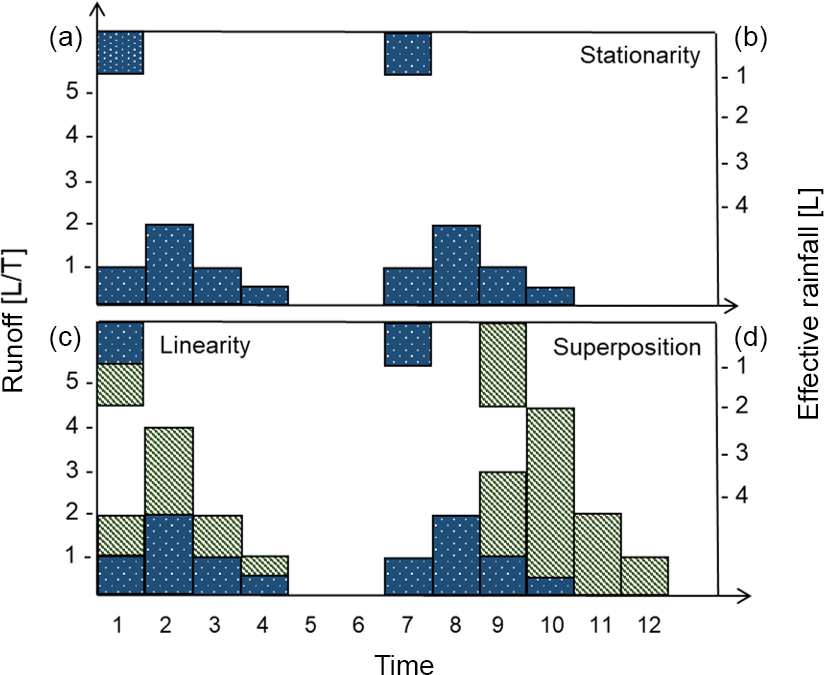
Figure 1An example of a UH (a) and an illustration of the principles of stationarity (b), linearity (c), and superposition (d). Units for runoff are provided as catchment area specific runoff in length (L) per time (T).
2.1 The unit hydrograph (UH)
Summarizing the theory of the UH as briefly described in the previous section, three basic principles can be emphasized when transferring a unit of effective precipitation to the catchment outlet: (i) stationarity, (ii) linearity, and (iii) superposition. Stationarity of the UH concept assumes that a unit of effective precipitation will always generate the same hydrograph, independent of the time of the day/year and of the antecedent e.g. soil moisture conditions. Linearity in the routing process requires that any event with x units of effective precipitation will generate x times as much predicted runoff in the hydrograph at the catchment outlet, having the same temporal distribution. The principle of superposition states that multiple consecutive effective precipitation events can be treated independently and predicted runoff in the hydrographs is superimposed by simply adding individual responses. An example unit hydrograph and these three fundamental principles are illustrated in Fig. 1.
We would like to point out here, that the UH concept per se does not explicitly link the runoff generation processes to any particular location. The UH rather represents the travel time distribution of a unit of effective rainfall for a particular catchment. Being aware of this fact, we nevertheless chose a spatially explicit setting for illustrating the UH and its principles as well as runoff routing processes. While the UH theory does allow for the consideration of spatially heterogeneous precipitation fields that are stationary in time, the focus here is on uniformly distributed precipitation fields, as is often seen in hydrology textbooks for simplicity (Maniak, 2016, p. 350). The implementation of this theory into a lecture theatre experiment will be explained step by step in the next subsection.
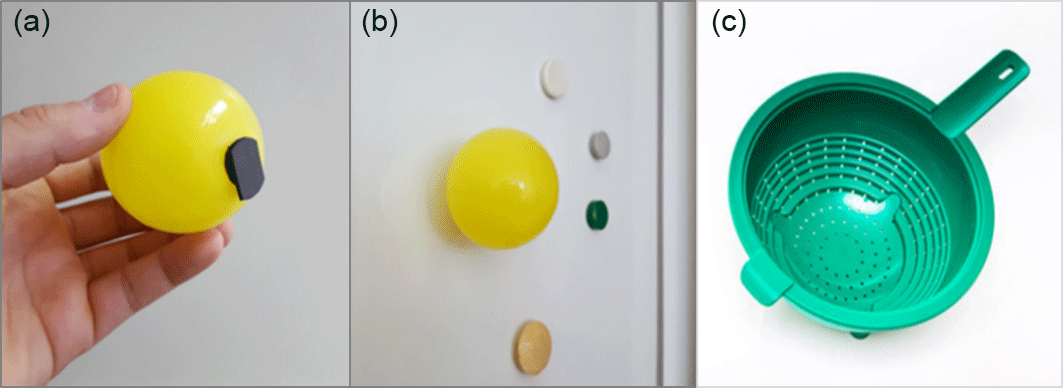
Figure 2A piece of magnetic strip glued to a plastic ball (a) that represents a unit amount (1 mm) of effective rainfall, as well as generated specific runoff. It can be tacked to most of the classroom white/black boards (b). The sieve is used to “collect” generated runoff during the routing procedure (c).
2.2 Lecture theatre experiment and teaching material
The following steps were implemented to realize an experimental illustration of the UH principle in a lecture theatre. The experiment took about 20–25 min including all instructions, explanations, and some basic discussions. It will be shown later (Sect. 2.3) that different variants of the experiments can be performed to focus on further aspects of catchment rainfall–runoff behaviour so that the experiment including discussions can be easily extended to 90 min. The experiment uses very simple and cheap materials that were easily available in any department store. Overall costs were approximately EUR 30.
2.2.1 Step 1: ball preparation
An effective precipitation of 1 mm is realized using differently coloured plastic balls. A short piece of magnetic strip was glued to each ball so that they could be tacked to most of the lecture theatre and seminar room white/black boards. Figure 2 illustrates a prepared ball and its use at the white/black board.
2.2.2 Step 2: defining the catchment
The “size” and the “form” of the catchment is defined by the positioning/seating of the individual students in the lecture theatre. By considering a different number of students within the experiment and changing the seating positions, the catchment size and form can be varied in order to examine and illustrate the effect of variations of both on the resulting hydrograph. Figure 3 shows the lecture theatre setup – each student holding a plastic ball representing 1 mm of effective precipitation received by the catchment.
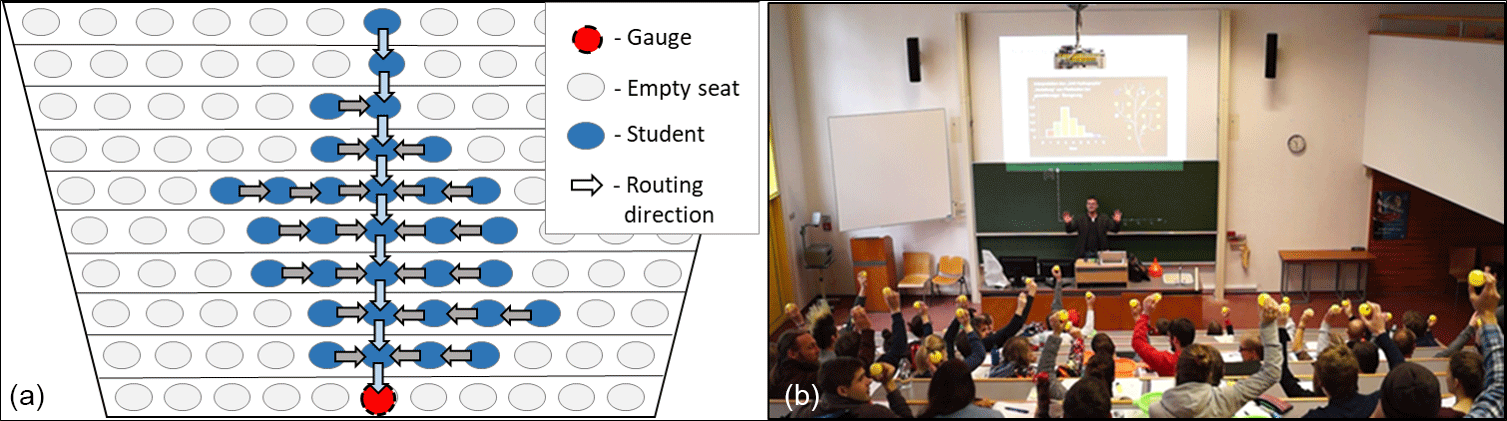
Figure 3Catchment setup by 32 students: a sketch of the student seating, flow routing, and the gauge – blue arrows indicate the main stream channel within the catchment (a). The “experimental” setup in the original lecture theatre (b).
One person – approximately in the centre of the first row or a teaching assistant (see Fig. 3a, gauge) – is defined as the catchment outlet and thus receives all the effective precipitation (balls) that have been routed “down” the catchment (lecture theatre).
2.2.3 Step 3: routing rules
The routing of the effective precipitation within the catchment has to follow some rules in order to generate runoff. To mimic some real catchment behaviour, each student has to transport their 1 mm of effective precipitation water package towards the outlet. A simple routing scheme that is easy to explain and execute is sketched in Fig. 3a and proceeds as follows for each time step: (i) vertical transport of water packages from only one position along the main stream channel starting in the first row (blue arrows) – the water packages in the gauge position are the measured runoff information for this time step; (ii) horizontal transport from one position towards the main stream channel in each row starting with the inside positions (grey arrows). The sampling of the water packages (balls) along the “main stream channel” (middle column of the lecture theatre) is carried out with plastic sieves as the number of balls might exceed the number of balls that can be handled by hand (see Fig. 2c).
2.2.4 Step 4: hydrograph representation
With each time step, a different number of water packages (balls) are collected/sampled at the catchment gauge. They represent the catchment hydrograph resulting from 1 mm of effective precipitation homogeneously spread over the entire catchment. Given the routing scheme that has been chosen for this particular experiment, the hydrograph in Fig. 4 represents the corresponding UH of our lecture theatre catchment. The units of the y axis are in length per time and dependent on the units chosen for the time steps and the effective precipitation (here 1 mm per ball).
The UH illustrated in Fig. 4 is the result of a specific lecture theatre setting including the form of the catchment defined by the positioning of the students in the lecture theatre (see Fig. 3) and the rules formulated to route the effective precipitation through the catchment. The simple experimental setup as described in Sect. 2 can be extended in various ways to illustrate (i) the basic principles behind the unit hydrograph, and (ii) a number of additional factors that have a significant control on the generated hydrograph, such as the catchment terrain, the surface conditions, and dominant runoff components (e.g. surface runoff or subsurface storm flow).
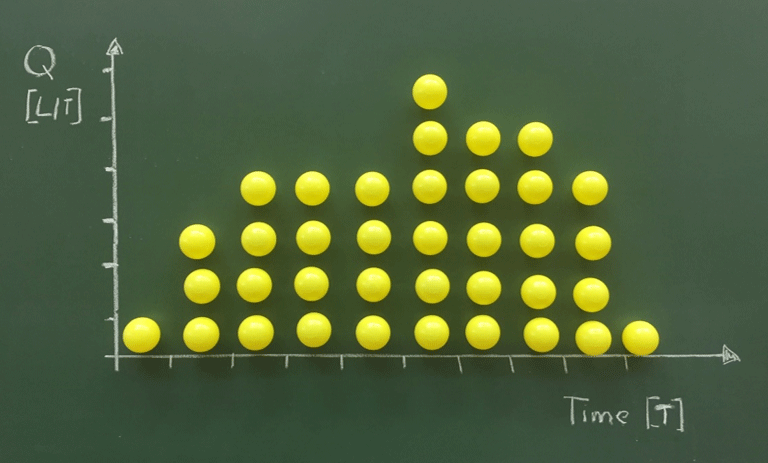
Figure 4A lecture theatre catchment unit hydrograph resulting from 1 mm effective precipitation (represented by a yellow plastic ball) homogeneously spread over the catchment.
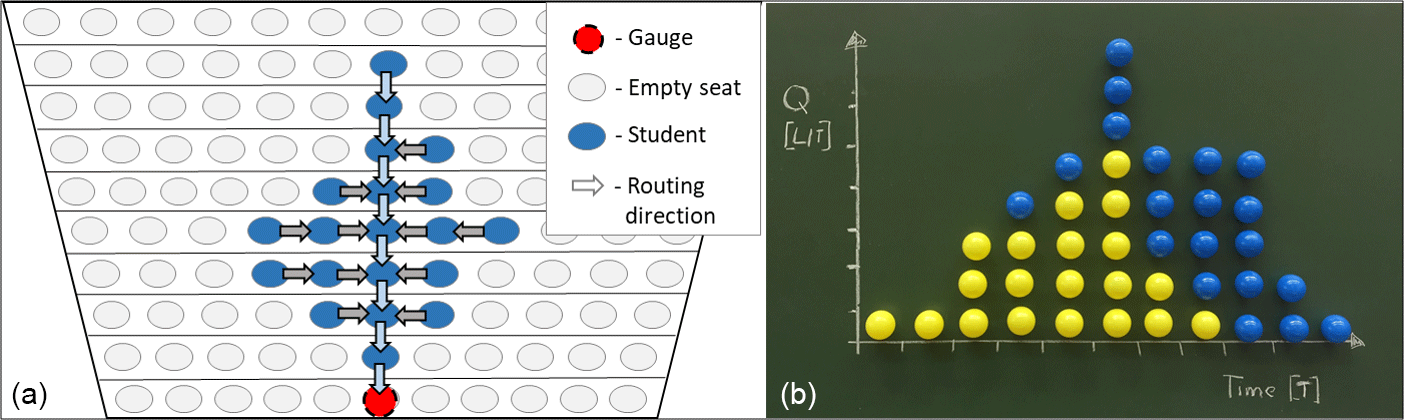
Figure 5The superposition of two rainfall events, both producing an effective precipitation of 1 mm. The first event is represented by yellow balls, the second event, which is delayed by four time steps, is represented by blue balls. Panel (a) illustrates the student seating and routing scheme applied in this experiment. The resulting hydrograph is shown in (b).
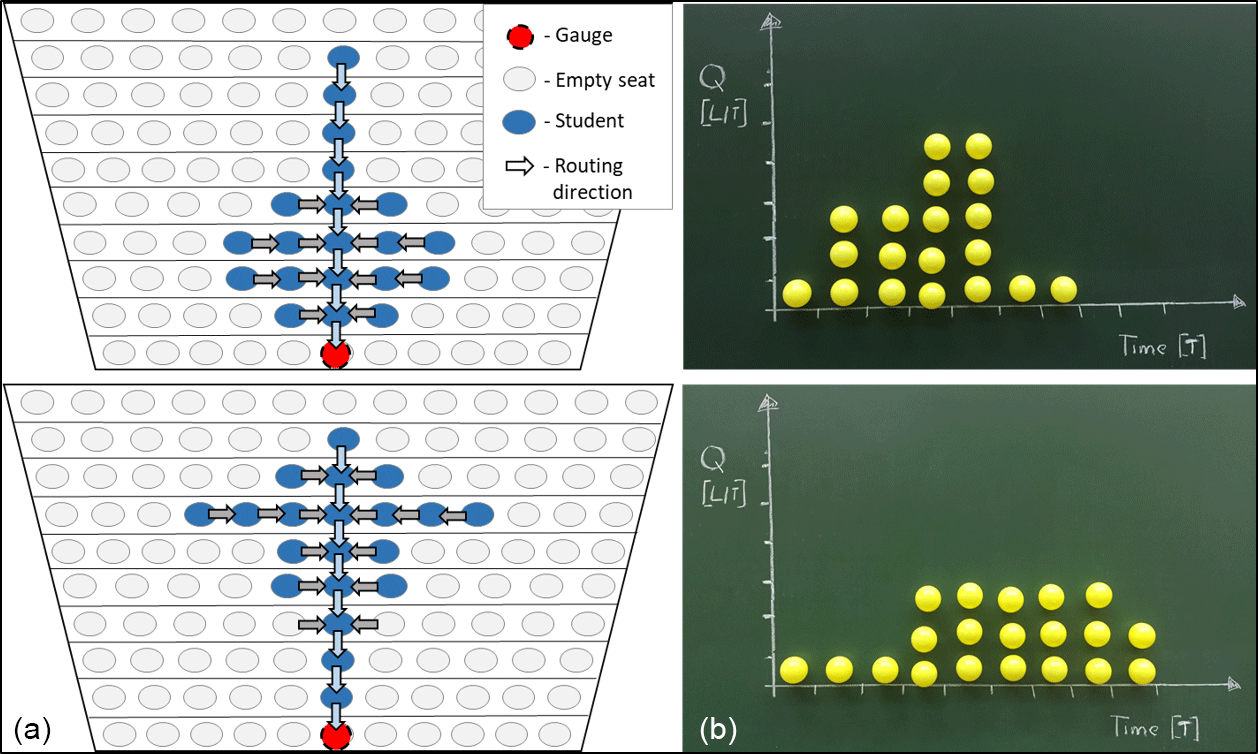
Figure 6The effect of different catchment forms (same area/number of students) (a), on the resulting hydrographs (b).
3.1 Illustration of unit hydrographs principles
The three principles underlying the UH are stationarity, linearity, and superposition of runoff generated by different events (Fig. 1). The principle of stationarity is easily explained by simply repeating the experiment and thereby receiving the same hydrograph as result. Such repetition might not be very exciting for the students, but experience shows that a thought experiment is sufficient to foster understanding. The principle of linearity can be illustrated and discussed in two ways. Firstly, given the initial experiment where each plastic ball represented an amount of effective precipitation (e.g. 1 mm), this is simply redefined to twice the amount (e.g. 2 mm) which exactly doubles the runoff generated in the hydrograph. Secondly, the experiment may be repeated with twice the number of balls per student, again resulting in a doubling of the runoff in the generated hydrograph. The second variant will obviously provide a more vivid illustration of the principle of linearity; however, it will require more resources in terms of number of balls and more experimental execution time, which might be limiting given a lecture setting. The principle of superposition can be illustrated by considering two independent precipitation events, each producing e.g. 1 mm of effective precipitation. The different precipitation events can be labelled using different coloured balls (e.g. yellow and blue). While the first precipitation event takes place at the first time step, the second event has a time delay of some steps. Figure 5b shows the superposition of the two events (each 1 mm of effective rainfall) and the resulting hydrograph.
As mentioned earlier, the unit hydrograph does not explicitly link any runoff generation to a specific location in the catchment. We used an explicit setting to illustrate the principles of the UH – each explicit setting or form of a catchment and routing scheme will produce a specific hydrograph. The experiment in Fig. 5 provides a good opportunity to discuss this fact with the students. This point could be illustrated by designing a second, different experimental setting (form and/or routing scheme) that leads to the same hydrograph.
3.2 Analysis of factors controlling the unit hydrograph
One obvious factor to analyse is the form of the catchment and its impact on the dynamics of the hydrograph. While such an analysis is presented in recent hydrology textbooks (e.g. Baumgartner and Liebscher, 1996, 525 pp.; Ward and Trimble, 2003, 126 pp.), this effect is simply assessed by changing the seating positions of the students in the lecture theatre and repeating the experiment. Figure 6 illustrates different catchment forms by altering student seating in the lecturer theatre (top panel) and the resulting hydrographs (lower panel).
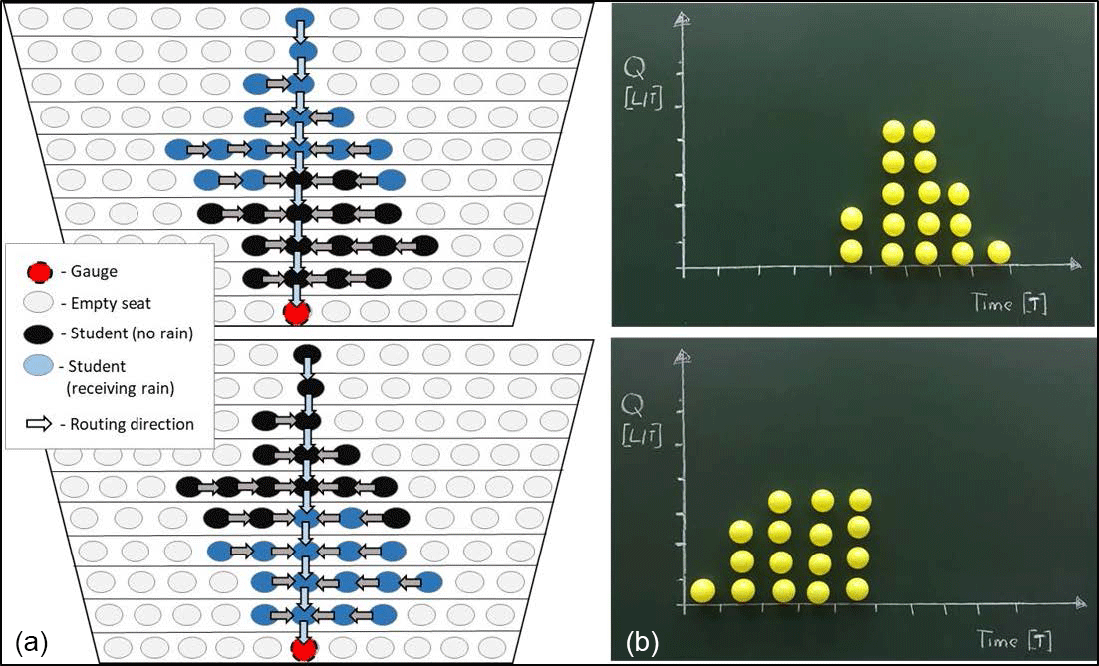
Figure 7The effect of different spatial distributions of effective precipitation within the catchment on the resulting hydrograph. The student seating, the spatial distribution of effective precipitation, and the routing scheme are indicated in (a), the hydrographs are illustrated in (b).
While the concept of the UH per-se does not require any linkage between the time delay of any runoff generated in the catchment to a particular location (see Sect. 1), the lecture theatre experiment is well suited to additionally discuss any of the catchment properties that are related to the different forms of runoff processes in the catchment. In the standard routing scheme as introduced in Sect. 2, no effects of differences in topography are considered in the routing scheme. In order to investigate the effects of topography, different areas with steep elevation gradients (e.g. steep areas close to the catchment boundaries, where the transport of water is enhanced) are demonstrated by allowing balls to “jump” over two positions, thus representing an increase in flow velocity due to increased potential gradients. Differences in the soil texture and resulting infiltration capacities might be represented similarly, indicating areas with more frequent surface runoff generation and quick flow conditions versus areas with more dominant subsurface or interflow flow regimes that deliver water more slowly towards the catchment outlet. In this way, different routing rules can be linked to different catchment properties and runoff/flow regimes, which can be used for critical discussion of the assumptions and underlying principles of the UH, as well as the possible effects in cases where these principles and assumptions are violated.
While beyond the underlying assumptions of the UH (spatially uniform effective precipitation), this lecture theatre experiment is well suited to additionally demonstrate the effect of spatially non-uniform precipitation and runoff generation processes, by limiting the distribution of plastic balls to only a subset of the students. Figure 7 illustrates the resulting hydrographs when only the lower half (Fig. 7a) or the upper half (Fig. 7b) of the catchment receive a unit amount of effective precipitation. The differences in the timing of the resulting hydrographs are clearly visible.
Our personal experience with the unit hydrograph and runoff routing lecture theatre experiment, as well as direct student feedback, and the student evaluation was extremely positive and revealed the following key aspects:
-
The experiment was well suited to illustrate the concepts of the unit hydrograph. The underlying principles such as stationarity, linearity, and superposition, as well as the effect of different catchment forms, catchment elevations, runoff mechanisms, and non-uniform precipitation events on the catchment hydrograph could be well demonstrated.
-
The active participation of every student in the experiment allowed an intensive “active experience” of the UH and routing mechanism by being “one part of the catchment” and being “involved” in the transport of the water towards the catchment outlet. Student's active participation in the experiment also highly supported an intensive discussion on the theoretical background of the unit hydrograph. Assumptions such as the linearity of the routing procedure could be questioned and discussed with regard to real catchment behaviour including the impact of antecedent soil moisture conditions on the runoff generation, and the non-linearity of the flow depth–flow velocity relationship.
-
For the basic experiment, a time slot of approximately 20–25 min and the help of two student assistants was needed in the lecture. However, in case there is more time available, the experiment and discussions can be easily extended to 90 min or more by including some of the additional variants as illustrated in Sect. 3.2. Given the 3 h framework for our particular lecture, the experiment was a very welcome “active break” from the standard slide based lecturing. It refocussed students' minds and attention.
-
Actively participating in deriving the catchment rainfall–runoff relationship was fun, not only for the students, but for everybody involved in the course teaching.
In summary, we believe that the integration of a lecture theatre experiment, such as the above-mentioned, into the course resulted in a much deeper learning experience for the students overall, due to the visualization and active participation involved. In order to quantify the impact of such experiments on the students' learning process, a longer-term educational study using some kind of split group approach would be needed. While the education department of our university has expressed their interest in conducting such a study, we are currently not able to make a quantitative statement in this regard. Nevertheless, our subjective experience is well expressed by a statement of Confucius (551–479 BC) saying “I hear and I forget, I see and I remember, I do and I understand” and will encourage us to further extend the integration of experiments into lecture-based teaching.
No data sets were used in this article.
KS (PI) designed the experiment and ran the lecture. RB (MSc student) developed the teaching material. JW (PhD student), DK (PhD student), MH (Co-PI), and RB contributed to the development of the teaching experiment. All authors were involved in the manuscript and figure preparation.
The authors declare that they have no conflict of interest.
The authors are thankful to the group of students in the third semester
Hydrology and Water Resources Management 1 course within the Civil
Engineering and Water Management (H033231) program at the University of
Natural Resources and Life Sciences (BOKU), Vienna. This publication was supported by the BOKU Vienna
Open Access Publishing Fund.
Edited by: Nandita Basu
Reviewed by: two anonymous referees
Baumgartner, A. and Liebscher, H. J.: Lehrbuch der Hydrologie, Band 1: Allgemeine Hydrologie – Quantitative Hydrologie, 2nd Edn., Gebrüder Bornträger, Berlin, Stuttgart, 1996.
Beven, K.: Rainfall–runoff Modelling: The Primer, 2nd Edn., J. Wiley & Sons, Ltd., Chichester, West Sussex, UK, 2012.
Biswas, A. K.: History of hydrology, North-Holland Publishing Company, Amsterdam, London, 1970.
Horton, R. E.: The role of infiltration in the hydrologic cycle, Trans. Am. Geophys. Union, 14, 446–460, 1933.
Hromadka, T. V. and Whitley, R. J.: The Rational Method for Peak Flow-Rate Estimation, Water Resour. Bull., 30, 1001–1009, 1994.
Maniak, U.: Hydrologie und Wasserwirtschaft, eine Einführung für Ingenieure, 7th Edn., Springer, Vieweg, 2016.
Mulvaney, T. J.: On the use of self-registering rain and flood gauges in making observations of the relations of rainfall and flood discharges in a given catchment, P. Inst. Civ. Eng. Ireland, 4, 19–31, 1951.
Plate, E. J., Ihringer, J., and Lutz, W.: Operational Models for Flood Calculations, J. Hydrol., 100, 489–506, https://doi.org/10.1016/0022-1694(88)90198-9, 1988.
Roberts, J. R., Hagedorn, E., Dillenburg, P., Patrick, M., and Herman, T.: Physical models enhance molecular three-dimensional literacy in an introductory biochemistry course, Biochem. Mol. Biol. Educ., 33, 105–110, 2005.
Ross, C. N.: The calculation of flood discharge by the use of time contour plan isichrones, Trans. Inst. Eng. Aust., 2, 85–92, 1921.
Samaniego, L., Kumar, R., and Attinger, S.: Multiscale parameter regionalization of a grid-based hydrologic model at the mesoscale, Water Resour. Res., 46, W05523, https://doi.org/10.1029/2008wr007327, 2010.
Savec, V. F., Vrtacnik, M., and Gilbert, J. K.: Evaluating the educational value of molecular structure representations, in: Visualisation in Science Education, edited by: Gilbert, J. K., Springer Netherlands, 269–300, 2005.
Sherman, L. K.: Streamflow from rainfall by unit-graph method, Eng. News Rec., 108, 501–505, 1932.
Ward, A. D. and Trimble, S. W.: Environmental Hydrology, 2nd Edn., Lewis Publishers, New York, 2003.