the Creative Commons Attribution 3.0 License.
the Creative Commons Attribution 3.0 License.
Assessing impacts of dike construction on the flood dynamics of the Mekong Delta
Dung Duc Tran
Gerardo van Halsema
Petra J. G. J. Hellegers
Long Phi Hoang
Tho Quang Tran
Matti Kummu
Fulco Ludwig
Recent flood dynamics of the Mekong Delta have raised concerns about an increased flood risk downstream in the Vietnamese Mekong Delta. Accelerated high dike building on the floodplains of the upper delta to allow triple cropping of rice has been linked to higher river water levels in the downstream city of Can Tho. This paper assesses the hydraulic impacts of upstream dike construction on the flood hazard downstream in the Vietnamese Mekong Delta. We combined the existing one-dimensional (1-D) Mekong Delta hydrodynamic model with a quasi-two-dimensional (2-D) approach. First we calibrated and validated the model using flood data from 2011 and 2013. We then applied the model to explore the downstream water dynamics under various scenarios of high dike construction in An Giang Province and the Long Xuyen Quadrangle. Calculations of water balances allowed us to trace the propagation and distribution of flood volumes over the delta under the different scenarios. Model results indicate that extensive construction of high dikes on the upstream floodplains has had limited effect on peak river water levels downstream in Can Tho. Instead, the model shows that the impacts of dike construction, in terms of peak river water levels, are concentrated and amplified in the upstream reaches of the delta. According to our water balance analysis, river water levels in Can Tho have remained relatively stable, as greater volumes of floodwater have been diverted away from the Long Xuyen Quadrangle than the retention volume lost due to dike construction. Our findings expand on previous work on the impacts of water control infrastructure on flood risk and floodwater regimes across the delta.
- Article
(8467 KB) - Full-text XML
- BibTeX
- EndNote


The Vietnamese Mekong Delta (VMD) is popularly known as the rice bowl of Vietnam, as it provides about half of the nation's food volume (Käkönen, 2008). The delta owes much of its agricultural productivity to seasonal flooding, though severe flood years have dire consequences for local populations. Severe flooding is relatively frequent too, having occurred, for example, in 2000, 2001, 2002, and 2011. In general, while extreme flooding poses a threat to people and properties, the benefits of small to medium floods outweigh the disadvantages. In particular, the fertile sediment and fish conveyed by the floodwaters help create an optimal environment for agricultural livelihoods (Käkönen, 2008; Hung, 2012). Tri et al. (2013) and Marchand et al. (2014) calculated that the seasonal floods transport some 160 million tons of fluvial sediment annually. Lu et al. (2014) estimated 67 million tons per year. Some 1.86 tons of fish, worth USD 2.6 billion, were supplied by the floods in 2000. Flooding also improves soil quality by flushing fields, which reduces acidity and agrochemical residues, while contributing to wetland protection and biodiversity conservation (Howie, 2011; Danh and Mushtaq, 2011; Hung, 2012). Historically the Vietnamese have adapted their farming systems to exploit the benefits of flooding (Wesselink et al., 2015; Ngan et al., 2018). One example is cultivation of floating rice (lua mua) which grows in sync with rising floodwaters and is often combined with fishing (Käkönen, 2008).
Vietnam's doi moi economic reform policy, introduced in 1986, and the nation's resolve to become self-sufficient in rice, set the VMD on a new socio-economic development path (Kingdom of the Netherlands, 2011; Toan, 2011). First and foremost, the policy gave rise to progressive intensification of rice cultivation (Sebesvari et al., 2012). Beginning with the Long Xuyen Quadrangle (LXQ) and Plain of Reeds, low dikes and irrigation and drainage canals were developed to enable cultivation of two rice crops before a delayed mid-August flood. In 1996, the land reclamation and flood protection program entered a new phase, with residents increasingly resettled to flood-protected villages (Danh and Mushtaq, 2011) and the first large-scale flood control infrastructures built. Construction of high dikes with compartments for rice cultivation continued unabated during the ensuing decades. The agricultural fields thus created were effectively cut off from natural flooding, allowing farmers to cultivate three rice crops annually.
Today, great expanses of the VMD floodplains are covered by intensively cultivated rice fields enclosed by low dikes or high dikes. This intensified land use, however, has coincided with an increased flood risk downstream in the delta, around the city of Can Tho. Comparing water levels in 2011 with those in 2000, lower water levels were observed upstream in the more recent year, with higher levels measured downstream. At the upstream station of Tan Chau, for example, water levels in 2011 were 0.63 m lower than in 2000 (4.27 m vs. 4.90 m). However, water levels at the downstream Can Tho station were 0.36 m higher in 2011 than in 2000 (2.15 m vs. 1.79 m). This suggests a relationship between the proliferation of dike construction on the floodplains, particularly high dikes, and higher water levels and flood risk downstream.
Several studies have concluded that the flood risk in the VMD has increased over time. Numerous reasons have been proposed, such as climate change, sea level rise, hydropower projects, land subsidence, and local rainfall. Wassmann et al. (2004) concluded based on a hydraulic model that the higher water levels in the delta were caused by sea level rise in association with climate change. Fujihara et al. (2015) investigated the impacts of upstream runoff, sea level rise, and land subsidence on flood levels. They found that flood depths would be significantly increased in 19 tide-dominated areas, and that land subsidence and sea level rise would worsen inundation. Lauri et al. (2012) and Hoang et al. (2016) explored potential impacts of climate change and reservoir management scenarios on the future hydrology of the Mekong River. Numerous authors have considered the effects of climate change and sea level rise on flood propagation, inundated area, and sediment transport (Apel et al., 2012; Hung, 2012; Quang et al., 2012; Manh et al., 2014).
Some studies have honed in on the effects of infrastructure development on VMD flood levels. Hoa et al. (2008) used the HydroGIS hydrodynamic model to evaluate the effects of the infrastructural changes from 1996 to 2004 on floodwater levels and flood protection efficacy. They concluded that infrastructure works, such as dredging canals, raising embankments, and upgrading roads, likely mitigated the overall extent of flooding but increased flood depth by 20 to 30 cm in some regions near and between embankment systems. Using the Mike 11 hydrodynamic model, Duong et al. (2014) simulated the water-level impacts of dike construction for the floodwater conditions experienced in 2000 and 2011. Using 2000 flood conditions in combination with the river network and infrastructure system of 2011, they found 13 cm higher water levels at Chau Doc and 5 cm higher Tien River levels at Can Tho. A scenario simulating the 2011 flood volumes with the 2000 river network and infrastructure system showed 8 cm lower water levels at Can Tho. Their simulations, however, could not determine how floodwaters would be distributed. Moreover, Dung et al. (2011) noted deficiencies in the model's representation of the dike system in Vietnam.
Dikes and other water control infrastructures prevent floodwaters from entering agricultural fields. They may therefore increase floodwater flows downstream. Indeed, although floodwater volumes were less in 2011 than in 2000, the water levels observed downstream were higher in 2011 than in 2000. Duong et al. (2014) and Marchand et al. (2014) proposed that the higher downstream river water levels observed during the 2011 floods could be due to the construction of higher dikes. Fujihara et al. (2015) pointed out the need for more research to understand the impacts of high dike construction. Despite the rapid expansion of high dike systems for triple rice cultivation in the upper Mekong Delta, few modeling studies have as yet assessed the implications of such dikes for floodwater regimes.1 Additionally, most previous studies have focused on changes in peak water levels, based on monitoring data or model results. No study has as yet analyzed the distribution of floodwaters and changes therein. However, water distribution analyses are essential for understanding how floodwaters may spread and where the impacted locations' corresponding changes in water volumes are under different dike construction scenarios.
The study presented in this paper aimed to fill these knowledge gaps by using 1-D and quasi2-D modeling to test the hypothesis that large-scale high dike construction reduces the flood retention capacity of the floodplains and increases water levels and the corresponding flood risk downstream. We first examined the impacts of dike construction on flood dynamics, focusing particularly on changes in river water levels and the spatial distribution of floods on the VMD floodplains. We then developed and calibrated a hydrodynamic model for the entire VMD to simulate flooding under different dike construction scenarios. Using the simulation results we calculated water balances to identify and quantify changes in flood dynamics. The modeling results enabled us to analyze changes in flood patterns and river water levels across the VMD due to dike construction. Finally, we analyze and discuss some of the accompanying uncertainties, closing with a number of conclusions.
The Mekong Delta covers some 5 million ha, extending down from Kratie in Cambodia through the VMD to the Gulf of Thailand and South China Sea. At Chaktomuk, its main river, the Mekong, meets the Tonlé Sap River, which in the wet and dry season, respectively, adds and abstracts water to and from the more northern Tonlé Sap Lake. Under Phnom Penh, the Mekong again divides, entering Vietnam in two branches: the Mekong River (called the Tien River in Vietnam) and the Bassac River (called the Hau River in Vietnam) (Manh et al., 2014; Kummu et al., 2014).
Located in the North Pacific monsoon climate (Tamura et al., 2010; Manh et al., 2014), the Mekong Delta is strongly impacted by both flooding upstream and the tidal flows of the Gulf of Thailand and South China Sea. Flooding occurs in the wet season, from July/August to November/December, beginning when the annual average discharge at Kratie exceeds 13 600 m3 s−1 (Manh et al., 2014). At Tan Chau, on the Cambodia–Vietnam border, the Tien River carries about 80 % of the floodwaters (equivalent to 20 500–25 500 m3 s−1), whereas 20 % (equivalent to 6500–7660 m3 s−1 at Chau Doc) is transported by the Hau River (Tri, 2012). South of Vam Nao, the water volumes of the two rivers become more balanced, owing to interconnecting tributaries. Due to the delta's flat, low-lying topography (its average elevation is just 0.8 m above mean sea level) and the impact of tidal regimes (Hung, 2012), the annual floods inundate 1.2 to 1.9 million ha of the delta (Hoa et al., 2008; Kingdom of the Netherlands and the Socialist Republic of Vietnam, 2013). In a severe flood season, water depths reach up to 3 m, affecting the lives of more than 2 million residents. Tidal movements make understanding floodwater flows and distribution even more complex.

The LXQ and Plain of Reeds floodplains, due to their huge water retention capacity, play a key role in moderating peak floods. Floodwaters originate from the two main rivers and overland from Cambodia. As the aim of this study is to examine the effects of water control infrastructure on floodwater levels and distribution, we focused on the LXQ, as it has undergone the most extensive development of high dikes during the past decades. Most agricultural areas on the LXQ floodplains are protected by low dikes or high dikes. Low dikes allow floodwaters to overflow into the fields after the harvest of the second crop in mid-August. High dikes prevent floods year-round, enabling cultivation of a third rice crop (Howie, 2011). This has made the LXQ one of the VMD's highest productivity rice areas (Quang et al., 2012). The LXQ encompasses parts of three provinces, including a large part of An Giang and Kien Giang provinces and a small part of Can Tho Province (see also Fig. 1). The LXQ has 0.49 million ha of floodplains, located on the northern delta, west of the Hau River. Between the river and the dense network of canals that has long been a feature of this region, numerous dikes have been built, some topped by roads. Statistics from the Department of Agricultural and Rural Development show an enormous increase in the area protected by high dikes in An Giang Province, from 2591 ha in 1998 to 87 909 ha in 2009 (Kien, 2013). In Kien Giang Province, most agricultural areas are protected by low dikes. There are very few dikes in Can Tho Province.
3.1 Model setup and data preparation
We developed a one-dimensional (1-D) hydrodynamic model using the Mike 11 software developed by the Danish Hydraulic Institute (DHI). This is an implicit finite difference model for 1-D unsteady flow computation. In addition, it can be applied to a quasi-two-dimensional (quasi2-D) flow simulation appropriate for detailed modeling of rivers, including special treatment of floodplains, road overtopping, culverts, gate openings, and weirs (Doulgeris et al., 2012). The modeling procedure allows use of kinematic, diffusive, or fully dynamic, vertically integrated equations for conservation of continuity and momentum (the Saint-Venant equations) to solve complex flow and mass transport problems (Patro et al., 2009; Dung et al., 2011; Manh et al., 2014). In the model, the Saint-Venant equations are formulated as follows (DHI, 2011).
Continuity equation:
Momentum equation:
with Q discharge (m3 s−1), A flow area (m2), q the lateral inflow (m2 s−1), h stage above datum (m), C Chezy resistance coefficient (), R hydraulic or resistance radius (m), and ∝ the momentum distribution coefficient.
We developed our model to represent the river network and floodplains of the Mekong Delta. Data on the Mekong Delta river network and physical properties were derived from the Southern Institute for Water Resources Research (SIWRR). The hydrodynamic module included in Mike 11 was applied to simulate flow dynamics and inundations. We incorporated four main components: (i) the river network, (ii) boundary conditions, (iii) a cross section and (iv) a set of other parameters. Although rainfall accounted for only a small percentage of surface water inflows, we nonetheless included it in the model using the Rainfall Runoff (RR) module.
The 2011 river network was imputed into the model based on available data. The area of interest – from Kratie and the Tonlé Sap Lake in Cambodia to the river mouths in Vietnam – encompassed 5 million ha, 4084 river branches and 21 235 computational nodes (see Appendix A). For the canal and water control infrastructure network, sluice gates (14), weirs (2246), and control structures (2657) were identified, representing the infrastructure system. Sluice gates regulate water flows to larger areas. Weirs regulate flows into and out of agricultural fields. The control structures considered were reservoirs, which prevent water overflow at a specific sill level.
Boundary conditions for the model were set using discharges and water levels observed in 2011 and 2013. All daily data were provided by the National Centre for Hydro-Meteorological Forecasting (NCHMF) and SIWRR. Discharges from six stations were imputed for the upstream boundary conditions, while the downstream boundary conditions were provided by water levels measured by nine tide gauges near the coast. Upstream, the discharge at Kratie was the most important boundary input for drawing the main flood hydrograph to simulate discharges and water levels downstream for the VMD.
We embedded 13 000 cross sections in the model. These described the topography of the rivers and branches. Cross-section data were collected from various sources. Data concerning the major streams were very reliable, as these measurements were produced and regularly updated by national projects. For the branches, bathymetric data were used for most cross sections, though this process meant that accuracy was likely lower. These cross sections had, however, been tested in various SIWRR projects.
Our set of other parameters included river roughness, wind effects, and various components derived from DHI (2011). These described the physics of the Mekong Delta. Among them, the river roughness coefficient was the most important and sensitive parameter. River roughness was represented in the model as Manning coefficients, which we initially estimated based on published values corresponding to particular types of rivers and canals (Chow, 1959; Fabio et al., 2010; Dung et al., 2011). First, referring to Chow (1959), we set the Manning coefficients as 0.020 (irrigation channel, straight, on hard-packed smooth sand), 0.025 (earth channel excavated in alluvial silt soil, with deposits of sand on the bottom and grass growth), and 0.033 (natural channel, somewhat irregular side slopes, very little variation in cross section). These were used for all rivers and branches in the three initial model runs to identify changes in water levels and discharges of the main rivers. Second, we calibrated the model by modifying these numbers for the branches in the more coastal areas. After model fitness was satisfactory for the stations near the coast, we defined a range of Manning coefficients (0.024–0.017) for the Tien and Hau rivers. Rivers in the Cambodian part of the delta were given a range of 0.1–0.05, whereas a range of 0.03–0.025 was selected for the rivers and canals on the VMD floodplains. These parameters were optimized during the calibration process.
Daily rainfall data were derived from 37 meteorological stations (28 in Vietnam and 9 in Cambodia). Thiessen polygons were used to describe the contribution of surface water flows to river and canal discharge. In the model, we divided the Mekong Delta into 120 sub-regions, with data from rainfall gauges for each. The rainfall discharge had to be calibrated using the RR module provided with the Mike 11 NAM before it could be used for the hydraulic model simulations.
3.2 Calibration and validation
The flood model had to be calibrated and validated to ensure reliable performance. For calibration, we used the severe flood year of 2011. To validate the model, we used data from the 2013 flood season. These 2 years were selected because the river and infrastructure network, land uses, and dike locations were similar in both years. The Nash–Sutcliffe efficiency (NSE) and correlation coefficients were used to check the model's goodness-of-fit for the calibration and validation periods. The NSE is one of the most commonly used efficiency criteria in hydrology. It measures how much of the variability observed is explained by the simulation. A perfect simulation has an NSE of 1 (Ritter and Muñoz-Carpena, 2013). The correlation coefficient (R2) expresses the linear relationship between observed and simulated values.
For the calibration and validation periods, we used hourly discharge and water level time series from 15 gauging stations, including 11 stations along the Tien and Hau rivers and 4 stations on the floodplains (Fig. 1). We selected these stations because (i) the objective of our study was to explore the water level dynamics in the main streams and LXQ and (ii) observational data were available from each.
In addition to calibration and validation for the 2011 and 2013 data, we assessed model performance for the 2000 flood hydrograph. Using flow data from 2000, including discharge at Kratie and water levels at nine tide gauges, we ran the model assuming the 2011 river network and land use system. Model outputs were compared to maximum river flows in the Hau River.
3.3 Modeling for the floodplains
To simulate the hydraulic dynamics of the floodplains, the quasi2-D approach was combined with 1-D modeling. In the quasi2-D model, the floodplains were described as a network of fictitious river branches and spillovers with the main rivers. This approach had several advantages, i.e., (i) transferring some of the benefits of 2-D flow calculations and flow directions to the 1-D hydrological model; (ii) saving computation time because fewer input data were needed; and (iii) reliable model representation of physical processes (Lindenschmidt, 2008; Soumendra et al., 2010).
We used different approaches to model the floodplains in Cambodia and in Vietnam. The Cambodian floodplains without channels and dikes were simulated by wide cross sections using the 1-D method. For the LXQ, we applied the quasi2-D approach to formulate the hydrodynamic interactions between the floodplains and rivers under various dike construction scenarios. Although the Plain of Reeds itself was not a focus of this research, we included it in the model with the dikes as constructed in 2011, to better understand the hydraulic interactions between the Tien and Hau rivers via the Vam Nao River and tributaries. The LXQ floodplains are characterized by a dense network of dikes and channels, producing multitudes of compartmentalized fields for agriculture.
Our model has 554 dike compartments representative of the floodplains of the VMD. Our modeling approach for simulating the interaction between rivers and floodplains is to consider that each dike compartment is a flood cell. It means each flood cell is a specifically defined and isolated geographical area as a rectangle surrounded by real dikes and channels. This approach, from Dung et al. (2011), is illustrated in Appendix A. In the figure, each compartment was considered as a flood cell and modeled as a fictitious river branch with a low and wide cross section, as extracted from a SRTM digital elevation model (Shuttle Radar Topography Mission DEM, 90 m×90 m resolution). These data also help the model to estimate each cell volume. The control structures linked these fictitious river branches to real channels. Weirs represented dikes and overflows. Dike height was adjusted by changing the sill level of the control structures. By using this approach, floodwater could flow in and out the flood cells, depending on the height of dikes as the sill level of the control structures.
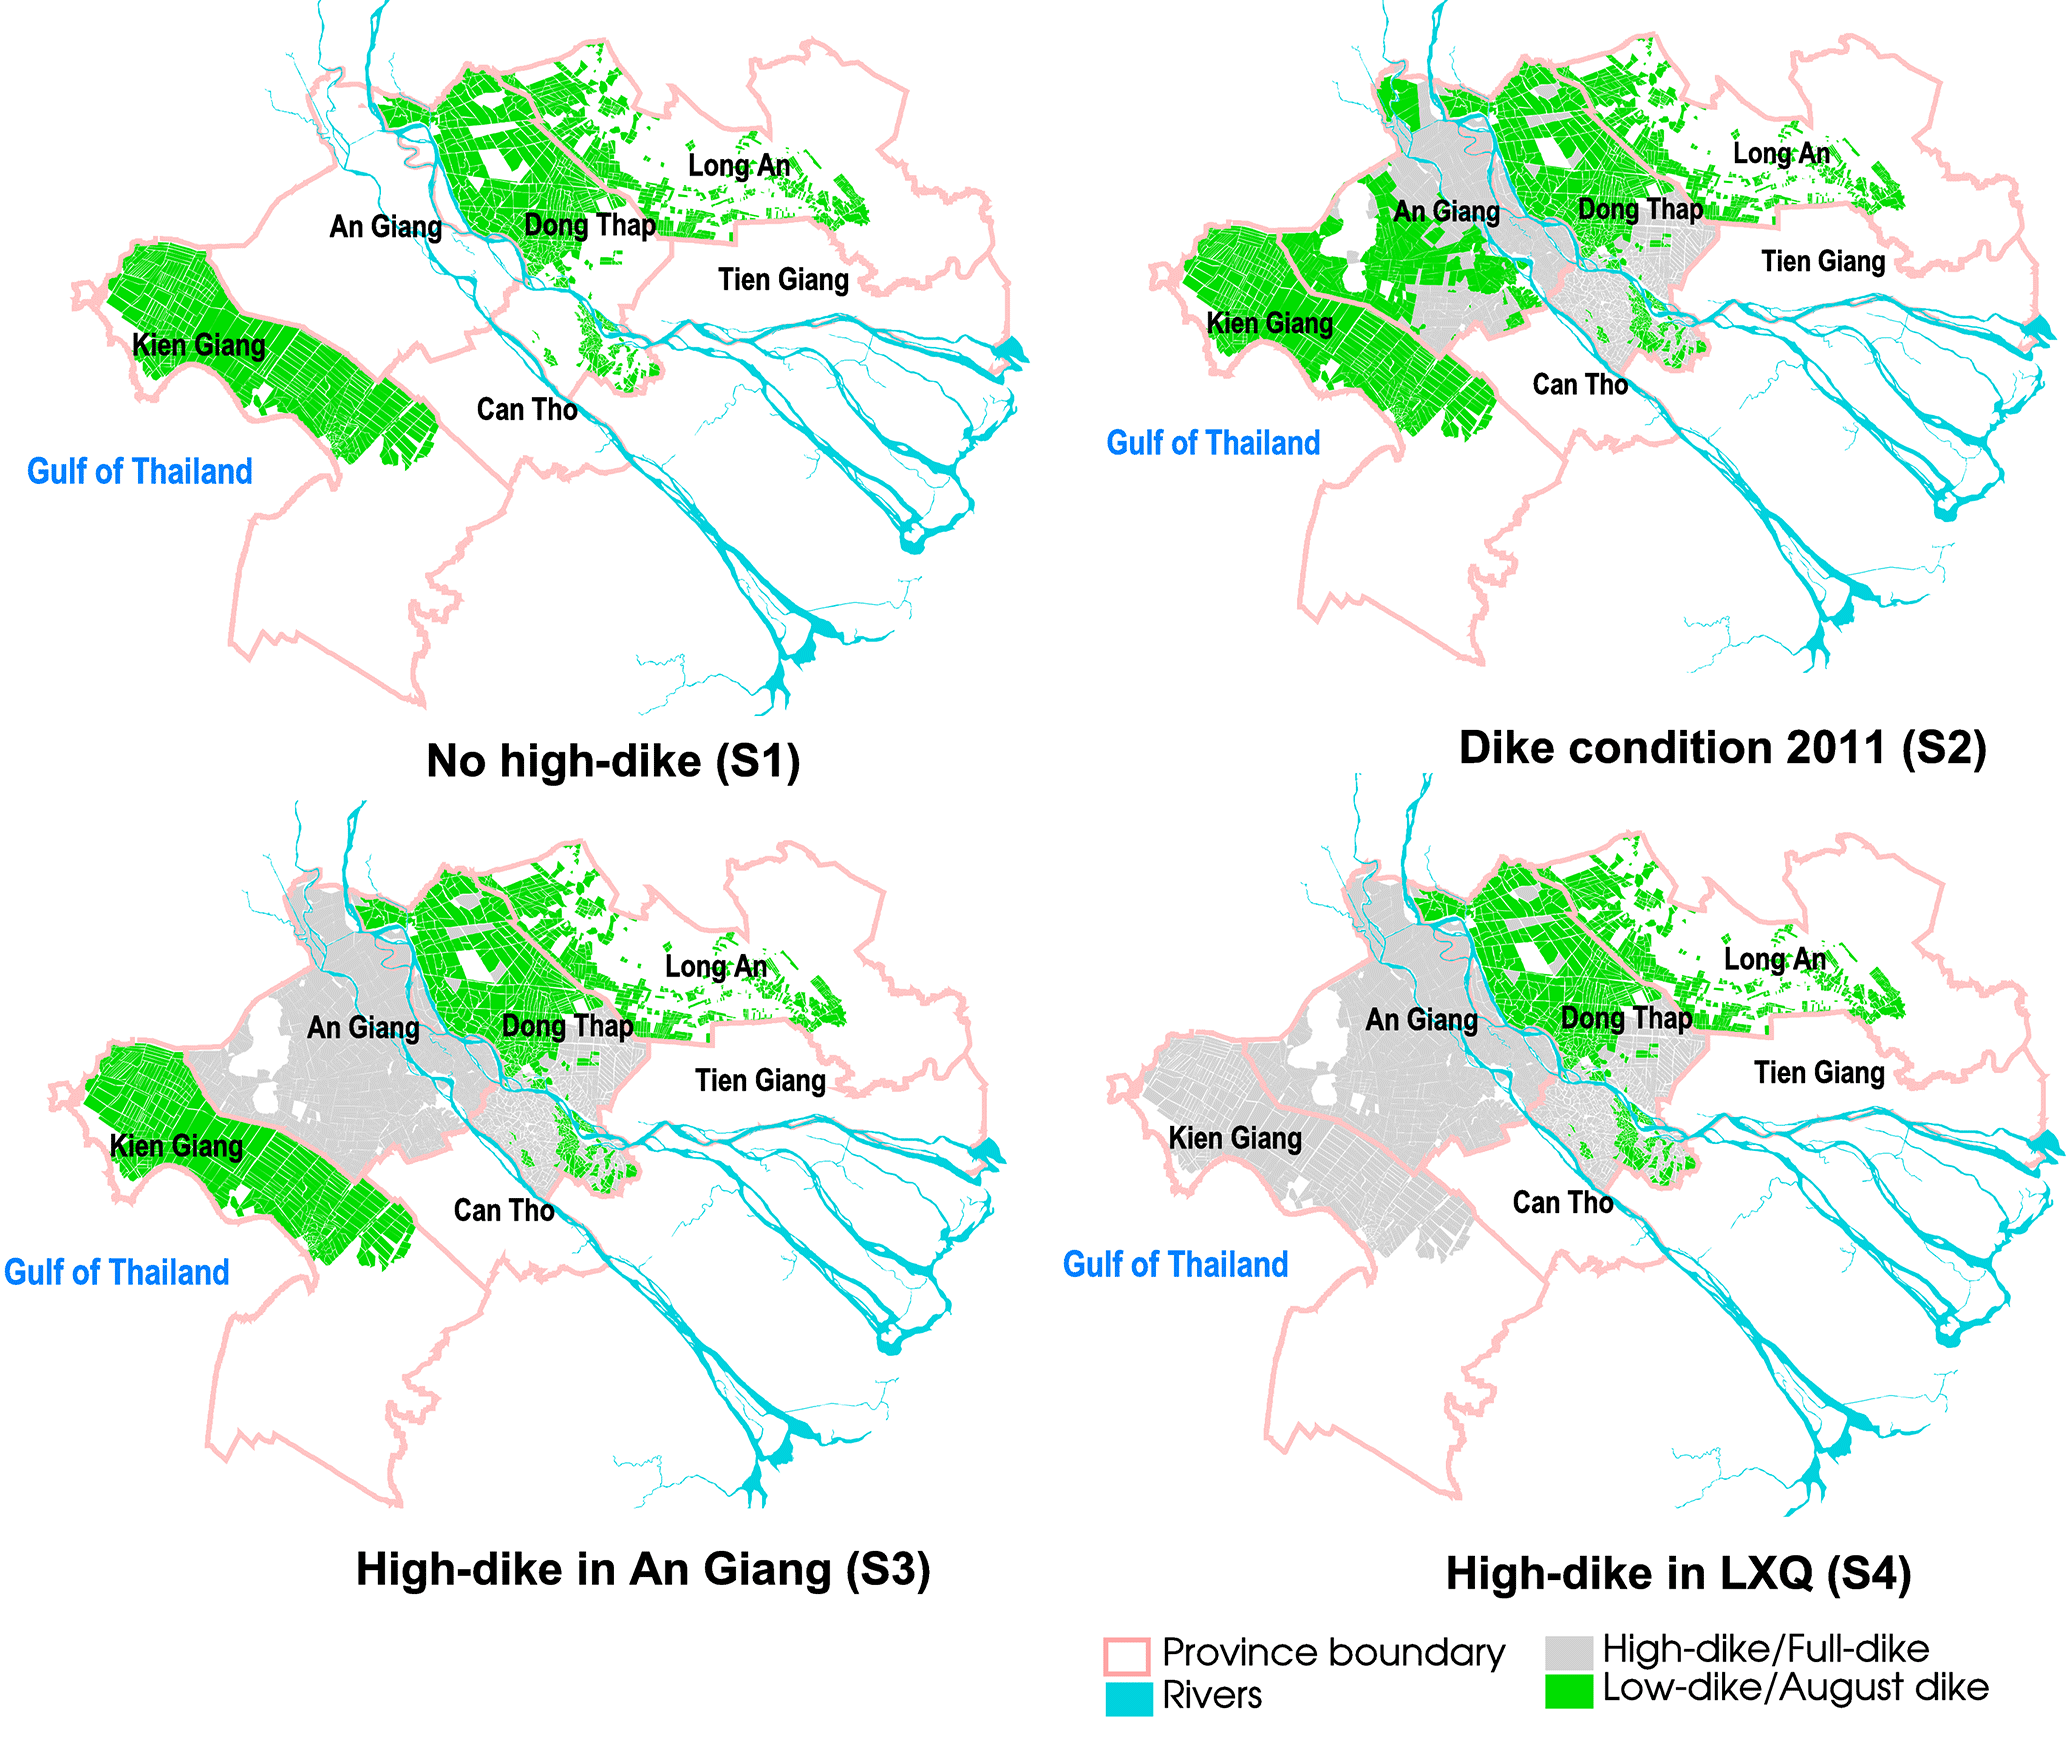
Figure 2Dike construction scenarios: (S1) no high dikes, (S2) dike infrastructure as in 2011, (S3) high dikes throughout An Giang Province, and (S4) high dikes throughout the Long Xuyen Quadrangle.
3.4 Dike construction scenarios
Various dike construction and land use scenarios were developed to explore the impacts of dikes on flood dynamics (Fig. 2). The first scenario (S1) provided a baseline to explore flood dynamics without the impact of high dikes.2 All of the high dikes were therefore removed from the model in this scenario. Without the high dike compartments, water discharge is freely distributed over the LXQ and throughout the canals along the Hau River. The second scenario (S2) represents the dike infrastructure and land use conditions of 2011. Here, more than half of the total agricultural area in An Giang Province is set off by high dikes, with the remaining areas protected by low dikes. Kien Giang Province had only low dikes in 2011. The third scenario (S3) depicts a system in which high dikes protect the entire An Giang Province. The fourth scenario (S4) represents a system with high dikes across the entire LXQ.
3.5 Water balance calculation
To understand why and where the water movements on the floodplains cause changes in downstream flows, we calculated water balances for each scenario. For the 1-D hydrological model representing the complex hydraulic situation of the Mekong Delta, all components in the water balance equation were estimated. The water balance equation is as follows:
where is total inflows and is total outflows to the LXQ, in cubic meters per second (m3 s−1), corresponding to the starting time t1 (July) and ending time tn (December) of the flood simulations. V is the controlled volume and V0 is the initial volume, in cubic meters (m3).
From the output of the hydraulic model, we extracted discharge time-series data from canals along the closed boundaries of the LXQ to calculate flow volumes over the July to December period. Inflows include the water fluxes along the Vinh Te Canal and along the Hau River. Outflows were taken from the Cai San Canal and the canal along the Gulf of Thailand. The water balance was also computed for the Hau River. Here, the water fluxes at Chau Doc and the volume of the Tien River were input flows, while the output flows consisted of discharges along the Hau River to the LXQ, through the Cai San Canal, and at the point on the Hau River beyond the Cai San Canal. Rainfall volumes were calculated from the individual rainfall simulation files.
Table 1Correlation coefficient and Nash–Sutcliffe efficiency of water levels (WL) and discharges (Q) for 2011 (calibration) and 2013 (validation).
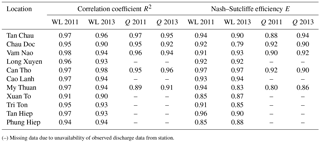
(–) Missing data due to unavailability of observed discharge data from station.

Figure 3Time series of daily simulated and observed flows in 2011 at all stations used for model calibration.
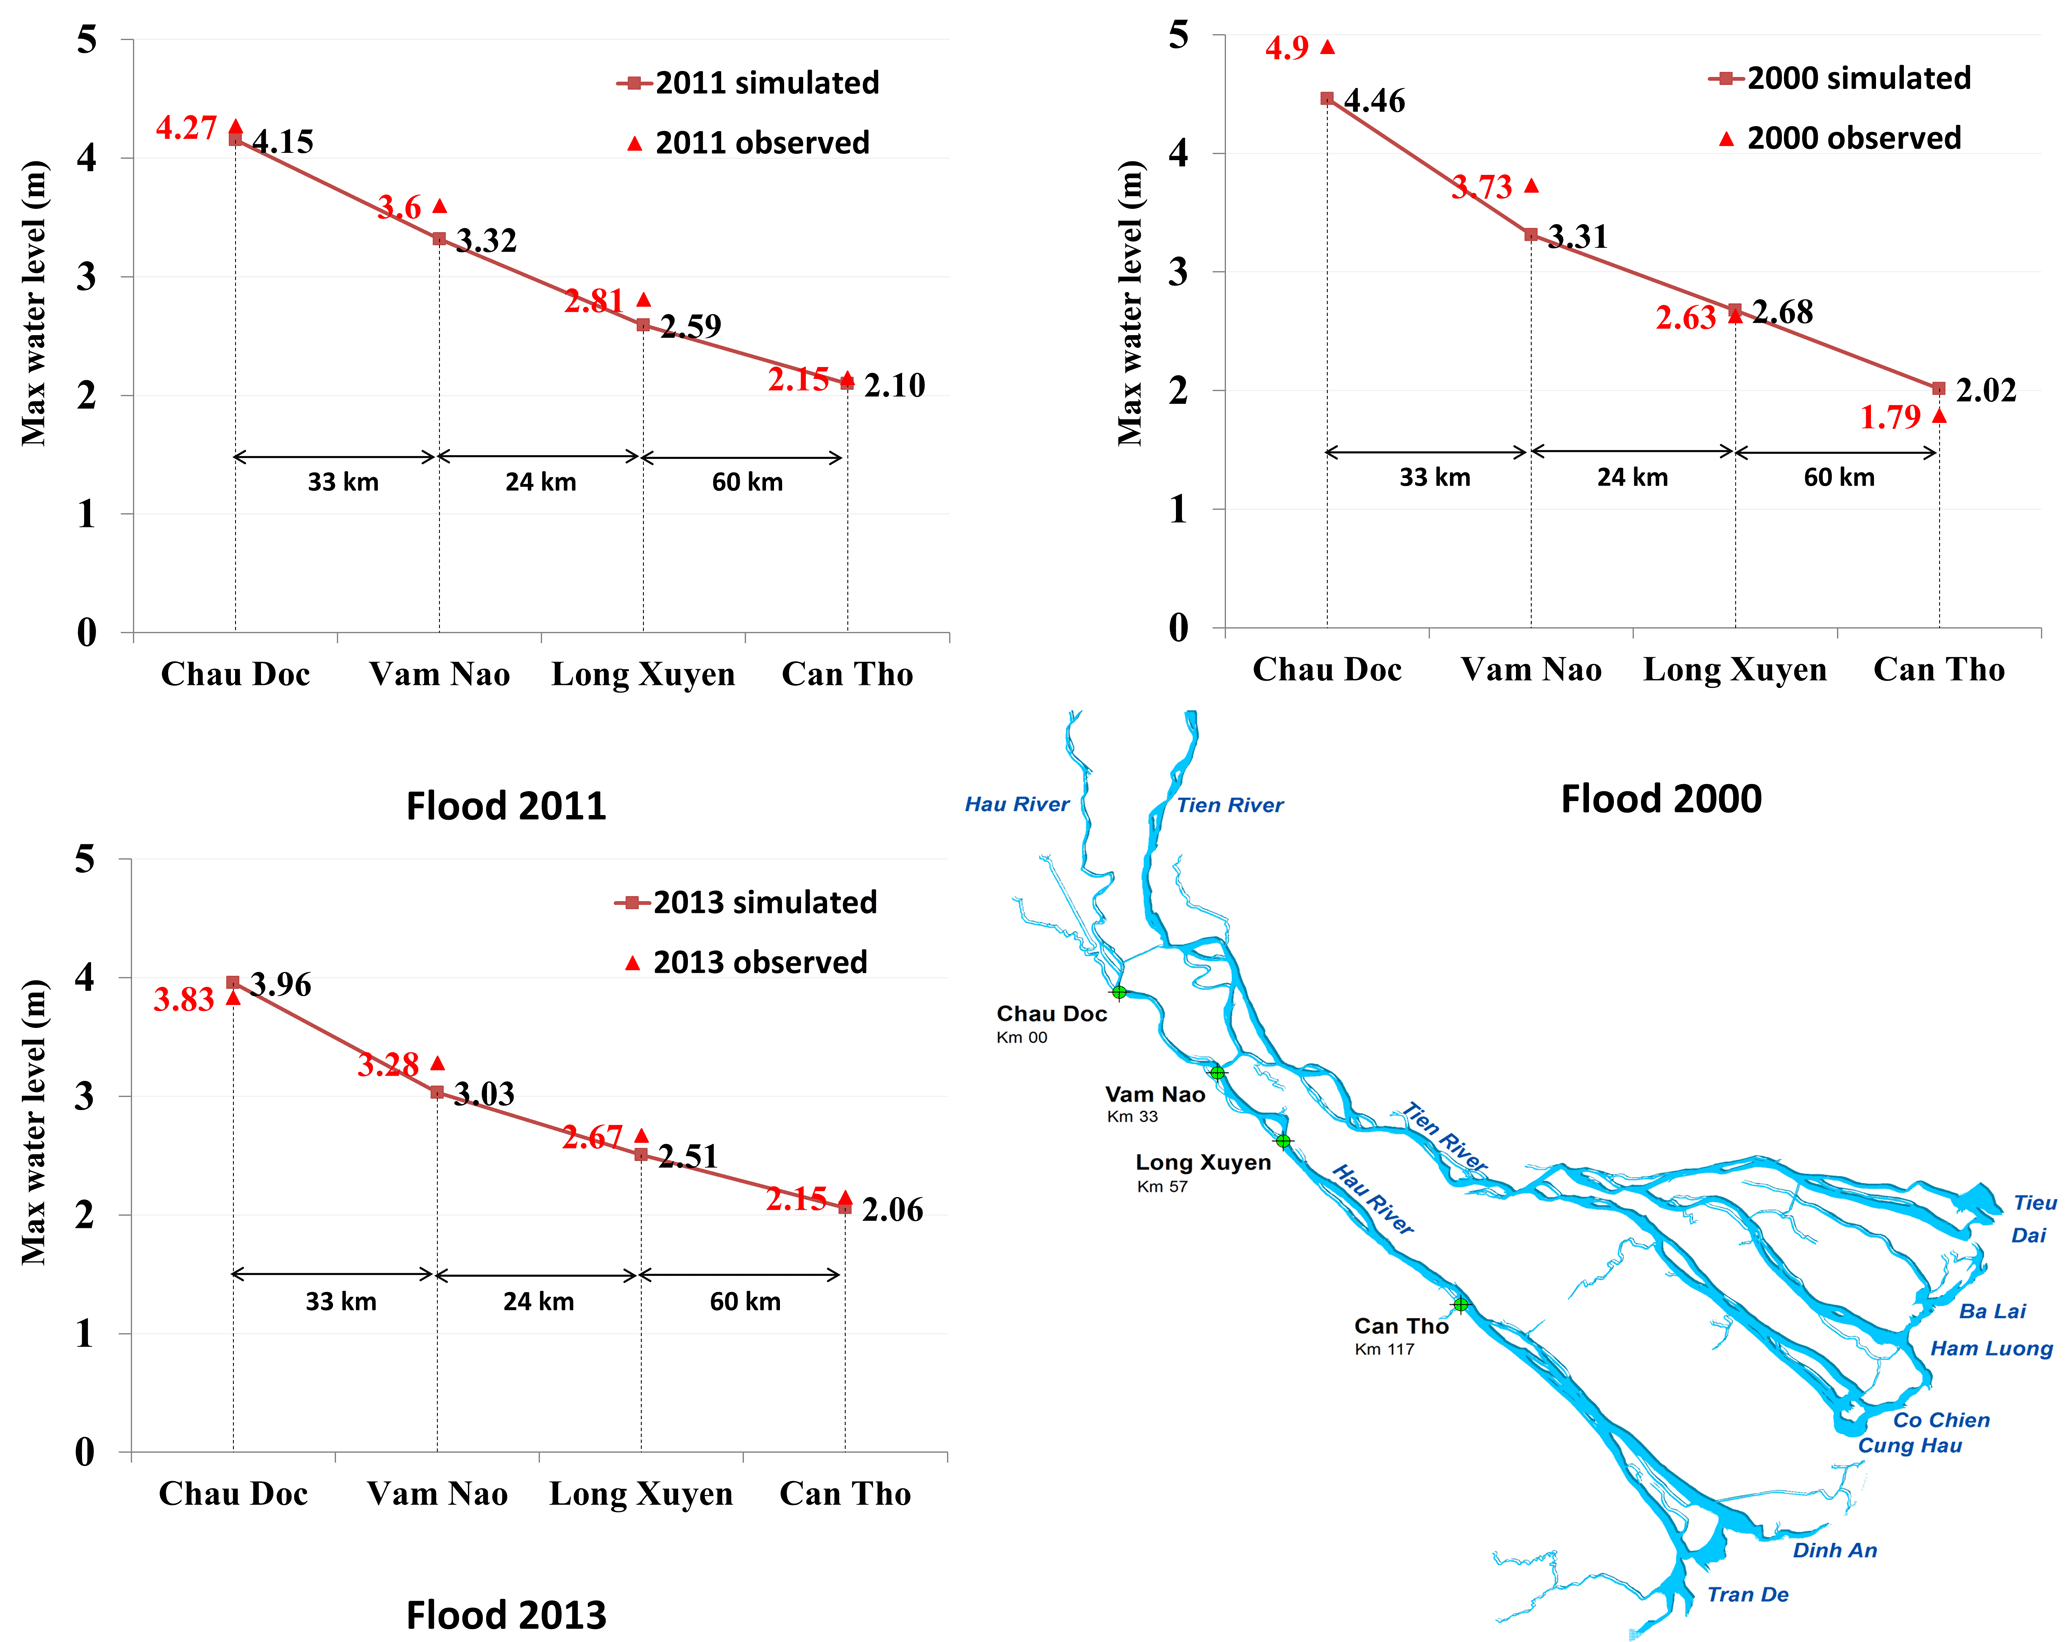
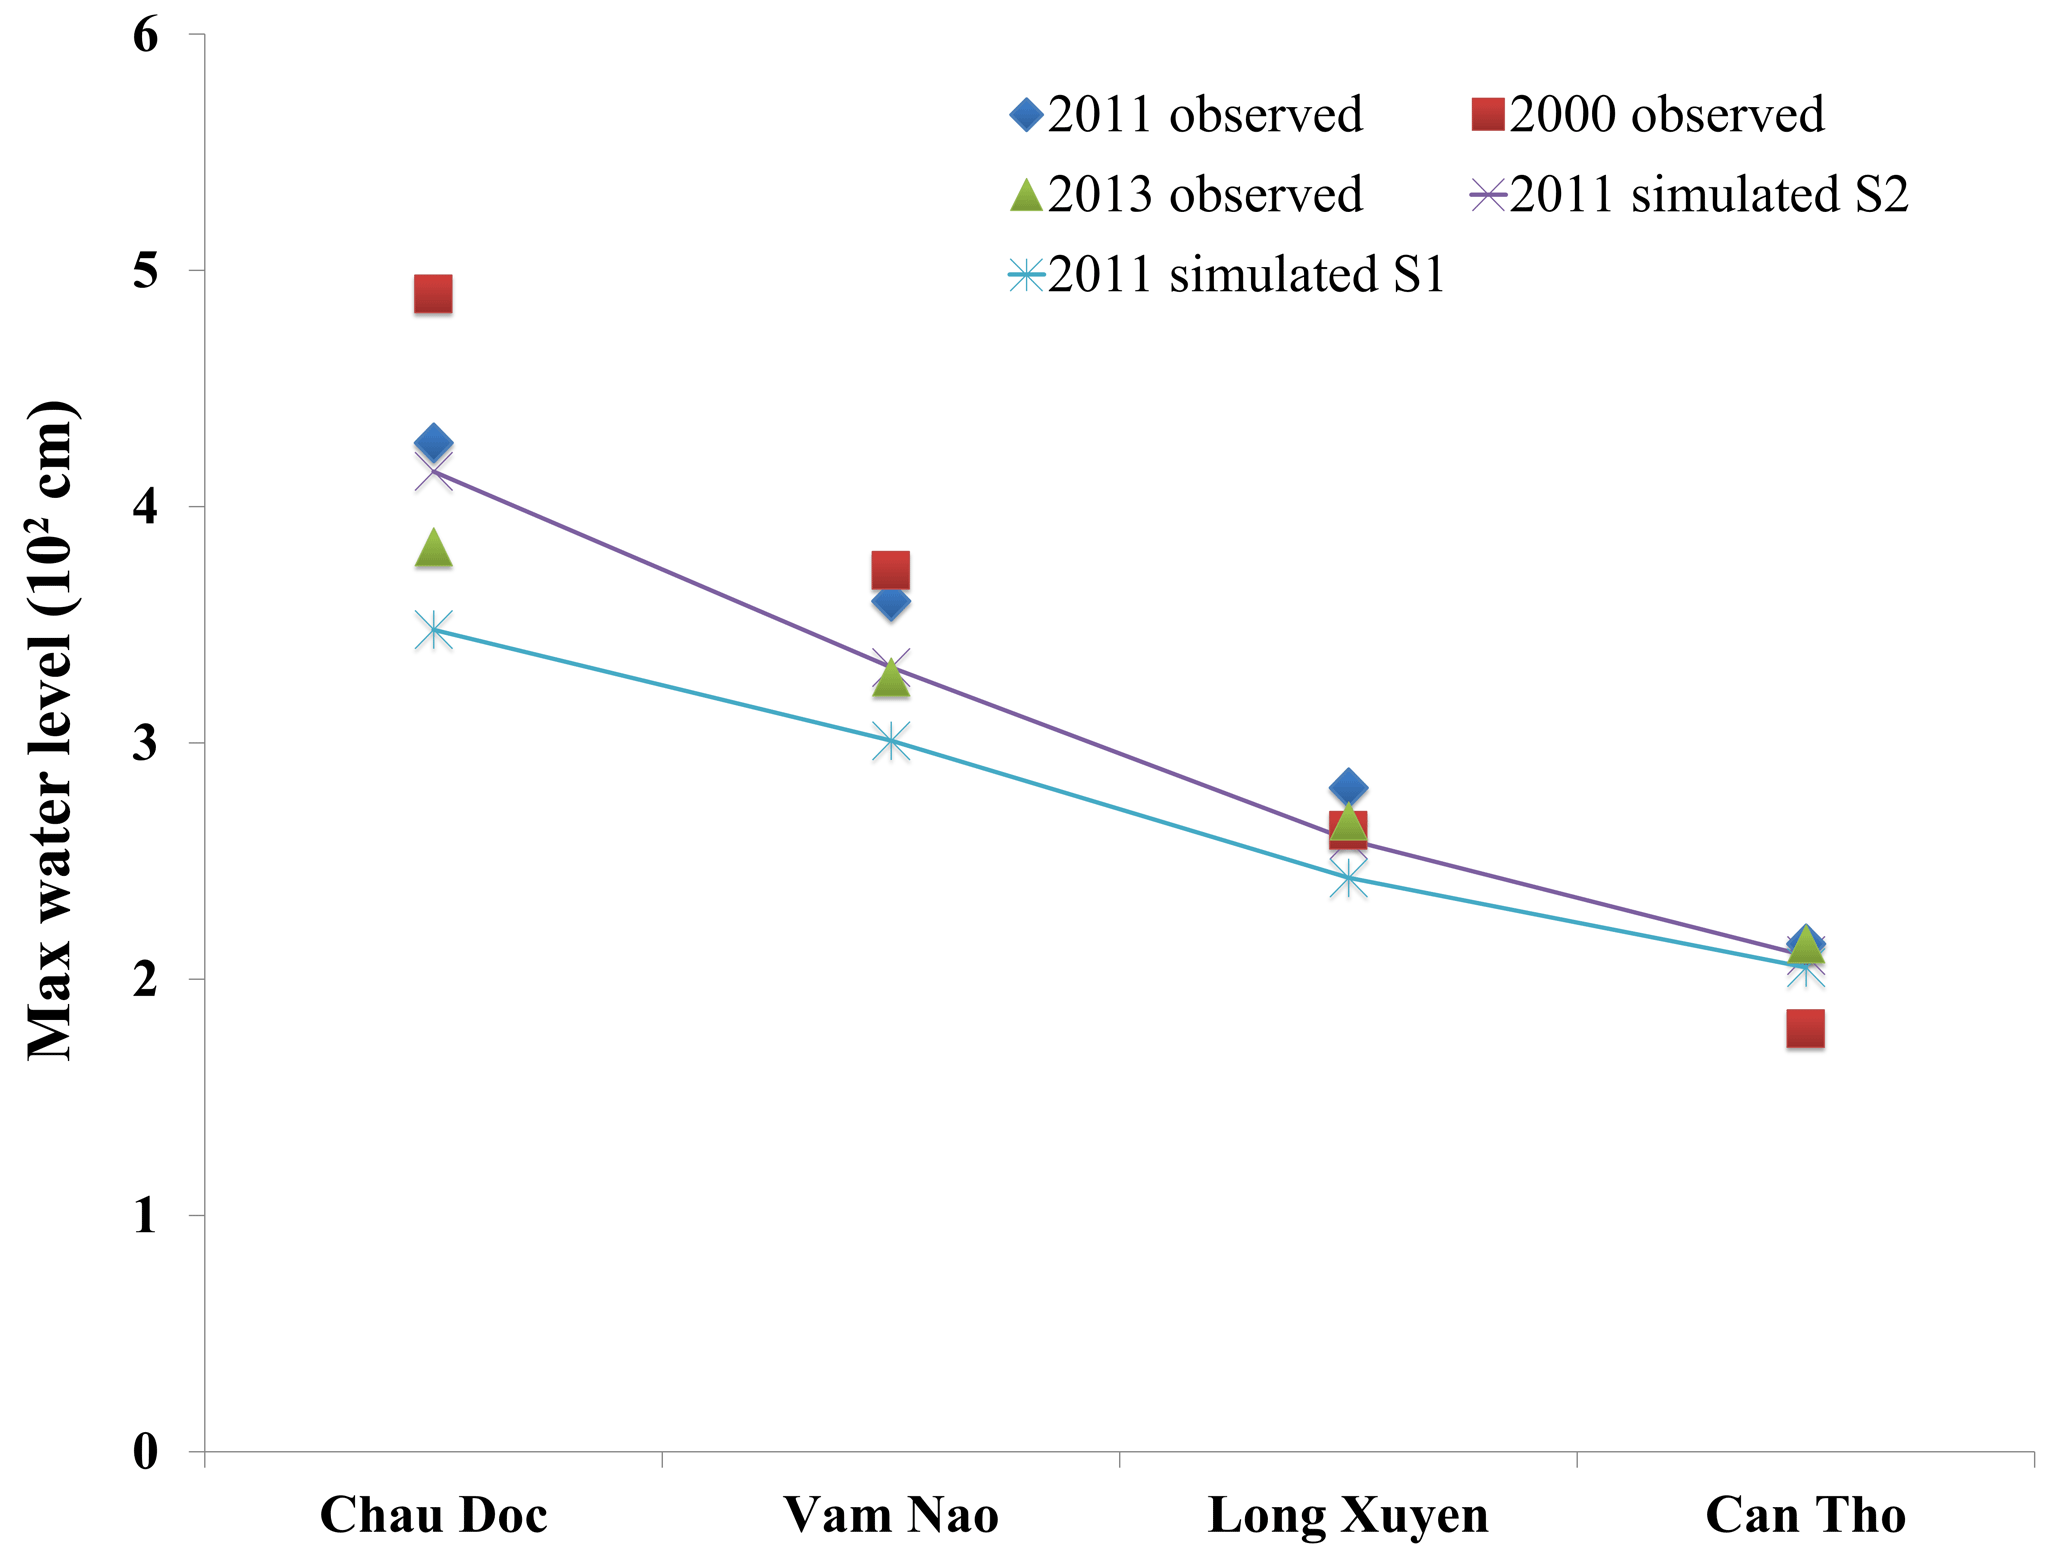
Figure 4Simulated and observed peak water levels for the 2000, 2011, and 2013 flood years at four stations along the Hau River.
4.1 Calibration and validation results
Table 1 presents the calibration and validation results. Additionally, Fig. 3 presents the time-series plots for the streamflow results of 2011. Q–Q plots for representative stations and time-series plots for the 2013 results are shown in Appendix B. Our NSE and R2 values computed for selected stations suggest generally very good performance of the model, in ranges, respectively, of 0.79–0.97 and 0.89–0.98. The 2011 calibration period shows better performance than the 2013 validation period. This is expected, as changes in infrastructure and dike network may have occurred between 2011 (calibration) and 2013 (validation) which were not incorporated in the model. For example, the NSE of the water level found in Chau Doc in 2013 is 0.79 compared to 0.92 in 2011. The My Thuan station shows lower NSE values for both 2011 and 2013, but these values are still greater than 0.8. For the stations located within the floodplains, good fitness was found in water levels (0.85–0.96); unfortunately, discharge observation data were not available for those stations.
Model performance was also judged as good considering the small difference between the peak water levels produced by the simulation and those observed in 2011 and 2013 (Fig. 4). However, the peak values simulated were in most cases lower than observed values. The discrepancy was greater for 2000 than for 2011 and 2013. The simulation returned a slightly lower peak river water level at Can Tho in 2000 (2.02 m) compared to 2011 (2.10 m). According to observational data, however, the highest water level observed in Can Tho in 2000 was 1.79 m, whereas 2.15 m was observed in 2011.
Table 2Tidal water levels in numbers of hours above various thresholds, observed at the My Thanh and Ben Trai stations in the 2000 and 2011 wet seasons (July to December).
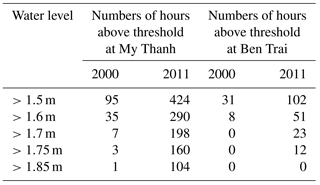
Table 3Changes in river water level and origins at Can Tho (2000, 2011).
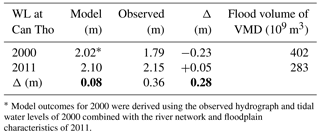
* Model outcomes for 2000 were derived using the observed hydrograph and tidal water levels of 2000 combined with the river network and floodplain characteristics of 2011.
This raises the question of whether the changes in river water levels at Can Tho are primarily attributable to changes in the floodplains and canal networks between 2000 and 2011, or to the effect of the higher tidal movements observed in the estuaries of the Tien and Hau rivers. Tidal flows in these estuaries were markedly higher in 2011 than in the peak flood year of 2000, suggesting potential backwater curve effects (Table 2). However, the model results for 2000 (using the 2011 river and infrastructure network and the 2000 river water level and tidal data) compared to those for 2011 (2011 river and infrastructure network and 2011 water levels) show just a modest increase of 0.08 m at Can Tho (Table 3). This suggests that the tidal backwater effect seems to be limited. It is significantly smaller than the difference in water levels observed between 2011 and 2000, which amounts to 0.36 m at Can Tho. This analysis suggests that the tidal influence is approximately 0.08 m, while the effect of changes in the river and infrastructure network and on the floodplains amounts to 0.28 m in terms of river water levels at Can Tho. Given that the total flood volume in 2011 was 30 % less than in 2000 (283×109 m3 compared to 402×109 m3), the effect of changes in the river and infrastructure network and floodplains appears relatively large.
Figure 4 shows a good fit between the simulated and observed peak water levels for the floods in 2011 (calibration) and 2013 (validation). In the 2000 flood, the fitness is low due to the significant changes in physical topography such as river network and branches and river cross sections between the model setup of 2011 and the measured data in 2000.
Table 4Peak water levels under different dike construction scenarios in the boundary canals of the Long Xuyen Quadrangle.
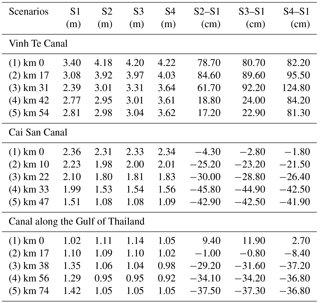
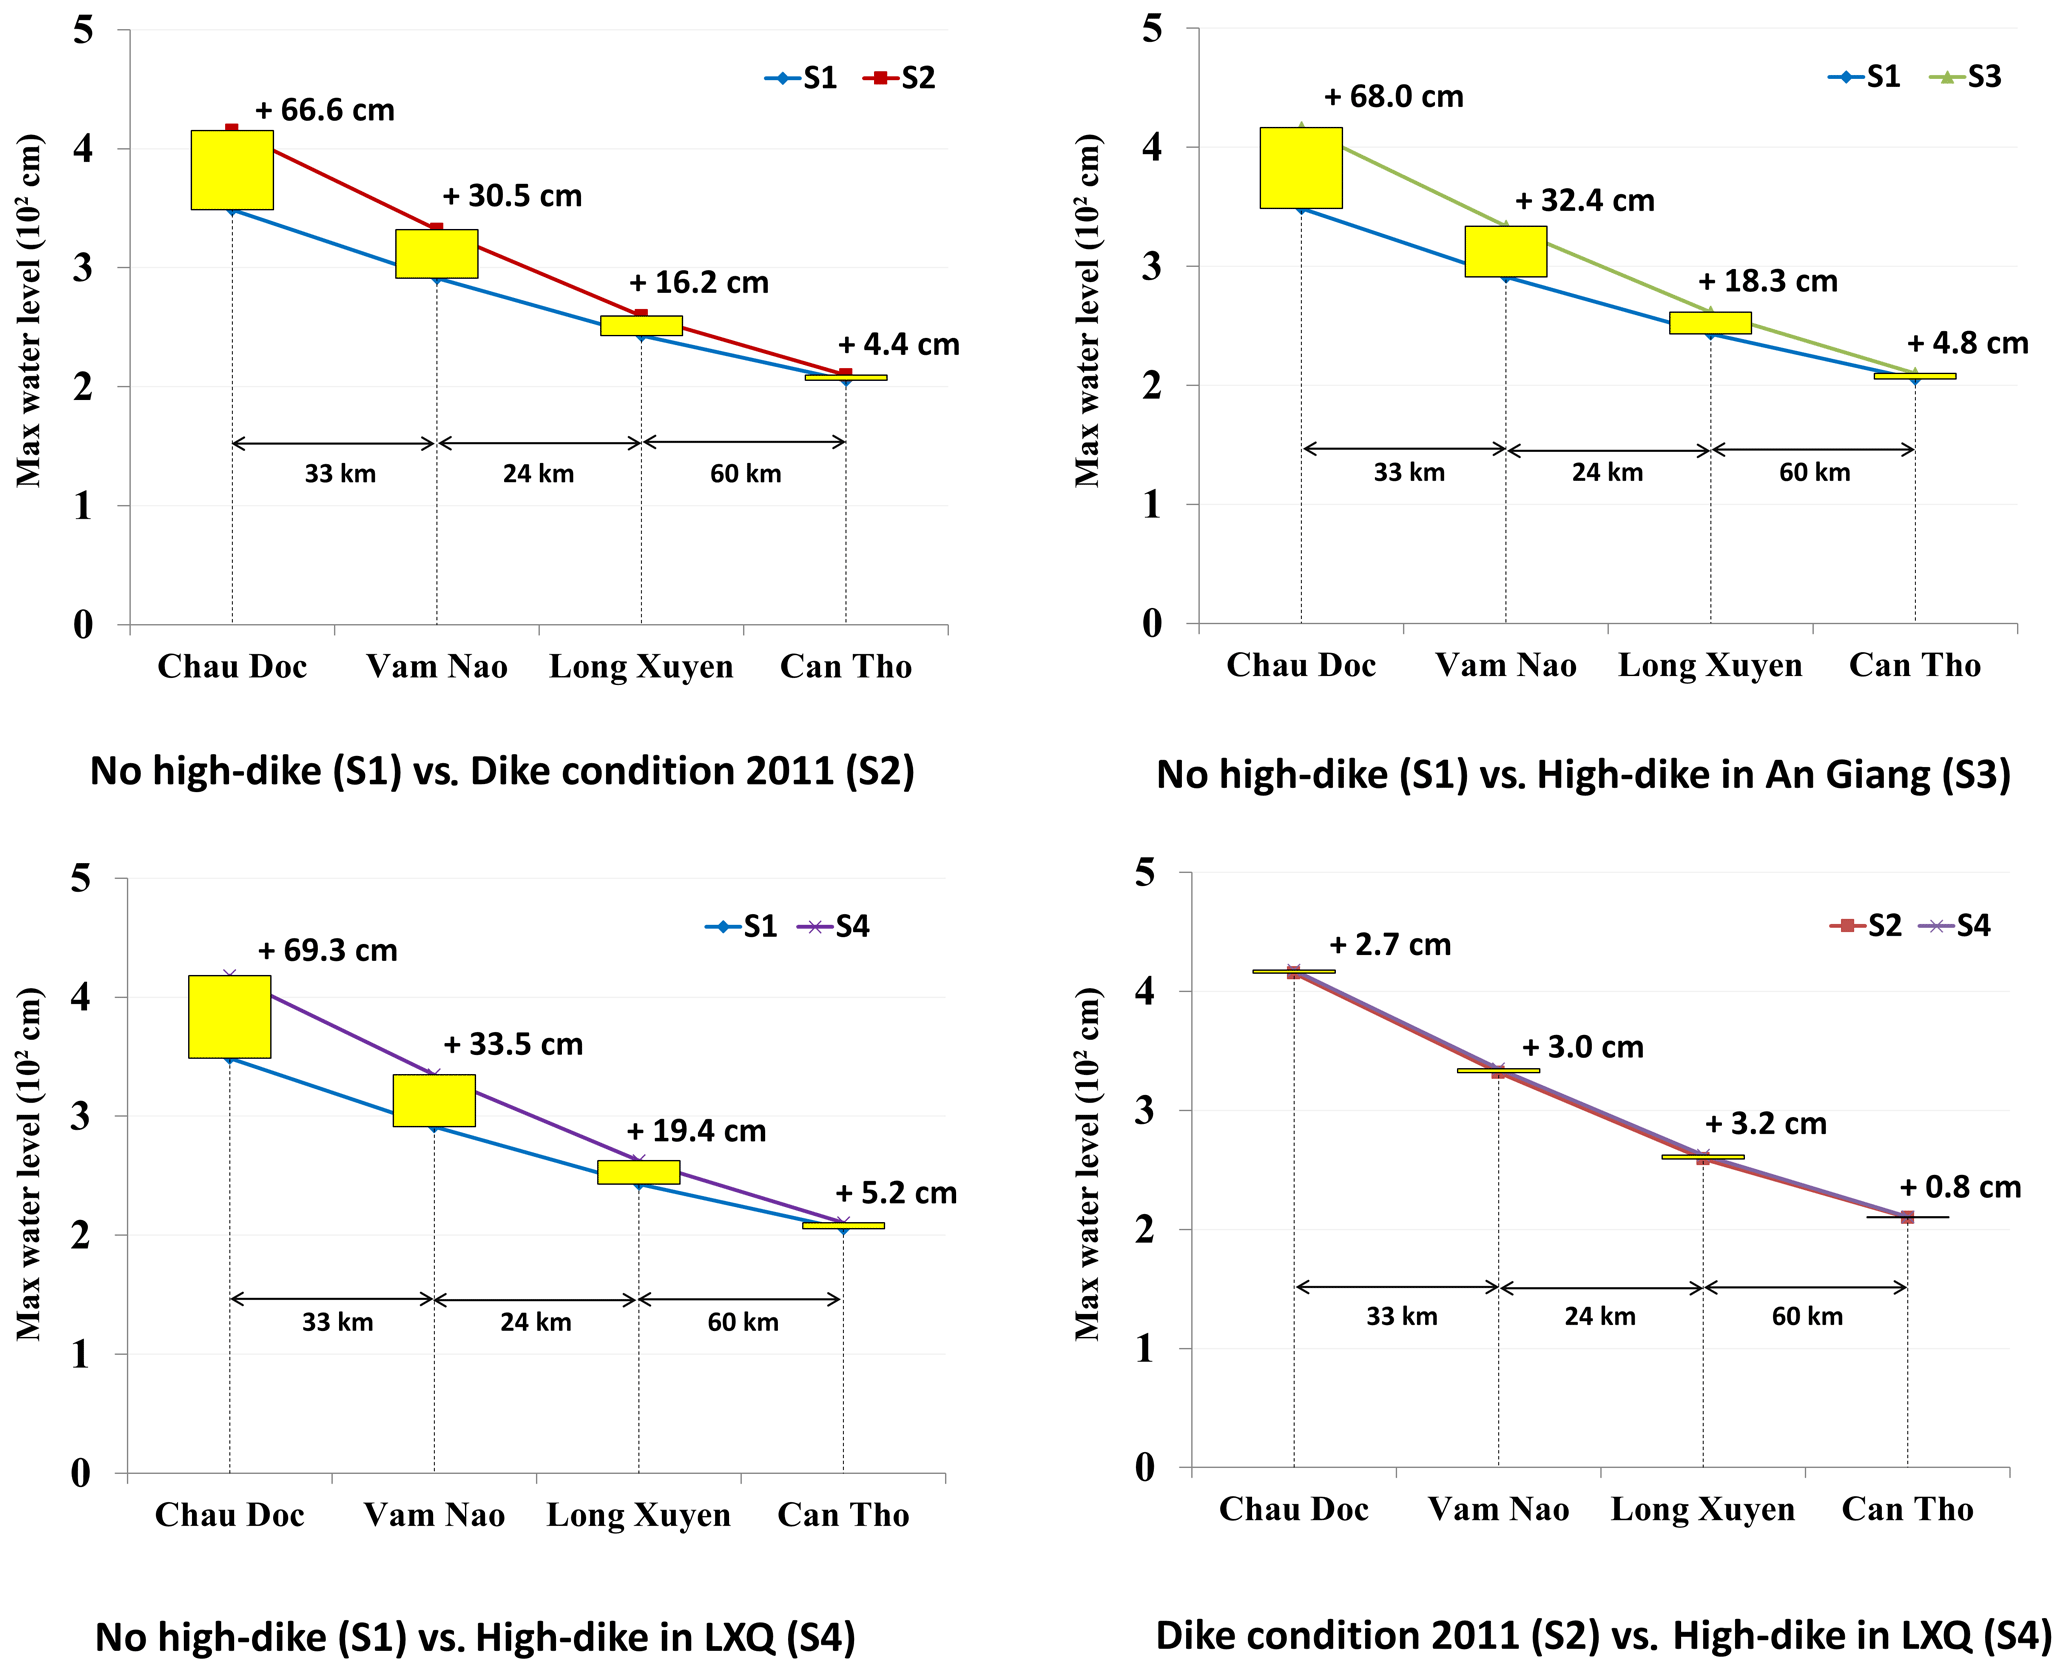
Figure 5Comparison of peak river water levels at stations along the Hau River resulting from different scenarios (note: LXQ is the Long Xuyen Quadrangle).
4.2 Flood dynamics under the impact of dike construction
Simulation results indicate that if all high dikes were removed (S1), peak river water levels would be much lower, especially in the upper part of the Mekong Delta (Fig. 5). Compared to the 2011 situation (S2), peak river water levels would be reduced by 66 cm at Chau Doc and 31 cm at Vam Nao if all high dikes were removed. At Can Tho, however, differences in peak river water levels were relatively small: removing all high dikes reduced peak levels in Can Tho by only about 4 cm. Within the LXQ, removal of all high dikes would result in relatively large increases in peak water levels upstream (90, 40, and 50 cm at Xuan To, Tri Ton, and Tan Hiep, respectively), compared to downstream points (2 cm at Phung Hiep) (Fig. 6). In the Vinh Te Canal, water levels fall under a no high dike scenario (by 17.2–84.6 cm from upstream to downstream), but they increase in the Cai San Canal (4.3–45.8 cm) and in the canal along the Gulf of Thailand (fluctuating 1.0–34.1 cm along the canal) (Table 4).

Figure 6Comparison of peak water levels at stations in the Long Xuyen Quadrangle (LXQ) resulting from different scenarios.

The increases in river water levels from high dike expansion in An Giang Province and the LXQ (S3 and S4) show a similar pattern to S2 (dike infrastructure as in 2011) and S1 (no dikes). The model presents very slight increases in river water levels (2–3 cm upstream and 1 cm downstream) from expansion of the high dikes (S3 and S4) compared the 2011 dike scenario (S2) (Figs. 5 and 6). Overall, we found major differences only between the baseline scenario (S1) and the high dike scenarios (S3 and S4).
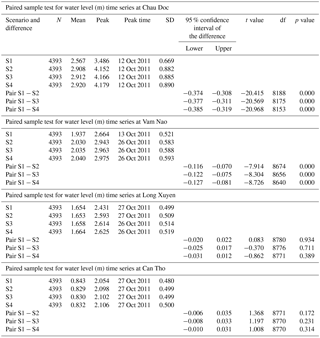
Paired sample t tests indicate significant differences between simulated and observational water level data for the different scenarios at upstream stations, but not for those downstream (p<0.05) (see Appendix C).
4.3 Floods of 2000 and 2013
To assess the impact of different floods on peak river water levels, we ran our four scenarios with the 2000 and 2013 flood hydrographs, compared to the base runs for 2011. These simulations resulted in upstream concentrations of water level increases for all of the three flood hydrographs (Fig. 7). The largest increases in river water levels were found for the high dike scenarios (S2, S3, and S4). These produced similar absolute increases in relation to the no dike scenario (S1) under all three hydrographs. The suggestion here is that peak levels in the Hau River are relatively independent of the amount of floodwater and flow regime, as water volumes for the simulations differed quite starkly, from 402×109 m3 (2000) to 283×109 m3 (2011) and 236×109 m3 (2013).
4.4 Variability in upstream and downstream water levels
Across the four scenarios and the three flood hydrographs, our model results indicate pronounced increases in water levels in the upstream reaches, with levels remaining fairly constant downstream (Fig. 8). For scenarios S1 and S2 and the 2000, 2011, and 2013 flood hydrographs, we calculated coefficients of variation (CV) for the water levels. At Chau Doc, upstream, the CV was 0.47, diminishing to 0.07 downstream at Can Tho. Two explanations may account for the limited variability found in water levels downstream: (i) use of tidal water level data at the river estuary as a boundary condition for the model and (ii) the coast-to-upstream direction of our model calibration procedure.
The tidal water level data at the estuary of the Mekong were influenced by the (peak) river discharges in the years considered, with peak river flows particularly influencing river mouth levels at high and low tide. Thus, our model's boundary conditions were not only set by tidal movements, but also influenced by river discharges at the estuary mouth for the years considered. In calibrating our model, we first set the roughness coefficients for the coastal area to agree with recorded water levels before calibrating for river water levels and discharges in the upstream parts. This potentially reduced the variability in downstream water levels. Potential biases of water level would be propagated toward the upstream reaches and outer edges of the model.
On the other hand, the dissipation effect of a floodplain and river network as large as the Mekong Delta is expected to yield relatively smaller change amplitudes in downstream water levels, as changes are modulated across a large area. However, any further reduction in the floodplain area and its dissipation capacity would be expected to produce a markedly increased amplitude in downstream water levels.
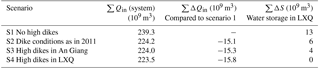
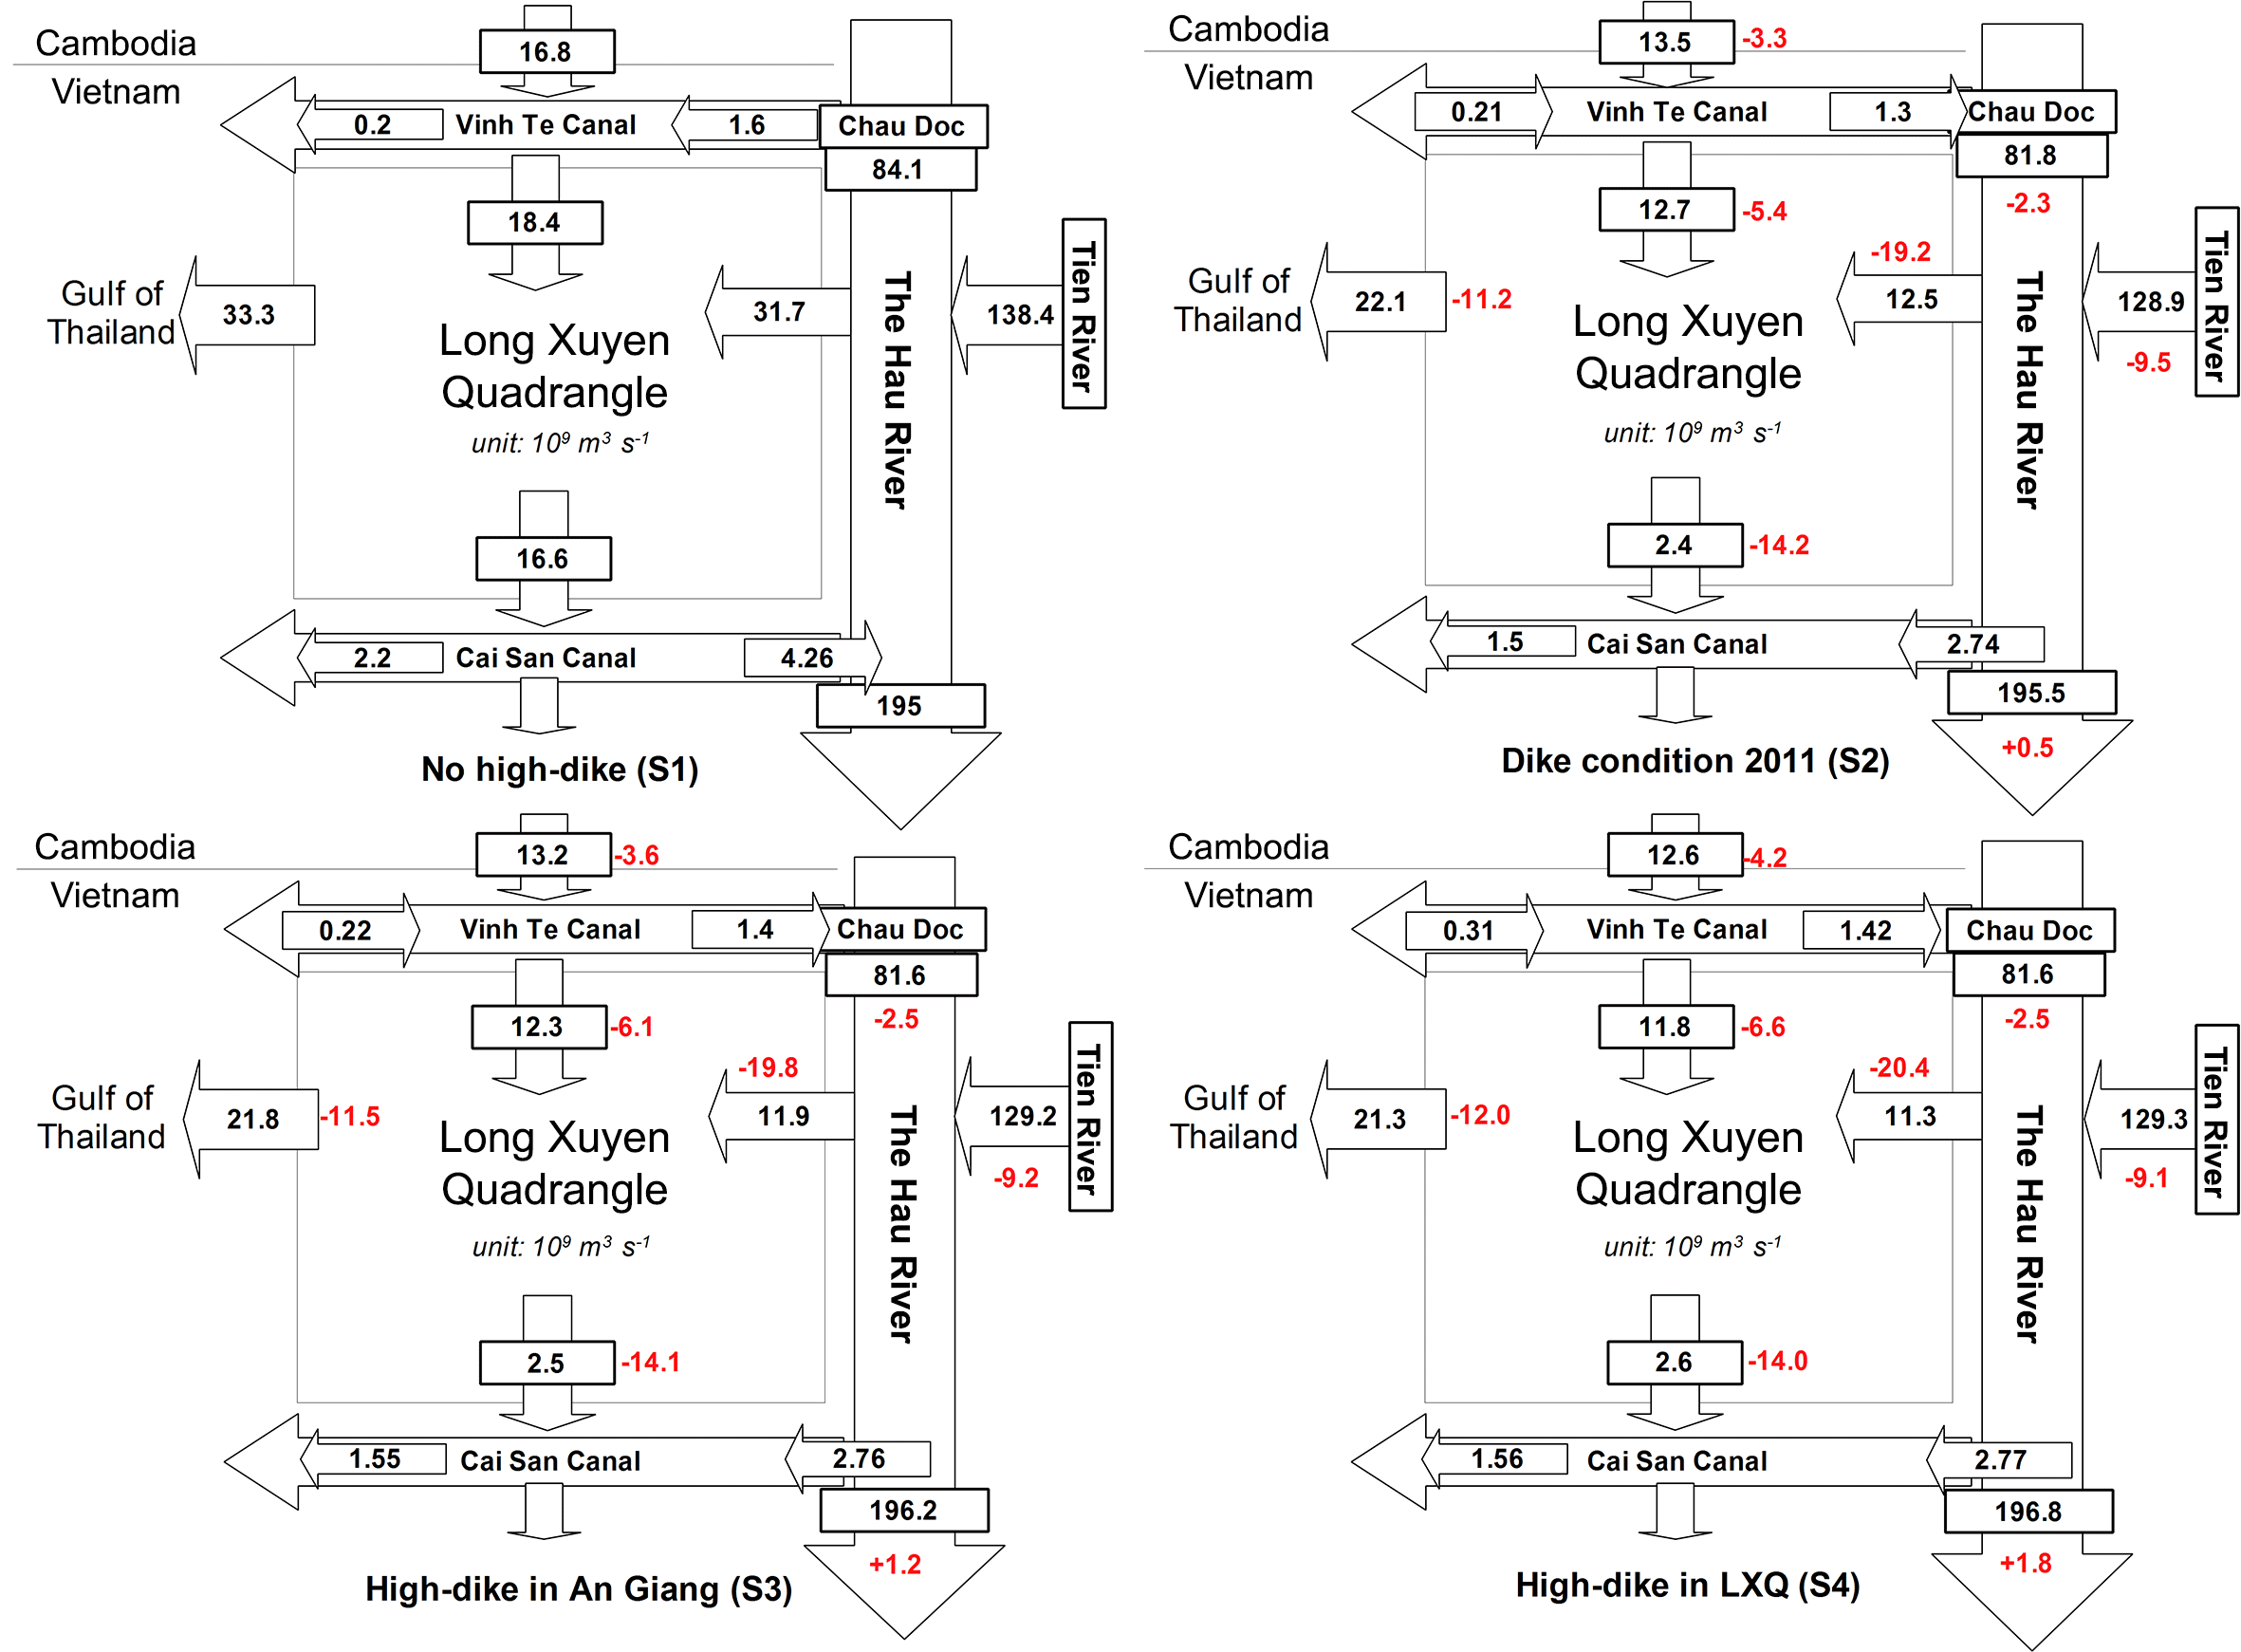
Figure 9Water balance calculations for the Long Xuyen Quadrangle under the various scenarios. Red numbers indicate the difference with scenario S1 (no high dikes).
4.5 Water balance
To further assess the model's simulation of the hydrodynamic characteristics of the Mekong Delta, we conducted a water balance analysis of flood volumes for the LXQ. Compared to the situation without high dikes (S1), the high dike scenarios (S2, S3, and S4) produced a reduction of floodwaters flowing into the LXQ (Fig. 9). The floodwater volume decreased from 18.4×10⁹ to 12.7–11.8×10⁹ m3 along the Vinh Te Canal bordering Cambodia, and from 31.7×10⁹ to 12.5–11.3×10⁹ m3 along the Hau River. With less water coming into the LXQ floodplains, water draining into the Gulf of Thailand and the Cai San Canal was reduced accordingly in the high dike scenarios (from 33.3×10⁹ to 22.1–21.3×10⁹ m3, and from 16.6×10⁹ to 2.4–2.6×10⁹ m3, respectively). The total reduction in flood volumes entering the northwestern corner of the Mekong Delta for simulation runs S2, S3, and S4 (2011 hydrograph) amounted to 15×109 m3 (Table 5). This is equivalent to a reduction greater than the estimated flood retention capacity (13×109 m3) of the entire LXQ (estimated as a flood depth of 3 m over the entire 0.49 million ha floodplain). This explains why the high dike simulations (S2, S3, and S4) return only minimal increases in river water levels, despite the significant reduction of flood retention capacity in the LXQ. In the model simulations, floodwaters are diverted away from the floodplains.
The floodwater volumes reaching the LXQ diminish with large-scale high dike construction, that is, in scenarios S2, S3, and S4, due to several factors. First, overflow from the Cambodian floodplains into the Vinh Te Canal drops from 16.8×10⁹ m3 in the situation without high dikes to 13.5–12.6×10⁹ m3 with high dikes. Second, floodwater from upstream in the Hau River drops from 84.1×10⁹ m3 to 81.8–81.6×10⁹ m3. Finally, the volume of floodwater from the Tien River flowing into the Hau decreases from 138×109 m3 to 128.9–129.3×10⁹ m3. Combined, these diverted floodwaters amount to a volume reduction of 15×109 m3 (Table 5).
The high dike scenarios (S2, S3, and S4) also resulted in changes in flow directions of the modeled flood streams and in volumes. As a consequence, there was only a slight increase in flood volume in the downstream (estuary) reach of the Hau River. In the Vinh Te Canal, a flood stream amounting to 1.6×10⁹ m3 drains toward the Gulf of Thailand in the no dike scenario (S1, 2011). For the high dike scenarios (S2, S3, and S4, 2011), it reverses direction, diverting 1.3–1.4×10⁹ m3 toward the Hau River. In the Cai San Canal, a flood stream amounting to 4.26×10⁹ m3 flows into the Hau River, but under the impact of high dikes changes direction, with a volume of 2.74–2.77×10⁹ m3 flowing toward the Gulf of Thailand. In the downstream reaches of the Hau River the model returns just a slight increase in flood volume (0.5–1.8×10⁹ m3; <1 %) for the high dike scenarios (S2, S3, and S4) compared to the no dike scenario (S1). As the water balance analysis shows, this is caused by a diversion (rerouting) of flood volumes away from the LXQ, so that the reduction of flood retention capacity due to expansion of high dikes has little impact on downstream water levels and flows. The reduction in the flood retention capacity of the LXQ (7–13×109 m3, Table 5) is thus effectively (over)compensated for in the model runs by the reduction of 24–26×109 m3 of flood volume entering the LXQ floodplains (Fig. 9). However, this diversion of flood volumes to primarily the Plain of Reeds ( m3) and the Cambodian floodplains ( m3) cannot be verified at present due to data limitations in these areas.
Recent flood dynamics of the Mekong Delta have raised concerns about an increased flood risk downstream in the VMD. Some authors suggest that a greater flood risk downstream might be linked to the prevalence of high dikes on the upper VMD floodplains (Hoa et al., 2007; Duong et al., 2014; Marchand et al., 2014; Fujihara et al., 2015). Using a 1-D hydrodynamic model combined with a quasi2-D approach (following Dung et al., 2011), we quantified the impacts of extensive high dike construction on floodwater levels and flood risk across the VMD. Most hydrodynamic studies of the Mekong Delta have retrofitted modeled changes (e.g., dikes and canal network) to past flood events (e.g., flood levels and flood area data). Whereas good fits are generally reported between model outputs and recorded water levels, these studies are unable to explain how flood volumes are distributed over the delta. We therefore elaborate one of the new studies to explore the 1-D with a quasi2-D model advantage, considering potential hydraulic impacts of existing and planning dike construction scenarios on the flood regimes in the VMD. We fill this knowledge gap by using water balance calculations to explain where floodwater delivers under the dike scenarios.
In our study, we calculated water balances for the flood scenarios and events considered, to provide insight into the spatial redistribution of flood volumes due to changes in dike prevalence. Our results show a clear impact of dike construction on floodwater levels in the Hau River. The high dike scenarios (S2, S3, and S4) produced a marked increase in peak river water levels in the upstream reaches of the Hau River (+68 cm at Chau Doc), while minimal increases occurred downstream (+5 cm at Can Tho). A similar trend and effect were found on water levels in the canal network of the LXQ and western floodplains. The model showed that high dike construction would have a substantial impact (+100 cm) on water levels along the upstream boundary of the LXQ (i.e., at Xuan To). This was paired with a diminishment in water levels (–45 cm) within the dike-protected floodplains and a limited or no effect on the downstream floodplains of the LXQ and in Can Tho (i.e., at Phung Hiep). These results suggest that further expansion of high dikes in the LXQ would have little impact on peak water levels, as simulated in scenario S3 (a fully diked An Giang Province) and scenario S4 (a fully diked LXQ). Furthermore, only a fraction of the reported differences in water levels between the no dike scenario (S1) and the 2011 scenario (S2) could be attributed to changes in dike infrastructure. Compared to the dike condition in 2011 (scenario S2), additional expansion of dikes is thus expected to have only small additional impact on river water levels. The greatest impact appears to have already occurred with the extent of dike construction in 2011.
Regarding the flood hydrographs and floodwater volumes examined, representing the flood conditions of 2000, 2011, and 2013, we found fairly limited effects of extensive dike construction on the water levels of the Hau River and canal network. Although total flood volumes differed markedly (402×109 m3 in 2000, 283×109 m3 in 2011, and 236×109 m3 in 2013), impacts on peak levels in the Hau River were minimal in our simulation runs. The largest effects were found for the upstream reaches at Chau Doc, but these were a fraction of the impacts in scenarios S1 and S2. Both with further extension of high dikes (S2, S3, and S4) and use of the different flood hydrographs (2000, 2011, and 2013), we found little change in peak water levels downstream in the Hau River (i.e., at Can Tho). The impacts of doubling the area of agricultural fields protected by high dikes (S2, S3, and S4) and increasing Mekong River discharge volumes (2011 compared with 2000) were absorbed elsewhere in the lower Mekong Delta, according to our model simulations.
These results are consistent with those of other authors making use of 1-D hydrodynamic models with quasi2-D approaches. Previous studies report water level increases of +60 to +100 cm concentrated in the upper reaches in the LXQ (Hoa et al., 2007; Duong et al., 2014; Fujihara et al., 2015) and limited increases (4–5 cm) downstream (Duong et al., 2014). Nonetheless, these large increases in water levels and flow velocities in the upper delta point to a heightened risk of bank erosion and catastrophic dike failures there (Hoa et al., 2007).
Our model performed well in the calibration (S2, 2011) and validation (S2, 2013) runs, in which the state of high dikes in 2011 was compared with the recorded water levels from gauging stations for the hydrographs of 2011 and 2013. Consistent with previous work, this suggests that our model setup and calibration were able to reproduce recorded water levels. Our simulation runs did not return a neat fit with the recorded water levels in the Hau River in the 2000 flood hydrograph (Fig. 8). Upstream, our scenarios returned lower than recorded values, and downstream at Can Tho our values were slightly higher. In part, this may be attributable to changes in the river and canal network between 2000 and 2011 (e.g., additional dredging and excavation). These may have altered the hydraulic properties of the Hau River in ways not captured in our scenarios.
The major known change in this period, that is, expansion of high dikes (from <10 000 ha in 2000 to >140 000 ha in 2011 in An Giang Province alone), was captured in our no dikes scenario (S1). The recorded rise in water levels at Can Tho (from 1.79 m in 2000 to 2.15 m in 2011/2013) over this period can also be partly attributed to the siltation of the Hau River (reported as the Bassac estuary in Hoa et al., 2007). According to Hoa et al. (2007), progressive siltation would lead to an increased backwater effect, as the discharge capacity of the river would be gradually reduced with siltation, sea level rise, and storm surges. This could potentially raise water levels at Can Tho up to 100 cm (Hoa et al., 2007).
At the outset of our study, we expected expansion of high dikes to produce greater discharges in the Hau River, resulting in a more pronounced backwater curve and higher water levels at Can Tho, such as those reported at the peak of the 2011 floods. However, this was not corroborated by our modeling results. Water levels at Can Tho were stable, the main changes in water levels being upstream. The relative stability of the water level at Can Tho can only be explained by a relative stability in discharge in the lower reaches of the Hau.
Our water balance analysis used the 2011 hydrograph for all of our scenarios to show how water is redistributed over the delta in the various model simulations. According to the scenario runs, the impacts of floodwater retention losses in the LXQ due to high dike construction are concentrated in the upstream and eastern reaches of the delta, with minimal impacts downstream in the Hau River and at Can Tho. The simulation runs further show increases in floodwater volumes and flood risk to be redirected toward the Tien River and Plain of Reeds, as well as the Cambodian floodplains. To be able to return fairly stable water levels downstream in the Hau River (at Can Tho and the estuary mouth), reductions in the flood retention capacity of the LXQ (S2, S3, and S4) are compensated for by reduced floodwater volumes entering the system and the LXQ floodplains (Δ Storage LXQ to m3; ΔQ entering the western delta m3; and ΔQ entering the LXQ plain m3). This enables the model to return a relatively constant water level and floodwater volume (195×109 m3 ±1 %) downstream. Whereas this may be a function of the current model configuration, there are at present no means of verification, as water level and discharge data are currently unavailable for these areas.
Some limitations need to be considered in our study. We could not fully validate the suggested reduced flood inflows to the Long Xuyen Quadrangle, and subsequent diversion of floodwaters to the Plain of Reeds and Cambodian floodplains, due to lack of monitoring data for these areas. Our model results regarding the spatial redistribution of floodwater volumes could have been influenced by the way we calibrated the model as well as the model uncertainty. The hydrodynamic model approach applied could also have influenced the accuracy of flood simulation and water balance equations. On a small scale, two-dimensional and three-dimensional hydrodynamic models (2-D and 3-D) are most suitable for simulating the flood dynamics of a complex floodplain. However, 2-D and 3-D models are at present difficult to apply to large areas, such as the Mekong Delta, due to the detailed data and computational capacity required (Soumendra et al., 2010; Dung et al., 2011). The aims of our study dictated a focus on a large part of the delta, as we were interested in the impacts of upstream water control measures on downstream river water levels. Given the constraints in data and available model configurations, we combined the 1-D model with a quasi2-D approach. Our modeling results are in line with previous studies applying similar methods. Our water balance analysis suggests that it would be recommendable to invest in better and more comprehensive data availability, as well as additional computational capacity, to enable more in-depth study of floodwater movements on the delta through 2-D and 3-D modeling.
Development of extensive high dikes to enable triple rice cultivation in the upstream floodplains of the VMD has raised critical concerns about environmental impacts, especially changing water flows and downstream flood risk. We used a 1-D-quasi2-D modeling approach to assess the impacts of four dike development scenarios on floodwater volumes and distributions on the delta, focusing on changes in peak water levels and the delta-wide water balance. Our study had three main findings.
-
First, expanded high dike construction in the upper Mekong Delta from 2000 to 2011 has had large hydraulic impact, demonstrated by significant increases in floodwater levels of up to +68 cm in the upper delta. Whereas dike expansion has substantially affected flood levels and distribution in the upper delta, impacts have been remarkably small in the downstream regions.
-
Second, continued high dike construction over the period from 2000 is likely to increase the flood risk across the entire LXQ, as peak water levels there are set to rise up to an additional +100 cm.
-
Third, dike construction has produced radical changes in the floodwater balance and distributions. High dikes have reduced the volumes of floodwater reaching the LXQ, in amounts in excess of the retention volume lost due to dike construction.
All in all, our results indicate substantial impacts of large-scale dike construction on peak flood levels, flood retention capacity, and the delta-wide water balance in the Mekong Delta. Flood risk in the Mekong Delta will likely increase as a direct consequence of high dike construction, especially in view of the cumulative impacts of other factors, such as sea level rise, land subsidence, and more extreme rainfall due to climate change. Any plans for future expansion of high dikes should therefore be subject to careful deliberation and detailed impact assessment. From a hydraulic modeling perspective, dike impact assessment should be conducted on a delta-wide scale and pay special attention to opportunities for model calibration and validation for the Cambodian floodplains and Plain of Reeds.
Data used for the study are freely requested by sending emails to the correspondence author.
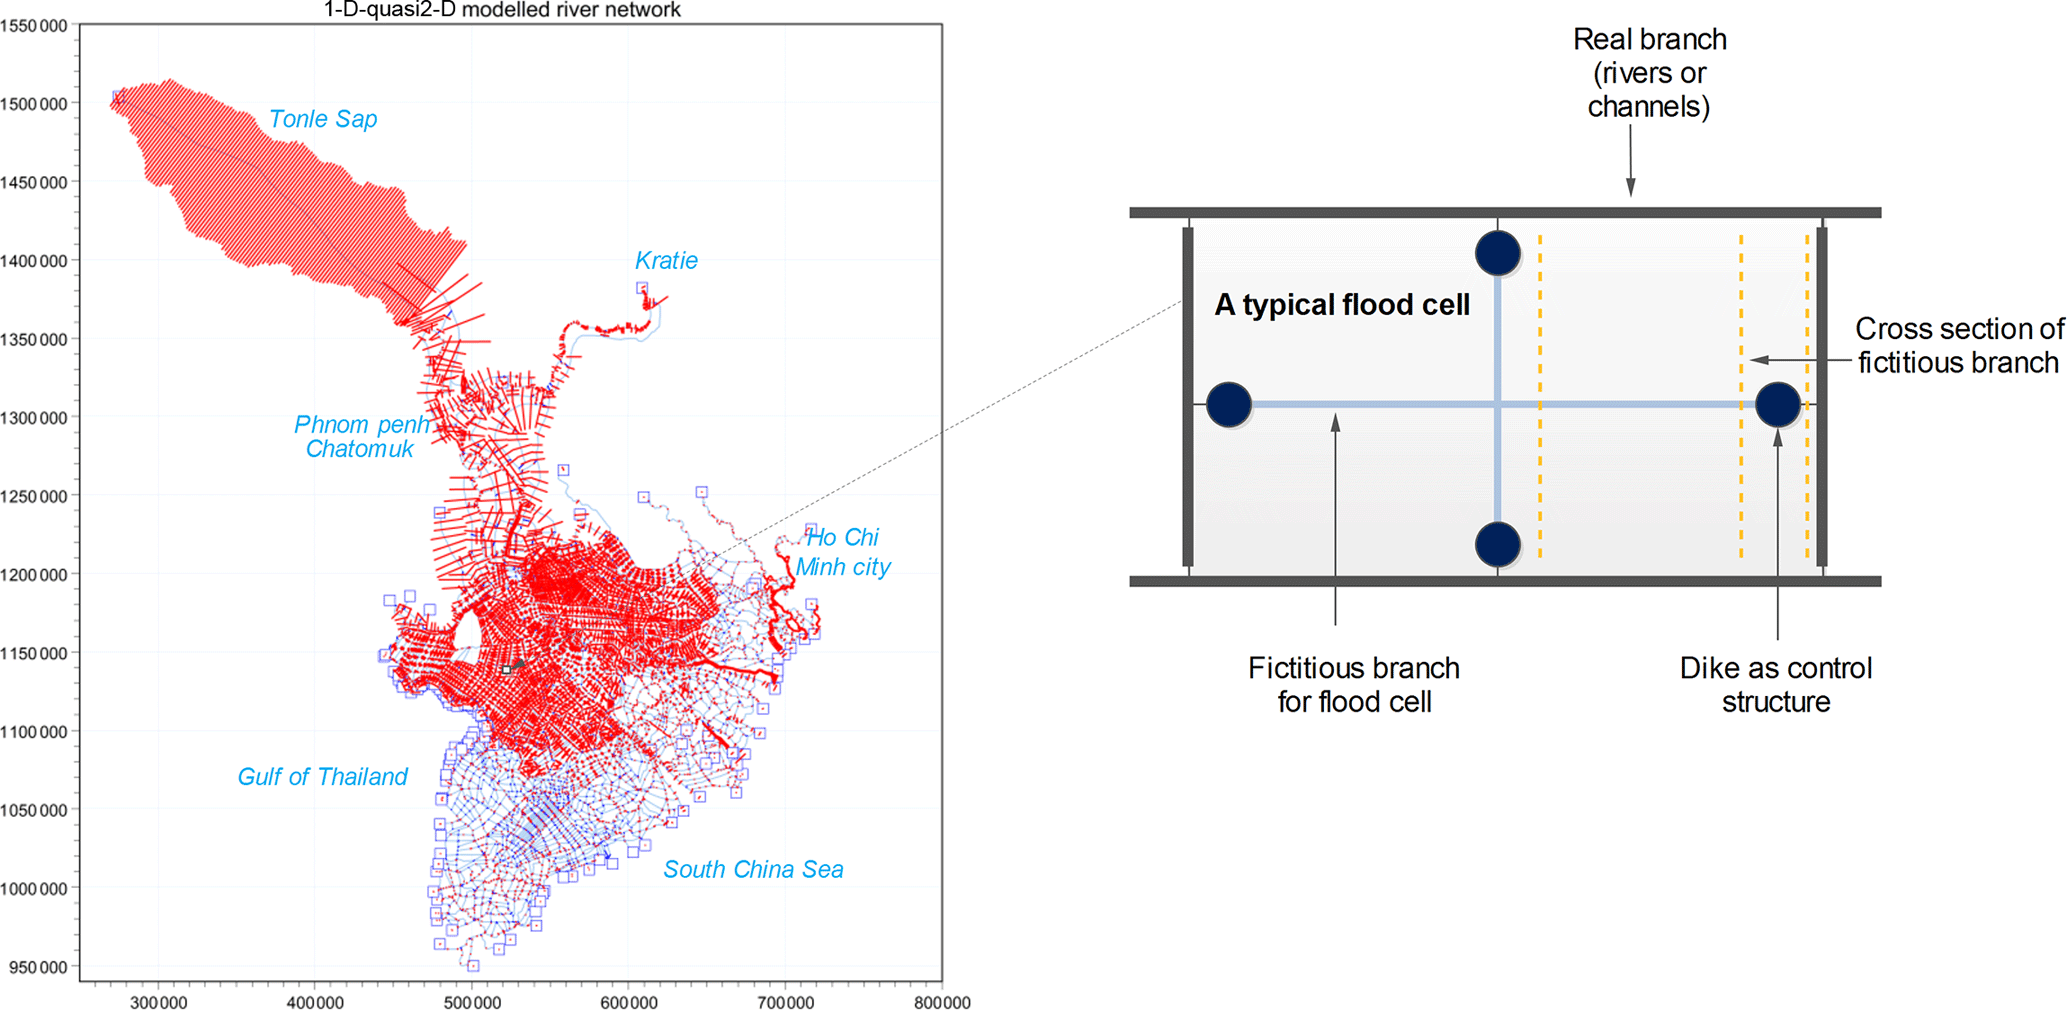
Figure A1The left figure describes the 1-D-quasi2-D modeled river network of the VMD and the right figure shows a representative typical floodplain compartment. The approach is from Dung et al. (2011).
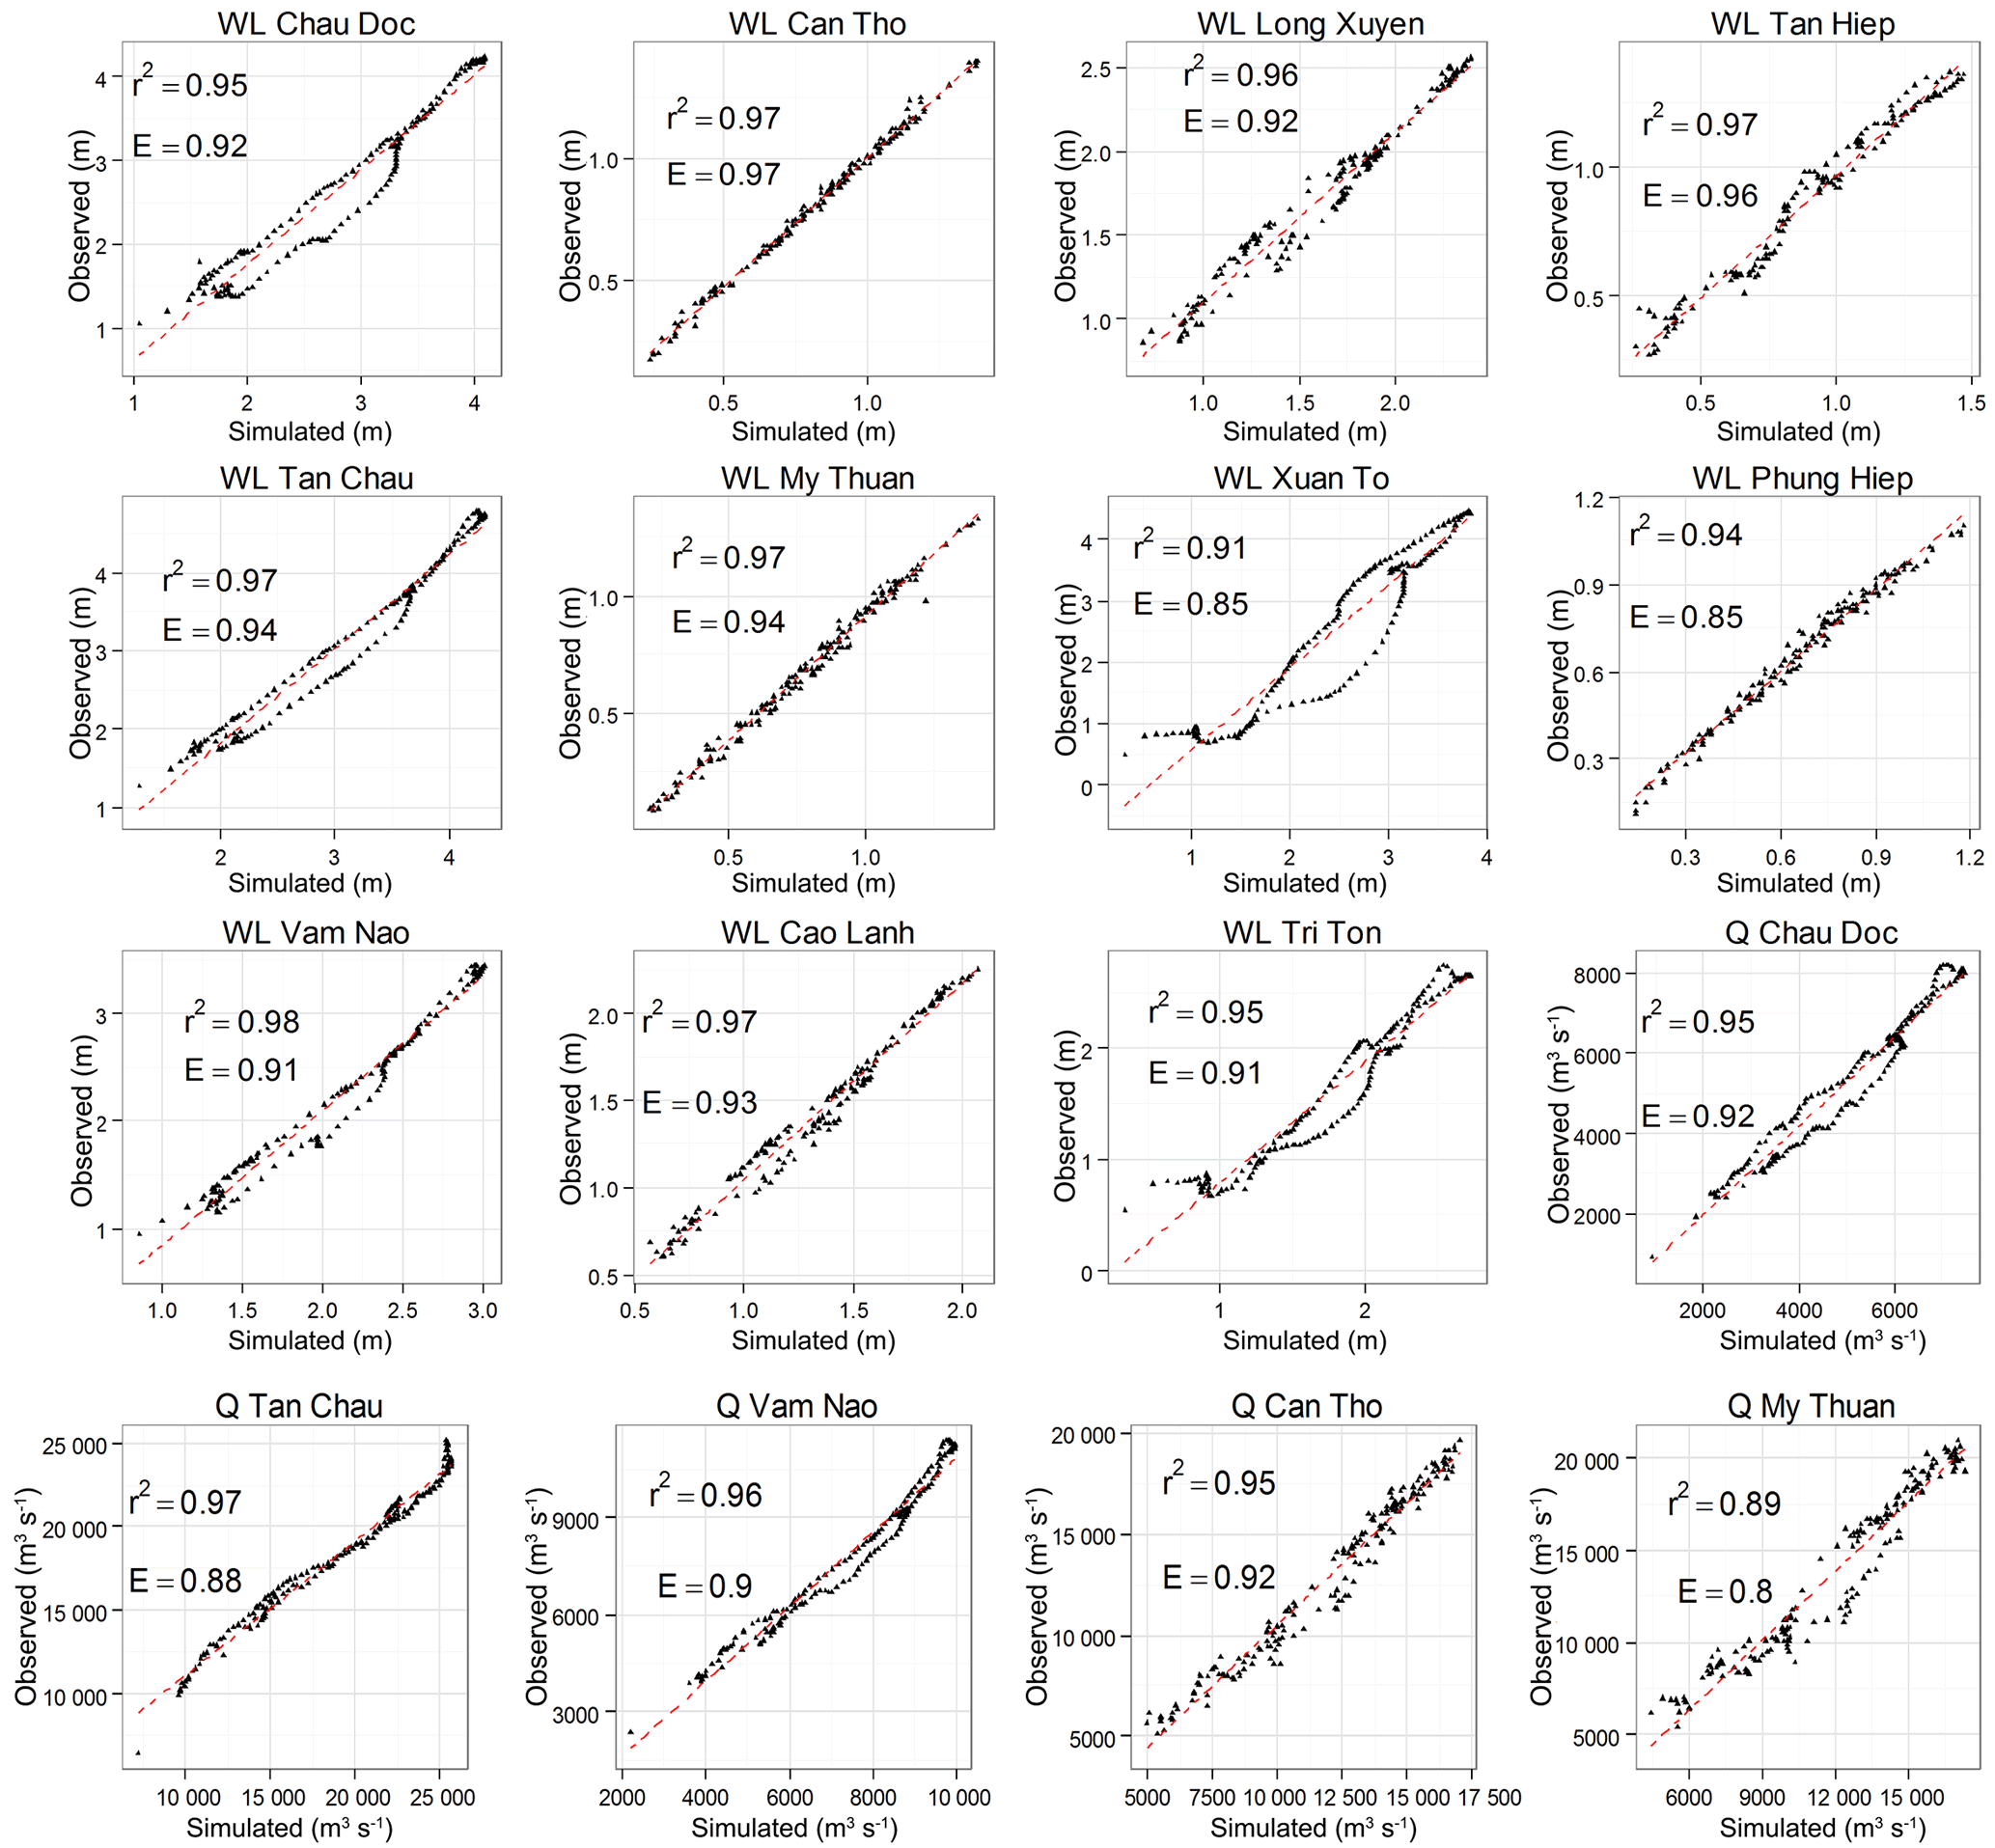
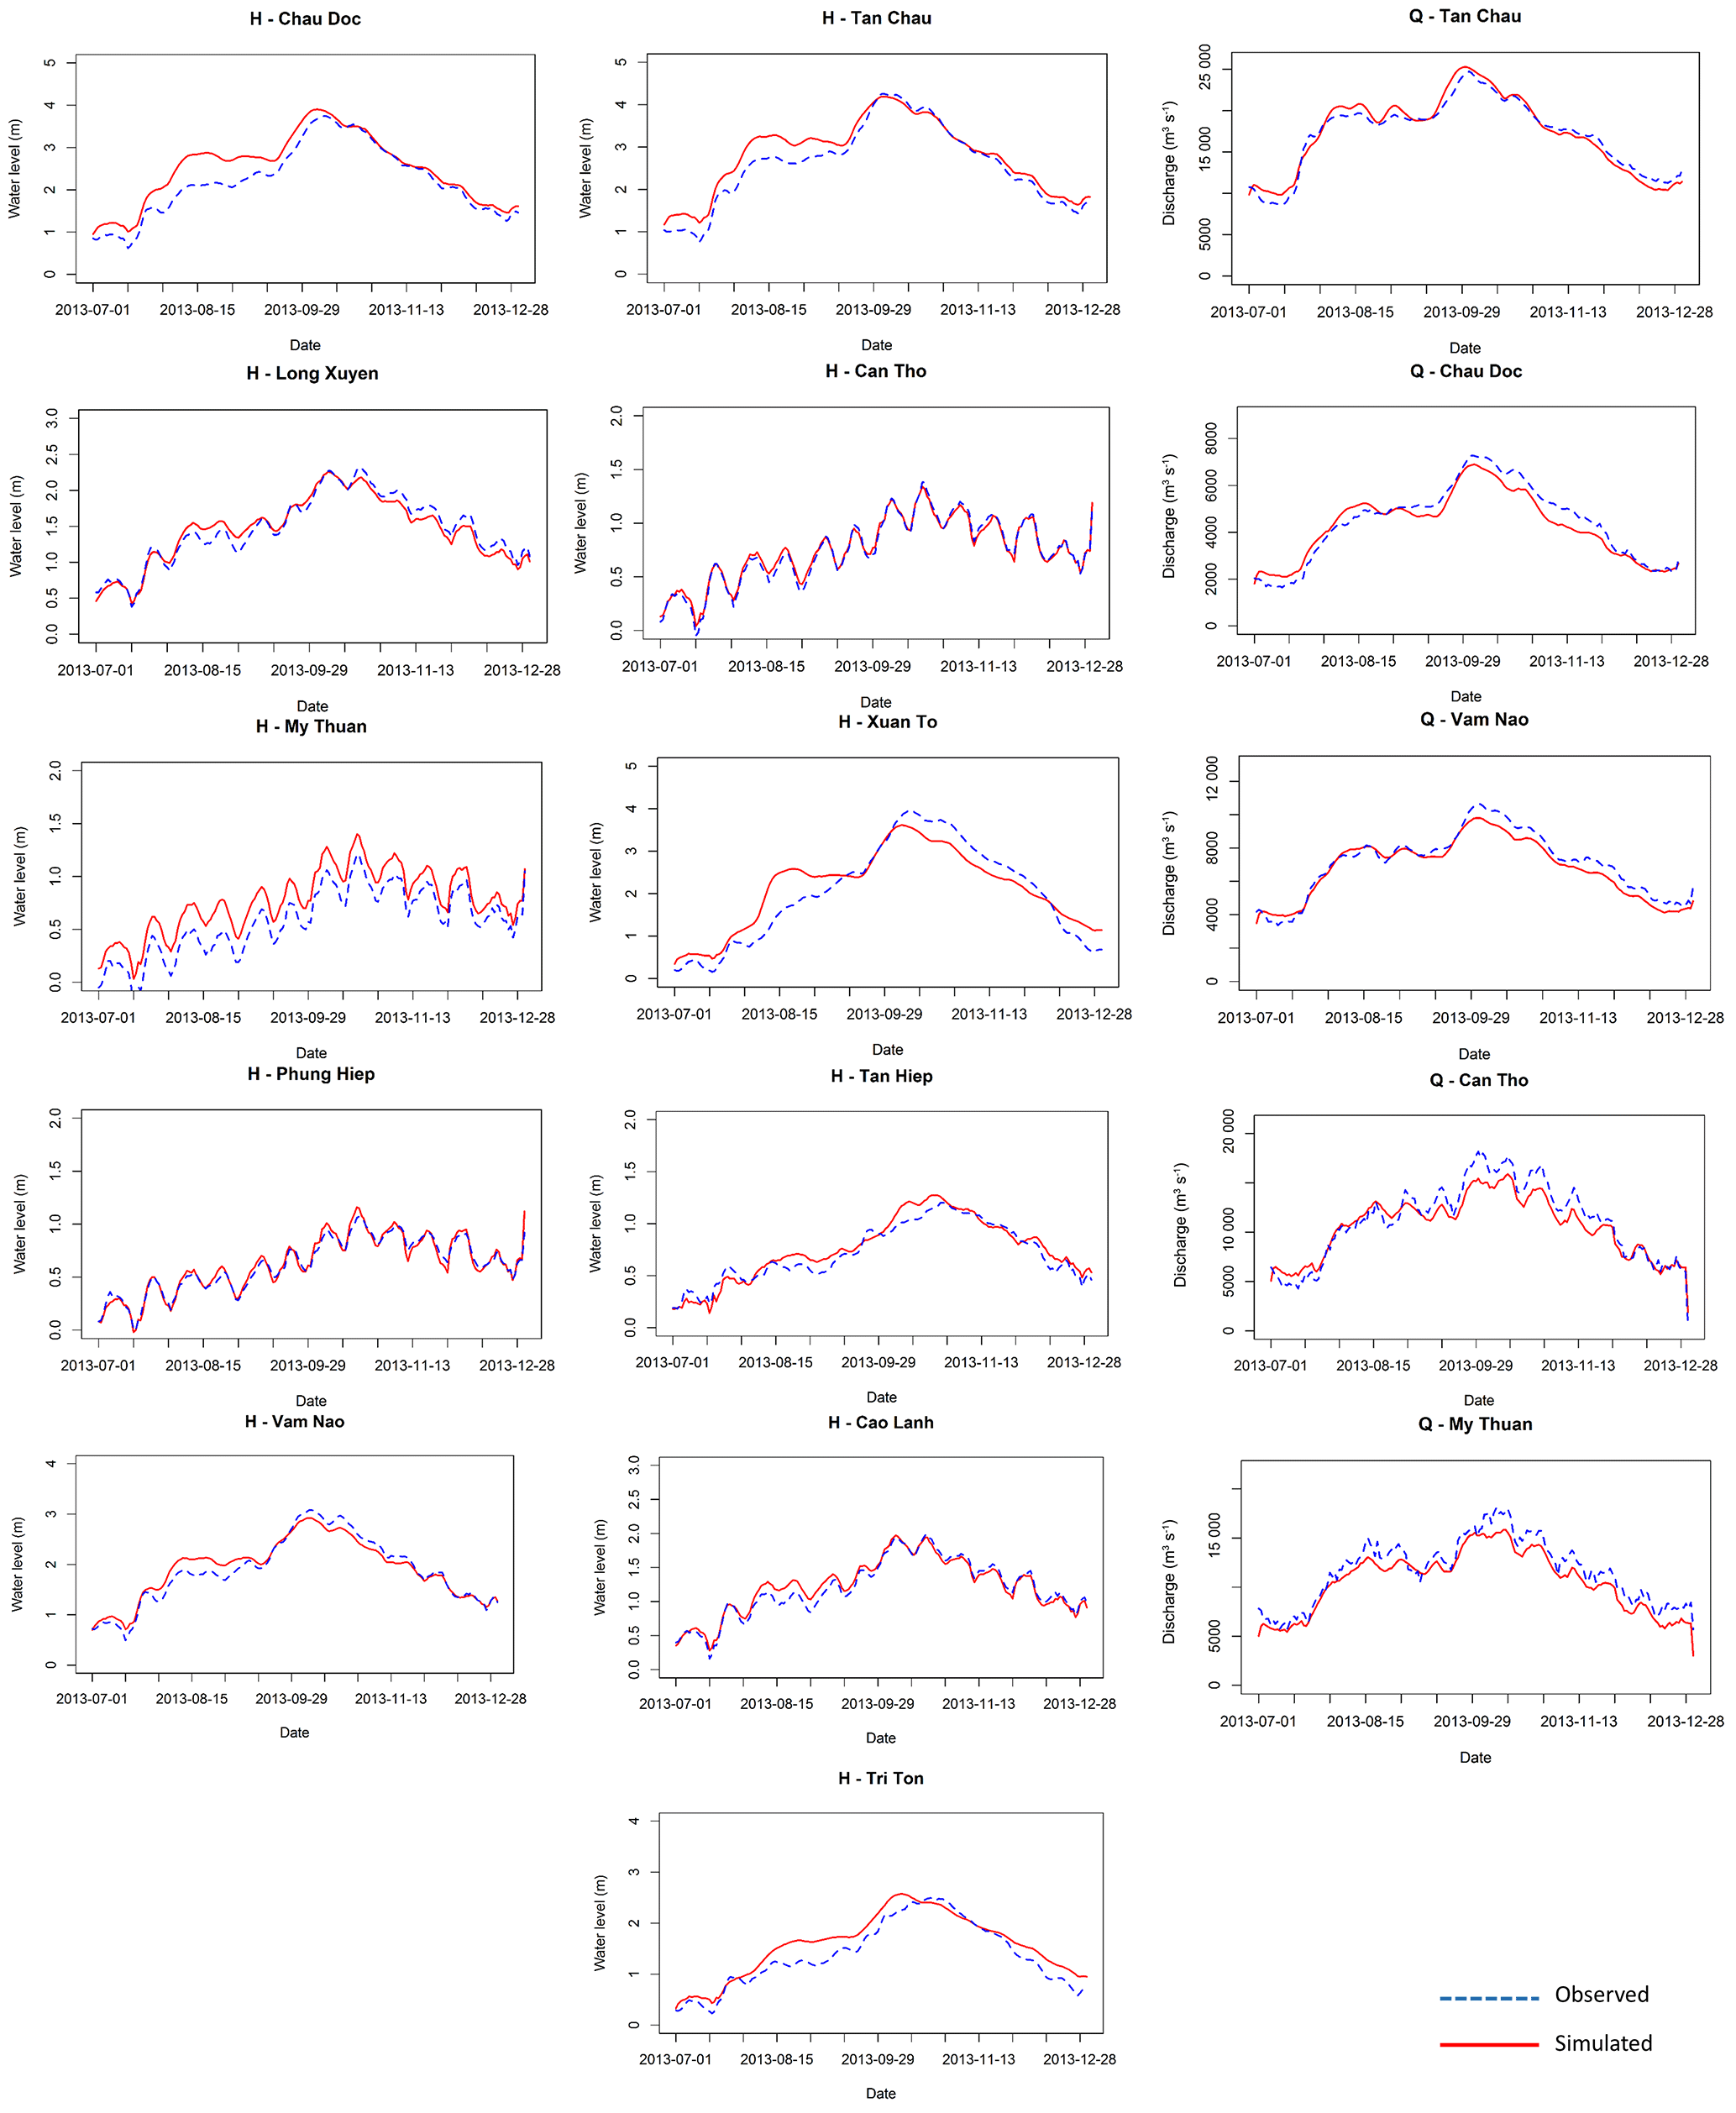
Table C1Paired sample test for water level time series along the Hau River in 2011.
The authors declare that they have no conflict of interest.
This research for this paper was funded by the NUFFIC/NICHE VNM 104 project,
which is co-funded by the Netherlands Government and Vietnam National
University. We thank the experts at the Water Resources Management Group of
Wageningen University, the Netherlands, and the Center of Water Resources
Management at the Vietnam National University for their valuable comments and
support. In addition, we are grateful to DHI for providing a Mike 11 model
license during the study.
Edited by: Dominic Mazvimavi
Reviewed by: Jonathan Remo and two anonymous referees
Chow, V.: Open-Channel Hydraulics, McGraw-Hill, New York, ed., 1959.
Danh, V. and Mushtaq, S.: Living with Floods: An Evaluation of the Resettlement Program of the Mekong Delta of Vietnam, in: Environmental Change and Agricultural Sustainability in the Mekong Delta, Advances in Global Change Research, edited by: Stewart, M. A. and Coclanis, P. A., Springer Netherlands, Dordrecht, 181–204, 2011.
DHI: A Modelling System for Rivers and Channels. DHI Software Licence Agreement, Danish Hydraulic Institute, 2011.
Doulgeris, C., Georgiou, P., Papadimos, D., and Papamichail, D.: Ecosystem approach to water resource management using the MIKE 11 modeling system in the Strymonas River and Lake Kerkini, J. Environ. Manage., 94, 132–143, https://doi.org/10.1016/j.jenvman.2011.06.023, 2012.
Dung, N. V., Merz, B., Bárdossy, A., Thang, T. D., and Apel, H.: Multi-objective automatic calibration of hydrodynamic models utilizing inundation maps and gauge data, Hydrol. Earth Syst. Sci., 15, 1339–1354, https://doi.org/10.5194/hess-15-1339-2011, 2011.
Duong, V. H. T., Trinh Cong, V., Franz, N., Peter, O., and Nguyen Trung, N.: Land use based flood hazards analysis for the mekong delta, in: Proceedings of the 19 Th IAHR – APD Congress 2014, Hanoi, Vietnam, Presented at the IAHR, Ha Noi, Vietnam, https://doi.org/10.13140/2.1.5153.9842, 2014.
Fabio, P., Aronica, G. T., and Apel, H.: Towards automatic calibration of 2-D flood propagation models, Hydrol. Earth Syst. Sci., 14, 911–924, https://doi.org/10.5194/hess-14-911-2010, 2010.
Fujihara, Y., Hoshikawa, K., Fujii, H., Kotera, A., Nagano, T., and Yokoyama, S.: Analysis and attribution of trends in water levels in the Vietnamese Mekong Delta, Hydrol. Process., 30, 835–845, https://doi.org/10.1002/hyp.10642, 2015.
Hoa, L. T. V., Shigeko, H., Nhan, N. H., and Cong, T. T.: Infrastructure effects on floods in the Mekong River Delta in Vietnam, Hydrol. Process., 22, 1359–1372, https://doi.org/10.1002/hyp.6945, 2008.
Hoang, L. P., Lauri, H., Kummu, M., Koponen, J., van Vliet, M. T. H., Supit, I., Leemans, R., Kabat, P., and Ludwig, F.: Mekong River flow and hydrological extremes under climate change, Hydrol. Earth Syst. Sci., 20, 3027–3041, https://doi.org/10.5194/hess-20-3027-2016, 2016.
Howie, C.: Co-operation and contestation: farmer-state relations in agricultural transformation, An Giang Province, Vietnam (Thesis), University of London, England, 2011.
Hung, N. N.: Sediment dynamics in the floodplain of the Mekong Delta, Vietnam, Universitätsbibliothek der Universität Stuttgart, Stuttgart, 2012.
Käkönen, M.: Mekong Delta at the Crossroads: More Control or Adaptation?, Ambio, 37, 205–212, https://doi.org/10.1579/0044-7447(2008)37[205:MDATCM]2.0.CO;2, 2008.
Kien, N. V.: How to conserve floating rice ecosystem in Tri Ton district, An Giang province, presented at the Agriculture Development with High-technology Application in An Giang Province, An Giang University, 2013.
Kingdom of the Netherlands: Towards a Mekong Delta Plan (Synthesis of Water Sector Assessment), Vietnam-Netherlands Cooperation, 2011.
Kingdom of the Netherlands and The Socialist Republic of Vietnam: Mekong Delta Plan, Report, 2013.
Kummu, M., Tes, S., Yin, S., Adamson, P., Józsa, J., Koponen, J., Richey, J., and Sarkkula, J.: Water balance analysis for the Tonle Sap Lake–floodplain system, Hydrol. Process., 28, 1722–1733, https://doi.org/10.1002/hyp.9718, 2014.
Lauri, H., de Moel, H., Ward, P. J., Räsänen, T. A., Keskinen, M., and Kummu, M.: Future changes in Mekong River hydrology: impact of climate change and reservoir operation on discharge, Hydrol. Earth Syst. Sci., 16, 4603–4619, https://doi.org/10.5194/hess-16-4603-2012, 2012.
Lindenschmidt, K.-E., Huang, S., and Baborowski, M.: A quasi-2D flood modeling approach to simulate substance transport in polder systems for environment flood risk assessment, Sci. Total Environ., 397, 86–102, https://doi.org/10.1016/j.scitotenv.2008.02.045, 2008.
Lu, X., Kummu, M., and Oeurng, C.: Reappraisal of sediment dynamics in the Lower Mekong River, Cambodia, Earth Surf. Proc. Land., 39, 1855–1865, https://doi.org/10.1002/esp.3573, 2014.
Manh, N. V., Dung, N. V., Hung, N. N., Merz, B., and Apel, H.: Large-scale suspended sediment transport and sediment deposition in the Mekong Delta, Hydrol. Earth Syst. Sci., 18, 3033–3053, https://doi.org/10.5194/hess-18-3033-2014, 2014.
Marchand, M., Pham Quang, D., and Le, T.: Mekong Delta: Living with water, but for how long?, Built Environ., 40, 230–243, 2014.
Ngan, L. T., Arnold, K. B., van Halsema, G. E., Hellegers, P. J. G. J., and Nguyen, L.-D.: Interplay between land-use dynamics and changes in hydrological regime in the Vietnamese Mekong Delta, Land Use Policy, 73, 269—280, https://doi.org/10.1016/j.landusepol.2018.01.030, 2018.
Patro, S., Chatterjee, C., Mohanty, S., Singh, R., and Raghuwanshi, N. S.: Flood inundation modeling using MIKE FLOOD and remote sensing data, J. Indian Soc. Remote, 37, 107–118, https://doi.org/10.1007/s12524-009-0002-1, 2009.
Quang, D., Balica, S., Popescu, I., and Jonoski, A.: Climate change impact on flood hazard, vulnerability and risk of the Long Xuyen Quadrangle in the Mekong Delta, Int. J. River Basin Manag., 10, 103–120, https://doi.org/10.1080/15715124.2012.663383, 2012.
Ritter, A. and Muñoz-Carpena, R.: Performance evaluation of hydrological models: Statistical significance for reducing subjectivity in goodness-of-fit assessments, J. Hydrolog., 480, 33–45, https://doi.org/10.1016/j.jhydrol.2012.12.004, 2013.
Sebesvari, Z., Le, H., Van Toan, P., Arnold, U., and Renaud, F.: Agriculture and Water Quality in the Vietnamese Mekong Delta, in: The Mekong Delta System, Springer Environmental Science and Engineering, edited by: Renaud, F. G. and Kuenzer, C., Springer Netherlands, Dordrecht, 331–361, 2012.
Soumendra, N. K., Dhrubajyoti, S., and Paul, D. B.: Coupled 1D-Quasi-2D Flood Inundation Model with Unstructured Grids, J. Hydraul. Eng., 136, 493–506, https://doi.org/10.1061/(ASCE)HY.1943-7900.0000211, 2010.
Tamura, T., Horaguchi, K., Saito, Y., Nguyen, V. L., Tateishi, M., Ta, T. K. O., Nanayama, F., and Watanabe, K.: Monsoon-influenced variations in morphology and sediment of a mesotidal beach on the Mekong River delta coast, Geomorphology, 116, 11–23, https://doi.org/10.1016/j.geomorph.2009.10.003, 2010.
Tran, D. D. and Weger, J.: Barriers to Implementing Irrigation and Drainage Policies in An Giang Province, Mekong Delta, Vietnam, Irrig. Drain., https://doi.org/10.1002/ird.2172, online first, 2017.
Tri, V. K.: Hydrology and Hydraulic Infrastructure Systems in the Mekong Delta, Vietnam, in: The Mekong Delta System: Interdisciplinary Analyses of a River Delta, edited by: Renaud, G. F. and Kuenzer, C., Springer Netherlands, Dordrecht, 49–81, 2012.
Tri, V. P. D., Trung, N. H., and Tuu, N. T.: Flow dynamics in the Long Xuyen Quadrangle under the impacts of full-dyke systems and sea level rise, VNU J. Sci. Earth Science, 28, 205–214, 2012.
Tri, V. P. D., Trung, N. H., and Thanh, V. Q.: Vulnerability to Flood in the Vietnamese Mekong Delta: Mapping and Uncertainty Assessment, J. Environ. Sci. Eng., 2, 229–237, 2013.
Wassmann, R., Hien, N., Hoanh, C., and Tuong, T. P.: Sea Level Rise Affecting the Vietnamese Mekong Delta: Water Elevation in the Flood Season and Implications for Rice Production, Climatic Change, 66, 89–107, https://doi.org/10.1023/B:CLIM.0000043144.69736.b7, 2004.
Whipple, A. A., Viers, J. H., and Dahlke, H. E.: Flood regime typology for floodplain ecosystem management as applied to the unregulated Cosumnes River of California, United States, Ecohydrology, 10, e1817, https://doi.org/10.1002/eco.1817, 2017.
Defined as “the prevailing characteristics and distribution of flood pulses and variability within and across years, is controlled by geography, geology, climate, and human modifications and drives physical and ecological processes within floodplain ecosystems, affecting the diversity, abundance, and communities of species” (Whipple et al., 2017).
High dikes are usually built at a height of 2.0–2.5 m, in places where maximum flood depths are less than 1.5 m, to completely prevent floodwater from entering the fields (Tran and Weger, 2017).
- Abstract
- Introduction
- Study area
- Methodology
- Results
- Discussion
- Conclusions
- Data availability
- Appendix A: The 1-D-quasi2-D modeled river network
- Appendix B: Graphs of correlation and Nash–Sutcliffe efficiency in 2011 and time series of daily simulated and observed flows in 2013.
- Appendix C: Paired sample test
- Competing interests
- Acknowledgement
- References