the Creative Commons Attribution 3.0 License.
the Creative Commons Attribution 3.0 License.
What controls the stable isotope composition of precipitation in the Mekong Delta? A model-based statistical approach
Nguyen Le Duy
Ingo Heidbüchel
Hanno Meyer
Bruno Merz
Heiko Apel
This study analyzes the influence of local and regional climatic factors on the stable isotopic composition of rainfall in the Vietnamese Mekong Delta (VMD) as part of the Asian monsoon region. It is based on 1.5 years of weekly rainfall samples. In the first step, the isotopic composition of the samples is analyzed by local meteoric water lines (LMWLs) and single-factor linear correlations. Additionally, the contribution of several regional and local factors is quantified by multiple linear regression (MLR) of all possible factor combinations and by relative importance analysis. This approach is novel for the interpretation of isotopic records and enables an objective quantification of the explained variance in isotopic records for individual factors. In this study, the local factors are extracted from local climate records, while the regional factors are derived from atmospheric backward trajectories of water particles. The regional factors, i.e., precipitation, temperature, relative humidity and the length of backward trajectories, are combined with equivalent local climatic parameters to explain the response variables δ18O, δ2H, and d-excess of precipitation at the station of measurement.
The results indicate that (i) MLR can better explain the isotopic variation in precipitation (R2 = 0.8) compared to single-factor linear regression (R2 = 0.3); (ii) the isotopic variation in precipitation is controlled dominantly by regional moisture regimes (∼ 70 %) compared to local climatic conditions (∼ 30 %); (iii) the most important climatic parameter during the rainy season is the precipitation amount along the trajectories of air mass movement; (iv) the influence of local precipitation amount and temperature is not significant during the rainy season, unlike the regional precipitation amount effect; (v) secondary fractionation processes (e.g., sub-cloud evaporation) can be identified through the d-excess and take place mainly in the dry season, either locally for δ18O and δ2H, or along the air mass trajectories for d-excess. The analysis shows that regional and local factors vary in importance over the seasons and that the source regions and transport pathways, and particularly the climatic conditions along the pathways, have a large influence on the isotopic composition of rainfall. Although the general results have been reported qualitatively in previous studies (proving the validity of the approach), the proposed method provides quantitative estimates of the controlling factors, both for the whole data set and for distinct seasons. Therefore, it is argued that the approach constitutes an advancement in the statistical analysis of isotopic records in rainfall that can supplement or precede more complex studies utilizing atmospheric models. Due to its relative simplicity, the method can be easily transferred to other regions, or extended with other factors.
The results illustrate that the interpretation of the isotopic composition of precipitation as a recorder of local climatic conditions, as for example performed for paleorecords of water isotopes, may not be adequate in the southern part of the Indochinese Peninsula, and likely neither in other regions affected by monsoon processes. However, the presented approach could open a pathway towards better and seasonally differentiated reconstruction of paleoclimates based on isotopic records.
- Article
(7945 KB) - Full-text XML
-
Supplement
(1425 KB) - BibTeX
- EndNote


Precipitation is typically composed of regional contributions, where atmospheric moisture has been transported over large distances, and local contributions, where the moisture has been provided by evapotranspiration within the close vicinity. Understanding the sources of precipitation and their relative contribution is critical for basin-wide water balance studies (Ingraham, 1998). Stable isotopes (δ18O and δ2H) offer the possibility to identify the sources of precipitation and to quantify the contribution of regional and local sources (Gat, 1996). Furthermore, they can be used to investigate hydrological processes such as mechanisms responsible for streamflow generation (e.g., Kendall and Caldwell, 1998), in groundwater studies (e.g., Gonfiantini et al., 1998), and rainfall–runoff studies (e.g., Genereux and Hooper, 1998).
Isotopic variation in precipitation has been correlated with climatic parameters such as precipitation amount, air temperature, and air mass history (Dansgaard, 1964; Rozanski et al., 1992; Gat, 1996), termed amount effect, temperature effect (Dansgaard, 1964), and circulation effect (Tan, 2009, 2014), respectively. The circulation effect describes the changes in isotopic composition of precipitation because of air moisture originating from different areas of the ocean.
Delineating the present-day relationship between climatic factors and stable isotope variation in precipitation can also help to understand past climatic conditions on regional and global scales. However, the factors controlling isotopic variation in precipitation are numerous and complex; hence a better understanding of the climatic influences on isotopic values would improve the use of precipitation isotopes as a proxy to reconstruct paleoclimates (Yang et al., 2016).
In the Asian monsoon region, the isotopic signature of precipitation has been found to correlate with large-scale climatic parameters such as sea surface temperature and relative humidity of the air masses (Dansgaard, 1964; Merlivat and Jouzel, 1979; Clark and Fritz, 1997; Lachniet, 2009), ENSO (Ichiyanagi and Yamanaka, 2005; Tan, 2014; Yang et al., 2016) and the vertical wind shear index (Vuille et al., 2005). Other processes were also identified as relevant for monsoon regions: distillation during vapor transport (Araguás-Araguás et al., 1998; Yoshimura et al., 2003; Vuille et al., 2005; Dayem et al., 2010; Lee et al., 2012; Liu et al., 2014), re-evaporation, and rain–vapor interactions (Risi et al., 2008b; Chakraborty et al., 2016).
Relations between climate and water isotopes have been analyzed by univariate statistical regression methods (e.g., Araguás-Araguás et al., 1998; Bowen, 2008), isotope-enabled global climate models (GCMs; Yoshimura et al., 2008, 2014; Risi et al., 2010b; Okazaki and Yoshimura, 2017), isotope-incorporated Lagrangian models (Pfahl and Wernli, 2008; Sodemann et al., 2008), or the combination of GCMs (or Lagrangian models) with statistical analysis (Vuille et al., 2003, 2005; LeGrande and Schmidt, 2009; Tindall et al., 2009; Ishizaki et al., 2012; Conroy et al., 2013). Statistical models are not able to explain the actual processes causing a phenomenon (e.g., the physical controls of isotope variations in precipitation), in contrast to the physical model representation of the processes like GCMs or Lagrangian models. They can, however, detect the results of a process, and thus help to identify the responsible processes. Both approaches, statistical and physical models, have their advantages and disadvantages and hence coexist supplementing each other. We argue that taking into consideration the limitations and benefits of both statistical and physical models can enhance their power to interpret the relations between climate and water isotopes.
As illustrated in previous studies (e.g., Noone and Simmonds, 2002) and discussed in Sturm et al. (2010), the inherent limitations of empirical (or statistical) climate reconstructions from precipitation isotopes can lead to incorrect paleoclimate reconstructions. A significant limitation is the assumption that a single climatic factor controls the isotopic signal and that the stationary relationship (e.g., between temperature and δ18O) remains valid over the entire proxy record. This mono-factorial relationship does not consider the interplay of different climatic factors and is possibly biased. Another limitation is the assumption of a constant precipitation source or similar isotopic signatures of different moisture sources throughout the study period when using only local parameters (e.g., local precipitation) to interpret precipitation isotopes. In real cases, these assumptions are rarely fulfilled and often unrealistic because of the changes in seasonality and atmospheric circulation patterns. This is particularly true in those parts of the Asian monsoon region located in the transition zone between the Indian and western North-Pacific monsoons, where precipitation originates from both the Indian and Pacific Oceans (Delgado et al., 2012). The isotopic signatures of air masses arising from the Indian Ocean differ considerably from those of the Pacific Ocean, where the average δ18O of the latter is about 2.5 ‰ more negative (Araguás-Araguás et al., 1998). Seasonally varying sources of precipitation have also been observed in China (Tan, 2014, and references therein), India (e.g., Breitenbach et al., 2010; Chakraborty et al., 2016), South Korea (Lee et al., 2003), Thailand (Ishizaki et al., 2012), and elsewhere (Araguás-Araguás et al., 1998).
Additionally, many studies have presented evidence that large-scale monsoon circulation is the primary driver of variations in precipitation isotopes instead of local controls (e.g., local precipitation amount or temperature) in some parts of the Asian monsoon region. This evidence has been found on different temporal scales including daily isotopic variability (Yoshimura et al., 2003, 2008), seasonal isotopic variability (Araguás-Araguás et al., 1998; Kurita et al., 2009; Dayem et al., 2010; Peng et al., 2010; Baker et al., 2015), and/or interannual isotopic variability (Vuille et al., 2005; LeGrande and Schmidt, 2009; Ishizaki et al., 2012; Tan, 2014; Kurita et al., 2015). This means that the isotopic composition of rainfall cannot be described adequately by mono-factorial statistical approaches. Quantitative multi-factorial statistical studies of the isotopic composition are, however, rare. Only Ishizaki et al. (2012) present a multi-factorial analysis, which is limited to two factors (local precipitation amount and distillation of the moisture along its transport trajectories). To our best knowledge, there is no study considering the interplay of several local and regional factors available quantitatively, whereas the need for a simultaneous consideration of local and regional factors for the explanation of isotopic signatures has already been formulated in other studies (e.g., Johnson and Ingram, 2004). Therefore a quantitative multi-factorial statistical approach is developed in this study, utilizing multiple linear regression (MLR) and relative factor importance analysis to determine the most important drivers of isotopic composition in rainfall and their individual contributions.
We hypothesize that using multiple factors in a single linear model can explain a more significant share of the observed variance in isotopic composition, compared to mono-factorial analyses. Furthermore, we also hypothesize that through importance analysis of the factors considered in the MLR models, the most important factors can be identified and their contribution quantified, thus enabling a better process understanding. Such a multi-factorial statistical method could also be applied in paleoclimate studies, separating and quantifying the impacts of local and regional factors on the isotopic composition of local precipitation (Sturm et al., 2010), thus overcoming the shortcomings of single factor analysis. The advantages of the statistical models are their simplicity and ease of interpretation, in contrast to complex circulation models (e.g., GCMs), which can also distinguish between local and regional drivers, but which require more extensive expertise and are more difficult to interpret. Circulation models can simulate the fractionation processes along the transport pathways of water in the atmosphere, but they cannot be used in a straightforward way to extract the impact of dominant factors and weigh their relative importance for the variability in the observed isotopic signal. For this, statistical techniques are required, in order to quantify the correlation between observed isotopic signal variability and regional climate change patterns (Sturm et al., 2010). Thus, using statistical models straight away might be an attractive alternative to obtain first indications about the dominant processes controlling the isotopic composition of rainfall, both for contemporary and paleoclimate studies.
This study uses the Vietnamese Mekong Delta (VMD) as a test case, for which isotopic data of precipitation has been collected for the first time. The rainfall samples (δ18O and δ2H) were collected comparatively frequently (bi-weekly to weekly) over a period of 18 months. This data set enables a better analysis of the temporal dynamics of the isotopic composition as compared to the typical monthly Global Network of Isotopes in Precipitation (GNIP) data (IAEA/WMO, 2016). The sampled data were used to test the proposed approach for the identification and quantification of the controls on the isotopic variation in precipitation.
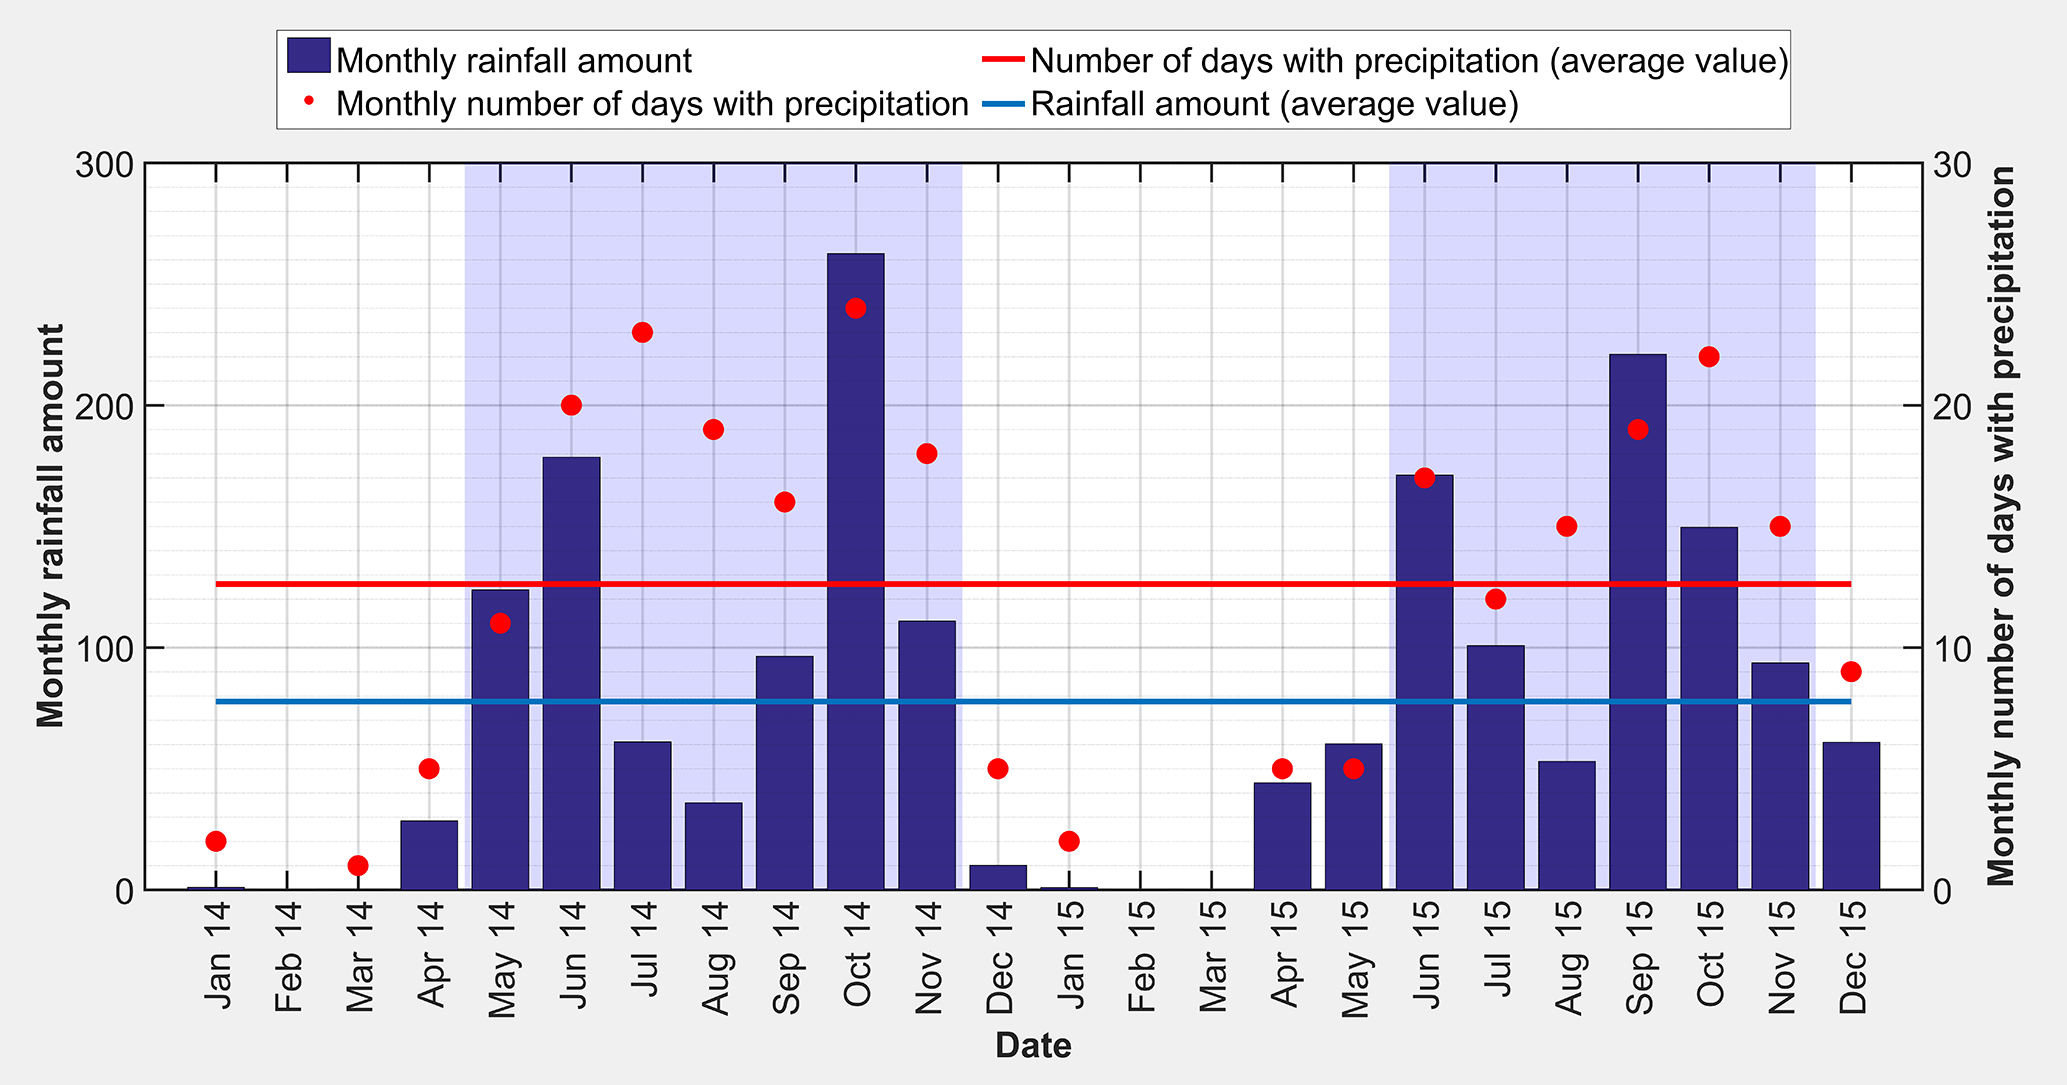
Figure 2Monthly precipitation (mm) and a monthly number of days with precipitation for the Cao Lanh station. Light blue background indicates rainy season.
The study area, the Plain of Reeds (Fig. 1), is located in the northern part of the VMD, between latitudes 10∘42′7′′ to 10∘48′9′′ N and longitudes 105∘22′45′′ to 105∘33′54′′ E. With an area of 697 000 ha, it accounts for 17.7 % of the total area of the VMD. About 95 % of the Plain of Reeds is primarily used for rice paddies, but also for vegetable cultivating and shrimp and fish farming (Hung et al., 2014). The average elevation ranges from 1–4 m a.s.l. (above sea level).
Located in a tropical monsoon region, the climate of the VMD has a distinct seasonality with two seasons: the rainy season (May to November) resulting from the flow of moisture from the Indian Ocean and western North-Pacific Ocean accounting for approximately 80–90 % of the annual rainfall (Tri, 2012) and the dry season (December to April) controlled by high-pressure systems over the Asian continent (Wang et al., 2001). Precipitation from the Indian monsoon is forced by the convective heat sources over the Bay of Bengal (Wang et al., 2001) and arrives earlier than precipitation from the western North-Pacific monsoon (Delgado et al., 2012), forced by a convective heat source over the South China Sea–Philippine Sea. The average annual rainfall is 1400–2200 mm, characterized by an uneven distribution, both spatially and temporally (Renaud and Kuenzer, 2012; GSO, 2014).
The local climate of An Long is described by data from Cao Lanh station. Cao Lanh is the closest national meteorological station to An Long with continuous climate records, located approximately 37 km south-east of An Long. It is assumed that the climatic conditions of An Long and Cao Lanh are similar. The proximity of the two locations without any orographic obstacles in between, the same elevation, and the similar geographical setting (flat topography, located at the eastern bank of the Mekong River) justify this assumption.
The two distinct seasons were defined by the monthly precipitation amounts and the monthly number of days with precipitation recorded at Cao Lanh (Fig. 2). The dry season is set as the months with rainfall amount smaller than the overall average (blue line in Fig. 2), and a monthly number of days with precipitation smaller than the overall average (red line in Fig. 2). All other months are included in the rainy season. The definition used here is mainly developed for the local climatic conditions, the problem to be solved, and the data available. Other definitions could cause some data points to be assigned to the other season. However, those data points will most likely be from the transition period from one season to the other, i.e., other definitions would affect samples that have the least explanatory value for the actual dry and wet seasons.
The data indicate that the rainy season in 2014 lasted from May to November, and in 2015 from June to November. The dry season is thus defined from December 2014 to May 2015 and starts again in December 2015. The study period was somewhat dry with an annual rainfall of 985 mm compared to the long-term average of 1550 mm at the Cao Lanh station. This anomaly needs to be considered in the interpretation of the results.
The annual average temperature is 27 ∘C with the small interannual variability of about 1 ∘C. Variation in temperature throughout the year is small with monthly averages in the range of 25 to 29 ∘C (Fig. 3). The average annual relative humidity ranges from 82 to 85 %, with a seasonal variation of 80 to 88 % during the rainy season and 77 to 83 % during the dry season (Fig. 3). The mean annual evaporation is 984 mm with a significant difference between the rainy season and the dry season. The monthly evaporation rate ranges from 67 to 80 mm and from 76 to 109 mm in the rainy and dry season, respectively. Daily sunshine duration is about 8.7 to 9.6 h in the dry season and 5.5 to 5.9 h in the rainy season (Renaud and Kuenzer, 2012; GSO, 2014).

Figure 3Climate data from the Cao Lanh meteorological station for the study period. Daily temperature (T) is given together with monthly and daily precipitation (P) and daily relative humidity (H). Weekly and bi-weekly δ18O (‰ VSMOW) values of rainwater are presented as red circles.
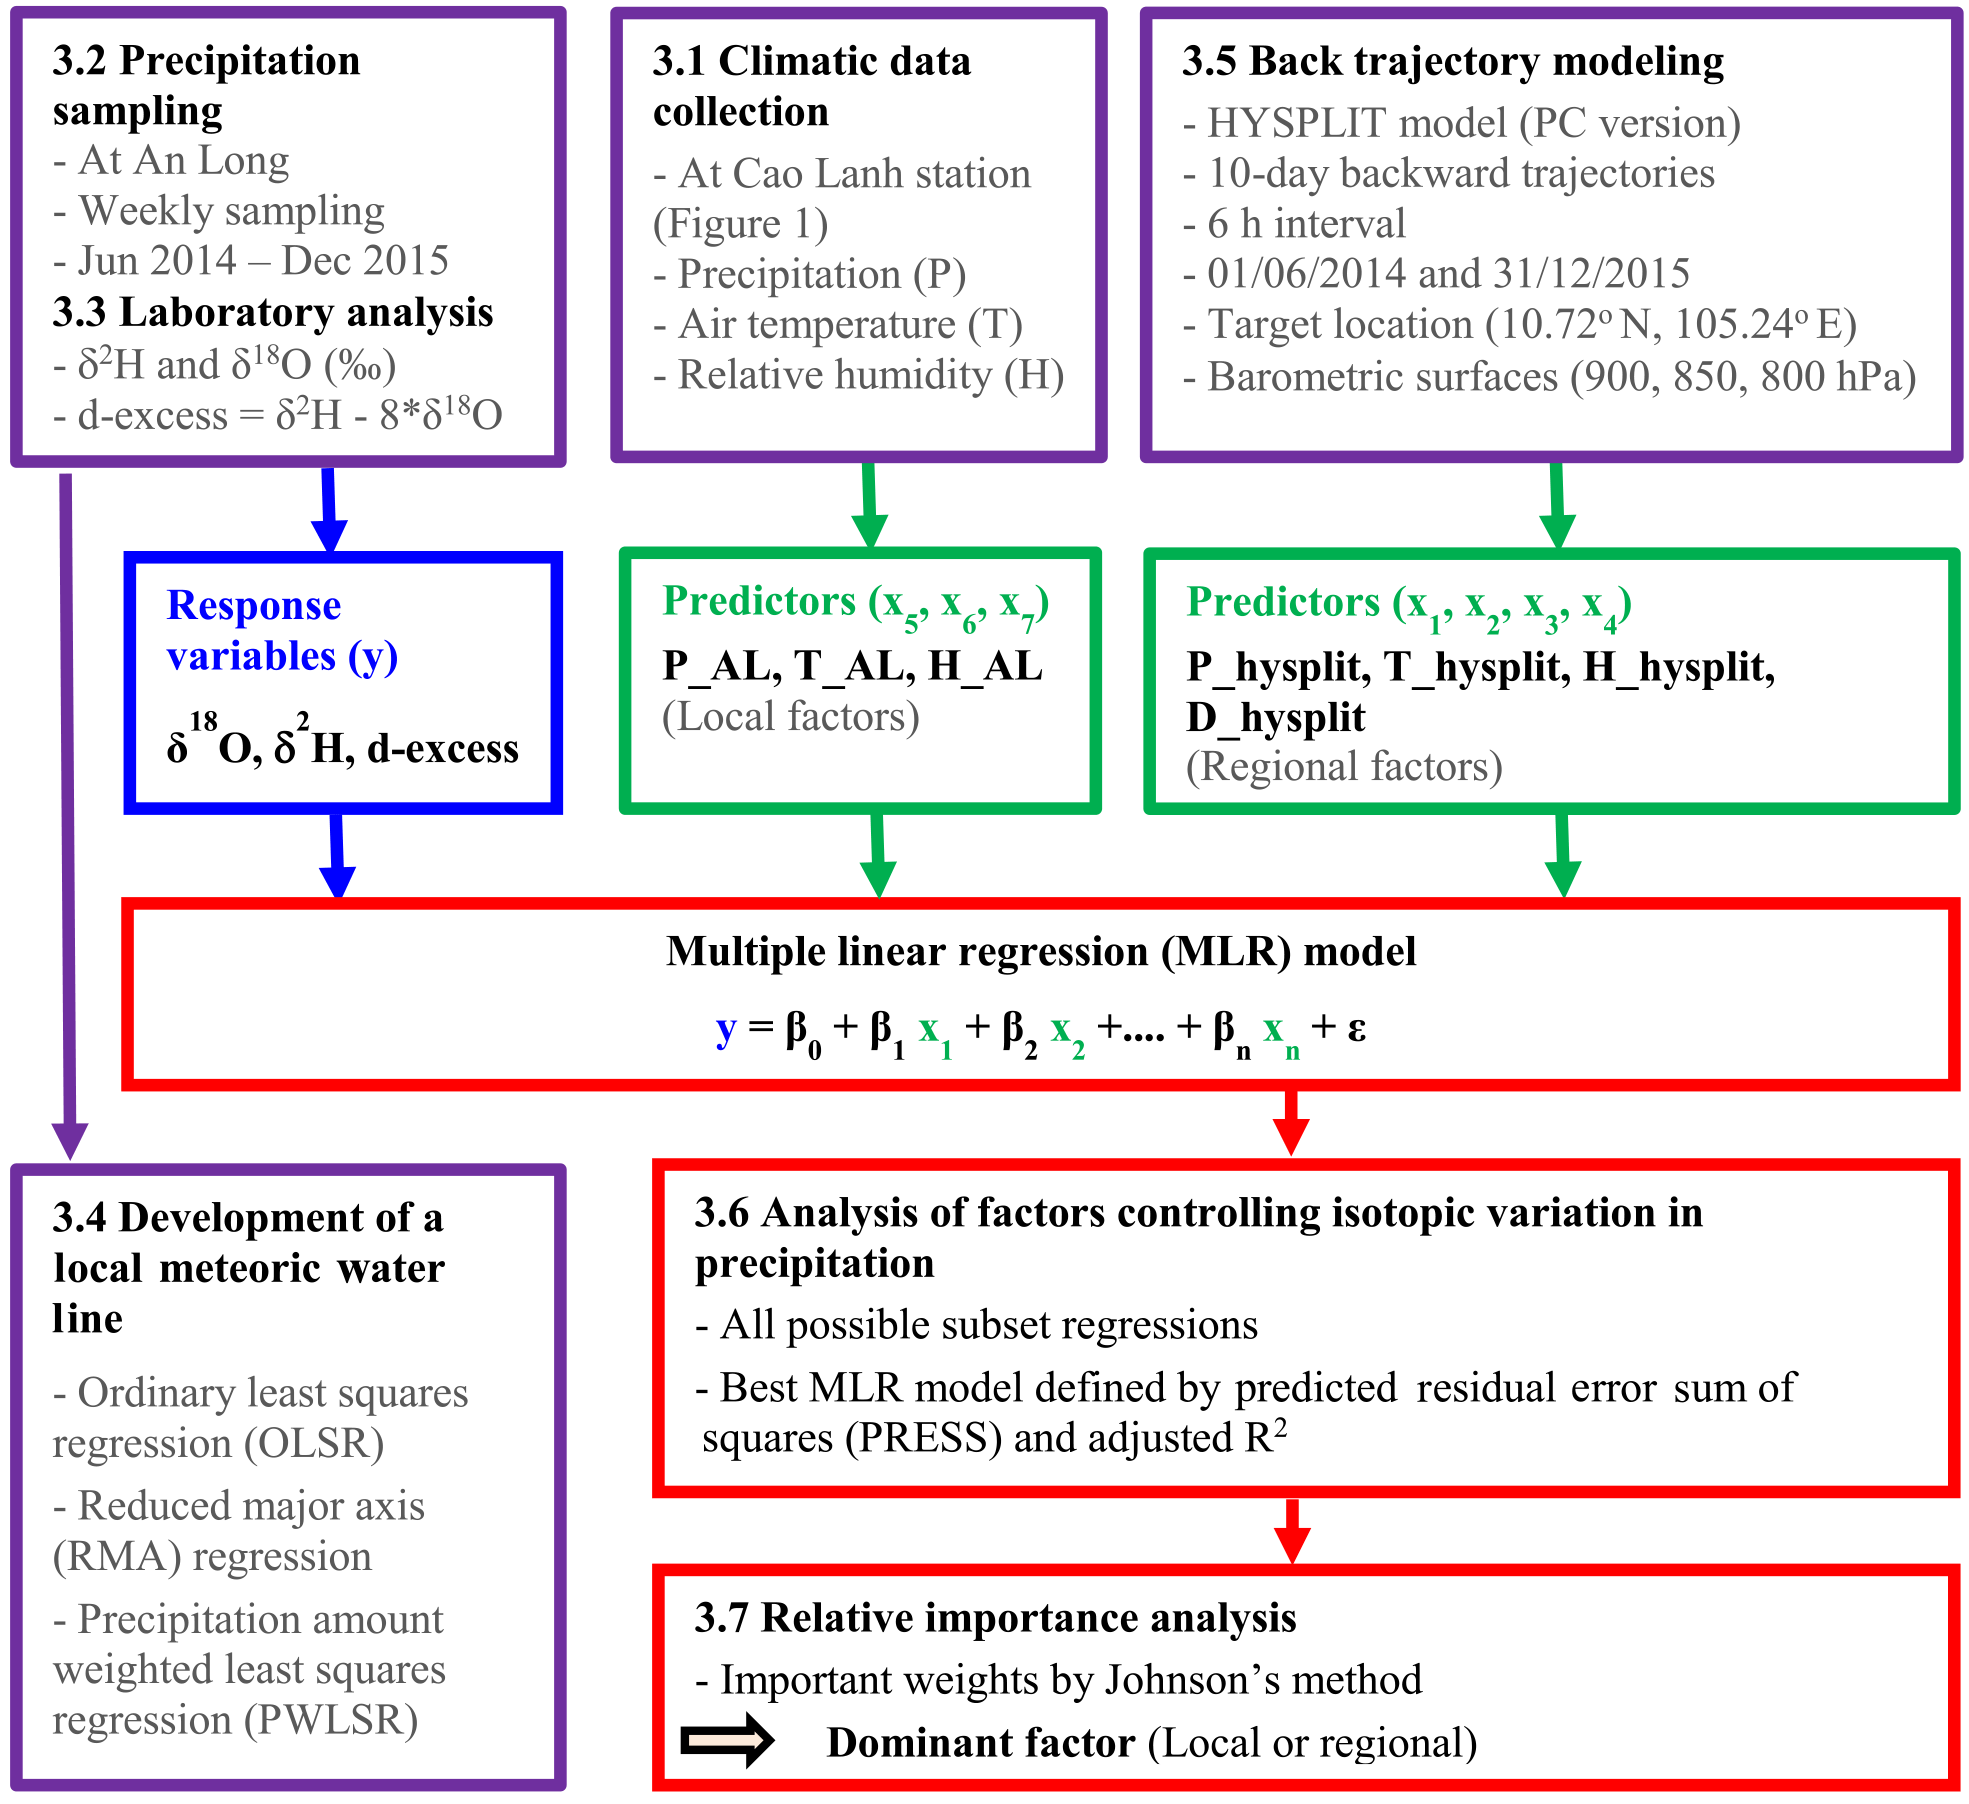
Figure 4Methodology used in the study. Local precipitation (P_AL), air temperature (T_AL), and relative humidity (H_AL) at An Long. Precipitation amount (P_hysplit), mean temperature (T_hysplit) and relative humidity (H_hysplit) along the transport pathways, and the length of backward trajectories (D_hysplit).
An overview of the methodology is given in Fig. 4. For the derivation of local factors relevant for the isotopic composition of precipitation, climate data from the nearby meteorological station of Cao Lanh were collected (Sect. 3.1). At the test location, precipitation samples were analyzed for their isotopic composition (Sects. 3.2 and 3.3). Local meteoric water lines (LMWLs) were derived from the isotopic data (Sect. 3.4). The regional factors were derived from atmospheric back trajectory modeling (Sect. 3.5). All possible combinations of local and regional predictors were included in multiple linear regressions, and their ability to explain the observed variance in the isotopic composition of precipitation was determined with performance statistics (MLR; Sect. 3.6). Finally, the influence of the different factors on the explained variance in isotopic composition was determined by relative importance analysis (Sect. 3.7).
3.1 Climatic and isotopic data collection
Daily precipitation, air temperature, and relative humidity were obtained from the National Centre for Hydro-Meteorological Forecasting (NCHMF) of Vietnam at Cao Lanh for the period 2012–2015. Long-term (more than 30 years) climatic data at this station were provided by SIWRP (2014). Precipitation isotopic data from six selected GNIP stations (IAEA/WMO, 2016) located in the Indochinese Peninsula (Fig. 1) were collected for comparison with the isotopic data sampled in this study in order to investigate regional similarities or differences in isotope composition in rainfall in Southeast Asia. This was tested by the Levene test (Levene, 1960) for equality of variances in the isotopic data of the different stations, and the comparison of LMWLs.
3.2 Precipitation sampling at An Long
Precipitation at An Long in the Plain of Reeds (Fig. 1) was sampled on a weekly basis between June 2014 and May 2015 and twice a week between June 2015 and December 2015. The rain collector was a dip-in sampler type as described in the guidelines of the IAEA technical procedure for precipitation sampling (IAEA, 2014). It consists of a 5 L accumulation glass bottle fitted with a vertical 14 cm diameter plastic funnel that reaches almost to the bottom to prevent evaporative losses, and a pressure equilibration plastic tube (2 mm in diameter and 15 m in length) to minimize evaporation. All collected samples were stored in 30 mL plastic sample bottles with tight screw caps to avoid evaporation effects. Between collection and laboratory analysis, the samples were stored in the dark.
3.3 Isotopic laboratory analysis
All stable isotope samples were analyzed at the laboratory of the Alfred-Wegener-Institute (AWI) in Potsdam, Germany. The measurements were performed with a Finnigan MAT Delta-S mass spectrometer using equilibration techniques to determine the ratio of stable oxygen (18O : 16O) and hydrogen (2H : 1H) isotopes. Analytical results were reported as δ2H and δ18O (‰, relative to Vienna Standard Mean Ocean Water – VSMOW) with internal 1σ errors of better than 0.8 and 0.1 ‰ for δ2H and δ18O, respectively. The measuring procedure is described in detail in Meyer et al. (2000). The deuterium excess (d-excess) was calculated following Eq. (1) (Dansgaard, 1964):
3.4 Development of local meteoric water lines
LMWLs were derived by least-squares regression of δ18O against δ2H values of the samples. The quality-of-fit of the LMWLs was evaluated based on the coefficient of determination R2 (also referred to as explained variance), the standard error SE, and the statistical significance value (p value). The regression model indicates a good fit to the data when R2 is close to 1.0, the standard error is small in relation to the magnitude of the data, and the p value is smaller than 0.0001 (Helsel and Hirsch, 2002). The slope and intercept of the LMWL of An Long were compared to those of GNIP stations to put the data from An Long in a regional context.
3.5 Back trajectory modeling
The potential locations of atmospheric moisture sources and the direction of the air mass causing precipitation before reaching An Long station were investigated via back-trajectory analysis. This investigation was performed using the PC Windows-based HYSPLIT (Hybrid Single Particle Lagrangian Integrated Trajectory) model developed by NOAA (National Oceanic and Atmospheric Administration) at the Air Resources Laboratory (ARL) (http://www.arl.noaa.gov/HYSPLIT info.php). The model builds on the Lagrangian approach, using a moving frame of reference for the advection and diffusion calculation as the air parcels move from their initial location (Draxler and Rolph, 2003; Stein et al., 2015).
The 1∘ × 1∘ climatic data set generated by the global data assimilation system (GDAS) was used as input to the HYSPLIT model. The 10-day backward trajectory analysis was performed every 6 h between 1 June 2014 and 31 December 2015 at the sampling site (10.72∘ N, 105.24∘ E) for three levels at 1000, 1500, and 2000 m above ground (corresponding to barometric surfaces of approximately 900, 850, and 800 hPa, respectively). These barometric surfaces were chosen because the 850 hPa vorticity is highly indicative of the strength of the boundary layer moisture convergence and rainfall in regions away from the equator (Wang et al., 2001), hence rainfall is expected to mostly originate from these altitudes. Consequently, the combination of 800 and 850 hPa barometric surfaces accounts for the fact that rainfall is expected to mostly originate between 1500 and 2000 m a.g.l. (above ground level). Correspondingly, the combination of the barometric surfaces of 800, 850, and 900 hPa means that rainfall is expected to mostly originate between 1000 and 2000 m a.g.l. In total, 6948 backward trajectories were computed. The HYSPLIT outputs, i.e., precipitation, temperature, relative humidity along the backward trajectories, and the length of trajectories (the distance of moisture sources traveled), were used as regional factors potentially controlling the variation in the isotopic composition of precipitation at An Long. Accumulated precipitation, mean values of temperature, and humidity of the hourly HYSPLIT output were calculated along the trajectory, as well as the length of the trajectory. All these factors were used as predictors in the MLR.
A cluster analysis of a large number of trajectories arriving at the study site was applied to group similar trajectories and thus source regions, in order to better interpret the trajectories and to confirm the accuracy of the trajectory analysis. More information about the HYSPLIT cluster analysis can be found at https://ready.arl.noaa.gov/documents/Tutorial/html/.
3.6 Analysis of factors controlling isotopic variation in precipitation
MLR was used to assess how the isotopic variation in precipitation is related to regional and local controlling factors. As indicators of regional factors, the output of the HYSPLIT model was used consisting of the accumulated precipitation amount along the transport pathways (hereafter P_hysplit), mean temperature (T_hysplit), and mean relative humidity (H_hysplit) along the trajectory, and the distance of moisture sources traveled within the time frame of 10 days (D_hysplit). The local climatic factors are weekly precipitation amount (P_AL) at An Long station, and weekly mean air temperature (T_AL) and weekly mean relative humidity (H_AL) taken from the nearby Cao Lanh station during the sampling period. These seven predictors were related to isotopic values (δ18O, δ2H, and d-excess) defined as response variables in the MLR. Pearson linear correlation coefficients were computed to show intercorrelations between response and predictor variables and then used to determine the importance of predictors in the MLR.
All possible subset regression models consisting of all possible combinations of predictors (27 − 1 = 127 models) were applied separately for δ18O, δ2H, and d-excess. The coefficient of determination R2 for the MLR was calculated for each subset regression. The goodness of each MLR model was evaluated based on the prediction residual error sum of squares (PRESS; Eq. 2) and adjusted R2 (; Eq. 3) (Helsel and Hirsch, 2002).
In Eq. (2), the PRESS residuals are defined as e(i) = yi − , where is the regression estimate of yi based on a regression equation computed leaving out the ith observation. The process is repeated for all n observations. The selection of best models with PRESS is equivalent to a leave-one-out cross-validation, which tests the regression models for robustness and reduces the chances of model over-fitting, i.e., the chances of finding spurious regression models that provide good results for the given combination of factors and selected period only.
In Eq. (3), p is the total number of predictors in the MLR model and n is the number of observations. The statistical significance of all linear regression was evaluated based on the p value for the F test as part of a one-way ANOVA analysis. A good MLR model is thus characterized by the following:
- i.
PRESS approaching zero,
- ii.
adjusted R2 () approaching 1.0,
- iii.
a p value smaller than 0.0001.
For each response variable, six pressure layers (800, 850, 900 hPa, and mean values of their combinations) and 10 durations of backward trajectories (from 1 to 10 days backward) were used. The different pressure levels and combinations were chosen to tackle the inherent uncertainty regarding the pressure levels from which the rainfall actually stems. Similarly, various durations of the trajectories were chosen in order to avoid fixing the a priori unknown travel time of precipitation reaching An Long. Overall, this resulted in 7620 MLR models for each response variable δ18O, δ2H, and d-excess (6 pressure levels times 10 trajectory durations times 127 predictor sets). The best MLR model was then identified by the smallest PRESS value (Eq. 2). Furthermore, the goodness-of-fit of the MLR models was characterized based on the adjusted R2 values.
3.7 Relative importance analysis
Relative importance analysis determines the proportion of the variance explained by the individual predictors in the regression. However, this is difficult when predictors are correlated, since multicollinearity can lead to a high sensitivity of regression coefficients caused by small changes in the model. This means that the importance can strongly shift from one predictor to another well correlated one if the data set is changed even only slightly. The leave-one-out cross-validation may be particularly vulnerable to this effect.
While several methods such as zero-order bivariate correlation (e.g., Pearson correlation), standardized regression weights (β weights), structure coefficient (the correlation between an observed predictor and the predicted criterion scores), or all possible subsets regression can be applied to interpret and understand the contributions of predictors playing in forming regression effects, these traditional estimates of importance fail to appropriately partition variance to the various predictors when they are correlated (Tonidandel and LeBreton, 2011). In response, two useful techniques for interpreting a regression equation and for quantifying predictor importance are available: dominance analysis (Budescu, 1993) and relative weight analysis (Johnson, 2000), which has been developed for more accurately quantifying the power of predictors when they are correlated. Both of these methods are advantageous over traditional measures of importance (LeBreton et al., 2007). Although both of these methods yield qualitatively similar results, Johnson's relative weight analysis is much more computationally efficient, especially with large numbers (> 10) of predictors (Johnson, 2000). For a review of approaches to estimate predictor importance, readers are referred to Tonidandel and LeBreton (2011) and Kraha et al. (2012).
Because of its computational efficiency, the relative weight analysis (Johnson, 2000) was applied in this study to quantify the proportion of the variance explained by the individual regression factors in the MLR, and thus identifies the dominant controls on the isotopic composition of rainfall. Specifically, relative weight analysis approximates the relative importance of a set of predictors by creating a set of variables that are highly related to the original set of variables but are uncorrelated with each other. The response variable is then regressed on the uncorrelated set of predictors to approximate the relative weight of the original set of predictors, defined as the relative contribution of each predictor to R2. Relative weights of correlated predictors are therefore analogous to squared standardized regression coefficients when predictors are uncorrelated. Details are given in Johnson (2000) and Tonidandel et al. (2009). In this study, relative weights were also reported as percentages of the regression R2.
4.1 Variability in moisture sources
Single backward trajectory computations by the HYSPLIT model are not definite, but can contain some uncertainty. The horizontal uncertainty of the trajectory calculations by HYSPLIT has been estimated to be 10–20 % of the travel distance (Draxler and Hess, 1998). Errors in trajectory calculation computed from analyzed wind fields seem to be typically of the order of 20 % of the distance traveled (Stohl, 1998). However, the statistical analysis of a large number of trajectories arriving at a study site would increase the accuracy of the trajectory analysis (Cabello et al., 2008). In this study, several quality control measures were applied, as recommended in Stohl (1998), to increase confidence in the HYSPLIT-generated back trajectories and to improve the validity of the air mass history. Firstly, trajectories were computed for three pressure levels (900, 850, and 800 hPa). Similar origins of atmospheric moisture for these pressure levels suggest that resolution errors and atmospheric shearing instabilities are negligible, which increases the confidence in the results. Secondly, we use the shortest possible integration time step (i.e., 1 h) and a small value for the parameter TRATIO (0.25), which is the fraction of a grid cell that a trajectory is permitted to transit in one advection time step. Smaller values of TRATIO help to minimize the trajectory computation error using the HYSPLIT model. Thirdly, the statistical analysis of a large number of trajectories (e.g., trajectory cluster analysis) arriving at the study site was applied to confirm the accuracy of the trajectory analysis. The trajectory cluster analysis is conducted by the HYSPLIT model to group trajectories with similar pathways. The cluster analysis merges these trajectories that are near each other and represents those clusters by their mean trajectory. Differences between trajectories within a cluster are minimized while differences between clusters are maximized. Computationally, trajectories are combined to decrease the number of clusters until the total spatial variance (TSV) starts to increase significantly. This occurs when disparate clusters are combined. This number of clusters is then selected as the optimal cluster number for sorting and combining similar trajectories.
Figure 5 shows back-calculated trajectories of atmospheric moisture prior to rainy days at An Long for the sampling period from June 2014 to December 2015. Left and right columns show the results of 850 hPa trajectories for 2014 and 2015, respectively, and the upper, middle, and lower panels show the results for the early (June–September) and late (October–November) rainy season and the dry season (December–May), respectively. Figure 6 shows the spatial distribution of vapor trajectories (cluster means) for precipitation days at An Long for three barometric surfaces (800, 850, 900 hPa) between June 2014 and December 2015, and the change in TVS for different cluster numbers. The TSV was used to identify the optimum number of clusters. The similarity of back-calculated trajectories (Fig. 5) and trajectory cluster analysis (Fig. 6) at three barometric surfaces (900, 850, and 800 hPa) illustrates that the trajectories and thus the source regions do not differ between different atmospheric layers. This indicates a barotropic atmosphere, with the consequence that it is unlikely that the selection of the pressure layer for the HYSPLIT trajectories modifies the results of the MLR significantly.
Figures 5 and 6 demonstrate that the dry-season precipitation (from December to May) in the Plain of Reeds mainly originates from the moisture sources of the Asian continental air masses and the oceanic air masses carried by the equatorial easterlies. Whereas during the rainy season (from June to November) air masses travel a longer distance over the tropical Indian Ocean (from June to September) and the South Pacific Ocean (October to November).
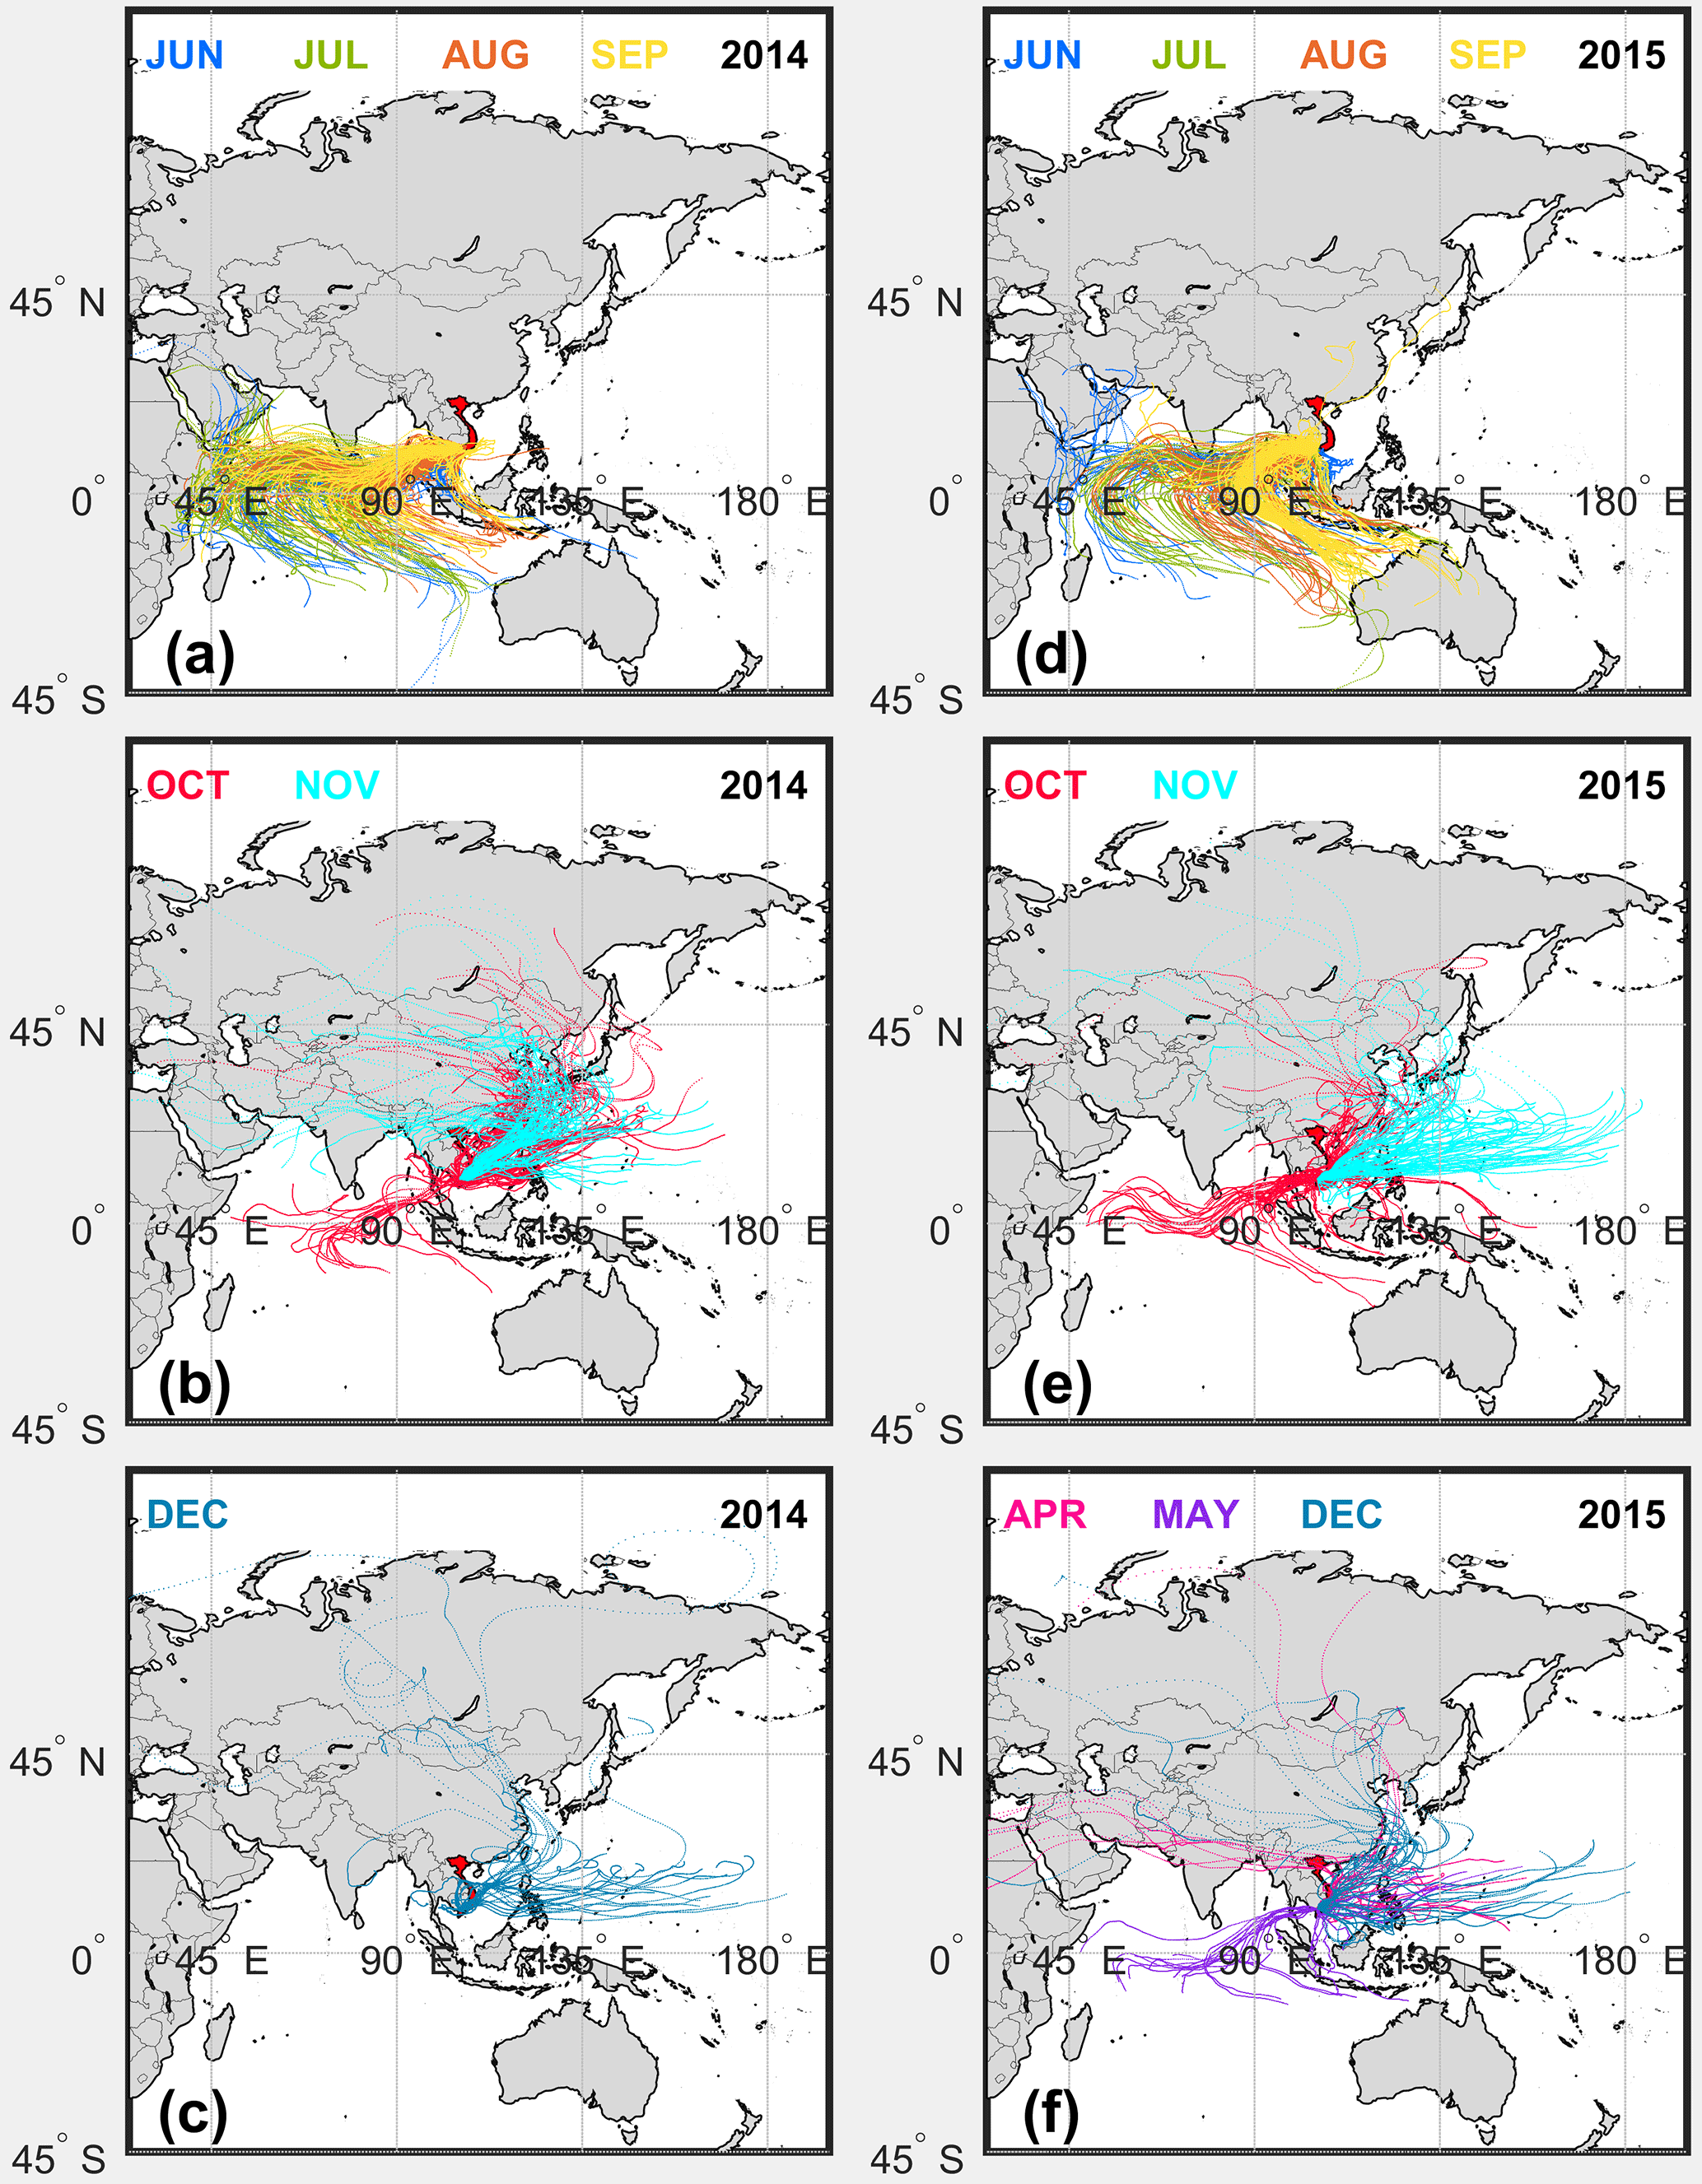
Figure 5Back-trajectories indicating potential moisture sources of precipitation (plotted only for days with precipitation) at An Long station for the barometric surfaces at 850 hPa between June 2014 and December 2015. (a)–(c) show the results for 2014, (d)–(f) for 2015; top row (a, d) early rainy season (June–September), middle row (b, e) late rainy season (October–November), bottom row (c, f) dry season (December–May). In January, February, and March 2015 no rainfall was recorded.
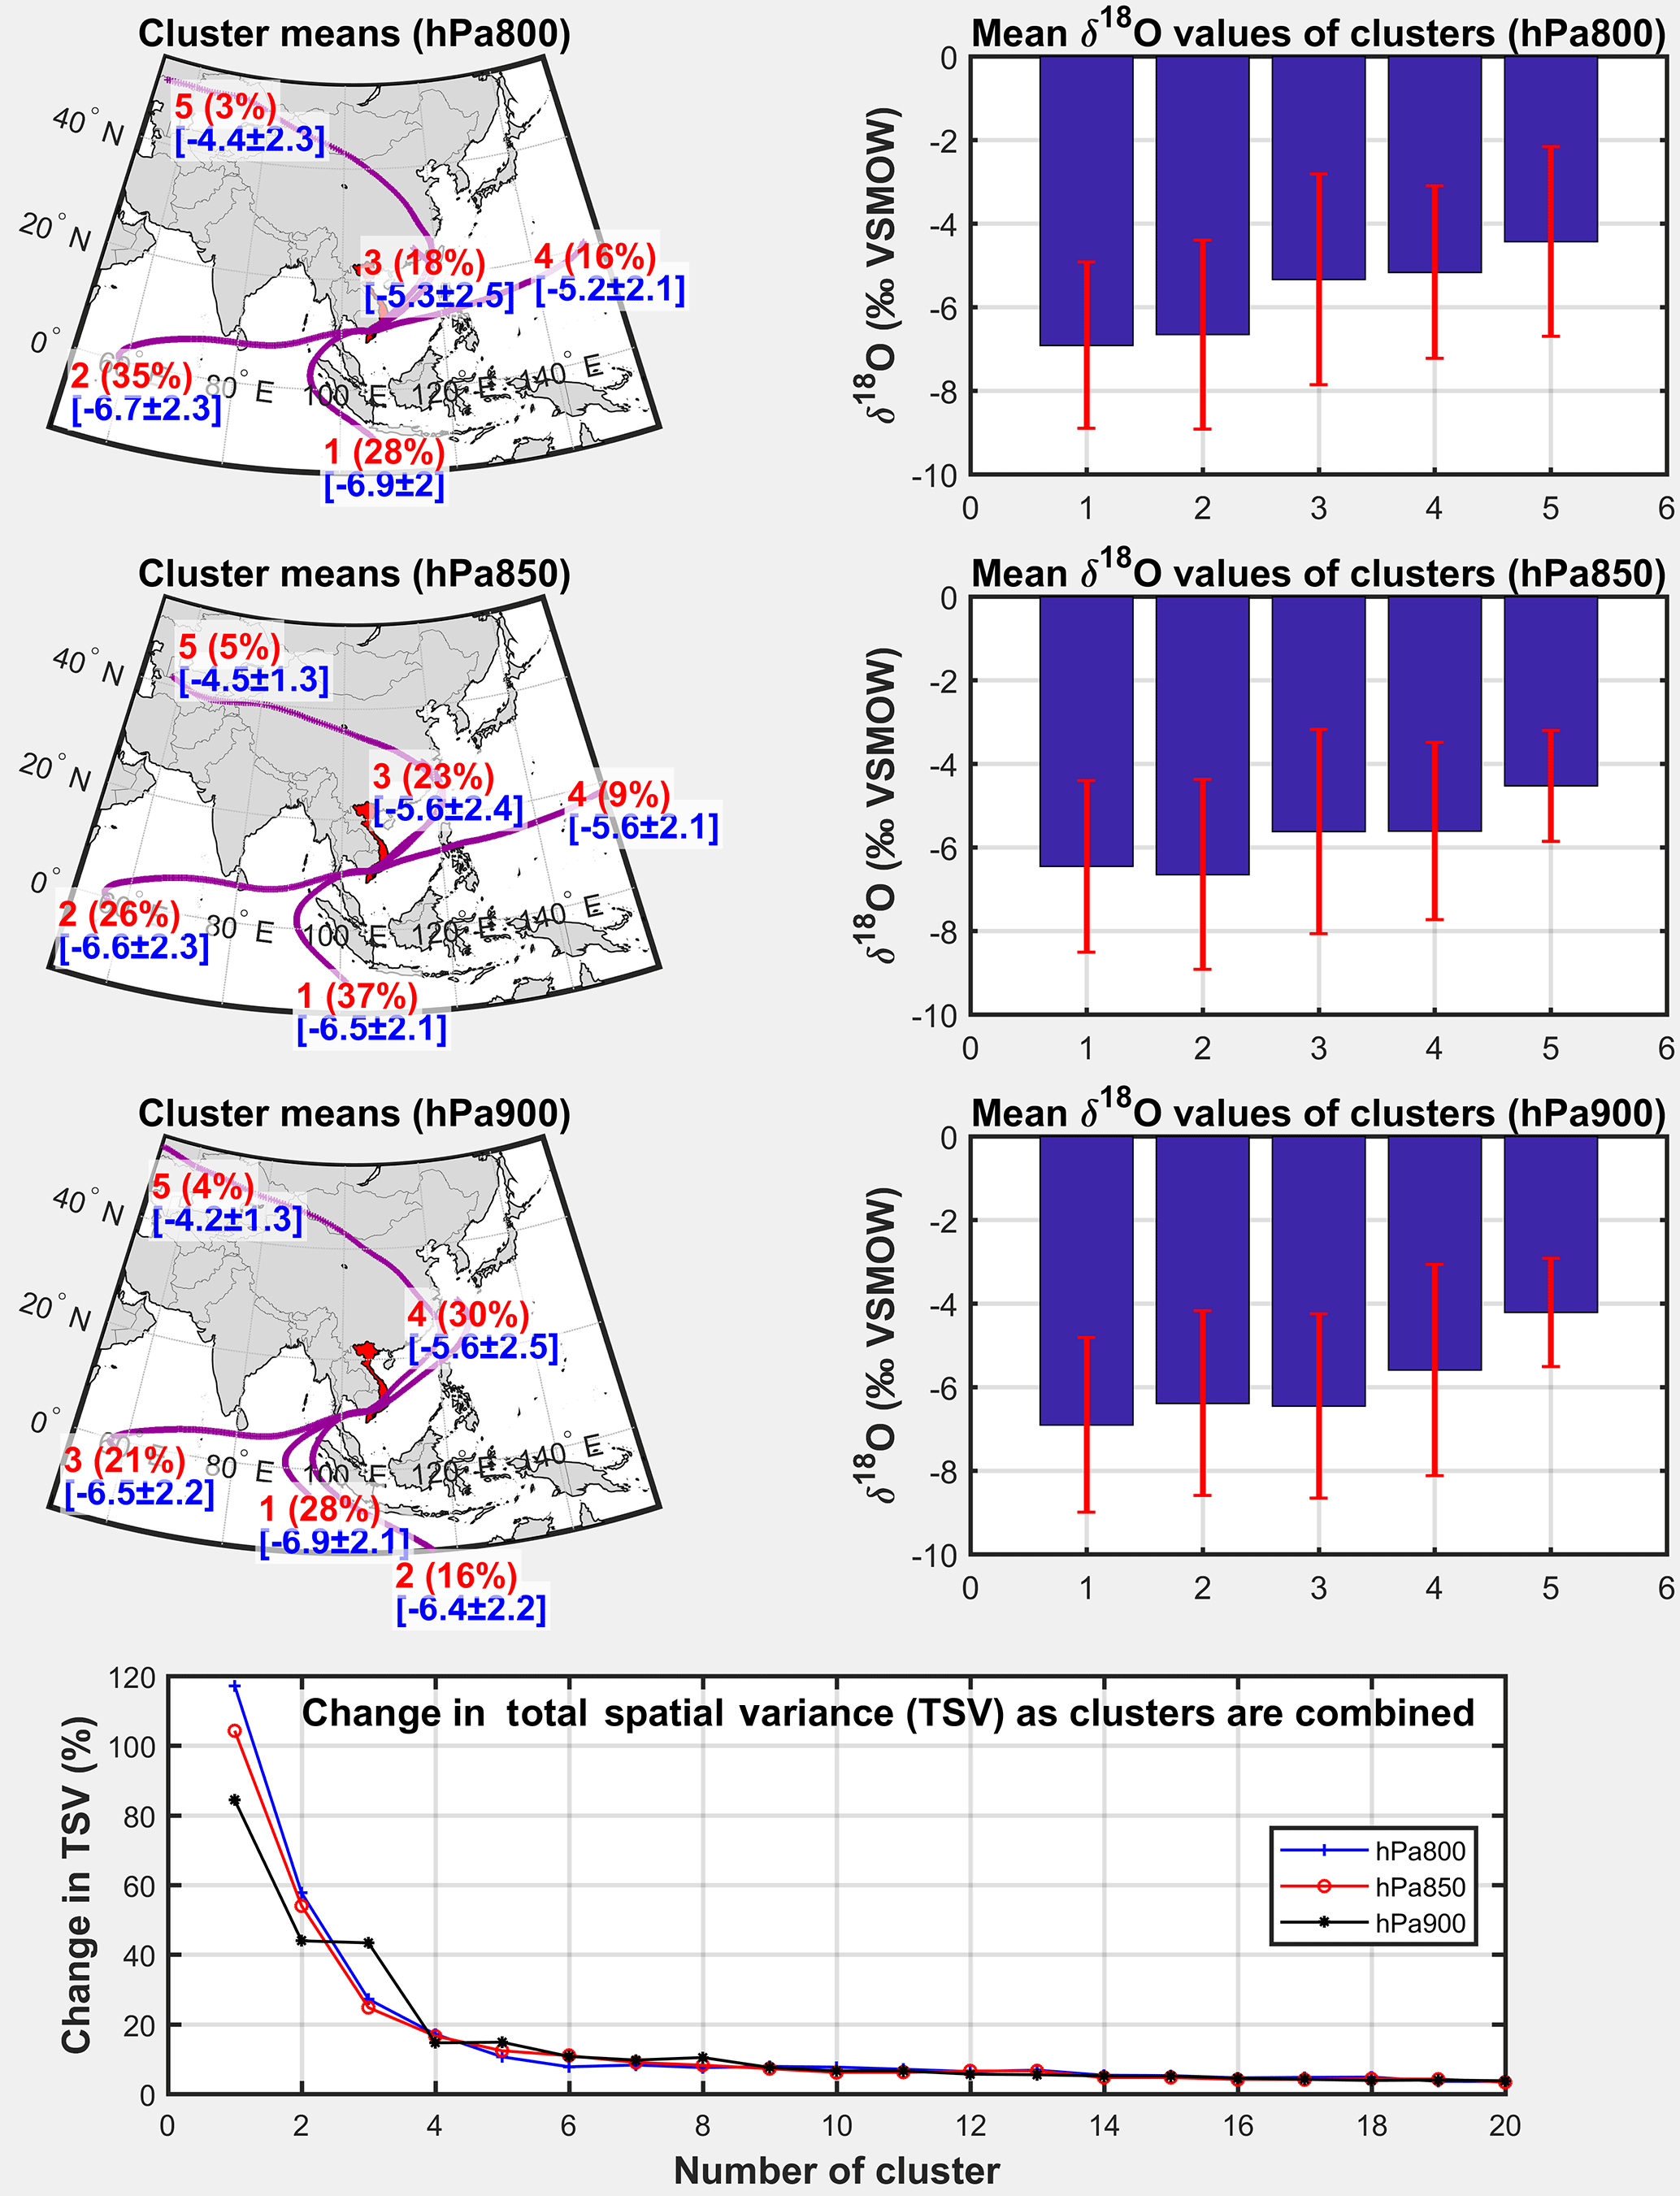
Figure 6Spatial distribution of vapor trajectories (cluster means) for precipitation days at An Long for three barometric surfaces (800, 850, 900 hPa) between June 2014 and December 2015, and change in total spatial variance (TVS) for different cluster numbers. The TSV was used to identify the optimum number of clusters (here 5 clusters). Red numbers indicate the cluster number (1–5) and the percent of all trajectories assigned to each of the five clusters. Blue numbers and bar charts indicate the mean δ18O values for each cluster plus/minus the standard deviation of each cluster.
These findings for An Long agree with the general characterization of monsoonal circulation and precipitation over the Southeast Asia region, with moisture from the Indian Ocean dominating during the initial stage of monsoon evolution, and the Pacific Ocean dominating in the later stages (Lim et al., 2002; Aggarwal et al., 2004; Delgado et al., 2012). This indicates that the HYSPLIT model provides valid trajectories to be used in the MLR.
The mean δ18O values for the five clusters are noted in Fig. 6 (in blue). The mean cluster values are similar for the three pressure levels. Also, the mean values of the two clusters from the Indian Ocean, as well as the two clusters from the Pacific, are similar. For a fingerprinting, one also has to consider the variation in the values within the clusters, which partly overlap. This means that the δ18O values of precipitation in the Mekong Delta cannot be used to uniquely identify the origin of the trajectory. However, they provide a coarse indication of their origin.
4.2 Isotopic composition of precipitation
4.2.1 Meteoric water lines
The ordinary least squares linear regression (OLSR) of 74 pairs of δ18O and δ2H values at An Long yield the following LMWL for the Plain of Reeds:
The numbers in brackets indicate the estimates of slope and intercept plus/minus the standard deviation, indicating the parameter uncertainty. The regression is stable against different regression techniques, as shown in the Supplement S1.
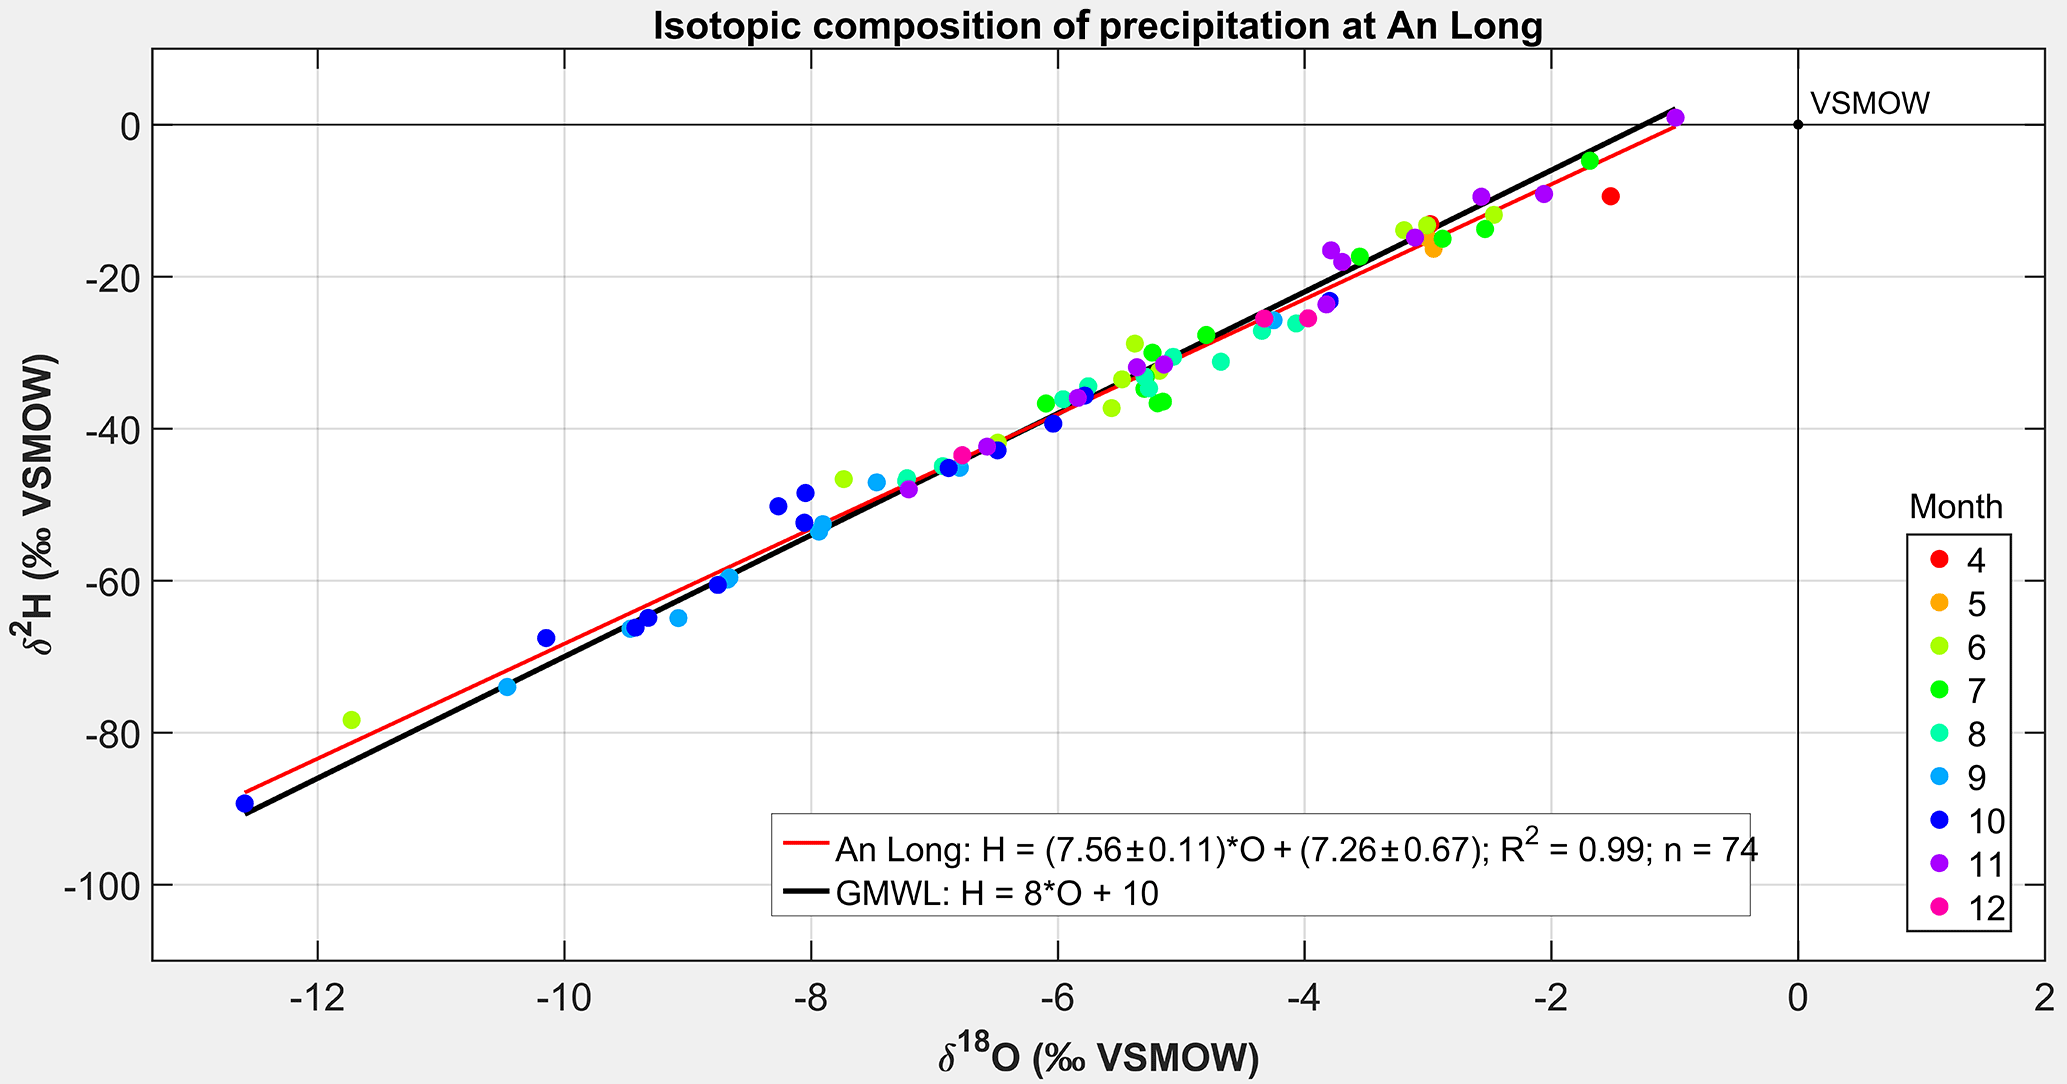
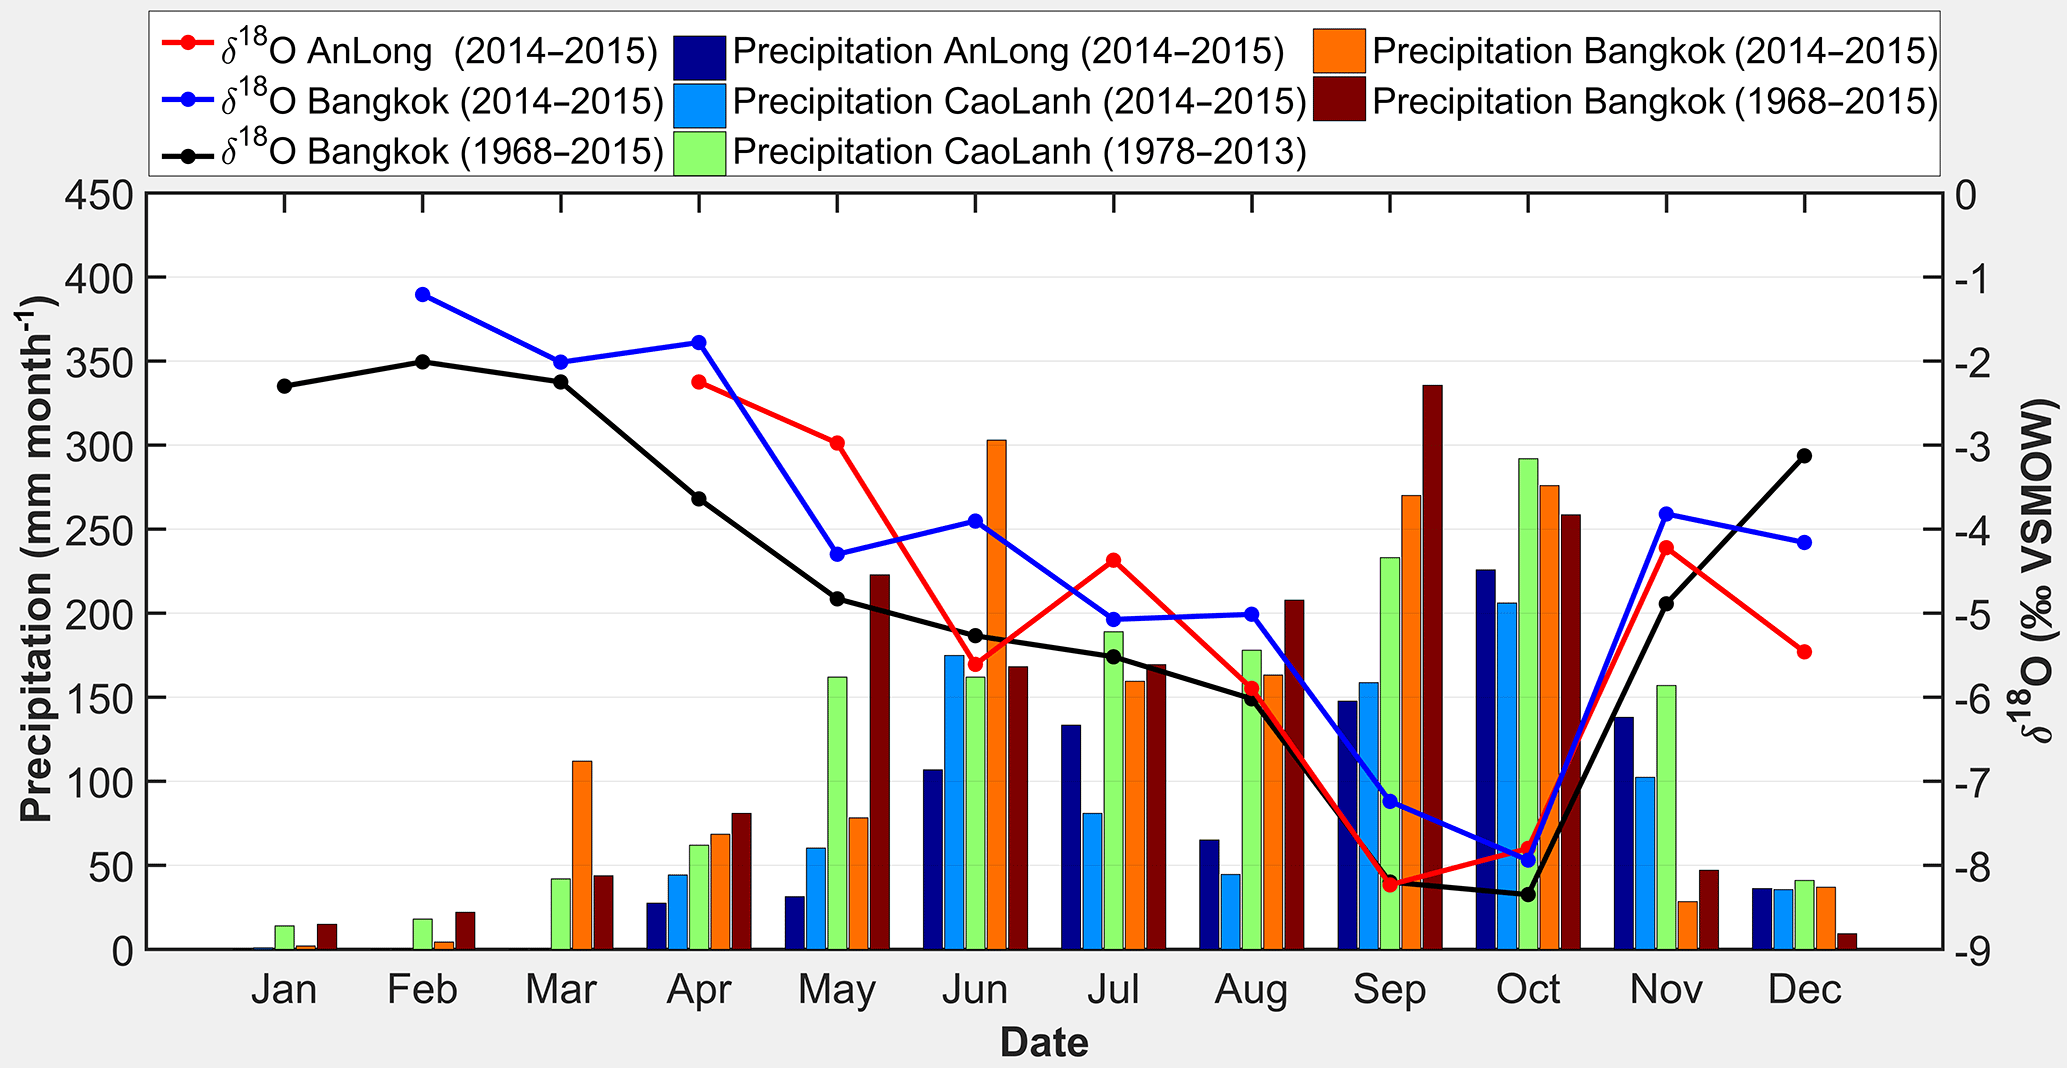
Figure 8Seasonal variation in the average monthly precipitation for An Long and Cao Lanh and δ18O values of precipitation for An Long (for the period of observation – red) and Bangkok (both for the period of observation – blue – and the long-term mean – black).
The close fit of all considered regressions indicates a very good linear relationship between δ18O and δ2H in the study. On large temporal scales, a good linear relationship between δ18O and δ2H is usually observed at sites where secondary fractionation processes, e.g., sub-cloud evaporation, are insignificant (Crawford et al., 2014). The LMWL for An Long is slightly different from the global meteoric water line (GMWL; defined by δ2H = 8 ⋅ δ18O + 10; Craig, 1961) (Fig. 7) and the LMWLs derived for six selected GNIP stations (IAEA/WMO, 2016) located in the Indochinese Peninsula (Table 1). The small difference in slope between the LMWL compared to that of GMWL, and the distribution of isotope values along the GMWL indicate that evaporative isotopic enrichment during rainfall is not significant. However, the less positive intercepts of the LMWL (< 10 ‰) (Fig. 7) may reflect smaller kinetic effects during evaporation (Ingraham, 1998) over the Mekong Delta compared to the worldwide average.
Table 1Isotopic composition of precipitation at An Long and six selected GNIP stations throughout the Indochinese Peninsula.

Note: * measured at An Long in 2015; numbers in parentheses show mean values of long-term measurements at Cao Lanh. Data are from https://nucleus.iaea.org/wiser/gnip.php (IAEA/WMO, 2016). P: annual precipitation (mm yr−1); T: average temperature (∘C); AL: altitude (m a.s.l. – meter above sea level); WM: weighted mean value; M: mean value; S: slope; Int.: intercept; a RMA: reduced major axis regression; b PWLSR: precipitation amount weighted least squares regression.
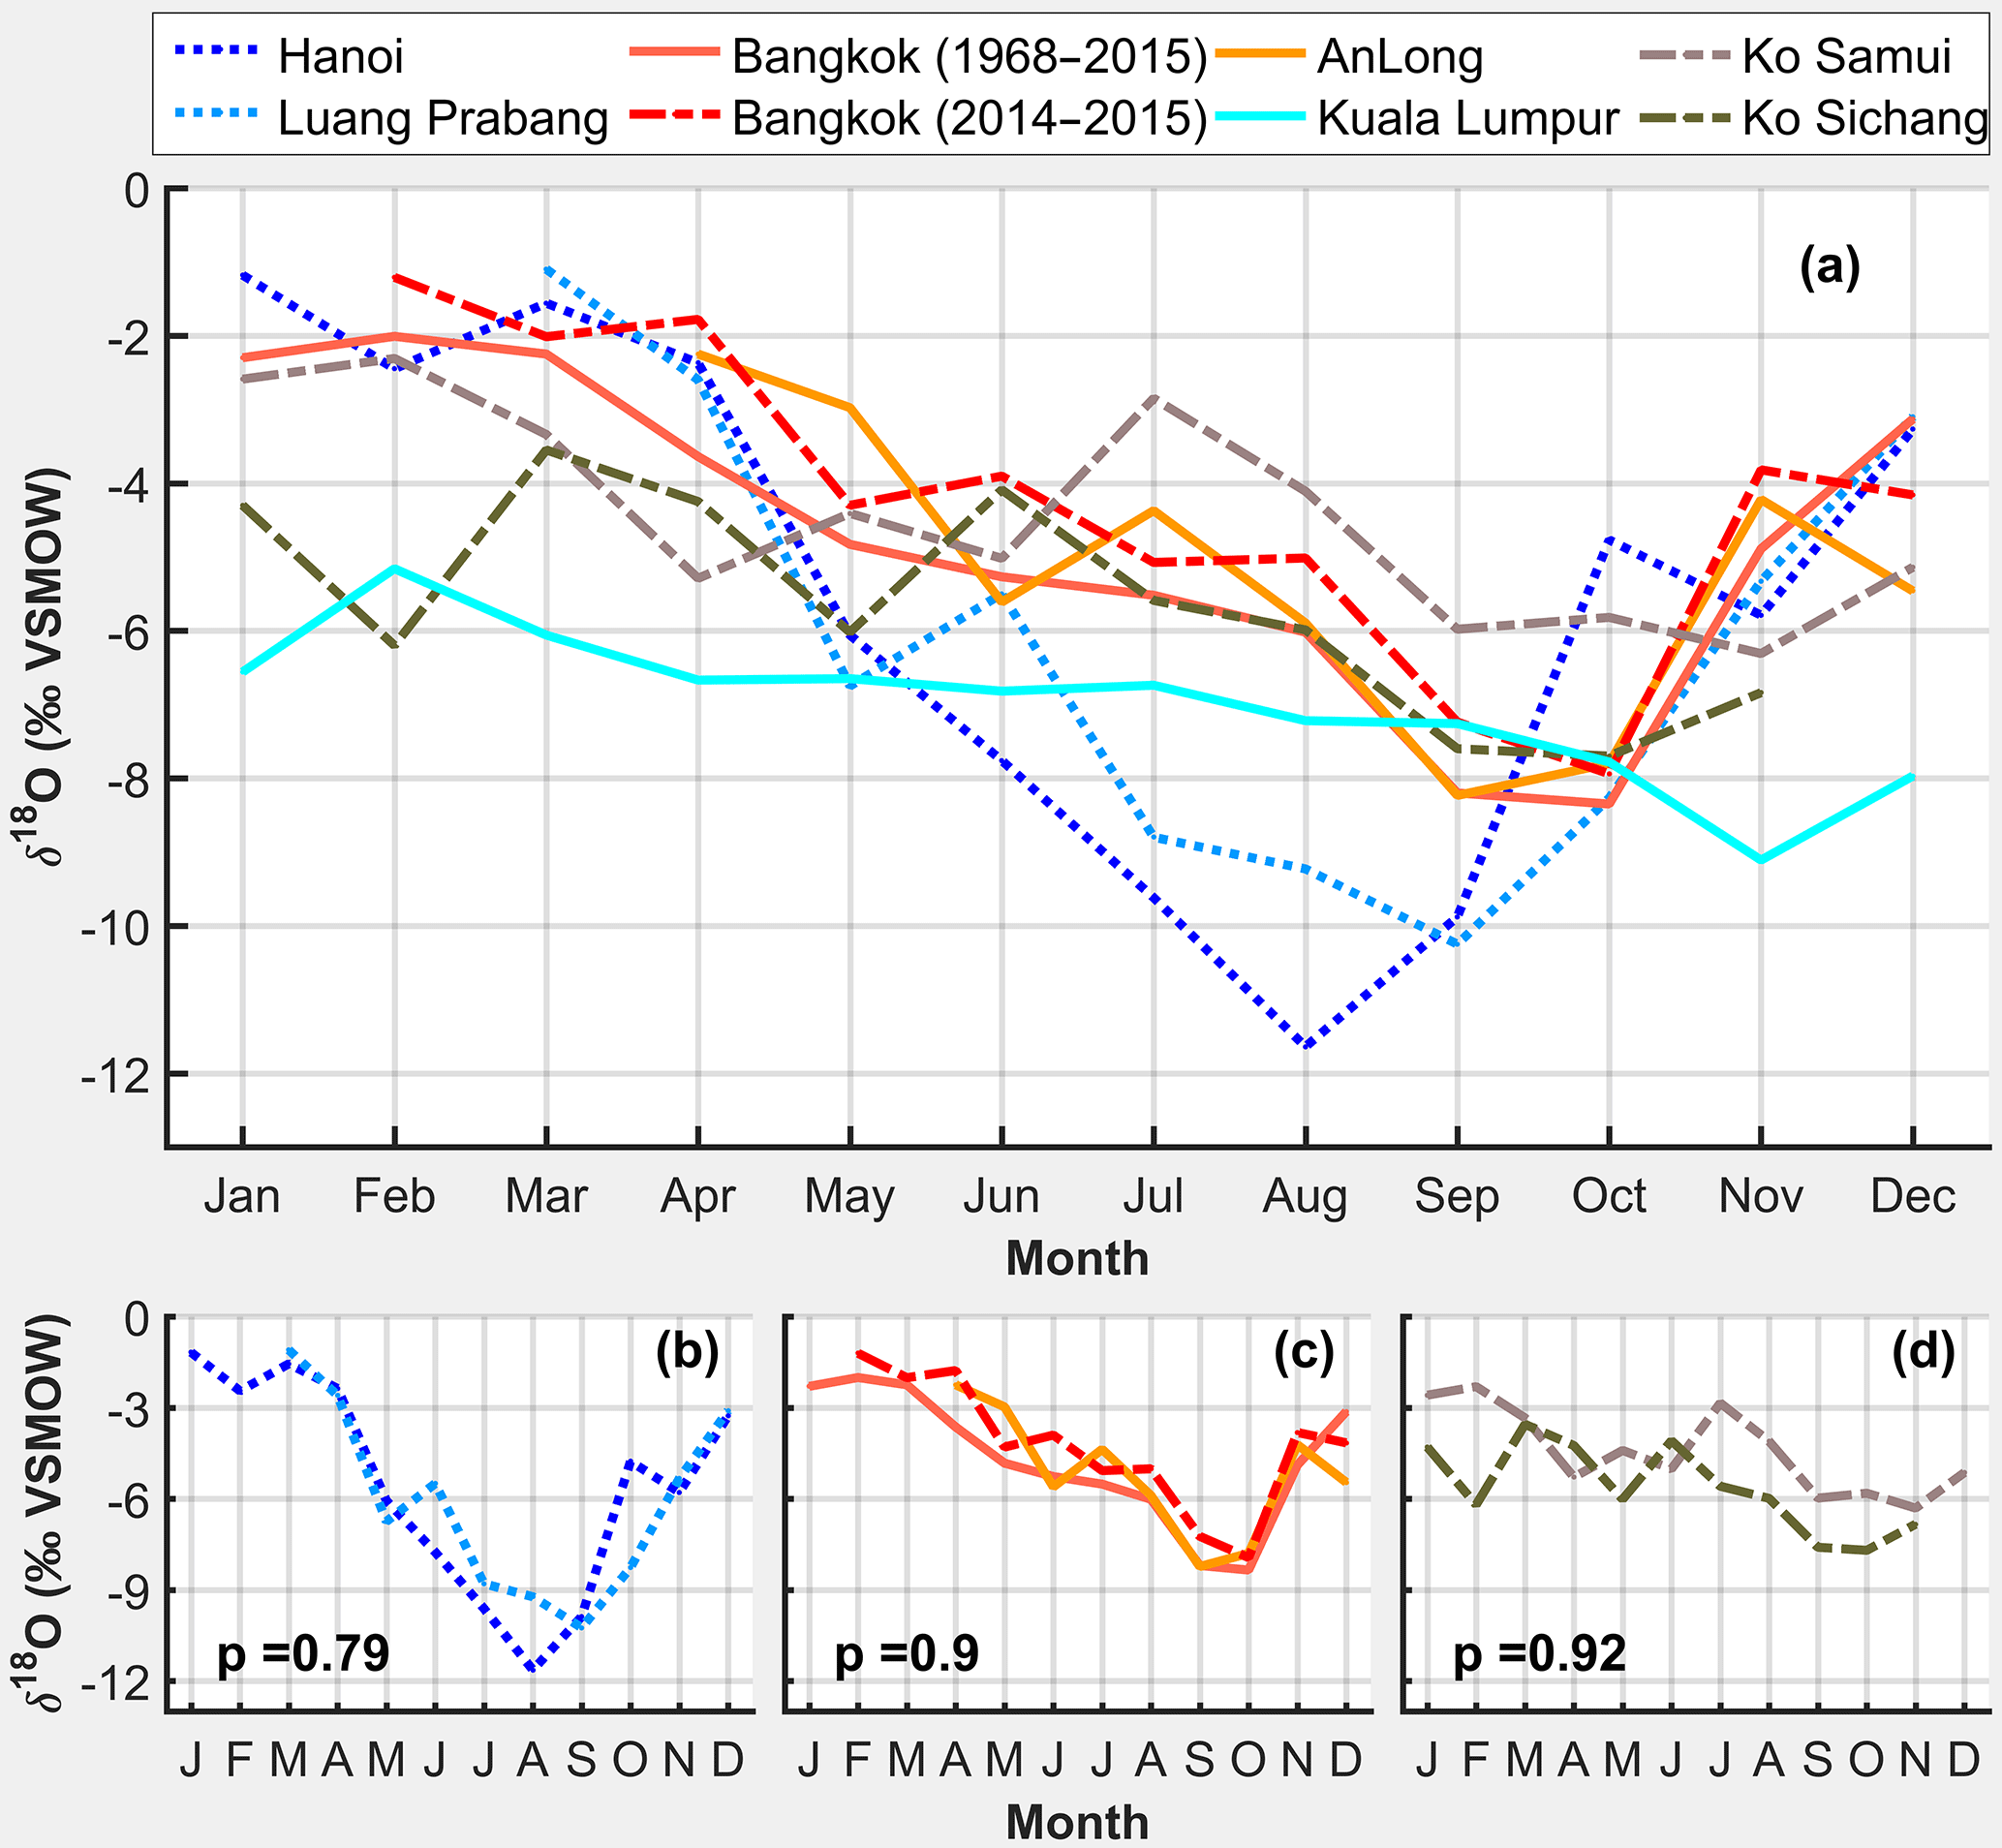
Figure 9Seasonal monthly mean δ18O values for An Long and GNIP data from the Indochinese Peninsula. The data are grouped according to similar variability tested with the Levene test. The p values given in (b)–(d) are the test statistics. High values indicate similar variance. The time series of Bangkok is plotted for short-term (2014–2015) and long-term (1968–2015) periods.
Table 2Pairwise correlation coefficients between regional factors (P_hysplit, T_hysplit, H_hysplit, D_hysplit) and local factors (P_AL, T_AL, H_AL) and stable isotopic values (δ18O, δ2H, and d-excess). Bold and italic numbers denote significance at the 0.01 and 0.05 level (2-tailed), respectively. The meteorological data are aggregated to weekly values corresponding to the precipitation sampling at An Long.
4.2.2 Seasonal variation and spatial homogeneity of the isotope composition
The 74 precipitation samples at An Long showed that δ18O ranges between −12.6 and −1.0 ‰, with an arithmetic mean value and standard deviation of −5.8 ± 2.5 ‰, and δ2H ranges between −89.3 and 0.9 ‰, with an arithmetic mean value and standard deviation of −36.2 ± 18.7 ‰. Generally, less negative isotopic values are observed in the dry-season precipitation samples. The most negative values occur in the second half of the rainy season (September and October), whereas the least negative values are observed in the late dry season in April and May (Figs. 7 and 8). This shows that the isotopic composition of precipitation at An Long station exhibits marked seasonal variations, which in turn indicates different dominant moisture sources and/or processes in the different seasons. A comparison of the seasonal variation in δ18O with the short-term (2014–2015) and long-term (1968–2015) monthly averages of Bangkok (Fig. 8) reveals very similar seasonality, both in terms of timing and magnitude. The small differences between δ18O for An Long and Bangkok are likely caused by the exceptional low rainfall in the study period compared to the long-term monthly values, particularly during May and July. But considering the similarity of the isotopic signatures and general factors controlling stable isotopic composition of precipitation between the two stations, i.e. annual rainfall amount, air temperature, altitude, and latitude (Dansgaard, 1964; Ingraham, 1998), it can be concluded that the isotopic variations in An Long and Bangkok follow the same dynamics and controls, both on an annual and seasonal scale. Moreover, the overall similarity suggests an important role of regional or larger-scale controls on An Long precipitation isotope ratios.
In order to test the representativeness of the An Long data for a wider area, the variability in the monthly mean δ18O data of An Long was compared to the available GNIP data of the Indochinese Peninsula (Table 1). As shown in Fig. 9, the test results in four distinct groups of data series with similar variances: the northern part of the Indochinese Peninsula (Hanoi and Luang Prabang; Fig. 9b), the southern part of the Indochinese Peninsula (Bangkok and An Long; Fig. 9c), the islands in the Gulf of Thailand (Ko Samui and Ko Sichang; Fig. 9d), and finally Kuala Lumpur showing only little seasonal variability. The northern and southern parts of the Indochinese Peninsula generally show a similar seasonal behavior with a distinct higher depletion during the rainy season, but in the northern part the highest depletion is 1 month earlier (August) than in the southern part, and the magnitude of the depletion is larger. The seasonal δ18O variability in precipitation on the islands is much lower than at the stations located on the continent. This is likely due to the maritime setting and could indicate a continental effect in the data of the mainland stations. In addition, the short-term time series of Bangkok and An Long (i.e., 2014–2015) show similar variances, resulting in a highly significant Levene test statistic of 0.98. The variation in the short-term time series of Bangkok and An Long is also very similar to the long-term time series, again shown by a highly significant Levene test statistic of 0.90 (Fig. 9c). This indicates that the variability in the isotopic signature of the An Long time series is almost identical to the one from Bangkok. In summary, the analyzed GNIP data suggest that the data and results from this study are likely to be representative of the southern continental part of the Indochinese Peninsula.
4.3 Factors controlling isotopic composition of precipitation
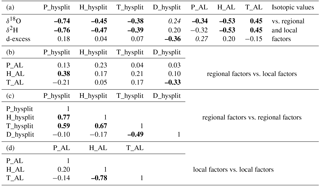
Prior to the MLR, the correlation of the predictors was analyzed (Table 2). The absolute values of the correlation coefficients between local (P_AL, T_AL, H_AL) and regional (P_hysplit, T_hysplit, H_hysplit, D_hysplit) climatic parameters are relatively small and mostly not significant ( < 0.4, Table 2b). However, the correlation coefficients between regional predictors are in most cases high and significant (Table 2c). Highest correlations are found between temperature and humidity for local factors, and between humidity and precipitation for regional factors. Interestingly, the correlation between P_AL and H_AL is quite low. This indicates that the local precipitation is influenced by other factors than local humidity (which is rather uniform throughout the year), e.g. large-scale circulation. The correlation between the predictors underlines the necessity to consider multicollinearity when investigating how the predictors control the response variables δ18O and δ2H.
4.3.1 Local factors and isotopic composition of precipitation
Typically, in tropical regions subject to a monsoon climate, the correlation between δ18O and δ2H values of precipitation and air temperature is virtually nonexistent, whereas a strong relation between δ18O and amount of precipitation has been observed (Rozanski et al., 1992; Araguás-Araguás et al., 1998). Our data show that the correlation of local precipitation amount (P_AL) and local temperature (T_AL) with isotopic values (δ18O and δ2H) are both low ( < 0.45, Table 2a). This suggests that δ18O and δ2H variation is neither dominated by local precipitation amount nor by local temperature during the sampling period. This lack of a significant correlation ( < 0.5) between δ18O and local rainfall amount was also observed in other regions affected by the Asian monsoon climate such as Bangkok, Hong Kong, New Delhi (Ishizaki et al., 2012), and Cherrapunji, India (Breitenbach et al., 2010). This again supports the statement that δ18O may not be an adequate proxy for local climatic conditions (e.g., temperature or rainfall amount) in the Asian monsoon region (Aggarwal et al., 2004; Vuille et al., 2005).
Table 3Results of the linear regression analysis between local relative humidity (H_AL) and isotopic values at An Long. Regressions that are statistically significant at the 0.05 level are marked in bold.
Secondary fractionation processes such as sub-cloud evaporation or secondary evaporation from open water bodies tend to decrease d-excess in the residual rainwater (Stewart, 1975) and enrich it in the heavy isotopes (Guan et al., 2013). The negative correlation of humidity (H_AL) with δ18O and δ2H (r = −0.53, Table 2a) combined with a positive correlation with d-excess (r = 0.2, Table 2a) indicates that some secondary fractionation processes (Risi et al., 2008b; Crawford et al., 2017) may occur during some months at An Long. To examine in which month secondary fractionation processes are likely significant, amount-weighted mean and arithmetic mean, for both δ18O and d-excess, are compared. The rationale is that if secondary fractionation processes are important (with the assumption that the moisture sources of different events within the month are the same), the arithmetic mean should have a δ18O value that is more enriched in heavy isotopes, and a much smaller d-excess than the weighted mean (Guan et al., 2013). Figure 10 shows that secondary fractionation processes may take place mainly during the dry season, in December 2014, and in April, May, and November 2015, because in these months less negative δ18O values and lower d-excess values compared to the overall arithmetic mean are observed, while at the same time the monthly arithmetic means are higher for δ18O and lower for d-excess compared to the monthly weighted means.
To further corroborate this finding, linear regression was performed for different seasons to derive seasonal LMWLs and relations between local humidity, δ18O, and d-excess. Table 3 suggests that secondary fractionation processes are likely to take place in the dry season between December 2014 and May 2015. This is depicted by a slope of lower than 8 (slope = 6.9) for the dry season, the slightly negative correlation between δ18O and local relative humidity, and the markedly positive correlation between humidity and d-excess. This is a distinctly different behavior compared to the rainy season as a whole, but also for the first (early monsoon) and second (late monsoon) parts of the rainy season. In summary, these findings indicate that secondary fractionation processes influence the isotopic composition of precipitation primarily in the dry season, which is characterized by lower humidity and higher temperature in the Plain of Reeds. While this conclusion is plausible due to the climatic conditions and low rainfall amounts, one has to consider the low number of rainfall samples during the dry season, which associates some uncertainty to this analysis.
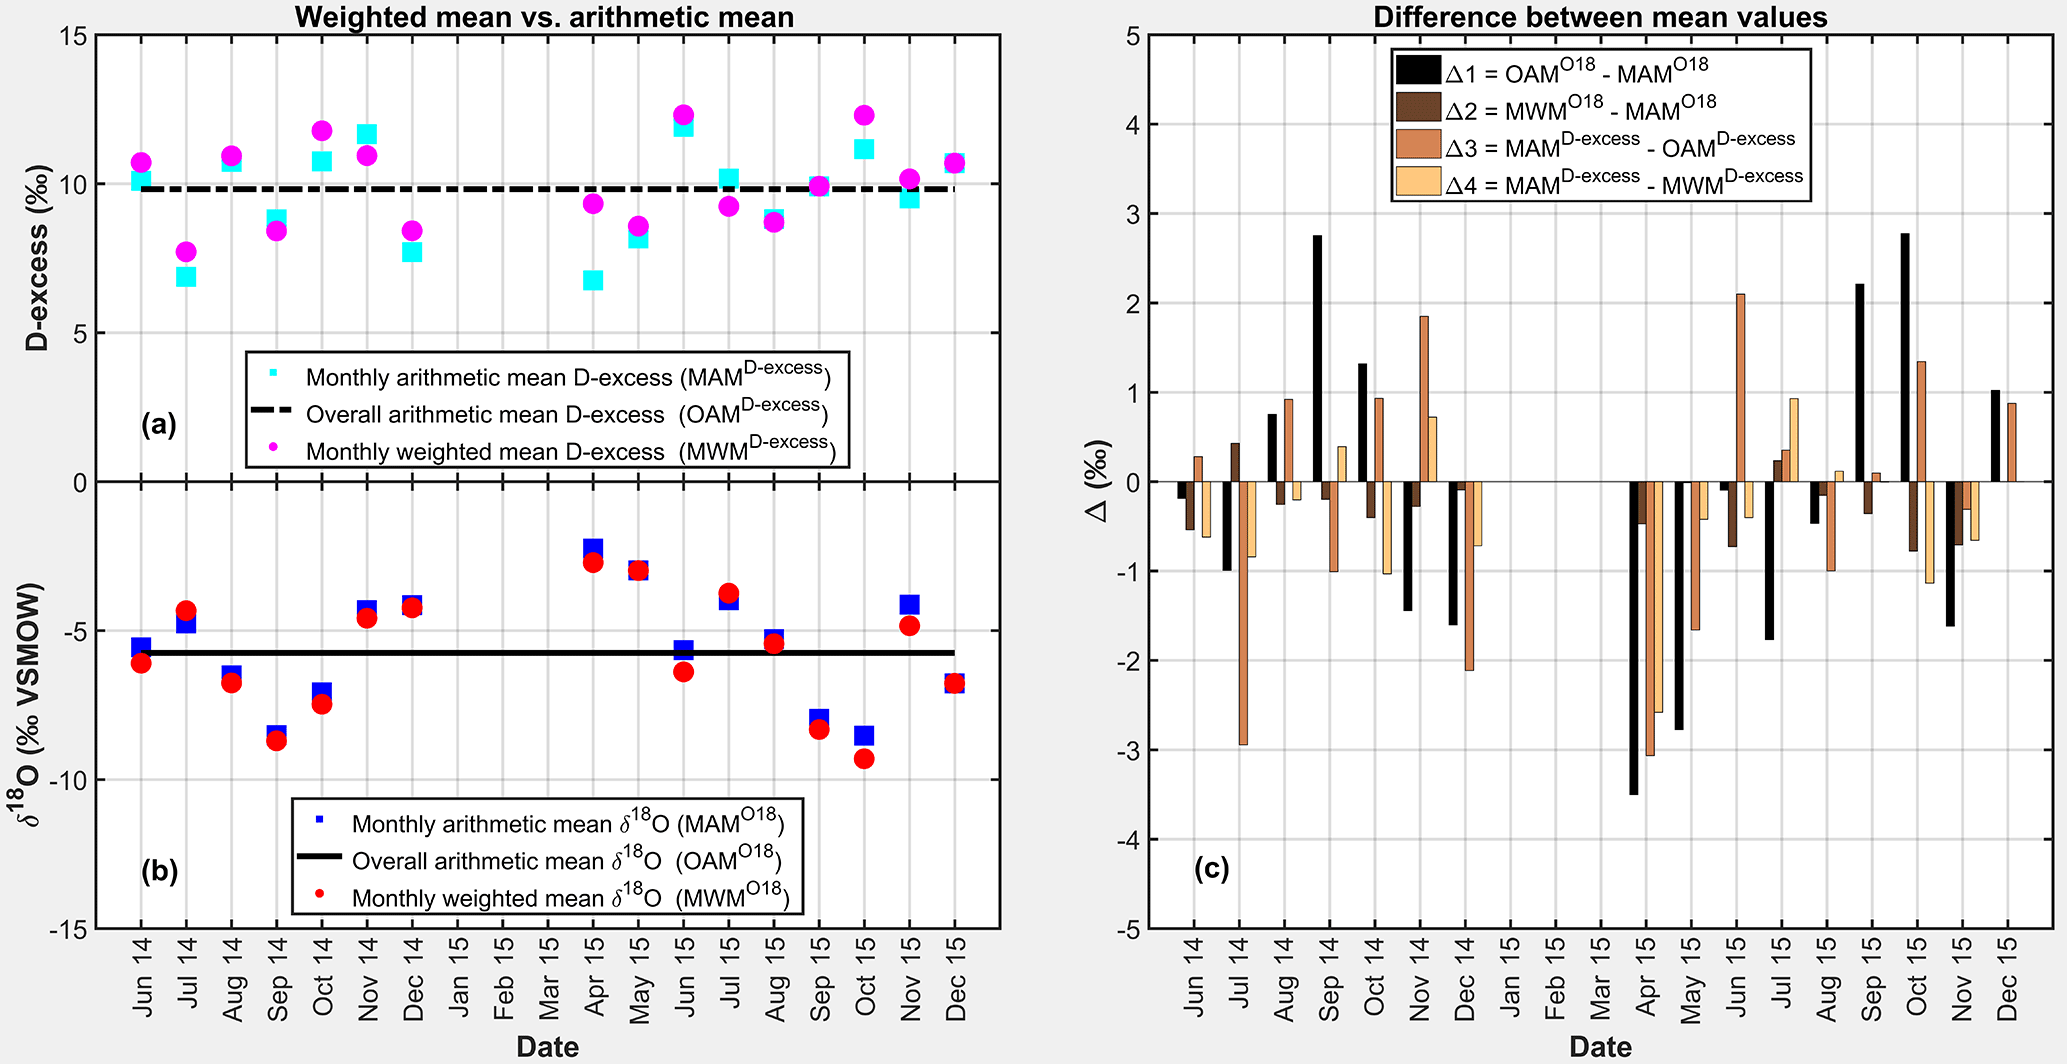
Figure 10Monthly arithmetic mean (MAM) vs. overall arithmetic mean (OAM), and MAM vs. monthly amount-weighted mean (MWM) for d-excess (a) and δ18O (b) at An Long during the sampling period June 2014 to December 2015. The difference between these mean values (c) including Δ1 = OAM18O − MAM18O, Δ2 = MWM18O − MAM18O for δ18O, and Δ3 = MAMD−excess − OAMD−excess, Δ4 = MAMD−excess − MWMD−excess for d-excess are shown to examine in which month secondary fractionation processes are likely significant (defined by all values of Δ in that month smaller than zero).
4.3.2 Regional factors and isotopic composition of precipitation
In comparison to other regional and local parameters, the precipitation amount along the transport pathways of moisture sources (P_hysplit) shows the strongest correlation with δ18O and δ2H as depicted by a correlation coefficient of −0.76 (Table 2a). Other predictors show weaker correlations with < 0.55. This, however, does not exclude that these predictors do have some predictive power for the isotopic composition of precipitation in An Long when used in combination with other predictors. Although δ18O and δ2H are rather well correlated with some climatic parameters, d-excess (which is a function of both) is not well correlated. This is because of the relative difference of the variation in δ18O and d-excess, which is expressed by a low correlation coefficient between these two variables (r = −0.44). The weak correlation between d-excess and all climatic parameters ( < 0.36) indicates that the selected predictors (i.e., selected climatic parameters) are not sufficient to explain the processes responsible for the variability in the d-excess. On a global scale, drivers controlling d-excess variation are likely sea surface temperature or near-surface relative humidity of moisture sources (Pfahl and Wernli, 2008; Uemura et al., 2008; Pfahl and Sodemann, 2014), which are not considered in this study. In tropical areas, a major contribution to the seasonal variation in d-excess can be convective processes, e.g. re-evaporation and rain–vapor interactions (Risi et al., 2008a, 2010a), or the influence of large-scale processes, e.g. conditions at the vapor source, convection, and recycling of moisture along trajectories (Landais et al., 2010). A complete investigation of factors controlling d-excess in precipitation is thus not possible by the presented study design and selected predictors. However, some conclusions about the factors controlling the d-excess can be obtained with the presented method (see below).
4.4 MLR and relative importance analysis
The results of the MLR with all predictor combinations indicate that the δ18O signal in precipitation at An Long is best explained by moisture sources of 5-day backward trajectories (Fig. 11). The MLRs using the predictors of these trajectories produce the lowest PRESS and highest R2 values, indicating that about 80 % of the variability in precipitation (δ18O, Fig. 11 and δ2H, Fig. S1 in the Supplement) at An Long can be explained by the best MLR model. However, the explained variance differs only slightly between the different pressure levels used. The best performance regarding the lowest PRESS value was obtained by the mean backward trajectories of the 800 and 850 hPa levels.
Contrary to δ18O and δ2H, the MLR fails to explain the variation in d-excess over the whole study period to a large extent, with a maximal R2 of 0.3 (Fig. 11). This indicates that the climatic parameters used in our MLR models only have little impact on the annual d-excess variation, which corroborates the findings of the linear correlation analysis in Sect. 4.3.2.
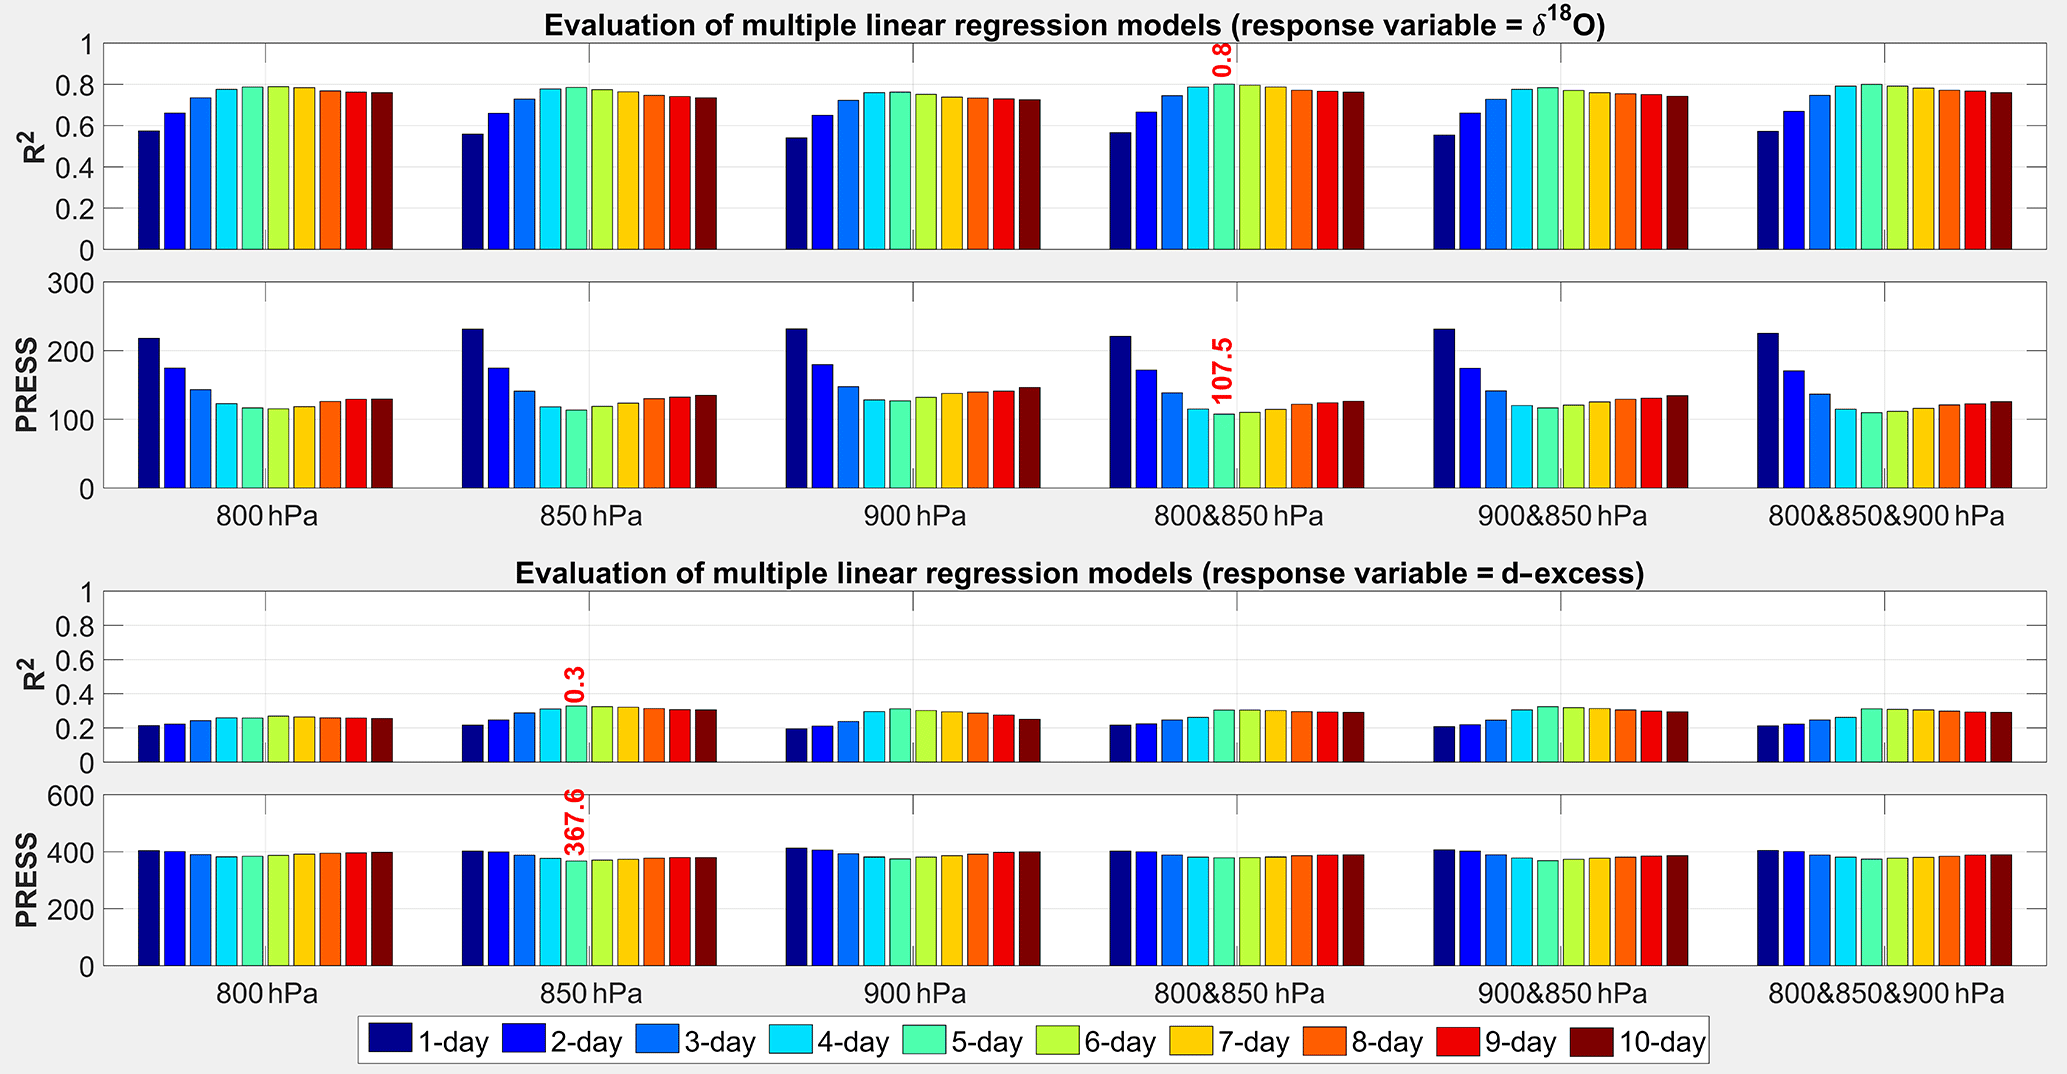
Figure 11Evaluation of multiple linear regression (MLR) models applied for δ18O and d-excess as response variables for different pressure levels used for three HYSPLIT backward trajectories and their combinations (mean values of the different levels). The best MLR model is marked with red text.
In the next step, the importance of the MLR predictors was analyzed. Figure 12 shows the results applying Johnson's relative weight analysis for the best performing MLR models, i.e. using the mean of the 800 and 850 hPa 5-day backward trajectories. In general, the predictive power of the MLR models increases with increasing number of predictors.
The results indicate that regional factors are always more important than local factors if the R2 value is above 0.5. The local factors dominate only in MLR models with low performance, or when no regional factors are used as predictors. This is also highlighted by the sum ratio line (black line in Fig. 12), defined as the fraction of R2 explained by regional factors normalized to the overall R2. In the best MLR model (124th model) with the lowest PRESS value and an R2 of 0.80, which is equivalent to an explained variance of 80 %, the regional factors explain 56 % of the absolute δ18O variance (which is equivalent to 70 % relative to R2 = 0.80), while local factors explain only 24 % (30 % relative to R2 = 0.80). This result agrees with the two-factor analysis of Ishizaki et al. (2012) who stated that distillation during transport from source regions is the dominant contributor to interannual variability in δ18O precipitation in Bangkok, Bombay, and Hong Kong, accounting for 70, 60, and 70 %, respectively, relative to the overall explained variance, while the amount of local precipitation contributed the remaining 27, 33, and 25 % of the explained variance.
In all models where precipitation amount along transport pathways from moisture source regions (P_hysplit) is included, this factor explains the highest proportion of R2, which is always at least double and up to triple of the explained variance in other factors (Fig. 12). In turn, the absence of P_hysplit as a predictor in the MLR model considerably decreases the R2, indicating that P_hysplit is the most dominant factor. In the best MLR model (124th model) the most important predictor is P_hysplit, explaining 47 % of the total δ18O variance (partial R2 = 0.47; Fig. 12). The second dominant factor is T_AL, accounting for 21 % of the explained total variance. The remaining factors account for less than 13 % of the δ18O variance. This result indicates that the regional amount effect is a dominant process in controlling isotopic variation, whereas the local amount effect is not important in the VMD. Similar findings are reported for other regions in Asia (e.g. Rozanski et al., 1992; Araguás-Araguás et al., 1998). The local temperature T_AL, however, can be regarded as a modulating factor for the isotopic composition on top of P_hysplit.
In a next step, the predictor importance analysis is performed for different seasons, in order to analyze if seasonal differences in the dominating factors for the isotopic composition exist, as the correlation analysis of local factors and isotopic composition suggests (Sect. 4.3.1). The samples were split into dry season and rainy season subsets, for which the MLR was applied individually. The definition of the seasons follows the analysis in Sect. 2, i.e., the dry season lasts from December to May. However, due to the low number of samples during this period, the dry season samples were taken from mid-November to mid-June in order to increase the sample number, thus enabling a more robust MLR fitting. This selection can be justified because the delineation of the dry and wet season above is based on monthly data, the “sharp” distinction between the rainy and dry season is forced by the temporal resolution of the data used. In reality, the transition between rainy and dry season is somewhat gradual. Thus, the delineation between the rainy and dry season should rather be regarded as fuzzy. Using data from the last 2 weeks of November and the first 2 weeks of June can be seen as one way to consider this.
Table 4Explained variance (partial R2) in regional and local factors of the best MLR model according to the PRESS value. The first value indicates the absolute partial R2, the second value the relative contribution to the overall explained variance.
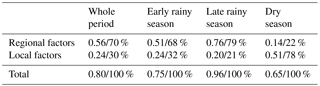
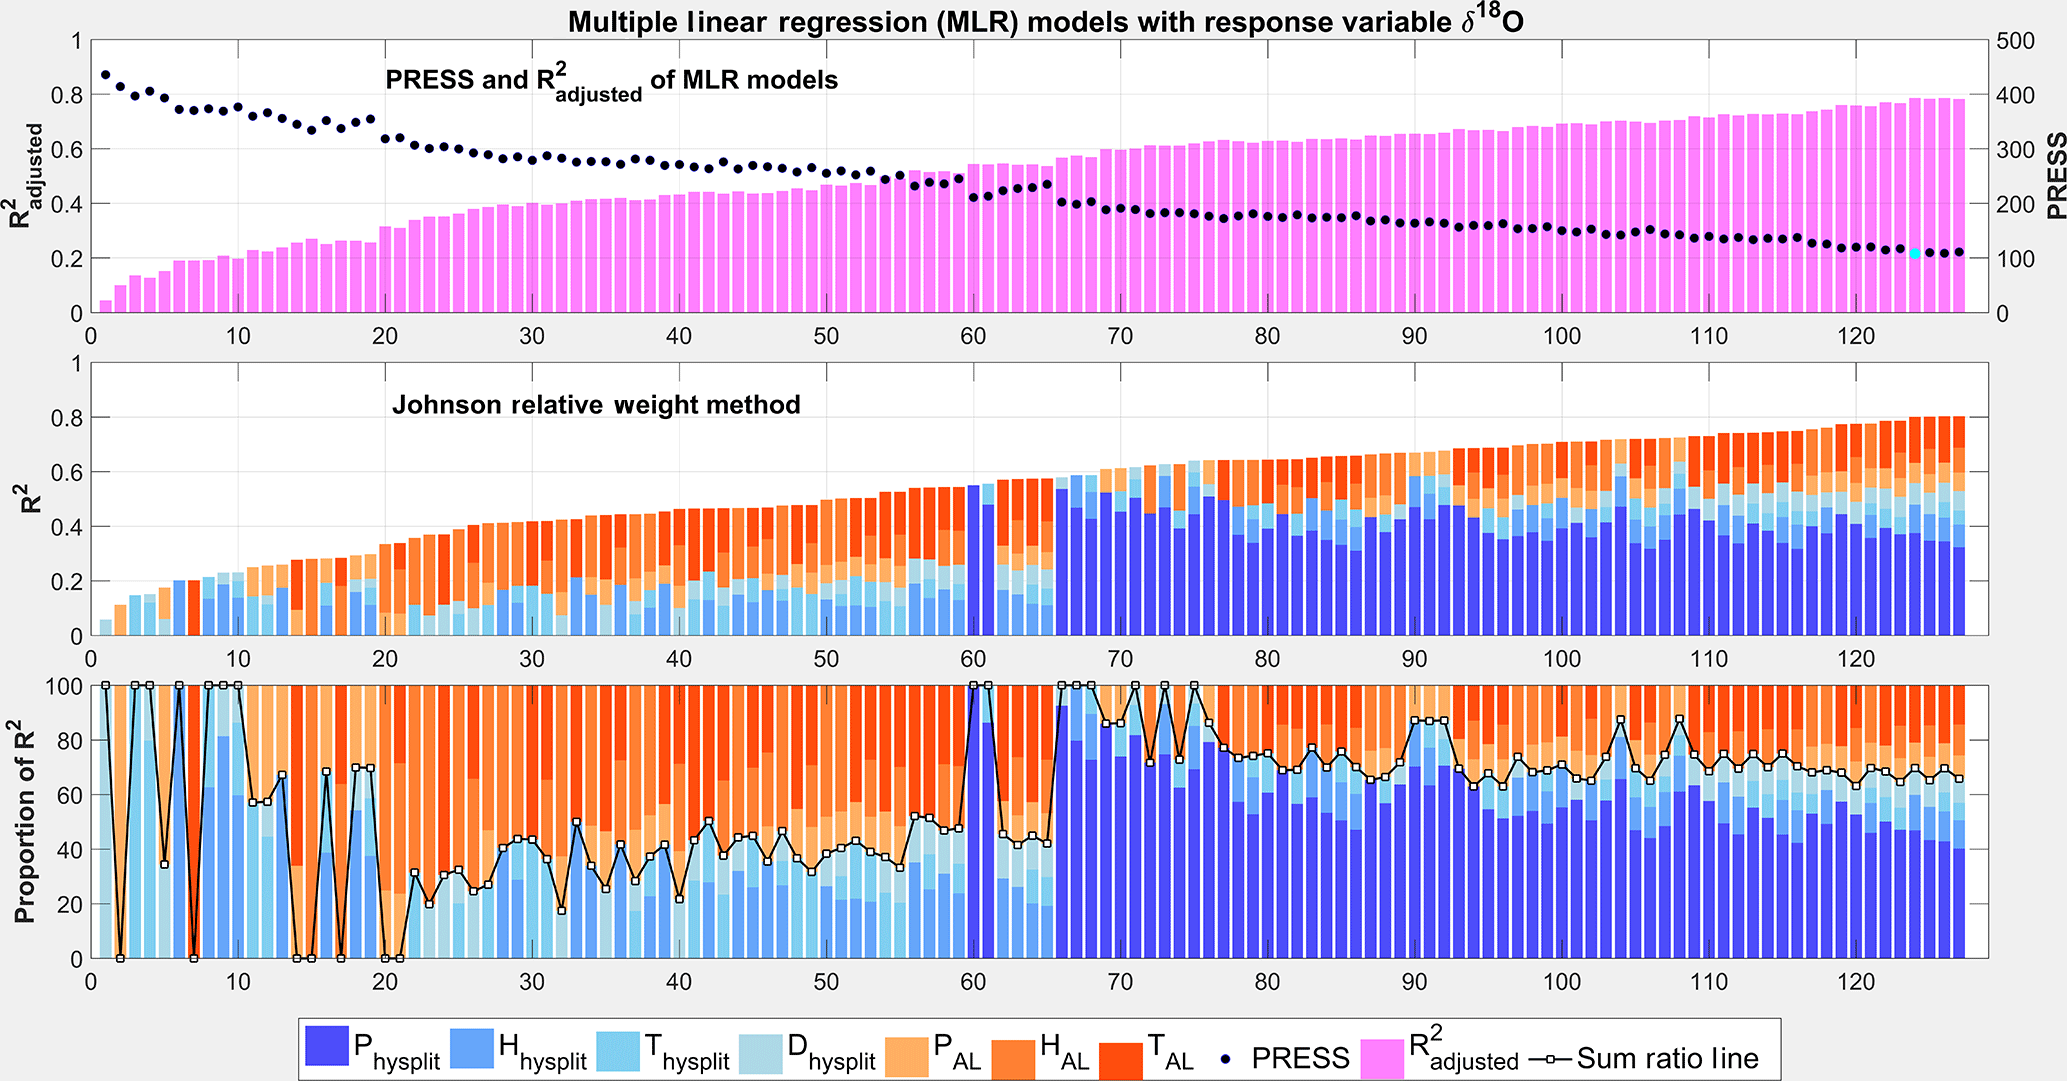
Figure 12MLR with response variable δ18O and relative importance analysis applied for all possible subsets. The 127 MLR models are sorted according to their R2 values in ascendant order. Colors represent the relative contribution (in %) of the predictors. The sum ratio line separates the contribution of local (in red and orange) and regional (in blue) factors. PRESS and adjusted R2 values indicate the quality of the MLR model. The best MLR model depicted by the lowest PRESS (model 124, highlighted by the cyan dot) explains 80 % of the δ18O variation (R2 = 0.8).
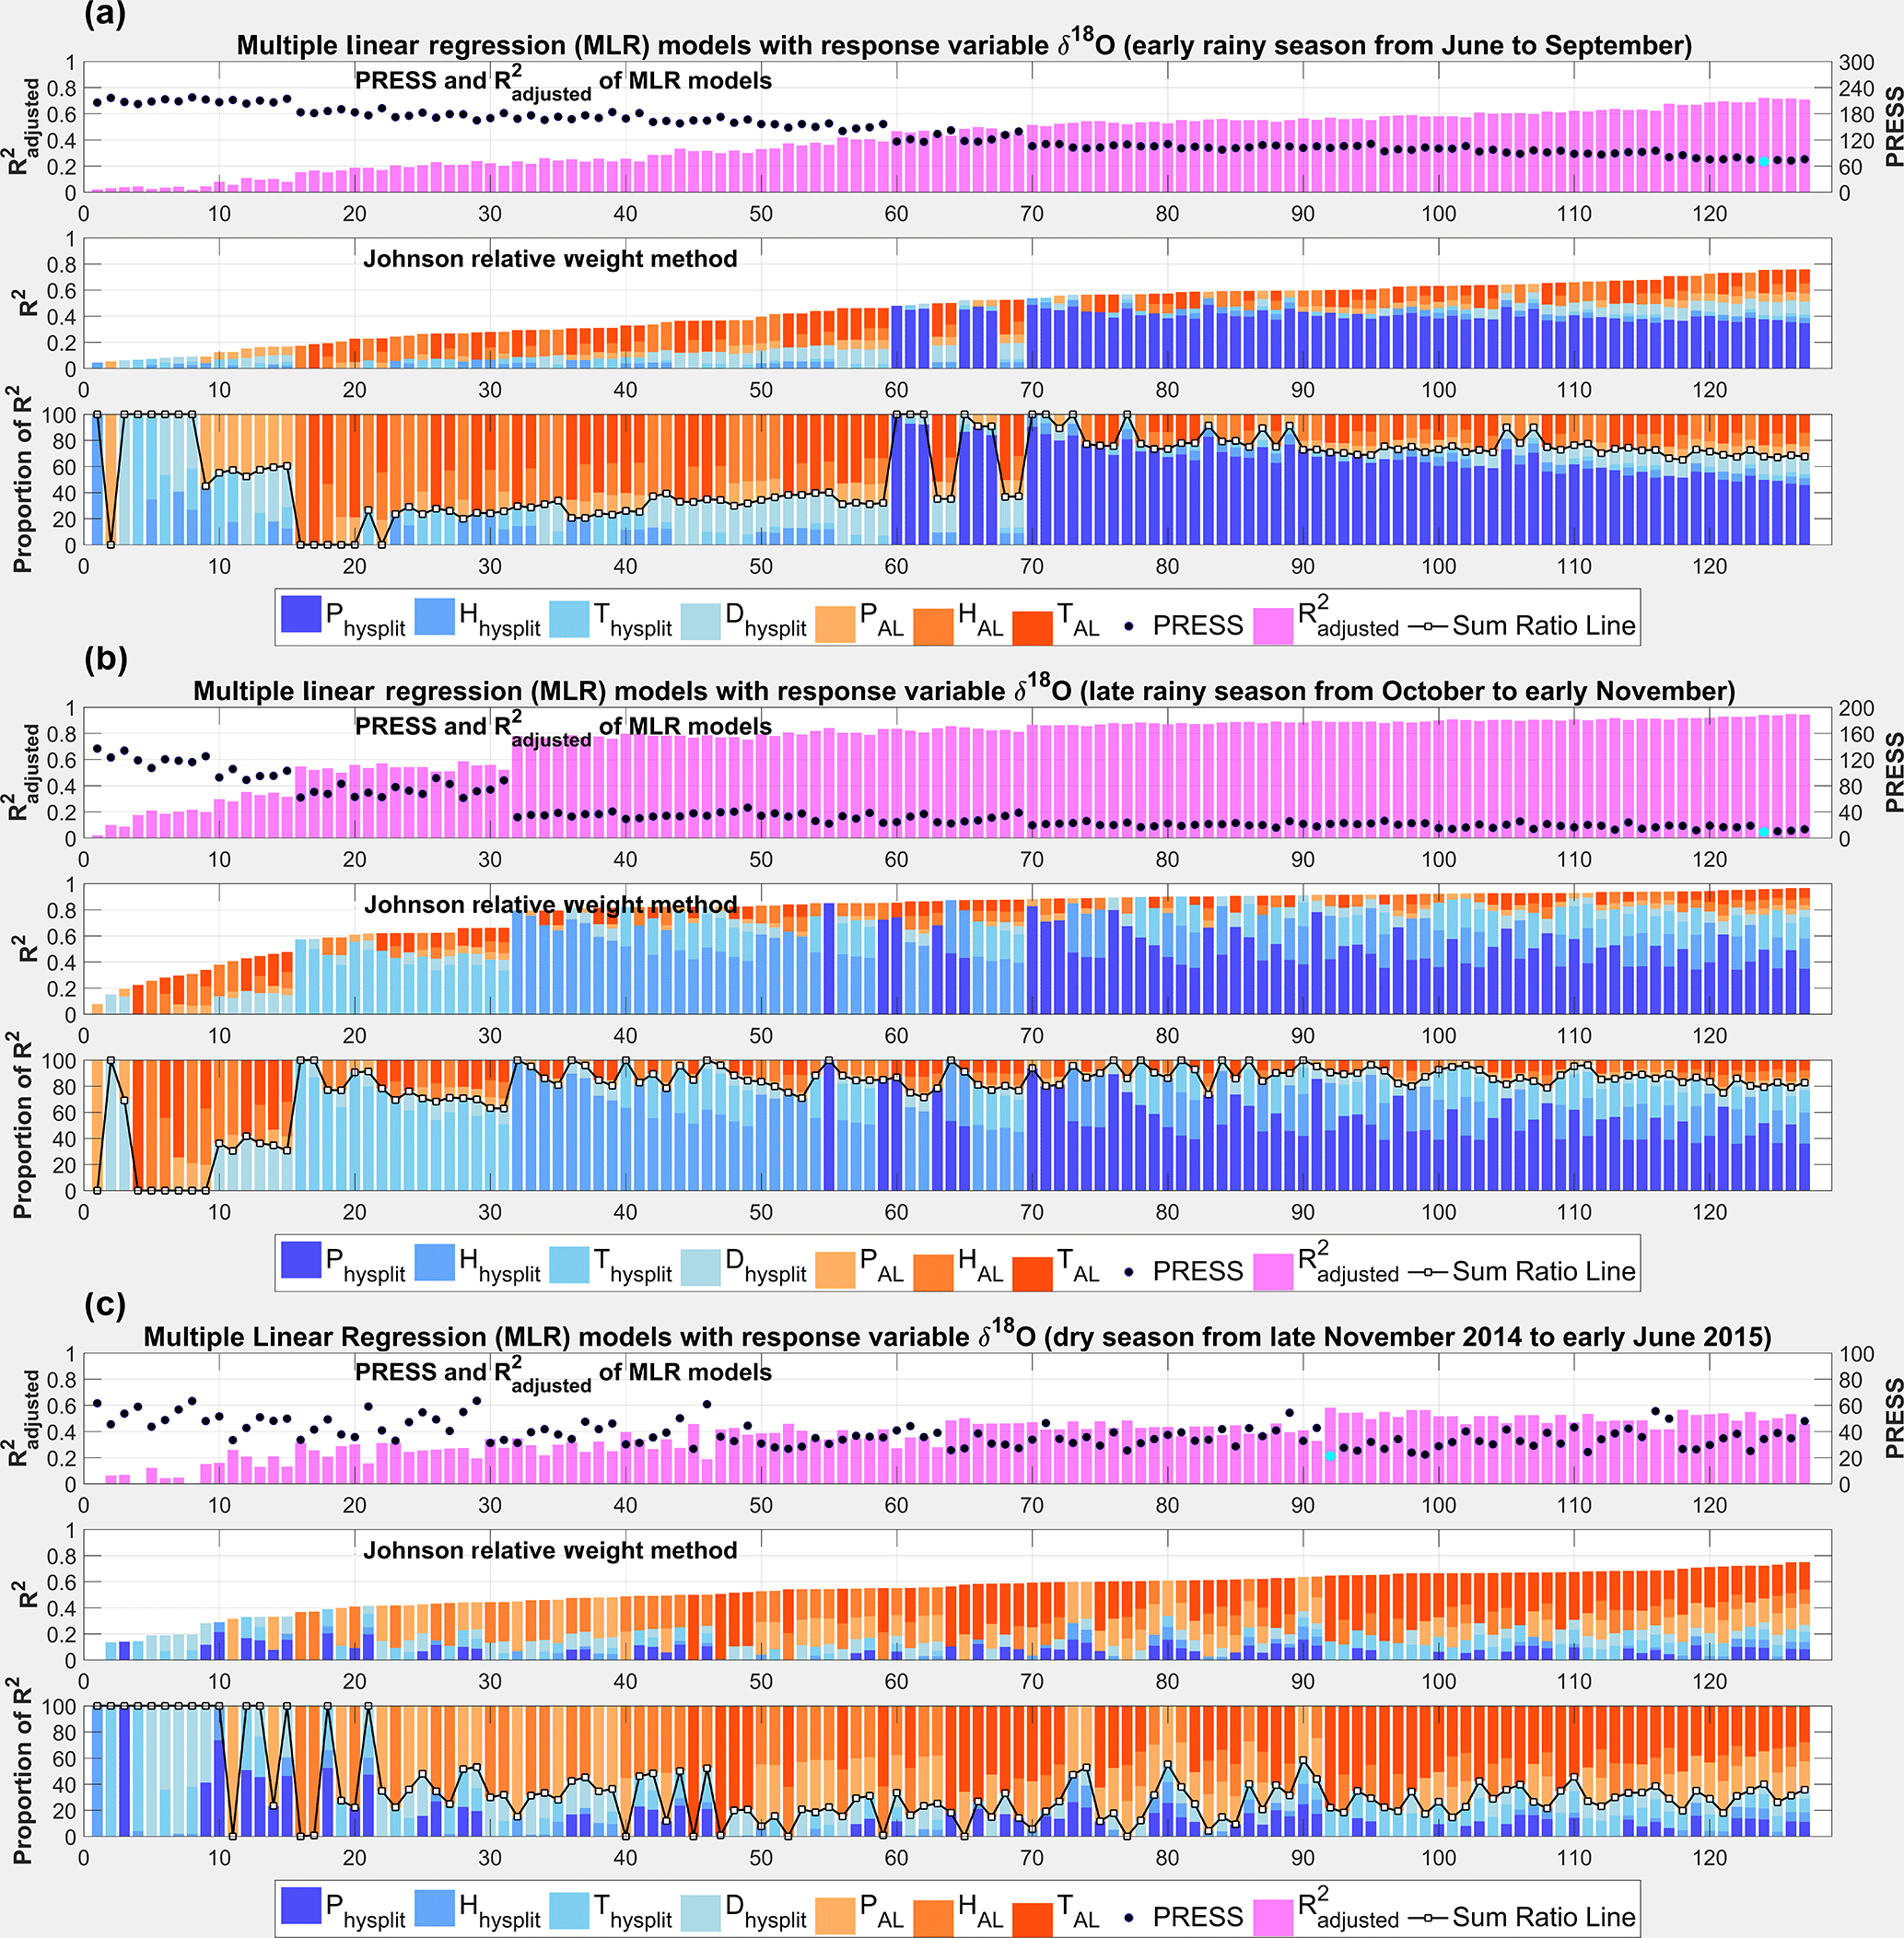
Figure 13MLR with response variable δ18O and relative importance analysis applied for all possible subsets (127 MLR models) for different seasons: (a) early monsoon from June to September, (b) late monsoon from October to mid-November, and (c) the dry season from mid-November to mid-June.
Furthermore, the rainy season was subdivided according to the different moisture source regions shown in Sect. 4.1: the Indian Ocean, dominating during the initial and high stage of the Indian monsoon from June to September/mid-October, and the South China Sea–Philippine Sea and the north-west Pacific Ocean from October to May during the late rainy and dry seasons, with some contribution from continental Asia (Fig. 5). In order to test if the factors have different importance caused by different source regions during the rainy season, the MLR models and relative importance analysis were applied for these two time periods in addition to the dry season. The number of samples for the different subsets was 42, 18, and 14 for the early rainy season, late rainy season, and dry season, respectively. This reduced number of data points needs to be considered when interpreting the results of the seasonal MLR analysis, because the degree of freedom of the regression (i.e. the difference between the number of data points and the number of predictors) is getting rather small, particularly for the dry season.
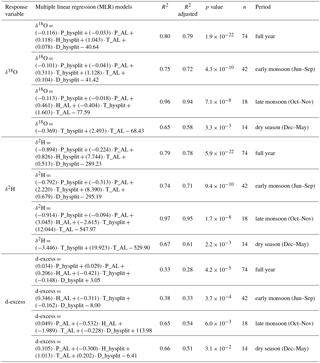
Figure 13 shows the results of the MLR and importance analysis for the three seasonal subsets for δ18O. The sorting of the models is the same as in Fig. 12. At a first glance, the results for the rainy season subsets (Fig. 13a and b) are quite similar to each other and to the overall data set. The best performing model in terms of the lowest PRESS value is in all cases model 124. However, in terms of R2, the performance of the early rainy season is somewhat lower compared to the overall data set, while for the late rainy season it is significantly better, with R2 = 0.96. This increase in explained variance is caused by an increased contribution of the regional factors. In the late rainy season, the regional factors alone contribute 76 % to the overall R2 of 0.96 of the best PRESS model, which equals 79 % of the explained variance (Table 4). The final best models (both for annual and seasonal analyses) are presented in Table 5.
Table 5The final best models (both for annual and seasonal analyses) for δ18O, δ2H, and d-excess as the response variable in MLR.
This is a much larger contribution compared to the partial R2 values of 56 and 51 % for the whole data set and the early rainy season, respectively. The increase stems from a more significant importance of the other regional factors H_hysplit and/or T_hysplit. While their contribution to the whole data set and the early rainy period is rather low and P_hysplit dominates the contribution of the regional factors, it is raised to about 30 % in the late rainy season, either individually or in combination. For the best PRESS model marked with the cyan dot in Fig. 13b, T_hysplit contributes 27 % to the overall R2 of 0.96. It indicates that temperature and humidity play a more significant role in the isotopic fractionation along the trajectories of water stemming from the north-west Pacific or South China Sea and continental Asia compared to water originating from the Indian Ocean during the boreal summer months. The broad regional and thus climatic heterogeneity of water sources during the late rainy season offers a plausible explanation for this result. The source regions during this period are located in oceans and continental areas of higher latitudes outside the tropics, where vast climatic differences may occur during the transport along the trajectories. Therefore, fractionation processes caused not only by the rainfall amount but also evaporation and condensation are likely to have a significant effect on the final isotopic composition of rainfall reaching An Long during this period. This climatic variability along the transport pathways is much more substantial compared to the low climatic variability of the tropical Indian Ocean source region, where the rainfall during the early rainy seasons originates.
An entirely different picture reveals the MLR fitting and importance analysis for the dry seasons shown in Fig. 13c. While the overall performance in terms of R2 is comparable to the early rainy season, the importance of the local and regional factors is very different from the other seasons. For the dry season, the local factors dominate. In the best performing MLR model with the lowest PRESS value (cyan dot in Fig. 13c), T_AL contributes 78 % of the explained variance. Similar results are obtained for almost all of the MLR models. For the models with R2 > 0.5, T_AL is the most important factor, followed by P_AL and H_AL with similar importance. The regional factors do not contribute more than 22 % of the explained variance if R2 > 0.6. This finding corroborates the assumed higher importance of secondary fractionation processes during the dry season in the VMD, as already hypothesized in Sect. 4.3.1. However, in combination with other predictors, T_AL seems to be a better predictor of the secondary fractionation processes compared to H_AL, which was used in Sect. 4.3.1. As T_AL and H_AL are closely correlated (Table 2), the findings of Sect. 4.3.1 and the MLR of the dry season presented in this section agree well. With regard to the low degrees of freedom for the dry season MLR models, it can be stated that this consistent high importance of the local factors in various MLR models reduces the uncertainty of this analysis stemming from the low number of data points to some extent.
The MLR modeling of δ2H shows very similar results to δ18O leading to the same conclusions (Figs. S1 and S2). The MLR modeling of seasonal d-excess also shows an improved fit for the late rainy and dry seasons (Figs. S3 and S4), but for the early rainy season the results are not as satisfying as for the whole data set. In contrast to δ18O and δ2H, regional factors explain the bulk of the d-excess variance also for the dry season. Among the regional factors, P_hysplit has the lowest importance for d-excess, while the other factors T_hysplit, H_hysplit, and D_hysplit explain about 65 % of the best R2 of 0.66. This is also a distinctively different result compared to δ18O and δ2H, where P_hysplit always dominated the regional factor contribution. The remaining explained variance stems mainly from the local precipitation P_AL, with some contribution of T_AL. This finding is in line with the rationale outlined in Sect. 4.3.1, that evaporation along the transport pathway decreases the d-excess (Stewart, 1975). This effect is much more variable during the late rainy and dry season due to the transport pathways from higher latitudes, as compared to the rather uniform climatic conditions along the transport pathways during the rainy season, as already argued in the previous paragraph for the late rainy season results of δ18O. Particularly the water stemming from continental Asia is very likely prone to evaporation and thus changes in d-excess along its transport pathways as it crosses some semi-arid areas (e.g. Tibet, Mongolia; cf. Fig. 5). This means, in summary, that the MLR and relative importance analysis of d-excess for the late rainy and dry season corroborate the hypothesis that secondary fractionation processes caused by evaporation are relevant during the dry season, respectively for rainfall stemming from the Pacific region and continental Asia. However, for δ18O and δ18H, local factors describing evaporation are more critical, while for d-excess regional factors and thus evaporation processes along the transport pathways dominate. But again, the low number of data points for the dry season needs to be taken into account for the interpretation of the results. Although the results are similar over a wide range of different MLR models corroborating the findings and although the mechanisms explaining the results are plausible, the results for the dry seasons still contain some uncertainty stemming from the low data volume.
Nevertheless, it can be stated that applying all possible subset regressions, MLR models can better explain the isotopic variation in rainfall compared to approaches considering only one predictor, i.e., a simple correlation analysis. Moreover, the associated relative importance analysis enables the identification of the dominant factors, thus offering interpretation aids for the identification of the processes responsible for the isotopic signature of local rainfall. The presented analysis illustrates that the investigation of dominant factors controlling isotopic composition of precipitation with simple correlation analyses may lead to wrong conclusions, particularly when predictors are correlated. Additionally, MLR is able to consider the combination of different local and regional factors, thus enabling a better identification and interpretation of the manifold processes controlling the isotopic composition of rainfall.
This study analyzes the influence of local and regional meteorological factors on the isotopic composition of precipitation, expressed as δ18O, δ2H, and d-excess in the VMD. For this purpose, rainfall samples were taken on a weekly to bi-weekly basis for 1.5 years at An Long in the north-eastern part of the VMD and analyzed for stable water isotopes. The regional factors potentially influencing isotopic composition were derived by back-tracing of water particles up to 10 days from the target location using the HYSPLIT model, while the local factors were derived from local climate records. The influence of the different factors on the isotopic condition was quantified by MLR of all factor combinations combined with relative importance analysis. This method is novel for the interpretation of isotopic records of rainfall and opens a pathway for a better understanding of the controlling processes with a rather simple statistical method.
The MLR showed that up to 80 % of the total variation in δ18O could be explained by linear combinations of the selected factors. Similar results are obtained for δ2H. Contrary to this, only about 30 % of the total variation in d-excess can be explained by the selected factors if the whole data series is used. General considerations regarding the controls of d-excess in tropical areas suggest that additional factors, like sea surface temperatures of the source region, need to be taken into account for an improved modeling of d-excess variation by MLR.
The study showed that local climatic factors, specifically rainfall amount and temperature, play a minor role in controlling the isotopic composition of the rainfall at An Long. However, there is evidence that sub-cloud evaporation has a small but notable effect during the dry season. Regional factors, on the contrary, dominate the isotopic composition of rainfall at An Long. Some 70 % of the explained variance, i.e., a partial R2 of up to 0.56, can be attributed to regional factors, among which precipitation amount along the transport pathway can explain most of the variance. The remaining 30 % of the explained variance is attributed to local factors, among which the temperature plays the most important role. These findings indicate that local secondary fractionation processes like sub-cloud evaporation play a small additional role for the isotopic composition, which is otherwise dominated by the rainout along the transport pathway of the precipitation.
Furthermore, the analysis of transport durations implies that the moisture-producing precipitation reaching An Long travels about 4–6 days from its source, as the best regression results are obtained for these travel durations. For longer travel durations, the explained variability in the regression decreases, suggesting that the moisture is recycled, i.e., precipitated and evaporated again, when the travel time exceeds 6 days.
If the data set is divided into seasonal subsets defined by precipitation amount and water source regions, the MLR and importance analysis enables a better identification of factors and thus processes controlling the isotopic composition in the different seasons. For the late rainy and dry seasons (i.e., October to May), the importance of regional (late rainy season) and local (dry season) factors increases, respectively, compared to the overall dominating factor P_hysplit. Because of this, the explained variance is raised, particularly for the late rainy season. The source regions (Pacific Ocean and continental Asia) and the associated transport pathways, as well as local processes, are more critical for the late rainy and dry season, indicating that secondary fractionation processes by evaporation, either along the pathway (for d-excess) or locally (for δ18O and δ2H), are more important than the amount effect, which is dominant during the Indian monsoon (early rainy season) period. This is reasonable because moisture transported to the Mekong Delta from the Pacific region and continental Asia passes through different climatic regimes, compared to the more uniform climatic conditions along the pathway from the Indian Ocean during the Indian summer monsoon.
In summary, it can be concluded that the proposed approach, consisting of simultaneous testing of all possible factors by MLR combined with relative importance analysis, is able to detect the relevant factors controlling the isotopic composition of rainfall as well as their individual contributions. If applied to seasonal data subsets, the predictions can be improved, and the seasonal differences in controlling factors and processes can be identified. The validity of the approach is confirmed by similar, but mainly qualitative results obtained in other studies. The comparable results provide a strong indication that the method is able to identify the dominant factors responsible for the isotopic composition of rainfall records. In contrast to previous studies, however, the presented approach and results provide a quantitative assessment of the impact of different factors, and thus information about the dominant processes of isotopic fractionation. It can support the interpretation of processes responsible for observed patterns of isotopic composition. The rather simple approach can, of course, not provide detailed information about atmospheric dynamics but it offers a relatively simple and easy to apply approach supplementing or preceding more complex studies of isotopic composition with circulation models. Due to the simplicity, the method can be easily applied to investigate factors controlling isotopic composition of precipitation at any given study area around the world, without the requirement of setting up or in-depth knowledge about running complex numerical atmospheric circulation models. Furthermore, the approach is easily reproducible and contains a rigorous quantitative analysis of the interplay of different driving factors. The analysis can easily be extended to other factors and processes of importance, e.g. in order to capture the d-excess better by including sea surface temperatures at the source regions. However, a sufficient number of data points (multiple times the number of predictors) is required to obtain robust regression results.
The similarity of isotopic signatures and their variability over Southeast Asia, as well as similar general climatic conditions, allows the conclusion that the findings are representative for a larger area. Particularly the similarity of the variability in the monthly isotopic composition of rainfall, and climatic conditions of the VMD and Bangkok, suggests that the results are representative for the whole Mekong Delta, and possibly for large areas of the southern tip of the continental Indochinese Peninsula.
The results have direct implications for the interpretation of paleorecords of stable water isotopes in terms of past climate conditions for Southeast Asia. This study shows that the factors controlling the isotopic signature of precipitation are changing between and even within seasons, and that regional factors have substantial impacts on the local isotopic composition of rainfall. This needs to be considered in the reconstruction of past climates based on isotopic records. For the presented study area, δ18O and δ2H values are likely to be representative of the local climatic conditions during the dry season. However, regional factors dominate during most of the rainy season receiving the bulk of the total annual rainfall. In this case, reconstructions of past climates based on paleo-isotopic records would have to be carefully interpreted. The proposed approach might open a pathway for an improved reconstruction of paleoclimates based on isotopic records. It may, for example, be used for identifying suitable variables to improve the performance of proxy data assimilation in paleoclimate reconstruction by circulation models. Moreover, assuming that the general circulation is stable over the period considered in paleoclimate reconstruction, which is reasonable for the Holocene for example, the presented findings can be used to infer moisture source regions and the strength of the two monsoonal regimes influencing Southeast Asia from paleo-isotopic records.
The climatic data used in this paper are not publicly accessible; however, the authors can be contacted by email (duy@gfz-potsdam.de) for help in contacting the person/authorities to acquire such data and how this should be acknowledged. The isotopic data at An Long is published in the open access data repository of the GFZ under http://pmd.gfz-potsdam.de/panmetaworks/review/9e1af507c8fce65a8d740033e 5fea31c2e7c58ade81762c235c6f6bbab91166e/.
The supplement related to this article is available online at: https://doi.org/10.5194/hess-22-1239-2018-supplement.
The authors declare that they have no conflict of interest.
We acknowledge the German Academic Exchange Service (DAAD) for the
scholarship that enabled the first author to pursue a PhD degree at the
University of Potsdam, Germany. We acknowledge the International Atomic
Energy Agency (IAEA) for their on-going maintenance of the Global Network of
Isotopes in Precipitation. The authors gratefully acknowledge the NOAA Air
Resources Laboratory (ARL) for provision of the HYSPLIT transport and
dispersion model and/or READY website (http://www.ready.noaa.gov) used in
this publication. We would also like to thank the staff at An Long station for
isotope sample collection of precipitation. Our thanks extend to the staff
who analyzed part of the isotope samples at the laboratory of the
Alfred-Wegener-Institute (AWI) in Potsdam, Germany. We thank the anonymous
reviewers for their constructive comments to improve the manuscript.
The article processing charges for this open-access
publication
were covered by a Research
Centre of the Helmholtz Association.
Edited by: Lixin Wang
Reviewed by: three anonymous referees
Aggarwal, P. K., Fröhlich, K., Kulkarni, K. M., and Gourcy, L. L.: Stable isotope evidence for moisture sources in the Asian summer monsoon under present and past climate regimes, Geophys. Res. Lett., 31, L08203, https://doi.org/10.1029/2004GL019911, 2004.
Araguás-Araguás, L., Froehlich, K., and Rozanski, K.: Stable isotope composition of precipitation over southeast Asia, J. Geophys. Res.-Atmos., 103, 28721–28742, 1998.
Baker, A. J., Sodemann, H., Baldini, J. U., Breitenbach, S. F., Johnson, K. R., Hunen, J., and Zhang, P.: Seasonality of westerly moisture transport in the East Asian summer monsoon and its implications for interpreting precipitation δ18O, J. Geophys. Res.-Atmos., 120, 5850–5862, 2015.
Bowen, G. J.: Spatial analysis of the intra-annual variation of precipitation isotope ratios and its climatological corollaries, J. Geophys. Res.-Atmos., 113, D05113, https://doi.org/10.1029/2007JD009295, 2008.
Breitenbach, S. F., Adkins, J. F., Meyer, H., Marwan, N., Kumar, K. K., and Haug, G. H.: Strong influence of water vapor source dynamics on stable isotopes in precipitation observed in Southern Meghalaya, NE India, Earth Planet. Sc. Lett., 292, 212–220, 2010.
Budescu, D. V.: Dominance analysis: A new approach to the problem of relative importance of predictors in multiple regression, Psycholog. Bull., 114, 542–551, 1993.
Cabello, M., Orza, J., Galiano, V., and Ruiz, G.: Influence of meteorological input data on backtrajectory cluster analysis? a seven-year study for southeastern Spain, Adv. Sci. Res., 2, 65–70, 2008.
Chakraborty, S., Sinha, N., Chattopadhyay, R., Sengupta, S., Mohan, P., and Datye, A.: Atmospheric controls on the precipitation isotopes over the Andaman Islands, Bay of Bengal, Scient. Rep., 6, 19555, https://doi.org/10.1038/srep19555, 2016.
Clark, I. D. and Fritz, P.: Environmental isotopes in hydrogeology, CRC Press, New York, 1997.
Conroy, J. L., Cobb, K. M., and Noone, D.: Comparison of precipitation isotope variability across the tropical Pacific in observations and SWING2 model simulations, J. Geophys. Res.-Atmos., 118, 5867–5892, 2013.
Craig, H.: Isotopic variations in meteoric waters, Science, 133, 1702–1703, 1961.
Crawford, J., Hughes, C. E., and Lykoudis, S.: Alternative least squares methods for determining the meteoric water line, demonstrated using GNIP data, J. Hydrol., 519, 2331–2340, 2014.
Crawford, J., Hollins, S. E., Meredith, K. T., and Hughes, C. E.: Precipitation stable isotope variability and subcloud evaporation processes in a semi-arid region, Hydrol. Process., 31, 20–34, https://doi.org/10.1002/hyp.10885, 2017.
Dansgaard, W.: Stable isotopes in precipitation, Tellus, 16, 436–468, 1964.
Dayem, K. E., Molnar, P., Battisti, D. S., and Roe, G. H.: Lessons learned from oxygen isotopes in modern precipitation applied to interpretation of speleothem records of paleoclimate from eastern Asia, Earth Planet. Sc. Lett., 295, 219–230, 2010.
Delgado, J. M., Merz, B., and Apel, H.: Monsoon variability and the Mekong flood regime, in: The Mekong Delta System, Springer, Dordrecht, 233–244, 2012.
Draxler, R. R. and Hess, G.: An overview of the HYSPLIT_4 modelling system for trajectories, Aust. Meteorol. Mag., 47, 295–308, 1998.
Draxler, R. R. and Rolph, G.: HYSPLIT (HYbrid Single-Particle Lagrangian Integrated Trajectory) model access via NOAA ARL READY website (http://ready.arl.noaa.gov/HYSPLIT.php), NOAA Air Resources Laboratory, Silver Spring, MD, 2003.
Gat, J. R.: Oxygen and hydrogen isotopes in the hydrologic cycle, Annu. Rev. Earth Planet. Sci., 24, 225–262, 1996.
Genereux, D. P. and Hooper, R. P.: Oxygen and hydrogen isotopes in rainfall–runoff studies, in: Isotope tracers in catchment hydrology, Elsevier Science, the Netherlands, 319–346, 1998.
Gonfiantini, R., Fröhlich, K., Araguas-Araguas, L., and Rozanski, K.: Isotopes in groundwater hydrology, in: Isotope tracers in catchment hydrology, Elsevier Science, the Netherlands, 203–246, 1998.
GSO: Statistical Yearbook of Vietnam 2013, General Statistics Office (GSO) Vietnam, Hanoi, 2014.
Guan, H., Zhang, X., Skrzypek, G., Sun, Z., and Xu, X.: Deuterium excess variations of rainfall events in a coastal area of South Australia and its relationship with synoptic weather systems and atmospheric moisture sources, J. Geophys. Res.-Atmos., 118, 1123–1138, 2013.
Helsel, D. R. and Hirsch, R. M.: Statistical methods in water resources, US Geological survey, Reston, VA, 2002.
Hung, N. N., Delgado, J. M., Güntner, A., Merz, B., Bárdossy, A., and Apel, H.: Sedimentation in the floodplains of the Mekong Delta, Vietnam. Part I: suspended sediment dynamics, Hydrol. Process., 28, 3132–3144, 2014.
IAEA: IAEA/GNIP precipitation sampling guide, International Atomic Energy Agency, Vienna, Austria, 2014.
IAEA/WMO: Global Network of Isotopes in Precipitation, The GNIP Database, available at: http://www.iaea.org/water (last access: 5 August 2017), 2016.
Ichiyanagi, K. and Yamanaka, M. D.: Interannual variation of stable isotopes in precipitation at Bangkok in response to El Niño Southern Oscillation, Hydrol. Process., 19, 3413–3423, 2005.
Ingraham, N. L.: Isotopic variations in precipitation, in: Isotope Tracers in Catchment Hydrology, Elsevier Science, the Netherlands, 87–118, 1998.
Ishizaki, Y., Yoshimura, K., Kanae, S., Kimoto, M., Kurita, N., and Oki, T.: Interannual variability of HO in precipitation over the Asian monsoon region, J. Geophys. Res.-Atmos., 117, D16308, https://doi.org/10.1029/2011JD015890, 2012.
Johnson, J. W.: A heuristic method for estimating the relative weight of predictor variables in multiple regression, Multivar. Behav. Res., 35, 1–19, 2000.
Johnson, K. R., and Ingram, B. L.: Spatial and temporal variability in the stable isotope systematics of modern precipitation in China: implications for paleoclimate reconstructions, Earth Planet. Sc. Lett., 220, 365–377, 2004.
Kendall, C. and Caldwell, E. A.: Fundamentals of isotope geochemistry, in: Isotope tracers in catchment hydrology, Elsevier Science, the Netherlands, 51–86, 1998.
Kraha, A., Turner, H., Nimon, K., Zientek, L., and Henson, R.: Tools to Support Interpreting Multiple Regression in the Face of Multicollinearity, Front. Psychol., 3, 44, https://doi.org/10.3389/fpsyg.2012.00044, 2012.
Kurita, N., Ichiyanagi, K., Matsumoto, J., Yamanaka, M. D., and Ohata, T.: The relationship between the isotopic content of precipitation and the precipitation amount in tropical regions, J. Geochem. Explor., 102, 113–122, 2009.
Kurita, N., Fujiyoshi, Y., Nakayama, T., Matsumi, Y., and Kitagawa, H.: East Asian Monsoon controls on the inter-annual variability in precipitation isotope ratio in Japan, Clim. Past, 11, 339–353, https://doi.org/10.5194/cp-11-339-2015, 2015.
Lachniet, M. S.: Sea surface temperature control on the stable isotopic composition of rainfall in Panama, Geophys. Res. Lett., 36, L03701, https://doi.org/10.1029/2008GL036625, 2009.
Landais, A., Risi, C., Bony, S., Vimeux, F., Descroix, L., Falourd, S., and Bouygues, A.: Combined measurements of 17 O excess and d-excess in African monsoon precipitation: Implications for evaluating convective parameterizations, Earth Planet. Sc. Lett., 298, 104–112, 2010.
LeBreton, J. M., Hargis, M. B., Griepentrog, B., Oswald, F. L., and Ployhart, R. E.: A multidimensional approach for evaluating variables in organizational research and practice, Person. Psychol., 60, 475–498, 2007.
Lee, J. E., Risi, C., Fung, I., Worden, J., Scheepmaker, R. A., Lintner, B., and Frankenberg, C.: Asian monsoon hydrometeorology from TES and SCIAMACHY water vapor isotope measurements and LMDZ simulations: Implications for speleothem climate record interpretation, J. Geophys. Res.- Atmos., 117, D15112, https://doi.org/10.1029/2011JD017133, 2012.
Lee, K.-S., Grundstein, A. J., Wenner, D. B., Choi, M.-S., Woo, N.-C., and Lee, D.-H.: Climatic controls on the stable isotopic composition of precipitation in Northeast Asia, Clim. Res., 23, 137–148, 2003.
LeGrande, A. N. and Schmidt, G. A.: Sources of Holocene variability of oxygen isotopes in paleoclimate archives, Clim. Past, 5, 441–455, https://doi.org/10.5194/cp-5-441-2009, 2009.
Levene, H.: Robust tests for equality of variances, Contrib. Probabil. Stat., 1, 278–292, 1960.
Lim, Y.-K., Kim, K.-Y., and Lee, H.-S.: Temporal and spatial evolution of the Asian summer monsoon in the seasonal cycle of synoptic fields, J. Climate, 15, 3630–3644, 2002.
Liu, Z., Wen, X., Brady, E., Otto-Bliesner, B., Yu, G., Lu, H., Cheng, H., Wang, Y., Zheng, W., and Ding, Y.: Chinese cave records and the East Asia summer monsoon, Quaternary Sci. Rev., 83, 115–128, 2014.
Merlivat, L. and Jouzel, J.: Global climatic interpretation of the deuterium–oxygen 18 relationship for precipitation, J. Geophys. Res.-Oceans, 84, 5029–5033, 1979.
Meyer, H., Schönicke, L., Wand, U., Hubberten, H.-W., and Friedrichsen, H.: Isotope studies of hydrogen and oxygen in ground ice-experiences with the equilibration technique, Isotop. Environ. Health Stud., 36, 133–149, 2000.
Noone, D. and Simmonds, I.: Associations between δ18O of Water and Climate Parameters in a Simulation of Atmospheric Circulation for 1979–95, J. Climate, 15, 3150–3169, 2002.
Okazaki, A. and Yoshimura, K.: Development and evaluation of a system of proxy data assimilation for paleoclimate reconstruction, Clim. Past, 13, 379–393, https://doi.org/10.5194/cp-13-379-2017, 2017.
Peng, T.-R., Wang, C.-H., Huang, C.-C., Fei, L.-Y., Chen, C.-T. A., and Hwong, J.-L.: Stable isotopic characteristic of Taiwan's precipitation: A case study of western Pacific monsoon region, Earth Planet. Sc. Lett., 289, 357–366, 2010.
Pfahl, S. and Sodemann, H.: What controls deuterium excess in global precipitation?, Clim. Past, 10, 771–781, https://doi.org/10.5194/cp-10-771-2014, 2014.
Pfahl, S. and Wernli, H.: Air parcel trajectory analysis of stable isotopes in water vapor in the eastern Mediterranean, J. Geophys. Res.-Atmos., 113, D20104, https://doi.org/10.1029/2008JD009839s, 2008.
Renaud, F. G. and Kuenzer, C.: The Mekong Delta system: Interdisciplinary analyses of a river delta, Springer Science & Business Media, Dordrecht, 2012.
Risi, C., Bony, S., and Vimeux, F.: Influence of convective processes on the isotopic composition (δ18O and δD) of precipitation and water vapor in the tropics: 2. Physical interpretation of the amount effect, J. Geophys. Res.-Atmos., 113, D19306, https://doi.org/10.1029/2008JD009943, 2008a.
Risi, C., Bony, S., Vimeux, F., Descroix, L., Ibrahim, B., Lebreton, E., Mamadou, I., and Sultan, B.: What controls the isotopic composition of the African monsoon precipitation? Insights from event-based precipitation collected during the 2006 AMMA field campaign, Geophys. Res. Lett., 35, L24808, https://doi.org/10.1029/2008GL035920, 2008b.
Risi, C., Bony, S., Vimeux, F., Chong, M., and Descroix, L.: Evolution of the stable water isotopic composition of the rain sampled along Sahelian squall lines, Q. J. Roy. Meteorol. Soc., 136, 227–242, 2010a.
Risi, C., Bony, S., Vimeux, F., and Jouzel, J.: Water-stable isotopes in the LMDZ4 general circulation model: Model evaluation for present-day and past climates and applications to climatic interpretations of tropical isotopic records, J. Geophys. Res.-Atmos., 115, 2010b.
Rozanski, K., Araguas-Araguas, L., and Gonfiantini, R.: Relation between long-term trends of oxygen-18 isotope composition of precipitation and climate, Science, 258, 981–985, 1992.
SIWRP: Flood Planning in Vietnamese Mekong Delta until 2020, SIWRP, Ho Chi Minh, Vietnam, 2014.
Sodemann, H., Schwierz, C., and Wernli, H.: Interannual variability of Greenland winter precipitation sources: Lagrangian moisture diagnostic and North Atlantic Oscillation influence, J. Geophys. Res.-Atmos., 113, D03107, https://doi.org/10.1029/2007JD008503, 2008.
Stein, A., Draxler, R., Rolph, G., Stunder, B., Cohen, M., and Ngan, F.: NOAA's HYSPLIT atmospheric transport and dispersion modeling system, B. Am. Meteorol. Soc., 96, 2059–2077, 2015.
Stewart, M. K.: Stable isotope fractionation due to evaporation and isotopic exchange of falling waterdrops: Applications to atmospheric processes and evaporation of lakes, J. Geophys. Res., 80, 1133–1146, 1975.
Stohl, A.: Computation, accuracy and applications of trajectories – a review and bibliography, Atmos. Environ., 32, 947–966, 1998.
Sturm, C., Zhang, Q., and Noone, D.: An introduction to stable water isotopes in climate models: benefits of forward proxy modelling for paleoclimatology, Climate of the Past, 6, 115-129, 2010.
Tan, M.: Circulation effect: climatic significance of the short term variability of the oxygen isotopes in stalagmites from monsoonal China – dialogue between paleoclimate records and modern climate research, Quaternary Sci., 29, 851–862, 2009.
Tan, M.: Circulation effect: response of precipitation δ18O to the ENSO cycle in monsoon regions of China, Clim. Dynam., 42, 1067–1077, 2014.
Tindall, J., Valdes, P., and Sime, L. C.: Stable water isotopes in HadCM3: Isotopic signature of El Niño–Southern Oscillation and the tropical amount effect, J. Geophys. Res.-Atmos., 114, D04111, https://doi.org/10.1029/2008JD010825, 2009.
Tonidandel, S. and LeBreton, J. M.: Relative importance analysis: A useful supplement to regression analysis, J. Business Psychol., 26, 1–9, 2011.
Tonidandel, S., LeBreton, J. M., and Johnson, J. W.: Determining the statistical significance of relative weights, Psycholog. Meth., 14, 387–399, 2009.
Tri, V. K.: Hydrology and hydraulic infrastructure systems in the Mekong Delta, Vietnam, in: The Mekong Delta System, Springer, Dordrecht, 49–81, 2012.
Uemura, R., Matsui, Y., Yoshimura, K., Motoyama, H., and Yoshida, N.: Evidence of deuterium excess in water vapor as an indicator of ocean surface conditions, J. Geophys. Res.-Atmos., 113, D19114, https://doi.org/10.1029/2008JD010209, 2008.
Vuille, M., Bradley, R., Werner, M., Healy, R., and Keimig, F.: Modeling δ18O in precipitation over the tropical Americas: 1. Interannual variability and climatic controls, J. Geophys. Res.-Atmos., 108, 4174, https://doi.org/10.1029/2001JD002038, 2003.
Vuille, M., Werner, M., Bradley, R., and Keimig, F.: Stable isotopes in precipitation in the Asian monsoon region, J. Geophys. Res.-Atmos., 110, D23108, https://doi.org/10.1029/2005JD006022, 2005.
Wang, B., Wu, R., and Lau, K.: Interannual variability of the Asian summer monsoon: contrasts between the Indian and the Western North Pacific-East Asian Monsoons, J. Climate, 14, 4073–4090, 2001.
Yang, H., Johnson, K., Griffiths, M., and Yoshimura, K.: Interannual controls on oxygen isotope variability in Asian monsoon precipitation and implications for paleoclimate reconstructions, J. Geophys. Res.-Atmos., 121, 8410–8428, 2016.
Yoshimura, K., Oki, T., Ohte, N., and Kanae, S.: A quantitative analysis of short-term 18O variability with a Rayleigh-type isotope circulation model, J. Geophys. Res.-Atmos., 108, 4647, https://doi.org/10.1029/2003JD003477, 2003.
Yoshimura, K., Kanamitsu, M., Noone, D., and Oki, T.: Historical isotope simulation using reanalysis atmospheric data, J. Geophys. Res.-Atmos., 113, D19108, https://doi.org/10.1029/2008JD010074, 2008.
Yoshimura, K., Miyoshi, T., and Kanamitsu, M.: Observation system simulation experiments using water vapor isotope information, J. Geophys. Res.-Atmos., 119, 7842–7862, 2014.