
the Creative Commons Attribution 4.0 License.
the Creative Commons Attribution 4.0 License.
 | 05 Nov 2026
Dam-regulated flow fragmentation and sand-mining-driven threshold shifts shorten the Mekong–Tonle Sap reverse-flow season
Khosro Morovati
Hongling Zhao

Sand mining, dam construction, and climate change have profoundly altered the hydrological dynamics of the Mekong River-Tonle Sap Lake floodplain system, one of the world's most ecologically productive river-lake complexes. This study provides an integrated, multi-scale assessment of flow regime alteration across the Mekong mainstream and its coupling with the Tonle Sap Lake across three periods: pre-dam (1976–1991), transition (1992–2009), and post-dam (2010–2024). Using daily and sub-daily data from eight mainstream stations, we quantify shifts in long-term flow memory, short-term variability, and flow amplitude. We use a hydrodynamic response-time model to link upstream regime change to the Mekong–Tonle Sap flow exchange.
During the post-dam period, flow memory increased in the upper mainstream but decreased slightly downstream, indicating growing upstream–downstream divergence in flow-regime characteristics and increasing hydrological fragmentation. Upstream stations, particularly Chiang Saen, exhibit a 33.3 % increase in minimum flows and a 40 % decrease in maximum flows during the post-dam period compared to the pre-dam period, alongside higher flow memory (+0.11), reflecting flow smoothing by reservoir operations. At the most downstream station at Kratie, a key control point for Tonle Sap inflow, maximum flows decreased by 9.4 %, while minimum flows increased by 117 % relative to the pre-dam baseline; the seasonal timing of peak discharge was also delayed by approximately two to three weeks.
Critically, the combined effects of the altered mainstream flow regime and sand-mining-driven riverbed lowering have shifted the conditions under which Tonle Sap flow reversal initiates. Using the lag-adjusted Kratie discharge at onset as a proxy for the Mekong-Tonle Sap confluence stage/head condition, we find that the median onset discharge increased from ∼ 3200 m3 s−1 (pre-dam) to ∼ 4300 m3 s−1 under the post-dam fixed-bed scenario (2010–2024 hydrology with reference morphology), and to ∼ 7200 m3 s−1 once sand-mining-driven channel incision is added. This indicates that post-2010 hydrological alteration reduced the probability of exceeding the discharge threshold for initiating reverse flow, while sand-mining-driven riverbed lowering substantially amplified this shift by modifying local stage–discharge relationships. Together, these interacting drivers shorten the reverse-flow season by approximately 28 d relative to the pre-dam baseline. Sustaining the Mekong–Tonle Sap flood pulse will therefore require basin-wide monitoring and transboundary governance that address flow timing and variability, not volume alone.
- Article
(4678 KB) - Full-text XML
-
Supplement
(2323 KB) - BibTeX
- EndNote


In riverine ecosystems, the flow regime–comprising the magnitude, timing, frequency, duration, and rate of change of discharge–is a foundational driver of ecological structure and biogeochemical functioning (Poff et al., 1997; Binh et al., 2020). Alterations to this regime, driven by climate change and intensified human interventions such as dam construction and sand mining, have emerged as critical concerns within the hydrological and ecological sciences (Koehnken et al., 2020; Lao et al., 2022; Morovati et al., 2024a). Since the 1990s, global river management has shifted beyond managing total runoff volumes toward safeguarding the integrity of natural flow dynamics (Li et al., 2017). Maintaining or restoring ecologically functional flow regimes has thus become a shared priority for engineers, policymakers, and ecologists seeking to balance infrastructure development with ecosystem resilience (Yin et al., 2011; Arthington et al., 2018).
The Mekong River, one of the world's most biodiverse and socioeconomically critical transboundary rivers (Try et al., 2022), has undergone profound hydrological transformations due to the rapid expansion of hydropower infrastructure (Soukhaphon et al., 2021; Yun et al., 2024). Particularly since 2010, rapid dam development in the upper Mekong (Lancang) and lower Mekong tributaries has coincided with substantial changes in the river's natural monsoonal flow regime and in the hydrological connectivity supporting downstream floodplain and delta systems (Hecht et al., 2019; Morovati et al., 2026). From 2010 to 2015 alone, dam operations accounted for approximately 62 % of total streamflow change in the basin (Li et al., 2017). These impacts have been especially pronounced during the dry season (November–April): Räsänen et al. (2017) reported dry season discharge increases of 121 %–187 % at Chiang Saen, the most upstream station in our study reach, in March, and an increase of 32 %–46 % at Kratie, the most downstream station (Fig. 1). Lu and Chua (2021) found a 98 % increase in monthly discharge at Chiang Saen during the dry months. Concurrently, wet-season flows (May–October) have declined substantially (Lu et al., 2014), undermining the amplitude and timing of flood pulses that sustain floodplain ecosystems. Nguyen et al. (2025) documented a 73.7 % increase in dry-season flows at Chiang Saen between 2000 and 2019, underscoring the dominant role of dam-induced regulation.
Most existing Mekong assessments emphasize changes in seasonal means, extremes, and selected indicators of alteration (Cochrane et al., 2014; Hoang et al., 2016; Li et al., 2017; Shrestha et al., 2021; Lu and Chua, 2021; Ly et al., 2023; Dang and Pokhrel, 2024). However, such descriptors do not fully capture two properties that are central to how basin-wide signals propagate through a river network and translate into downstream responses: flow memory and flow synchrony. Here, flow memory refers to the persistence (long-range dependence) of discharge variability, that is, the extent to which present conditions retain information from antecedent fluctuations (de Lavenne et al., 2022; Berghuijs et al., 2025); we quantify this using the Hurst exponent (see Methods) (Koutsoyiannis, 2005; Mudelsee, 2007). Flow synchrony refers to the coherence of hydrograph timing and shape among stations along the mainstream, evaluated here using inter-station similarity of standardised daily discharge time series (see Methods). These properties are not simply statistical: hydrological memory controls how climatic or discharge anomalies persist, accumulate, and decay through catchment storage and runoff generation, thereby influencing drought propagation, seasonal-flow predictability, and flood or low-flow risk (Alvarez-Garreton et al., 2021; de Lavenne et al., 2022; Berghuijs et al., 2025). Synchrony, in turn, reflects how coherently the flood pulse is transmitted downstream; changes in the synchrony between mainstem and tributary flows can modulate high-flow extremes, while broader discharge synchronization has been linked to spatially coherent flood risk across river networks (Rupp et al., 2021; Cooper et al., 2025; Yang et al., 2025). A decline in either property indicates hydrological fragmentation, meaning that upstream forcing becomes less persistently expressed through time and less consistently aligned across space, even when changes in mean seasonal discharge appear modest.
In parallel, the effects of such disruptions on threshold-sensitive processes such as the annual reverse flow from the Mekong into Tonle Sap Lake, a globally unique hydrological phenomenon essential to Cambodian fisheries, agriculture, and biodiversity (Yoshida et al., 2020; Morovati et al., 2021) remain underexplored. Tonle Sap Lake functions as a seasonal water storage system, with reverse flows during the monsoon expanding the lake by up to sixfold (Try et al., 2020; Do et al., 2025), delivering nutrient-rich sediment and sustaining livelihoods across Cambodia (Arias et al., 2014; Morovati et al., 2023; Zhang et al., 2026). Earlier work has shown that Mekong flow alteration can reduce flood-peak amplitude and shorten flood duration, with important ecological consequences for the Tonle Sap flood pulse (Kummu and Sarkkula, 2008). Climate variability further exerts strong control on Tonle Sap storage, with lake-volume anomalies closely tracking rainy-season rainfall anomalies across the Mekong Basin (Frappart et al., 2018), and satellite-based analyses indicate that interannual inundation fluctuations are dominated by precipitation variability, while the contribution attributed to dams constructed in China is comparatively small (Wang et al., 2020).
In addition to basin-scale hydrological alteration, intensive sand mining provides a distinct local geomorphic pathway through which Mekong–Tonle Sap connectivity can be weakened. Natural sand supply to the lower Mekong has been estimated at only approximately 6.18 ± 2.01 Mt yr−1, substantially below reported extraction rates of approximately 50 Mt yr−1 (Hackney et al., 2021). In Cambodia, estimated extraction increased from approximately 24 Mt in 2016 to 59 Mt in 2020, generating a persistent negative sand budget and median reach-scale riverbed incision of approximately 0.26 m yr−1 (Hackney et al., 2021). Beyond lowering mean bed elevation, extraction creates deep pits and irregular anthropogenic bedforms that increase hydraulic roughness, modify near-bed turbulence and sediment transport, and can prevent mining pits from being rapidly refilled (Hackney et al., 2021, 2025). These changes are particularly important near the Chaktomuk junction, where the Mekong, Tonle Sap and Bassac channels interact and where alterations in bed geometry, conveyance and stage–discharge relationships can modify the hydraulic gradient required for the Tonle Sap flow reversal. Sand-mining-driven riverbed lowering of the Mekong mainstream has reduced reverse flow by approximately 40 %–50 % between 1998 and 2018 (Quan et al., 2025), yet how this local geomorphic change interacts with basin-wide flow-regime alteration to shift reverse-flow onset and cessation thresholds remains insufficiently quantified.
A wide range of approaches, including statistical indicators, hydrodynamic simulations, and hydrological models, have been employed to assess flow regime alterations in the Mekong basin (Delgado et al., 2010; Lauri et al., 2012; Piman et al., 2013; Cochrane et al., 2014; Li et al., 2017; Yun et al., 2024; Lu and Chua, 2021; Wang et al., 2021; Chen et al., 2021). Among these, the Indicators of Hydrologic Alteration (IHA) framework remains one of the most widely used tools for evaluating site-specific changes in hydrologic parameters (Li et al., 2017; Binh et al., 2020). However, IHA's predominantly univariate and station-based nature limits its ability to capture system-wide dynamics, such as spatial coherence, inter-station synchrony, or long-term predictability. This limitation is particularly critical in the Mekong basin, where pronounced spatial and temporal variability in precipitation (Pokhrel et al., 2018; Zhang et al., 2023), combined with the presence of over 300 operational dams (more than 500 according to some sources, Ang et al., 2024), has resulted in extensive flow regulation. To address these gaps, alternative metrics have been proposed. The Richards-Baker Flashiness index (RBI), for example, captures short-term variability by quantifying how rapidly flow rises and falls (Gannon et al., 2022), while the Hurst exponent provides a measure of long-range dependence or memory in discharge time series.
This study addresses these gaps through a multi-decadal, multi-indicator assessment of flow regime shifts at eight mainstream stations along the Mekong River from 1976 to 2024. We quantify changes in daily discharge variability, flashiness, and memory across three hydrological periods: pre-dam (1976–1991), transition (1992–2009), and post-dam (2010–2024), and we use these indicators to characterize the disruption of flow memory and the fragmentation of spatial coherence along the mainstream. In addition to these indicators, we examine annual discharge extremes, including maximum and minimum daily flows and their associated timing. Furthermore, using 15 min water-level observations (2018–2025), we quantify sub-daily variability using amplitude, flashiness (RBI), and peak count metrics. Finally, we link these altered flow characteristics to the onset, termination, and duration thresholds of Tonle Sap's reverse flow using Delft3D-Flow hydrodynamic simulations with a response-time model from Kratie to the Mekong-Tonle Sap confluence (Fig. 1b), which enables a physically consistent lag adjustment between Kratie discharge and conditions at the confluence. This approach enables the empirical derivation of reverse flow thresholds and reveals significant temporal shifts in both their magnitude and timing. Our findings document substantial post-2010 hydrological alteration during a period of rapid dam development and climate variability. They further show that sand-mining-driven channel incision near the Mekong–Tonle Sap confluence imposes an additional local geomorphic control on reverse-flow thresholds. Together, these findings provide updated system-wide insights for hydrological management within the frameworks of the Mekong River Commission (MRC) and the Lancang-Mekong Cooperation (LMC) (MRC, 2023), where effective science-policy communication is essential (Orieschnig et al., 2026; Morovati et al., 2026; Zhao et al., 2026a).
2.1 Study area
The Mekong River, one of the world's most prominent transboundary river systems, extends over 4800 km from the glaciated Tibetan Plateau through six countries–China, Myanmar, Laos, Thailand, Cambodia, and Vietnam–before discharging into the sea (Duc et al., 2020). Over the past three decades, hydrological dynamics in the basin have been reshaped by the combined pressures of climate change and rapid hydropower expansion. Shifts in precipitation regimes and temperature variability have interacted with extensive dam construction on both the mainstream and tributaries (Ang et al., 2024), amplifying alterations to the river's seasonal flow regime. Twelve large dams are now located on the upper Mekong (Lancang) in China (Fig. 1a), with a collective storage capacity exceeding 43 000 million m3 (Mm3). Among them, the Xiaowan (14 645 Mm3, completed in 2010) and Nuozhadu (21 749 Mm3, completed in 2014) reservoirs dominate in both scale and operational influence (Zhang et al., 2023).
In the lower Mekong, mainstream dam development began more recently, marked by the commissioning of the Xayaburi Dam in 2019 and the Don Sahong Dam in 2020, together contributing around 1300 Mm3 of storage (Fig. 1a). Although many of the tributary dams are small (<5000 Mm3), their cumulative storage, asynchronous operational strategies, and often uncoordinated management (Lyu et al., 2024; Morovati et al., 2024b) – even within a single jurisdiction – have led to profound disruptions in the basin's natural flow regime (Morovati et al., 2026). These hydrological shifts are further intensified by the region's pronounced spatial and temporal variability in precipitation, including extreme monsoonal rainfall patterns typical of the lower Mekong's tropical climate (Pokhrel et al., 2018; Zhang et al., 2023).
Downstream, the Mekong River interacts seasonally with the Tonle Sap Lake via the Tonle Sap River. During the wet season, elevated mainstream water levels reverse the hydraulic gradient at the confluence and drive reverse flow into the lake, expanding its surface area from ∼ 2500 km2 in the dry season to >13 000 km2 at peak inundation (Kummu et al., 2014; Morovati et al., 2023). Lake water level typically rises from ∼ 1.2 to 10.4 m (Dang et al., 2022), corresponding to a storage increase of ∼ 1.6–59.7 km3 (Kummu et al., 2014; Morovati et al., 2023). Water-balance analyses indicate that the Mekong mainstream (via reverse flow) supplies the dominant fraction of annual inflow (∼ 42 %–53.5 %), while Tonle Sap tributaries contribute a smaller but substantial share (∼ 34 %–41 %), and direct precipitation contributes ∼ 12.5 % (Kummu et al., 2014; Morovati et al., 2023). This seasonal exchange delivers sediment- and nutrient-rich water that underpins floodplain productivity, supporting one of the world's most productive freshwater fisheries and sustaining Cambodia's rice-based agrarian economy (Tian et al., 2023; Zhang et al., 2026).
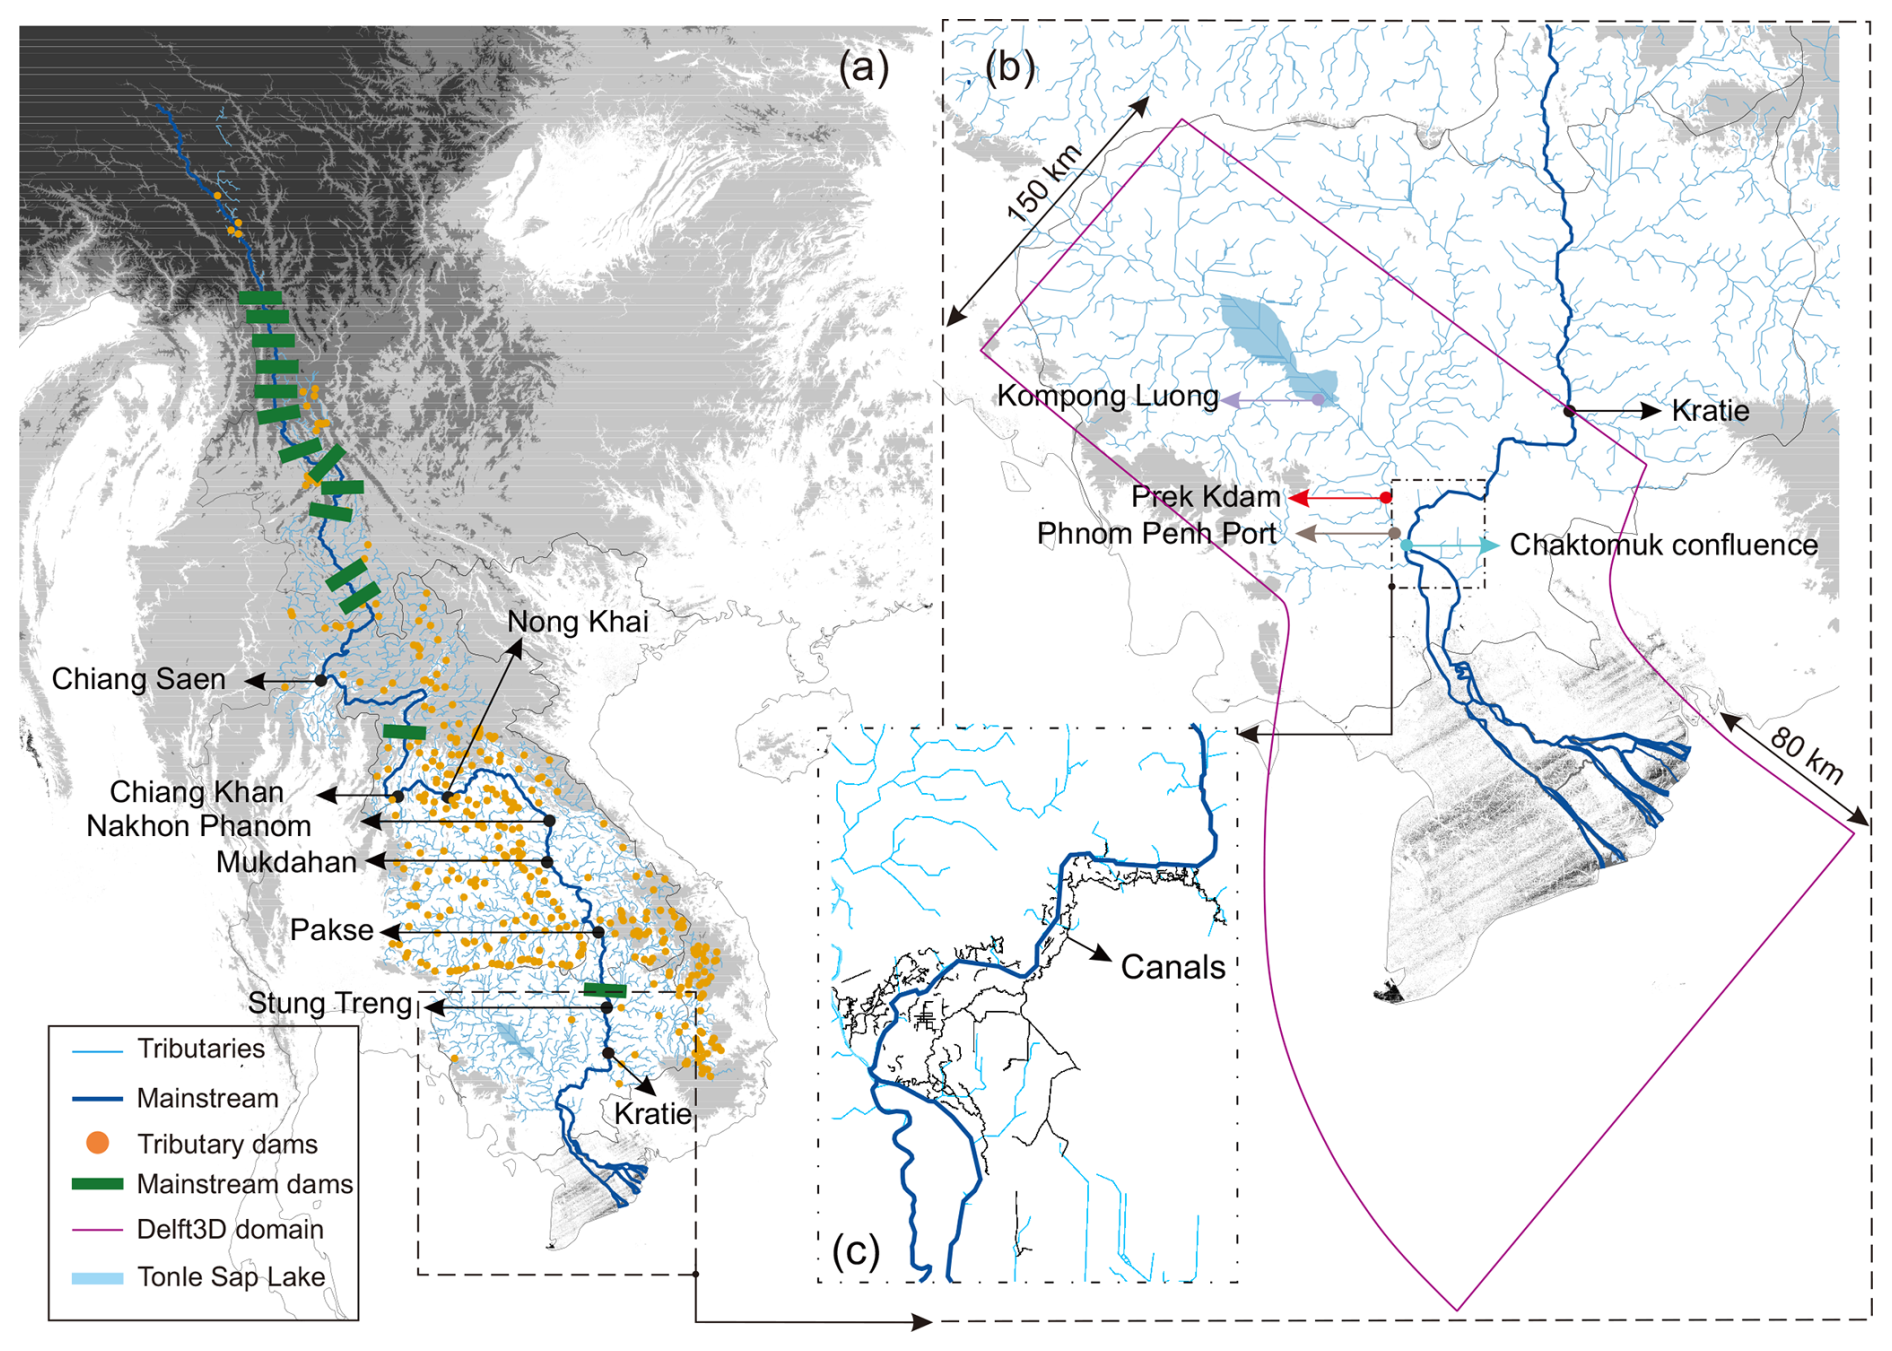
Figure 1Map of the Mekong River basin and model configuration. (a) Locations of the Mekong mainstream and tributary network, hydrological stations, and mainstream and tributary dams. (b) Computational domain of the Delft3D-Flow hydrodynamic model, highlighting key sites (e.g., Kratie, Kompong Luong, and Prek Kdam). (c) The canal network at the Mekong-Tonle Sap confluence incorporated in the model to represent floodplain connectivity and exchange via the Tonle Sap River. Note: The Phnom Penh Port station is shown for reference and is used only for river cross-section validation (Fig. S1), not for the flow regime analysis.
2.2 Station selection
To capture spatially representative changes in flow regime across the Mekong, this study analyzes data from eight mainstream hydrological stations, ranging from Chiang Saen in northern Thailand (representing upper-basin inflow conditions) to Kratie in Cambodia (located upstream of the Tonle Sap confluence) (Fig. 1a).
Additionally, we incorporated data from three supplementary stations for hydrodynamic validation and discharge lag adjustment: Chaktomuk, located at the Mekong–Tonle Sap confluence; Prek Kdam, situated on the Tonle Sap River; and Kompong Luong, located within Tonle Sap Lake (Fig. 1b). These stations were used to validate the Delft3D-Flow hydrodynamic model, which was calibrated to simulate flood inundation and reverse flow in the floodplain (see detailed information in Sect. 2.5.2).
2.3 Period and scenario classification
To capture the evolving anthropogenic impacts on the Mekong River system, we classified the historical record into three distinct hydrological periods: pre-dam (1976–1991), transition (1992–2009), and post-dam (2010–2024). The pre-dam period represents the baseline hydrological state, dominated by natural monsoonal variability and minimal human interference, with no major mainstream dams constructed during this time (Chua et al., 2022; Morovati et al., 2024b). The transition period marks the onset of large-scale regulation, with the construction of the Manwan (1992), Dachaoshan (2003), and Jinghong (2009) dams along the Lancang mainstream, alongside expansion of tributary dam networks across the lower Mekong basin (Morovati et al., 2024b). This phase also saw the emergence of relatively large-scale sand mining in Cambodia, with estimated extraction volumes reaching ∼ 13.5 Mt yr−1 (United Nations, 2017; Chua et al., 2022). The post-dam period is characterized by intensified regulation, marked by the commissioning of two mega-dams – Xiaowan (2010) and Nuozhadu (2014), which together increased upstream storage capacity by more than 36 000 Mm3. This period also featured widespread dam construction in tributaries and the expansion of irrigation infrastructure (Morovati et al., 2024b; Zhao et al., 2026b). Concurrently, sand mining intensified sharply, with annual extraction volumes in Cambodia surpassing 59 Mt yr−1, significantly reshaping riverbed morphology and hydraulics near the Mekong-Tonle Sap confluence (Hackney et al., 2021, 2025; Quan et al., 2025). These compounding hydrological and morphological alterations are likely to affect not only flow magnitude and timing but also threshold-dependent dynamics such as the initiation and cessation of reverse flow into Tonle Sap Lake.
For the mainstream flow-regime analysis, these three periods are treated as historical hydrological periods. For the Tonle Sap reverse-flow analysis, however, we further separated the hydrological effects of post-2010 dam regulation and climate variability from the geomorphic effects of sand-mining-driven bed incision. We therefore used four hydrodynamic scenarios: (i) pre-dam, representing baseline hydrology and reference riverbed morphology; (ii) transition, representing early dam development and climate variability with the same reference morphology; (iii) the post-dam fixed-bed scenario represents observed 2010–2024 hydrology under the reference riverbed morphology, thereby isolating the effect of post-2010 hydrological alteration – including dam regulation, climate variability and other contemporaneous changes in hydrological forcing – from the additional effect of prescribed riverbed incision; and (iv) post-dam + sand mining, using the same 2010–2024 hydrology but with annually reconstructed incised riverbed digital elevation models (DEMs), thereby isolating the additional effect of sand-mining-driven morphological change. Comparisons between the post-dam fixed-bed and post-dam + sand-mining scenarios therefore quantify the geomorphic contribution of sand mining to changes in reverse-flow onset, cessation, and lag-adjusted Kratie discharge thresholds.
2.4 Data sources and preprocessing
Daily discharge data spanning 1976–2024 were obtained from the MRC Data Portal (https://portal.mrcmekong.org/home, last access: 24 April 2026). Quality checks were applied to remove duplicates, missing dates, and outliers. For each station, we constructed a continuous daily time series (n=17 898 d) and identified missing dates by comparison with the full daily index. Missing records were rare (0–9 d per station; maximum at Kratie: 8 d = 0.050 % of the record), totalling 17 missing station-day entries across eight stations (0.0126 % of all station-day values). Isolated short gaps (1–2 d) were filled by linear interpolation between adjacent days. The only multi-day gap (Kratie, 24 to 28 January 2003) was infilled using the upstream station discharge at Stung Treng plus intervening tributary inflow between Stung Treng and Kratie derived from the Tsinghua Representative Elementary Watershed (THREW) model (Table S1 in the Supplement).
To assess dam-induced changes in flow, simulated daily discharge without dam influence for the post-dam period (2010–2024) was obtained from validated THREW hydrological simulations (see Sect. 2.5.1). Except for this case, our analyses reflect the compounded impacts of dam regulation and climate variability, and we do not explicitly disentangle their relative contributions (Fig. 2d–f). Accordingly, the measured post-dam flows incorporate the combined effects of dam regulation, climate variability, and other contemporaneous changes in basin hydrology; historical-period comparisons should therefore not be interpreted as isolating the effect of dam regulation alone.
Water level datasets, including both daily and sub-daily (15 min interval) records, were also accessed through the MRC portal. Sub-daily water level data were available from 2018 onwards, and corresponding analyses were limited to this sub-period. For hydrodynamic analyses of the Tonle Sap system, additional time series of lake water levels, reverse flow periods, and discharge were acquired from the MRC and Procedures for the Maintenance of Flows on the Mainstream (PMFM) online platform (https://pmfm.mrcmekong.org/monitoring/6b/, last access: 4 November 2026).
The THREW hydrological simulations were forced using station-based meteorological observations from MRC and the China Meteorological Administration (CMA). Daily potential evapotranspiration was computed using the Penman-Monteith approach based on station meteorological variables (including temperature, wind speed, humidity, and radiation/sunshine duration; Fig. S2). Land-surface datasets used for parameterization included soil properties from the Harmonized World Soil Database (∼ 1 km) and Moderate Resolution Imaging Spectroradiometer (MODIS)-based surface-condition products, including the normalized difference vegetation index (NDVI), leaf area index (LAI), and snow cover (500 m, 16 d). These datasets were processed following Zhang et al. (2023) and aggregated to THREW model units as described in Sect. 2.5.1.
To support hydrodynamic simulation of the lower Mekong–Tonle Sap–Delta system, we used surveyed riverbed cross-sectional bathymetry obtained from the MRC and other hydrological agencies as bathymetric inputs for the Delft3D-Flow model (see Sect. 2.5.2). To separate hydrological from geomorphic effects, the pre-dam, transition, and post-dam fixed-bed simulations were all implemented using a common reference riverbed morphology (see Sect. 2.5.3). This fixed-bed design ensures that differences among these three simulations reflect changes in hydrological forcing, including climate variability and dam regulation, rather than prescribed changes in channel geometry. In contrast, the post-dam + sand-mining scenario used annually updated riverbed DEMs for 2010–2024 to represent progressive sand-mining-driven incision in the lower Mekong and near the Mekong–Tonle Sap confluence. In this paired modelling design, the post-dam fixed-bed scenario represents observed 2010–2024 hydrology under reference morphology, whereas the post-dam + sand-mining scenario applies the same hydrological boundary conditions but includes annual channel lowering. Therefore, the difference between these two post-dam simulations can be interpreted as the additional geomorphic effect of sand-mining-driven riverbed incision on reverse-flow onset, cessation, and lag-adjusted Kratie discharge thresholds.
Adjacent measured transects are irregularly spaced along the thalweg (300 to 3000 m). To derive a hydraulically consistent continuous bathymetry from these discrete transects, we reconstructed intermediate cross-sections in a curvilinear reference frame defined by the river centreline (chainage) and signed cross-channel distance. For each transect, we fit a third-order polynomial bed profile and extracted left- and right-bank elevations; the resulting profile parameters were interpolated along chainage using monotone piecewise-cubic interpolation (PCHIP). Between each pair of measured transects, we generated 30–200 virtual cross-sections (∼ 100 points per transect), enforcing (i) bank anchoring at the interpolated bank elevations and (ii) envelope clipping that constrains interior bed elevations to the min-max range of the bracketing surveyed transects. We also applied a smoothness constraint to suppress unrealistic lateral jumps in the thalweg. The measured and virtual cross-sections were then mapped onto the Delft3D curvilinear grid using Delft3D-QUICKIN, which applies triangular interpolation and internal diffusion to generate a continuous digital elevation model (DEM) at each grid-node corner (see Sect. S2 in the Supplement for more details).
Additionally, Forest And Buildings removed Copernicus DEM (FABDEM) data with 30 m spatial resolution were incorporated to define floodplain topography and overbank areas beyond the main river channels. For the hydrodynamic simulations, observed daily discharge at Kratie obtained from MRC was prescribed as the upstream inflow boundary, while tributary inflows to the Mekong mainstream and the Tonle Sap system were specified using THREW-simulated daily discharge at tributary outlets (see Sect. 2.5.1 and 2.5.2).
2.5 Methods
2.5.1 Hydrological model
Due to the absence of measured daily discharge data for tributaries discharging into the Mekong mainstream and the Tonle Sap Lake (see Fig. 1b), we employed the THREW model to simulate tributary inflows. In parallel, to generate a baseline scenario for the post-dam period (2010–2024) that is unimpacted by dam operations, we also applied the THREW model to estimate naturalized discharge along the Mekong mainstream. The THREW model is a spatially distributed, physically based hydrological model designed to operate at the scale of Representative Elementary Watersheds (REWs), which preserve physical realism while ensuring computational efficiency. The model has been extensively validated in large transboundary basins, including the Mekong (Morovati et al., 2021, 2023, 2024b; Zhang et al., 2023) (see Sect. S3 in the Supplement for more information).
The entire Mekong River basin was discretised into 651 REWs, allowing spatial representation of diverse hydrological processes across climatic and topographic gradients (Fig. S3 in the Supplement). The THREW hydrological simulations were driven by station-based precipitation and meteorological observations from the MRC and the China Meteorological Administration (CMA). Precipitation was obtained from a basin-wide gauge network (105 stations) and air temperature from 35 stations (Fig. S2 in the Supplement). Daily potential evapotranspiration was computed using the Penman-Monteith method based on station meteorological variables (including temperature, wind speed, humidity, and radiation/sunshine duration). Soil properties were taken from the Harmonized World Soil Database (∼ 1 km). Vegetation and surface-condition inputs, including NDVI, LAI, and snow cover, were derived from MODIS products (500 m, 16 d) following Zhang et al. (2023). Site-based meteorological inputs (e.g., precipitation, temperature) were spatially allocated to REWs using the Thiessen polygon method (Fig. S2 in the Supplement). For gridded datasets such as LAI and NDVI, spatial intersection analyses were performed to determine the weighted contributions of raster cells falling within each REW. The weighted averages of these variables were then assigned as REW-scale inputs.
Model calibration was conducted using an automatic parallel computation framework that optimizes hydrological parameters across multiple REWs simultaneously (Nan et al., 2021) (Table S2 in the Supplement). This enabled efficient exploration of the parameter space while maintaining consistency with observed discharge data at available gauging stations. The THREW model was calibrated for 2000–2009 and validated for 1980–1999. At Kratie, which provides the principal upstream boundary for the hydrodynamic model, calibration and validation NSE values were 0.93 and 0.94, respectively; results for the other mainstream stations are provided in Fig. S4 of the Supplement. The THREW model was used to simulate daily discharge for all tributaries flowing into the Mekong and the Tonle Sap Lake, providing critical boundary conditions for the hydrodynamic simulations described in Sect. 2.5.2. For the tributary stations with available observations, model performance was also strong, with NSE values ranging from 0.74 to 0.93; station-specific bias and mean relative error (MRE) values are provided in Fig. S5 of the Supplement.
2.5.2 Hydrodynamic model
To simulate flow propagation and water surface dynamics across the lower Mekong River-Tonle Sap-Delta system, we developed a three-dimensional (3D), grid-based hydrodynamic model using Delft3D-Flow (Deltares, 2025). The model domain spans from the Kratie gauging station in Cambodia to approximately 80 km offshore, encompassing the Tonle Sap Lake and River, the Cambodian floodplain, and the Vietnamese delta (Fig. 1b).
Given the meandering nature of the Mekong River and its distributaries, we adopted a spherical coordinate system to minimise discretization errors associated with angular distortion and to ensure the accurate representation of curved channel boundaries. The model employed the cyclic method for advection and the k–ϵ turbulence closure scheme, which is well suited for resolving complex three-dimensional flow structures in fluvial-estuarine systems (Morovati et al., 2023; Wu et al., 2024).
The Kratie station served as the primary upstream inflow boundary, where we imposed time-series discharge based on observed daily data. In addition, discharge time series for all major tributaries entering the Mekong mainstream or the Tonle Sap system were also defined as inlet boundaries. These were derived from a calibrated and validated physically based hydrological model (see Sect. 2.5.1). A vertically uniform flow profile was prescribed at the inflow boundaries. The downstream open boundary was defined approximately 80 km offshore, where tidal forcing was applied using nine dominant tidal constituents (M2, S2, K1, O1, N2, P2, K2, O2, and Q4). This tidal boundary ensured a realistic representation of tidal propagation and backwater effects from the sea into the Mekong estuarine system. The model was run with a 1 min time step.
The horizontal grid resolution varied from 20 m in river channels and Tonle Sap tributaries to 250 m in floodplains and offshore areas. A finer resolution was employed within the river network and lake system to accurately capture channel morphology and water level gradients, both of which are critical for simulating reverse flow phenomena and calculating travel times. The first simulation year was treated as a spin-up period and excluded from the analysis. Over the subsequent period, the model reproduced observed daily water levels and reverse flow characteristics with high skill at Prek Kdam and Kompong Luong stations, which were used for hydrodynamic model validation. For daily water levels, the comparison between simulated and observed values showed coefficient of determination (R2) and Nash–Sutcliffe efficiency (NSE) values exceeding 0.92 and 0.94 at both stations (Fig. S6 in the Supplement). The simulated reverse-flow onset and cessation dates differed from the observed dates by only 0–3 d (Table S3 in the Supplement). In addition, the simulated exchange discharge between the Mekong mainstream and Tonle Sap Lake at Prek Kdam showed high agreement with observations, with R2 ∼ 0.94, mean relative error (MRE) ∼ 14 %, and bias = −89 m3 s−1 (Fig. S7 in the Supplement). These results indicate that the developed model is suitable for simulating water levels, exchange discharge, and reverse-flow timing, and suggest limited sensitivity to initial conditions, confirming that a one-year warm-up period is sufficient for this application.
Around the Tonle Sap-Mekong confluence, many natural and artificial canals interact with the Mekong and Tonle Sap River, influencing overland flow exchange during both reverse and non-reverse flow periods. These lateral exchanges, which can exceed 5 km3 yr−1 (Kummu et al., 2014; Morovati et al., 2023), were fully incorporated into the hydrodynamic model. To represent these flows, we extracted canal networks using a machine learning-based remote sensing model developed by Zhao et al. (2025), supplemented by manual digitization from high-resolution satellite imagery (Fig. 1c). This enabled a more realistic representation of hydraulic connectivity between rivers, floodplains, and the lake. More details can be found in Zhao et al. (2025).
Bathymetry was derived from the surveyed cross-sections (spacing 300–3000 m) using the interpolation procedure described in Sect. 2.4 and mapped to the Delft3D curvilinear grid with Delft3D-QUICKIN (triangular interpolation with internal diffusion). Interpolation performance, assessed via leave-one-section-out cross-validation and independent-transect comparisons, achieved a root mean square error (RMSE) of 0.46 m and a median absolute error of 0.37 m.
2.5.3 Scenario implementation and annual DEM reconstruction
To isolate the contribution of sand-mining-driven incision from post-2010 hydrological alteration, we implemented paired fixed-bed and dynamic-bed hydrodynamic simulations for 2010–2024. In the post-dam fixed-bed simulation, observed Kratie discharge and tributary inflows for 2010–2024 were prescribed, but the riverbed was held at the reference morphology used for the pre-dam and transition simulations. This scenario therefore represents the effects of post-2010 dam regulation and climate variability on the Mekong–Tonle Sap hydraulic gradient without imposing additional channel incision.
In the post-dam + sand-mining simulation, the same hydrological boundary conditions were used, but the riverbed DEM was updated annually to represent progressive sand-mining-driven lowering of the active channel. Sand-mining forcing was applied to the Cambodian Mekong mainstream reach from Kratie to the Cambodia–Vietnam border and to the Mekong Delta distributary network. For the Cambodian mainstream reach, extraction was prescribed as a time-varying forcing consistent with published estimates: approximately 20 Mt yr−1 for 2010–2012, 30 Mt yr−1 for 2013–2016, a transitional interpolated value of approximately 37 Mt yr−1 in 2017, and 50 Mt yr−1 from 2018 onward (Hackney et al., 2021, 2025). Delta extraction was represented as a constant rate of approximately 45 Mt yr−1 (Ahmed et al., 2025).
Annual removal volumes were converted to equivalent incision depths over active-channel grid cells only, assuming a bulk sediment density of 1.6 t m−3; floodplain and non-channel cells were excluded. Within the active channel, most of the removal was allocated to the thalweg corridor, identified from the bathymetric surface as the deepest hydraulically connected pathway, with the remainder distributed over the residual active-channel area. This allocation does not assume that all mining occurs on the thalweg; rather, it represents the observed tendency for localized extraction pits and scour zones – including bank-adjacent extraction – to evolve into deeper conveyance pathways under persistent sediment deficit, flow focusing, and repeated dredging (Ahmed et al., 2025; Vu et al., 2025), while avoiding uniform lowering of the full computational domain. At the Mekong–Tonle Sap confluence, the reconstruction was further constrained by measured DEMs for 2013 and 2022 (Hackney et al., 2025): the 2014–2021 annual bed surfaces were required to lie between the two measured surfaces, and geometries for 2010–2012 and 2023–2024 were extrapolated using the same extraction rates. The annually updated bed elevations were imported into Delft3D-QUICKIN to interpolate them onto the computational grid (depth points at grid-cell corners). The reliability of this reconstruction was evaluated against independent observations: the post-dam + sand-mining simulation reproduced daily observed water levels at Chaktomuk, at the Mekong–Tonle Sap confluence, with an NSE of approximately 0.92–0.95 (Fig. S8 and Table S4 in the Supplement), indicating that the annually updated bed geometries capture the evolving stage–discharge behaviour at this hydraulically critical junction.
By comparing the post-dam fixed-bed and post-dam + sand-mining simulations, we quantified the added effect of channel incision on reverse-flow onset, cessation, and lag-adjusted Kratie discharge thresholds.
2.5.4 Response time model
To quantify the time lag between discharge at Kratie and its impact at the Mekong-Tonle Sap confluence, we developed a response time model embedded within the hydrodynamic framework described in Sect. 2.5.2.
The concept of response time, also referred to as water age, reflects the transit time required for water parcels to travel from a specified upstream point to a downstream target location (Morovati et al., 2024b). It characterizes the average residence time of water traveling from the Kratie station (inlet boundary) to the Mekong-Tonle Sap confluence. This metric inherently accounts for spatial heterogeneity in flow velocity and channel morphology and thus provides a physically meaningful measure of hydrodynamic connectivity (Wu et al., 2024).
We implemented a 3D response time (age) model using an Eulerian framework, following the methodology of Shi et al. (2023). Within this framework, a virtual passive tracer–assumed to be neutrally buoyant and non-reactive–was continuously injected at the inlet boundary (Kratie). This tracer does not alter water density or momentum fields and is solely used to track water mass movements (Morovati et al., 2024b). The response time (a) at a given location is defined as the average elapsed time since the tracer particles first exited the inlet, weighted by their mass.
The evolution of tracer concentration C and age concentration α is governed by coupled advection–diffusion equations derived from mass conservation:
In these equations, uh is the horizontal velocity vector, w is the vertical velocity, Dh and Dv are the horizontal and vertical turbulent diffusivities, respectively, and ∇h denotes the horizontal vector differential operator. The source term C in Eq. (2) accounts for the continuous ageing of the tracer. The mean response time, a, is then calculated as the ratio of age concentration to tracer concentration, .
2.5.5 Hurst exponent: Long-term memory of flow
To quantify the persistence or memory of discharge fluctuations over time, we computed the Hurst exponent (H) using the Rescaled Range () method, a widely used method in hydrological studies (Khan et al., 2025). The Hurst exponent captures the degree of autocorrelation and long-range dependence in time series, with H>0.5 indicating persistence, H<0.5 signifying anti-persistence, and H∼0.5 denoting stochastic behavior. The discharge time series Qt is divided into multiple non-overlapping segments of equal length n, spanning a wide range of scales. For each segment, the series is mean-centered and transformed into a cumulative deviation series (Eq. 4), where is the mean discharge of the segment.
The rescaled range is then calculated for each segment (Eq. 5):
Then, the average is plotted as a function of window size n in log-log space (Eq. 6)
The slope of the best-fit line yields the Hurst exponent This method was implemented using the Hurst Python Package.
2.5.6 Richards-Baker Flashiness Index (RBI): High-Frequency Variability
The Richards-Baker Flashiness Index (RBI) was used to evaluate the short-term variability and flow “flashiness” of the discharge series and sub-daily water levels. It is a measure of how quickly and how much streamflow rises and falls in response to watershed input (Gannon et al., 2022). RBI is calculated as:
where Qi is the daily discharge on day i, and n is the number of valid observations. RBI values range from 0 (completely stable flow) to >1 (highly variable, flashy flows). This metric captures the magnitude and frequency of day-to-day discharge changes, allowing assessment of how dam regulation has attenuated or enhanced hydrograph variability.
2.5.7 Coefficient of Variation (CV): Interannual discharge variability
To assess changes in relative flow variability across the basin, we computed CV for each station and time period as (Blöschl and Sivapalan, 1997; Li et al., 2025):
where σQ and μQ denote the standard deviation and mean of daily discharge, respectively. This dimensionless index provides a standardised measure of variability that facilitates comparisons between stations with differing flow magnitudes.
2.5.8 Sub-daily water-level variability metrics
Sub-daily water level variability was quantified using three complementary metrics derived from 1 min water-level records (available from 2018 onward). For each day d, amplitude (A) was defined as the daily range of sub-daily water levels (WL):
Monthly amplitude was computed as the mean of Ad over all days in the month. Sub-daily flashiness was computed using the Richards-Baker formulation, substituting water level for discharge and applying the calculation within each calendar month:
where WLi denotes consecutive 1 min observations within the month, and n is the number of valid records. This yields a dimensionless index of intramonth sub-daily variability. Peak count was defined as the number of positive hourly water level rises exceeding a threshold of 0.05 m h−1 (i.e., 5 cm h−1), following the rate-of-change guidance referenced by the MRC (MRC, 2020). The 1 min series was resampled to hourly water levels. Daily peak count was reported as events per day and aggregated to monthly values by averaging across days.
3.1 Model validation
The performance of the THREW and Delft3D-Flow models was evaluated across multiple hydrological stations. The THREW model reproduced daily discharge at eight Mekong mainstream stations, with validation NSE values ranging from 0.77 to 0.94. The Delft3D-Flow model reproduced observed water levels at Prek Kdam and Kompong Luong with NSE values exceeding 0.94. Detailed validation results are provided in Sects. S3 and S4 of the Supplement.
3.2 Multi-scale streamflow alterations under dam regulation and climate change
Figure 2 summarises the spatiotemporal evolution of discharge dynamics across eight mainstream stations from Chiang Saen to Kratie. The top row shows observed changes across three hydrological periods, while the bottom row compares measured conditions with a no-dam counterfactual for the post-dam era (2010–2024). All metrics are derived from the daily discharge series. The no-dam daily discharge series for 2010–2024 is taken from the THREW model simulations.
Flow memory (Hurst exponent, H) captures long-range persistence in daily discharge variability (Fig. 2a). H is highest upstream and generally decreases downstream across all periods, but the upstream-downstream contrast strengthens in the post-dam era. For example, H increases at Chiang Saen from ∼ 0.58 (pre-dam) to ∼ 0.69 (post-dam), whereas Kratie decreases from ∼ 0.53 to ∼ 0.47. The post-dam comparison between observations and no-dam simulations confirms that the increase in persistence is concentrated in the regulated upper reach: measured H exceeds the no-dam case at upstream stations (e.g., Chiang Saen: 0.69 vs 0.56), while differences are small and can reverse in the lower basin (e.g., Kratie: 0.47 vs 0.48) (Fig. 2d). The measured-versus-no-dam comparison is consistent with reservoir regulation strengthening flow persistence in the upper reach, whereas increasing contributions from downstream tributaries and adjacent floodplains modulate – and may partly offset – this signal toward the lower basin.
Daily flashiness (RBI) quantifies day-to-day discharge fluctuations (Fig. 2b). RBI is consistently largest at the upstream station (Chiang Saen) and decreases toward the mid-lower basin in all periods, with values on the order of ∼ 0.03–0.07. Across periods, RBI increases modestly at the upstream stations (e.g., Chiang Saen: ∼ 0.060 pre-dam to ∼ 0.065 post-dam), but declines at downstream stations (e.g., Kratie: ∼ 0.043 to ∼ 0.036), indicating spatially heterogeneous changes in day-to-day variability (Fig. 2b). In the post-dam comparison between observations and the no-dam simulation, measured RBI is higher than the no-dam counterfactual at all stations, with the strongest relative increase upstream (e.g., Chiang Saen: 0.065 vs 0.039; Chiang Khan: 0.050 vs 0.033) (Fig. 2e). This model-based comparison suggests that, at the daily scale, regulation is associated with enhanced day-to-day fluctuations relative to the counterfactual hydrograph, while the magnitude of this effect weakens downstream.
Amplitude variability (coefficient of variation, CV) reflects the combined seasonal and interannual variability of daily discharge (Fig. 2c). CV is high in the pre-dam and transition periods and tends to increase downstream, but it declines substantially in the post-dam era at upstream sites (e.g., Chiang Saen: ∼ 0.77 pre-dam to ∼ 0.52 post-dam; Chiang Khan: ∼ 0.85 to ∼ 0.71), consistent with the combined influence of attenuated wet-season peaks, enhanced dry-season flows, dam regulation and climate variability. The post-dam comparison between observations and no-dam simulations supports this interpretation in the upper reach (e.g., Chiang Saen: 0.52 vs 0.68; Chiang Khan: 0.71 vs 0.81; Nong Khai: 0.74 vs 0.81), whereas differences are small downstream (e.g., Mukdahan-Kratie) (Fig. 2f), consistent with attenuation of the regulation signal and increasing influence of tributary inflows and floodplain dynamics in the lower basin.
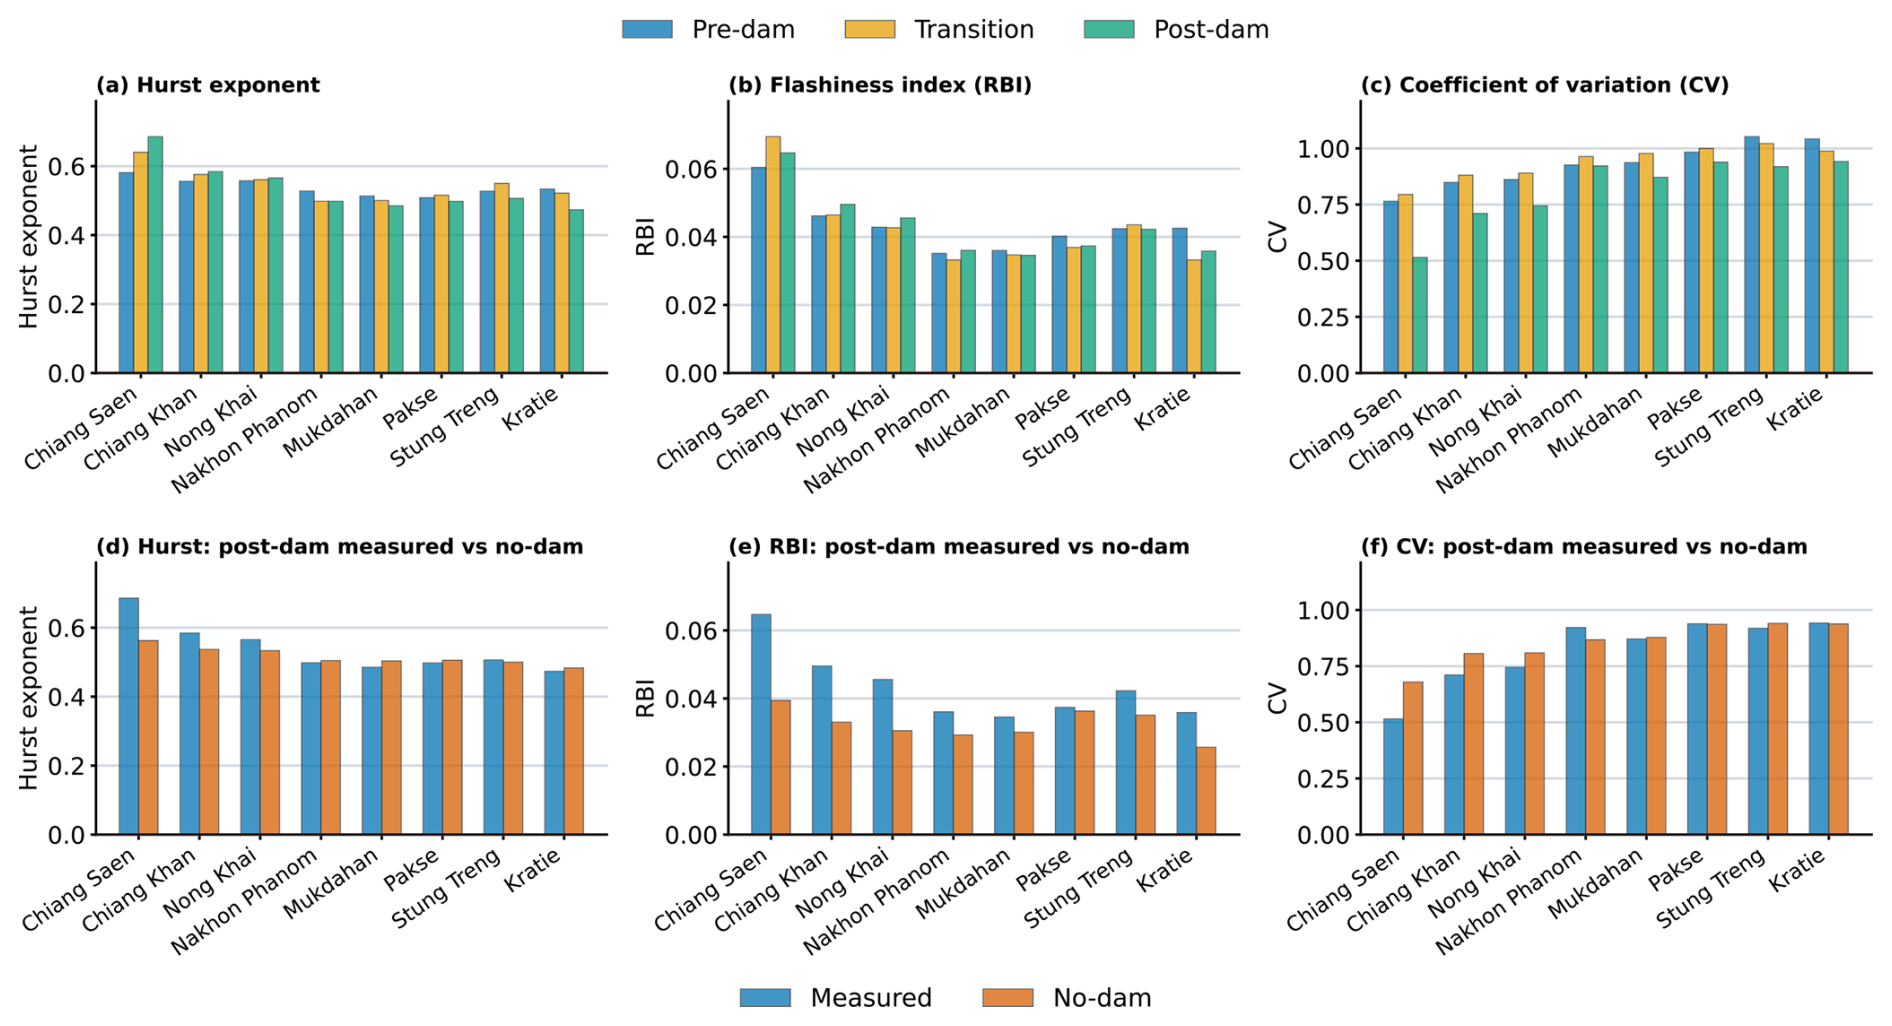
Figure 2Spatial variation in streamflow memory, flashiness and relative variability along the Mekong mainstream under observed and no-dam conditions. Grouped bar plots summarise hydrological characteristics at eight mainstream stations from Chiang Saen to Kratie. The top row compares the pre-dam (1976–1991), transition (1992–2009) and post-dam (2010–2024) periods in terms of (a) the Hurst exponent, representing long-term flow memory; (b) the Richards–Baker flashiness index (RBI), representing day-to-day discharge fluctuations; and (c) the coefficient of variation (CV), representing the relative variability of daily discharge over each analysis period. The bottom row compares measured post-dam conditions with the no-dam counterfactual simulated using the THREW hydrological model for (d) the Hurst exponent, (e) RBI, and (f) CV. Differences among stations indicate spatially heterogeneous changes in flow-regime characteristics along the mainstream rather than a direct measure of inter-station flow synchrony.
3.3 Spatial patterns of sub-daily flow variability
Figure 3 illustrates sub-daily water level dynamics at three representative mainstream stations–Chiang Saen (CS; Fig. 3a–c), Mukdahan (MD; Fig. 3d–f), and Kratie (KR; Fig. 3g–i) – using three complementary metrics: (i) amplitude, defined as the intraday water level range (daily max-min; m), (ii) flashiness (RBI) computed from sub-daily water level changes, and (iii) peak count, defined as the mean number of hourly water-level rises ≥5 cm h−1 per day. The 5 cm h−1 threshold follows MRC guidance as a rate-of-change level above which ecological impacts may increase (MRC, 2020).
Amplitude exhibits a consistent wet-season intensification across the three stations, but with station-specific magnitude and timing (Fig. 3a, d, g). At CS, amplitudes increase markedly during the wet season (typically June–September), with notable high-variability months including July 2021 (∼ 0.48 m) and August–September 2024 (∼ 0.40–0.46 m), while many dry-season months remain comparatively muted. At MD, amplitudes are generally lower and more moderate, but still strengthen during wet-season months (commonly July-September), reaching ∼ 0.2–0.3 m in several years. At KR, the wet-season signal is more pronounced and can extend into the late wet season, culminating in a strong event in September 2019 (∼ 0.77 m). The corresponding matrices for the remaining stations (Chiang Khan (CK), Nong Khai (NK), Nakhon Phanom (NP), Pakse (PA), Stung Treng (ST)) show that larger amplitudes can occur at mid-reach stations in particular years/months (Supplement Fig. S9), reinforcing that sub-daily variability is spatially heterogeneous and episodic.
Flashiness (RBI) broadly tracks the occurrence of rapid intraday changes but highlights the intermittency of short-lived fluctuation episodes (Fig. 3b, e, h). RBI at CS is generally low but displays distinct episodic enhancements, including a prominent increase in February 2022 (∼ 0.004) and elevated wet-season values during months of higher amplitude (e.g., July 2021). At MD, RBI remains low for many months but includes isolated months with higher values (e.g., late 2019 and early 2021), indicating that rapid fluctuations can emerge intermittently even when typical conditions are relatively smooth. At KR, RBI is usually low but increases during months with stronger wet-season dynamics, including September 2019 (∼ 0.0017) and June 2020 (∼ 0.0017), consistent with periods of intensified intraday variability. Supplement Fig. S9 indicates that some mid-mainstream stations can reach substantially higher RBI in specific wet-season months, underscoring the episodic nature of flashiness along the reach.
The peak count metric isolates where rapid hourly rises are frequent and shows that exceedances of the 5 cm h−1 threshold are seasonally concentrated and event-driven rather than pervasive (Fig. 3c, f, i). At CS, peak counts are zero in many months but rise sharply during certain wet-season months, including July 2021 (∼ 2.0 events per day) and August–September 2024 (∼ 1.3-1.4 events per day). At MD, exceedances are rarer overall and typically confined to isolated wet-season months (e.g., July 2018 and August 2020), indicating fewer frequent rapid-rise events than at CS and KR. At KR, exceedances can be both larger and more frequent in the wet season, with a major episode in September 2019 (∼ 4.4 events per day) and elevated activity in June 2020 (∼ 2.6 events per day). Across the full station set (Supplement Fig. S9), the most frequent exceedances occur at selected mid-reach stations during particular wet-season months, highlighting strong spatial clustering of rapid water-level rises.
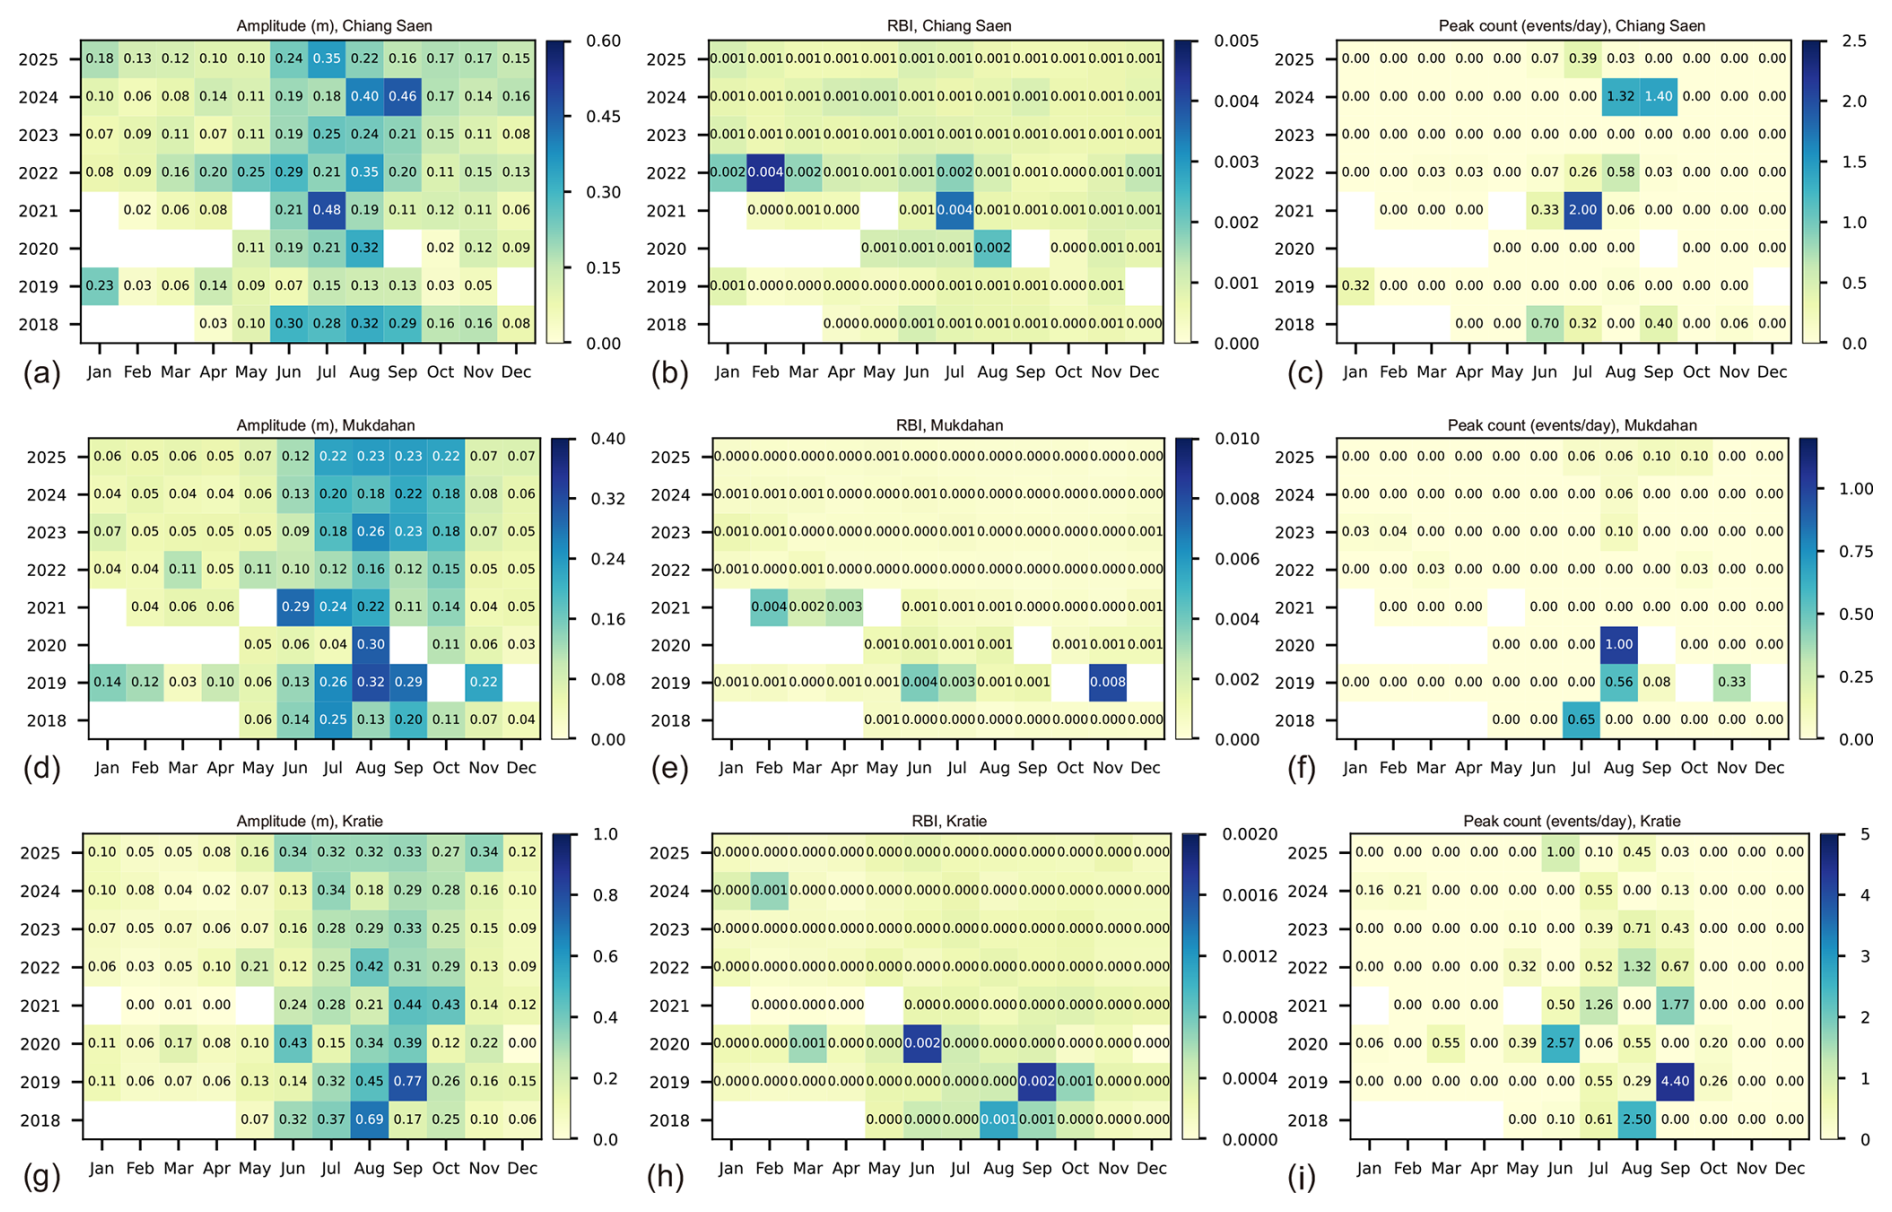
Figure 3Sub-daily water level variability at three representative Mekong mainstream stations (2018–2025). Sub-daily dynamics are quantified from 15 min water level observations using three complementary metrics: intraday amplitude (daily max-min water level, m), flashiness (Richards-Baker Flashiness index, RBI, computed from sub-daily water-level changes), and peak count (mean number of hourly water-level rises ≥5 cm h−1 events per day). Panels (a)–(c) show Chiang Saen (CS); panels (d)–(f) show Mukdahan (MD); and panels (g)–(i) show Kratie (KR). Each panel displays monthly values by year; numbers denote the metric value for that station-month. Blank cells indicate months without available 1 min water level records. Results for the remaining mainstream stations (Chiang Khan, Nong Khai, Nakhon Phanom, Pakse, and Stung Treng) are shown in Supplement, Fig. S9.
3.4 Changes in annual discharge extremes and their timing
A pronounced reduction in annual peak discharge is evident at several stations following upstream dam development (Fig. 4a). At Chiang Saen, which reflects transboundary inflow from the Lancang cascade, the median peak flow declined by ∼ 40 %, from ∼ 10 850 m3 s−1 in the pre-dam period to ∼ 6490 m3 s−1 in the post-dam era. Similar, though less pronounced, reductions in median peak discharge are observed at Chiang Khan and Nong Khai, where values declined by approximately 11.4 % and 8.4 %, respectively, from the pre-dam to post-dam period. These trends reflect attenuated flood pulses downstream of the Chinese cascade and possibly early regulatory effects from tributary inflows. In contrast, Nakhon Phanom exhibited a 9.6 % increase in peak discharge, suggesting localized hydrological intensification, potentially influenced by regional rainfall variability or unregulated tributary contributions. At Kratie – a hydrologically strategic station controlling the Mekong inflow to the Tonle Sap River and lake during the wet season months – the median annual peak discharge declined from ∼ 38 300 m3 s−1 in the pre-dam period to 34 700 m3 s−1 in the post-dam period, representing a 9.4 % reduction.
Conversely, annual minimum discharges exhibit a consistent increasing trend across all stations, particularly during the post-dam period (Fig. 4c). At Chiang Saen, the median minimum discharge rose from approximately 748 m3 s−1 in the pre-dam period to 997 m3 s−1 in the post-dam period–an increase of 33.3 %, reflecting enhanced baseflow likely sustained by regulated dam releases. This upward trend is even more pronounced downstream. At Stung Treng, minimum flow increased from 1565 to 2820 m3 s−1, an 80.2 % increase. Most notably, at Kratie, minimum discharge surged from 1326 m3 s−1 in the pre-dam period to 2880 m3 s−1 in the post-dam period, marking an increase of 117.2 %. These increases in dry-season flow are consistent with the combined effects of mainstream and tributary reservoir storage, regulated releases, climate variability, and other changes in basin water management, all of which can compress the seasonal amplitude of Mekong River discharge and alter floodplain and Tonle Sap hydro-ecological dynamics.
In the pre-dam period, peak flows generally occurred between early August and early September across all stations, aligned with the core of the monsoon season (Fig. 4b). Peak-flow timing shifted systematically later during the post-dam period, reflecting the combined influence of altered monsoon conditions, reservoir operations and changing tributary contributions. Peak flow timing at most stations has shifted by approximately 10–20 d later. At Kratie, the median day of peak flow occurred around late August, whereas in the post-dam period, this timing has shifted to approximately mid-September.
The timing of annual minimum flows has consistently advanced across all stations along the Mekong mainstream (Fig. 4d). At Kratie, for example, the timing of median minimum discharge shifted from early April (10 April) to mid-March in the post-dam period, an advancement of nearly a month. Similar shifts are observed throughout the basin, with Chiang Saen advancing from 25 March to 2 March, Chiang Khan from 9 April to 14 March, and Stung Treng from 9 April to 11 March. These 3–4-week advancements in low-flow timing indicate a system-wide shift in hydrological seasonality during the post-dam period, potentially reflecting both changes in monsoon timing and reservoir operating patterns across the upper and lower Mekong basin.
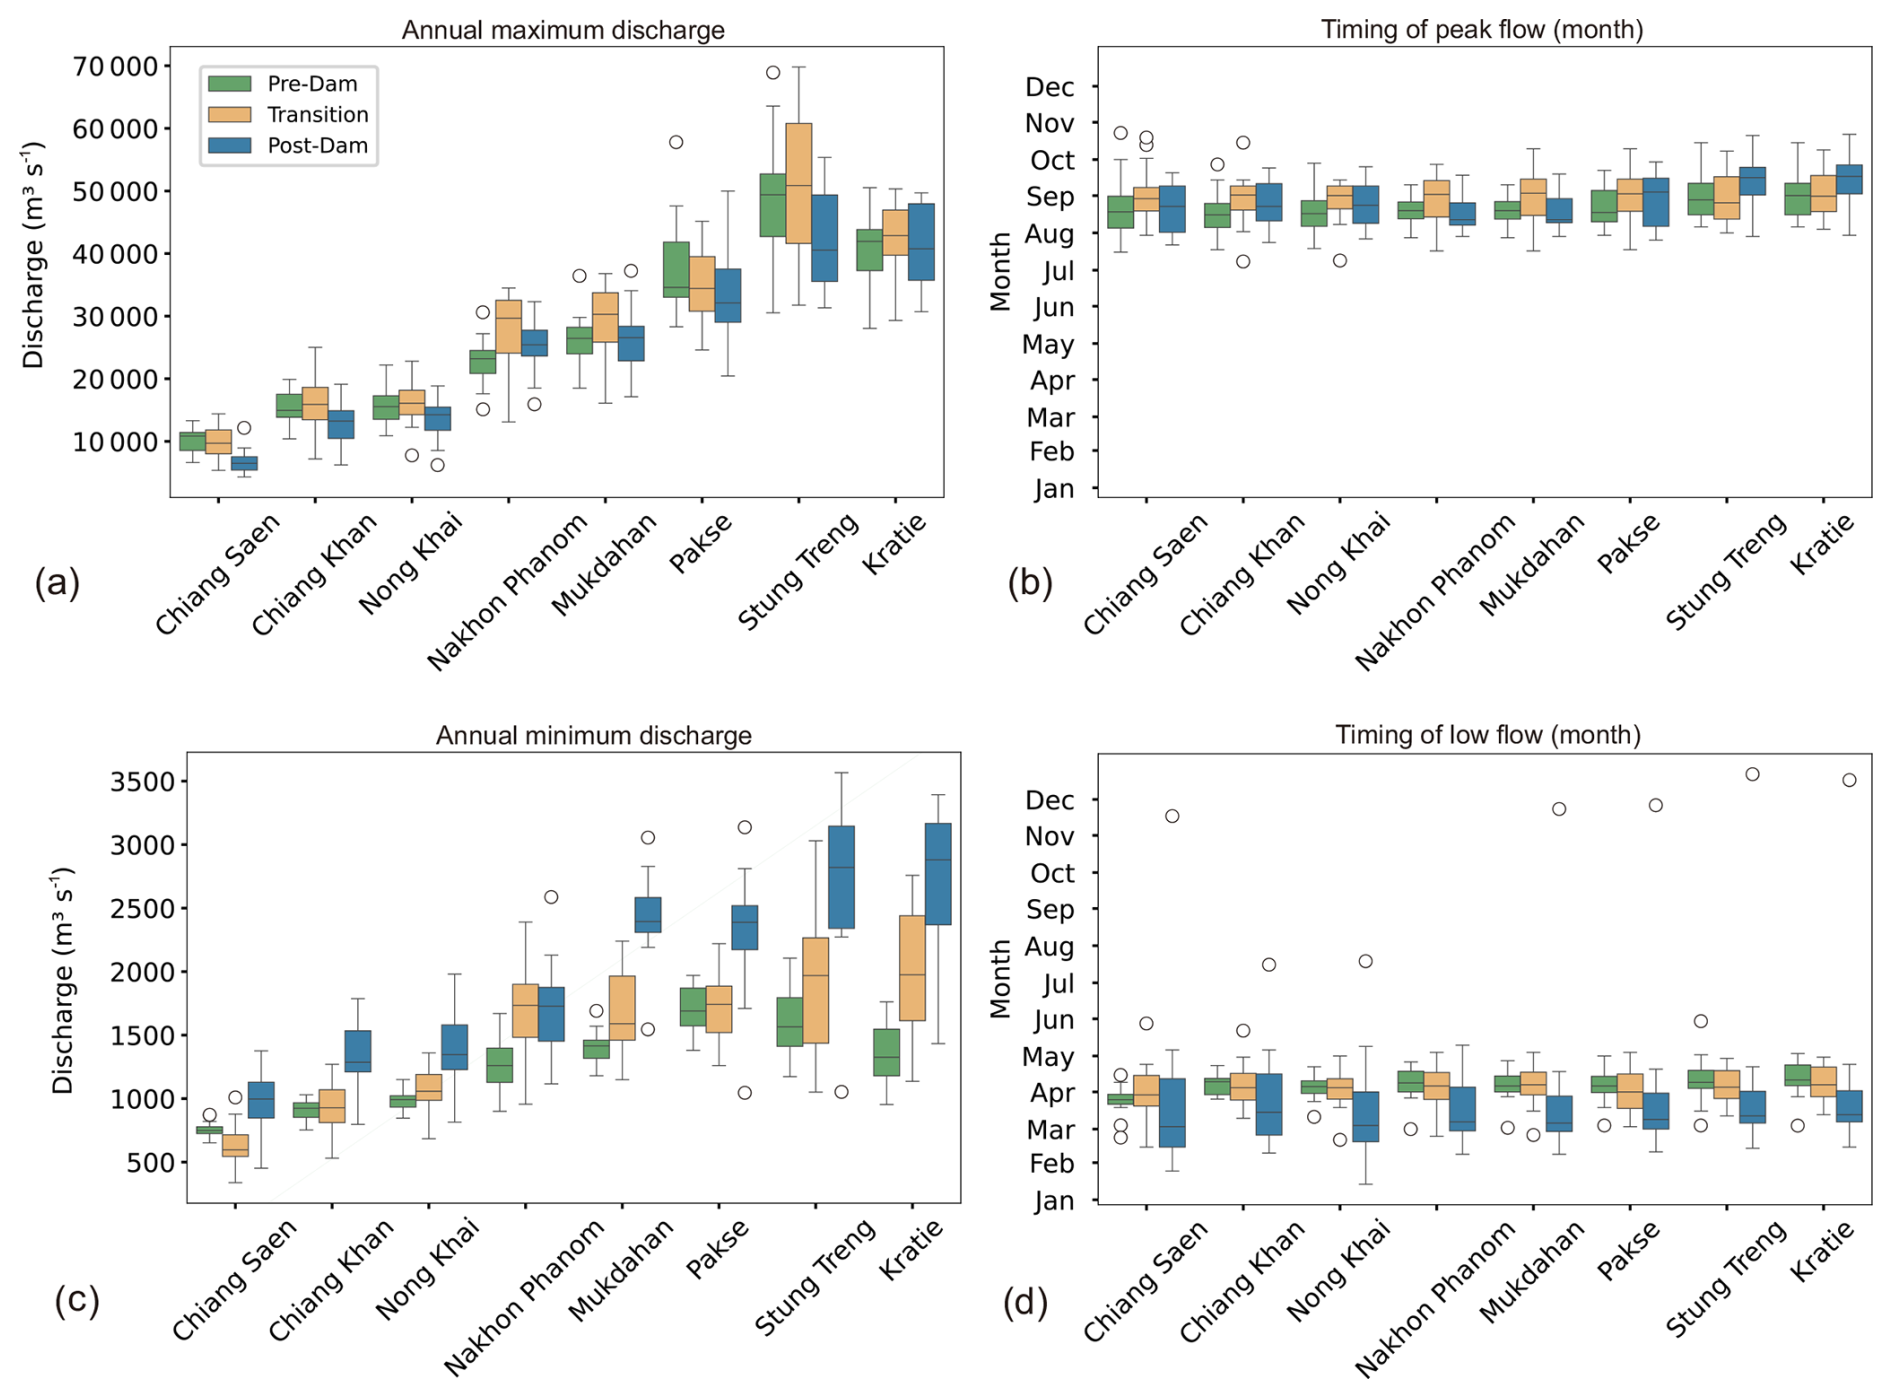
Figure 4Alterations in annual discharge extremes and their timing across the Mekong mainstream. Boxplots show the spatial and temporal evolution of (a) annual maximum daily discharge, (b) timing of annual maximum discharge, (c) annual minimum daily discharge, and (d) timing of annual minimum discharge. For each station and period, the central line indicates the median, boxes span the interquartile range (IQR; 25th–75th percentiles).
3.5 Lag-adjusted Kratie discharge thresholds for reverse flow onset and cessation
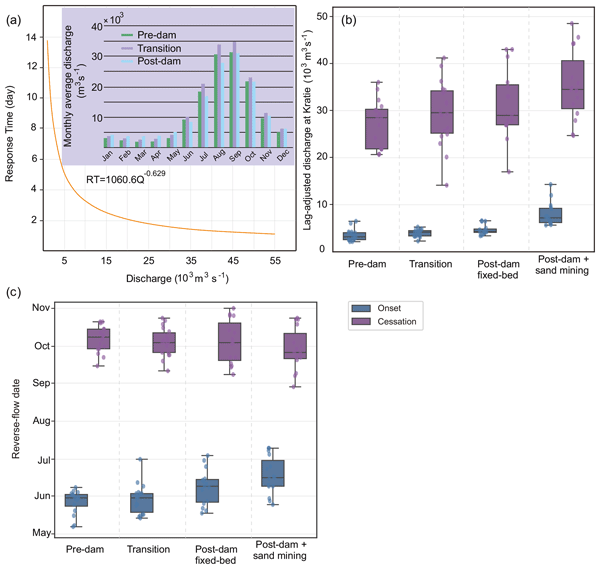
Here, “threshold” denotes the lag-adjusted Kratie discharge associated with the observed onset and cessation of reverse flow, used as an operationally interpretable proxy for hydraulic conditions at the confluence. It is therefore influenced by local stage-discharge relations (including incision effects) and by the timing-dependent head difference between the mainstream and the lake, rather than representing a fixed geometric constant. Figure 5a shows (i) the nonlinear discharge-travel time relationship between Kratie and the Mekong-Tonle Sap confluence and (ii) period-specific differences in the monthly discharge regime. The fitted power-law relationship between response time (RT) and discharge (Q) () indicates that travel time decreases rapidly with increasing discharge; during the wet season's peak discharges (June–November), flows at Kratie typically reach the confluence within ∼ 1–3 d. The inset monthly hydrograph further indicates that the post-dam period exhibits a more peaked seasonal pattern, with reduced early wet season discharge (June–July) and a more abrupt rise toward the seasonal maximum. September remains the peak month across all periods.
Figure 5b presents the lag-adjusted discharge thresholds at Kratie associated with the onset (rising limb) and cessation (recession limb) of reverse flow into the lake across the four scenarios. Onset thresholds rise progressively across the hydrological and geomorphic scenarios: from a median of 3.18 × 10³ m3 s−1 (interquartile range (IQR); 2.59–4.06) in the pre-dam period (1976–1991), to 4.30 × 10³ m3 s−1 (IQR; 4.14–4.85) in the post-dam fixed-bed scenario (2010–2024 hydrology with reference morphology) – about 35 % above the pre-dam baseline – and to 7.21 × 10³ m3 s−1 (IQR; 6.22–9.24) under the combined post-dam + sand-mining (channel-incision) scenario, a further ∼ 68 % increase (∼ 127 % above the pre-dam baseline); the transition period (1992–2009) is intermediate. The onset-threshold interquartile ranges for the pre-dam, post-dam fixed-bed and post-dam + sand-mining scenarios are essentially non-overlapping, indicating that this tightening is a systematic shift rather than an artefact of a few extreme years. Cessation thresholds behave differently: the median end-of-reverse-flow discharge is nearly identical in the pre-dam (28.52 × 10³ m3 s−1; IQR; 21.88–30.29) and post-dam fixed-bed (29.00 × 10³ m3 s−1; IQR; 27.00–35.50) periods – a difference below 2 % – with heavily overlapping interquartile ranges, and rises materially only under the post-dam + sand-mining scenario, to 34.52 × 10³ m3 s−1 (IQR; 30.42–40.62; individual years approaching 48 × 103 m3 s−1), ∼ 21 % above the pre-dam baseline. The two limbs thus respond asymmetrically across scenarios: the onset threshold is already elevated in the post-dam period, whereas the cessation threshold rises appreciably only once sand-mining incision is added.
Figure 5c shows the corresponding timing of reverse flow. In the pre-dam period, onset occurred in late May (median 31 May, IQR 24 May–2 June) and cessation in early October (median 9 October, IQR: 29 September–15 October). Under the post-dam + sand-mining scenario, onset shifted about 16 d later (median 16 June, IQR: 9–30 June) and cessation about 13 d earlier (median 26 September, IQR: 21 September–12 October). The net effect is a progressive shortening of the reverse-flow season, from a median of 132 d in the pre-dam period to 113 d post-dam fixed-bed scenario and 104 d under post-dam + sand mining – a 28 d contraction relative to the pre-dam baseline, driven by both delayed onset and earlier cessation. Because onset, cessation, and season length are each summarized by their own medians across years, the season-length contraction (28 d) need not equal the sum of the separate onset and cessation shifts (∼ 16 and ∼ 13 d). This earlier cessation coincides with the elevated cessation-discharge threshold in Fig. 5b: reverse flow terminates while mainstream discharge remains comparatively high, consistent with a narrowed seasonal connectivity window between the Mekong mainstream and Tonle Sap Lake rather than with attribution to any single driver.
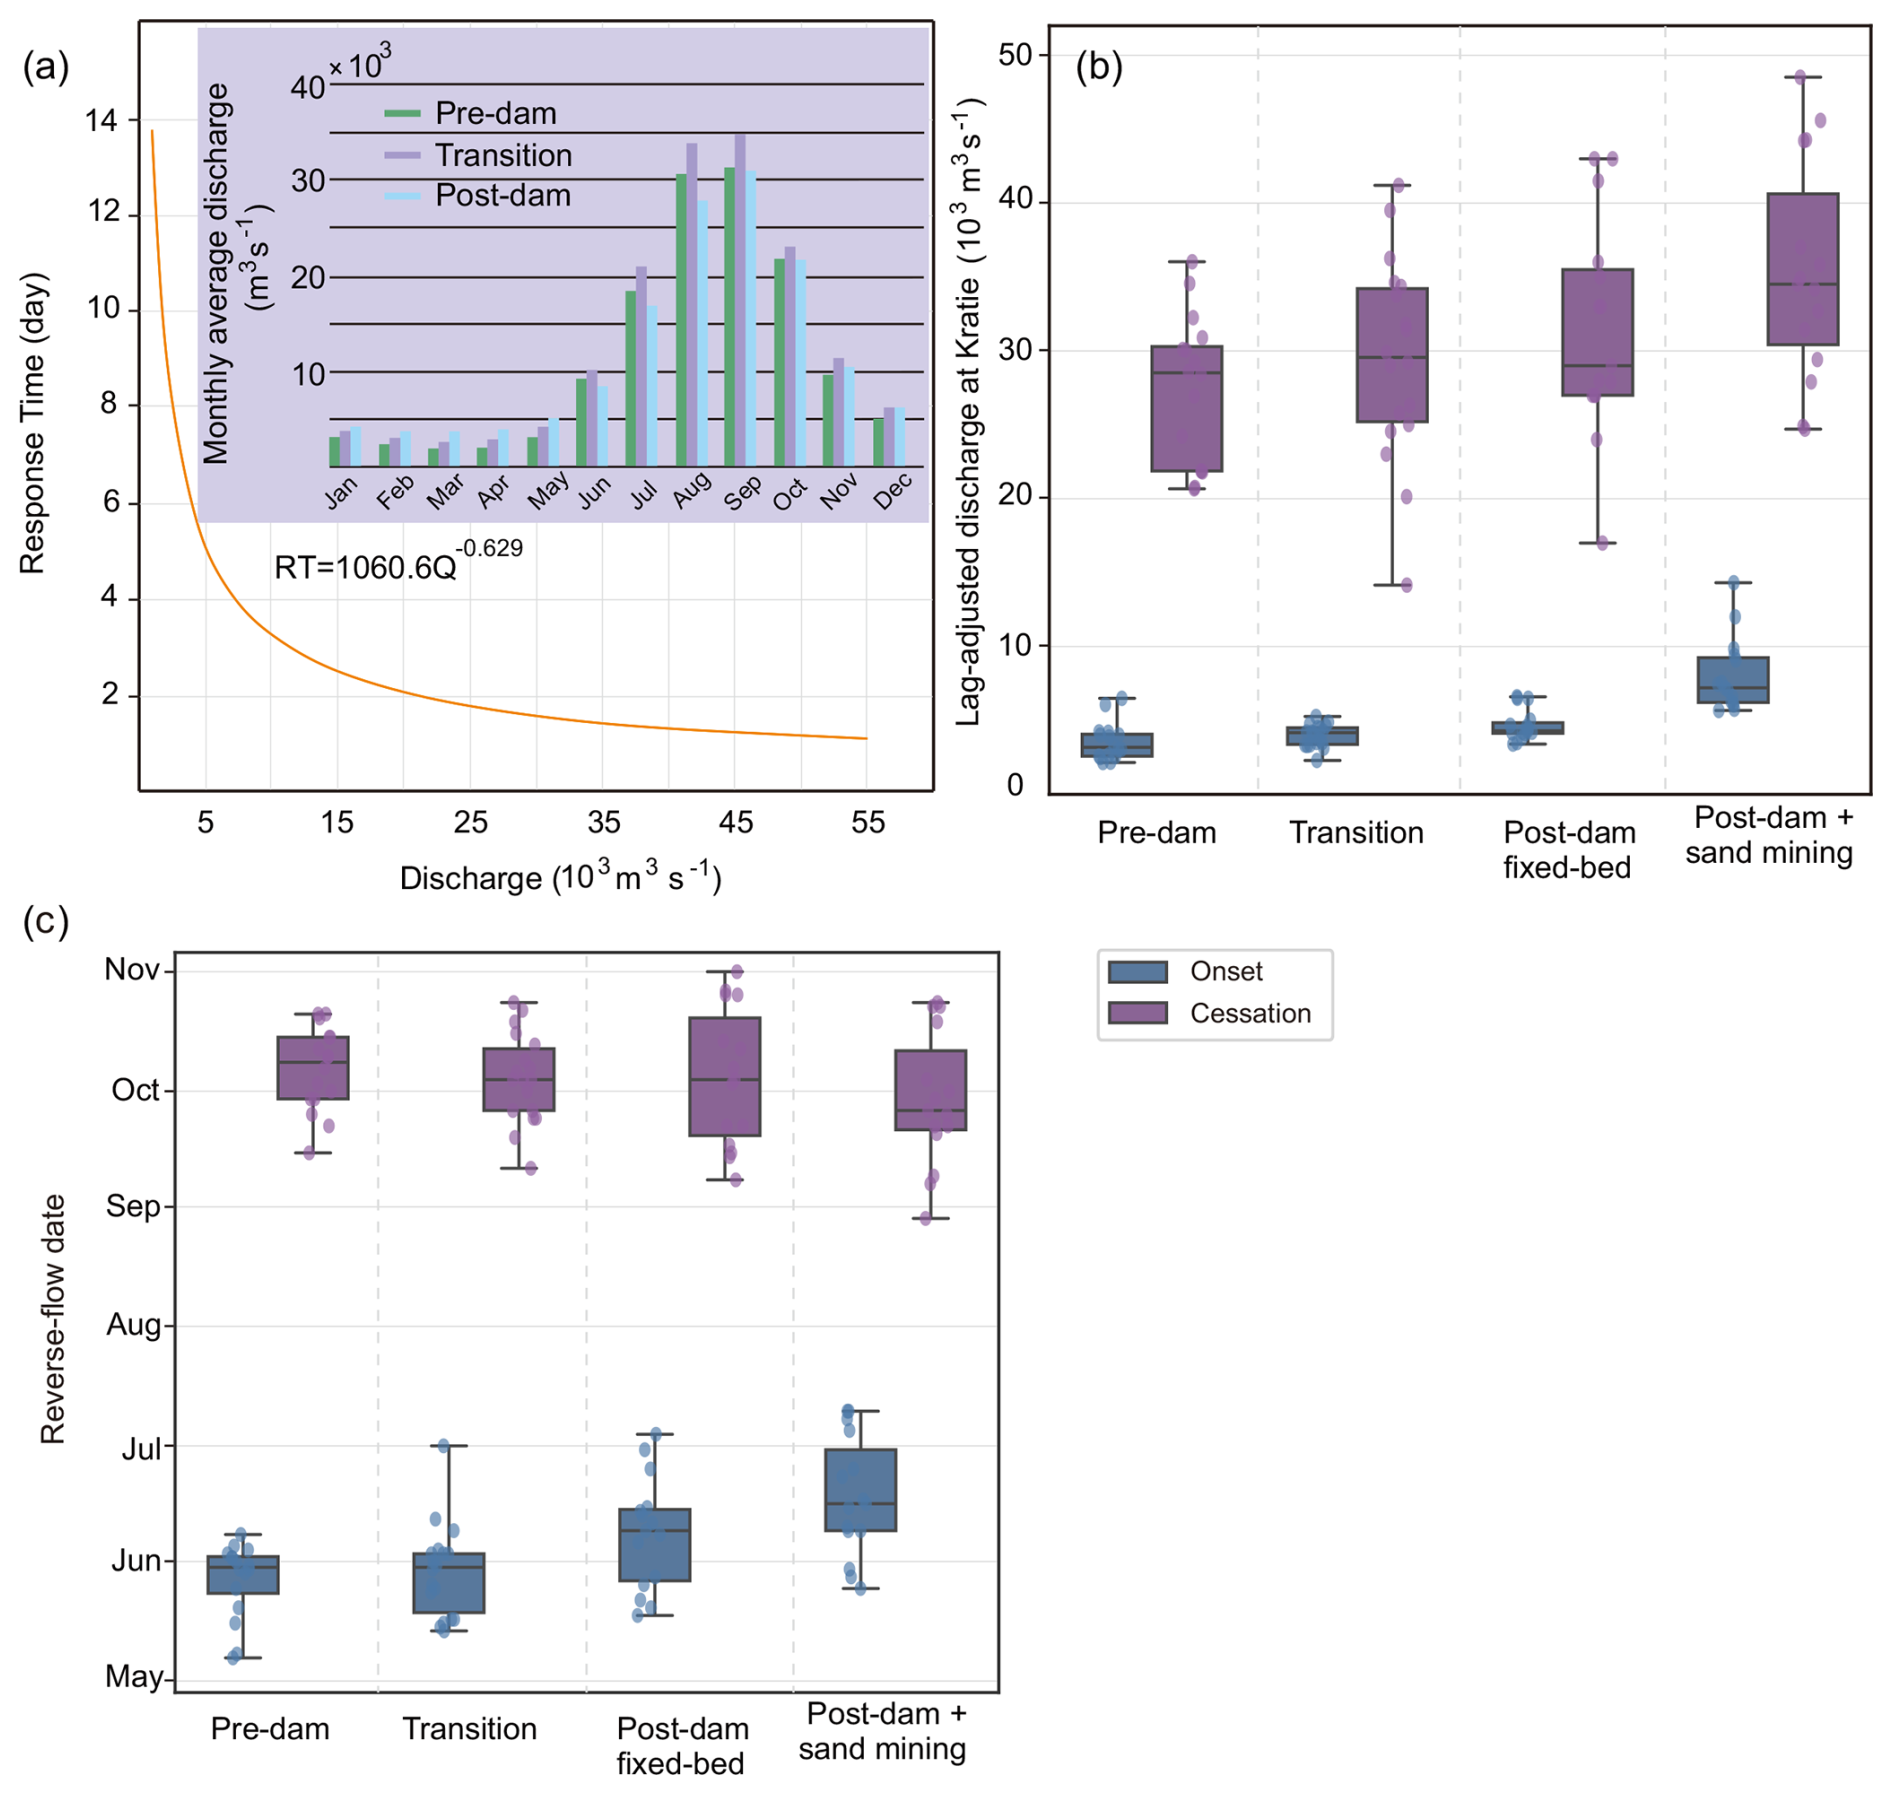
Figure 5(a) Estimated response times (days) for Kratie discharge to reach the Tonle Sap-Mekong confluence, overlaid with monthly average discharge at Kratie. (b) Lag-adjusted discharge thresholds at Kratie corresponding to the onset (left) and cessation (right) of reverse flow into the Tonle Sap Lake. (c) Timing of reverse flow onset (left) and cessation (right). Note that historical data on the Tonle Sap Lake's reverse flow period are available from 1997 onward (https://pmfm.mrcmekong.org/monitoring/6b/, last access: 16 July 2025). Consequently, we reconstructed the reverse-flow periods from 1976 to 1996 using the hydrodynamic model described in Sect. 2.5.2 and validated as detailed in Sect. S4 of the Supplement.
Large regulated monsoonal rivers can exhibit substantial changes in flow magnitude, but our results indicate a broader reorganisation of Mekong hydrology during the post-dam period: (i) dampening of the seasonal discharge envelope and altered early wet-season rise in the upper mainstream, alongside higher persistence and modest changes in day-to-day flashiness, (ii) altered spatiotemporal coherence along the mainstream, and (iii) a measurable shift in the hydraulic conditions governing the Tonle Sap reverse flow. These changes occurred during a period of rapid dam development, climate variability, and intensified local channel modification and collectively indicate a progressive departure from the historical flood-pulse regime supporting floodplain–lake connectivity and productivity in the lower Mekong–Tonle Sap system.
A central contribution of this study is the response-time (travel time) alignment between Kratie and the Mekong-Tonle Sap confluence, which enables onset/cessation thresholds to be interpreted as properties of the coupled river-lake system rather than as station-specific statistics. This framing also helps reconcile why the downstream reach remains monsoon-driven even as upstream reaches show pronounced regulation: tributary inflows partly preserve seasonal variability downstream (Zhang et al., 2023; Morovati et al., 2024b), but they do not fully restore the early wet season rise and hydraulic gradients that historically initiated and sustained reverse flow.
4.1 Fragmentation across daily to sub-daily scales
The daily-metric synthesis indicates a spatially heterogeneous reorganisation of flow characteristics during the post-dam period rather than a uniform damping of variability. At Chiang Saen, persistence increases while discharge variability decreases (CV), consistent with seasonal flow redistribution and flood-peak attenuation, whereas daily flashiness (RBI) increases modestly. The measured-versus-no-dam comparison suggests that reservoir regulation contributes to this combination by smoothing the seasonal envelope while introducing shorter-term irregularity through storage-and-release sequencing. Farther downstream, tributary inflows partly preserve seasonal contrasts, and the influence of the upper-basin regulation signal becomes progressively less distinct.
These changes are hydrologically meaningful because many floodplain processes respond to the rate of rise, onset timing, and duration of high water conditions (Poff et al., 2007; Bunn and Arthington, 2002; Lamberts and Koponen, 2008; Sabo et al., 2017; Zhang et al., 2026), not only to seasonal totals. In the Tonle Sap system, timing-related controls influence floodplain access, the predictability of seasonal cues, and the window over which connectivity enables exchange of water, sediment, and nutrients (Baran and Myschowoda, 2009; Arias et al., 2014; MRC, 2017; Dudgeon, 2019). The observed sub-daily water level variability further indicates that intraday fluctuations can represent an additional layer of disturbance. Although direct attribution is limited without operational release data, the patterns are consistent with hydropeaking behavior reported downstream of hydropower cascades (MRC, 2020), where rapid ramping can impose ecological stress through repeated short-duration rises and falls (Toffolon et al., 2010; Bozeman et al., 2025; Hayes et al., 2025). Notably, sub-daily variability is spatially heterogeneous and metric-dependent rather than monotonically damped downstream: for example, Kratie exhibits comparatively low sub-daily RBI but can still experience frequent rapid hourly rises during specific wet-season months (e.g., September 2019), underscoring the episodic nature of hydropeaking-relevant ramping.
4.2 Reverse flow threshold shifts and mechanistic interpretation
The most consequential system-level signal is the contraction and retiming of the Tonle Sap reverse flow, expressed here as higher lag-adjusted discharge thresholds for onset and cessation and a shorter reverse flow season. Because reverse flow governs lake expansion and floodplain inundation (Ng and Park, 2021; Morovati et al., 2023; Zhang et al., 2026), these shifts imply reduced duration of strong Mekong-lake connectivity, with likely consequences for sediment and nutrient exchange and for the seasonal availability of floodplain habitat.
Two mechanisms are likely acting together. First, the altered shape and timing of the observed post-2010 Mekong hydrograph – particularly the weaker early wet-season rises and a more abrupt approach to peak flow – can reduce the persistence of the hydraulic gradient required to initiate and sustain reverse flow. Because the post-2010 hydrological forcing contains the combined effects of dam regulation, climate variability, and other basin-scale changes, the fixed-bed scenario isolates the effect of the altered hydrograph but does not attribute that alteration exclusively to dam operations. Second, local hydraulic and geomorphic changes in the confluence reach can modify conveyance and the head difference required for reversal (Quan et al., 2025). In particular, recent satellite-based estimates indicate that sand extraction from the Cambodian Mekong increased from ∼ 24 Mt in 2016 to ∼ 59 Mt in 2020, while natural sand supply in 2020 was only ∼ 3.7 Mt, implying a large and persistent sediment deficit (Hackney et al., 2021). This deficit is associated with reach-scale bed incision (median ∼ −0.26 m yr−1 over 2013–2019) (Hackney et al., 2021) and intense local lowering near the confluence (net incision ∼ 1.2 m yr−1) (Hackney et al., 2025), providing a physically consistent pathway for threshold shifts via changes in cross-sectional geometry and stage-discharge relations.
A practical implication of the response-time framework is that it translates coupled dynamics into an operationally interpretable quantity: a lag-consistent Kratie discharge threshold associated with reverse flow initiation and termination. Because Kratie-to-confluence response time is short during high flow conditions, these thresholds are directly relevant for short-lead monitoring and for interpreting how changes in timing and variability–rather than water volume alone–affect Tonle Sap exchange.
4.3 Implications for ecosystems and governance
Although this study focuses on hydrology and does not model ecological outcomes directly, the documented shifts align with established pathways by which floodplain productivity can decline (Lamberts and Koponen, 2008; Arias et al., 2012, 2013): shorter and less predictable connectivity, reduced floodplain access, and compressed inundation windows that can affect habitat heterogeneity and seasonal cues for fish movement and reproduction (Ngor et al., 2018; Sor et al., 2024; Chea et al., 2020; Deng et al., 2023; Chevalier et al., 2023). These risks reinforce that “volume-only” perspectives are insufficient for basin planning. Effective transboundary management should explicitly consider (i) seasonal timing (onset/cessation), (ii) persistence and flashiness, and (iii) sub-daily ramping behavior, because each affects different components of floodplain-lake functioning and downstream risk.
4.4 Limitations and ways forward
While this study provides a holistic analysis of hydrological alterations across both long-term and sub-daily scales, several limitations remain that warrant further investigation. First, the attribution of observed sub-daily fluctuations to upstream hydropower operations is inherently constrained by the absence of publicly available dam release data (Morovati et al., 2026). Although the temporal alignment between wet-season peaks and sub-daily variability supports a linkage to hydropeaking, direct validation through operational records remains essential.
Although the annual DEM reconstruction represents progressive channel incision, it does not constitute a fully coupled morphodynamic simulation. The spatial allocation of extraction, subsequent redistribution of bed material, bank failure, local mining-pit evolution, and feedbacks between sediment transport and channel geometry are prescribed or simplified rather than dynamically resolved. Additional repeated bathymetric surveys and spatially explicit extraction data would therefore help constrain uncertainty in the magnitude and distribution of incision.
Although the comparison between measured post-dam discharge and the THREW-simulated no-dam counterfactual provides model-based evidence of a dam-regulation signal in flow memory, flashiness and relative variability, the magnitude of this signal remains conditional on the model structure, parameterisation and meteorological forcing. Moreover, the observed post-dam series incorporates not only dam operations but also climate variability and other contemporaneous changes in basin hydrology and water management. The comparison should therefore be interpreted as identifying a model-dependent regulation signal rather than providing a complete attribution of the observed hydrological changes. Future work should quantify this uncertainty through ensemble simulations, alternative flow-naturalisation approaches and, where available, operational reservoir-release data.
This study focuses primarily on hydrological metrics and does not explicitly assess ecological or livelihood outcomes. Integrating these flow regime alterations with floodplain vegetation dynamics, fish migration cues, and agricultural timing would provide a more comprehensive view of cascading socio-ecological impacts.
This study provides a comprehensive spatiotemporal assessment of hydrological alteration across the Mekong River system during a period of rapid mainstream and tributary dam development and climate variability. In the Tonle Sap system, the paired hydrodynamic simulations identify sand-mining-driven channel incision as an additional local control that interacts with the altered upstream flow regime.
The contrasting changes in flow memory, flashiness, and seasonal variability between the upper and lower mainstream indicate an increasing spatial divergence in flow-regime characteristics. Regulation, dam sequencing, and associated interventions have fragmented longitudinal connectivity, particularly during the post-2010 mega-dam era. The divergence of these indicators between the upper and lower reaches reflects a loss of spatial coherence along the river's longitudinal profile, with locally distinct dynamics progressively replacing the previously unified flood pulse.
At Chiang Saen, annual minimum flows increased by 33.3 % (from 748 to 997 m3 s−1) in the post-dam period (2010–2024). A similar trend is observed downstream, most notably at Kratie, where minimum flows rose by 117.2 % (from 1326 to 2880 m3 s−1). In contrast, annual maximum flows decreased by 40 % at Chiang Saen and by only 9.4 % at Kratie, likely due to the buffering effects of monsoonal tributary inflows and dam operations on these tributaries.
These mainstream alterations propagate into the Tonle Sap system, where the reverse-flow season is progressively shortened and retimed as a result of interacting hydrological and geomorphic changes. The paired fixed-bed and dynamic-bed simulations show that post-2010 hydrological alteration and sand-mining-driven incision affect reverse flow through different but interacting mechanisms. Under post-dam fixed-bed conditions, altered discharge timing and persistence increased the median lag-adjusted Kratie discharge required for reverse-flow onset from ∼ 3200 to ∼ 4300 m3 s−1, equivalent to an increase of approximately 35 % relative to the pre-dam baseline. When annual sand-mining-driven bed incision was added, this threshold increased further to ∼ 7200 m3 s−1, approximately 127 % higher than the pre-dam baseline. This indicates that dam regulation and climate variability mainly alter how frequently and persistently reversal-favourable hydraulic gradients occur, while sand mining lowers the riverbed and modifies the local stage–discharge relationship, thereby requiring a substantially higher discharge to initiate and sustain Mekong–Tonle Sap flow reversal. Together, these interacting drivers shorten the reverse-flow season by approximately 28 d relative to the pre-dam baseline.
The combined evidence of dampened high flows, pronounced episodic sub-daily variability in the recent record, and shifting seasonal flow timings points to a river system undergoing profound anthropogenic transformation. As regional development intensifies, future management must extend beyond annual water volume considerations, focusing instead on the temporal structure and synchrony of flow regimes–key to sustaining downstream ecosystems, floodplain agriculture, and rural livelihoods. Preserving the integrity of the Mekong-Tonle Sap flood pulse will require basin-wide hydrological monitoring, transparent data sharing, and coordinated transboundary water governance.
Hydrological data, including water level and discharge data, are accessible at https://portal.mrcmekong.org/home (last access: 16 July 2025). Code for extracting canals across the lower Mekong can be obtained upon reasonable request from the primary author of the paper. FABDEM data is publicly available at https://www.fathom.global/product/global-terrain-data-fabdem/ (last access: 16 July 2025). Constructed DEM data for the Tonle Sap Lake and river can be obtained upon reasonable request from the primary author of the paper. Data on the reverse-flow period is publicly available at https://pmfm.mrcmekong.org/monitoring/6b/ (last access: 16 July 2025).
The supplement related to this article is available online at https://doi.org/10.5194/hess-30-6821-2026-supplement.
KM conceptualized and designed the study. KM and FT contributed to model development, with KM responsible for model implementation and analysis. KM led the manuscript writing in close collaboration with HZ and FT. All authors contributed to discussions throughout the study, provided critical feedback, and approved the final version of the manuscript.
At least one of the (co-)authors is a member of the editorial board of Hydrology and Earth System Sciences. The peer-review process was guided by an independent editor, and the authors also have no other competing interests to declare.
Publisher's note: Copernicus Publications remains neutral with regard to jurisdictional claims made in the text, published maps, institutional affiliations, or any other geographical representation in this paper. The authors bear the ultimate responsibility for providing appropriate place names. Views expressed in the text are those of the authors and do not necessarily reflect the views of the publisher.
This research was supported by the Beijing Natural Science Foundation (grant no. IS25095), the National Natural Science Foundation of China (NSFC; grant nos. W2633143 and 52609030), and the Shuimu Tsinghua Scholar Program.
This paper was edited by Micha Werner and reviewed by Grigorios Vasilopoulos and one anonymous referee.
Ahmed, M. F., Van Binh, D., Kantoush, S. A., Park, E., Doan, N. L. P., Tuan, L. A., and Sumi, T.: Intensified susceptibility to riverbed incisions under sand mining impacts in the Vietnamese Mekong Delta: A long-term spatiotemporal analysis, Geomorphology, 470, 109535, https://doi.org/10.1016/j.geomorph.2024.109535, 2025.
Alvarez-Garreton, C., Boisier, J. P., Garreaud, R., Seibert, J., and Vis, M.: Progressive water deficits during multiyear droughts in basins with long hydrological memory in Chile, Hydrol. Earth Syst. Sci., 25, 429–446, https://doi.org/10.5194/hess-25-429-2021, 2021.
Ang, W. J., Park, E., Pokhrel, Y., Tran, D. D., and Loc, H. H.: Dams in the Mekong: a comprehensive database, spatiotemporal distribution, and hydropower potentials, Earth Syst. Sci. Data, 16, 1209–1228, https://doi.org/10.5194/essd-16-1209-2024, 2024.
Arias, M. E., Cochrane, T. A., Piman, T., Kummu, M., Caruso, B. S., and Killeen, T. J.: Quantifying changes in flooding and habitats in the Tonle Sap Lake (Cambodia) caused by water infrastructure development and climate change in the Mekong Basin, J. Environ. Manage., 112, 53–66, https://doi.org/10.1016/j.jenvman.2012.07.003, 2012.
Arias, M. E., Cochrane, T. A., Norton, D., Killeen, T. J., and Khon, P.: The flood pulse as the underlying driver of vegetation in the largest wetland and fishery of the Mekong Basin, Ambio, 42, 864–876, https://doi.org/10.1007/s13280-013-0424-4, 2013.
Arias, M. E., Cochrane, T. A., Kummu, M., Lauri, H., Holtgrieve, G. W., Koponen, J., and Piman, T.: Impacts of hydropower and climate change on drivers of ecological productivity of Southeast Asia's most important wetland, Ecol. Model., 272, 252–263, https://doi.org/10.1016/j.ecolmodel.2013.10.015, 2014.
Arthington, A. H., Bhaduri, A., Bunn, S. E., Jackson, S. E., Tharme, R. E., Tickner, D., and Ward, S.: The Brisbane declaration and global action agenda on environmental flows, Frontiers in Environmental Science, 6, 45, https://doi.org/10.3389/fenvs.2018.00045, 2018.
Baran, E. and Myschowoda, C.: Dams and fisheries in the Mekong Basin, Aquat. Ecosyst. Health, 12, 227–234, 2009.
Berghuijs, W. R., Woods, R. A., Anderson, B. J., Hemshorn de Sánchez, A. L., and Hrachowitz, M.: Annual memory in the terrestrial water cycle, Hydrol. Earth Syst. Sci., 29, 1319–1333, https://doi.org/10.5194/hess-29-1319-2025, 2025.
Binh, V. D., Kantoush, S. A., Saber, M., Mai, N. P., Maskey, S., Phong, D. T., and Sumi, T.: Long-term alterations of flow regimes of the Mekong River and adaptation strategies for the Vietnamese Mekong Delta, Journal of Hydrology: Regional Studies, 32, 100742, https://doi.org/10.1016/j.ejrh.2020.100742, 2020.
Blöschl, G. and Sivapalan, M.: Process controls on regional flood frequency: Coefficient of variation and basin scale, Water Resour. Res., 33, 2967–2980, https://doi.org/10.1029/97WR00568, 1997.
Bozeman, B. B., Pracheil, B. M., and Matson, P. G.: The environmental impact of hydropower: a systematic review of the ecological effects of sub-daily flow variability on riverine fish, Rev. Fish Biol. Fisher., 35, 45–76, https://doi.org/10.1007/s11160-024-09909-4, 2025.
Bunn, S. E. and Arthington, A. H.: Basic principles and ecological consequences of altered flow regimes for aquatic biodiversity, Environ. Manage., 30, 492–507, https://doi.org/10.1007/s00267-002-2737-0, 2002.
Chea, R., Pool, T. K., Chevalier, M., Ngor, P., So, N., Winemiller, K. O., and Grenouillet, G.: Impact of seasonal hydrological variation on tropical fish assemblages: abrupt shift following an extreme flood event, Ecosphere, 11, e03303, https://doi.org/10.1002/ecs2.3303, 2020.
Chen, A., Liu, J., Kummu, M., Varis, O., Tang, Q., Mao, G., and Chen, D.: Multidecadal variability of the Tonle Sap Lake flood pulse regime, Hydrol. Process., 35, e14327, https://doi.org/10.1002/hyp.14327, 2021.
Chevalier, M., Ngor, P. B., Pin, K., Touch, B., Lek, S., Grenouillet, G., and Hogan, Z.: Long-term data show alarming decline of majority of fish species in a Lower Mekong basin fishery, Sci. Total Environ., 891, 164624, https://doi.org/10.1016/j.scitotenv.2023.164624, 2023.
Chua, S. D. X., Lu, X. X., Oeurng, C., Sok, T., and Grundy-Warr, C.: Drastic decline of flood pulse in the Cambodian floodplains (Mekong River and Tonle Sap system), Hydrol. Earth Syst. Sci., 26, 609–625, https://doi.org/10.5194/hess-26-609-2022, 2022.
Cochrane, T. A., Arias, M. E., and Piman, T.: Historical impact of water infrastructure on water levels of the Mekong River and the Tonle Sap system, Hydrol. Earth Syst. Sci., 18, 4529–4541, https://doi.org/10.5194/hess-18-4529-2014, 2014.
Cooper, M. G., Sun, N., Wigmosta, M. S., Eldardiry, H., Deb, M., Yang, Z., and Judi, D. R.: Enhanced flood synchrony and downstream severity in the Delaware River under rising temperatures, Communications Earth & Environment, 6, 296, https://doi.org/10.1038/s43247-025-02243-y, 2025.
Dang, H. and Pokhrel, Y.: Evolution of river regimes in the Mekong River basin over 8 decades and the role of dams in recent hydrological extremes, Hydrol. Earth Syst. Sci., 28, 3347–3365, https://doi.org/10.5194/hess-28-3347-2024, 2024.
Dang, H., Pokhrel, Y., Shin, S., Stelly, J., Ahlquist, D., and Du Bui, D.: Hydrologic balance and inundation dynamics of Southeast Asia's largest inland lake altered by hydropower dams in the Mekong River basin, Sci. Total Environ., 831, 154833, https://doi.org/10.1016/j.scitotenv.2022.154833, 2022.
de Lavenne, A., Andréassian, V., Crochemore, L., Lindström, G., and Arheimer, B.: Quantifying multi-year hydrological memory with Catchment Forgetting Curves, Hydrol. Earth Syst. Sci., 26, 2715–2732, https://doi.org/10.5194/hess-26-2715-2022, 2022.
Delgado, J. M., Apel, H., and Merz, B.: Flood trends and variability in the Mekong river, Hydrol. Earth Syst. Sci., 14, 407–418, https://doi.org/10.5194/hess-14-407-2010, 2010.
Deltares: Delft3D-Flow user manual, https://content.oss.deltares.nl/delft3d4/Delft3D-FLOW_User_Manual.pdf (last access: 10 July 2025), 2025.
Deng, Q., Sabo, J. L., Holtgrieve, G. W., Ngor, P. B., and Holway, J.: Timing of hydrologic anomalies: direct impacts on migration traits in a flood pulse fishery system, J. Appl. Ecol., 60, 494–506, https://doi.org/10.1111/1365-2664.14349, 2023.
Do, S. K., Du, T. L., Lee, H., Chang, C. H., Bui, D. D., Nguyen, N. T., and Bui, L. K.: Assessing impacts of hydropower development on downstream inundation using a hybrid modeling framework integrating satellite data-driven and process-based models, Water Resour. Res., 61, e2024WR037528, https://doi.org/10.1029/2024WR037528, 2025.
Duc, N. A., Nguyen, L. T., Thai, T. H., Khan, A., Rautenstrauch, K., and Schmidt, C.: Assessing cumulative impacts of the proposed Lower Mekong Basin hydropower cascade on the Mekong River floodplains and Delta–Overview of integrated modeling methods and results, J. Hydrol., 581, 122511, https://doi.org/10.1016/j.jhydrol.2018.01.029, 2020.
Dudgeon, D.: Multiple threats imperil freshwater biodiversity in the Anthropocene, Curr. Biol., 29, R960–R967, https://doi.org/10.1016/j.cub.2019.08.002, 2019.
Frappart, F., Biancamaria, S., Normandin, C., Blarel, F., Bourrel, L., Aumont, M., Azemar, P., Vu, P.-L., Le Toan, T., Lubac, B., and Darrozes, J.: Influence of recent climatic events on the surface water storage of the Tonle Sap Lake, Sci. Total Environ., 636, 1520–1533, https://doi.org/10.1016/j.scitotenv.2018.04.326, 2018.
Gannon, J. P., Kelleher, C., and Zimmer, M.: Controls on watershed flashiness across the continental US, J. Hydrol., 609, 127713, https://doi.org/10.1016/j.jhydrol.2022.127713, 2022.
Hackney, C. R., Vasilopoulos, G., Heng, S., Darbari, V., Walker, S., and Parsons, D. R.: Sand mining far outpaces natural supply in a large alluvial river, Earth Surf. Dynam., 9, 1323–1334, https://doi.org/10.5194/esurf-9-1323-2021, 2021.
Hackney, C. R., Cisneros, J., Heng, S., Darby, S. E., Leyland, J., Konsoer, K., and Parsons, D. R.: Increased hydraulic roughness in alluvial rivers created by sand-mining sculpted bed features, J. Geophys. Res.-Earth, 130, e2024JF008189, https://doi.org/10.1029/2024JF008189, 2025.
Hayes, D. S., Bätz, N., Tonolla, D., Merl, K., Auer, S., Gorla, L., and Greimel, F.: Why hydropeaking frequency matters: effects of recurring stranding on fish, Journal of Ecohydraulics, 10, 302–318, https://doi.org/10.1080/24705357.2024.2426820, 2025.
Hecht, J. S., Lacombe, G., Arias, M. E., Dang, T. D., and Piman, T.: Hydropower dams of the Mekong River basin: A review of their hydrological impacts, J. Hydrol., 568, 285–300, https://doi.org/10.1016/j.jhydrol.2018.10.045, 2019.
Hoang, L. P., Lauri, H., Kummu, M., Koponen, J., van Vliet, M. T. H., Supit, I., Leemans, R., Kabat, P., and Ludwig, F.: Mekong River flow and hydrological extremes under climate change, Hydrol. Earth Syst. Sci., 20, 3027–3041, https://doi.org/10.5194/hess-20-3027-2016, 2016.
Khan, A., Hussain, S., Bakhet, A., Anwer, A., Raza, S. M., Ali, S., and Zakarya, M.: Climate time series variability analysis of Islamabad Capital Territory using fractal dimension and Hurst exponent methods, J. Atmos. Sol.-Terr. Phy., 267, 106406, https://doi.org/10.1016/j.jastp.2024.106406, 2025.
Koehnken, L., Rintoul, M. S., Goichot, M., Tickner, D., Loftus, A. C., and Acreman, M. C.: Impacts of riverine sand mining on freshwater ecosystems: A review of the scientific evidence and guidance for future research, River Res. Appl., 36, 362–370, https://doi.org/10.1002/rra.3586, 2020.
Koutsoyiannis, D.: Hydrologic persistence and the Hurst phenomenon, Water Encyclopedia, 3, 210–221, https://doi.org/10.1002/047147844X.sw434, 2005.
Kummu, M. and Sarkkula, J.: Impact of the Mekong River flow alteration on the Tonle Sap flood pulse, Ambio, 37, 185–192, https://doi.org/10.1579/0044-7447(2008)37[185:iotmrf]2.0.co;2, 2008.
Kummu, M., Tes, S., Yin, S., Adamson, P., Józsa, J., Koponen, J., and Sarkkula, J.: Water balance analysis for the Tonle Sap Lake–floodplain system, Hydrol. Process., 28, 1722–1733, https://doi.org/10.1002/hyp.9718, 2014.
Lamberts, D. and Koponen, J.: Flood pulse alterations and productivity of the Tonle Sap ecosystem: a model for impact assessment, Ambio, 37, 178–184, https://doi.org/10.1579/0044-7447(2008)37[178:FPAAPO]2.0.CO;2, 2008.
Lao, J., Wang, C., Nie, S., Xi, X., and Wang, J.: Monitoring and analysis of water level changes in the Mekong River from ICESat-2 spaceborne laser altimetry, Water, 14, 1613, https://doi.org/10.3390/w14101613, 2022.
Lauri, H., de Moel, H., Ward, P. J., Räsänen, T. A., Keskinen, M., and Kummu, M.: Future changes in Mekong River hydrology: impact of climate change and reservoir operation on discharge, Hydrol. Earth Syst. Sci., 16, 4603–4619, https://doi.org/10.5194/hess-16-4603-2012, 2012.
Li, D., Long, D., Zhao, J., Lu, H., and Hong, Y.: Observed changes in flow regimes in the Mekong River basin, J. Hydrol., 551, 217–232, https://doi.org/10.1016/j.jhydrol.2017.05.061, 2017.
Li, W., Maharjan, S., and El-Askary, H.: Atmospheric teleconnection patterns and hydrological whiplashes in the Western US, Scientific Reports, 15, 21262, https://doi.org/10.1038/s41598-025-06087-6, 2025.
Lu, X. X. and Chua, S. D. X.: River discharge and water level changes in the Mekong River: Droughts in an era of mega-dams, Hydrol. Process., 35, e14265, https://doi.org/10.1002/hyp.14265, 2021.
Lu, X. X., Li, S., Kummu, M., Padawangi, R., and Wang, J. J.: Observed changes in the water flow at Chiang Saen in the lower Mekong: Impacts of Chinese dams?, Quatern. Int., 336, 145–157, https://doi.org/10.1016/j.quaint.2014.02.006, 2014.
Ly, S., Sayama, T., and Try, S.: Integrated impact assessment of climate change and hydropower operation on streamflow and inundation in the lower Mekong Basin, Progress in Earth and Planetary Science, 10, 55, https://doi.org/10.1186/s40645-023-00586-8, 2023.
Lyu, H., Morovati, K., Zhang, K., and Tian, F.: Hydrological model calibration in data-deficient basins using satellite altimetry and a hydrodynamic model, J. Hydrol., 643, 132022, https://doi.org/10.1016/j.jhydrol.2024.132022, 2024.
Morovati, K., Nakhaei, P., Tian, F., Tudaji, M., and Hou, S.: A Machine learning framework to predict reverse flow and water level: A case study of Tonle Sap Lake, J. Hydrol., 603, 127168, https://doi.org/10.1016/j.jhydrol.2021.127168, 2021.
Morovati, K., Tian, F., Kummu, M., Shi, L., Tudaji, M., Nakhaei, P., and Olivares, M. A.: Contributions from climate variation and human activities to flow regime change of Tonle Sap Lake from 2001 to 2020, J. Hydrol., 616, 128800, https://doi.org/10.1016/j.jhydrol.2022.128800, 2023.
Morovati, K., Tian, F., Pokhrel, Y., Someth, P., Shi, L., Zhang, K., and Ly, S.: Fishery and agriculture amidst human activities and climate change in the Mekong River: A review of gaps in data and effective approaches towards sustainable development, J. Hydrol., 644, 132043, https://doi.org/10.1016/j.jhydrol.2024.132043, 2024a.
Morovati, K., Zhang, K., Shi, L., Pokhrel, Y., Wu, M., Someth, P., Ly, S., and Tian, F.: On the cause of large daily river flow fluctuations in the Mekong River, Hydrol. Earth Syst. Sci., 28, 5133–5147, https://doi.org/10.5194/hess-28-5133-2024, 2024b.
Morovati, K., Kondolf, G. M., Pokhrel, Y., and Tian, F.: Saving Mekong River's ecosystem integrity before delta sinks, Sci. Bull., 10, 2397–2399, https://doi.org/10.1016/j.scib.2026.01.031, 2026.
MRC: The Council Study: Impacts of water infrastructure development on the Mekong mainstream. MRC Secretariat, Vientiane, https://www.mrcmekong.org/wp-content/uploads/2024/08/macroeconomic-assessment-report-of-the-MRC-Council-Study.pdf (last access: 10 July 2025), 2017.
MRC: Hydropower Mitigation Guidelines (Volume 3), Vientiane: MRC Secretariat, https://www.mrcmekong.org/wpcontent/uploads/2024/08/Ish0306-vol3-1.pdf (last access: 26 November 2024), 2020.
MRC: Technical report – Phase 1 of the Joint study on the changing patterns of hydrological conditions of the Lancang-Mekong River Basin and adaptation strategies. Beijing: LMC Water Center and Vientiane: MRC Secretariat, https://www.mrcmekong.org/publications/technical-report-phase-1-of-the-joint-study-on-the-changing-patterns-of-hydrological-conditions-of-the-lancang-mekong-river-basin-and-adaptation-strategies/ (last access: 10 July 2025), 2023.
Mudelsee, M.: Long memory of rivers from spatial aggregation, Water Resour. Res., 43, https://doi.org/10.1029/2006WR005721, 2007.
Nan, Y., Tian, L., He, Z., Tian, F., and Shao, L.: The value of water isotope data on improving process understanding in a glacierized catchment on the Tibetan Plateau, Hydrol. Earth Syst. Sci., 25, 3653–3673, https://doi.org/10.5194/hess-25-3653-2021, 2021.
Ng, W. X. and Park, E.: Shrinking Tonlé Sap and the recent intensification of sand mining in the Cambodian Mekong River, Sci. Total Environ., 777, 146180, https://doi.org/10.1016/j.scitotenv.2021.146180, 2021.
Ngor, P. B., Oberdorff, T., Phen, C., Baehr, C., Grenouillet, G., and Lek, S.: Fish assemblage responses to flow seasonality and predictability in a tropical flood pulse system, Ecosphere, 9, e02366, https://doi.org/10.1002/ecs2.2366, 2018.
Nguyen, T. T. H., Wang, Y. L., Binh, D. V., and Dang, T. D.: Hydrological alterations and sediment changes caused by dams in the Mekong River Basin, Hydrolog. Sci. J., 70, 1744–1760, https://doi.org/10.1080/02626667.2025.2498684, 2025.
Orieschnig, C., Adla, S., Chun, K. P., Srivastava, S., Morovati, K., Howard, B. C., Octavianti, T., Uchôa, J. G., Duan, Z., Mazzoglio, P., Panchanathan, A., Széles, B., Koren, G., Papacharalampous, G. A., Pradhananga, D., Soulis, K., Choukrani, H., Dakhlaoui, H., Elçi, A., Fan, X., Khatami, S., Mendiondo, E. M., Payne, T., Rahmati, M., Roy, T., Skinner, C., Teutschbein, C., Yonaba, R., Adyel, T. M., Aguirre, I., Aslam, H., Ganapathy, A., Jain, J., Nkwasa, A., O’Loughlin, F., Pechlivanidis, I., Pizarro, A., Sharma, A., Tyralis, H., Vora, S., Adla, S., Bertola, M., Boico, V., Ceperley, N., Dewals, B., Heinle, M., Jessen, S., Kaiselgruber, F., Lakhwan, N., Lateef, M. B., Mishra, A., Ojera, P., Ovcharuk, V., Singh, A., Wadhwa, A., Acharya, S. C., Alexandri, S., Rico Carranza, E., Cavus, Y., Dogulu, N., Faty, A., Jorquera, J., Rane, V., and Zappa, M.: Effective science communication in the face of water crises: a community perspective on challenges and best practice in HELPING, Hydrolog. Sci. J., 71, 1207–1224, https://doi.org/10.1080/02626667.2026.2625282, 2026.
Piman, T., Lennaerts, T., and Southalack, P.: Assessment of hydrological changes in the lower Mekong Basin from Basin-Wide development scenarios, Hydrol. Process., 27, 2115–2125, https://doi.org/10.1002/hyp.9764, 2013.
Poff, N. L., Allan, J. D., Bain, M. B., Karr, J. R., Prestegaard, K. L., Richter, B. D., and Stromberg, J. C.: The natural flow regime, Bioscience, 47, 769–784, https://doi.org/10.2307/1313099, 1997.
Poff, N. L., Olden, J. D., Merritt, D. M., and Pepin, D. M.: Homogenization of regional river dynamics by dams and global biodiversity implications, P. Natl. Acad. Sci. USA, 104, 5732–5737, https://doi.org/10.1073/pnas.0609812104, 2007.
Pokhrel, Y., Burbano, M., Roush, J., Kang, H., Sridhar, V., and Hyndman, D. W.: A review of the integrated effects of changing climate, land use, and dams on Mekong River hydrology, Water, 10, 266, https://doi.org/10.3390/w10030266, 2018.
Quan, L. Q., Hackney, C. R., Vasilopoulos, G., Coulthard, T., Hung, N. N., Darby, S. E., and Parsons, D. R.: Sand-mining-driven reduction in Tonle Sap Lake's critical flood pulse, Nature Sustainability, 8, 1455–1466, https://doi.org/10.1038/s41893-025-01677-8, 2025.
Räsänen, T. A., Someth, P., Lauri, H., Koponen, J., Sarkkula, J., and Kummu, M.: Observed river discharge changes due to hydropower operations in the Upper Mekong Basin, J. Hydrol., 545, 28–41, https://doi.org/10.1016/j.jhydrol.2016.12.023, 2017.
Rupp, D. E., Chegwidden, O. S., Nijssen, B., and Clark, M. P.: Changing river network synchrony modulates projected increases in high flows, Water Resour. Res., 57, e2020WR028713, https://doi.org/10.1029/2020WR028713, 2021.
Sabo, J. L., Ruhi, A., Holtgrieve, G. W., Elliott, V., Arias, M. E., Ngor, P. B., and Nam, S.: Designing river flows to improve food security futures in the Lower Mekong Basin, Science, 358, eaao1053, https://doi.org/10.1126/science.aao1053, 2017.
Shi, L., Sun, J., Lin, B., Morovati, K., Liu, Z., and Zuo, X.: Macroscopic hydro-thermal processes in a large channel-type reservoir, Journal of Hydrology: Regional Studies, 47, 101367, https://doi.org/10.1016/j.ejrh.2023.101367, 2023.
Shrestha, S., Bae, D. H., Hok, P., Ghimire, S., and Pokhrel, Y.: Future hydrology and hydrological extremes under climate change in Asian river basins, Scientific Reports, 11, 17089, https://doi.org/10.1038/s41598-021-96656-2, 2021.
Sor, R., Prudencio, L., Hogan, Z. S., Chandra, S., Ngor, P. B., and Null, S. E.: Factors influencing fish migration in one of the world's largest inland fisheries, Frontiers in Freshwater Science, 2, 1426350, https://doi.org/10.3389/ffwsc.2024.1426350, 2024.
Soukhaphon, A., Baird, I. G., and Hogan, Z. S.: The impacts of hydropower dams in the Mekong River Basin: A review, Water, 13, 265, https://doi.org/10.3390/w13030265, 2021.
Tian, F., Hou, S., Morovati, K., Zhang, K., Nan, Y., Lu, X. X., and Ni, G.: Exploring spatio-temporal patterns of sediment load and driving factors in Lancang-Mekong River basin before operation of mega-dams (1968–2002), J. Hydrol., 617, 128922, https://doi.org/10.1016/j.jhydrol.2022.128922, 2023.
Toffolon, M., Siviglia, A., and Zolezzi, G.: Thermal wave dynamics in rivers affected by hydropeaking, Water Resour. Res., 46, https://doi.org/10.1029/2009WR008234, 2010.
Try, S., Tanaka, S., Tanaka, K., Sayama, T., Lee, G., and Oeurng, C.: Assessing the effects of climate change on flood inundation in the lower Mekong Basin using high-resolution AGCM outputs, Progress in Earth and Planetary Science, 7, 34, https://doi.org/10.1186/s40645-020-00353-z, 2020.
Try, S., Sayama, T., Oeurng, C., Sok, T., Ly, S., and Uk, S.: Identification of the spatio-temporal and fluvial-pluvial sources of flood inundation in the Lower Mekong Basin, Geoscience Letters, 9, 5, https://doi.org/10.1186/s40562-022-00215-0, 2022.
United Nations: UN Comtrade Database, https://comtrade.un.org (last access: 10 July 2025), 2017.
Vu, T. H., Backhaus, L., Binh, D. V., Kantoush, S. A., and Stamm, J.: Applying deep learning for boat detection and numerical modeling to assess sand mining impacts on river morphology: a case study in the Vietnamese Mekong Delta, Geomorphology, 490, 110010, https://doi.org/10.1016/j.geomorph.2025.110010, 2025.
Wang, J., Yun, X., Pokhrel, Y., Yamazaki, D., Zhao, Q., Chen, A., and Tang, Q.: Modeling daily floods in the Lancang-Mekong River basin using an improved hydrological-hydrodynamic model, Water Resour. Res., 57, e2021WR029734, https://doi.org/10.1029/2021WR029734, 2021.
Wang, Y., Feng, L., Liu, J., Hou, X., and Chen, D.: Changes of inundation area and water turbidity of Tonle Sap Lake: responses to climate changes or upstream dam construction?, Environ. Res. Lett., 15, 0940a1, https://doi.org/10.1088/1748-9326/abac79, 2020.
Wu, M., Sun, J., Shi, L., Guo, J., Morovati, K., Lin, B., and Li, Y.: Vertical water renewal and dissolved oxygen depletion in a semi-enclosed Sea, J. Hydrol., 637, 131369, https://doi.org/10.1016/j.jhydrol.2024.131369, 2024.
Yang, Y., Yang, L., Villarini, G., Zhao, F., Huang, D., Vecchi, G. A., and Tian, F.: Synchronization of global peak river discharge since the 1980s, Nat. Clim. Change, 15, 1084–1090, https://doi.org/10.1038/s41558-025-02427-6, 2025.
Yin, X. A., Yang, Z. F., and Petts, G. E.: Reservoir operating rules to sustain environmental flows in regulated rivers, Water Resour. Res., 47, https://doi.org/10.1029/2010WR009991, 2011.
Yoshida, Y., Lee, H. S., Trung, B. H., Tran, H. D., Lall, M. K., Kakar, K., and Xuan, T. D.: Impacts of mainstream hydropower dams on fisheries and agriculture in lower Mekong Basin, Sustainability, 12, 2408, https://doi.org/10.3390/su12062408, 2020.
Yun, X., Song, J., Wang, J., and Bao, H.: Modelling to assess the suitability of hydrological-hydrodynamic model under the hydropower development impact in the Lancang-Mekong River basin, J. Hydrol., 637, 131393, https://doi.org/10.1016/j.jhydrol.2024.131393, 2024.
Zhang, K., Morovati, K., Tian, F., Yu, L., Liu, B., and Olivares, M. A.: Regional contributions of climate change and human activities to altered flow of the Lancang-mekong river, Journal of Hydrology: Regional Studies, 50, 101535, https://doi.org/10.1016/j.ejrh.2023.101535, 2023.
Zhang, K., Morovati, K., Urfels, A., and Tian, F.: Dam regulation moderates climate-induced rice yield loss in the Mekong–Tonle Sap Lake system, Earth's Future, 14, e2025EF008053, https://doi.org/10.1029/2025EF008053, 2026.
Zhao, H., Tian, F., Zhang, K., Morovati, K., and Sun, J.: Intelligent remote sensing canal system detection and irrigation water use estimation: A case study in the transboundary Mekong River Basin, J. Hydrol., 657, 133110, https://doi.org/10.1016/j.jhydrol.2025.133110, 2025.
Zhao, H., Zhao, Z., Morovati, K., Zhang, D., and Tian, F.: Climate change and irrigation expansion reshape the water pressure and upstream–downstream interactions in the Lancang–Mekong River Basin, Hydrol. Earth Syst. Sci., 30, 2433–2453, https://doi.org/10.5194/hess-30-2433-2026, 2026a.
Zhao, H., Morovati, K., Tian, F., Lu, H., and Zhang, K.: Climate change, dams, and irrigation expansion reshape water–energy trade-offs in the Lancang–Mekong River Basin, J. Hydrol., 672, 135371, https://doi.org/10.1016/j.jhydrol.2026.135371, 2026b.
Each wet season, the Mekong River flows into Cambodia's Tonle Sap Lake, supporting fisheries and farming. We used river records and simulations to study changes linked to dams, climate variability and sand mining. Altered river flows and a lowered riverbed now require stronger flows to bring water into the lake. Together, these changes have shortened the inflow season by about 28 days compared with earlier decades. Protecting the lake depends on when water arrives, not just how much.
Each wet season, the Mekong River flows into Cambodia's Tonle Sap Lake, supporting fisheries and...