the Creative Commons Attribution 4.0 License.
the Creative Commons Attribution 4.0 License.
 | 05 Feb 2026
Mitigating the impact of increased drought-flood abrupt alternation events under climate change: the role of reservoirs in the Lancang-Mekong River Basin
Keer Zhang
Zilong Zhao
The Lancang-Mekong River (LMR) Basin is highly vulnerable to extreme hydrological events, including Drought-Flood Abrupt Alternation (DFAA). The efficacy of potential mitigation measures, such as reservoir operations, on DFAA under climate change remains poorly understood. This study investigates these dynamics using five Global Climate Models (GCMs) from the Coupled Model Intercomparison Project Phase 6 (CMIP6). It employs the Revised Short-cycle Drought-Flood Abrupt Alteration Index (R-SDFAI), along with the Tsinghua Representative Elementary Watershed (THREW) model integrated with the developed reservoir module. The findings reveal that DFAA in the LMR Basin is primarily dominated by DTF (drought to flood), with probabilities of DTF exceeding those of FTD (flood to drought) at mild, moderate, and severe intensity levels. The increase in DTF probability for future periods is also significantly higher than that of FTD. Mild DTF and mild FTD account for 58 % to 90 % and 75 % to 100 % of their total probability in the future, making the mild-intensity events the most frequent DFAA. Reservoirs play a significant role in reducing DTF risks during both dry and wet seasons, though their effectiveness in controlling FTD risks, particularly during the dry season, is relatively weaker. Furthermore, there is a positive correlation between the reservoir's capacity to mitigate total DFAA risk and its total storage. Reservoirs display a stronger ability to regulate high-intensity FTD and high-frequency DTF events, and significantly reduce the monthly duration of DFAA. These insights provide valuable guidance for the effective management of water resources cooperatives across the LMR Basin.
- Article
(7024 KB) - Full-text XML
-
Supplement
(1489 KB) - BibTeX
- EndNote


Flood and drought are two of the most frequent natural disasters in the world (Adikari and Yoshitani, 2009; ADREM et al., 2024). Drought-Flood Abrupt Alternation (DFAA), which is defined as the rapid transition between flood and drought conditions within a region (Xiong and Yang, 2025), has received growing attention in recent years (Chen et al., 2025; Wu et al., 2006; Zhang et al., 2012; Shan et al., 2018; Song et al., 2023). DFAA specifically consists of two types of rapid transition events: (1) drought to flood (DTF), where conditions shift quickly from drought to flood, and (2) flood to drought (FTD), where conditions rapidly change from flood to drought. Hazards arising from DFAA are more significant than those from floods and droughts. DFAA not only alters soil conditions and increases the potential for exceeding water quality standards (Bai et al., 2023; Yang et al., 2019) but also challenges food security and seriously affects agricultural production. Furthermore, DFAA events, particularly DTF events, are prone to triggering severe secondary natural hazards, primarily including flash floods, landslides, and mudslides (Wang et al., 2023).
It has been observed that the intensity and frequency of DFAA events demonstrate a global increasing trend (Yang et al., 2022; Chen et al., 2025). However, notable regional differences exist. Shan et al. (2018) observed that the scope of DFAA events in the Yangtze River mid-lower reaches has expanded since the 1960s, with both frequency and intensity increasing annually. Zhang et al. (2012) found that although droughts and floods have increased in the Huai River Basin, DFAA events have become less frequent. Looking ahead, Zhao et al. (2022) projected that the Han River Basin will experience an upward trend in both DFAA frequency and intensity, whereas Yang et al. (2019) reported a projected decline in the frequency of DFAA events in the Hetao region.
The Lancang-Mekong River (LMR), as a significant international river in Southeast Asia, profoundly affects key sectors such as hydropower, agriculture, fisheries, and transport (Morovati et al., 2024). At the same time, the LMR Basin is a high-incidence area for floods and droughts (Liu et al., 2020; MRC, 2020). Notably, wet-season droughts account for about 40 % of annual droughts (Tian et al., 2020), while the region is also prone to large floods during the dry season (e.g., May 2006, May 2007, December 2016) (Tellman et al., 2021). The existence of these wet-season droughts and dry-season floods establishes the necessary conditions for DFAA in the LMR Basin.
Continued global warming is expected to further intensify both extreme wet and dry climate patterns (IPCC, 2023), contributing to increased vulnerability to DFAA in the future (Yang et al., 2022; Wang et al., 2023; Chen et al., 2025). There is a strong tendency toward more intense floods and droughts in Southeast Asia (IPCC Working Group I, 2021) and specifically in the LMR Basin (Wang et al., 2021; Li et al., 2021; Dong et al., 2022; Hoang et al., 2016). This heightens concerns about DFAA patterns in the LMR Basin, emphasizing the need for improved water security, sustainable management, and early disaster forecasting and prevention systems.
The hydrological regime of the LMR Basin is shaped mainly by climate change and human activities (LMC and MRC, 2023). Despite the severe impacts of climate change, human activities such as reservoir operation can help adapt the hydrological regime to these changes (Zhang et al., 2023; Khadka et al., 2023; Sridhar et al., 2019; Lu et al., 2014; Gunawardana et al., 2021). Researches highlight that reservoirs play a crucial role in reducing flood damage during the wet season and in minimizing low-flow occurrences (Arias et al., 2014; Räsänen et al., 2012; Dang and Pokhrel, 2024). To evaluate reservoir impacts under the changing climate, integration of a reservoir module within hydrological models is a widely adopted practice. For example, Wang et al. (2017b) demonstrated that reservoir operation can reduce flood intensity and frequency, while Yun et al. (2021a, b) showed that careful reservoir management can relieve both extreme drought and wet events, though with some trade-offs in hydroelectric benefits. Collectively, these studies indicate that reservoirs offer practical adaptation solutions to address climate change impacts.
It is essential to consider how human activities, especially reservoir operations, can help manage DFAA under climate change. This consideration supports effective water resource management and the sustainable development of the basin system. However, little research to date has focused on this aspect for the LMR Basin. The statistics, reports, and studies on DFAA in the LMR Basin remain scarce, particularly concerning the mitigating role of reservoirs under the changing climate. In response, this study develops a reservoir module for hydrological modeling, examines the trends of DFAA in the LMR Basin under climate change, and assesses how reservoirs can help basin states adapt to changing conditions. This work aims to advance knowledge on DFAA and support regional water resources management and sustainability.
2.1 Study area
The LMR originates from the Tibetan Plateau in China and flows through China, Myanmar, Laos, Thailand, Cambodia, and Vietnam before entering the South China Sea at the Mekong Delta. The LMR is approximately 4900 km long with a basin area of 812 400 km2 (He, 1995). Its annual runoff is about 446 billion m3 (MRC, 2023). The LMR Basin is characterized by steep slopes and rapid flows in the upstream. The downstream features shallow slopes and slow, mixed flows. The wet and dry seasons in the LMR Basin extend from June to November and from December to May, respectively (LMC and MRC, 2023). These are mainly influenced by the southwestern and northeastern monsoons. The distribution of the hydrology system and mainstream hydrological stations in the LMR Basin is detailed in Fig. 1a.
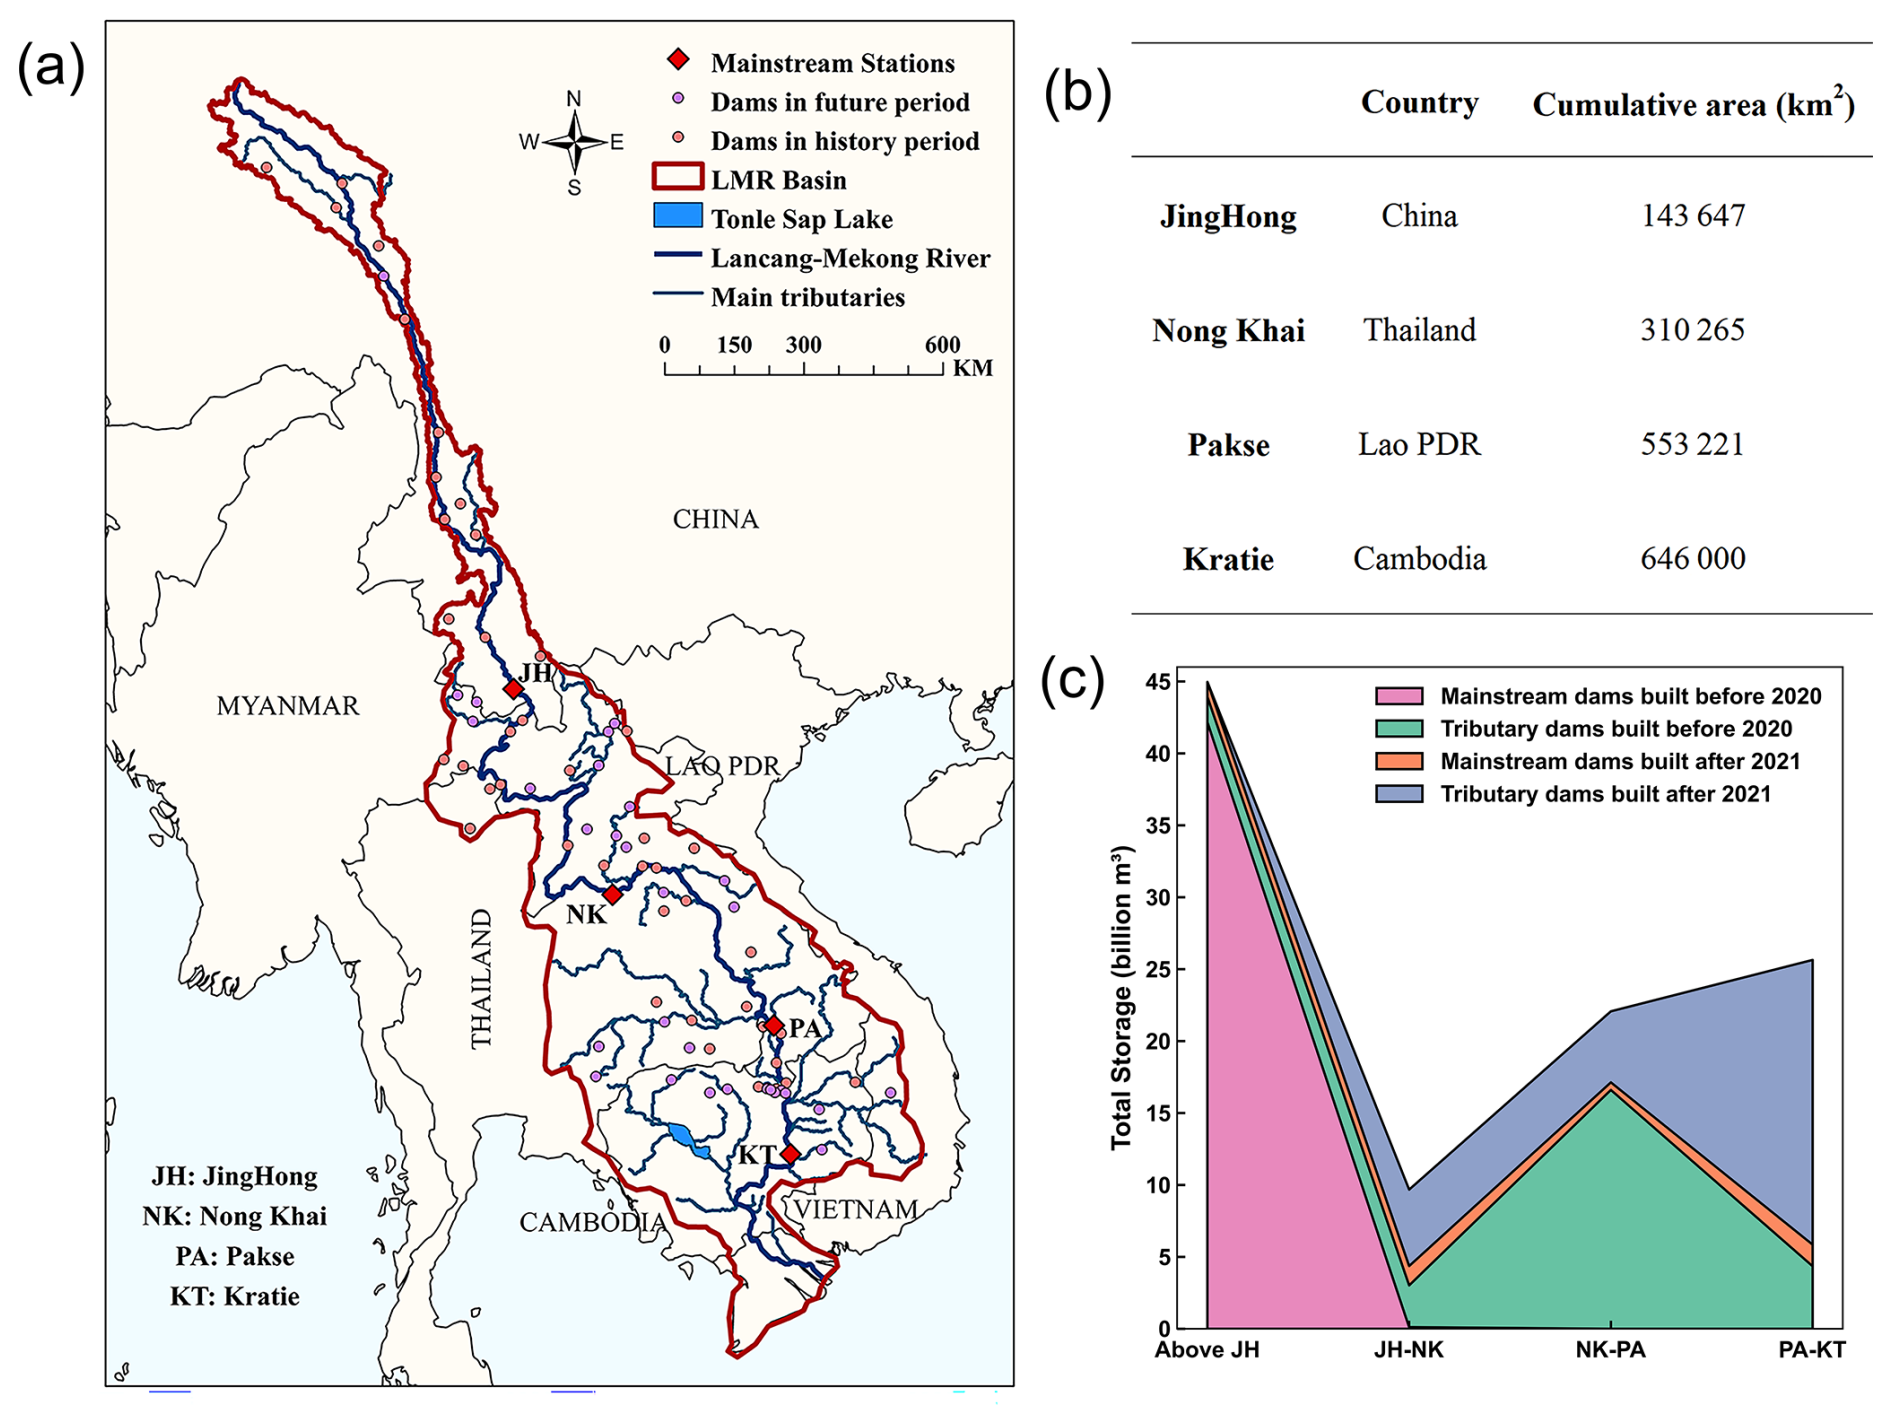
Figure 1Hydrology of the LMR Basin. (a) Map of rivers and reservoirs, (b) Information on four main hydrological stations, and (c) distribution of reservoir storage. Here, JH, NK, PA, and KT denote JingHong, Nong Khai, Pakse, and Kratie stations, respectively.
The LMR Basin nourishes approximately 65 million people (Sabo et al., 2017; Luo et al., 2023). The basin states rely on the river system to develop economic industries, including capture fisheries, irrigation agriculture, and hydropower. The LMR Basin has the largest freshwater capture fishery in the world (MRC, 2010; MRC, 2019). Its irrigation area is estimated at around 4.3 million ha (Do et al., 2020), with the Mekong Delta regarded as Southeast Asia's food basket. The LMR Basin is one of the most active regions for hydropower in the world (MRC, 2019; Williams, 2019). It harbors about 235 000 GWh yr−1 of hydroelectric potential in its mainstream and tributaries (Do et al., 2020; Schmitt et al., 2018). The LMR Basin is also heavily impacted by floods and droughts. During the past two decades, the LMR Basin has experienced several severe droughts (2004–2005, 2009–2010, 2015–2016, and 2019–2020) and floods (Liu et al., 2020; Tian et al., 2020; MRC, 2020). These disasters affect crop cultivation and fisheries harvesting, leading to the loss of property and lives in riparian countries. In 2013 and 2018, floods heavily affected the lower basin, specifically Cambodia, Vietnam, Laos, and Thailand. These floods covered 22 300 and 6470 km2, respectively (Tellman et al., 2021).
2.2 Data collection
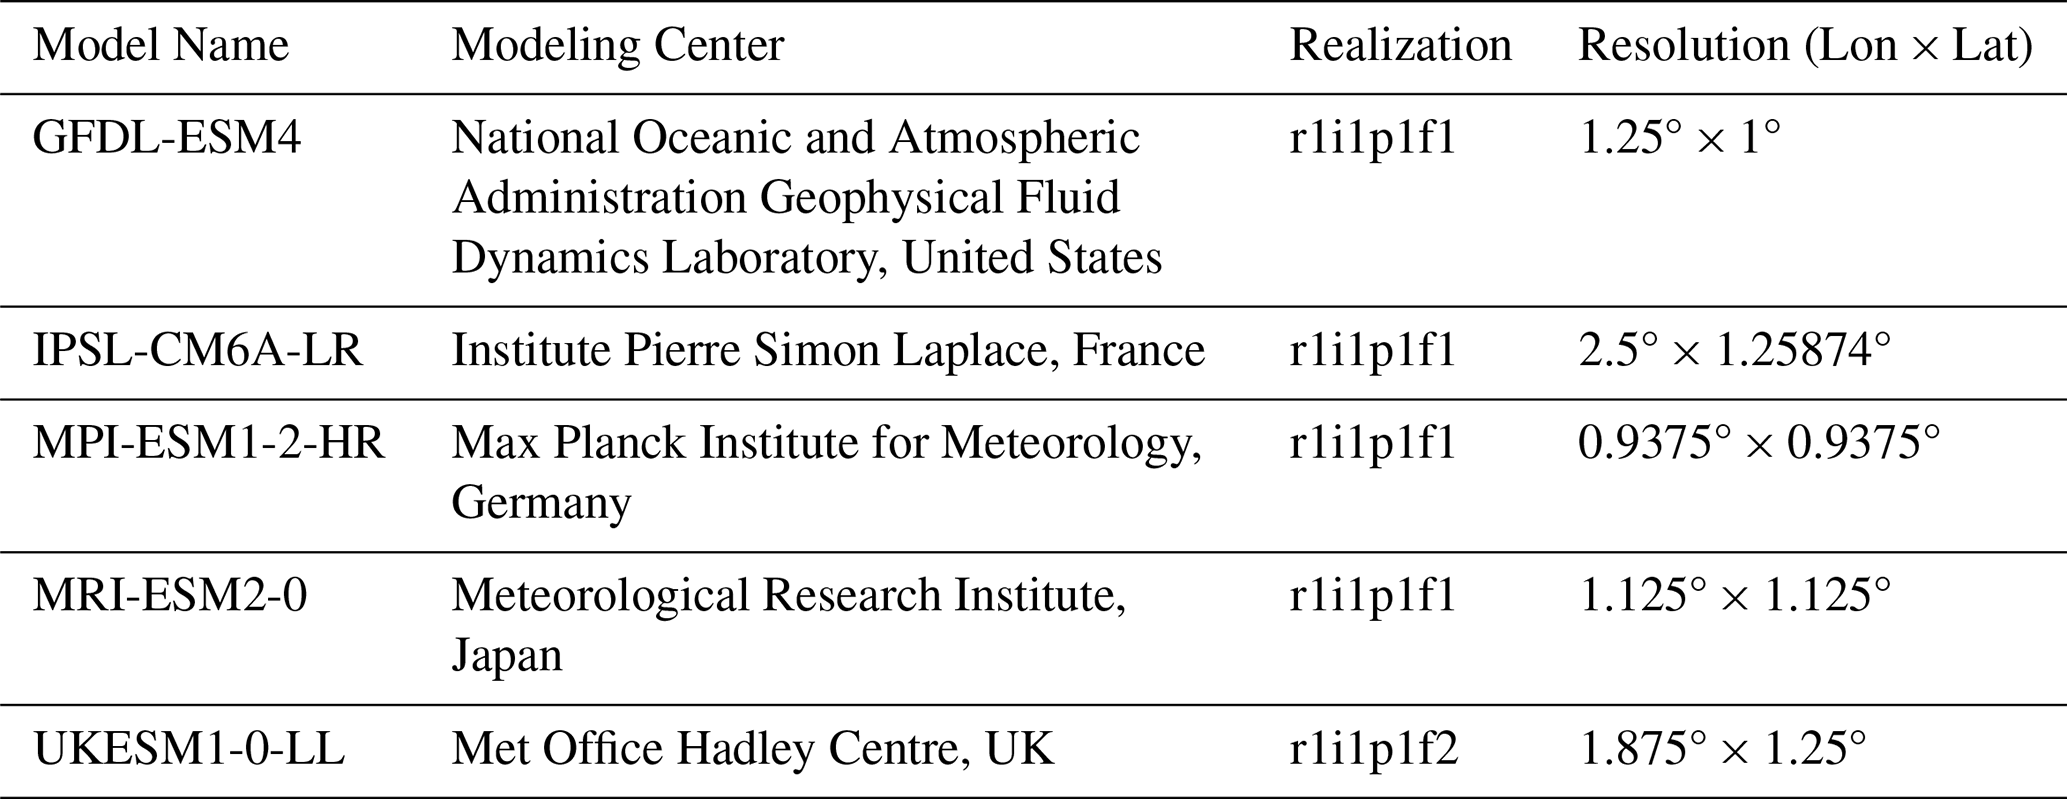
This study utilizes CMIP6 (Sixth Phase of Coupled Model Inter-comparison Project) data as the meteorological input to analyze DFAA. Three SSP (Shared Socioeconomic Pathways) scenarios, namely SSP1-2.6, SSP2-4.5, and SSP5-8.5, are considered to characterize the low-, medium-, and high-emission scenarios, respectively. Five GCMs (Global Climate Models) with wide utilization and proven performance in the LMR Basin are applied in this study (Li et al., 2021; Yun et al., 2021a; Yun et al., 2021b), i.e., GFDL-ESM4, IPSL-CM6A-LR, MPI-ESM1-2-HR, MRI-ESM2-0, and UKESM1-0-LL. The detailed information for these five GCMs is shown in Table 1 (Eyring et al., 2016; Gidden et al., 2019; Cui et al., 2023). CMIP6 data span from 1980 to 2100. This study accordingly considers three research periods: the history period from 1980 to 2014 (consistent with CMIP6), the near future period from 2021 to 2060, and the far future period from 2061 to 2100.
In this study, the daily observed runoff data at four major mainstream hydrological stations from 1980 to 2020 are used to calibrate and validate the hydrological model. These data are derived from the China Meteorological Administration (CMA) and the Mekong River Commission (MRC). The hydrological stations from upstream to downstream are sequentially JingHong, Nong Khai, Pakse, and Kratie, whose locations and basic information are shown in Fig. 1a and b. This study uses the ERA5_Land data as the meteorological input for calibrating and validating the hydrological model, and as the correction dataset for correcting the raw CMIP6 data. ERA5_Land data cover the period from 1980 to 2020, with a spatial resolution of 0.1°, and contain precipitation, temperature, and potential evapotranspiration. Soil data are obtained from the Global Soil Database (GSD) provided by the Food and Agriculture Organization of the United Nations (FAO) with a spatial resolution of 10 km × 10 km. Normalized Vegetation Index (NDVI), Leaf Area Index (LAI), and Snow Cover data are obtained from MODIS (Moderate-resolution Imaging Spectroradiometer) with a spatial resolution of 500 m × 500 m and a temporal resolution of 16 d.
Reservoir data are sourced from MRC and Mekong Region Futures Institute (MERFI) (MERFI, 2024). This study utilizes 122 reservoirs, which simultaneously contain information on location, storage, and operation years, including 24 reservoirs in the Lancang Basin and 98 reservoirs in the Mekong Basin. The earliest and latest operation years for them are 1965 and 2035. The location and storage distribution of these reservoirs are shown in Fig. 1a and c.
2.3 Bias correction method for CMIP6 data
The raw CMIP6 data require correction for more accurate modelling (Hoang et al., 2016; Mishra et al., 2020; Sun et al., 2023). The uncorrected raw CMIP6 data misestimate the temperature and precipitation in the LMR Basin, especially overestimating the precipitation (Cui et al., 2023; Lange, 2019; Lange, 2021). ERA5_Land data are used as correction data in this study to address bias in raw CMIP6 data.
This study interpolates the data from the five GCMs of CMIP6, which have different spatial resolutions, to 0.1° (consistent with ERA5_Land) using the bilinear interpolation spatial resolution method. The interpolated CMIP6 data are bias-corrected for each GCM according to an N-dimensional probability density function transform of the multivariate bias correction approach (abbreviated as MBCn) (Cannon, 2016, 2018). The MBCn method is trained based on the difference between precipitation and temperature data from ERA5_Land and CMIP6 over the history period (1980–2014), and then applied to the future period (i.e., 2021–2100) to correct the CMIP6 data for each GCM.
The MBCn method considers the multivariate dependency structure of meteorological data and enables the simultaneous correction of temperature and precipitation data. Random orthogonal rotation and quantile delta mapping are the two most critical formulas of the MBCn method (Cannon, 2018), as illustrated in Eqs. (1) and (2).
Equation (1) displays the process of random orthogonal rotation. It outlines the process of transforming historical observations , historical climate model simulations , and climate model projections using a random orthogonal rotation matrix R[l] during the lth iteration. The rotated data are represented as , , and . This procedure is pivotal for MBCn's multivariate joint distribution correction, as it transforms the original variable space into new random orientations. In contrast to conventional univariate correction approaches, MBCn employs a random orthogonal matrix to mix variables, thereby breaking their independence.
Equation (2) exhibits the quantile delta mapping, which defines how quantile delta mapping is applied to the nth dimension of the rotated climate model projection data within the rotated space of the lth iteration. Here, Δ(n)[l](i) represents the quantile difference between the historical climate model simulations and climate model projections in the lth iteration and the nth dimension. denotes the empirical cumulative distribution function for the rotated climate model projection data in the nth dimension. and denote inverse Functions of the empirical cumulative distribution functions for the rotated historical observation data and historical climate model simulation data in the nth dimension. This step preserves the trend of the climate model projection data throughout the correction process. The number of iterations is typically set to 10–30.
The MBCn algorithm performs multivariate joint distribution bias correction by iteratively applying random orthogonal rotation and quantile delta mapping, while preserving the projected signals in the climate model. The rotation operation breaks dependencies between variables, enabling the quantile delta mapping of a single variable to indirectly adjust multivariate correlations. The quantile delta mapping ensures the transmission of absolute or relative trends by computing quantile differences between the historical and projected periods of the climate model. The MBCn method has been reported to increase correction precision and accuracy compared to univariate and other multivariate bias correction algorithms (Cannon, 2018).
In addition, this study utilized the method proposed by van Pelt et al. (2009) to compute daily potential evapotranspiration data for five GCMs under three SSP scenarios, based on daily temperature. The computational approach is outlined in Eq. (3).
Where, and correspond to the daily air temperature (°C) and daily potential evapotranspiration (mm d−1) in the history period sourced from ERA5_Land dataset. T signifies the corrected daily air temperature (°C) from CMIP6 dataset. The parameter α0 is determined by the relationship between daily potential evapotranspiration and daily temperature in ERA5_Land data during the history period.
2.4 Hydrological model coupled with reservoir module
The THREW (Tsinghua Representative Elementary Watershed) hydrological model is applied in this study for runoff simulation. It utilizes the Representative Elementary Watershed (REW) approach for spatial division, and further subdivides the REW into eight distinct hydrological zones: vegetated zone, bare soil zone, glacier covered zone, snow covered zone, sub-stream-network zone, main channel reach, saturated zone, and unsaturated zone (Tian et al., 2006; Mou et al., 2008).
The model is built upon scale-coordinated equilibrium equations, geometrical relationships, and constitutive relationships, and enables comprehensive simulation of complex hydrological processes from mountain to ocean. The fundamental balance equations in the THREW model are listed in Eqs. (4) to (6).
Equation (4) demonstrates the general form of the mass conservation equation at the REW scale. denotes the time derivative. refers to the time-averaged density of phase α in sub-region j, in kg m−3. means the volume fraction of phase α within sub-region j. yj indicates the time-averaged thickness of sub-region j, in m. ωj means the time-averaged fraction of REW horizontal area occupied by sub-region j. denotes the net mass exchange flux of phase α in sub-region j through interface P (e.g., with atmosphere, groundwater, neighboring REWs), in kg m−2 s−1, where a positive value indicates the inflow to sub-region j. refers to the phase transition rate between phase α and phase β within sub-region j, in kg m−2 s−1, where a positive value indicates phase α gains mass from phase β. Sub-region here refers to the eight zones within each REW.
Equation (5) presents the general form of the momentum conservation equation at the REW scale. indicates the time-averaged velocity vector of phase α in sub-region j, in m s−1. denotes the time-averaged gravity vector of phase α in sub-region j, in m s−2. means the force vector (pressure, friction, seepage) exerted on phase α in sub-region j by interface P, in N s−2, representing the momentum exchange. refers to the interfacial force vector between phase α and phase β within sub-region j, in N s−2, including drag and capillarity.
Equation (6) exhibits the general form of the heat conservation equation at the REW scale. means the specific heat capacity (constant volume) of phase α in sub-region j, in J kg−1 K−1. refers to the time-averaged temperature of phase α in sub-region j, in K. denotes the heat generation rate per unit mass within phase α in sub-region j, in W kg−1 (e.g., radioactive decay, negligible usually). indicates the heat exchange rate between phase α in sub-region j and its environment via interface P, in W m−2, with the positive value representing the heat gained by phase α in sub-basin j. refers to the heat exchange rate between phase α and phase β within sub-region j, in W m−2, with a positive value indicating that heat is gained by phase α.
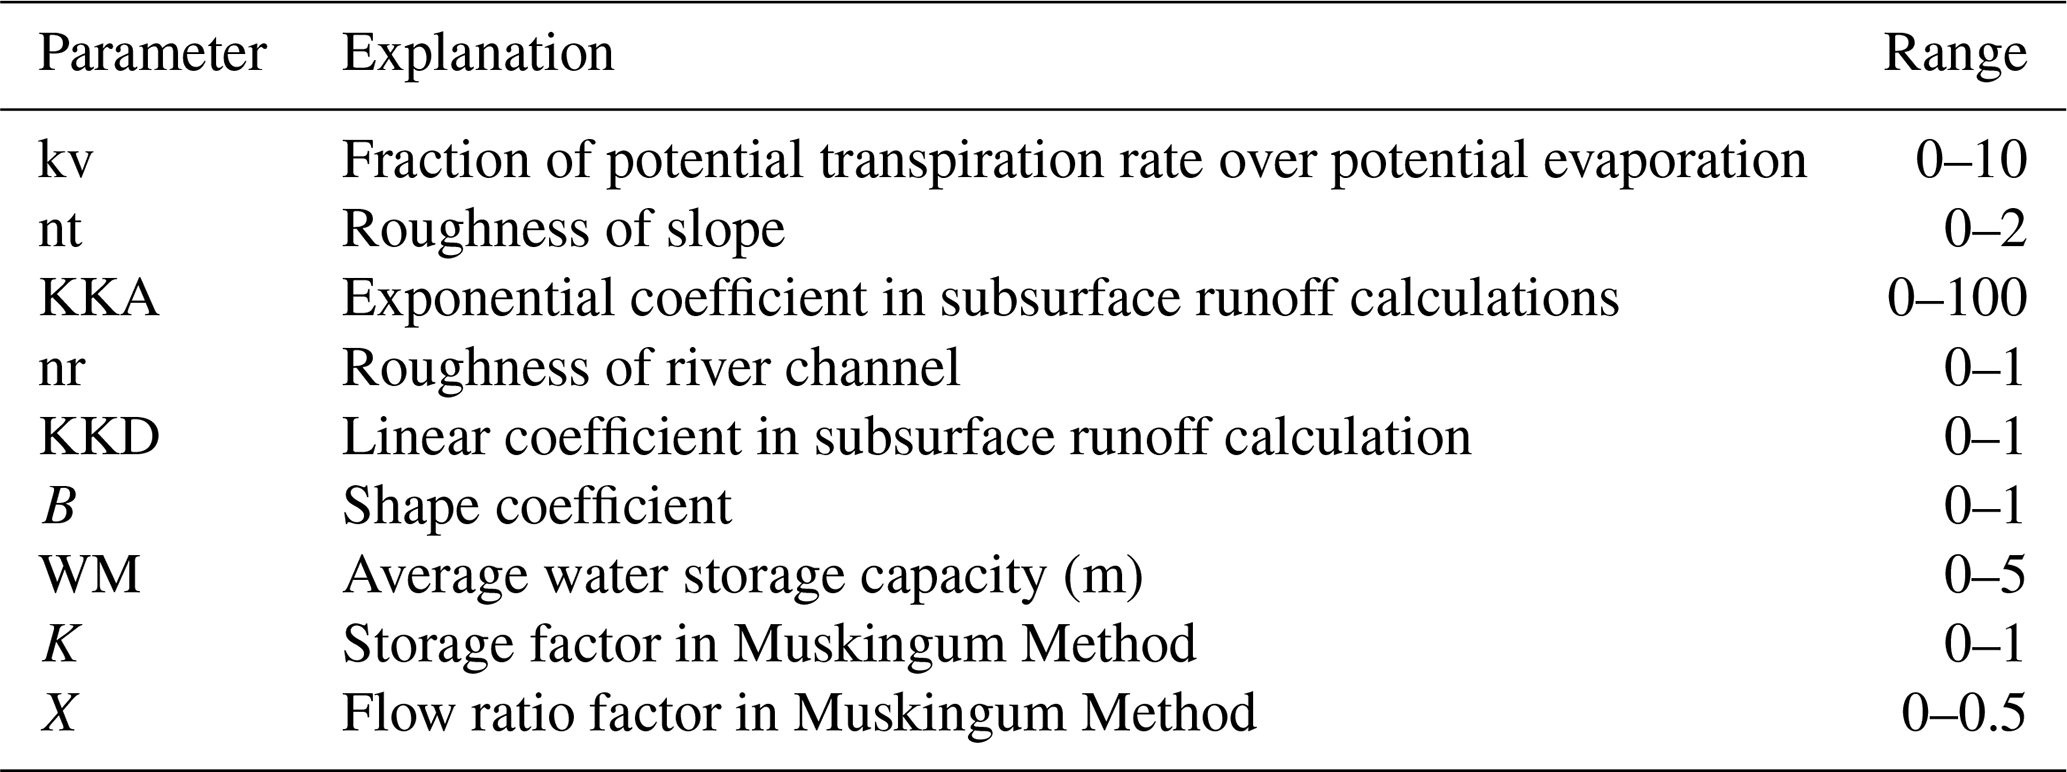
The THREW model employs an automatic calibration procedure to calibrate hydrological parameters through parallel computation (Nan et al., 2021). The calibration period of the THREW model in the LMR Basin is from 2000 to 2009, and the validation period is from 2010 to 2020. The calibration process involves nine hydrological parameters. A compilation of their explanations and permissible value ranges is given in Table 2. The Nash-Sutcliffe efficiency coefficient (NSE) indicator is adopted to calibrate the objective function and evaluate simulation effectiveness at the daily scale, which is calculated according to Eq. (6). The THREW model has been successfully applied to a number of basins with various climate characteristics worldwide (Tian et al., 2012; Lu et al., 2021; Morovati et al., 2023; Cui et al., 2023; Zhang et al., 2023).
Where, is the daily observed runoff, is the daily simulated runoff, is the average of observed runoff, and N is the total number of days.
This study extends the THREW model by developing and integrating a reservoir management module. This integration allows the expanded THREW model to use detailed information on 122 reservoirs in the LMR Basin, with operational years ranging from 1965 to 2035. By specifying whether the module is active, the model can simulate either natural runoff (without considering reservoirs) or dammed runoff (with reservoirs included). This setup ensures a seamless interaction between the core model and the reservoir operations framework.
Reservoir operation follows consistent rules across time and space, with each reservoir starting operation according to its operational year. Strategies are adapted in response to inflow fluctuations and administered on a daily scale. Each reservoir is assigned based on location. Cumulative multi-year sub-basin storage is calculated as input for the reservoir module, which operates in two phases: initial and normal. The normal phase is divided into general and emergency cases, both using the same operation rules but differing constraints; the emergency case allows more flexibility. The module's flowchart is illustrated in Fig. 2.
If a REW's cumulative multi-year storage changes within a year, it signals the start of a new reservoir's operation, which follows initial phase rules. During the initial phase, the outlet flow matches the inlet if it is below the minimum discharge constraint; otherwise, it meets the minimum discharge constraint. The rules for the initial phase are described as Eqs. (8) to (9). Storage and discharge constraints are defined in Eqs. (10) to (11) (Tennant, 1976; Yun et al., 2020). The initial phase ends when reservoir storage exceeds the minimum constraint (Eq. 12), then transitions to the normal phase.
Where Qout is the outlet flow, Qin is the inlet flow, Qmin is the minimum discharge constraint, St is the storage for time t, Smin is the minimum storage constraint, Stotal is the total storage, and Qave is the average multi-year runoff during the calibration period (i.e., 2000–2009).
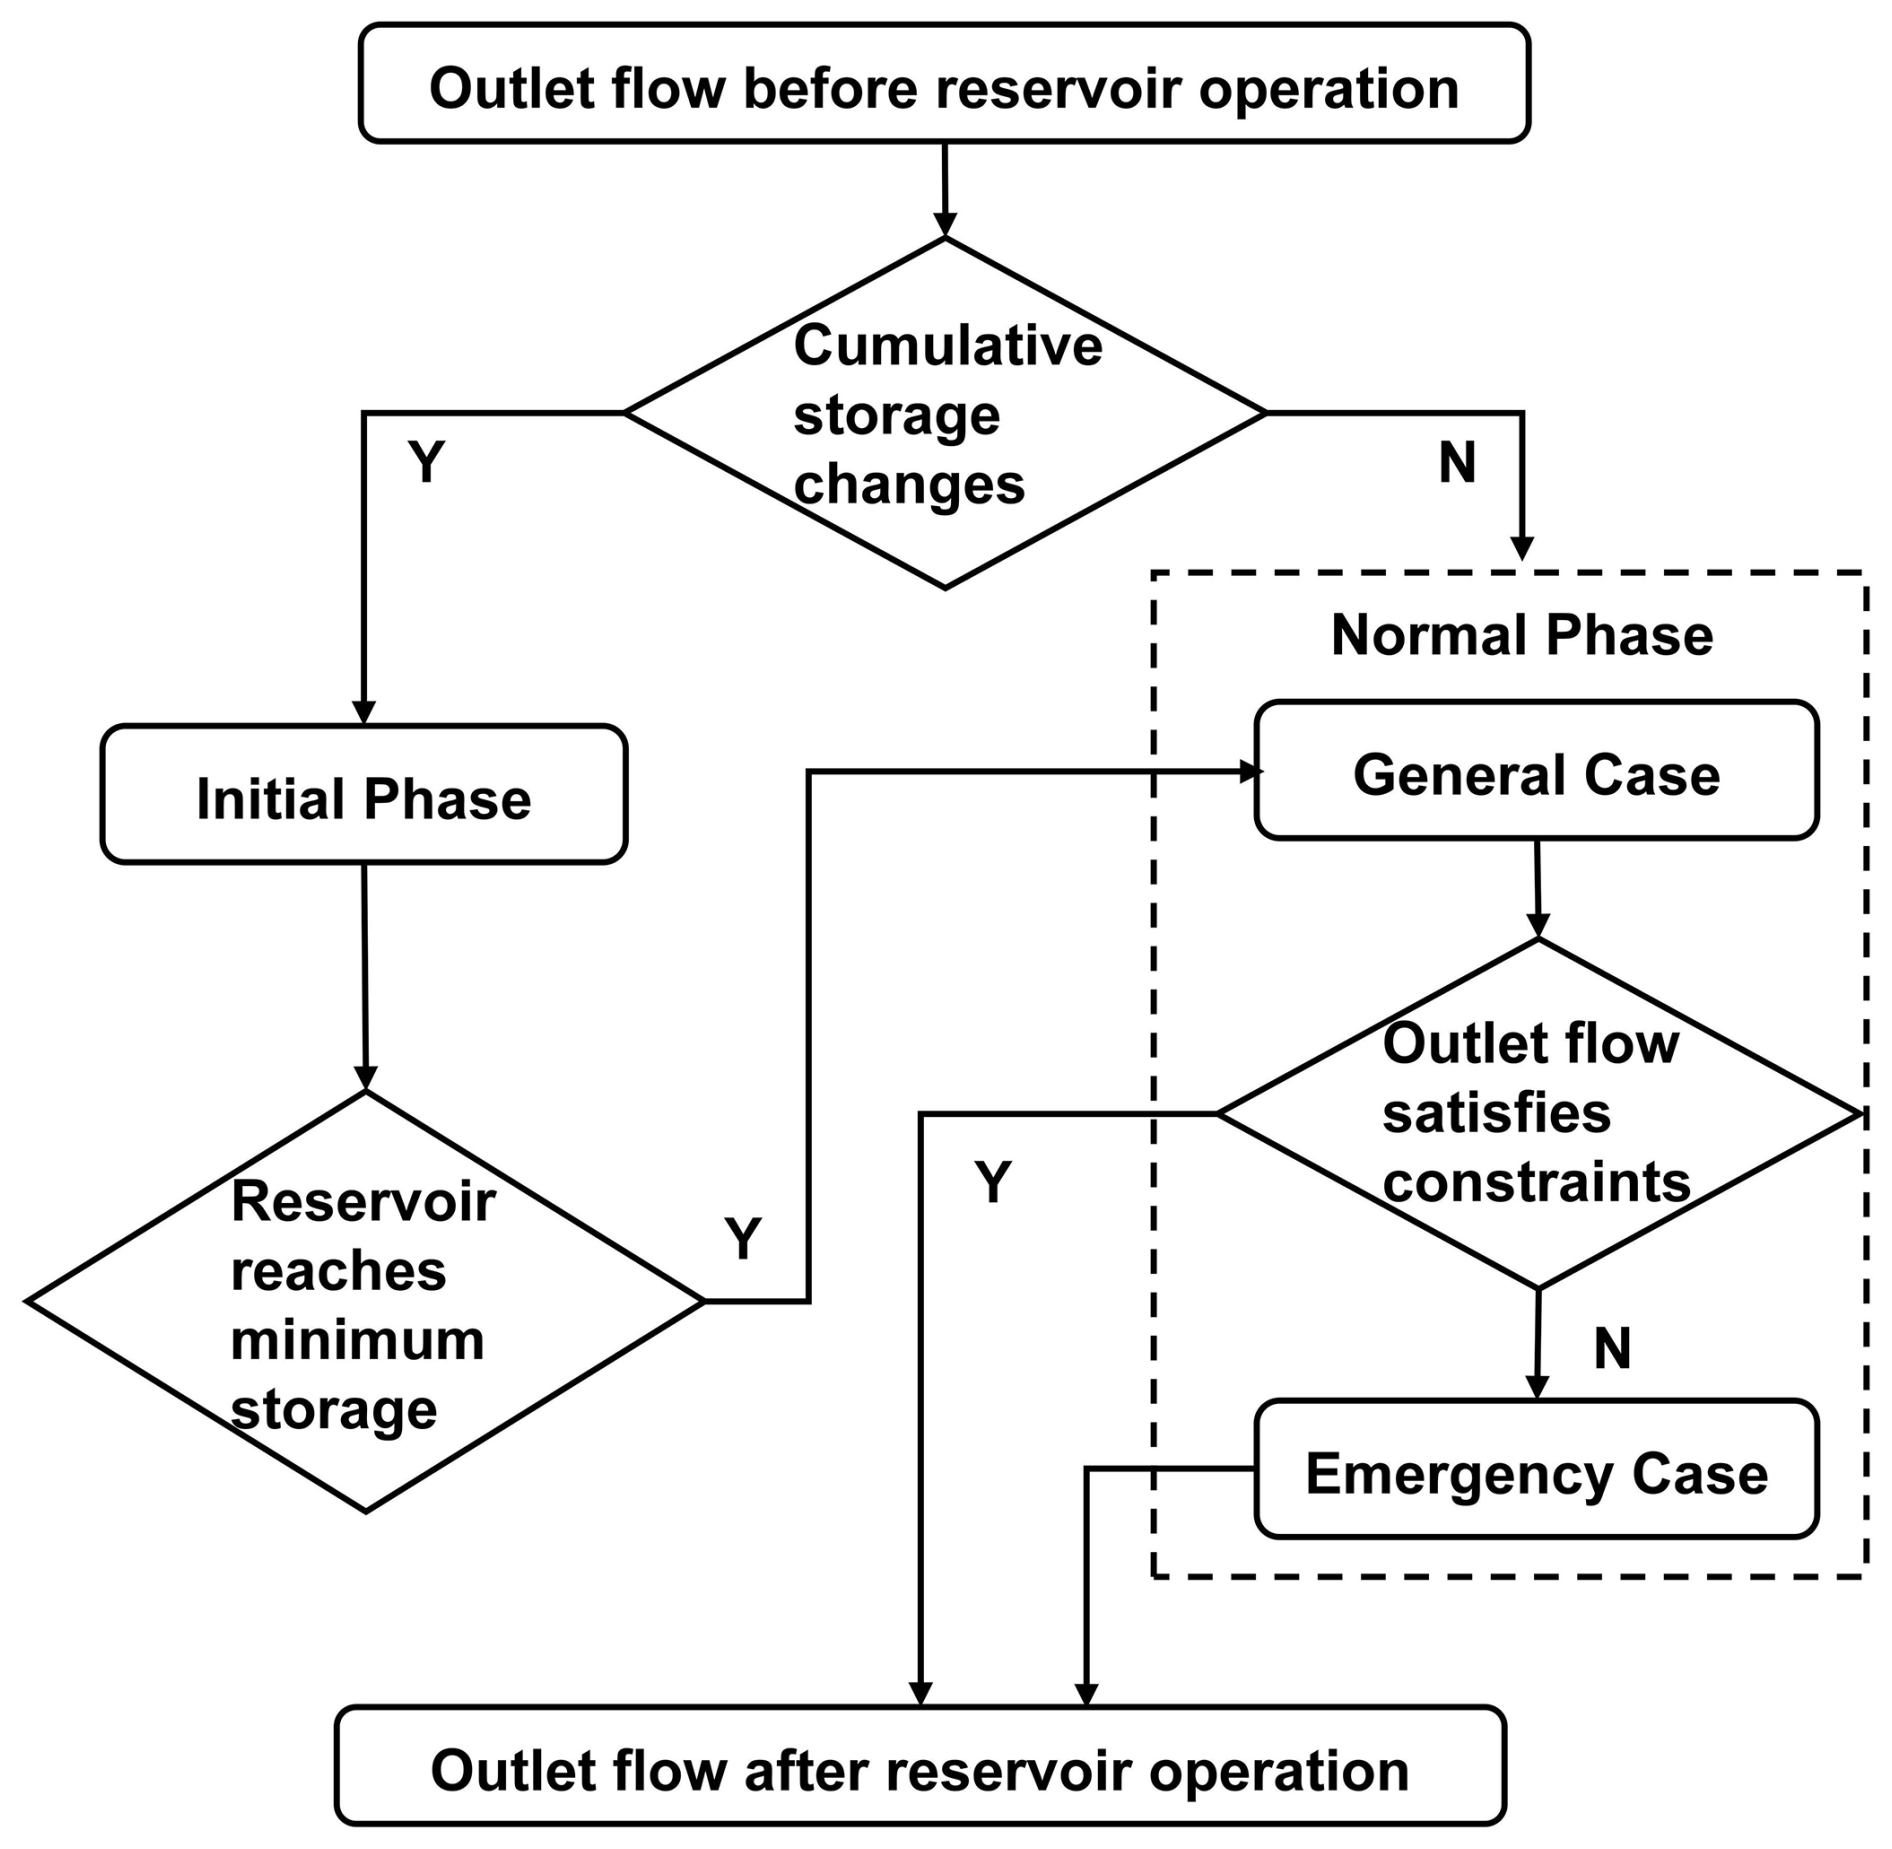
The scheduling rule for the normal phase is the improved Standard Operation Policy hedging model (SOP) (Wang et al., 2017a; Morris and Fan, 1998), as depicted in Eq. (9) and Eqs. (13) to (16). The SOP operating policy is proven to effectively capture floods and droughts under reservoir regulation (Wang et al., 2017a; Yun et al., 2020, 2021a, 2021b). Under the premise of water balance (Eq. 9), constraints for annual storage (Eq. 13), outlet flow (Eq. 14), wet season storage (Eq. 15), and dry season storage (Eq. 16) are considered separately, where priority is given to the annual storage constraint (Eq. 13).
Where Qmax is the maximum discharge constraint, Smax is the maximum storage constraint, Sc is the storage corresponding to the flood control level, and Sn is the storage corresponding to the normal water level.
When in the normal phase, the reservoir first applies general case constraints (Eqs. 17 to 22). If outlet flow is not fully satisfied (Eq. 14), constraints switch to the emergency case, and the reservoir is rescheduled. Equation (23) signals an emergency case start, which provides more flexible flow limits to avoid extremes. Emergency case constraints are in Eqs. (24) to (25).
Where is the outlet flow after the scheduling in the general case.
2.5 Indicator for DFAA
It is common practice to quantify DFAA incidents via indices. Long-cycle droughts-floods abrupt alternation index (LDFAI), proposed by Wu et al. (2006), quantitatively characterizes long-term DFAA during the wet season and has been widely adopted (Ren et al., 2023; Shi et al., 2021; Yang et al., 2022; Yang et al., 2019). Building on this, Zhang et al. (2012) introduced the one-month interval SDFAI (short-cycle droughts-floods abrupt alternation index), extending its application from precipitation to runoff and characterizing short-term DFAA. SDFAI has since been applied in fields such as hydrology, meteorology, ecology, and agriculture (Zhao et al., 2022; Lei et al., 2022; Yang et al., 2019; Zhang et al., 2019).
Song et al. (2023) proposed the Revised Short-cycle Drought-Flood Abrupt Alteration Index (R-SDFAI), which extends the LDFAI and SDFAI time frame from only the flood season to the entire year, facilitating multi-year DFAA analysis. R-SDFAI also addresses issues of over-identification, under-identification, and misrepresentation of DFAA severity found in SDFAI. Therefore, this study uses R-SDFAI for DFAA analysis, with the formulas outlined in Eqs. (26) to (31) (Song et al., 2023).
Where, Si refers to the SRI in month i, F1 denotes the intensity of DFAA, F2 denotes the absolute intensity of drought and flood, and F is a weighting factor between 0 and 1. refers to I′ when I=0.5.
The calculation process of the SRI indicator utilized in this work is elucidated in Eqs. (32) to (37). The runoff simulated by the THREW model for the LMR Basin conforms to a Gamma distribution, as detailed in the Sect. S1 in the Supplement. Hence, the Gamma distribution is adopted to derive the SRI index. Equation (32) gives the probability density function that satisfies the Gamma distribution for runoff x at a given time period.
Where, α>0 and β>0 are respectively the shape and scale parameters. and are the optimal values of α and β, obtained according to the maximum likelihood estimation method, as illustrated in Eqs. (33) to (35). Γ(α) is the gamma function, as given in Eq. (36).
Where, xi is the sample of runoff sequence, is the average runoff, and “num” is the length of the runoff sequence.
Then the cumulative probability of runoff x is illustrated in Eq. (37).
Table 3The evaluation criteria and intensity classification for DFAA events.
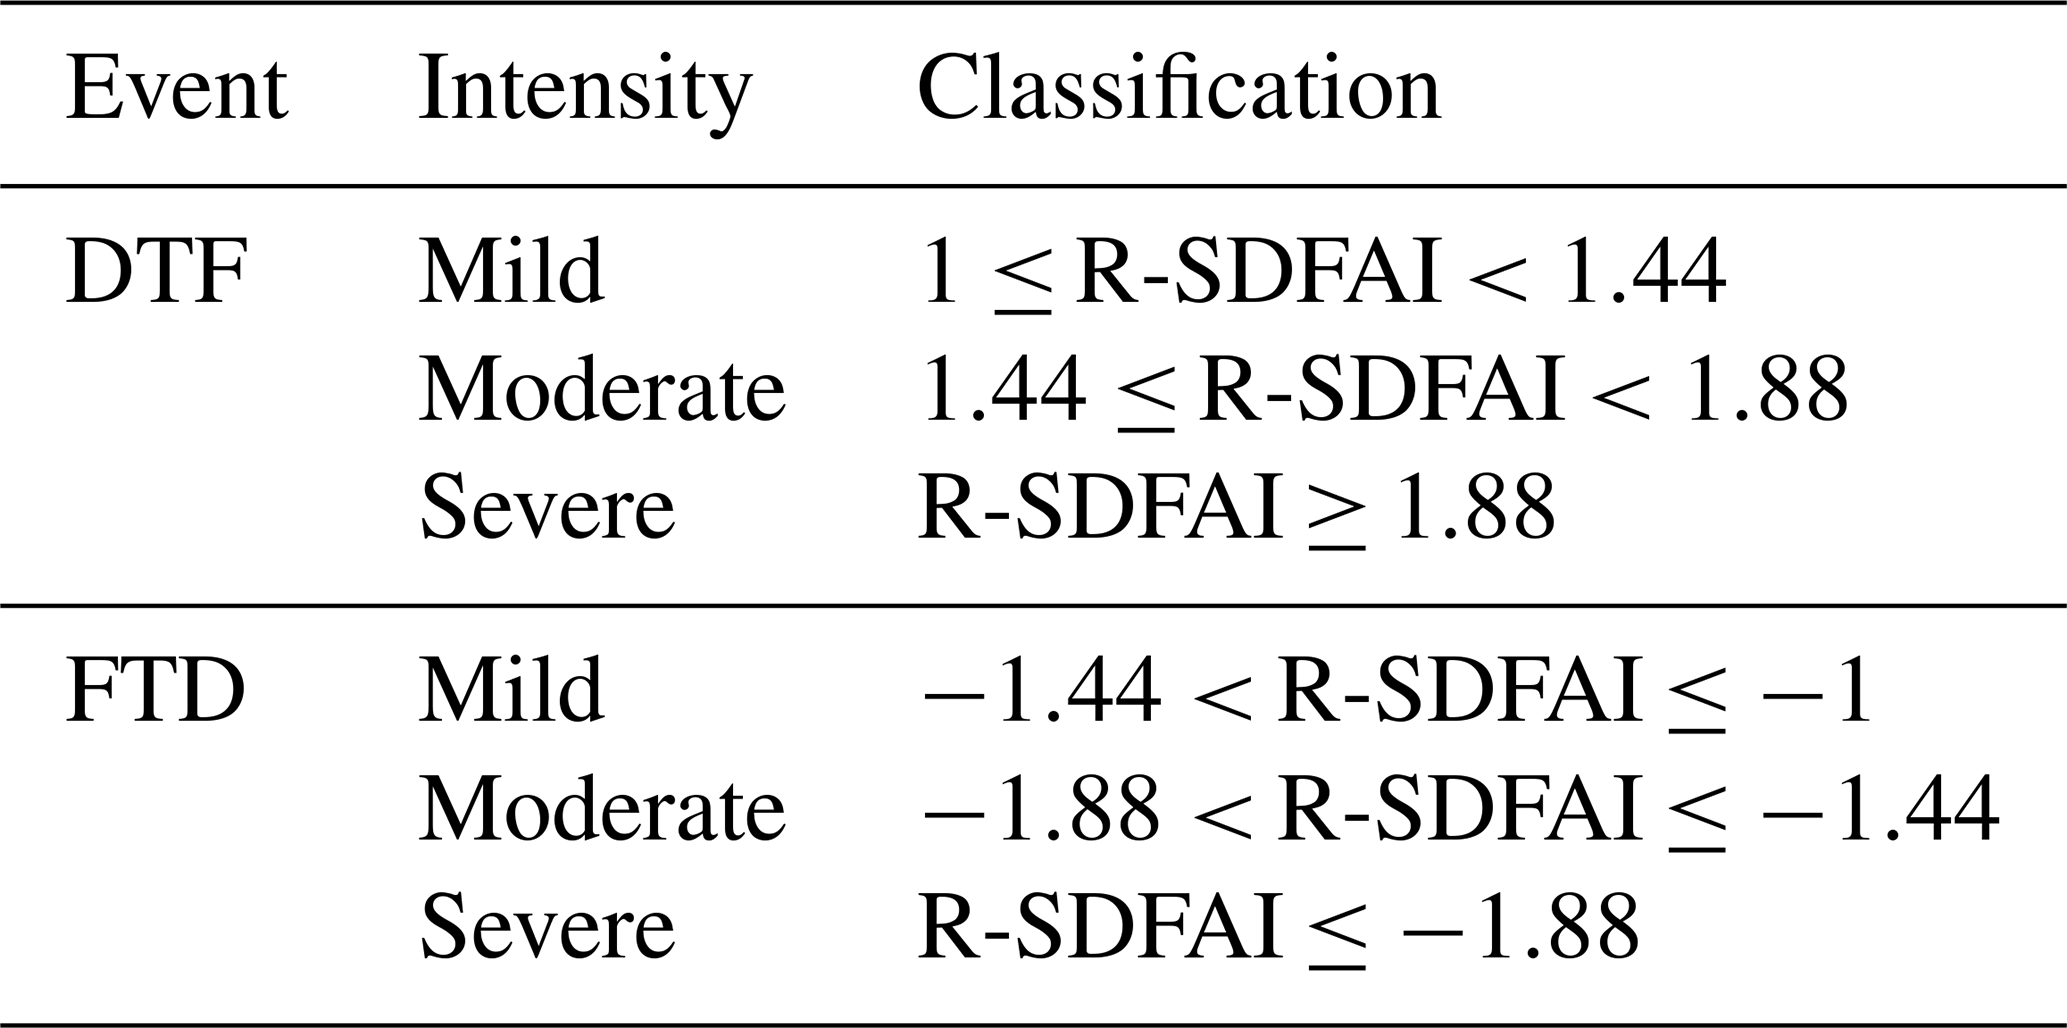
The R-SDFAI index identifies DFAA events with a threshold of ±1 (Song et al., 2023), and further categorizes DFAA events into three intensity levels – mild, moderate, and severe – using thresholds of ±1, ±1.44, and ±1.88, as demonstrated in Table 3. This classification follows the criteria proposed by Song et al. (2023). The underlying rationale involves using ±0.5, ±1, and ±1.5 as thresholds for the SRI index to categorize extreme hydrological events into mild, moderate, and severe droughts and floods (positive values indicate flood, while negative values indicate drought). The R-SDFAI index values of ±1, ±1.44, and ±1.88 are calculated through the transitions between mild drought and mild flood, moderate drought and moderate flood, and severe drought and severe flood. These thresholds serve as the classification criteria for mild, moderate, and severe DFAA events. For a more detailed explanation of this classification standard, please refer to Song et al. (2023). In this study, the frequency of DFAA events is represented by their occurrence probabilities during history, near future, and far future periods, while the intensity of DFAA is assessed through the probability of different intensity events.
2.6 Scenario Setting
This study examines two scenarios: dammed (with reservoir operations) and natural (without reservoir operations). Meteorological data from five GCMs under three SSPs are downscaled to the REW scale and used as input for the THREW model. The model, with the reservoir module, simulates runoff at key hydrological stations for the history period (1980–2014), the near future (2021–2060), and the far future (2061–2100). Both scenarios – with and without reservoir management – are examined. The R-SDFAI indicator evaluates DFAA event probabilities for each period and for each scenario, using runoff simulated by 5 GCMs and 3 SSPs.
This study adopts the difference in DFAA's probability between the natural scenario (without reservoir operations) and the dammed scenario (with reservoir operations) to capture the reservoir's impact, as shown in Eq. (38).
Where represents the impact of reservoirs on the probability of event e in period i. denotes the probability of event e under the natural scenario in period i, while denotes the probability of event e under the dammed scenario in period i. Period i refers to near future or far future. Event e indicates DTF, FTD, or DFAA.
Equations (39) and (40) give the definitions of and described above.
Where denotes the number of months in which event e occurs in period i under the natural scenario. denotes the number of months occurred event e in period i under the dammed scenario. TMi refers to the total number of months in period i. Period i refers to near future or far future. Event e indicates the DTF, FTD, or DFAA.
As each GCM possesses a unique structure and assumptions, projections of climate change by a single GCM inherently possess uncertainties, which in turn introduce uncertainties in the simulation of hydrological outcomes (Kingston et al., 2011; Thompson et al., 2014). Thus, averaging across multiple GCMs is a crucial approach, as it minimizes model biases, eliminates outliers, reduces uncertainties, and ensures more robust and universally applicable outcomes (Lauri et al., 2012; Hoang et al., 2016; Hecht et al., 2019; Wang et al., 2024; Yun et al., 2021b). This method has been extensively employed in prior studies (Dong et al., 2022; Li et al., 2021; Wang et al., 2022; Yun et al., 2021a). Therefore, this research determines the average DFAA probability from five GCMs to lessen the uncertainty in their predictions and assesses the fluctuation in these probabilities across the models to demonstrate their variability.
3.1 CMIP6 data bias correction performance
From both regional and seasonal perspectives, the uncorrected raw CMIP6 data show significant discrepancies with ERA5_Land data during the history period (1980–2014). When compared with ERA5_Land data, the uncorrected raw CMIP6 data reveal an average annual precipitation bias of around ±1800 mm and an average daily temperature bias of approximately ±12 °C (Fig. 3b and e). These notable inconsistencies highlight that using uncorrected CMIP6 data for hydrological modeling would incur considerable inaccuracies. However, CMIP6 data corrected by the MBCn method deviate from ERA5_Land data by less than ±120 mm of average annual precipitation and ±0.2 °C of average daily temperature (Fig. 3c and f). The bias correction greatly improves CMIP6 data accuracy in the LMR Basin. The corrected CMIP6 data also match the seasonal cycle of ERA5_Land well for both precipitation and temperature (Fig. 3g). Compared to the raw data, the corrected CMIP6 shows much improved spatial and temporal accuracy, leading to more accurate and reasonable analyses for DFAA.
3.2 Calibration and validation for the hydrological model
The daily observed runoff and daily simulated runoff from the THREW model for the calibration period (2000–2009) and validation period (2010–2020) are illustrated in Fig. 4, demonstrating the model's strong performance. Importantly, since there was no massive reservoir construction in the LMR Basin before and during the calibration period (Zhang et al., 2023), the THREW model without the reservoir module is applied for calibration. Meanwhile, the addition of large-scale reservoirs during the validation period allows validation of the THREW model configuration with the reservoir module, Notably, the THREW model captures runoff fluctuations between wet and dry seasons with high accuracy, achieving an NSE of at least 0.8 during both periods. This excellent simulation performance extends across both upstream and downstream regions, emphasizing the robustness of the model under observed conditions.
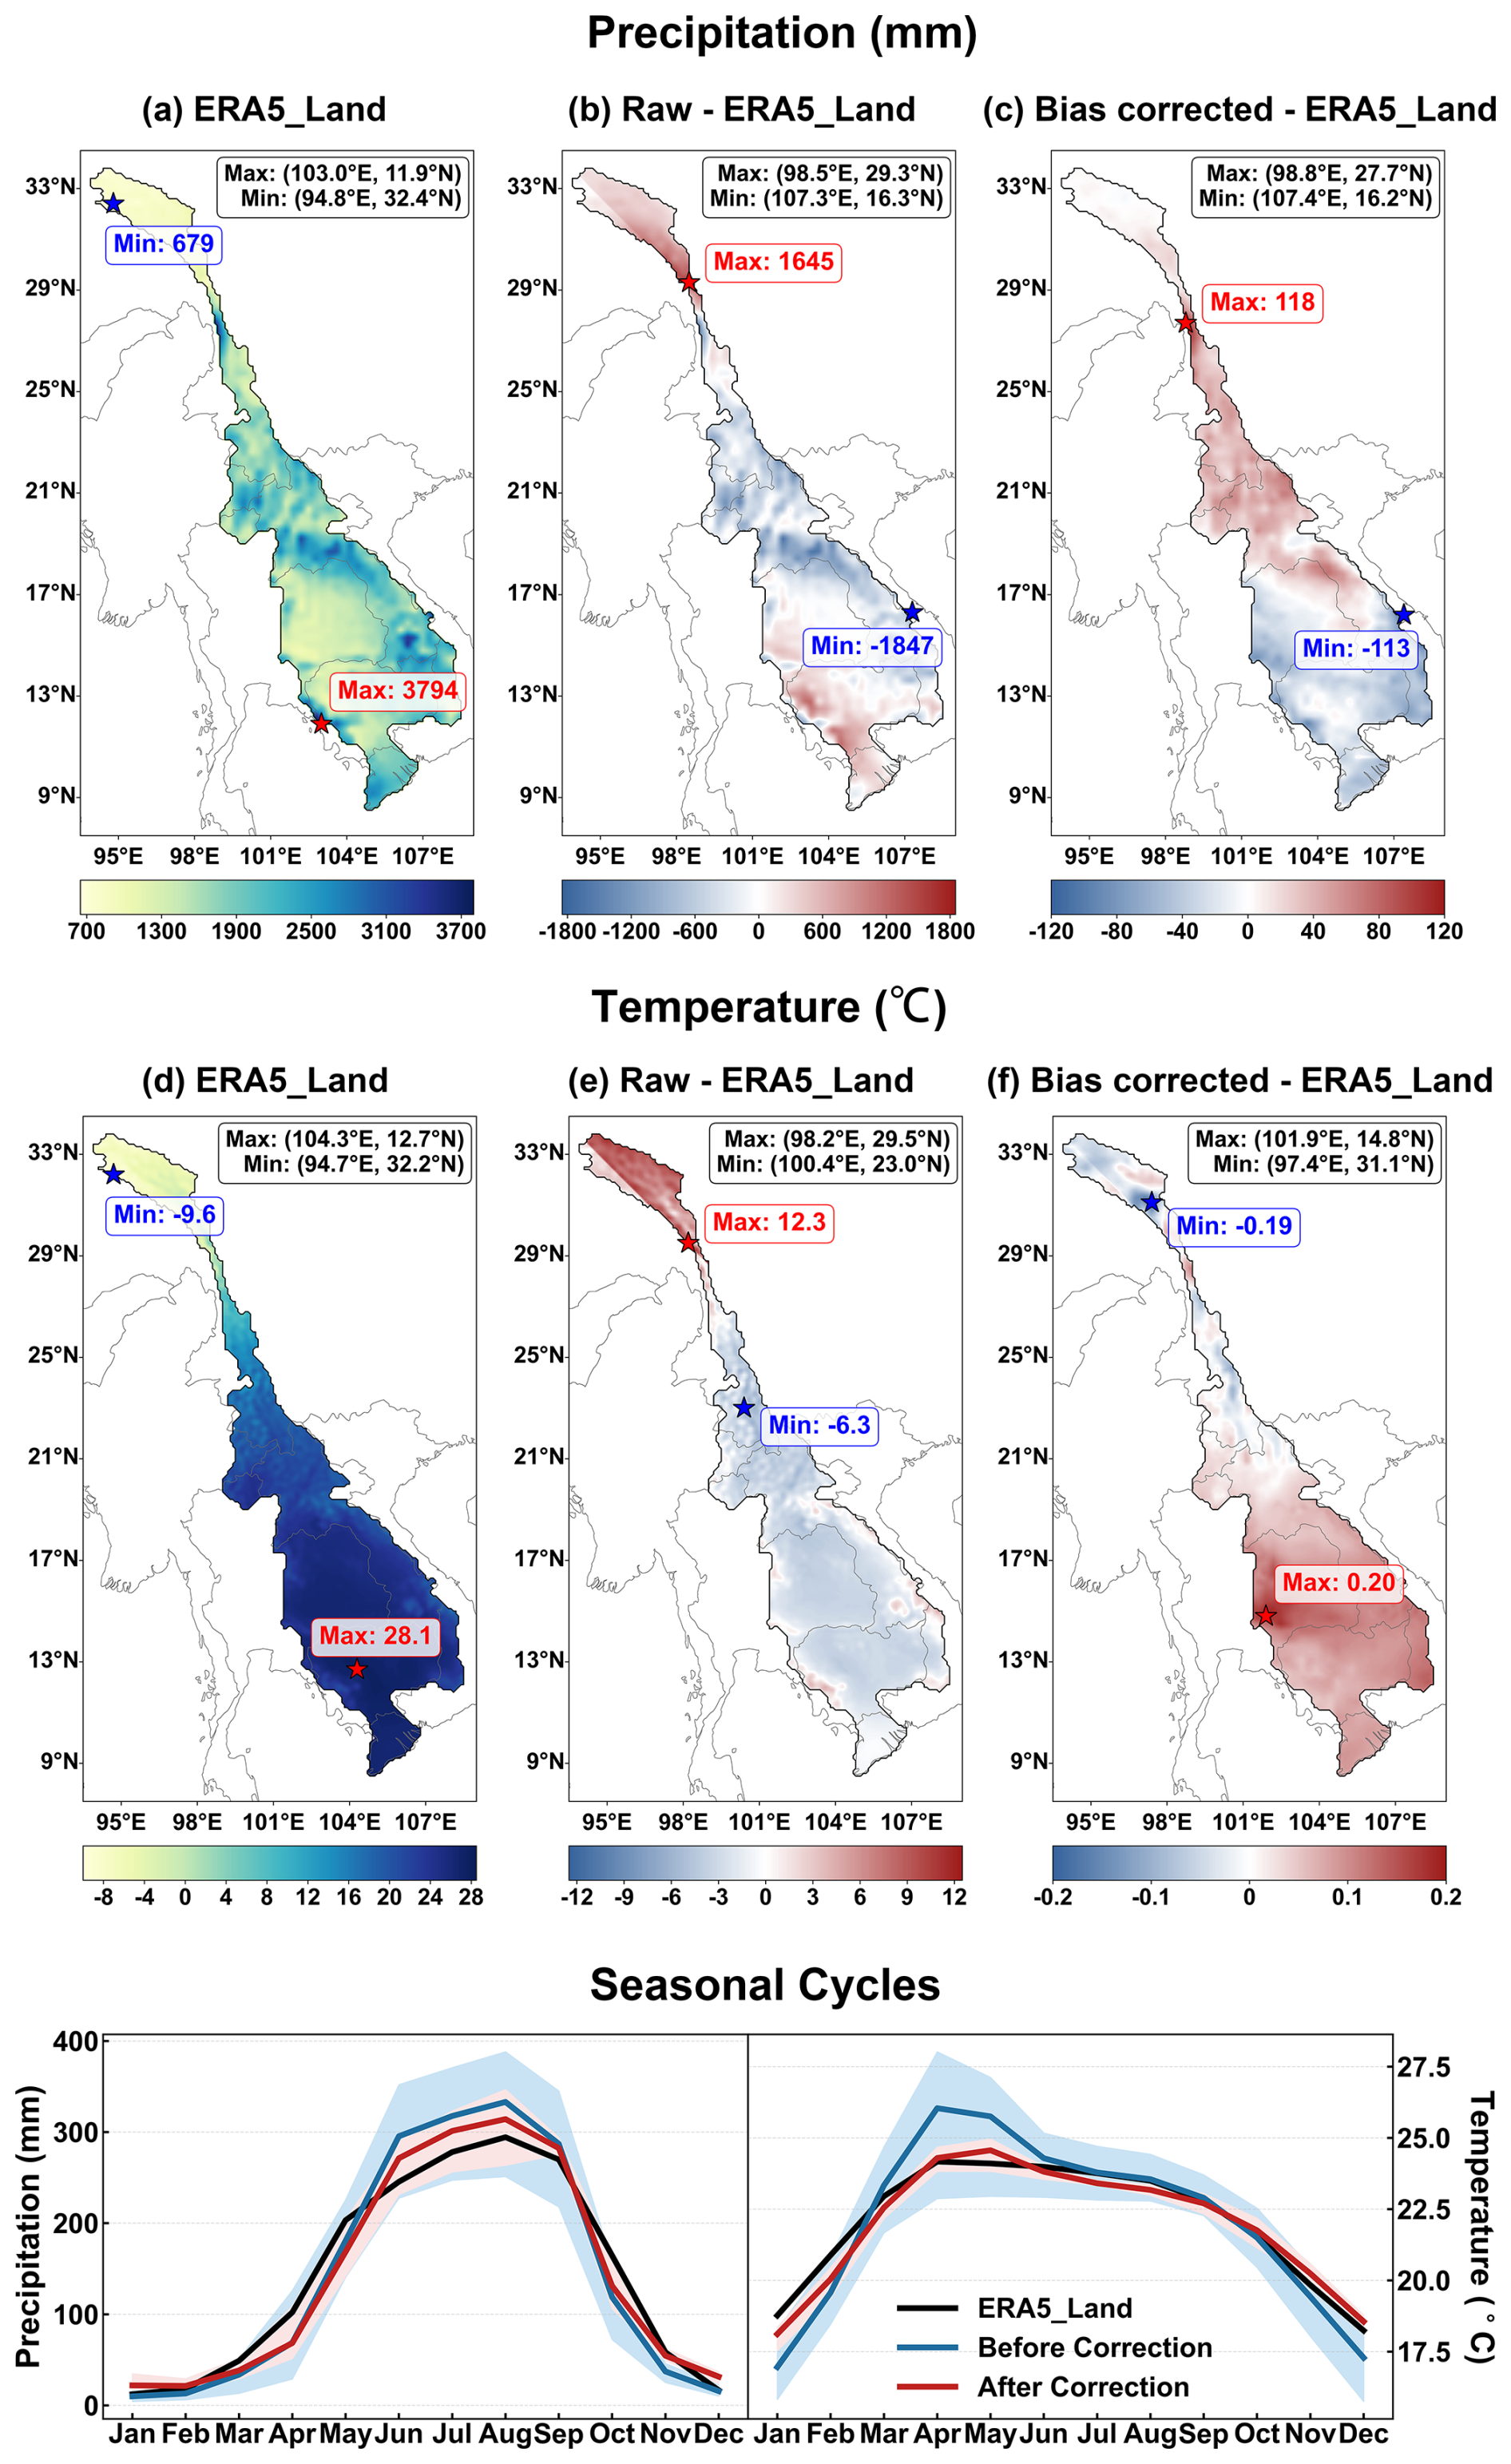
Figure 3Averaged meteorological data of 5 GCMs for the history period (1980–2014). Here, 5 GCMs are corrected separately. The red and blue star symbols respectively indicate the locations of the maximum and minimum values in (a) to (f). (a) to (c) present the spatial distribution of precipitation based on respectively ERA5_Land, raw CMIP6 (raw CMIP6 minus ERA5_Land) and bias-corrected CMIP6 (bias-corrected CMIP6 minus ERA5_Land). (d) to (f) illustrate the spatial distribution of temperature based on ERA5_Land, raw CMIP6 (raw CMIP6 minus ERA5_Land) and bias-corrected CMIP6 (bias-corrected CMIP6 minus ERA5_Land). (g) shows seasonal cycles of temperature and precipitation from ERA5_Land, raw and bias-corrected CMIP6, as well as their corresponding range.
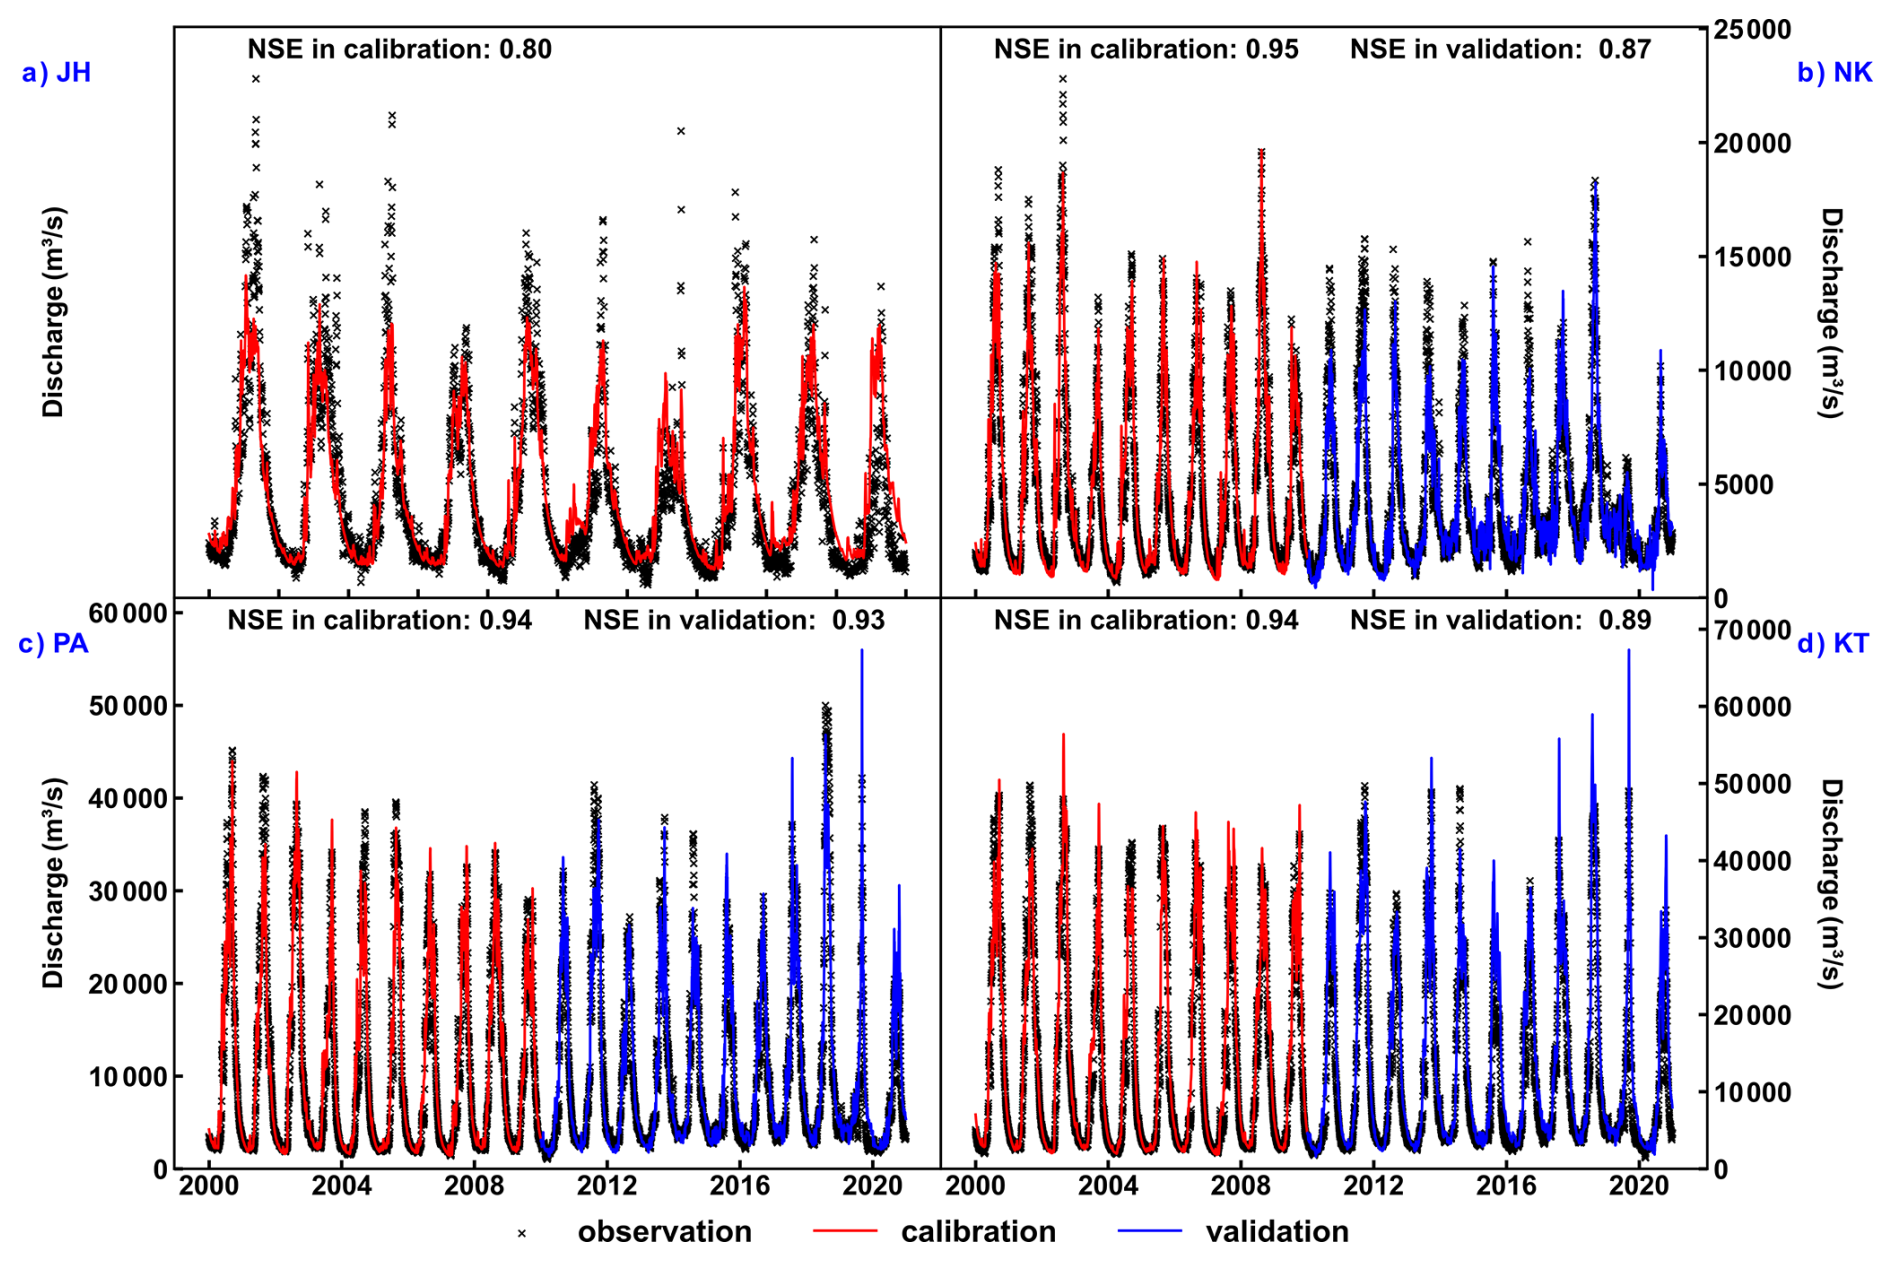
Figure 4Performance of the THREW model in calibration (2000–2009) and validation (2010–2020) periods. Here, JH, NK, PA, and KT denote JingHong, Nong Khai, Pakse, and Kratie stations, respectively.
3.3 DFAA under the changing climate
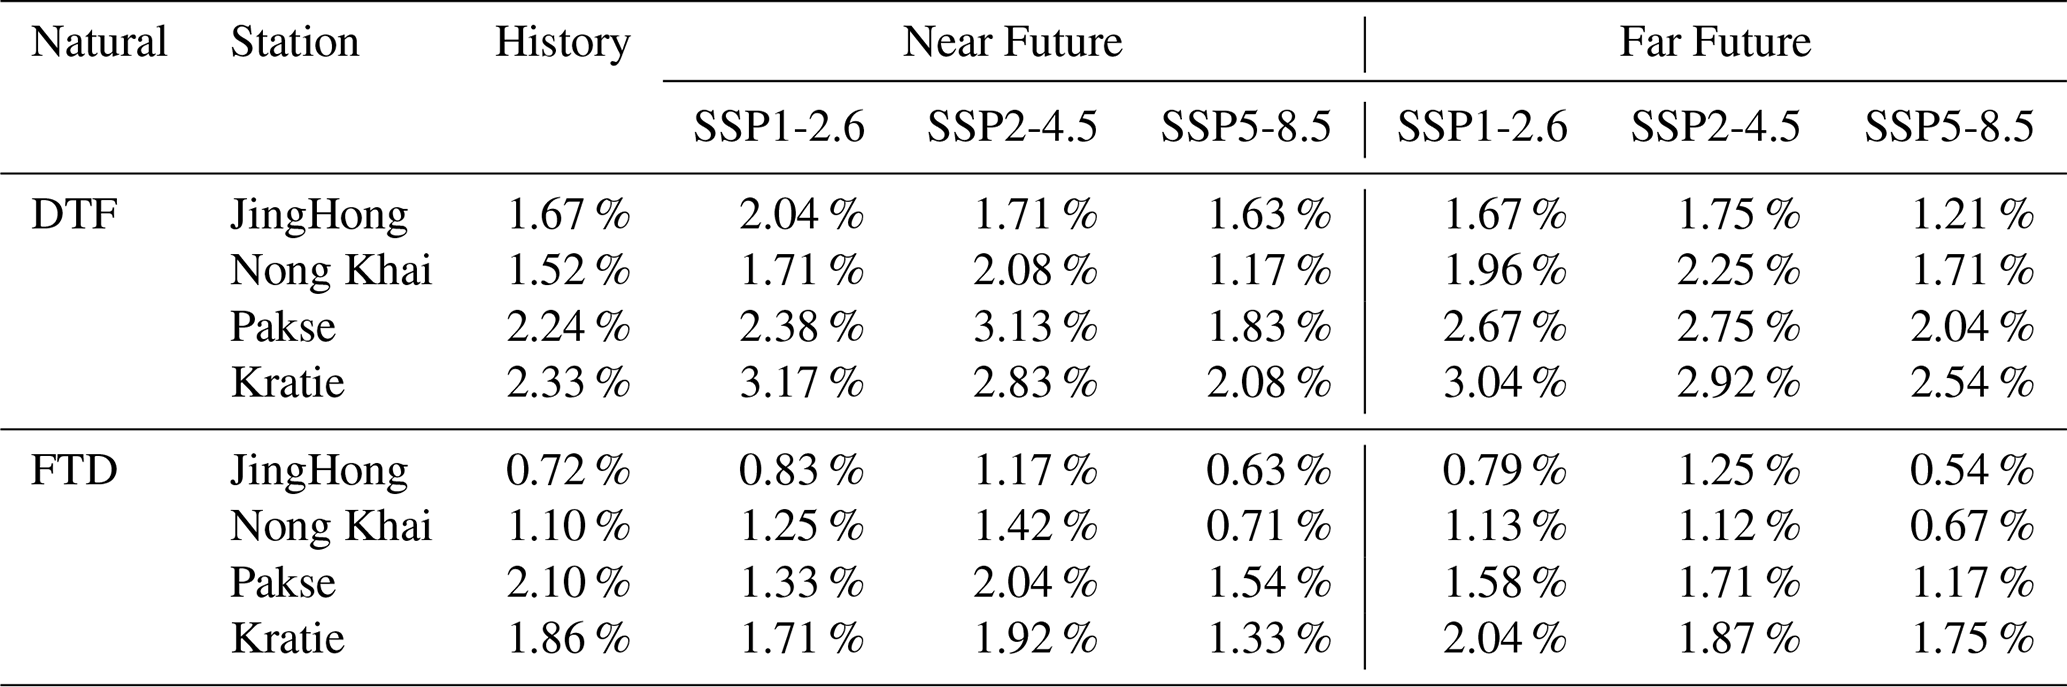
Under the natural scenario (without reservoir operations), DFAA in the LMR Basin is dominated by DTF, that is, the risk of DTF is more critical than that of FTD (Table 4). The probability of FTD ranges from 0.7 % to 2.1 % in the history period, 0.6 % to 2.0 % in the near future, and 0.5 % to 2.0 % in the far future. Conversely, DTF probabilities are higher, ranging from 1.6 % to 2.3 %, 1.2 % to 3.2 %, and 1.2 % to 3.0 % respectively in these three periods.
Table 4The year-round DFAA probability averaged across five GCMs during each period under the natural scenario.
DFAA risk is substantially elevated during the wet season compared to the dry season (Table S1). For the average of five GCMs, the probability of FTD in the wet season is 2 to 5.5 times higher than that in the dry season in the history period. In the near and far future periods, this ratio ranges from 1.1 to 36 times and 3.3 to 41 times, respectively. As for DTF, the probability in the wet season is correspondingly 1.7 to 5.7 times, 1.3 to 3.9 times, and 0.9 to 6.3 times higher than that in the dry season for history, near future, and far future. Only JingHong station experiences a slightly higher probability of DTF in the dry season (1.25 %) than in the wet season (1.17 %) for the far future.
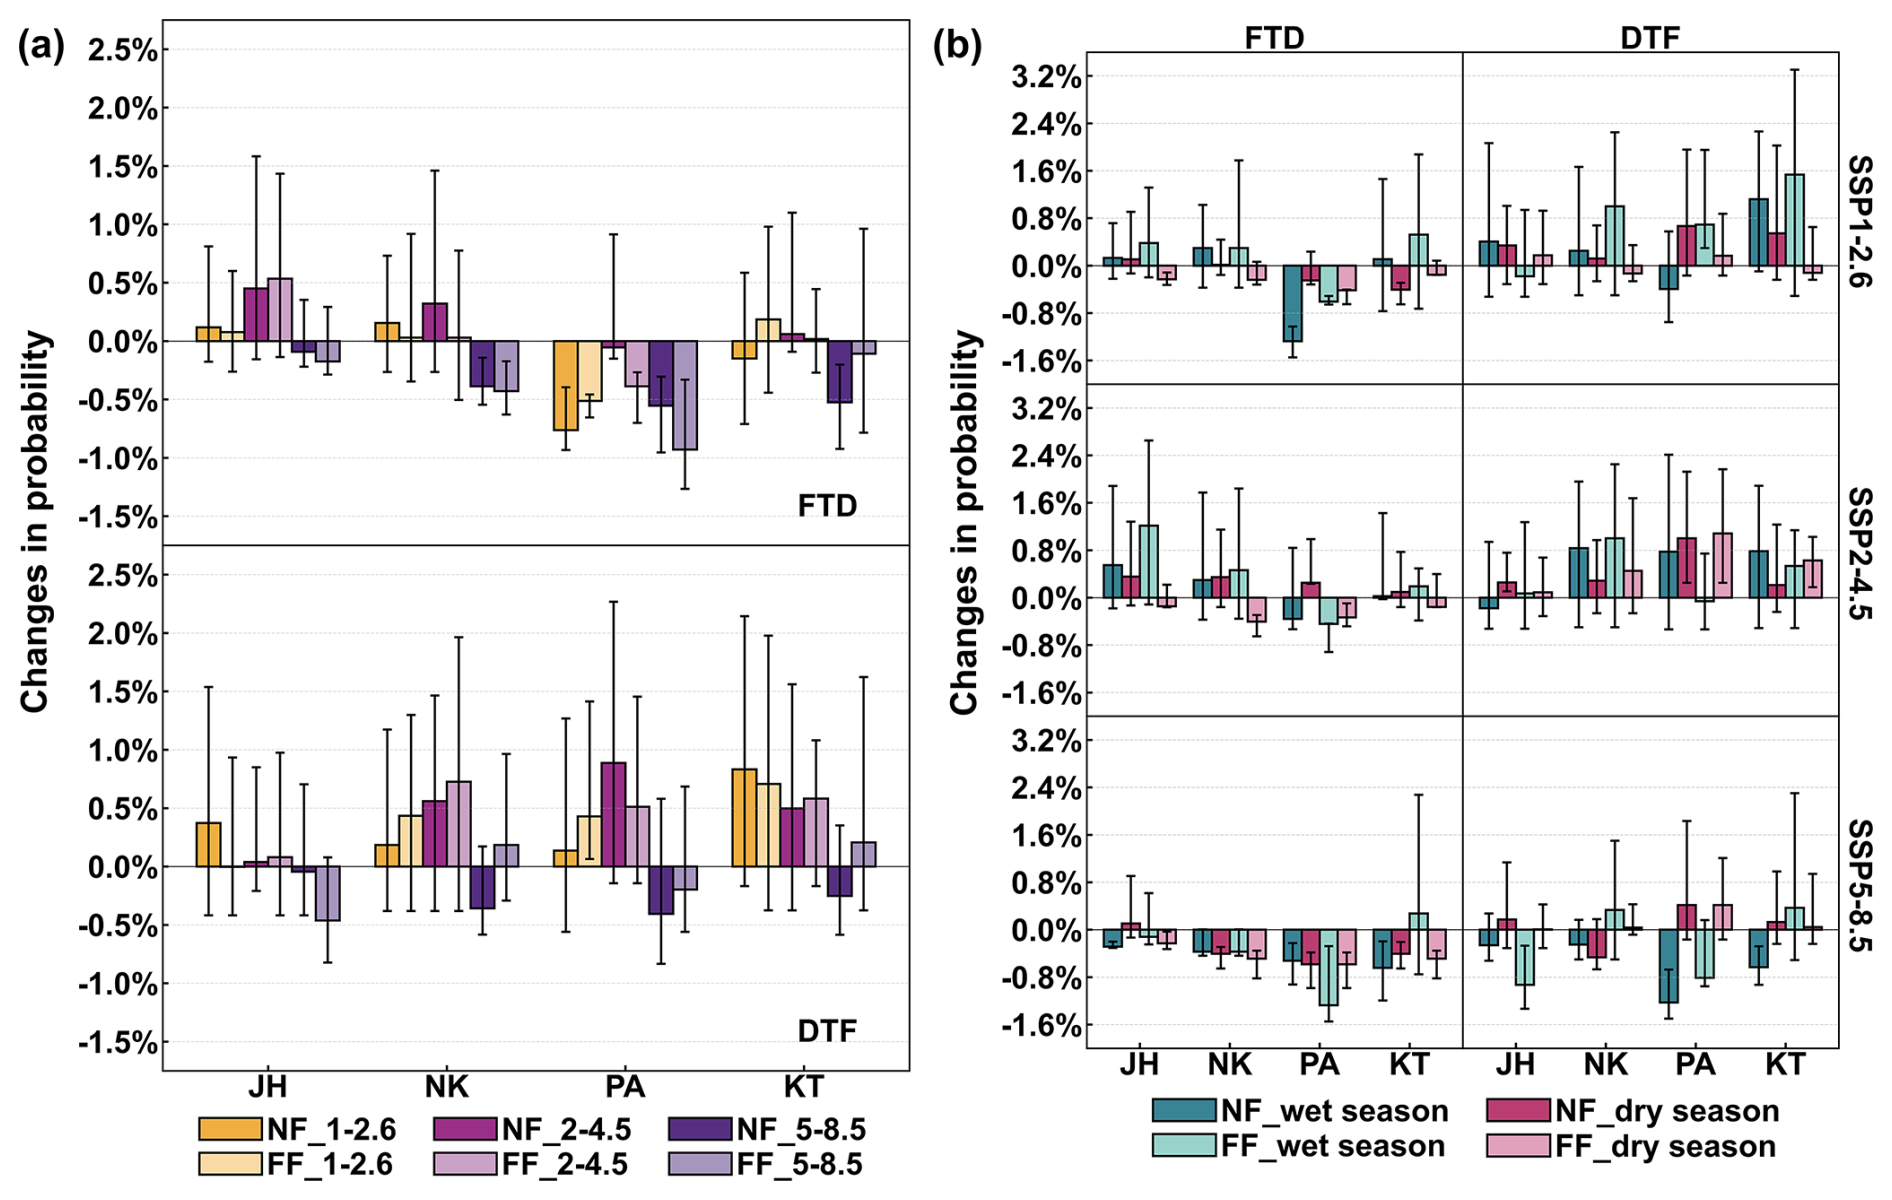
Figure 5DFAA under the natural scenario. (a) The annual change in DFAA probability averaged across five GCMs and their ranges in the near and far future periods with respect to the history period under three SSPs. (b) The seasonal change in DFAA probability averaged across five GCMs and their ranges in the near and far future periods with respect to the history period during wet and dry seasons under three SSPs. Here, JH, NK, PA, and KT respectively denote JingHong, Nong Khai, Pakse, and Kratie stations. NF and FF represent the near future period and the far future period. 1–2.6, 2–4.5 and 5–8.5 respectively denote SSP1-2.6, SSP2-4.5, and SSP 5-8.5 scenarios. Please note that this figure illustrates variations in DFAA events under climate change. The annual and seasonal probabilities of DFAA under the natural scenario are presented in Tables 4 and S1, respectively.
DFAA risks show marked spatial variation, with annual probability consistently higher downstream than upstream (Table 4). The annual probability of FTD ranges from 0.6 % to 1.3 % at JingHong station and 0.7 % to 1.4 % at Nong Khai station. These probabilities rise to 1.2 % to 2.1 % and 1.4 % to 2.1 % at Pakse and Kratie stations, respectively. Similarly, the annual probability of DTF at JingHong and Nong Khai stations is 1.2 % to 2.1 % and 1.2 % to 2.3 %. The probabilities at Pakse and Kratie stations range from 1.4 % to 3.2 % and 3.1 % to 3.2 %, respectively. The DTF risk in the wet season and the FTD risk in both dry and wet seasons are also higher downstream than upstream. Since the probability of FTD in the dry season at Nong Khai, Pakse, and Kratie stations is limited, especially under the SSP5-8.5 scenario (<0.2 %), the risk of FTD in the dry season appears more notable upstream than downstream.
The annual DFAA probability increases under SSP1-2.6 and SSP2-4.5 scenarios (except for FTD at Pakse station) and decreases under the SSP5-8.5 scenario (Fig. 5a). Such a pattern is attributable to the enhanced tendency for flood and drought events in the LMR Basin to cluster rather than alternate under the SSP5-8.5 scenario (Dong et al., 2022). Under the SSP5-8.5 scenario, the average probability of FTD across five GCMs is 0.6 % to 1.8 %, while the probability of DTF ranges from 1.2 % to 2.6 %. Conversely, the average probabilities of FTD and DTF under the SSP2-4.5 scenario range from 0.7 % to 2.1 % and 1.7 % to 3.2 %, respectively.
The future growth in DTF is significantly greater than that in FTD. For the average probabilities across five GCMs, relative to the history period, the future change in DTF probability at JingHong station is −0.5 % to 0.4 %, at Nong Khai station is −0.4 % to 0.7 %, and at Pakse and Kratie stations, respectively, is −0.5 % to 0.9 % and −0.2 % to 0.8 %. The future FTD probability change for JingHong is −0.2 % to 0.5 %, while for Nong Khai, Pakse, and Kratie, the changes are −0.4 % to 0.3 %, −1 % to −0.1 %, and −0.6 % to 0.2 %, respectively. The maximum values from the five GCMs show a consistent trend, with increases in DTF probability being significantly greater than those in FTD probability.
Upstream and downstream regions experience contrasting future risk increases, with FTD risks rising more upstream and DTF risks rising more downstream (Fig. 5a). Under three climate scenarios, JingHong Station experiences the maximum increase of 0.37 % and 0.08 % in DTF risks, respectively, in the near and far future. Meanwhile, FTD risks at this station rise by 0.45 % and 0.53 %, respectively. Conversely, Kratie Station exhibits the highest increase of 0.83 % and 0.71 % in DTF risks, alongside 0.06 % and 0.02 % increases in FTD risks. The opposite trends of DFAA risk in upstream and downstream pose enhanced challenges to the integrated management of the LMR Basin.
Future seasonal DFAA risks follow scenario-dependent trends: wet-season risks for both DTF and FTD rise under SSP1-2.6 and SSP2-4.5 scenarios, and fall under the SSP5-8.5 scenario (Fig. 5b). This is similar to the annual DFAA risk. The risk of FTD during the dry season decreases, with an upward trend emerging only in the near future under the SSP2-4.5 scenario (average across five GCMs <0.4 %, maximum <1.3 %). The risk of DTF during the dry season rises in most situations, except at Nong Khai station in the near future under the SSP5-8.5 scenario, where it shows an average decrease of 0.46 % across five GCMs. The largest increase of dry-season risk of DTF is found at Pakse station under the SSP2-4.5 scenario, with an average increase of 1.08 % across five GCMs and a maximum increase of 2.08 %.
Mild-intensity DFAA events constitute the majority of all DFAA occurrences (Fig. 6). The probability of mild DTF varies across scenarios, with values ranging from 0.7 % to 2.4 %, which corresponds to 58 % to 90 % of the total DTF probability. Likewise, mild FTD probabilities range from 0.6 % to 1.8 % (Fig. 6), comprising a larger share of the total FTD probability, specifically 75 % to 100 %. Mild DTF events account for 2 to 13 times the possibility of moderate DTF events. This ratio escalates to 3 to 31 times for FTD events. Notably, severe FTD events are extremely rare, often occurring at 0 % probability. However, severe DTF events are notable, with probabilities ranging from 0 % to 0.38 %, and in some instances, accounting for up to 13 % of total DTF probability.
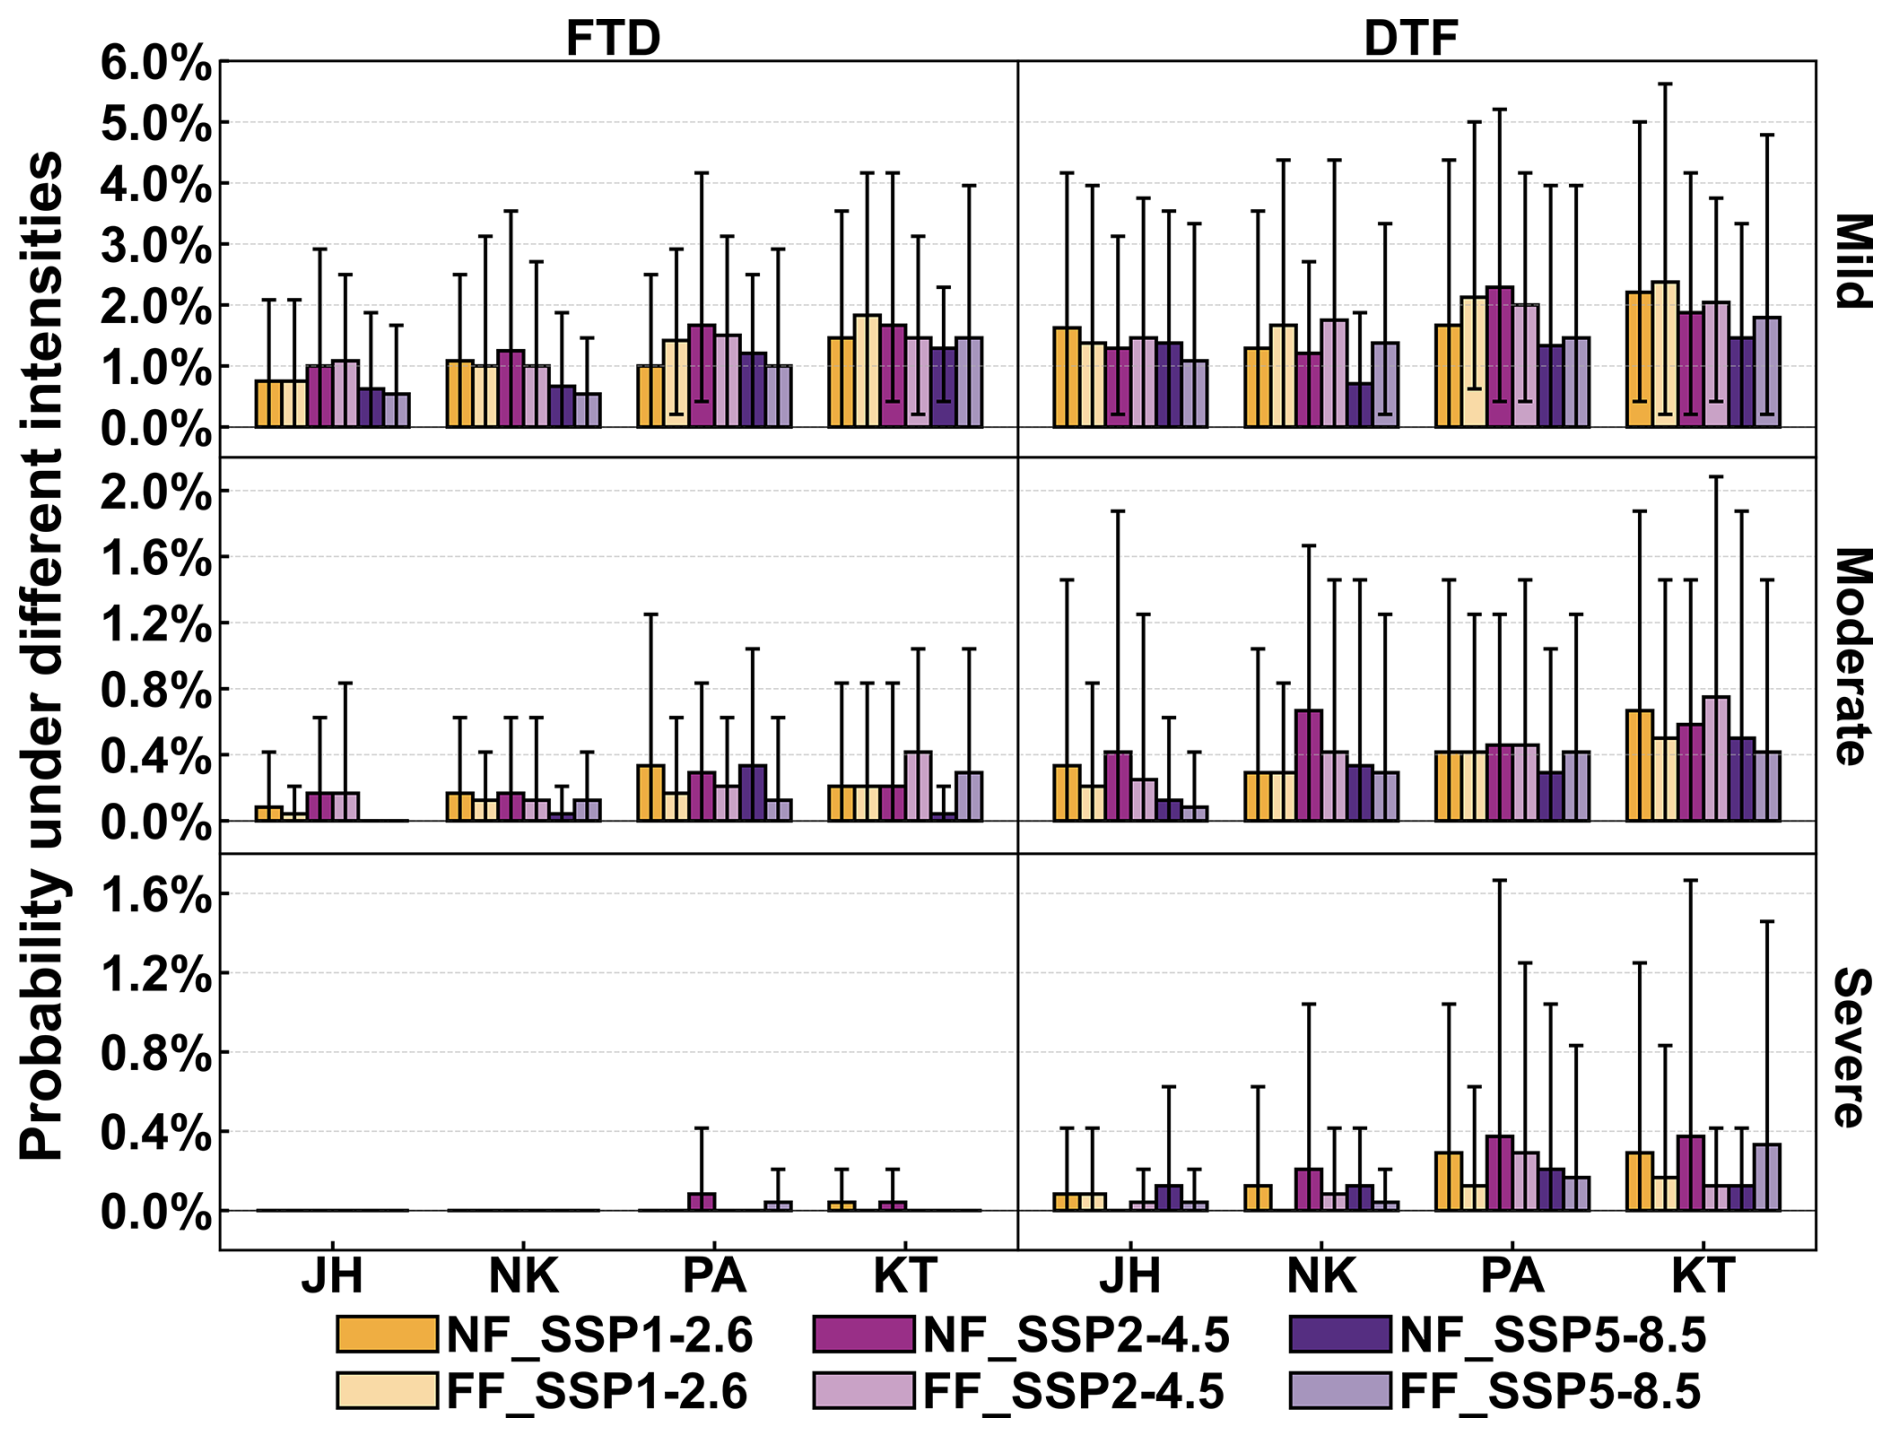
Figure 6Annual probability of DFAA at different intensities under the natural scenario, averaged across five GCMs and their ranges in the near future (2021–2060) and far future (2061–2100) periods under three SSPs. Here, JH, NK, PA, and KT respectively denote JingHong, Nong Khai, Pakse, and Kratie stations. NF and FF represent the near future period and the far future period. The specific value shown in this figure can be found in Table S2.
The total probabilities of DTF events exceed that of FTD events (Fig. 5a), and this holds true for mild, moderate, and severe intensity events (Fig. 6). The disparity between DTF and FTD events is not as pronounced in mild intensity events, but it becomes significant in moderate intensity events. The probabilities of moderate DTF range from 0.08 % to 0.75 %, whereas the probabilities of moderate FTD range from 0.04 % to 0.42 % (Fig. 6). The marked disparity in severe intensity events is even more pronounced by the extremely low probability of severe FTD.
Mild DTF probabilities are projected to increase in the far future, while moderate and severe DTF probabilities are projected to decrease. Specifically, the probability of mild DTF rises to 1.1 % to 2.4 % in the far future, compared to 0.7 % to 2.3 % in the near future. The probabilities of moderate and severe DTF drop from an average of 0.42 % and 0.19 % in the near future to 0.38 % and 0.12 %, respectively, in the far future. However, the probabilities of FTD events across all three intensity levels remain relatively consistent between the near and far future.
3.4 Reservoirs' impacts on DFAA
Reservoirs exhibit extraordinary mitigation effects on DTF risk under the changing climate while showing weaker effects in FTD risk (Fig. 7a). Nonetheless, the higher probability of DTF compared to FTD (Fig. 5a) demonstrates that reservoirs contribute significantly to reducing overall DFAA risk. The distinct controlling role of reservoirs on DTF risk versus FTD risk is associated with the consistency between these two types of DFAA events and the logic of reservoir operation. Section 4.1 will delve into the mechanistic details.
Reservoirs adequately reduce or only slightly increase the future DTF probability (−0.13 % to 1 %, averaged across five GCMs). Throughout this section, a negative value indicates that reservoirs increase the probability of DFAA, while positive values indicate a reduction. In most scenarios, the reservoir plays a positive mitigating role across all GCMs (Fig. 7a). Reservoirs are expected to have better mitigation effects in the near future at JingHong station. As for Nong Khai and Pakse stations, the reduction effect of reservoirs on DTF is more pronounced in the far future under SSP1-2.6 and SSP2-4.5 scenarios, while in the near future under the SSP5-8.5 scenario. The effect conversely, exhibits greater strength under SSP1-2.6 and SSP5-8.5 scenarios in the near future, while it is stronger under the SSP2-4.5 scenario in the far future at Kratie station. These findings are consistent across both the average of the GCMs and their ranges.
Reservoirs are more effective in reducing FTD in the near future than in the far future at JingHong, Pakse, and Kratie, while the effect at Nong Khai is slightly less in the far future (Fig. 7b). Reservoirs are most effective under high emissions (SSP5-8.5), reducing FTD probability at all stations (0.13 % to 0.42 %, GCM average). Under lower emissions (SSP1-2.6 and SSP2-4.5), mitigation is weaker (−0.33 % to 0.38 %, GCM average) at Nong Khai and Pakse, but notable at JingHong and Kratie, especially in certain future periods. For example, under intermediate emissions (SSP2-4.5) in the far future at JingHong, reservoirs lower the average probability by over 0.9 % and maximum by nearly 1.8 %.
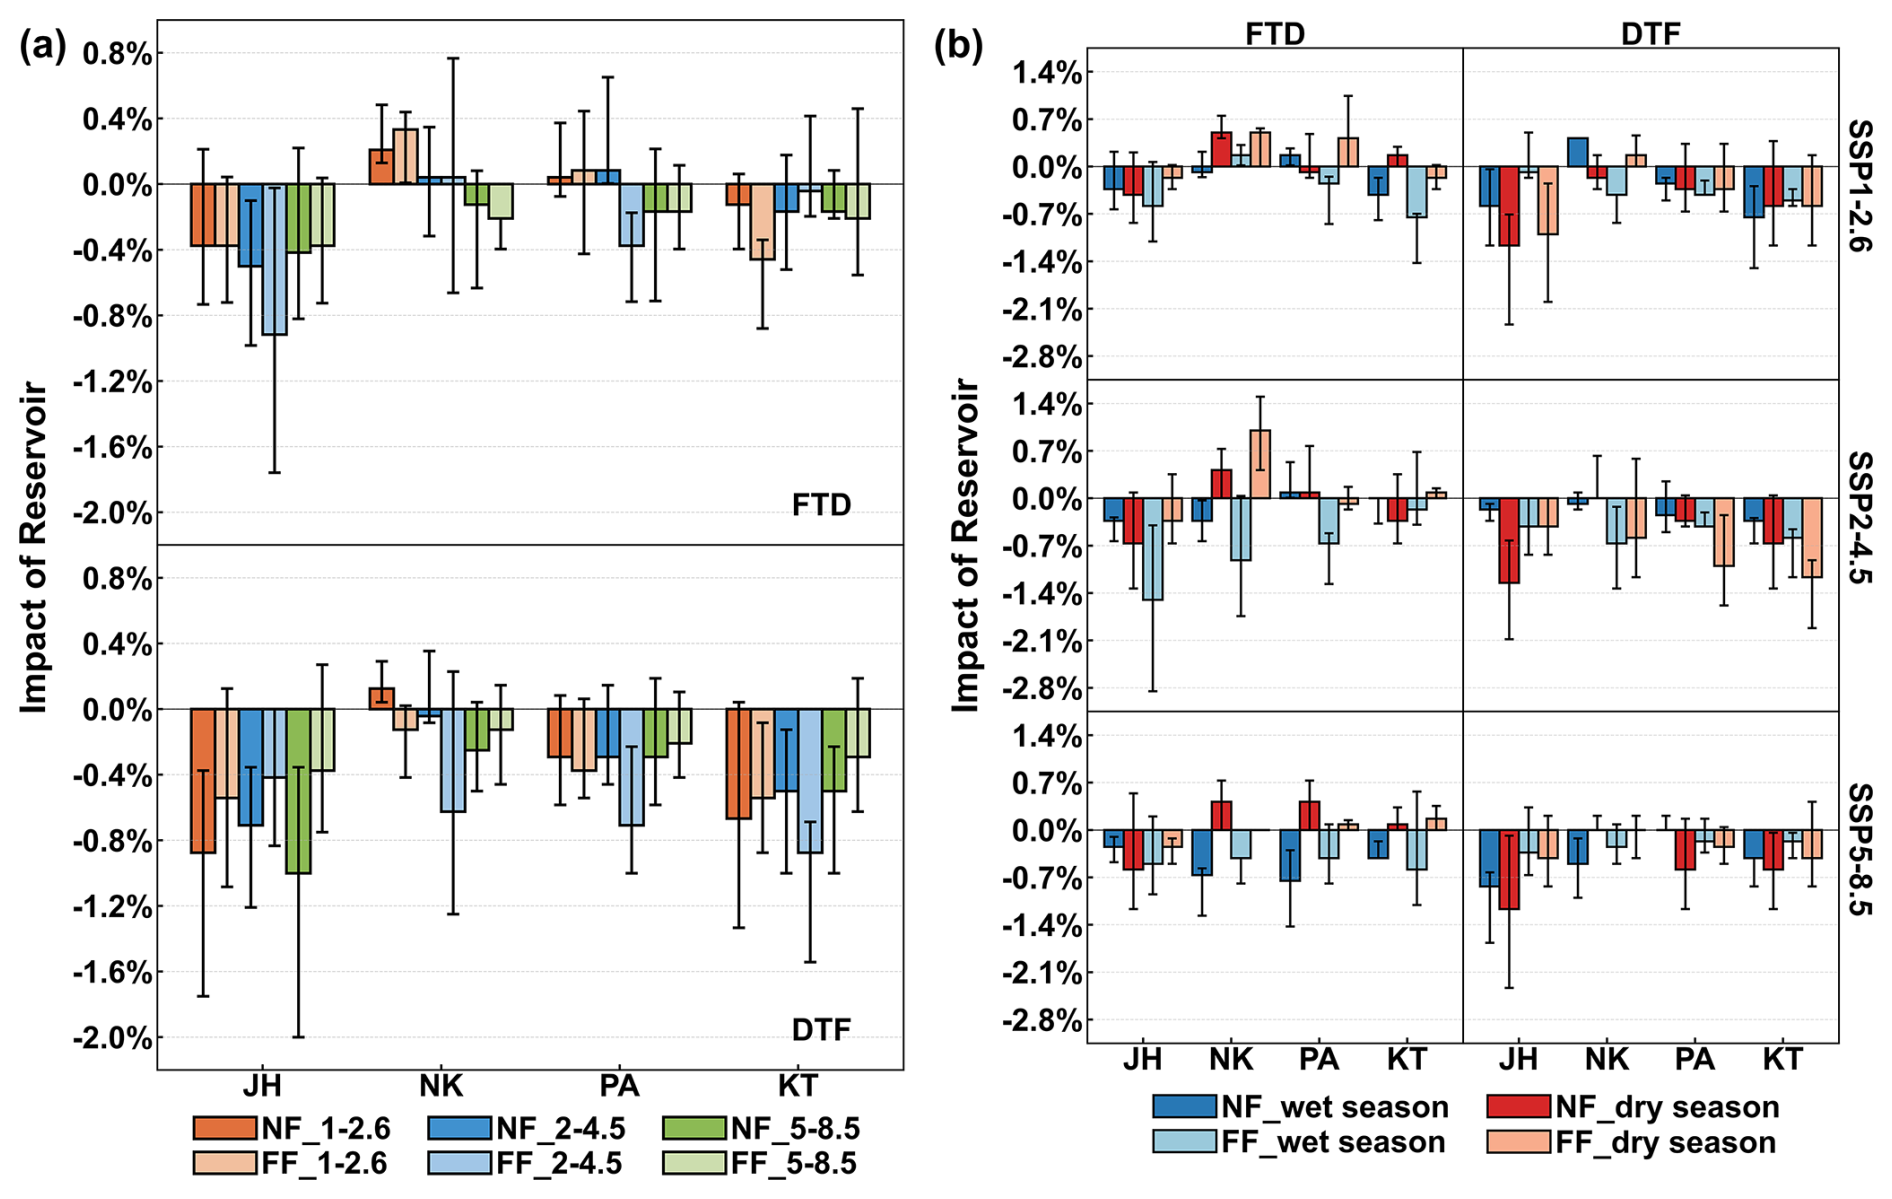
Figure 7Reservoir impacts on DFAA during the near future (2021–2060) and the far future (2061–2100) under three SSPs. (a) The annual reservoir impacts averaged across five GCMs and their ranges. (b) The seasonal reservoir impacts in wet and dry seasons averaged across five GCMs and their ranges. Here, JH, NK, PA, and KT respectively denote JingHong, Nong Khai, Pakse, and Kratie stations. NF and FF represent the near future period and the far future period. 1–2.6, 2–4.5 and 5–8.5 respectively denote SSP1-2.6, SSP2-4.5, and SSP 5-8.5 scenarios. Please note that this figure illustrates the impact of reservoir operations on DFAA events. The annual and seasonal probabilities of DFAA under the dammed scenario are presented in Table S3.
Reservoirs reduce FTD more in the wet season (−0.17 % to 1.5 %, GCM average) than in the dry season (−1 % to 0.67 %), especially at Nong Khai, Pakse, and Kratie (Fig. 7b). Negative values mean a reservoir increases FTD probability. In the wet season, reduction is notable (−0.17 % to 0.92 %), but in the dry season, FTD probability increases (−1 % to 0.33 %). Seasonal differences in DTF mitigation are less pronounced. Reservoirs slightly better reduce DTF in the dry season (−0.17 % to 1.25 %) than in the wet season (−0.42 % to 0.83 %). Reservoirs mitigate DTF more effectively than FTD in both seasons, aligning with the annual DFAA.
Reservoirs effectively manage DFAA events, which are predominantly characterized by mild intensity. They decrease the probability of mild DTF by −0.1 % to 0.9 % (Fig. 8), whereas the probability of such events is 0.7 % to 2.4 % under the natural scenario (Fig. 6), indicating that reservoirs decrease their likelihood by −0.12 to 0.64 times. Reservoir reduces the probability of mild FTD by −0.4 % to 0.8 % (Fig. 8). They increase the probability of mild FTD at the Nong Khai station under the SSP1-2.6 scenario. Since the probability of mild FTD is 0.6 % to 1.8 % under the natural scenario (Fig. 6), reservoir operation reduces their probability by −0.38 to 0.69 times.
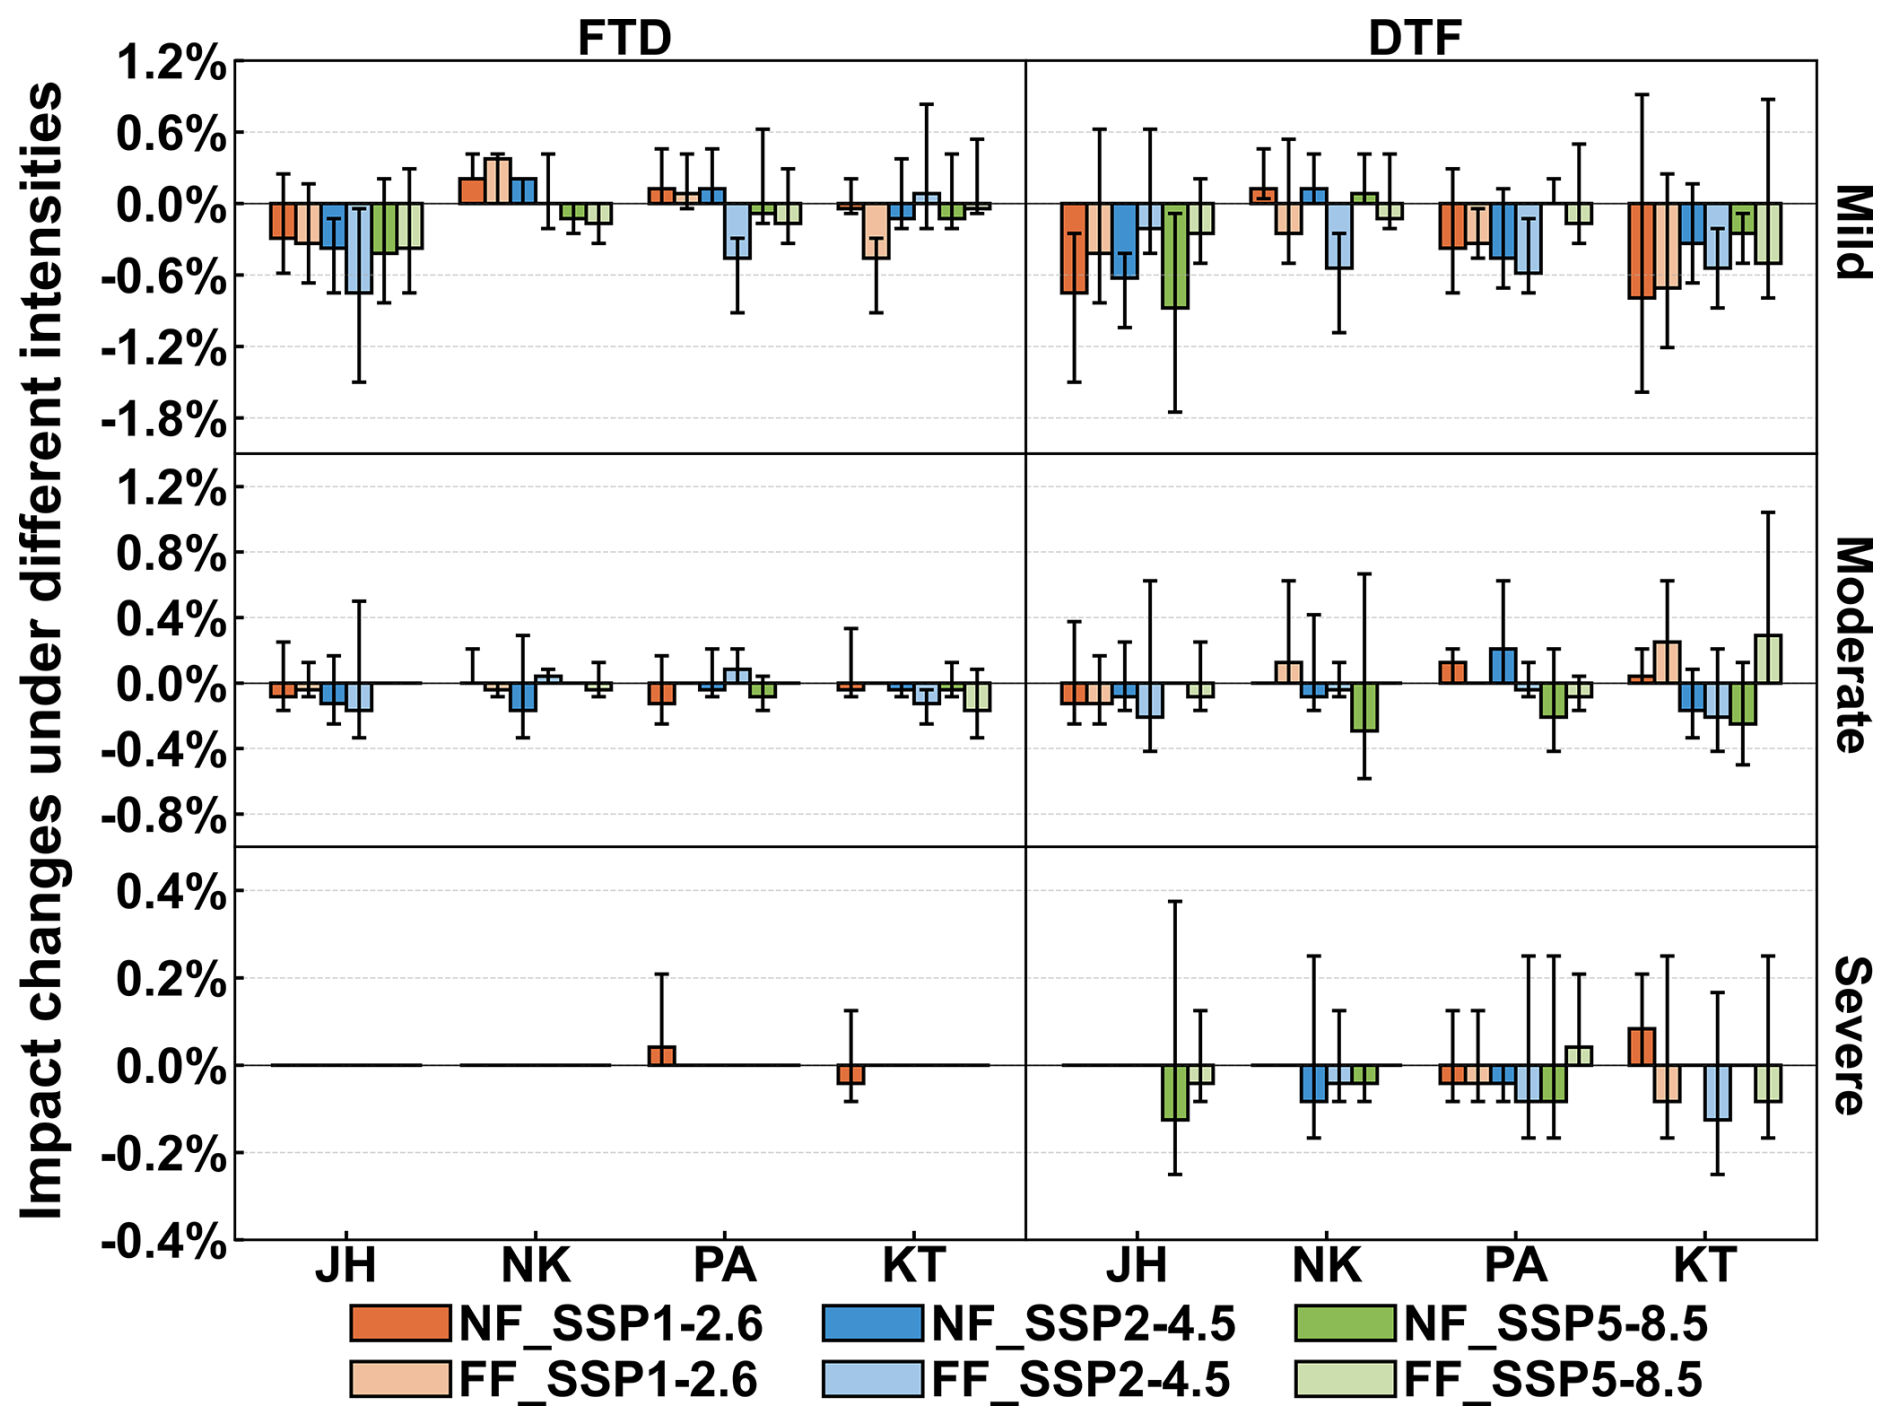
Figure 8Reservoir impacts on DFAA under different intensities, averaged across five GCMs and their ranges in the near future (2021–2060) and far future (2061–2100) periods under three SSPs. Here, JH, NK, PA, and KT respectively denote JingHong, Nong Khai, Pakse, and Kratie stations. NF and FF represent the near future period and the far future period. Please note that this figure shows how the reservoir affects DFAA events at different intensities. The probabilities of DFAA events at each intensity under the dammed scenario are presented in Table S4.
While the reservoir's mitigation effect on FTD events is less pronounced than on DTF events (Fig. 7), it demonstrates a commendable mitigation effect on moderate FTD, reducing their probability by −0.08 % to 0.17 % (Fig. 8). This reduction represents −0.4 to 1 times the probability under the natural scenario. This ratio surpasses the reservoir's mitigation effect on moderate DTF, where the probability is reduced by −0.3 % to 0.3 % (Fig. 8), accounting for −0.70 to 1 times the natural probability. This highlights that the reservoir exerts a more significant mitigating force on high-intensity FTD events compared to high-frequency FTD events.
Reservoirs exhibit notable mitigating effects for DTF events across all three intensity levels. However, their ability to alleviate moderate DTF is relatively weaker than that for mild DTF (Fig. 8), which differs from the characteristic of FTD events. This implies that reservoirs possess a stronger capability to manage high-frequency DTF events than higher-intensity events.
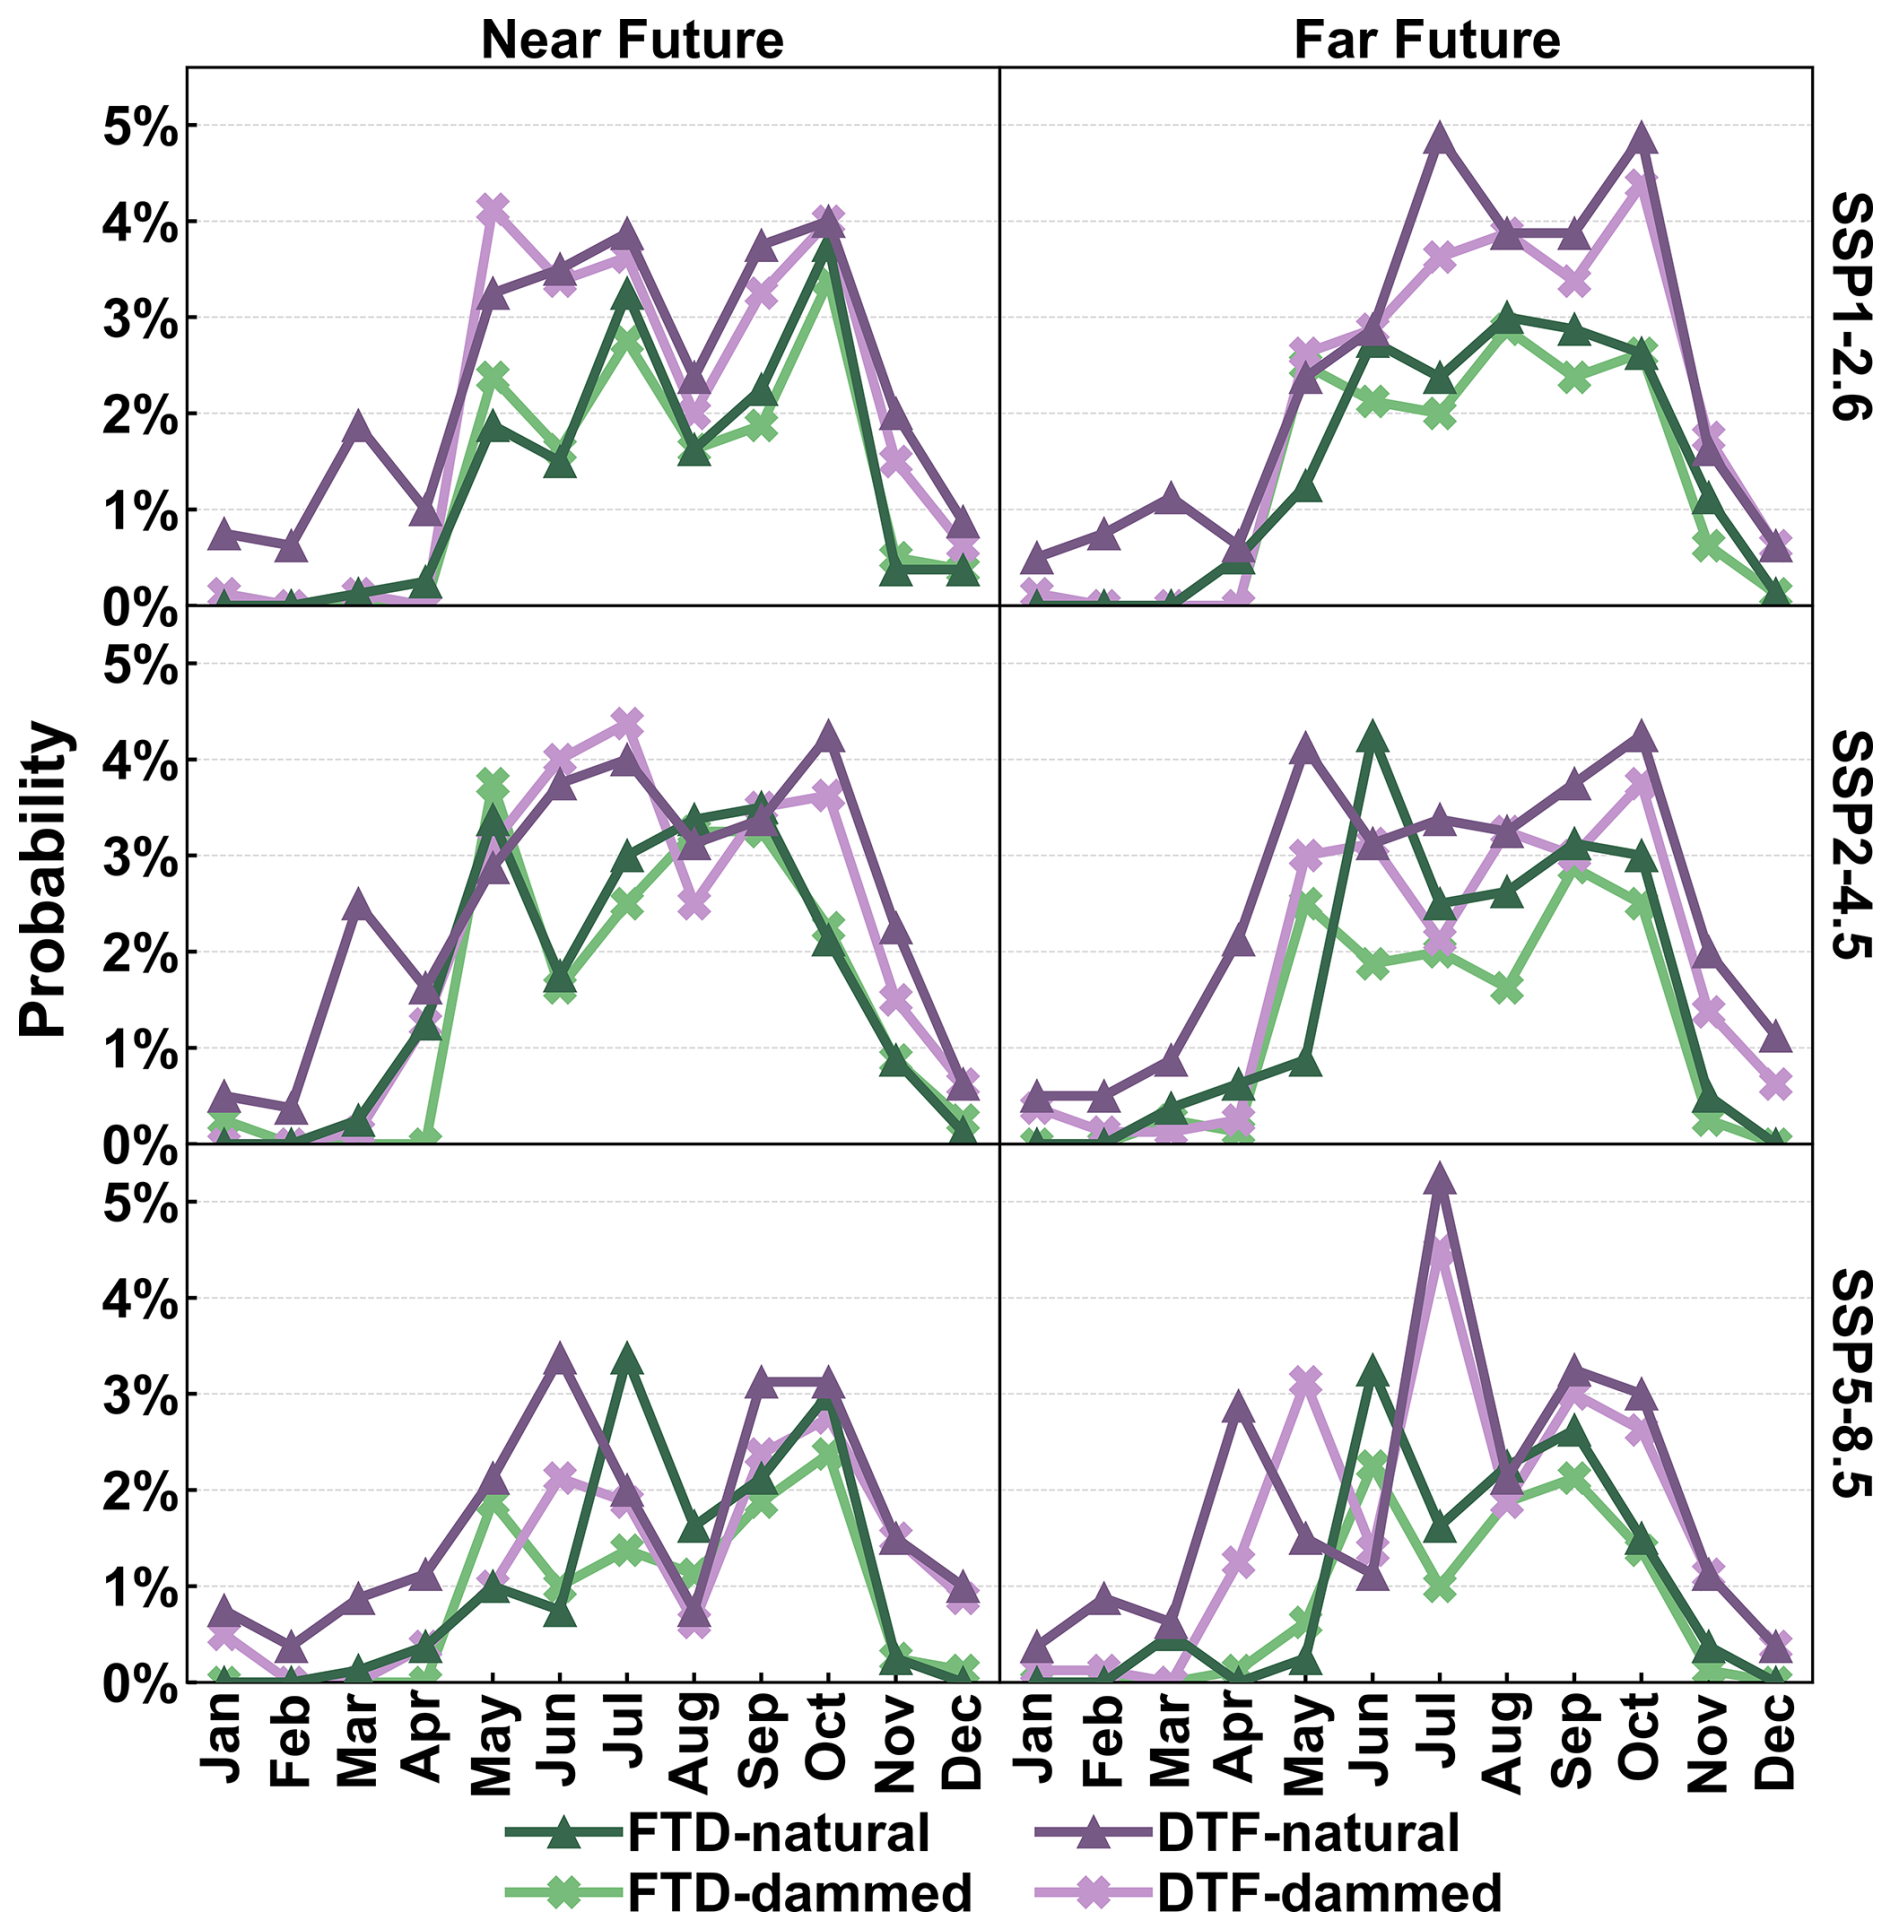
Figure 9Monthly DFAA probability averaged over four mainstream hydrological stations (i.e., JingHong, Nong Khai, Pakse, and Kratie stations) under natural and dammed scenarios for three SSPs during the near future (2021–2060) and far future (2061–2100) periods. Please note that the probabilities shown in this figure are averaged over 5 GCMs.
DFAA often shows several monthly peaks under the natural scenario. This means some months have a higher DFAA probability than their neighbors. The multiple peaks are clearer in DTF than in FTD (Fig. 9). When averaging monthly DFAA over four mainstream hydrological stations, DTF shows three peaks under near-term SSP2-4.5 and far-term SSP5-8.5 scenarios, while FTD only shows two peaks in both cases. Reservoirs help to regulate DFAA by lowering and reducing peaks, with a stronger peak reduction effect anticipated in the near future for DTF (Fig. 9). In the far future, for FTD, especially under SSP1-2.6 and SSP2-4.5, reservoirs still alleviate peaks, though less so in terms of reducing their number. Reservoirs also lower DFAA probability during early and middle dry seasons (December to April) for both near and far futures, often 1 % or less at most stations. Sometimes, such as the SSP2-4.5 scenario in the near future, reservoirs actually increase the probability of DFAA in May. This happens because helping during the dry season before May reduces the capacity of reservoirs for water regulation in May, making it hard to control DFAA risks that month. Reservoirs also shorten DFAA's monthly span. Instead of occurring throughout the year under the natural scenario, DFAA is to concentrated from May to October under the dammed scenario (Fig. 9). This allows the LMR Basin to focus DFAA policies and actions on those months. As a result, riparian states can combine resources and coordinate their efforts more efficiently to manage and respond to DFAA and related hazards.
4.1 Different characteristics of DTF and FTD events
The distinct characteristics of DTF and FTD events have been identified by previous research. Shi et al. (2021) found that FTD events predominate in the Wei River Basin. Wang et al. (2023) projected that in the Poyang Lake Basin, the temporal spread of DTF events will expand in the future, while that of FTD events will constrict. Ren et al. (2023) found that under SSP1-2.6 and SSP2-4.5 scenarios, the Huang-Huai-Hai River Basin will experience more DTF events, whereas under SSP3-7.0 and SSP5-8.5 scenarios, it will experience more FTD events. This study identifies differences between DTF and FTD events as well, and further highlights the different characteristics of reservoirs' mitigating effects on these events.
The average probability of DTF across all periods is 2.1 % under the natural scenario, which is significantly higher than the 1.4 % average for FTD (Fig. 5a). The probability of DTF consistently exceeds that of FTD under three different intensities (Fig. 6). Additionally, DTF probabilities show a significant increase in both the near and far future, averaging 0.23 %, which exceeds the increase in FTD probabilities, averaging 0.13 % (Fig. 5a).
Compared with FTD events, reservoirs more effectively control DTF probabilities, significantly lowering DTF risk in both dry and wet seasons (Fig. 7). The reason is that the timing of DTF's water regulation matches the way reservoirs operate. At the start of DTF, reservoirs typically hold water at the storage corresponding to the normal water level, which equates to 0.8 times the maximum storage (Eq. 20). Hence, reservoirs possess sufficient storage capacity to mitigate the drought conditions. In parallel, the water release during the initial phase of the DTF reduced the water level, thereby meeting the storage needs for sudden floods that occur later in the DTF. As a result, even if DTF events are frequent, reservoirs can manage them well. Reservoirs especially succeed in reducing mild DTF events (Fig. 8). However, they control moderate DTF events less effectively. In intense DTF cases, the rules for operating reservoirs are not enough. For example, if a severe drought at DTF's beginning exceeds reservoir storage, they cannot effectively relieve the extreme drought and thus fail to control such DTF events.
Although FTD is less likely than DTF, reservoirs control FTD less effectively, especially in the dry season (Fig. 7). The problem is that when the FTD event occurs, reservoirs are generally maintained at their target storage for the wet season. The storage corresponds to the flood control water level, which is 1.2 times the minimum storage capacity (Eq. 19). Consequently, reservoirs, while fully meeting flood control requirements at the start of FTD, struggle to maintain sufficient water storage to satisfy water supply demands for the subsequent drought stage. If FTD occur frequently, reservoirs' control decreases further. While reservoirs do little for mild FTD, they noticeably reduce moderate FTD (Fig. 8). This means that, for rare but strong FTD events, reservoirs can help by storing water for later droughts. However, if FTD is frequent, current reservoir operations do not help much. This difficulty in regulation is what makes FTD a major challenge. It is encouraging, though, that FTD is expected to become less common in most areas of the LMR Basin in the future (Fig. 5).
4.2 The relationship between reservoirs' mitigation roles and their storage
The reservoir systems provide enhanced mitigation efficiency against DFAA at JingHong and Kratie compared to those at Nong Khai and Pakse (Fig. 7). Reservoir storage in the region above JingHong and the Pakse to Kratie region is significantly larger than storage in the JingHong to Nong Khai and Nong Khai to Pakse regions (Fig. 1c). Reservoirs' capacity to reduce total DFAA risk closely relates to the total storage of mainstream and tributary reservoirs, consistently showing a positive correlation for DTF and FTD events (Fig. 10a). These findings highlight reservoirs' multifaceted role in managing flood prevention and drought resistance (Hecht et al., 2019; Hoang et al., 2019; Ly et al., 2023) while also addressing sudden DFAA challenges. These results align with Feng et al.' s (2024) discovery that large reservoirs significantly reduce drought and flood risks and corroborate Ehsani et al.' s (2017) conclusion that increased dam dimensions can mitigate water resource vulnerability to climate uncertainties.
The positive correlation between total reservoir storage and the reduction of total DFAA risk indicates that basins with larger total storage are better equipped to resist DFAA events. However, this study examines only hydroelectric reservoirs in the LMR Basin and excludes other water storage facilities such as irrigation reservoirs. In the LMR Basin, total storage of irrigation reservoirs is considerable. According to the MRC, the Mekong Basin contains 1317 irrigation reservoirs, with total storage of about 17 billion m3 (MRC, 2018; LMC and MRC, 2023). This storage exceeds the total storage of reservoirs between JingHong and Nong Khai stations (around 9.7 billion m3). It is slightly lower than the storage between Nong Khai and Pakse stations (approximately 22.1 billion m3) (Figs. 1c and 10). Since reservoirs mitigate extreme hydrological events regardless of their primary function (Brunner, 2021; Ho and Ehret, 2025), even irrigation reservoirs can play a beneficial role in addressing DFAA events. Fully utilizing irrigation reservoirs and implementing coordinated operation of all reservoir types across the LMR Basin could effectively lower DFAA risks and enhance the basin's resistance to these events.
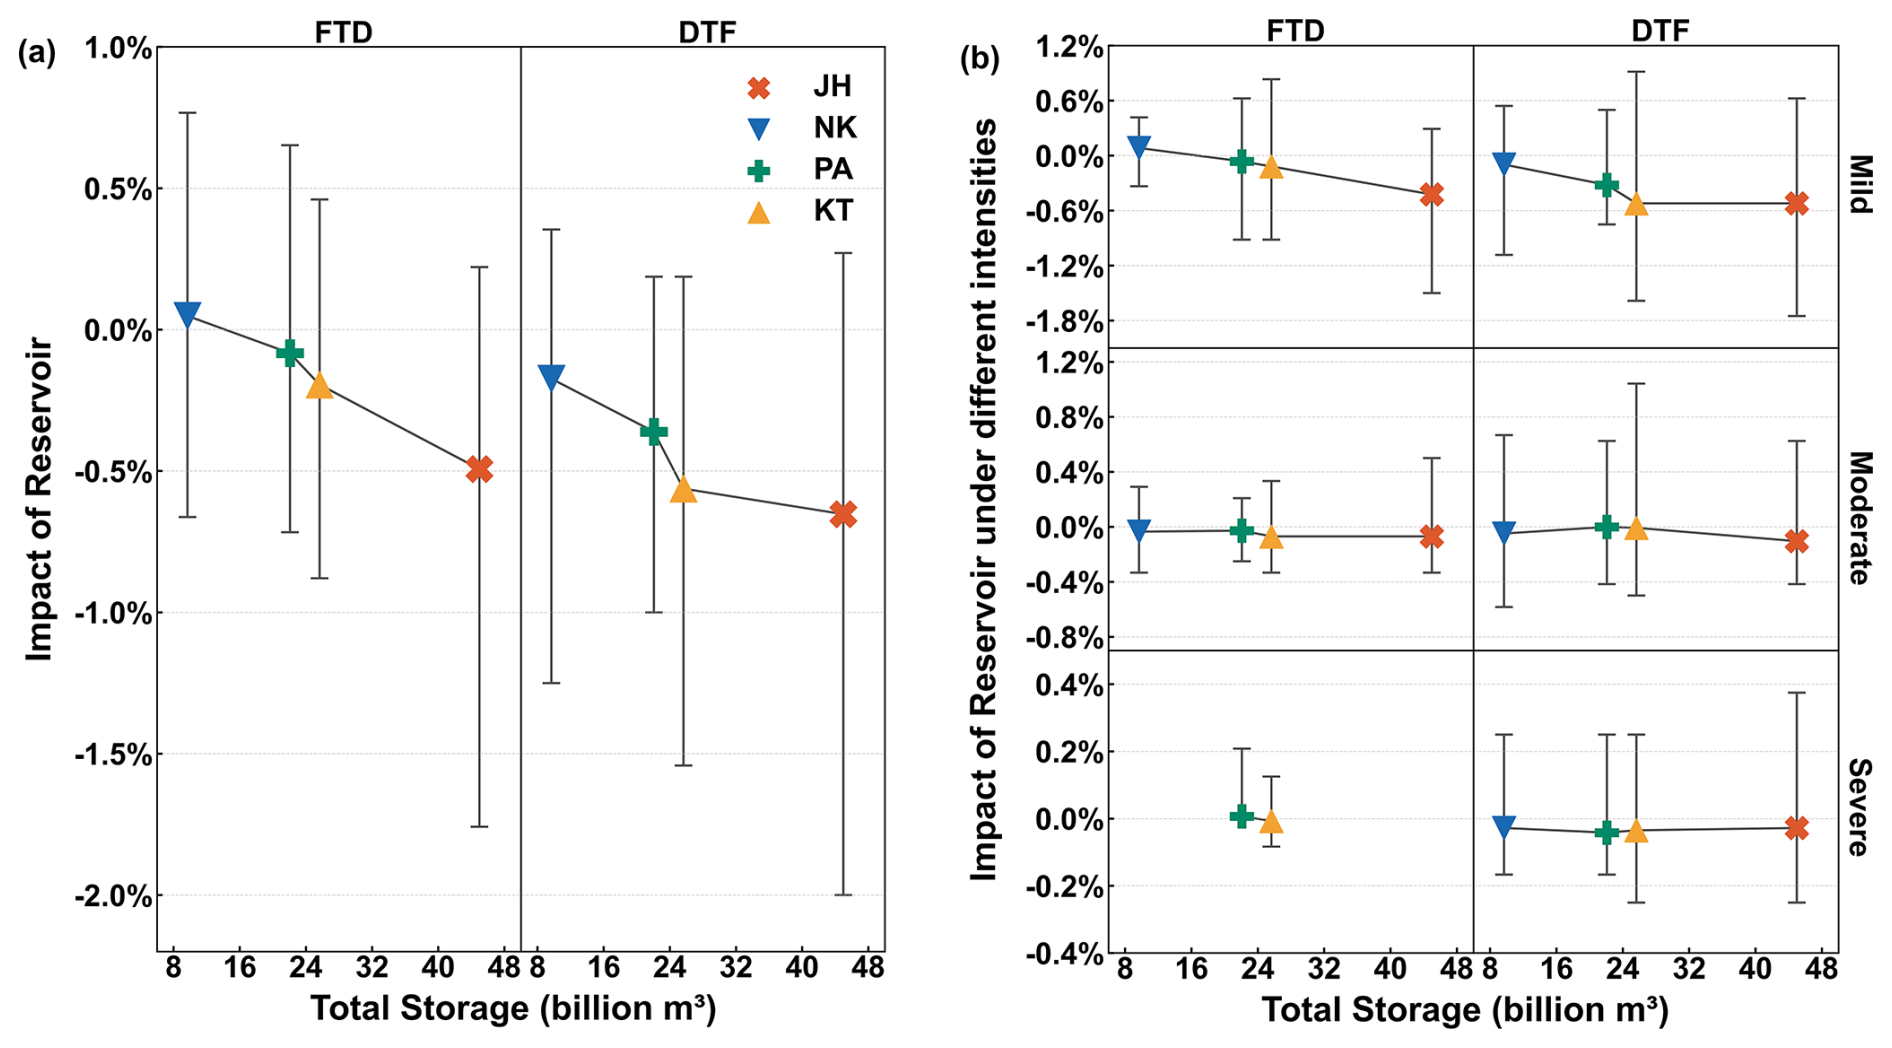
Figure 10The relationship between reservoirs' mitigation effects and their total storage. Symbol points denote the average values for each station under three SSP scenarios during the near future (2021–2060) and far future (2061–2100) periods, while error bars indicate the maximum and minimum values. (a) The impact of reservoirs on the total probability of DFAA. (b) The impact of reservoirs on DFAA of different intensities. Here, JH, NK, PA, and KT respectively denote JingHong, Nong Khai, Pakse, and Kratie stations. Please note that, as JingHong and Nong Khai stations are not expected to experience severe FTD events in the future, the relevant information has not been included in this figure.
Both mild DTF and mild FTD show a positive correlation with total reservoir storage, consistent with total DFAA events (Fig. 10b). In contrast, moderate and severe DFAA events do not strongly correlate with reservoir storage (Fig. 10b). This implies that for moderate to severe DFAA events, increasing reservoir storage capacity does not enhance the reservoirs' control capabilities. Therefore, refining reservoir operation rules presents a more appropriate strategy to strengthen control of moderate and severe DFAA events in the LMR Basin.
4.3 Limitations of reservoir regulation rules
The reservoir operation rule SOP adopted in this study is a commonly used method. Previous studies have widely employed this method (Wang et al., 2017a; Yun et al., 2020). The SOP rule is proven appropriate for hydrological modeling in large-scale basins such as the LMR Basin. It is also effective for extended simulation periods in future hydrological assessments (Wang et al., 2017b; Yun et al., 2021a, b).
This study further improved the standard SOP operation rules by adding the general case and emergency case (Fig. 2). This scheduling approach manages reservoir operations using real-time inflow data. It also considers the operational year of each reservoir. As a result, the reservoir module developed in this study is robust and adaptable. It reflects reservoir scheduling scenarios with high reliability.
Despite this, the study uses uniform operation rules for reservoirs of different storage scales within the LMR Basin. It implements daily regulation for all reservoirs. The study does not use differentiated regulation scales (daily, annual, or multi-annual) based on storage. It also does not consider unique operation rules in different sub-basins. These simplifications may cause uncertainties in how reservoirs mitigate effects. This is a limitation of the study.
This study adopts CMIP6 meteorological data, applying three SSP scenarios and five GCMs. It corrects these data using the MBCn method. The study integrates the THREW distributed hydrological model and the developed reservoir module. It describes DFAA through R-SDFAI, assessing mild, moderate, and severe intensities. The study explores how reservoirs help reduce DFAA under the changing climate in the LMR Basin. It examines three periods: history (1980–2014), near future (2021–2060), and far future (2061–2100). The main findings are summarized below:
-
DFAA in the LMR Basin is dominated by DTF, with a mean probability of 2.1 %. This is much higher than the FTD probability of 1.4 %. DTF remains higher than FTD at all intensity levels. The future increase in DTF probability (average 0.23 %) is also greater than the increase for FTD (average 0.13 %). Mild-intensity DFAA events are most common. They account for 58 % to 90 % of future DTF probability and 75 % to 100 % of FTD probability. Both DTF and FTD present higher DFAA risk during the wet season than the dry season.
-
Reservoirs manage DTF probability well, cutting DTF risks in both dry and wet seasons. However, they have less influence over FTD risks, especially during dry-season FTD events. Limited capacity to control FTD risks is a challenge. Reservoirs do better at managing high-frequency DTF and high-intensity FTD events. They also cut down multi-peak DFAA events and reduce their monthly duration.
-
Reservoirs' ability to lower DFAA total risk is linked to their combined storage. Using large irrigation reservoirs within the LMR Basin can help withstand mild DFAA risks and overall events. To better handle moderate and severe DFAA events, reservoir operations need to be optimized.
This study gives new insights into how reservoirs help mitigate DFAA in the LMR Basin. It also aids water management for riparian countries. DFAA remains a serious challenge. This shows the need for LMR Basin countries to work together, build capacity against DFAA events, reduce climate change effects, and support sustainable development.
The hydrological data can be accessed and requested from the MRC Data Portal (https://portal.mrcmekong.org/home, last access: October 2025). Information related to dams is available on the Mekong Region Futures Institute (MERFI) website (https://www.merfi.org/mekong-region-dams-database, last access: October 2025). The raw CMIP6 data without correction is available at https://esgf-node.llnl.gov/search/cmip6/ (last access: October 2025). The MBCn algorithm can be accessed and implemented through an R package, which is available at https://CRAN.R-project.org/package=MBC (last access: October 2025).
The supplement related to this article is available online at https://doi.org/10.5194/hess-30-671-2026-supplement.
KZ: Conceptualization; Data curation; Model development; Investigation; Methodology; Validation; Visualization; Writing – original draft; Writing – review & editing. ZZ: Writing – review & editing. FT: Conceptualization; Funding acquisition; Investigation; Methodology; Supervision; Writing – review & editing.
At least one of the (co-)authors is a member of the editorial board of Hydrology and Earth System Sciences. The peer-review process was guided by an independent editor, and the authors also have no other competing interests to declare.
Publisher's note: Copernicus Publications remains neutral with regard to jurisdictional claims made in the text, published maps, institutional affiliations, or any other geographical representation in this paper. The authors bear the ultimate responsibility for providing appropriate place names. Views expressed in the text are those of the authors and do not necessarily reflect the views of the publisher.
This research was funded by the National Natural Science Foundation of China (grant nos. U2442201 and 51961125204).
This paper was edited by Hongkai Gao and reviewed by Ningpeng Dong and four anonymous referees.
Adikari, Y. and Yoshitani, J.: Global Trends in Water-Related Disasters: An Insight for Policymakers, International Centre for Water Hazard and Risk Management (ICHARM), The United Nations World Water Development Report 3, Tsukuba, Japan, https://unesdoc.unesco.org/ark:/48223/pf0000181793 (last access: October 2025), 2009.
ADREM, SNSE, NDRC, IFRC and IRDR: 2023 Global Natural Disaster Assessment Report. Bejing, https://reliefweb.int/report/world/2023-global-natural-disaster-assessment-report (last access: October 2025), 2024.
Arias, M. E., Piman, T., Lauri, H., Cochrane, T. A., and Kummu, M.: Dams on Mekong tributaries as significant contributors of hydrological alterations to the Tonle Sap Floodplain in Cambodia, Hydrol. Earth Syst. Sci., 18, 5303–5315, https://doi.org/10.5194/hess-18-5303-2014, 2014.
Bai, X., Zhao, C., Tang, Y., Zhang, Z., Yang, B., and Wang, Z.: Identification, physical mechanisms and impacts of drought–flood abrupt alternation: a review, Front. Earth Sci., 11, 1203603, https://doi.org/10.3389/feart.2023.1203603, 2023.
Brunner, M.: Reservoir regulation affects droughts and floods at local and regional scales, Environ. Res. Lett., 16, https://doi.org/10.1088/1748-9326/ac36f6, 2021.
Cannon, A.: Multivariate Bias Correction of Climate Model Output: Matching Marginal Distributions and Intervariable Dependence Structure, J. Climate, 29, 7045–7064, https://doi.org/10.1175/JCLI-D-15-0679.1, 2016.
Cannon, A.: Multivariate quantile mapping bias correction: an N-dimensional probability density function transform for climate model simulations of multiple variables, Clim. Dynam., 50, 31–49, https://doi.org/10.1007/s00382-017-3580-6, 2018.
Chen, Z., Li, X., Zhang, X., Xu, L., Du, W., Wu, L., Wang, D., Zhang, Y., and Chen, N.: Global drought-flood abrupt alternation: Spatio-temporal patterns, drivers, and projections, The Innovation Geoscience, 3, 100113, https://doi.org/10.59717/j.xinn-geo.2024.100113, 2025.
Cui, T., Li, Y., Yang, L., Nan, Y., Li, K., Tudaji, M., and Tian, F.: Non-monotonic changes in Asian Water Towers' streamflow at increasing warming levels, Nat. Commun., 14, 1176, https://doi.org/10.1038/s41467-023-36804-6, 2023.
Dang, H. and Pokhrel, Y.: Evolution of river regimes in the Mekong River basin over 8 decades and the role of dams in recent hydrological extremes, Hydrol. Earth Syst. Sci., 28, 3347–3365, https://doi.org/10.5194/hess-28-3347-2024, 2024.
Do, P., Tian, F., Zhu, T., Zohidov, B., Ni, G., Lu, H., and Liu, H.: Exploring synergies in the water-food-energy nexus by using an integrated hydro-economic optimization model for the Lancang-Mekong River basin, Sci. Total Environ., 728, 137996, https://doi.org/10.1016/j.scitotenv.2020.137996, 2020.
Dong, Z., Liu, H., Baiyinbaoligao, Hu, H., Khan, M., Wen, J., Chen, L., and Tian, F.: Future projection of seasonal drought characteristics using CMIP6 in the Lancang-Mekong River Basin, J. Hydrol., 610, https://doi.org/10.1016/j.jhydrol.2022.127815, 2022.
Ehsani, N., Vörösmarty, C., Fekete, B., and Stakhiv, E.: Reservoir operations under climate change: storage capacity options to mitigate risk, J. Hydrol., 555, 435–446, https://doi.org/10.1016/j.jhydrol.2017.09.008, 2017.
Eyring, V., Bony, S., Meehl, G. A., Senior, C. A., Stevens, B., Stouffer, R. J., and Taylor, K. E.: Overview of the Coupled Model Intercomparison Project Phase 6 (CMIP6) experimental design and organization, Geosci. Model Dev., 9, 1937–1958, https://doi.org/10.5194/gmd-9-1937-2016, 2016.
Feng, J., Qin, T., Yan, D., Lv, X., Yan, D., Zhang, X., and Li, W.: The role of large reservoirs in drought and flood disaster risk mitigation: a case of the Yellow River Basin, Sci. Total Environ., 949, 175255, https://doi.org/10.1016/j.scitotenv.2024.175255, 2024.
Gidden, M. J., Riahi, K., Smith, S. J., Fujimori, S., Luderer, G., Kriegler, E., van Vuuren, D. P., van den Berg, M., Feng, L., Klein, D., Calvin, K., Doelman, J. C., Frank, S., Fricko, O., Harmsen, M., Hasegawa, T., Havlik, P., Hilaire, J., Hoesly, R., Horing, J., Popp, A., Stehfest, E., and Takahashi, K.: Global emissions pathways under different socioeconomic scenarios for use in CMIP6: a dataset of harmonized emissions trajectories through the end of the century, Geosci. Model Dev., 12, 1443–1475, https://doi.org/10.5194/gmd-12-1443-2019, 2019.
Gunawardana, S., Shrestha, S., Mohanasundaram, S., Salin, K., and Piman, T.: Multiple drivers of hydrological alteration in the transboundary Srepok River Basin of the Lower Mekong Region, J. Environ. Manage., 278, 111524, https://doi.org/10.1016/j.jenvman.2020.111524, 2021.
He, D.: Analysis on the hydrological characteristics of Lancang-Meigong River, Yunnan Geographic Environment Research, 1, 58–74, 1995 (in Chinese).
Hecht, J., Lacombe, G., Arias, M., Dang, T., and Piman, T.: Hydropower dams of the Mekong River basin: A review of their hydrological impacts, J. Hydrol., 568, 285–300, https://doi.org/10.1016/j.jhydrol.2018.10.045, 2019.
Ho, S. Q.-G. and Ehret, U.: Is drought protection possible without compromising flood protection? Estimating the potential dual-use benefit of small flood reservoirs in southern Germany, Hydrol. Earth Syst. Sci., 29, 2785–2810, https://doi.org/10.5194/hess-29-2785-2025, 2025.
Hoang, L. P., Lauri, H., Kummu, M., Koponen, J., van Vliet, M. T. H., Supit, I., Leemans, R., Kabat, P., and Ludwig, F.: Mekong River flow and hydrological extremes under climate change, Hydrol. Earth Syst. Sci., 20, 3027–3041, https://doi.org/10.5194/hess-20-3027-2016, 2016.
Hoang, L., van Vliet, M., Kummu, M., Lauri, H., Koponen, J., Supit, I., Leemans, R., Kabat, P., and Ludwig, F.: The Mekong's future flows under multiple drivers: How climate change, hydropower developments and irrigation expansions drive hydrological changes, Sci. Tot. Environ., https://doi.org/10.1016/j.scitotenv.2018.08.160, 2019.
IPCC: Sections, in: Climate Change 2023: Synthesis Report. Contribution of Working Groups I, II and III to the Sixth Assessment Report of the Intergovernmental Panel on Climate Change, edited by: Core Writing Team, Lee, H., and Romero, J., IPCC, Geneva, Switzerland, 35–115, https://doi.org/10.59327/IPCC/AR6-9789291691647, 2023.
IPCC Working Group I: Contribution to the Sixth Assessment Report of the Intergovernmental Panel on Climate Change. Climate Change; The Physical Science Basis, TS-93, https://www.ipcc.ch/report/ar6/syr/ (last access: October 2025), 2021.
Khadka, D., Babel, M., and Kamalamma, A.: Assessing the Impact of Climate and Land-Use Changes on the Hydrologic Cycle Using the SWAT Model in the Mun River Basin in Northeast Thailand, Water, 15, 3672, https://doi.org/10.3390/w15203672, 2023.
Kingston, D. G., Thompson, J. R., and Kite, G.: Uncertainty in climate change projections of discharge for the Mekong River Basin, Hydrol. Earth Syst. Sci., 15, 1459–1471, https://doi.org/10.5194/hess-15-1459-2011, 2011.
Lancang-Mekong Water Resources Cooperation Center (LMC) and Mekong River Commission (MRC): Technical Report – Phase 1 of the Joint Study on the Changing Patterns of Hydrological Conditions of the Lancang-Mekong River Basin and Adaptation Strategies, Beijing: LMC Water Center or Vientiane: MRC Secretariat, http://www.lmcwater.org.cn/cooperative_achievements/collaborative_projects/ (last access: October 2025), 2023.
Lange, S.: Trend-preserving bias adjustment and statistical downscaling with ISIMIP3BASD (v1.0), Geosci. Model Dev., 12, 3055–3070, https://doi.org/10.5194/gmd-12-3055-2019, 2019.
Lange, S.: ISIMIP3BASD (2.5.0), Zenodo [code], https://doi.org/10.5281/zenodo.4686991, 2021.
Lauri, H., de Moel, H., Ward, P. J., Räsänen, T. A., Keskinen, M., and Kummu, M.: Future changes in Mekong River hydrology: impact of climate change and reservoir operation on discharge, Hydrol. Earth Syst. Sci., 16, 4603–4619, https://doi.org/10.5194/hess-16-4603-2012, 2012.
Lei, X., Song, X., Guo, H., Ma, R., and Song, S.: Analysis on spatio-temporal evolution characteristics of short-cycle drought-flood sudden alteration and potential driving factors in the north-south transitional zone of China, Journal of Natural Disasters, 31, 31–43, https://doi.org/10.13577/j.jnd.2022.0403, 2022 (in Chinese).
Li, Y., Lu, H., Yang, K., Wang, W., Tang, Q., Khem, S., Yang, F., and Huang, Y.: Meteorological and hydrological droughts in Mekong River Basin and surrounding areas under climate change, J. Hydrol.: Reg. Stud., 36, 100873, https://doi.org/10.1016/j.ejrh.2021.100873, 2021.
Liu, H., Yang, Z., Xu, F., Zhang, X., Baiyin, B., Mu, X., and Hu, H.: Drought in Lancang-Mekong River Basin and the impact of upstream reservoirs, J. China Inst. Water Resour. Hydropower Res., 6, 479–485, https://doi.org/10.13244/j.cnki.jiwhr.20200058, 2020 (in Chinese).
Lu, X., Li, S., Kummu, M., Padawangi, R., and Wang, J.: Observed changes in the water flow at Chiang Saen in the lower Mekong: impacts of Chinese dams?, Quatern. Int., 336, 145–157, https://doi.org/10.1016/j.quaint.2014.02.006, 2014.
Lu, Y., Tian, F., Guo, L., Borzì, I., Patil, R., Wei, J., Liu, D., Wei, Y., Yu, D. J., and Sivapalan, M.: Socio-hydrologic modeling of the dynamics of cooperation in the transboundary Lancang–Mekong River, Hydrol. Earth Syst. Sci., 25, 1883–1903, https://doi.org/10.5194/hess-25-1883-2021, 2021.
Luo, X., Luo, X., Ji, X., Ming, W., Wang, L., Xiao, X., Xu, J., Liu, Y., and Li, Y.: Meteorological and hydrological droughts in the Lancang-Mekong River Basin: spatiotemporal patterns and propagation, Atmos. Res., 293, 106913, https://doi.org/10.1016/j.atmosres.2023.106913, 2023.
Ly, S., Sayama, T., and Try, S.: Integrated impact assessment of climate change and hydropower operation on streamflow and inundation in the lower Mekong Basin, Prog. Earth Planet. Sci., 10, 55, https://doi.org/10.1186/s40645-023-00586-8, 2023.
Mekong Region Futures Institute (MERFI): Dataset on the Dams of the Greater Mekong. Bangkok, Mekong Region Futures Institute, https://www.merfi.org/mekong-region-dams-database (last access: October 2025), 2024.
Mishra, V., Bhatia, U., and Tiwari, A.: Bias-corrected climate projections for South Asia from Coupled Model Intercomparison Project-6, Sci Data, 7, 338, https://doi.org/10.1038/s41597-020-00681-1, 2020.
Morovati, K., Tian, F., Kummu, M., Shi, L., Tudaji, M., Nakhaei, P., and Olivares, M.: Contributions from climate variation and human activities to flow regime change of Tonle Sap Lake from 2001 to 2020, J. Hydrol., 616, 128800, https://doi.org/10.1016/j.jhydrol.2022.128800, 2023.
Morovati, K., Tian, F., Pokhrel, Y., Someth, P., Shi, L., Zhang, K., and Ly, S.: Fishery and agriculture amidst human activities and climate change in the Mekong River: A review of gaps in data and effective approaches towards sustainable development, J. Hydrol., 132043, https://doi.org/10.1016/j.jhydrol.2024.132043, 2024.
Morris, G. L. and Fan, J.: Reservoir sedimentation handbook: Design and management of dams, reservoirs, and watersheds for sustainable use, McGraw-Hill, New York, NY, ISBN 007043302X, 9780070433021, 1998.
Mou, L., Tian, F., Hu, H., and Sivapalan, M.: Extension of the Representative Elementary Watershed approach for cold regions: constitutive relationships and an application, Hydrol. Earth Syst. Sci., 12, 565–585, https://doi.org/10.5194/hess-12-565-2008, 2008.
MRC: Assessment of Basin-Wide Development Scenarios – Main Report, Mekong River Commission, https://reliefweb.int/report/lao-peoples-democratic-republic/assessment-basin-wide-development-scenarios-main-report (last access: October 2025), 2010.
MRC: Irrigation Database Improvement for the Lower Mekong Basin. Vientiane, Lao PDR, https://www.mrcmekong.org/publications/irrigation-database-improvement-for-the-lower-mekong-river-basin/#:~:text=It reviews the current situation of irrigation in,%28LMB%29 and provides recommendations for further database impro (last access: October 2025), 2018.
MRC: State of the Basin Report 2018, https://www.mrcmekong.org/publications/state-of-the-basin-report-2018-2/ (last access: October 2025), 2019.
MRC: Annual Mekong hydrology, flood and drought report 2019: Drought in the Lower Mekong River Basin. Vientiane: MRC Secretariat, https://www.mrcmekong.org/publications/annual-mekong-hydrology-flood-and-drought-report-2019-drought-in-the-lower-mekong-basin/ (last access: October 2025), 2020.
MRC: State of the Basin Report 2023, https://www.mrcmekong.org/?download_document=1&document_id=01YJPZCU5Z52GW2IBACZCYVFLPVHD4GF4T&name=State-of the Basin Report 2023 (last access: November 2025), 2023.
Nan, Y., Tian, L., He, Z., Tian, F., and Shao, L.: The value of water isotope data on improving process understanding in a glacierized catchment on the Tibetan Plateau, Hydrol. Earth Syst. Sci., 25, 3653–3673, https://doi.org/10.5194/hess-25-3653-2021, 2021.
Räsänen, T., Koponen, J., Lauri, H., and Kummu, M.: Downstream Hydrological Impacts of Hydropower Development in the Upper Mekong Basin, Water Resour. Manage., 26, 3495–3513, https://doi.org/10.1007/s11269-012-0087-0, 2012.
Ren, J., Wang, W., Wei, J., Li, H., Li, X., Liu, G., Chen, Y., and Ye, S.: Evolution and prediction of drought-flood abrupt alternation events in Huang-Huai-Hai River Basin, China, Sci. Total Environ., 869, https://doi.org/10.1016/j.scitotenv.2023.161707, 2023.
Sabo, J., Puhi, A., Holtgrieve, G., Elliott, V., Arias, M., Ngor, B., Räsänen, T., and Nam, S.: Designing river flows to improve food security futures in the lower Mekong Basin, Science, 358, https://doi.org/10.1126/science.aao1053, 2017.
Schmitt, R., Bizzi, S., Castelletti, A., and Kondolf, G.: Improved trade-offs of hydropower and sand connectivity by strategic dam planning in the Mekong, Nat. Sustain., 1, 96–104, https://doi.org/10.1038/s41893-018-0022-3, 2018.
Shan, L., Zhang, L., Song, J., Zhang, Y., She, D., and Xia, J.: Characteristics of dry-wet abrupt alternation events in the middle and lower reaches of the Yangtze River Basin and the relationship with ENSO, Acta Geographica Sinica, 73, 25–40, https://doi.org/10.11821/dlxb201801003, 2018 (in Chinese).
Shi, W., Huang, S., Liu, D., Huang, Q., Han, Z., Leng, G., Wang, H., Hao, L., Li, P., and Wei, X.: Drought-flood abrupt alternation dynamics and their potential driving forces in a changing environment, J. Hydrol., 597, 126179, https://doi.org/10.1016/j.jhydrol.2021.126179, 2021.
Song, X., Lei, X., Ma, R., Hou, J., and Liu, W.: Spatiotemporal variation and multivariate controls of short-cycle drought–flood abrupt alteration: A case in the Qinling-Daba Mountains of China, Int. J. Climatol., 43, 4756–4769, https://doi.org/10.1002/joc.8115, 2023.
Sridhar, V., Kang, H., and Ali, S.: Human-Induced Alterations to Land Use and Climate and Their Responses for Hydrology and Water Management in the Mekong River Basin, Water, 11, 1307, https://doi.org/10.3390/w11061307, 2019.
Sun, P., Zou, Y., Yao, R., Ma, Z., Bian, Y., Ge, C., and Lv, Y.: Compound and successive events of extreme precipitation and extreme runoffunder heatwaves based on CMIP6 models, Sci. Total Environ., 878, 162980, https://doi.org/10.1016/j.scitotenv.2023.162980, 2023.
Tellman, B., Sullivan, J. A., Kuhn, C., Kettner, A. J., Doyle, C. S., Brakenridge, G. R., Erickson, T. A., and Slayback, D. A.: Satellite imaging reveals increased proportion of population exposed to floods, Nature, 596, 80–86, https://doi.org/10.1038/s41586-021-03695-w, 2021.
Tennant, D.: Instream flow regimens for fish, wildlife, recreation and related environmental resources, FISHERIES, 1, 6–10, https://doi.org/10.1577/1548-8446(1976)001<0006:IFRFFW>2.0.CO;2, 1976.
Thompson, J., Green, A., and Kingston, D.: Potential evapotranspiration-related uncertainty in climate change impacts on river flow: An assessment for the Mekong River basin, J. Hydrol., 510, 259–279, https://doi.org/10.1016/j.jhydrol.2013.12.010, 2014.
Tian, F., Hu, H., Lei, Z., and Sivapalan, M.: Extension of the Representative Elementary Watershed approach for cold regions via explicit treatment of energy related processes, Hydrol. Earth Syst. Sci., 10, 619–644, https://doi.org/10.5194/hess-10-619-2006, 2006.
Tian, F., Li, H., and Sivapalan, M.: Model diagnostic analysis of seasonal switching of runoff generation mechanisms in the Blue River basin, Oklahoma, J. Hydrol., 418, 136–149, https://doi.org/10.1016/j.jhydrol.2010.03.011, 2012.
Tian, F., Liu, H., Hou, S., Li, K., Lu, H., Ni, G., Mu, X., and Baiyinbaoligao: Drought characteristics of the Lancang-Mekong Basin and the role of reservoir regulation on streamflow, The International Journal of Hydropower & Dams, 5, 81–89, 2020.
van Pelt, S. C., Kabat, P., ter Maat, H. W., van den Hurk, B. J. J. M., and Weerts, A. H.: Discharge simulations performed with a hydrological model using bias corrected regional climate model input, Hydrol. Earth Syst. Sci., 13, 2387–2397, https://doi.org/10.5194/hess-13-2387-2009, 2009.
Wang, A., Miao, Y., Kong, X., and Wu, H.: Future changes in global runoff and runoff coefficient from CMIP6 multi-model simulation under SSP1-2.6 and SSP5-8.5 scenarios, Earth's Future, 10, e2022EF002910, https://doi.org/10.1029/2022EF002910, 2022.
Wang, C., Leisz, S., Li, L., Shi, X., Mao, J., Zheng, Y., and Chen, A.: Historical and projected future runoff over the Mekong River basin, Earth Syst. Dynam., 15, 75–90, https://doi.org/10.5194/esd-15-75-2024, 2024.
Wang, R., Li, X., Zhang, Q., Cheng, J., Li, J., Zhang, D., and Liu, Y.: Projection of drought-flood abrupt alternation in a humid subtropical region under changing climate, J. Hydrol., 624, 129875, https://doi.org/10.1016/j.jhydrol.2023.129875, 2023.
Wang, S., Zhang, L., She, D., Wang, G., and Zhang, Q.: Future projections of flooding characteristics in the Lancang-Mekong River Basin under climate change, J. Hydrol., 602, https://doi.org/10.1016/j.jhydrol.2021.126778, 2021.
Wang, W., Li, H. Y., Leung, L. R., Yigzaw, W., Zhao, J., Lu, H., Deng, Z., Demisie, Y., and Blöschl, G.: Nonlinear filtering effects of reservoirs on flood frequency curves at the regional scale, Water Resour. Res., 53, 8277–8292, https://doi.org/10.1002/2017WR020871, 2017a.
Wang, W., Lu, H., Leung, L. R., Li, H., Zhao, J., Tian, F., Yang, K., and Sothea, K.: Dam construction in Lancang-Mekong River Basin could mitigate future flood risk from warming-induced intensified rainfall, Geophys. Res. Lett., 44, 10378–10386, https://doi.org/10.1002/2017GL075037, 2017b.
Williams, J.: The hydropower myth, Environ. Sci. Pollut. R, https://doi.org/10.1007/s11356-019-04657-6, 2019.
Wu, Z., Li, J., He, J., and Jiang, Z.: Large-scale atmospheric singularities and summer long-cycle droughts–floods abrupt alternation in the middle and lower reaches of the Yangtze River, Chinese Science Bulletin, 51, 2027–2034, https://doi.org/10.1007/s11434-006-2060-x, 2006.
Xiong, J. and Yang, Y.: Climate Change and Hydrological Extremes, Curr. Clim. Change Rep., 11, 1, https://doi.org/10.1007/s40641-024-00198-4, 2025.
Yang, P., Zhang, S., Xia, J., Zhan, C., Cai, W., Wang, W., Luo, X., Chen, N., and Li, J.: Analysis of drought and flood alternation and its driving factors in the Yangtze River Basin under climate change, J. Atmos. Res., 270, 106087, https://doi.org/10.1016/j.atmosres.2022.106087, 2022.
Yang, Y., Weng, B., Bi, W., Xu, T., Yan, D., and Ma, J.: Climate Change Impacts on Drought-Flood Abrupt Alternation and Water Quality in the Hetao Area, China, Water, 11, 652, https://doi.org/10.3390/w11040652, 2019.
Yun, X., Tang, Q., Wang, J., Liu, X., Zhang, Y., Lu, H., Wang, Y., Zhang, L., and Chen, D.: Impacts of climate change and reservoir operation on streamflow and flood characteristics in the Lancang-Mekong River Basin, J. Hydrol., 590, 125472, https://doi.org/10.1016/j.jhydrol.2020.125472, 2020.
Yun, X., Tang, Q., Li, J., Lu, H., Zhang, L., and Chen, D.: Can reservoir regulation mitigate future climate change induced hydrological extremes in the Lancang-Mekong River Basin?, Sci. Total Environ., 785, https://doi.org/10.1016/j.scitotenv.2021.147322, 2021a.
Yun, X., Tang, Q., Sun, S., and Wang, J.: Reducing climate change induced flood at the cost of hydropower in the Lancang-Mekong River Basin, Geophys. Res. Lett., 48, e2021GL094243, https://doi.org/10.1029/2021GL094243, 2021b.
Zhang, K., Morovati, K., Tian, F., Yu, L., Liu, B., and Olivares, M.: Regional contributions of climate change and human activities to altered flow of the Lancang-Mekong river, J. Hydrol.: Reg. Stud., 50, 101535, https://doi.org/10.1016/j.ejrh.2023.101535, 2023.
Zhang, S., Zhang, J., Min, J., Zhang, Z., Zhuang, J., and Lin, J.: Drought–flood abrupt alternation based on runoff in the Huaihe River Basin during rainy season, Journal of Lake Sciences, 24, 679–686, https://doi.org/10.18307/2012.0506, 2012 (in Chinese).
Zhang, Z., Yuan, Y., Shen, D., and Fan, H.: Identification of drought-flood Abrupt alternation in tobacco growth period in Xingren county under climate change in China, Appl. Ecol. Environ. Res., 17, 12259–12269, https://doi.org/10.15666/aeer/1705_1225912269, 2019.
Zhao, D., Deng, S., and Zhang, J.: Spatiotemporal characteristics of dry-wet abrupt alternation events in China during 1960–2018, Int. J. Climatol., 42, 9612–9625, https://doi.org/10.1002/joc.7850, 2022.