
the Creative Commons Attribution 4.0 License.
the Creative Commons Attribution 4.0 License.
 | 22 Oct 2026
Benchmarking convection-permitting climate simulations for hydrometeorological characterizations: a comparative study of WRF-SAAG and observation-based products in Chile
Sofía Segovia-Escafi

Miguel Lagos-Zúñiga
Lucía Scaff
Andreas F. Prein
Over the last few years, significant progress has been made in the development of convection-permitting climate models (CPCMs), especially in improving precipitation estimates in regions with complex terrain. Recently, the South American Affinity Group (SAAG) developed a novel high-resolution dataset – hereafter referred to as the WRF-SAAG dataset – by dynamically downscaling the ERA5 reanalysis using the Weather Research and Forecasting (WRF) model over South America for the period 2000–2021. Here, we evaluate WRF-SAAG outputs across continental Chile and compare them with two widely used gridded meteorological products, CR2MET and RF-MEP, which combine reanalysis data with in situ measurements. In particular, we analyze spatial differences among climatological estimates from the three products, and we assess the quality of daily precipitation and daily maximum and minimum temperature simulations using observations from meteorological stations over the period April/2001–March/2018. We also compare the potential of these climate datasets for hydrological modeling using a conceptual, bucket-style rainfall-runoff model, evaluating the results against streamflow observations, satellite remote sensing (SRS) products, and a snow water equivalent (SWE) reanalysis product. We found that the detection accuracy varied within each Chilean macrozone, with worse performance in the Far North (17.5–26° S) and Patagonia (43.7–56° S). The evaluation of daily precipitation against station observations using Tang's Kling–Gupta efficiency (KGET) reveals that all datasets performed better in reproducing precipitation in rainy regions (median KGET ≥ 0.65 in the Southern macrozone), while in arid areas such as the Near North during summer, the median KGET was negative. The CR2MET product consistently provided the best performance for extreme precipitation and temperature, partly because it includes information from the stations used for evaluation. Finally, the application of the hydrological model shows that although WRF-SAAG simulations achieved runoff estimations comparable to the best observation-based gridded products (i.e., CR2MET or RF-MEP), with the best results in the southern macrozone they provided relatively lower performance in evapotranspiration (ET) and soil moisture estimates, as well as SWE simulations of competitive quality. More broadly, the results presented here show that, despite some remaining challenges in arid climate regions, kilometer-scale climate models can deliver valuable information for hydrological applications at the daily time scale in Chile.
- Article
(8806 KB) - Full-text XML
-
Supplement
(2278 KB) - BibTeX
- EndNote


Spatially distributed meteorological datasets are not only essential to understand weather and climate patterns, but also to characterize hydrological systems in various contexts (e.g., water balances, extreme events) and make predictions for water resources management and planning. Hence, the evaluation (e.g., Rasmussen et al., 2011; Mendoza et al., 2015) and inter-comparison (e.g., Zambrano-Bigiarini et al., 2017; Henn et al., 2018; Newman et al., 2019) of such datasets is critical for understanding their potential for different applications, especially in areas with complex topography where the scarcity of observations (e.g., Viviroli et al., 2011; Muñoz et al., 2024), the lack of long-term records (e.g., Barrios et al., 2018; Serrano-Notivoli and Tejedor, 2021), and precipitation undercatch (e.g., Rasmussen et al., 2012; Prein and Gobiet, 2017) introduce large uncertainties in the estimation of hydrometeorological variables.
In recent decades, several gridded meteorological datasets have been produced worldwide for catchment-scale, regional, and global-scale applications. Although spatial interpolation schemes based on in situ measurements and topographic descriptors have been the standard approach (Daly et al., 1994, 2008; Clark and Slater, 2006; Isotta et al., 2014; Newman et al., 2015a, 2020), their accuracy heavily depends on the spatial density of stations, which is typically higher in valleys and populated areas. On the other hand, satellite-based products (e.g., TRMM and CMORPH) have become an attractive alternative in sparse data regions, especially for rainfall (e.g., Kidd and Huffman, 2011; Lockhoff et al., 2014; Funk et al., 2015), though they tend to underestimate precipitation intensities, overestimate their frequency (Scheel et al., 2011; Katiraie-Boroujerdy et al., 2013), and depend on the retrieval algorithm (Bartsotas et al., 2018). Further, satellite-based precipitation estimates have particularly large uncertainties and biases in mountain regions (Derin and Yilmaz, 2014). Dynamical climate simulations have also been useful in producing global coverage historical time series at moderate (∼ 0.25–0.75°) resolutions, contributing to an improved understanding of mesoscale meteorology (e.g., Torma et al., 2015; Rummukainen, 2016; Vautard et al., 2021). In particular, atmospheric reanalysis products are generated with numerical weather prediction (NWP) models that assimilate a variety of observations, resulting in historical time series that contain a full set of meteorological variables (e.g., Saha et al., 2010; Rienecker et al., 2011; Hersbach et al., 2020), which can be used for detailed hydrological modeling analyses. However, these products still feature large biases, especially in mountainous regions, because of the inherent simplification of mesoscale processes in a smoothed topography. Finally, several gridded meteorological products have been developed by blending different data sources of meteorological variables, including in situ measurements, radar data, satellite products, reanalysis products and NWP model output. For example, Verdin et al. (2015) developed a product by combining satellite estimates with rain gauge observations using a Bayesian kriging approach; Beck et al. (2017) produced the global Multi-Source Weighted-Ensemble Precipitation (MSWEP) dataset by merging gauge, satellite, and reanalysis data; and Yin et al. (2021) proposed a three stage blending approach integrating multiple satellite and reanalysis products with gauge data.
Numerous studies have assessed the suitability of gridded precipitation and temperature datasets to provide reliable hydrological model simulations (e.g., Kouakou et al., 2023; Evin et al., 2024; Gebrechorkos et al., 2024; Jahanshahi et al., 2024). Overall, previous work suggests that observation-based meteorological products generally outperform other datasets in runoff estimation, and that bias correction using observational data improves the accuracy of runoff simulations (e.g., Kouakou et al., 2023; Jahanshahi et al., 2024). However, the reliability of observation-based products is inherently constrained by the spatial density of meteorological stations (Terink et al., 2018; Herrera et al., 2019). Lundquist et al. (2019) concluded that, in mountainous regions, the low density of meteorological stations relative to the spatial variability of precipitation, particularly snowfall, combined with the systematic undercatch of rain gauges, limits the representativeness of gridded observational products. As a result, high-resolution atmospheric models can perform similarly (e.g., Prein et al., 2023) or even outperform (e.g., Lundquist et al., 2019) gridded observational products in capturing total precipitation over complex terrain. Additionally, these models offer a physically consistent and spatially continuous representation of precipitation, making them a viable alternative for hydrological modeling applications.
Because of its complex topography and large hydroclimatic diversity (Sarricolea et al., 2017; Aceituno et al., 2021) continental Chile (∼ 17–57° S) is an interesting domain for the development and evaluation of gridded meteorological products for hydrometeorological applications. For example, Boisier et al. (2018) created the gridded meteorological product CR2MET based on the combination of in situ observations and ERA5 (Hersbach et al., 2020) reanalysis outputs, whereas Baez-Villanueva et al. (2020) developed the Random Forest based MErging Procedure (RF-MEP) for precipitation estimation, which consists of the combination of observational data, meteorological products (e.g., ERA5 reanalysis) and topographic covariates. While these observation-based datasets have been widely used for different applications (e.g., Hernandez et al., 2022; Murillo et al., 2022 in the case of CR2MET, and Chen et al., 2022; Al-Saeedi et al., 2024 in the case of RF-MEP), no systematic assessments of CR2MET and RF-MEP daily precipitation have been conducted using ground measurements as the observational reference. The far north (above 26° S) and far south (below 43.7° S) of Chile are regions of special interest, since the station density is considerably lower and, therefore, reanalysis products become critical for the development of gridded meteorological products and, in particular, precipitation estimates. Further, there is a high disagreement among CR2MET, RF-MEP, and ERA5 precipitation estimates over those areas. Indeed, annual differences between products in the far north (above 26° S) reach up to 117 mm (CR2MET: 63 mm, RF-MEP: 40 mm, ERA5: 157 mm), while in the far south (below 43.7° S), discrepancies are even larger, reaching up to 2203 mm (CR2MET: 1888 mm, RF-MEP: 815 mm, ERA5: 3018 mm) (Baez-Villanueva et al., 2021).
In the Andes, the performance of meteorological products varies considerably, with substantial differences between precipitation estimates north of 24° S and south of 35° S, and among temperature estimates between 27 and 35° S (Schumacher et al., 2020b). Zambrano-Bigiarini et al. (2017) assessed seven satellite-based rainfall products, finding that most of them perform better between 32 and 43° S at elevations below 1000 m a.s.l., while the poorest performance was obtained for elevations above 2000 m a.s.l. On the other hand, Zambrano et al. (2017) showed that satellite products generally capture the rainiest months more accurately than dry months, especially during the austral winter (JJA), except north of 28° S, where rainfall is concentrated in summer (DJF).
During the last decade, convection-permitting climate models (CPCMs) have become increasingly popular (Lucas-Picher et al., 2021) because they offer an enhanced representation of precipitation (e.g., Fosser et al., 2020), with the potential to outperform gridded observational products in capturing total precipitation over complex terrain (Lundquist et al., 2019). Additionally, CPCMs do not rely on cumulus parameterizations, detected as an important source of errors in regional climate modeling, improving land-atmosphere interactions (Prein et al., 2015). CPCMs also offer the opportunity to advance hydrometeorological understanding at kilometer-scale resolution, and have been used for a myriad of purposes, including snowpack analysis (Ikeda et al., 2021), cloud band detection (Zilli et al., 2024), and flood studies (Li et al., 2022) over continental domains (e.g., Liu et al., 2025). In particular, CPCMs offer a physically consistent and spatially continuous representation of precipitation, making them a viable alternative for process-based hydrological modeling applications.
Recently, the South American Affinity Group (SAAG), supported by the National Science Foundation (NSF) National Center for Atmospheric Research (Dominguez et al., 2024), generated an unprecedented high-resolution gridded meteorological dataset for South America using the Weather Research and Forecasting (WRF; Skamarock et al., 2019) model. This dataset , hereafter referred to as WRF-SAAG, offers new research opportunities for the region, characterized by scarce and discontinuous observational records (Condom et al., 2020). The WRF-SAAG precipitation simulations revealed high spatial correlations with observed annual averages (0.65–0.8), and a 0.95 correlation coefficient for mean annual 2 m temperature compared with observational and reanalysis products over the entire South American continent (Dominguez et al., 2024). Hourly evaluations indicate that the WRF-SAAG simulations better reproduce the diurnal cycle and heavy hourly precipitation over the East of Brazil (Dominguez et al., 2024). Liu et al. (2025) demonstrated the robust performance of convection-permitting WRF model simulations in replicating observed climatic patterns across South America, including the spatial distribution of annual, seasonal, and sub-seasonal precipitation amounts. They also showed the ability of WRF-SAAG to capture sharp near surface temperature gradients over steep and narrow mountains, along with the probability distributions of daily and hourly temperatures, highlighting the capability in resolving fine scale climatic variability. However, some regions feature annual biases up to 400 mm yr−1 (Liu et al., 2025). Despite other studies having evaluated the representation of cloud bands (Zilli et al., 2024) and tracking mesoscale systems (Núñez Ocasio and Moon, 2024; Prein et al., 2024; Rehbein et al., 2025), to the best of our knowledge, a hydrologically-oriented long-term evaluation has not been conducted, except for an individual watershed in the arid western Andes (∼ 28° S, Sanhueza, 2024).
Despite the WRF-SAAG simulations were not designed to reproduce every singular event precisely, their potential in representing historical weather variability at the daily time scale as well as the spatial and temporal characteristics of key hydroclimatic variables remains unknown. Therefore, the general objective of this study is to evaluate the ability of the WRF-SAAG simulations to represent daily precipitation and maximum and minimum temperatures over continental Chile, and to assess their potential as a meteorological forcing dataset for hydrological modeling, by comparing them with two observation-based meteorological products (CR2MET and RF-MEP). To achieve this, four specific objectives are addressed: (i) to identify the regions and climatic conditions where the main differences among the three meteorological datasets are observed; (ii) to evaluate the performance of daily meteorological time series from WRF-SAAG and observation-based meteorological products for precipitation, maximum temperature, and minimum temperature, against meteorological station observations; (iii) to assess the ability of the precipitation datasets to reproduce daily precipitation events of different magnitudes at meteorological stations; and (iv) to analyze the ability of the meteorological datasets to simulate runoff, reproduce hydrological signatures associated with mean flow and extreme runoff events and simulate other processes of the water cycle in a suite of catchments located across Chile, using a conceptual hydrological model.
The study area is continental Chile (Fig. 1), which spans more than 4200 km from north (17°29′ S) to south (55°58′ S) and is bounded by the Pacific Ocean in the west and the Andes Cordillera in the East. This domain encompasses four main geographical units from West to East: the Coastal Plains, the Coastal Range, the Intermediate Depression, and the Andes Cordillera. Further, the Chilean Water Directorate (DGA by its acronym in Spanish) defines five major macroclimatic zones for water resources management and planning: Far North (17.5–26° S); Near North (26–32.18° S); Central Chile (32.18–36.4° S); Southern Chile (36.40–43.7° S); and Austral Chile (43.7–56° S). These macrozones span a wide variety of climates, with very specific features across the austral seasons: summer (DJF), autumn (MAM), winter (JJA), and spring (SON).
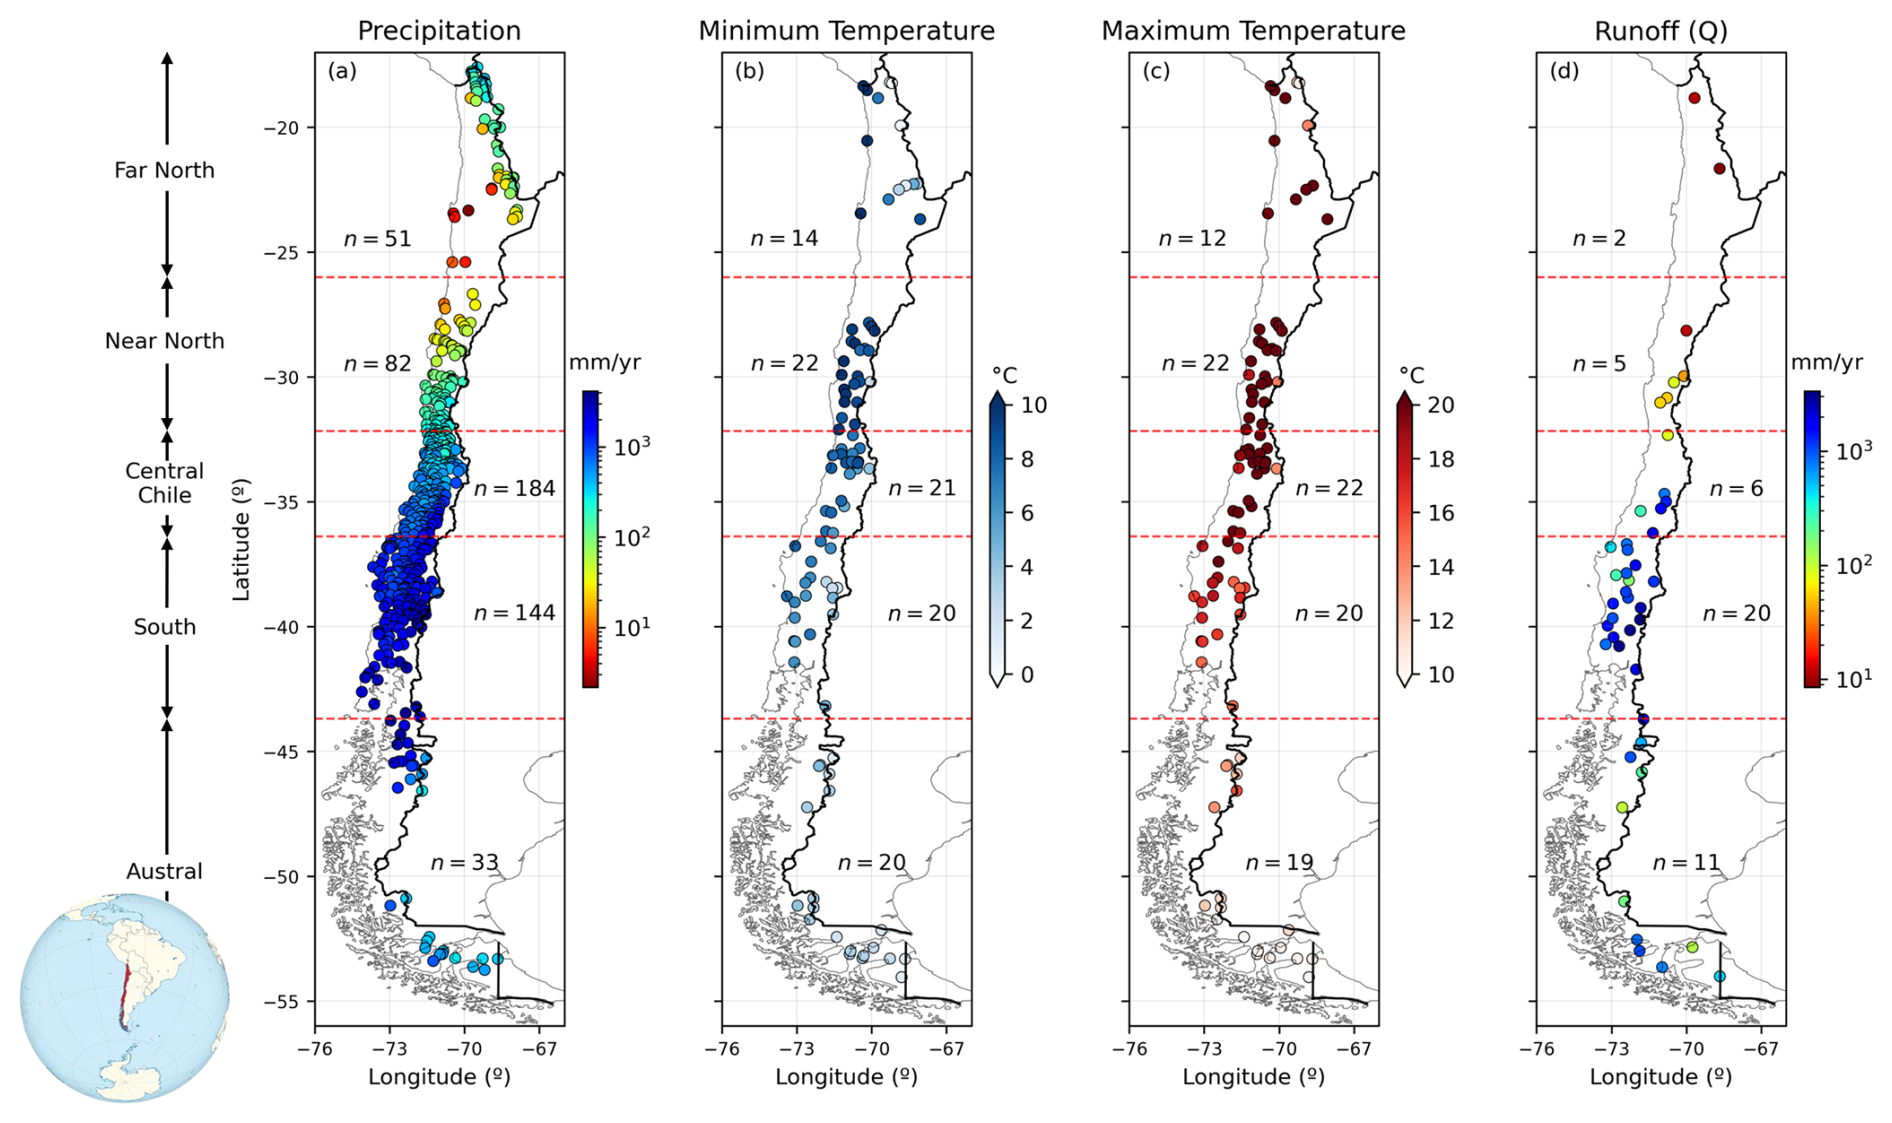
Figure 1Temporal averages of (a) annual precipitation, (b) minimum daily temperature, (c) maximum daily temperature, and (d) annual runoff measured at stations over the period April/2001–March/2018. Annual means were computed considering only water years with at least 80 % data availability. Red dashed lines indicate the boundaries of the study macrozones.
Arid and semi-arid conditions prevail in the Far and Near North macrozones, with spatially-averaged annual precipitation amounts (computed from station observations) of 129 and 135 mm yr−1 (Fig. 1), respectively. In the Far North, precipitation is concentrated in the austral summer (DJF) due to the Altiplano rainy season (Garreaud et al., 2003) whereas, in the Near North, winter precipitation is driven by Cut-Off Low events that produce snow accumulation at high altitudes (Rondanelli, 2025). The Near North macrozone also exhibits the highest daily minimum (maximum) temperature values, averaging 9.1 °C (24.5 °C). In Central Chile, temperate climates dominate, with an average annual precipitation of 591 mm, primarily concentrated in winter. The Southern macrozone is the wettest region, receiving an average of ∼ 1690 mm yr−1 (Fig. 1), with persistent winter precipitation events and moderate summer precipitation (Aceituno et al., 2021). Finally, precipitation is relatively uniform throughout the year in the Austral macrozone, with seasonal totals ranging 200–365 mm, and the lowest daily minimum (maximum) temperature values averaging 2.8 °C (11.3 °C).
For hydrological analyses, we selected 44 unimpaired catchments from the 2022 version of the Catchment Attributes and Meteorology for Large Sample Studies, Chile dataset (CAMELS-CL; Alvarez-Garreton et al., 2018). The selected catchments fulfill the following criteria: (i) at least 80 % coverage of daily discharge observations during the period April/2001–March/2018; (ii) location in the headwaters of the main river basins of the country; (iii) less than 2 % of glacierized area; (iv) absence of reservoirs; (v) area larger than 300 km2; and (vi) a low degree of human intervention (< 0.05), quantified as the ratio between the mean annual flow of surface water rights (permanent continuous consumptive) and the mean annual streamflow measured in the basin outlet (Alvarez-Garreton et al., 2018).
3.1 Ground-based observations
In-situ measurements of precipitation and extreme temperatures were obtained from stations maintained by the DGA and the Chilean National Weather Service (DMC by its acronym in Spanish). We selected stations with at least 80 % of daily records (period April/2001–March/2018) that passed the quality control process followed by Lagos-Zúñiga et al. (2024), which includes: (i) the Buishand (1984) U Homogeneity Test for annually-averaged time series, (ii) exclusion of stations with more than two years of missing data, (iii) removal of records with minimum temperature higher than maximum temperature, and (iv) application of a quantile mapping procedure to fill missing data, selecting the best neighboring station to complete missing records following Tang et al. (2020). Besides, daily precipitation values exceeding the mean plus 2.3 times the standard deviation were removed. For daily extreme temperatures, values above the mean plus three standard deviations or below the mean minus three standard deviations were also removed (Newman et al., 2015a). Hence, we considered 494 stations with precipitation records, and 97 (95) stations with minimum (maximum) temperature records for subsequent analyses.
Streamflow records were retrieved from stations maintained by the DGA, publicly available from the Center for Climate and Resilience Research (CR2) Climate Explorer (https://www.cr2.cl/datos-de-caudales/, last access: 23 October 2023).
3.2 Climate datasets
3.2.1 WRF-SAAG Simulations
The convection-permitting WRF-SAAG dataset (Dominguez et al., 2024) was produced by forcing the Weather Research and Forecasting Model (WRFv4.1.5, Skamarock and Klemp, 2008) with fifth-generation reanalysis (ERA5; Hersbach et al., 2020) produced by the European Centre for Medium-Range Weather Forecasts (ECMWF), using a 4 km grid spacing and 61 vertical levels over the period January/2000–December/2021. The model physics options include the Thompson microphysics scheme (Thompson et al., 2008); the Rapid Radiative Transfer Model (RRTM, Iacono et al., 2008); the Yosei University (YSU) boundary layer (Hong et al., 2006); the Noah land surface model with Multiple Parameterization Options (Noah-MP; Niu et al., 2011); and the Miguel-Macho and Fan (MMF) groundwater scheme (Miguez-Macho et al., 2007). For more details on the methodology and outcomes of these simulations, readers are referred to Dominguez et al. (2024).
Since WRF-SAAG simulations are forced with ERA5 reanalysis, they are expected to reproduce large-scale precipitation events and explicitly resolve mesoscale processes such as convective precipitation. However, because the simulations were not designed as a reanalysis dataset (i.e., they do not include data assimilation or spectral nudging), they are not intended to replicate every individual event with high precision.
WRF simulations are often used in hydrological studies, including hydrological modeling (e.g., Wagner et al., 2016) and case study analysis (e.g., Naabil et al., 2017) among others. However, the WRF-SAAG simulations have not been exhaustively evaluated in South America, and their skill as meteorological input forcing for hydrological applications (e.g., Xie et al., 2025) remains unexplored.
3.2.2 CR2MET
The CR2MET gridded meteorological product (DGA, 2017; Boisier et al., 2018) includes daily time series with precipitation and near-surface maximum/minimum temperatures over a regular 0.05° × 0.05° horizontal grid across continental Chile, for the period 1960–2021 in its latest version (v2.5). In CR2MET daily precipitation estimates were obtained through a statistical postprocessing technique that uses topographic descriptors and large-scale climatic variables (water vapor and moisture fluxes) from the ERA5 reanalysis (Hersbach et al., 2020). The postprocessing includes (i) a logistic regression model to estimate the probability of precipitation, and (ii) multiple linear regression models to compute precipitation amounts. Maximum and minimum daily temperature were also estimated through multiple linear regression models, including variables from MODIS land surface products as additional predictors. For the first version of CR2MET, more than 800 precipitation stations were considered (DGA, 2017). However, the number of temperature stations used in that version was not specified. Moreover, subsequent versions of the precipitation and temperature products do not provide detailed information on the number of stations used.
The CR2MET dataset has been used as an observational reference for many purposes, including the evaluation of other meteorological products (e.g., Bozkurt et al., 2019; Fernández et al., 2021; Torrez-Rodriguez et al., 2023); hydroclimatic characterizations (e.g., Vásquez et al., 2021; Hernandez et al., 2022); the assessment of hydrological modeling decisions (e.g., Sepúlveda et al., 2022; Murillo et al., 2022; Cortés-Salazar et al., 2023); drought propagation studies (e.g., Alvarez-Garreton et al., 2021; Lema et al., 2025); streamflow forecasting (e.g., Araya et al., 2023); and climate change impact assessments (Vicuña et al., 2021; Gateño et al., 2024; Vásquez et al., 2024, 2025).
3.2.3 RF-MEP
The Random Forest based MErging Procedure (RF-MEP, Baez-Villanueva et al., 2020), uses the Random Forest algorithm to characterize the spatial distribution of precipitation by merging information from different gridded products and ground-based observations for a given temporal scale. In this study, we used daily gridded precipitation generated by Baez-Villanueva et al. (2021) for a 0.05° × 0.05° horizontal grid that covers continental Chile over the period April/2001–March/2018. The RF-MEP product used here integrates 334 rain gauges, the SRTM-v4 digital elevation model (Rabus et al., 2003), and the atmospheric reanalysis ERA5.
The RF-MEP methodology has been replicated and evaluated for precipitation estimation in other regions of the world. Mohammed et al. (2023) applied the RF-MEP approach in the Upper Blue Nile River basin (Ethiopia) to merge ground-based measurements, satellite and reanalysis precipitation products, as well as topography-related features. The resulting merged product exhibited improved spatio-temporal representation and greater accuracy compared to individual input sources. In Chile, Baez-Villanueva et al. (2021) applied RF-MEP and used it to evaluate its impact on the regionalisation of hydrological model parameters, showing that RF-MEP performed competitively compared to other used precipitation datasets. RF-MEP has also served as a benchmark in comparisons with other precipitation estimation methodologies. For instance, Chen et al. (2022) found that RF-MEP performed comparably to triple collocation-based fusion methods in terms of correlation and error metrics, while Chen et al. (2024) reported that although RF-MEP improved precipitation estimates over raw satellite data, it was outperformed by their proposed Spatial Random Forest Downscaling and Merging (SRF-DM) approach, particularly in capturing high-intensity rainfall and complex spatial patterns. Further, RF-MEP has been applied in climate change studies to assess precipitation extremes and their trends (e.g., Valdivieso-García et al., 2024; Yan et al., 2024), and to characterize and optimize ground-based precipitation monitoring networks (e.g., Sreeparvathy and Srinivas, 2022).
3.3 Digital Elevation Models
For the hydrological modeling, the catchments were divided into elevation bands. To this end, we used digital elevation models (DEMs) from the Shuttle Radar Topography Mission (SRTM; Rabus et al., 2003) with a horizontal resolution of 3 arcsec (approximately 90 m).
3.4 Remote sensing and reanalysis reference datasets
3.4.1 MOD16A2GF evapotranspiration
To evaluate ET simulations, we obtained MOD16A2GF evapotranspiration (Running et al., 2021) through the AppEEARS platform (AppEEARS Team, 2026) for the period April/2001–March/2018. The MOD16A2GF product provides gap-filled net ET at a 500 m horizontal resolution and an 8 d cumulative temporal resolution. Basin-scale ET time series were derived for each catchment and used as the reference dataset, considering only grid-cell values between 0 and 100 mm 8 d−1. Catchments with less than 50 % spatial data coverage were excluded, resulting in a final set of 39 catchments for the evaluation.
3.4.2 C3S Satellite Soil Moisture
For soil moisture evaluation, we used global satellite observations of surface soil moisture (saturation) from the Copernicus Climate Change Service (C3S) Climate Data Store (Copernicus Climate Change Service, 2018). Specifically, we employed the C3S Satellite Surface Soil Moisture merged ACTIVE Product (version v202505). The product provides daily estimates content of liquid water in a surface soil layer of 2 to 5 cm depth expressed as the percentage of total saturation on a regular 0.25° latitude–longitude grid. Only basins with at least 50 % data availability in the daily reference soil moisture time series were retained for the analysis, resulting in 14 basins in the South macrozone and one basin in Central Chile.
3.4.3 SWE
Daily basin-scale SWE reference data were obtained from the CAMELS-CL dataset, which includes SWE derived from the 180 m resolution product developed by (Cortés and Margulis, 2017), covering the Near North and Central zones of Chile (25–37° S) for the period 1984–2015. We considered basins with at least 80 % daily SWE data, resulting in 11 catchments located between the Near North and Central Chile macrozones.
4.1 Meteorological assessment of gridded products
In order to compare precipitation and temperature estimates from WRF-SAAG simulations against the CR2MET and RF-MEP datasets, we first aggregated WRF-SAAG outputs to the same temporal resolution as those products (i.e., daily, Table 1), starting at UTC−4 (8 h winter local time in Santiago). We performed two types of comparisons among the three products, aimed at (i) detecting spatial differences between climatological annual and seasonal averages, and (ii) diagnosing the accuracy of daily estimates using ground-based observations as the reference at local time. Importantly, all the assessments presented in this study were conducted for the period April/2001–March/2018, for which the three forcing datasets have available data (Table 1).
Dominguez et al. (2024)Boisier et al. (2018)Baez-Villanueva et al. (2020, 2021)
4.1.1 Spatial comparison of climatological averages
To identify the main differences among climate variables across Chile, we computed annual and seasonal precipitation totals, as well as annual averages of daily minimum and maximum temperatures, along with their corresponding differences. For the grid-to-grid comparison, we performed remapping to the WRF-SAAG and RF-MEP grids, using the horizontal grid of CR2MET (0.05° × 0.05°, Table 1) as the reference.
4.1.2 Evaluation of daily precipitation and daily maximum and minimum temperatures
We extracted, at each station location in Fig. 1a, the closest grid cell values of daily precipitation time series from the WRF-SAAG, CR2MET, and RF-MEP products. Similarly, time series with minimum (maximum) daily temperatures were retrieved from the WRF-SAAG and CR2MET grid cells containing the stations in Fig. 1b (Fig. 1c), following the approach proposed by Thiemig et al. (2012). Then, we evaluated the capability of these products to replicate the occurrence of precipitation events with different magnitudes at station locations and the overall skill of daily time series. It should be noted that the daily assessments performed here are very restrictive and demand that events are simulated at the exact same time and location as observed. Even when the WRF-SAAG simulations have been compared with other climatological datasets (Dominguez et al., 2024), and are forced with ERA5 reanalysis, they may have spatiotemporal displacements of individual storms due to the large computational domain and chaotic nature of the atmosphere.
Despite CR2MET and RF-MEP being developed using many of the station-based observations employed in this evaluation, we assessed their performance against station data for two reasons: (i) the results show that, although these precipitation products combine reanalysis data and ground observations, they were not designed to match station measurements perfectly; and (ii) the reported errors are valuable for the hydrometeorology community, as this is the first evaluation against in situ observations at the daily time scale. The following points describe the performance metrics used to assess the different datasets.
-
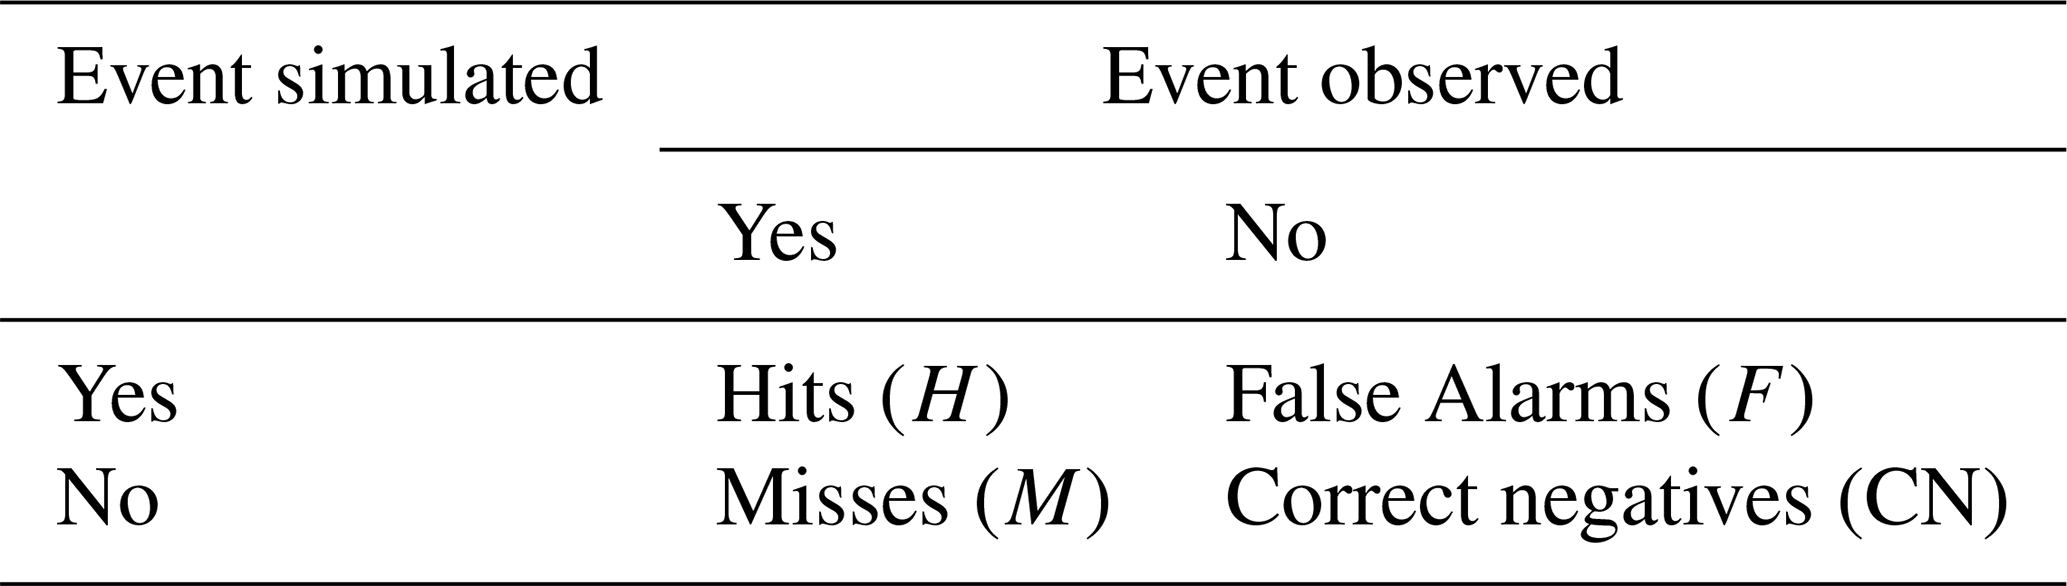
Ability to simulate observed precipitation events. We used metrics formulated from contingency tables to assess the ability of the datasets to replicate historically observed daily precipitation events exceeding thresholds of 1, 5, 10, and 20 mm d−1 (i.e., events > 1, > 5, > 10, and > 20 mm d−1). Given a precipitation threshold, 2 × 2 contingency tables (Table 2) can be constructed to assess the correspondence between nonprobabilistic forecast values and the discrete observable predictand values to which they pertain (Wilks, 2019).
We assessed the ability to replicate precipitation occurrence using the percentage correct (PC, Eq. 1), the probability of detection (POD, Eq. 2), the critical success index (CSI, Eq. 3), and the false alarm ratio (FAR, Eq. 4) (Wilks, 2019). These metrics have been widely used to assess precipitation products (e.g., Hobouchian et al., 2017; Nashwan et al., 2020; Valencia et al., 2023). The PC indicates how well the datasets discriminate precipitation and non-precipitation events:
The POD evaluates the ability to capture the occurrence of events:
We used the CSI to assess how well each product captures events:
Finally, we used the FAR to evaluate the fraction of events erroneously predicted:
PC, POD, FAR and CSI values range between 0 and 1, being the optimal value equal to 1 except for FAR, whose perfect value is 0.
-
Accuracy of daily precipitation and extreme temperature simulations. To assess the accuracy of precipitation and temperature retrieved from the different products, we used a modification of the Kling–Gupta efficiency (KGE; Gupta et al., 2009) proposed by Tang et al. (2021):
where r, βT and αT are the Pearson correlation coefficient, the bias and the variability term between observations (o) and data set (s), respectively, whereas σ and μ are the standard deviation (mm or °C) and the mean (mm or °C), respectively. Note that KGET, r, βT and αT are dimensionless, and that the optimal value for KGET, r, and αT is 1, while the optimal value for βT is 0. In this study, we computed the KGET for precipitation by season, whereas we used the entire time series for the assessment of temperature extremes.
4.2 Implications for hydrological modeling
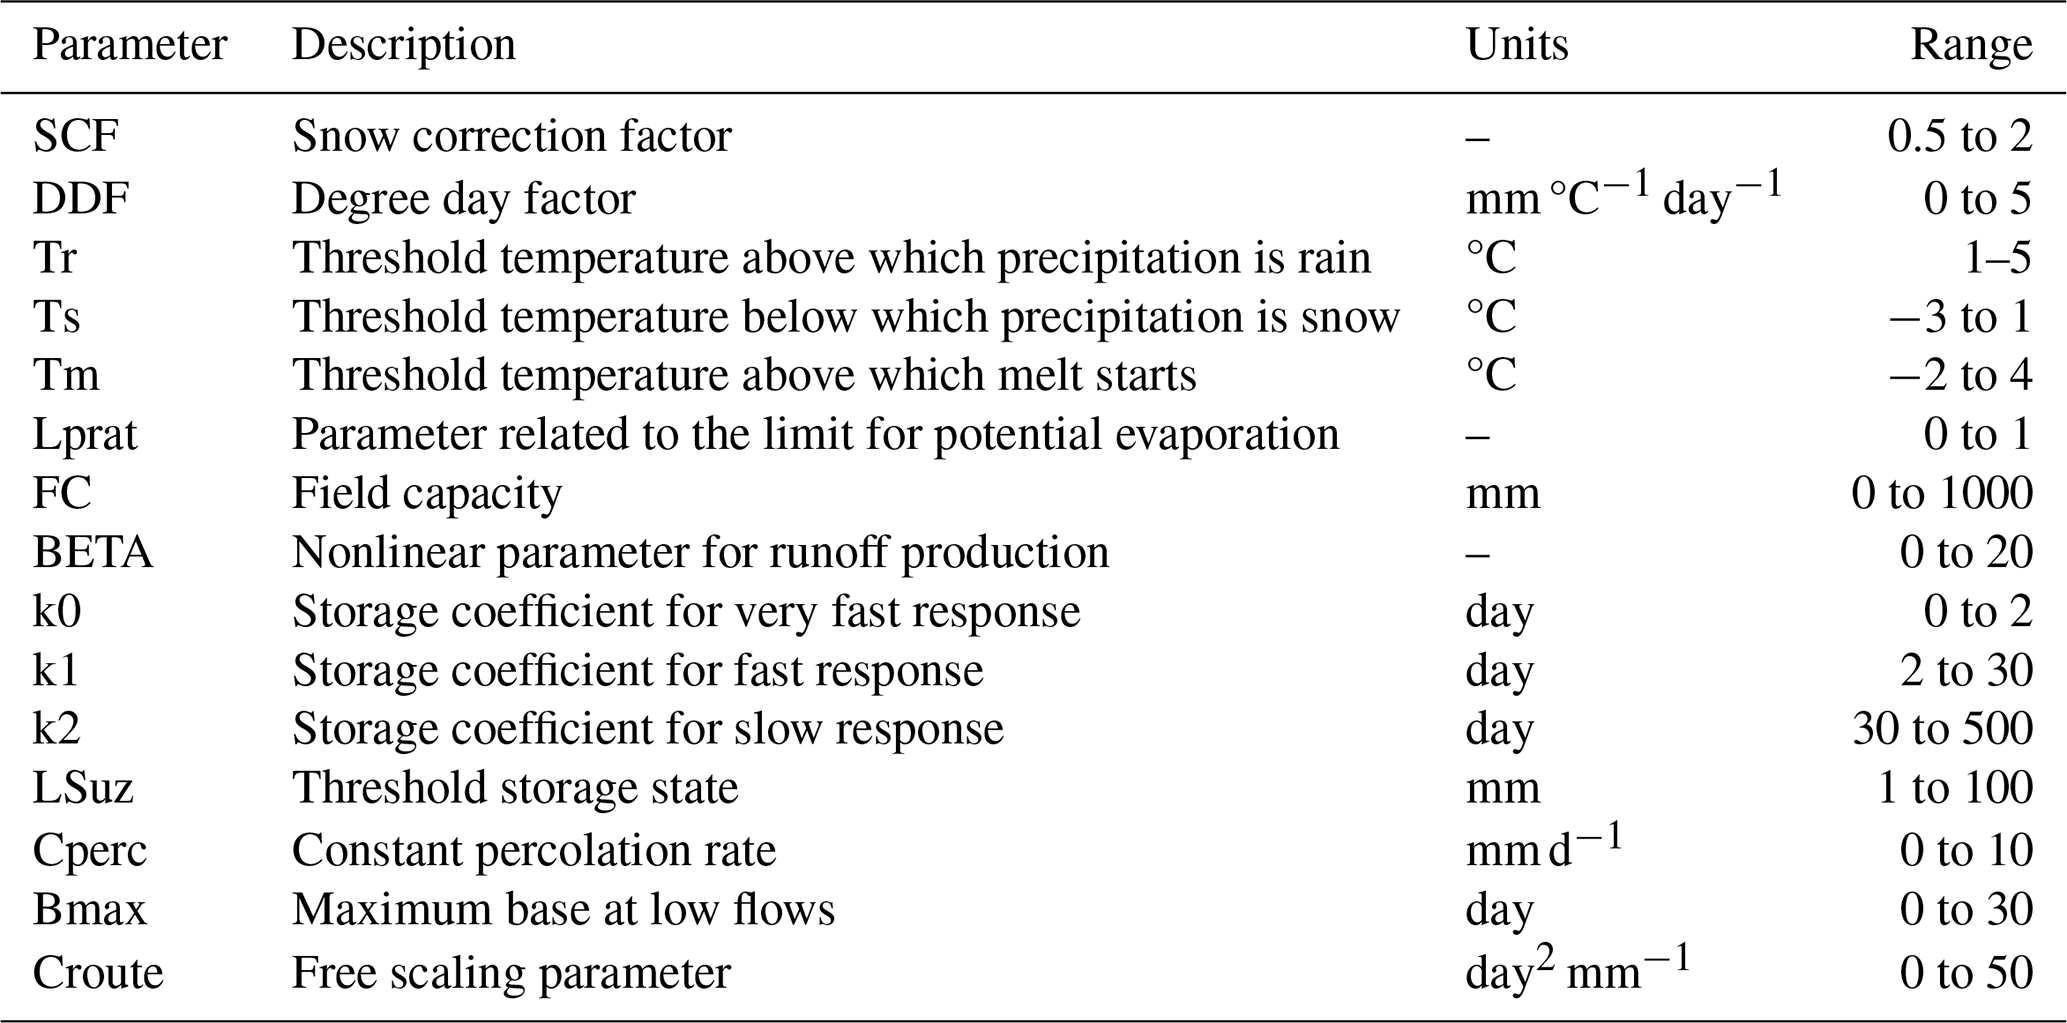
To assess the potential of WRF-SAAG precipitation and temperature data for hydrological modeling applications, and to perform a comparative evaluation against CR2MET and RF-MEP, we configured and calibrated the TUW model (Parajka et al., 2007) in the 44 case study basins at a daily time scale. The TUW model is a conceptual, bucket-style rainfall–runoff model based on the structure of the HBV model (Bergström, 1976). It simulates the catchment-scale water balance through snow, soil moisture, response, and routing modules and requires the specification of 15 parameters (Table 3).
Table 3Description of TUW model parameters and calibration ranges.
4.2.1 Model configurations
In this study, we configure the TUW model using the TUWmodel package implemented in the statistical software R (Viglione and Parajka, 2019). To account for subunit variability in precipitation and temperature due to orographic effects, we delineated three equal area elevation bands in catchments smaller than 600 km2 and five equal area elevation bands in the remaining basins.
The model's required input forcing variables are daily precipitation, temperature, and potential evapotranspiration (PET). Hence, we extracted precipitation time series from the WRF-SAAG, CR2MET, and RF-MEP datasets, and mean temperature time series from WRF-SAAG and CR2MET, computed as the average of daily maximum and minimum temperatures, datasets to compare different combinations of forcing datasets: (i) WRF-SAAG precipitation and temperature; (ii) CR2MET precipitation and temperature; (iii) RF-MEP precipitation and WRF-SAAG temperature; (iv) RF-MEP precipitation and CR2MET temperature. We calculated PET for each elevation band using the formulation proposed by Oudin et al. (2005), available in the R package airGR (Coron et al., 2023) and considering the latitude of the centroid of each band:
where Re is extraterrestrial radiation (MJ m−2 d−1), λ is the latent heat flux (MJ kg−1), ρ is the density of water (kg m−3) and T is mean daily air temperature (°C).
4.2.2 Calibration
We calibrated the parameters of the TUW model for each catchment and input forcing combination by maximizing the composite metric proposed by Garcia et al. (2017):
where Q is daily discharge, is the reciprocal of daily discharge, and KGE′ is the modified Kling–Gupta efficiency (KGE′, Kling et al., 2012):
In these equations, r, β and γ are the Pearson correlation coefficient, the bias ratio, and the variability ratio, respectively, whereas μs (μo) and σs (σo) are the mean and the standard deviation, respectively, of simulated (observed) daily values. KGE′, r, β and γ are dimensionless, with an optimal value of 1. Finally, KGE′(Q) (KGE) denotes the KGE′ obtained from comparing daily time series of simulated and observed .
The model parameters were calibrated by maximizing the objective function in Eq. (9) with the Shuffled Complex Evolution (SCE-UA, Duan et al., 1993) global optimization algorithm, using the same parameter ranges (Table 3) as Araya et al. (2023). The calibration period was defined as April/2005–March/2011, allowing a 4-year warm-up period, and the evaluation period was set as April/2011–March/2018.
4.2.3 Evaluation metrics
We used hydrological signatures representing mean-flow conditions, seasonality, and extremes (Table 4) to assess the ability of the three gridded climate datasets to replicate different observed hydrological features. These signatures were derived from simulated daily discharge (Q) for the four model configurations: (i) WRF-SAAG, (ii) CR2MET, (iii) RF-MEP and WRF-SAAG, and (iv) RF-MEP and CR2MET.
Table 4Hydrological signatures.
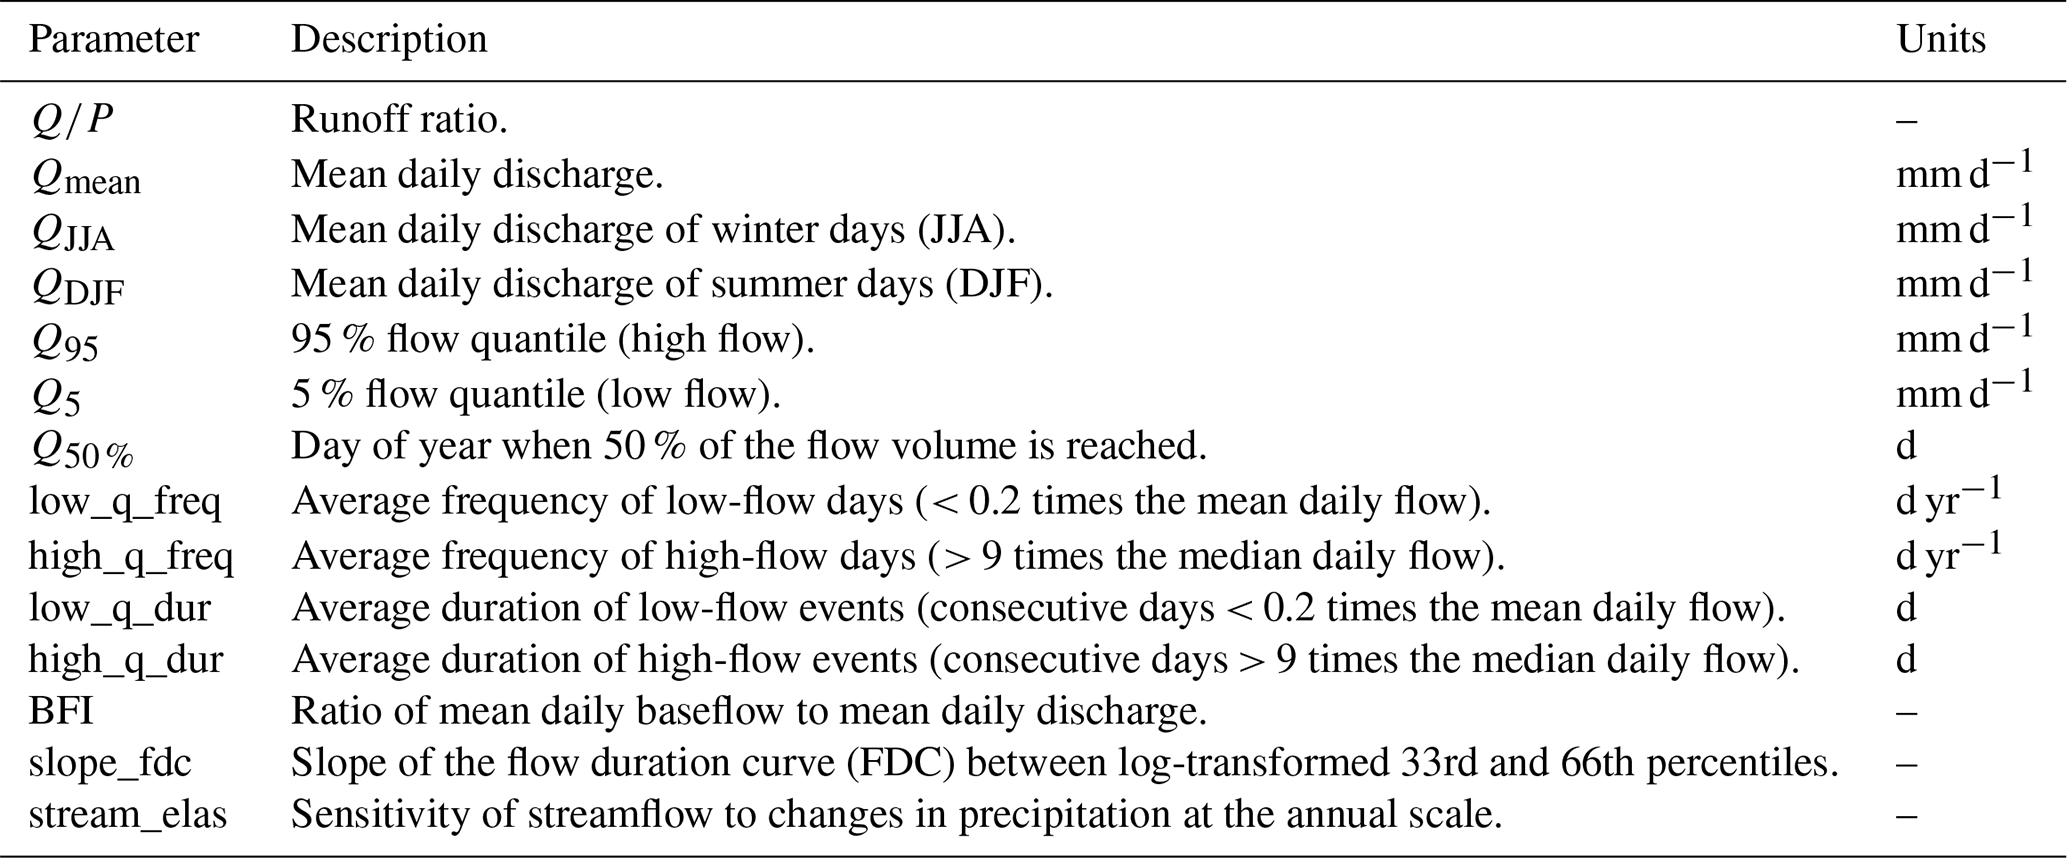
Note: the signatures Q50 %, low_q_freq, high_q_freq, low_q_dur, and high_q_dur were first calculated for each water year (April–March) and subsequently averaged over the study period. The remaining signatures (, Qmean, QJJA, QDJF, Q95, Q5, BFI, slope_fdc, and stream_elas) were computed using the full time series.
To ensure consistency between observed and simulated datasets, all metrics were computed using a paired-data approach: simulated Q values and associated precipitation (P) values were excluded (set to NA) for any time step where observations were missing. For signatures related to magnitude, ratios, and elasticity, we calculated the percent bias (PBias) as:
where Ssim and Sobs represent the simulated and observed hydrological signatures, respectively. Conversely, for signatures describing timing (Q50 %), frequency (low_f, high_f), and duration (low_d, high_d), the bias was computed as an absolute difference in days:
We evaluated catchment-scale outputs of actual evapotranspiration (ET), soil moisture, and snow water equivalent (SWE) simulated by the hydrological model under four different input forcing combinations, using satellite remote sensing (SRS) and reanalysis products as observational references.
Because the TUW model produces daily ET estimates, simulated ET was aggregated into 8 d cumulative values to match the temporal resolution of the MOD16A2GF product. ET performance was evaluated using a modified Kling–Gupta efficiency metric that excludes the bias term (KGE, eq. 15), following the formulation proposed by Pool et al. (2024), which emphasizes the correlation and variability components.
For soil moisture, simulated values were normalized by the field capacity parameter (FC, mm; Table 3) to obtain a dimensionless variable representing the degree of saturation. Then, the simulated degree of saturation was evaluated using the “surface soil moisture (saturation) %” from the C3S Satellite Surface Soil Moisture product (Copernicus Climate Change Service, 2018), which represents a soil layer of 2–5 cm depth, as the observational reference. The TUW model represents soil moisture storage as a single conceptual reservoir bounded by FC, without an explicitly defined physical soil depth. Because this conceptual storage is not necessarily equivalent to the shallow surface layer captured by the satellite product, soil moisture performance was assessed using the Pearson correlation coefficient to focus on the temporal dynamics (timing) of soil moisture variations rather than on the absolute magnitude of the degree of saturation.
Due to the temporal coverage of the SWE data, the evaluation period for this variable was restricted to April/2011–March/2015. Daily simulated SWE values were directly compared with the corresponding daily reanalysis estimates. SWE simulations were evaluated using the modified Kling–Gupta efficiency (KGE′, Eq. 10).
5.1 Comparison between gridded products
The first row of Fig. 2 shows WRF-SAAG mean annual and seasonal precipitation amounts (April/2001–March/2018), whereas the second and third rows display, for the same temporal aggregations, the differences between WRF-SAAG and CR2MET and RF-MEP, respectively. The maps with annual and seasonal accumulations reflect pronounced spatial gradients, with precipitation increasing from north to south and from west to east. The largest (smallest) precipitation amounts occur during winter (summer). WRF-SAAG simulations yield spatially-averaged (i.e., mean of all precipitation values in the grid cells within each macrozone) annual precipitation amounts of 74, 143, 840, 1936, and 2798 mm yr−1 for the Far North, Near North, Central Chile, South, and Austral macrozones, respectively. The largest differences between macrozone WRF-SAAG and CR2MET annual estimates are obtained in the Southern (−241 mm) and Austral (533 mm) macrozones (Fig. 2a). When contrasting WRF-SAAG against RF-MEP, the largest differences in annual domain-averaged estimates are found in Central Chile (−247 mm) and the Southern macrozone (−418 mm). Note that localized (i.e., pixel-wise) large (e.g., > 500 mm yr−1) differences between these products exist in the Austral macrozone (Fig. 2b).
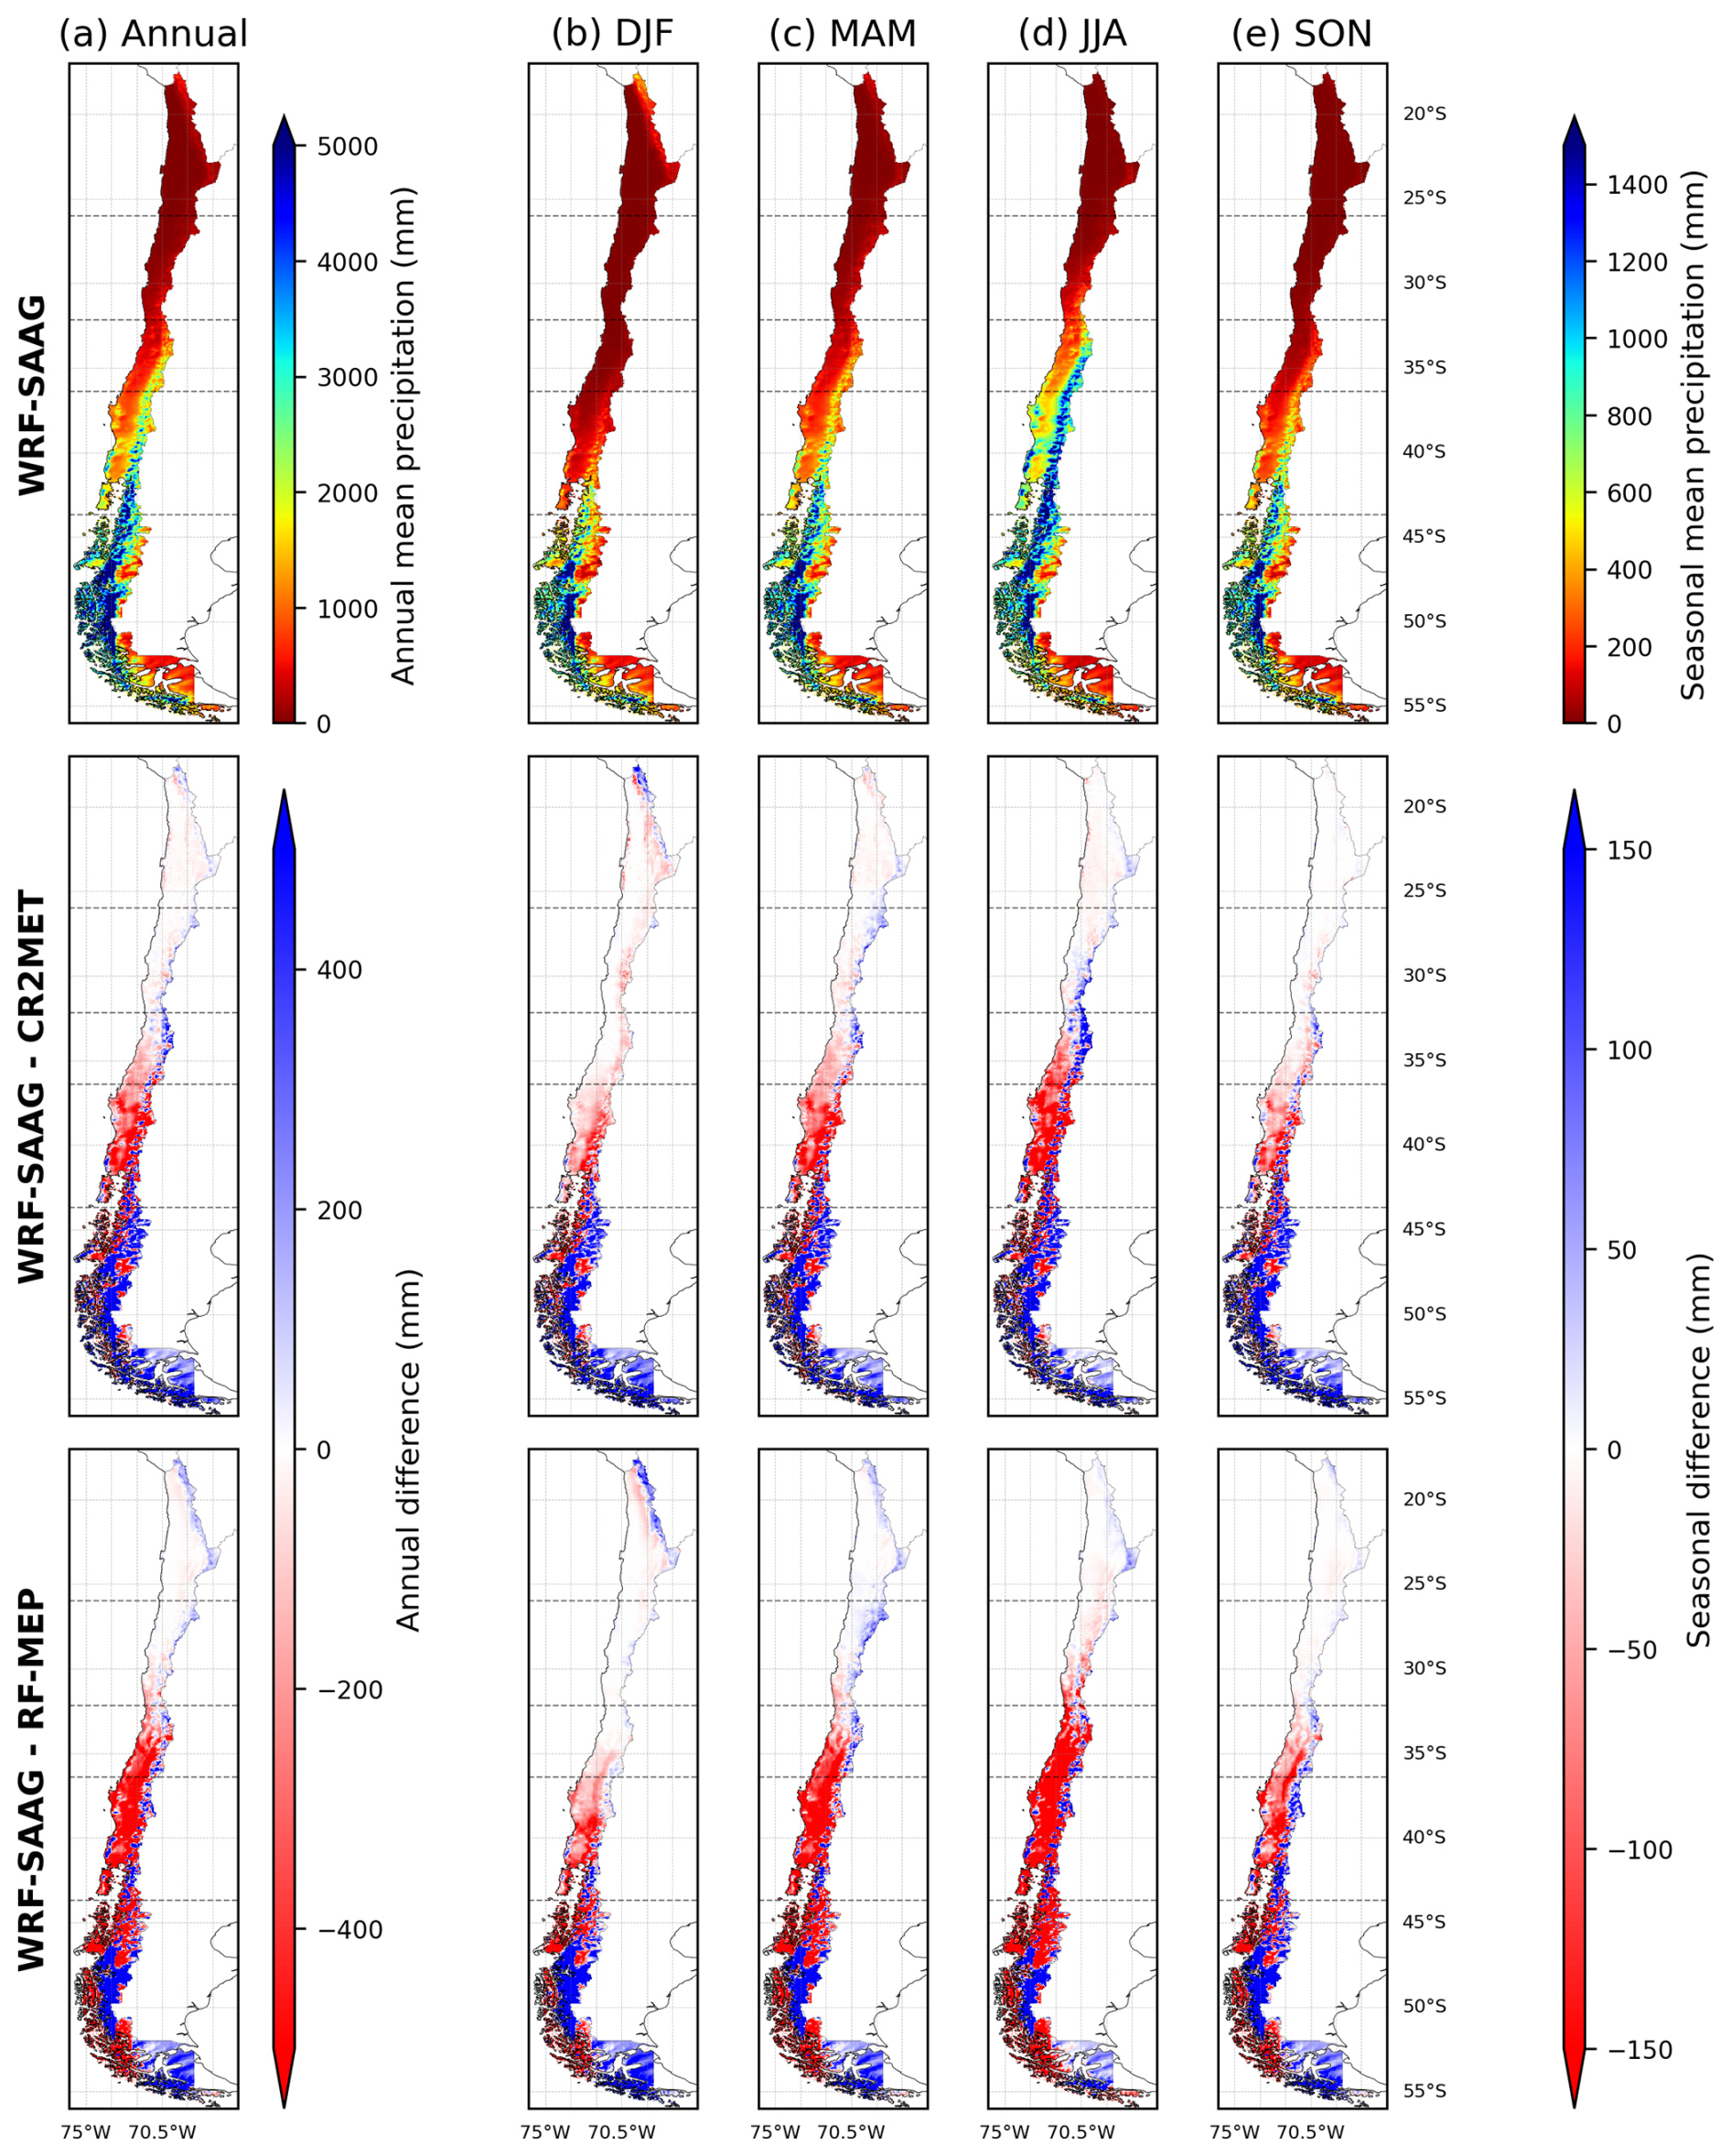
Figure 2Spatial distribution of mean precipitation simulated by WRF-SAAG and precipitation differences relative to CR2MET and RF-MEP over Chile (April/2001–March/2018). Columns show (a) annual means and seasonal means for (b) summer, (c) autumn, (d) winter, and (e) spring. The top row displays mean precipitation from WRF-SAAG, while the middle and bottom rows show precipitation differences between CR2MET and WRF-SAAG, and between RF-MEP and WRF-SAAG, respectively. Horizontal dashed lines indicate the boundaries of the five latitudinal macrozones: Far North, Near North, Central Chile, Southern, and Austral.
At the seasonal scale, the spatial patterns obtained for annual differences are preserved, with the largest disagreements (i.e., WRF-SAAG – CR2MET and WRF-SAAG – RF-MEP amounts) during winter, except in the Far North, where most precipitation occurs during summer. In this macrozone, WRF-SAAG yields a spatially averaged summer precipitation of 43 mm, primarily concentrated over the Altiplano; additionally, WRF-SAAG surpasses CR2MET and RF-MEP summer amounts by more than 150 mm in some areas of the Altiplano. In Central and Southern Chile, both CR2MET and RF-MEP generally provide larger precipitation amounts (i.e., pixel-wise differences < −100 mm) than WRF-SAAG, mainly during fall and winter, whereas pixel-wise differences are mostly positive over the Andes, with many grid cells having differences higher than 100 mm. In the Austral macrozone, CR2MET provides differences in spatially-averaged seasonal amounts ranging from 105 to 150 mm (i.e., WRF-SAAG simulates more precipitation than CR2MET). In contrast, pixel-wise comparisons between WRF-SAAG and RF-MEP yield positive and negative pixel-wise differences exceeding ±150 mm.
Figure 3 shows the spatial distribution of temporally-averaged (i.e., annual, summer, and winter) daily extreme temperatures simulated by WRF-SAAG and their differences relative to CR2MET. Overall, west–east and south–north temperature gradients are observed, with higher temperatures in summer, especially in northern Chile and the central valley, and lower temperatures in winter, particularly in Austral Chile and the Andes. The spatial distributions of differences between WRF-SAAG and CR2MET are different for daily maximum and minimum temperatures. For minimum temperatures between the Far North and Central Chile (excluding the Andes), WRF-SAAG yields temperatures up to 5 °C warmer than CR2MET throughout the year, in the coast and the central Valley. In contrast, CR2MET generally yields higher maximum temperatures, especially in high-elevation areas and in the Austral macrozone, where differences exceed 4 °C.
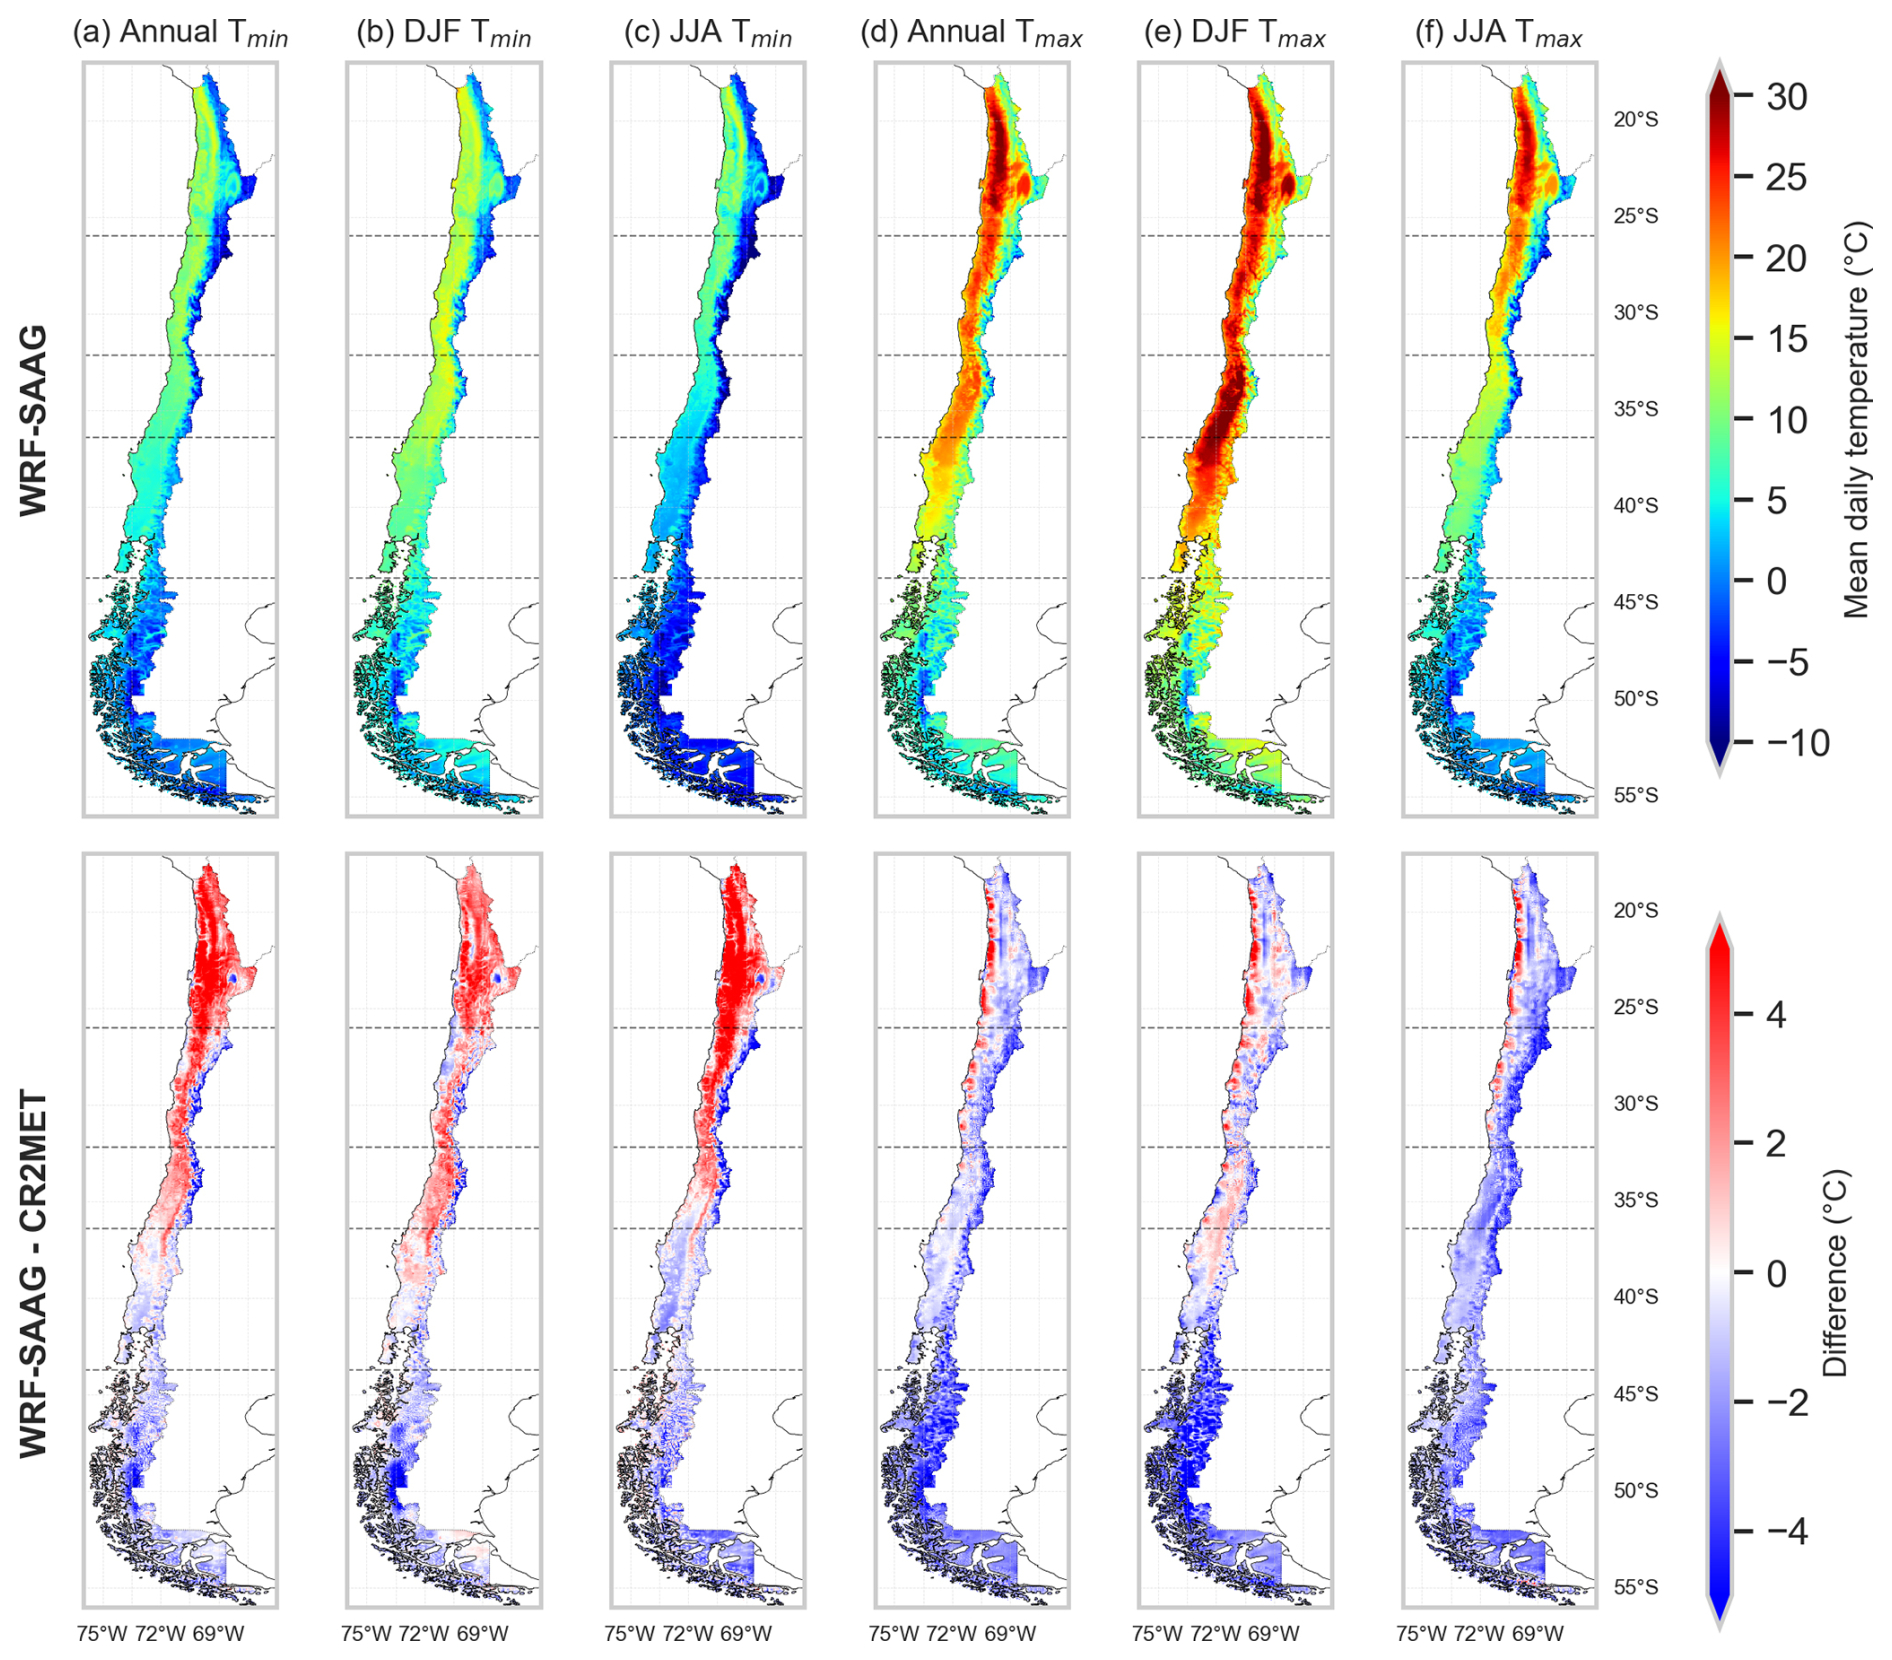
Figure 3(Top row) Spatial distribution of climatological averages for annual, summer and winter daily (a–c) minimum (Tmin) and (d–f) maximum (Tmax) air temperatures over Chile derived from the WRF-SAAG dataset, and (bottom row) differences relative to CR2MET (April/2001–March/2018). Horizontal dashed lines indicate the boundaries of the five latitudinal macrozones: Far North, Near North, Central Chile, Southern, and Austral.
5.2 Precipitation and temperature evaluation
5.2.1 Ability to simulate precipitation events
Figure 4 shows categorical metrics assessing the ability of WRF-SAAG, CR2MET, and RF-MEP to replicate precipitation events of different magnitudes across the study macrozones. The results show that all datasets achieve high PC values (≥ 0.64) across macrozones and precipitation thresholds, although this metric is strongly influenced by the large number of correct negatives (i.e., all the products are able to correctly simulate non-precipitation events). For the remaining metrics (i.e., POD, CSI and FAR), clearer differences among products are obtained. CR2MET provides the highest POD for precipitation events > 1 mm d−1, with median values generally above 0.85 across the study macrozones. However, the detection ability of CR2MET and WRF-SAAG decreases as the precipitation threshold increases. For events > 5, > 10, and > 20 mm d−1, RF-MEP generally achieves the highest median POD values. This is not the case for events above 1 mm d−1, which may be attributed to precipitation distribution, since the fraction of events (i.e., combinations of station locations and days) between 1 and 5 mm d−1 dominates among all events with P > 1 mm d−1 (not shown).
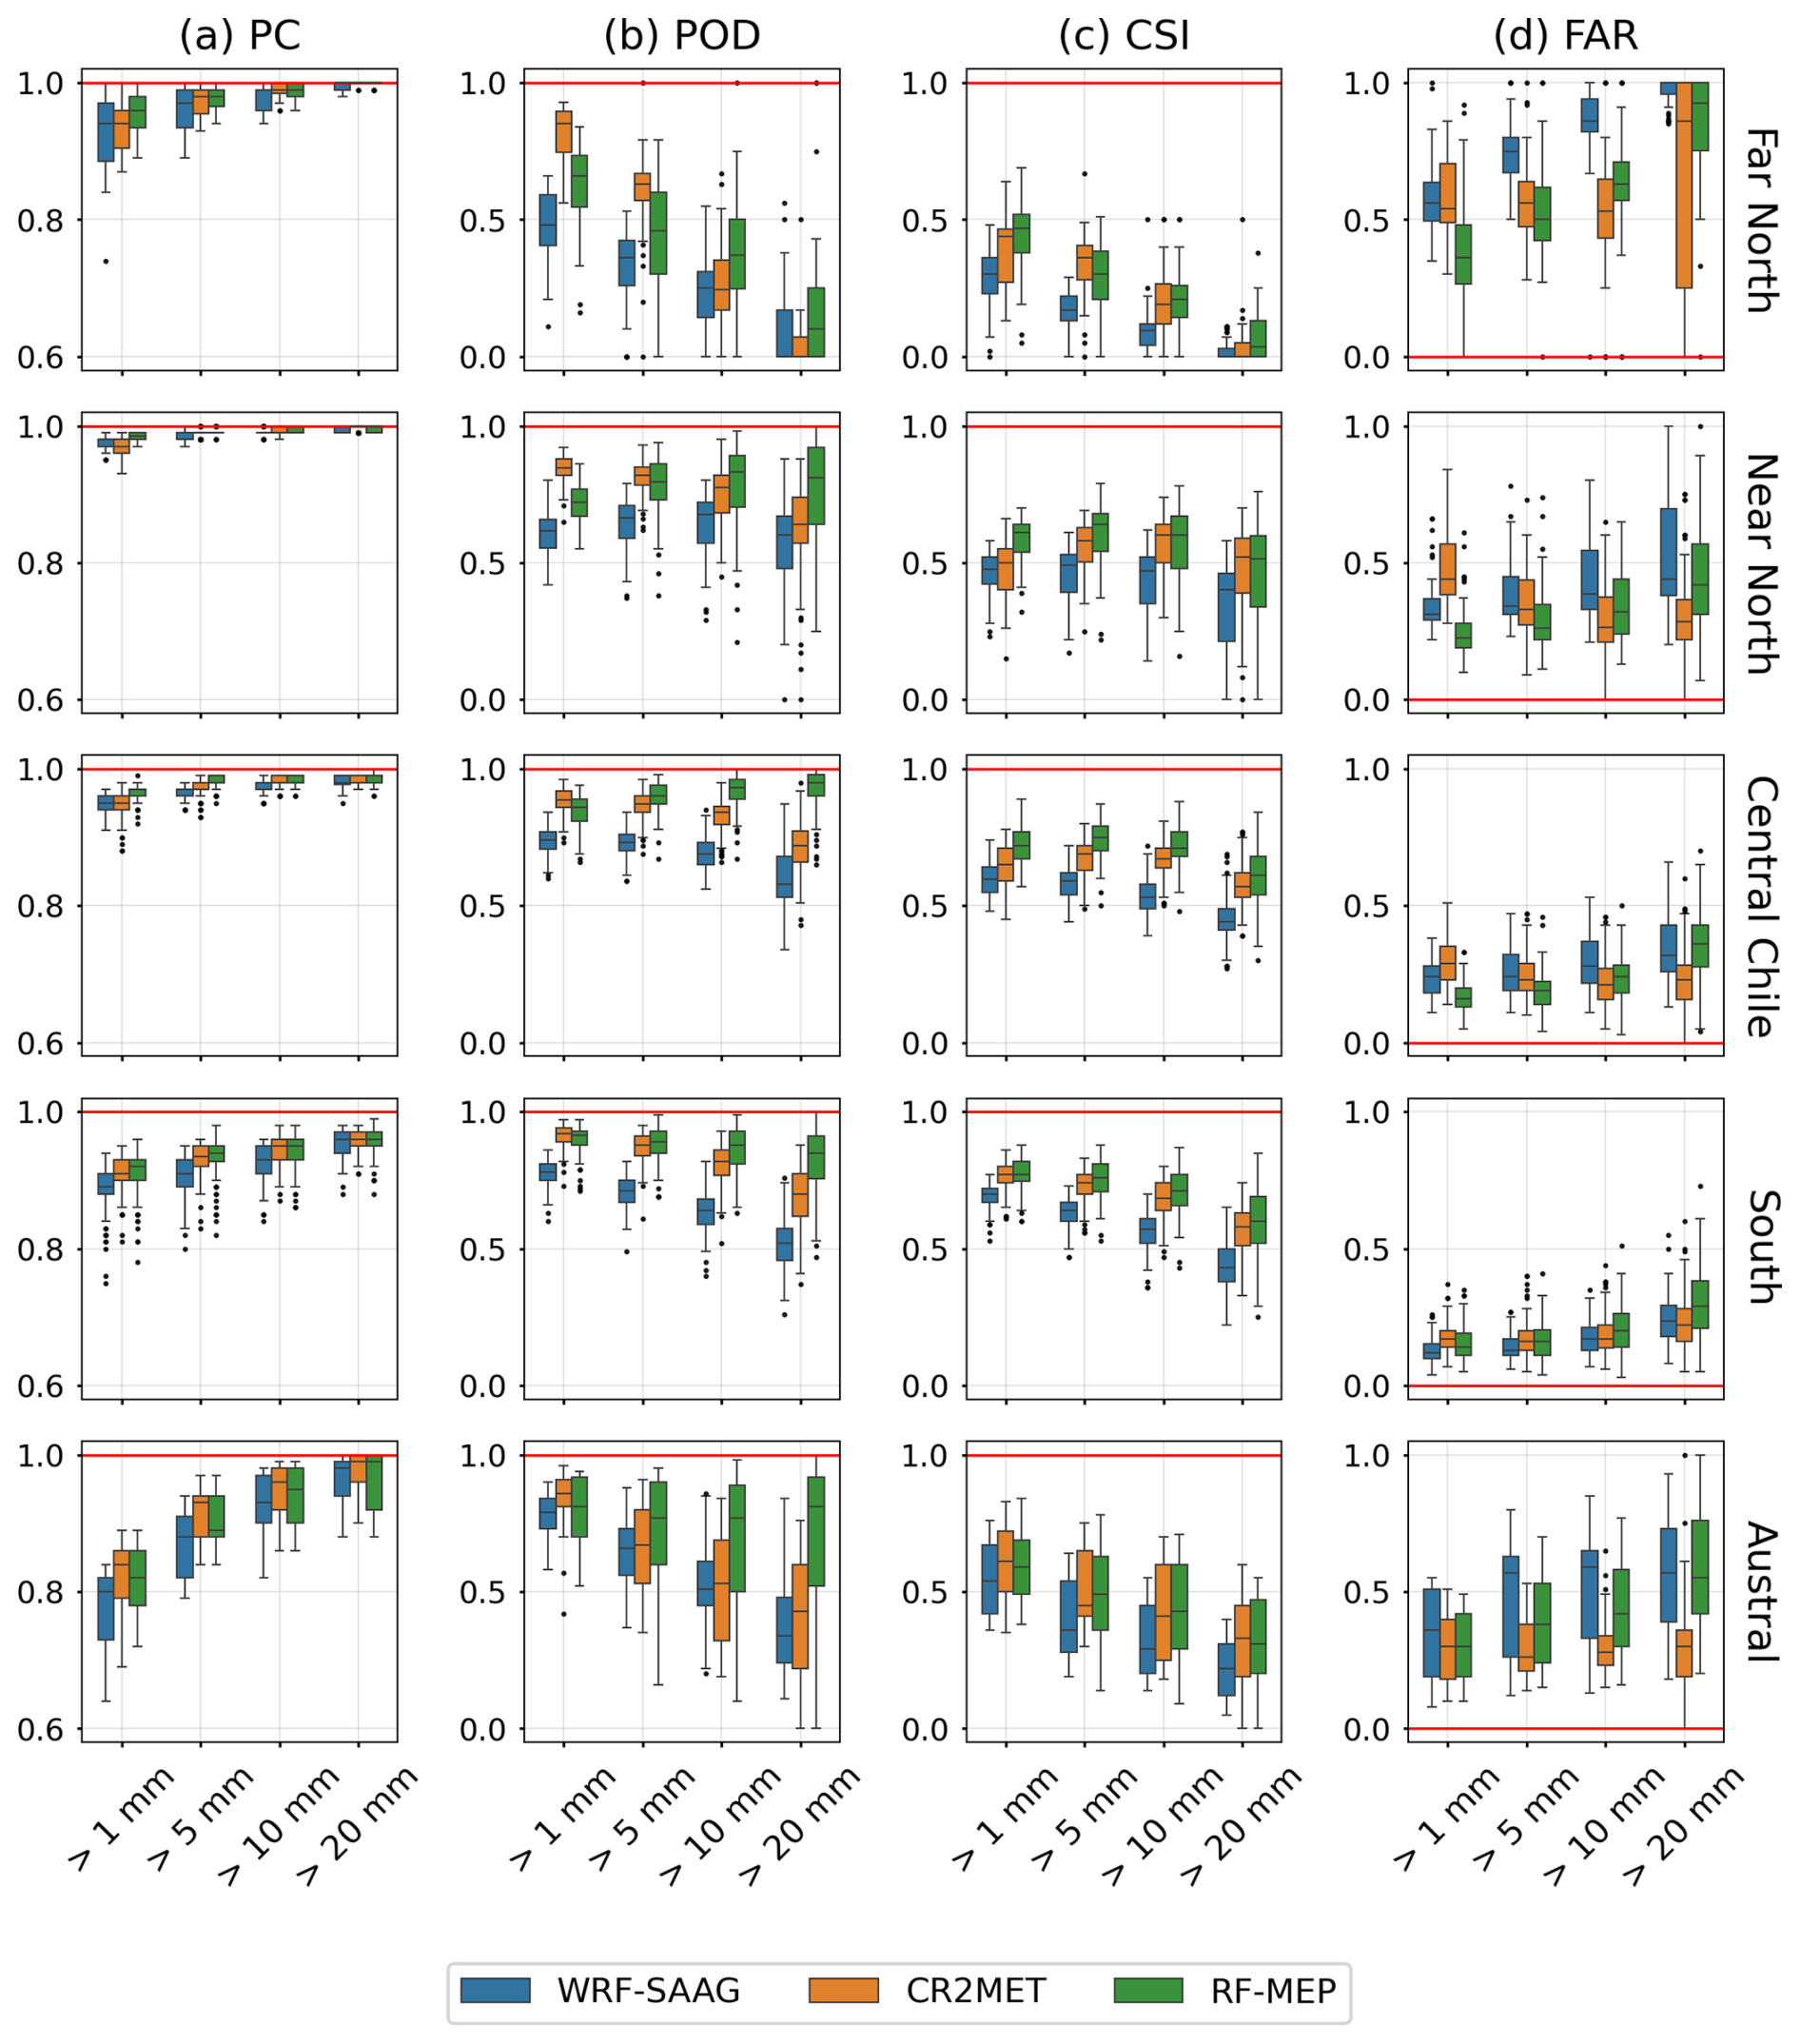
Figure 4Ability of WRF-SAAG, CR2MET, and RF-MEP to replicate historically observed daily precipitation events with amounts larger or equal than 1, 5, 10, and 20 mm d−1 in the study macrozones (rows). The metrics displayed in each column are: (a) Percentage Correct (PC), (b) Probability of detection (POD), (c) Critical Success Index (CSI), and (d) False Alarm Ratio (FAR). Each boxplot comprises results from all the stations within each macrozone. The boxes correspond to the interquartile range (IQR, i.e., 25th and 75th percentiles), the horizontal line in each box is the median, and whiskers extend to the ±1.5 ⋅ IQR of the ensemble. The red line represents the optimal values.
Figure 4 also shows that RF-MEP overall reaches the highest median CSI values for events > 5, > 10, and > 20 mm d−1. CR2MET yields the lowest median FAR for the 10 and 20 mm d−1 thresholds across the five macrozones, while RF-MEP achieved the lowest FAR at lower thresholds (> 1 and > 5 mm d−1) in the Far North, Near North and Central Chile.
5.2.2 Accuracy of daily precipitation estimates
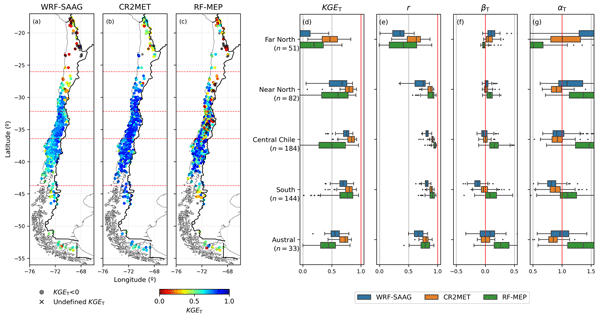
Figure 5 shows the spatial distribution of KGET (and its components) for summer (DJF) daily precipitation estimates from WRF-SAAG, CR2MET, and RF-MEP. The highest KGET values during summer are observed in the Southern macrozone, where median KGET values reach 0.65, 0.79, and 0.76 for WRF-SAAG, CR2MET, and RF-MEP, respectively. Median KGET values also remain at or above 0.65 in this macrozone throughout all seasons (see Fig. 6 for JJA and Figs. S1 and S2 in the Supplement for MAM and SON, respectively). The second best KGET for CR2MET in summer is obtained in the Austral region (median KGET = 0.72), whereas the second best KGET for WRF-SAAG (RF-MEP) is achieved in Central Chile, with a median of 0.59 (0.57). However, there are also negative KGET values within this macrozone, near its northern boundary (∼ 32.18° S).
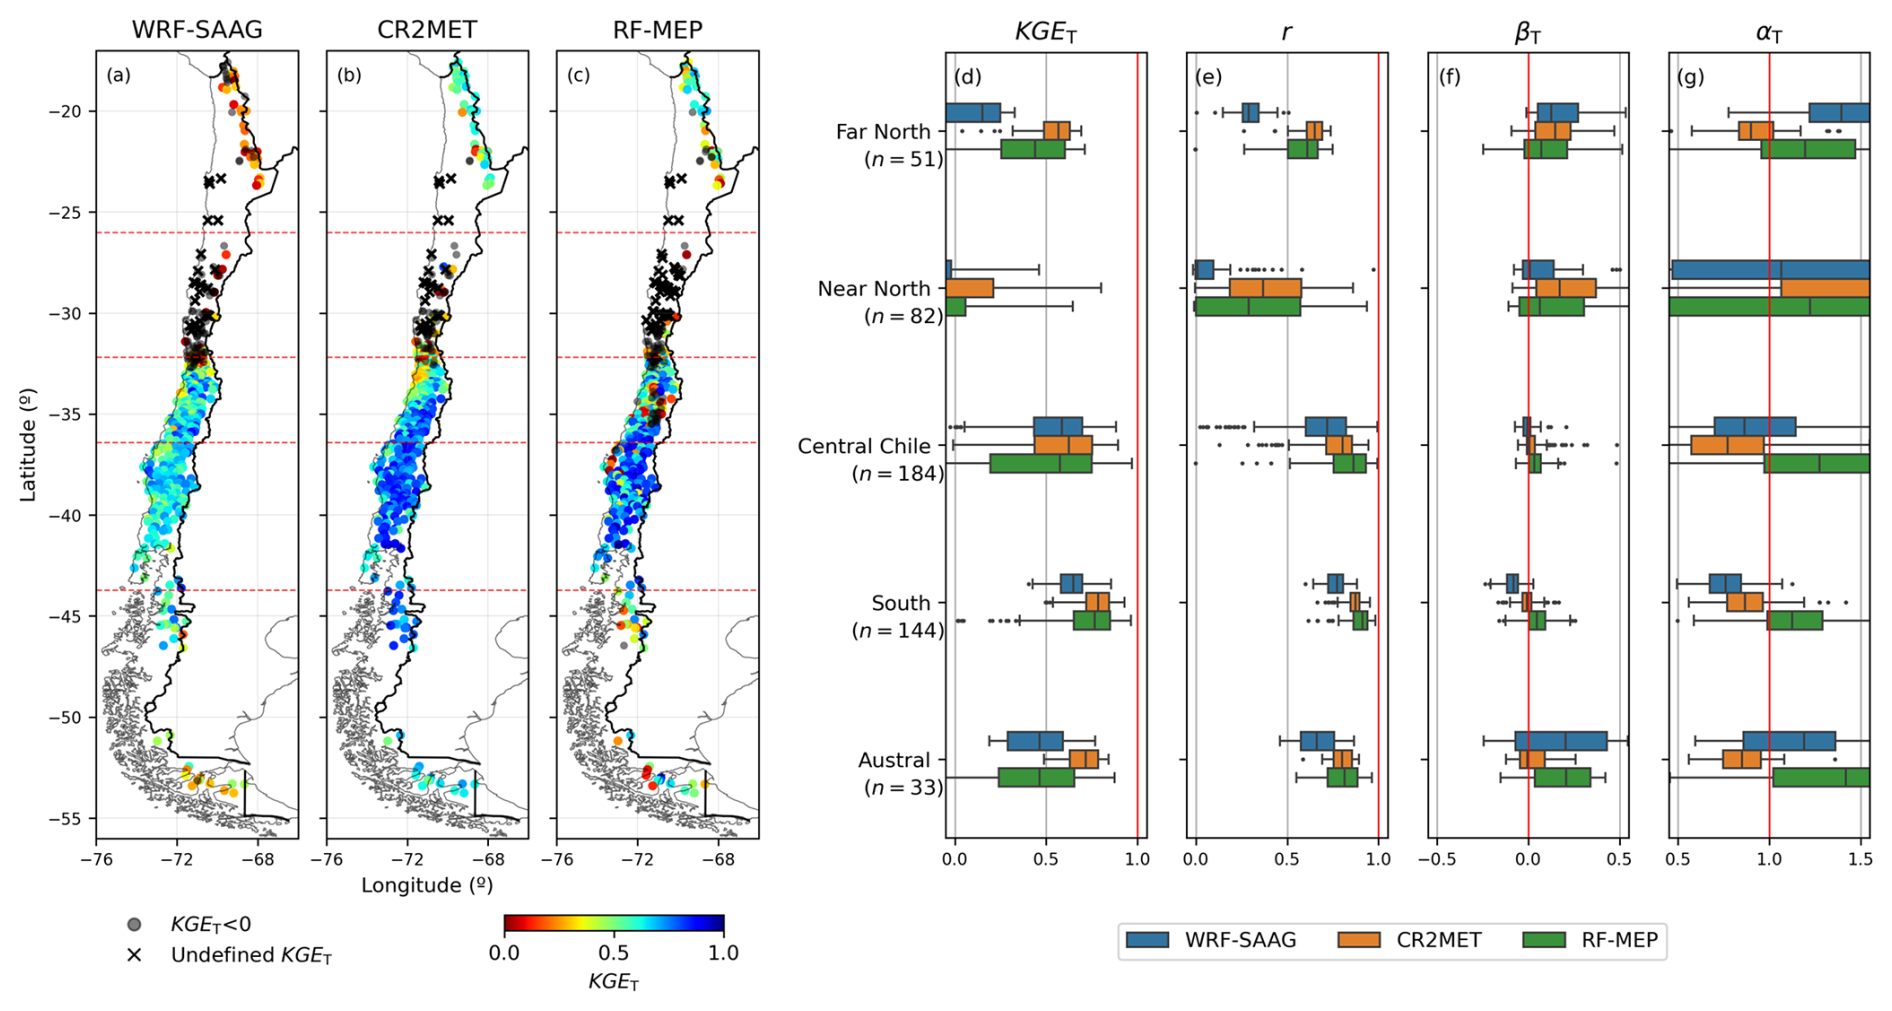
Figure 5(a–c) Spatial distribution of Tang's Kling–Gupta Efficiencies (KGET) for summer (DJF) daily precipitation retrieved from WRF-SAAG, CR2MET, and RF-MEP (period April/2001–March/2018) across continental Chile, using ground-based observations as the reference. Red dashed lines indicate the limits of the macrozones analyzed. (d–g) Boxplots with KGET, the Pearson correlation coefficients (r), bias term (βT), and variability ratios of Tang’s Kling–Gupta Efficiency (αT) obtained with the products examined for each macrozone, with the red line indicating the optimal value. Each boxplot comprises results for all the stations within a specific macrozone. The boxes correspond to the interquartile range (IQR, i.e., 25th and 75th percentiles); the vertical line in each box is the median, and the whiskers extend to the ±1.5 ⋅ IQR of the ensemble of stations.
The results in Fig. 5 show that the datasets have limitations in effectively capturing daily precipitation in arid regions, characterized by very low (or zero) precipitation amounts. In the Far North (medians KGET of 0.15, 0.44 and 0.57 for WRF-SAAG, RF-MEP and CR2MET, respectively) and Near North (medians KGET of −0.18, −0.32 and −0.22 for WRF-SAAG, RF-MEP and CR2MET, respectively), 23 stations did not record any precipitation events during all studied summers, which yields undefined KGET at these sites. Additionally, the largest differences among datasets in valid KGET are observed in the Far North and Austral macrozones, with CR2MET standing out in both regions, with medians of 0.57 and 0.72, respectively.
The largest spread among the KGET components for the three datasets is obtained for the variability ratio (αT; Fig. 5g), making it the term with the largest influence on the spatial variability of KGET throughout all the seasons (see also Figs. 6, S1 and S2). Further, WRF-SAAG provides lower correlation coefficients (r) compared to CR2MET and RF-MEP in all macrozones (Fig. 5e), which is consistent with the results obtained for the remaining seasons. Figure 5f shows that RF-MEP tends to overestimate daily precipitation amounts (median ≥ 0.03) and overestimate precipitation variability (median ≥ 1.12), a behavior that persists throughout the rest of the year, except for fall and winter in the Far North (the results for the transition seasons are provided in the Supporting Information). Additionally, CR2MET represents precipitation amounts between the Central and Austral macrozones better than the other datasets throughout the year (median βT difference of 0.03 from the optimal value; Fig. 5f). However, CR2MET underestimates the variability of daily precipitation during summer in these areas, with medians ≤ 0.87. This behavior is also observed across the other seasons.
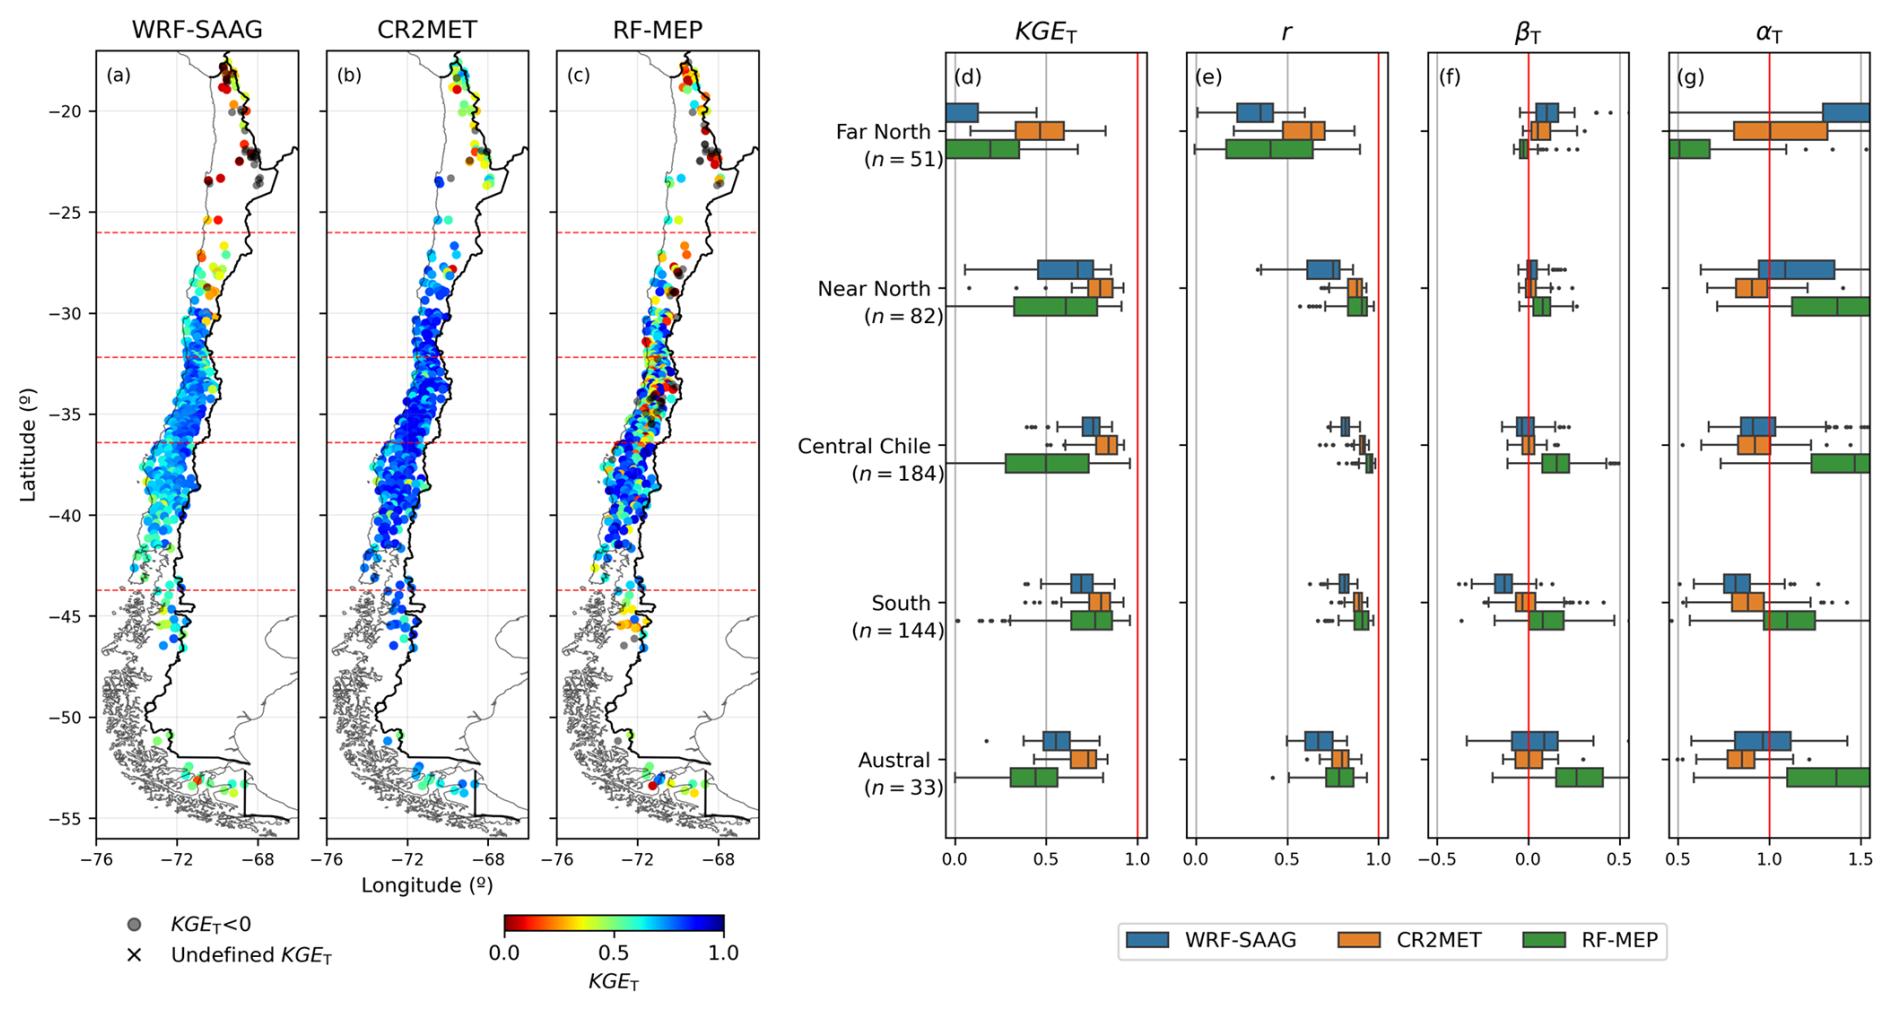
Figure 6Same as in Fig. 5, but for winter (JJA) daily precipitation.
Figure 6 displays performance metrics for winter (JJA) daily precipitation across the study domain. In general, both WRF-SAAG and CR2MET show an increase in median KGET during winter compared to summer between the Near North and Austral macrozones. CR2MET achieves the highest median winter KGET in all macrozones, with the best performance in the Central and Southern macrozones (median KGET ≥ 0.8). In the Near North, the three datasets shift KGET from negative values in summer to medians above 0.61 during winter. The Far North has the lowest winter precipitation (less than 5 mm per station) and the lowest median KGET compared to the other macrozones, with median values of −0.14, 0.47 and 0.19 for WRF-SAAG, CR2MET, and RF-MEP, respectively. The best results for WRF-SAAG (RF-MEP) are obtained in Central (Southern) Chile, with median KGET = 0.76 (0.77). On the other hand, RF-MEP performs better during summer than in winter in the Central (KGET median: 0.57 and 0.5 respectively) and Austral (KGET median: 0.46 and 0.44, respectively) macrozones.
During winter, the three datasets yield the lowest Pearson correlation in the Far North (Fig. 6e), with medians ≤ 0.63, and large ranges in the variability term αT (Fig. 6g). Interestingly, CR2MET achieves a median αT equal to the optimal value, but with an interquartile range of 0.51. Figure 6 also shows that CR2MET excels in replicating winter precipitation volumes, with bias term medians deviating by only 0.06 from the optimal value. Further, CR2MET tends to underestimate daily precipitation variability (αT) in Near North, Central Chile, South, and Far South, with αT medians ranging from 0.85 to 0.92. On the other hand, RF-MEP struggles to replicate precipitation variability, overestimating the dispersion of precipitation amounts between the Near North and Austral macrozones (i.e., αT medians spanning 1.1–1.47).
5.2.3 Accuracy of daily temperature estimates
Figure 7 displays the spatial distribution of KGET and its components for WRF-SAAG and CR2MET minimum daily temperatures. The results show that CR2MET outperforms WRF-SAAG, with median KGET ≥ 0.71 in the Central, Southern and Austral macrozones, while the median values drop between 0.52 and 0.54 in the northern regions. WRF-SAAG reaches its highest KGET values in the Austral macrozone, with a median of 0.6; on the other hand, the median KGET between the Far North and Central Chile macrozones is ≤ 0.43. Figure 7d also shows that CR2MET yields a higher Pearson correlation in all macrozones, with median values ≥ 0.74, and a narrower interquartile range of βT and αT coefficients compared to WRF-SAAG.
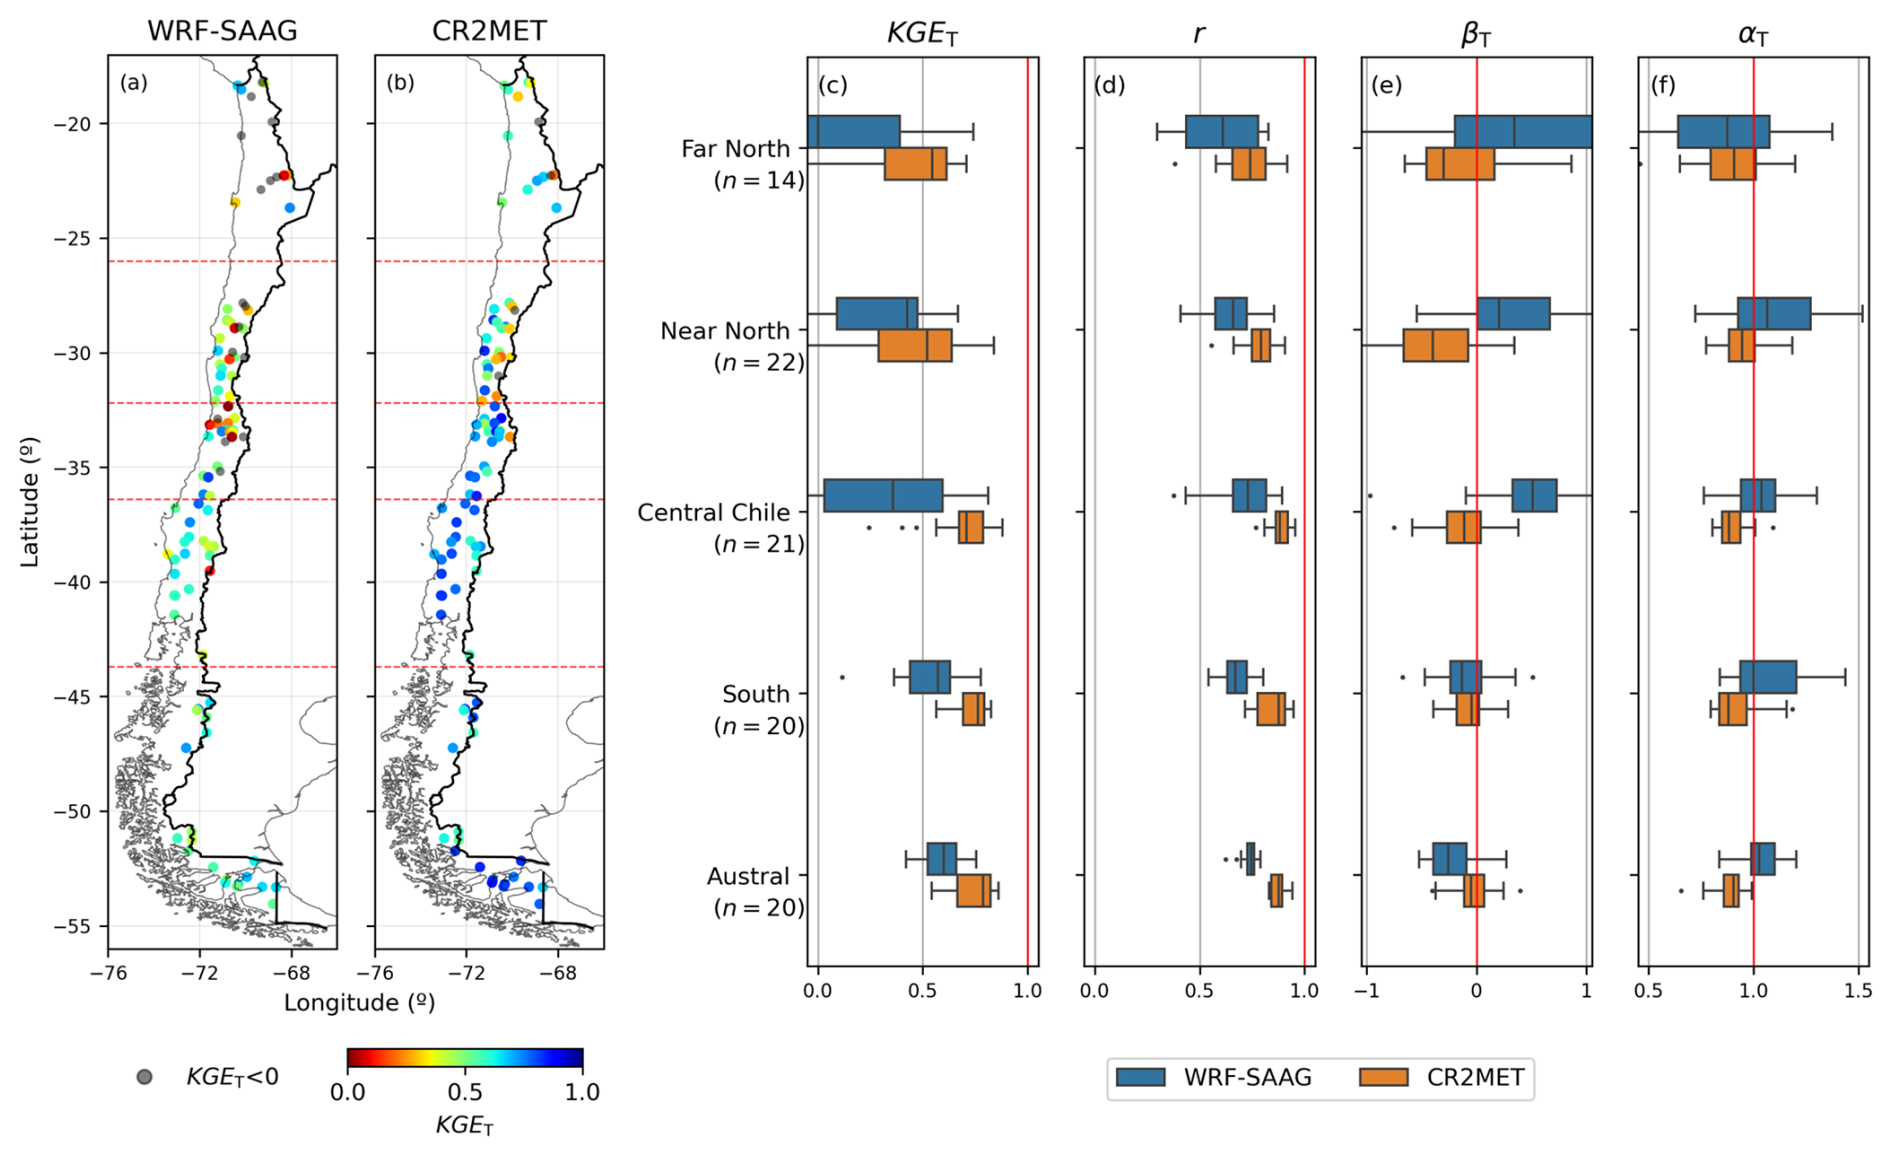
Figure 7Spatial distribution of Tang's Kling–Gupta Efficiencies (KGET) for daily minimum temperature retrieved from (a) WRF-SAAG and (b) CR2MET (period April/2001–March/2018) across continental Chile, using ground-based observations as the reference. Red dashed lines indicate the limits of the macrozones analyzed. (c–f) Boxplots with KGET, the Pearson correlation coefficients (r), bias term (βT), and variability ratios (αT) obtained with the products examined for each macrozone, with the red line indicating the optimal value. Each boxplot comprises results for all the stations within a specific macrozone. The boxes correspond to the interquartile range (IQR, i.e., 25th and 75th percentiles); the vertical line in each box is the median, and the whiskers extend to the ±1.5 ⋅ IQR of the ensemble of stations.
The results in Fig. 7e show that CR2MET tends to underestimate minimum temperatures (median βT < 0), with smaller biases from the Central macrozone southward, reaching median βT values between −0.04 and −0.11. Conversely, WRF-SAAG overestimates minimum temperature magnitudes between the Far North and Central Chile macrozones, with median βT values ranging from 0.2 to 0.51. WRF-SAAG underestimates temperatures in the southern regions, reaching its best result (median βT of −0.13) in the Southern macrozone. The results show that CR2MET underestimates the variability of minimum temperature (Fig. 7e), with median αT values ranging 0.88–0.94 across all macrozones. In contrast, WRF-SAAG achieves median αT values closer to the optimal range (1–1.04), particularly in the Central and Austral macrozones.
CR2MET provides higher KGET for maximum temperature (see Fig. S3), compared to minimum temperature, in all macrozones except the Near North. Similarly, WRF-SAAG yields higher KGET for maximum temperature in the Far North, Central Chile and Southern macrozones. Both CR2MET and WRF-SAAG yield general improvements in Pearson correlation for maximum daily temperature compared to minimum temperature, with median values ≥ 0.84 across the study area, and a reduced range of αT. CR2MET tends to overestimate maximum temperatures in the Far North, Central Chile, and Southern macrozones, with median βT values ranging 0.01–0.11. In the Near North, CR2MET yields a median βT = −0.61. Conversely, WRF-SAAG consistently underestimates maximum temperatures across the study domain (median βT ≤ −0.05), with the lowest median βT values in the Far North (−0.63) and Near North (−0.6) macrozones, respectively. Despite the results, it should be noted that there may be significant topographic differences between stations and gridded products, as well as differences in land cover at a given station relative to the WRF-SAAG simulations within the considered grid cell, which may partly explain the findings.
5.3 Hydrological model performance
Figure 8 illustrates hydrological modeling results for five (5) selected river basins (one for each macrozone). In general, we found that the parameter estimation process can compensate for differences in input forcings over domains with temperate climates (i.e., Central and Southern Chile). Figure 8b and c show that all input forcing combinations fail to simulate annual runoff cycles at the Loa River basin (Far North) and the Derecho Stream (Near North). In the Loa River basin, none of the configurations captures the flood events observed in February 2012. All the forcing combinations fail to reproduce the winter runoff increase (JJA) and low flow volumes in the Derecho Stream basin; further, a flashier response (i.e., steeper slope of the mid-segment FDC) is obtained with all forcing datasets.
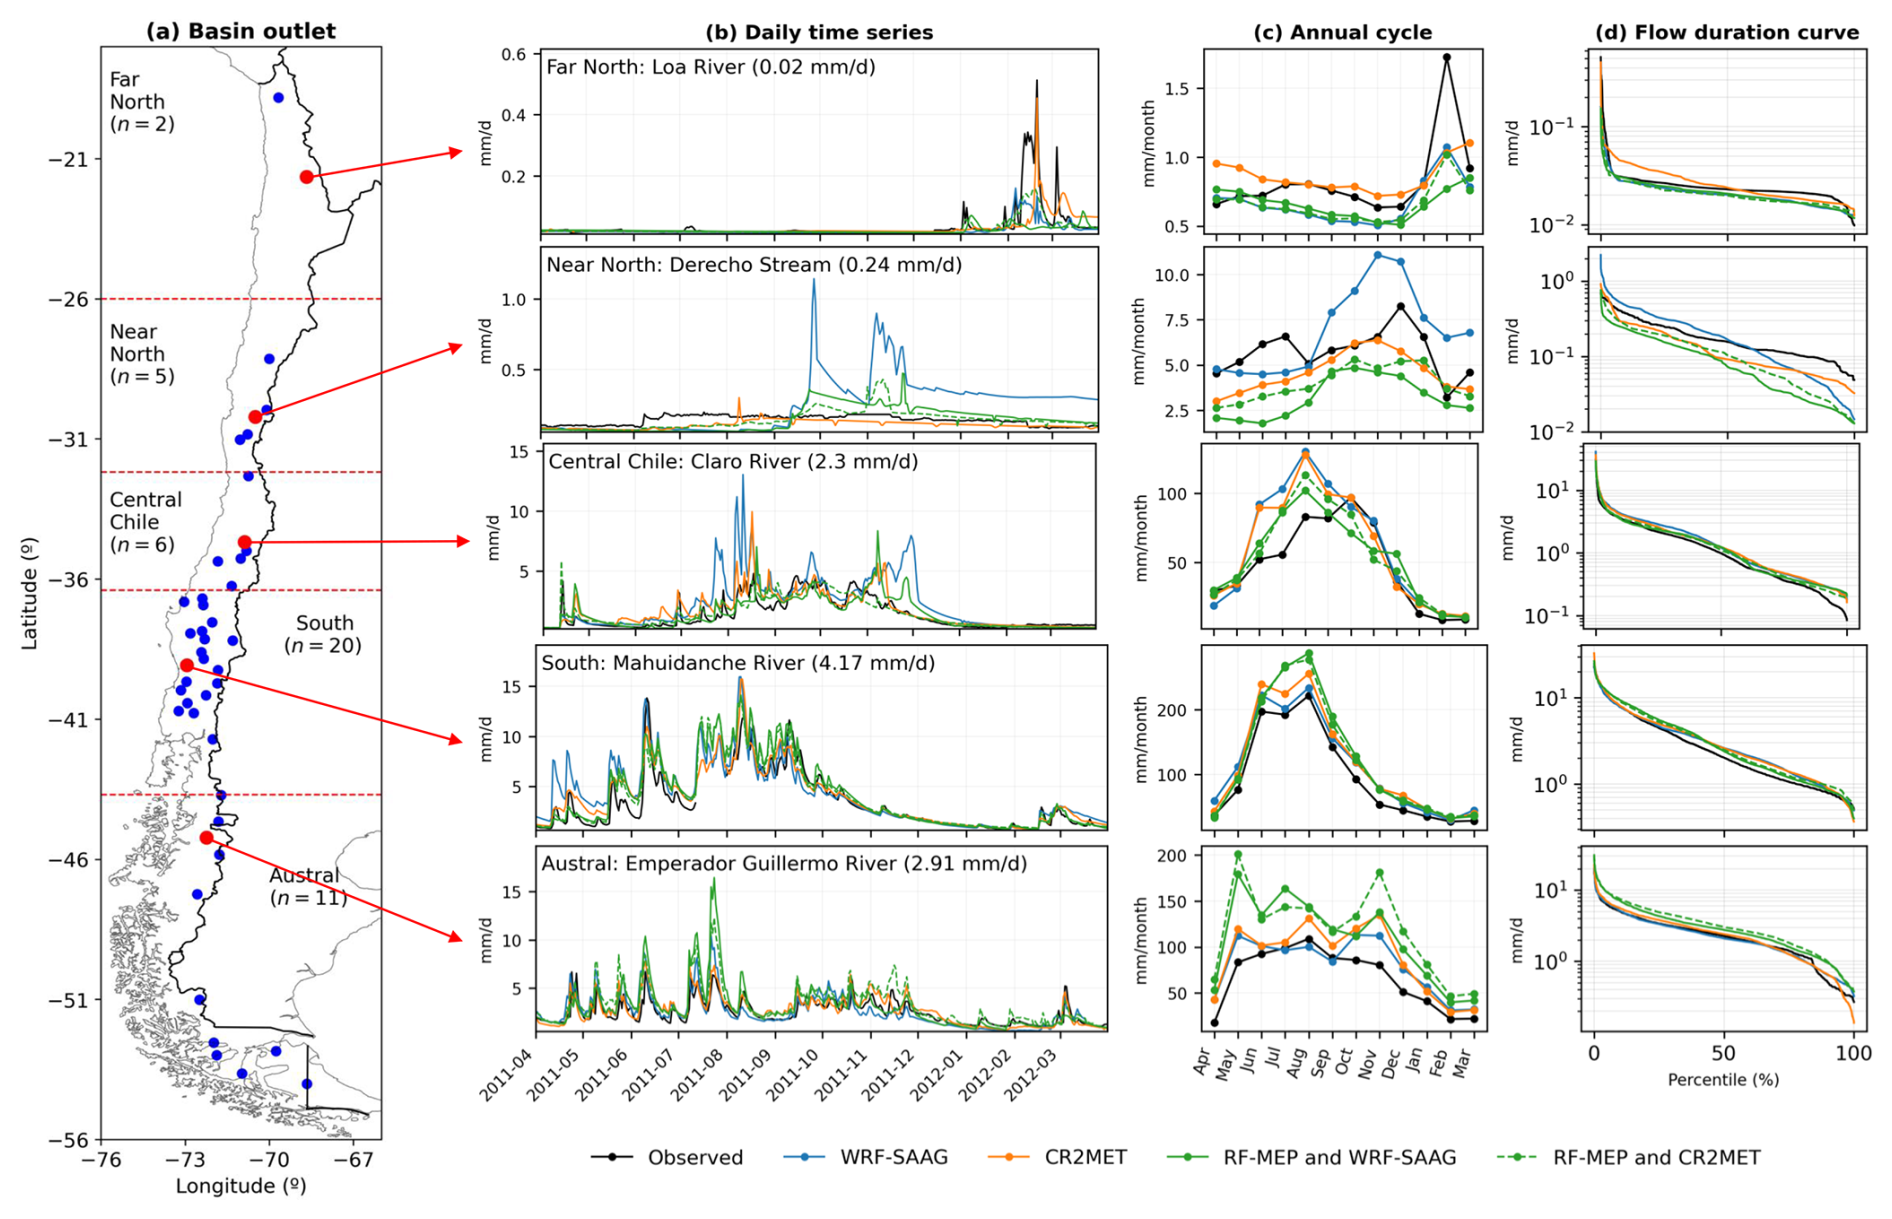
Figure 8(a) Location of the 44 stream gauges and five (5) selected catchment outlets (one per macrozone, red dots) used to illustrate how the choice of forcing input combination affects runoff simulations (b–d). (b) Time series with observed and simulated daily runoff for the period April/2011–March/2012, using different meteorological forcing inputs (the value in parentheses indicates the mean daily runoff for the study period, April/2001–March/2018); (c) annual cycles, and (d) daily flow duration curves for the evaluation period (April/2011–March/2018). The selected catchments are: (Far North) Loa River; (Near North) Derecho Stream; (Central Chile) Claro River; (South) Mahuidanche River; (Austral) Emperador Guillermo River.
In the Claro River (Fig. 8, Central Chile macrozone), all the forcing combinations episodically overestimate runoff volumes during the peak runoff season (July–September), with differences between simulated and observed mean monthly runoff ranging from 4.2 to 47.4 mm per month, and slight overestimations of low flows (lower percentiles in the FDC, Fig. 8c). In the Mahuidanche River basin (Southern macrozone), all the forcing combinations capture annual cycles and FDCs, but RF-MEP based datasets tend to overestimate daily runoff. In the Emperador Guillermo River basin (Austral macrozone), the RF-MEP configurations yield considerably larger runoff volumes, with differences between simulated and observed mean monthly runoff from May to December that may exceed 100 mm per month, and consistent model overestimations of the FDC.
Figure 9 compares hydrologic model calibration and evaluation metrics obtained with different forcing combinations. The results show consistently good calibration performance compared to the evaluation period across all macrozones and forcing combinations. Additionally, the results reveal comparable performance metrics for WRF-SAAG and CR2MET within Central Chile, the South and the Austral macrozones. The highest median OF values are obtained in South (0.87–0.89 in calibration, 0.67–0.73 in evaluation) and Central Chile (0.83–0.89 in calibration, 0.58–0.63 in evaluation). In these macrozones, median β and γ values also remain close to the optimum, ranging 0.98–1.02 and 0.95–0.99 (1.01–1.14 and 0.93–1.14), respectively, during the calibration (evaluation) period. Conversely, the poorest performance is obtained in the Far North and Near North, with median OF dropping to very low or even negative values during the evaluation period. In the Austral macrozone, we obtain good calibration performance (OF ≈ 0.71–0.78) and a marked decline during the evaluation period when RF-MEP based combinations are used (OF ≈ 0.49–0.52, β up to 1.36–1.45).
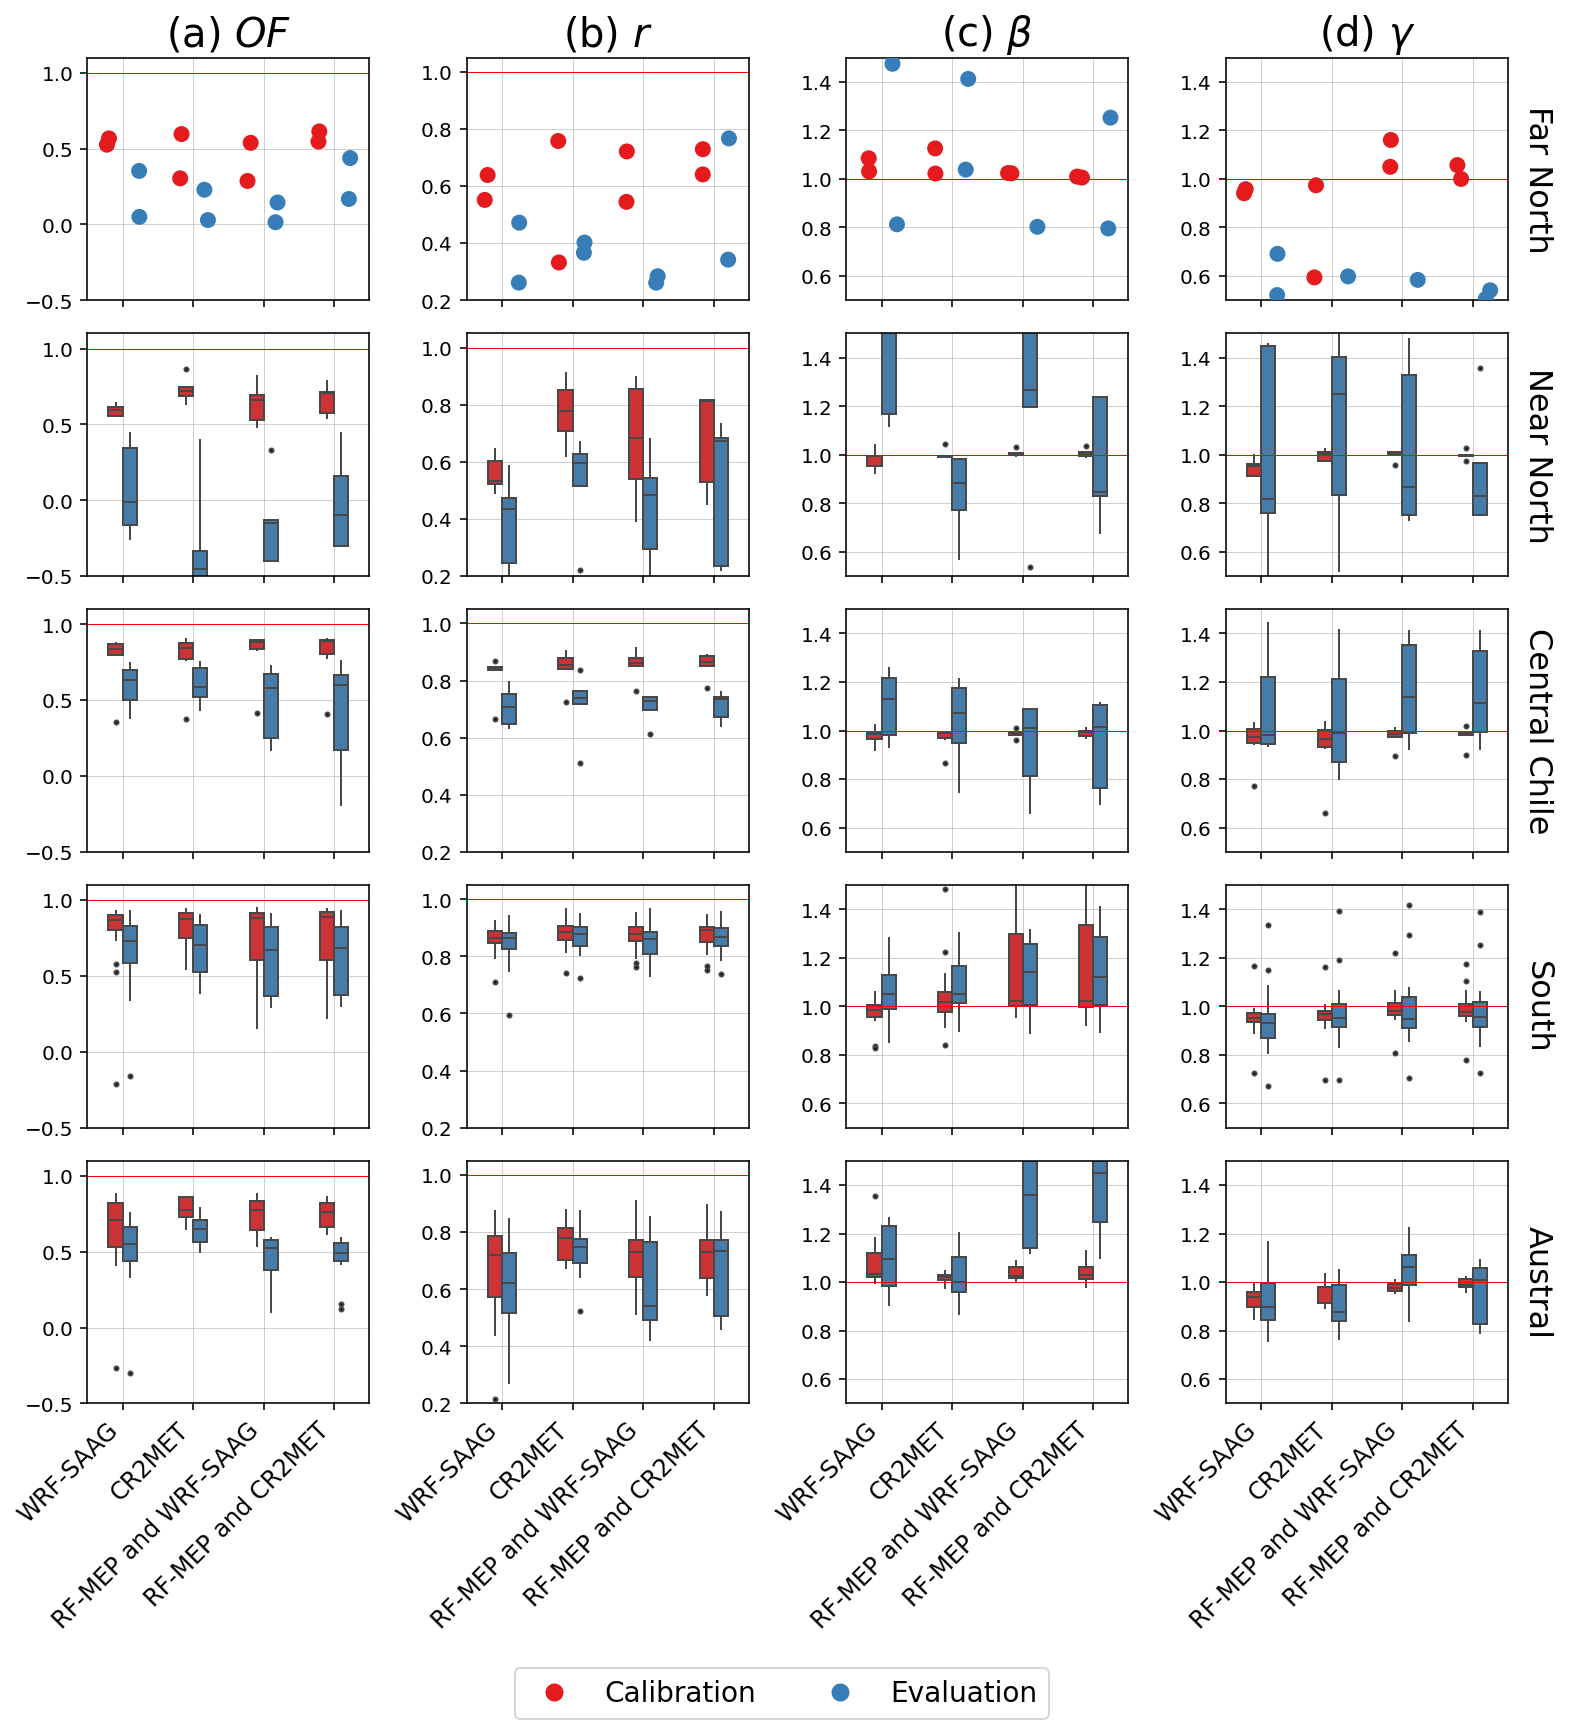
Figure 9Hydrologic model calibration (April/2005–March/2011) and evaluation (April/2011–March/2018) results for the 44 case study basins using different input forcing combinations: WRF-SAAG (precipitation and temperature); CR2MET (precipitation and temperature); RF-MEP (precipitation) and WRF-SAAG (temperature); RF-MEP (precipitation) and CR2MET (temperature). The columns indicate the following metrics: (a) objective function (OF) used for calibration, (b) Pearson correlation coefficient (r), (c) bias ratio (β), and (d) variability ratio (γ). Each boxplot shows results for all the stations within a specific macrozone (displayed in different rows). The boxes correspond to the interquartile range (IQR, i.e., 25th and 75th percentiles); the horizontal line in each box is the median, and the whiskers extend to the ±1.5 ⋅ IQR of the ensemble of stations. Points are used instead of boxplots for the Far North macrozone (first row) because only two basins were evaluated. The red line represents the optimal value.
We now turn our attention to the following question: how do the different forcing datasets compare in terms of hydrological processes that were not necessarily considered in the calibration step? Figure 10 compares the capability of the input forcing combinations to replicate observed hydrological signatures during the evaluation period, using the same parameter sets as in Fig. 9. One can note that all forcing combinations struggle to simulate baseflow (see results for BFI) across all macrozones and that the small sample of catchments in the Far North (n = 2), along with the varying relative performances for all indices, makes it difficult to generalize about the performance of forcing datasets. In catchments located in the Near North, WRF-SAAG yields comparatively larger biases for all signatures except slope_fdc (median bias ∼ 3.1 %), and CR2MET provides more stable (i.e., closer to zero) biases in , Qmean, QJJA and QDJF. In central Chile, all forcing combinations yield small biases (i.e., median absolute values < 2 d) in high_q_freq, low_q_dur and high_q_dur, and the best/worst dataset depends on the signature analyzed; for example, WRF-SAAG provides the largest median bias in QJJA (44.3 %), and the second smallest median bias in QDJF (−6 %). In southern Chile, WRF-SAAG provides the smallest median biases for most signatures, and inter-forcing differences are generally smaller compared to the other macrozones, though all yield large biases in Q5, BFI, stream_elas and low_q_freq. Finally, the results for the Austral macrozone show that WRF-SAAG and CR2MET provide the smallest median biases (< 15.4 %) for , Qmean, and Q95, whereas the configurations using RF-MEP precipitation yield the poorest performance for most indices.
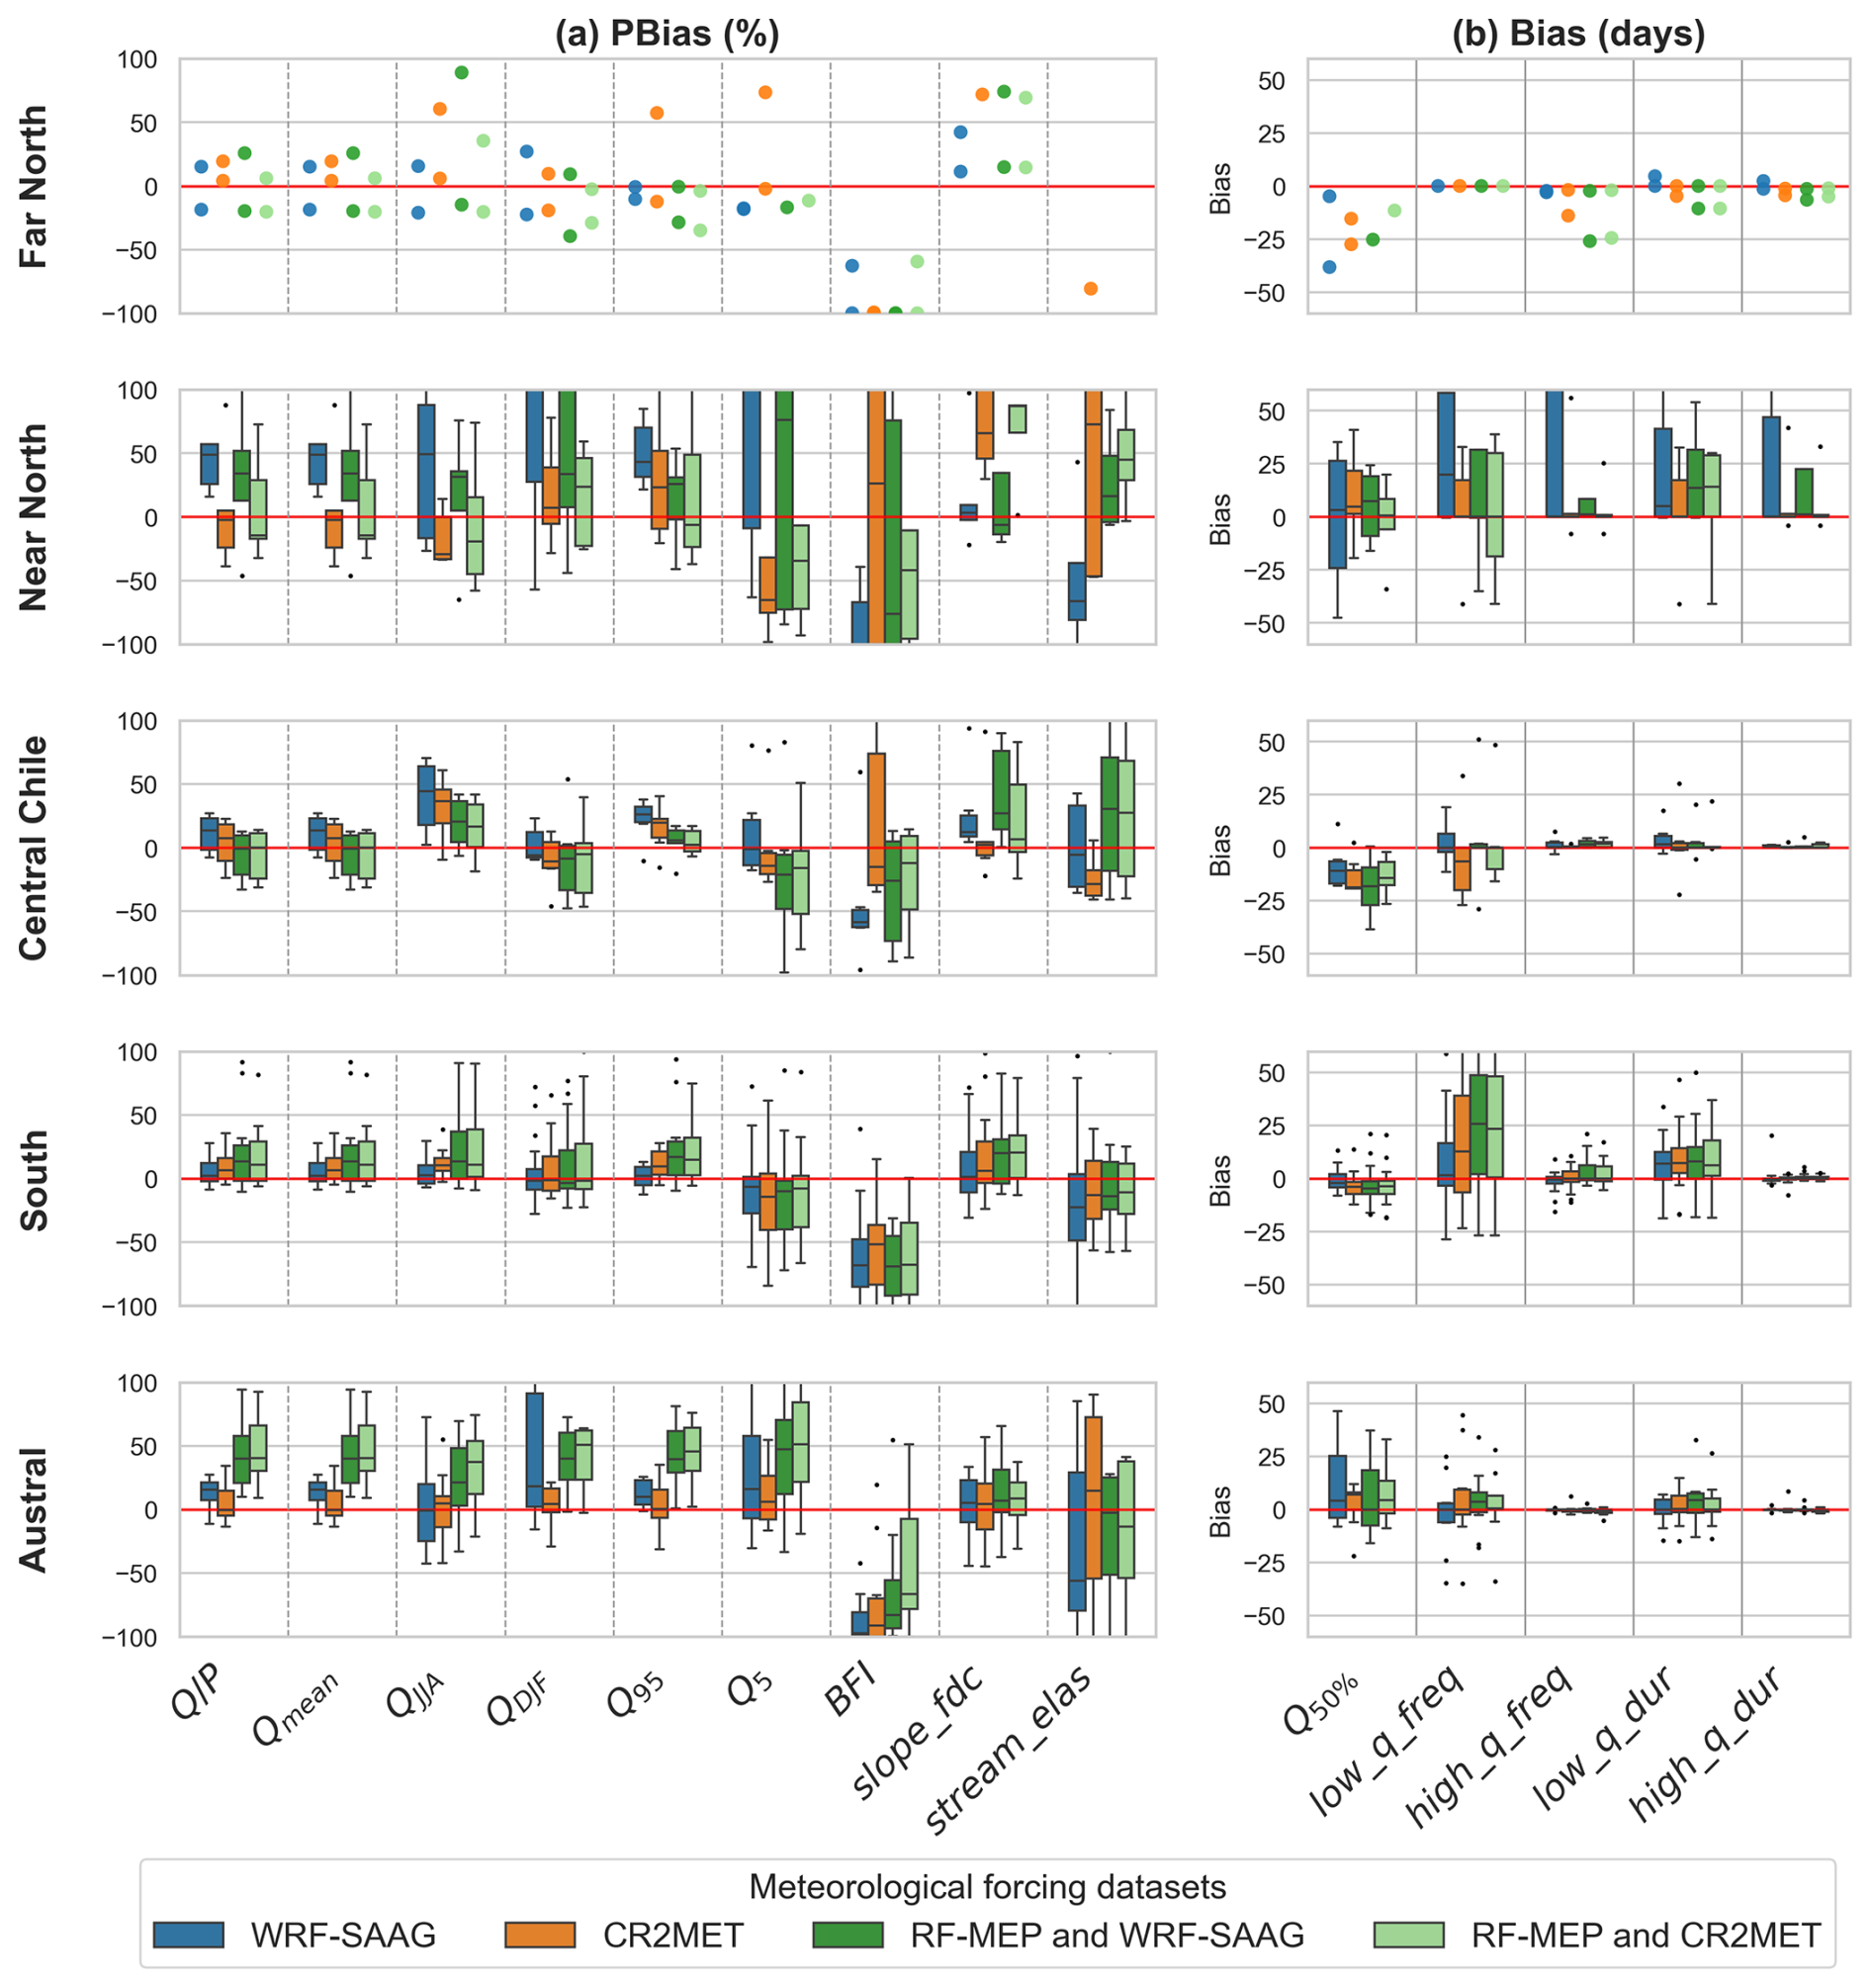
Figure 10Biases in hydrological signatures across 44 catchments in continental Chile during the evaluation (April/2011–March/2018), obtained from different input forcing combinations: WRF-SAAG (precipitation and temperature); CR2MET (precipitation and temperature); RF-MEP (precipitation) and WRF-SAAG (temperature); RF-MEP (precipitation) and CR2MET (temperature). The horizontal red line indicates the optimal performance. The abbreviations on the x axis correspond to the signatures described in Table 4. The boxes correspond to the interquartile range (IQR, i.e., 25th and 75th percentiles); the horizontal line in each box is the median, and the whiskers extend to the ±1.5 ⋅ IQR of the ensemble of stations. Points are used instead of boxplots for the Far North macrozone (first row) because only two basins were evaluated. Note that the y axis are truncated to facilitate the visual comparison among input forcing combinations.
Figure 11 shows KGE results for ET, using SRS products as observational references and the same parameter sets used to produce Fig. 9. The results for ET reveal that: (1) in general, the lowest KGE values in all macrozones are obtained with meteorological inputs from WRF-SAAG; (2) the combination of RF-MEP (precipitation) and CR2MET (temperature) stands out in the Far North (KGE ≥ 0.59 in calibration and evaluation periods) and Central Chile (medians of KGE ≥ 0.56); and (3) CR2MET and RF-MEP+CR2MET yield comparable results in the Southern and Austral macrozones. Additionally, the best results (median KGE > 0.67 with all datasets and evaluation periods) are obtained for ET simulated in the Southern macrozone, where the forcing dataset RF-MEP+WRF-SAAG also becomes competitive.
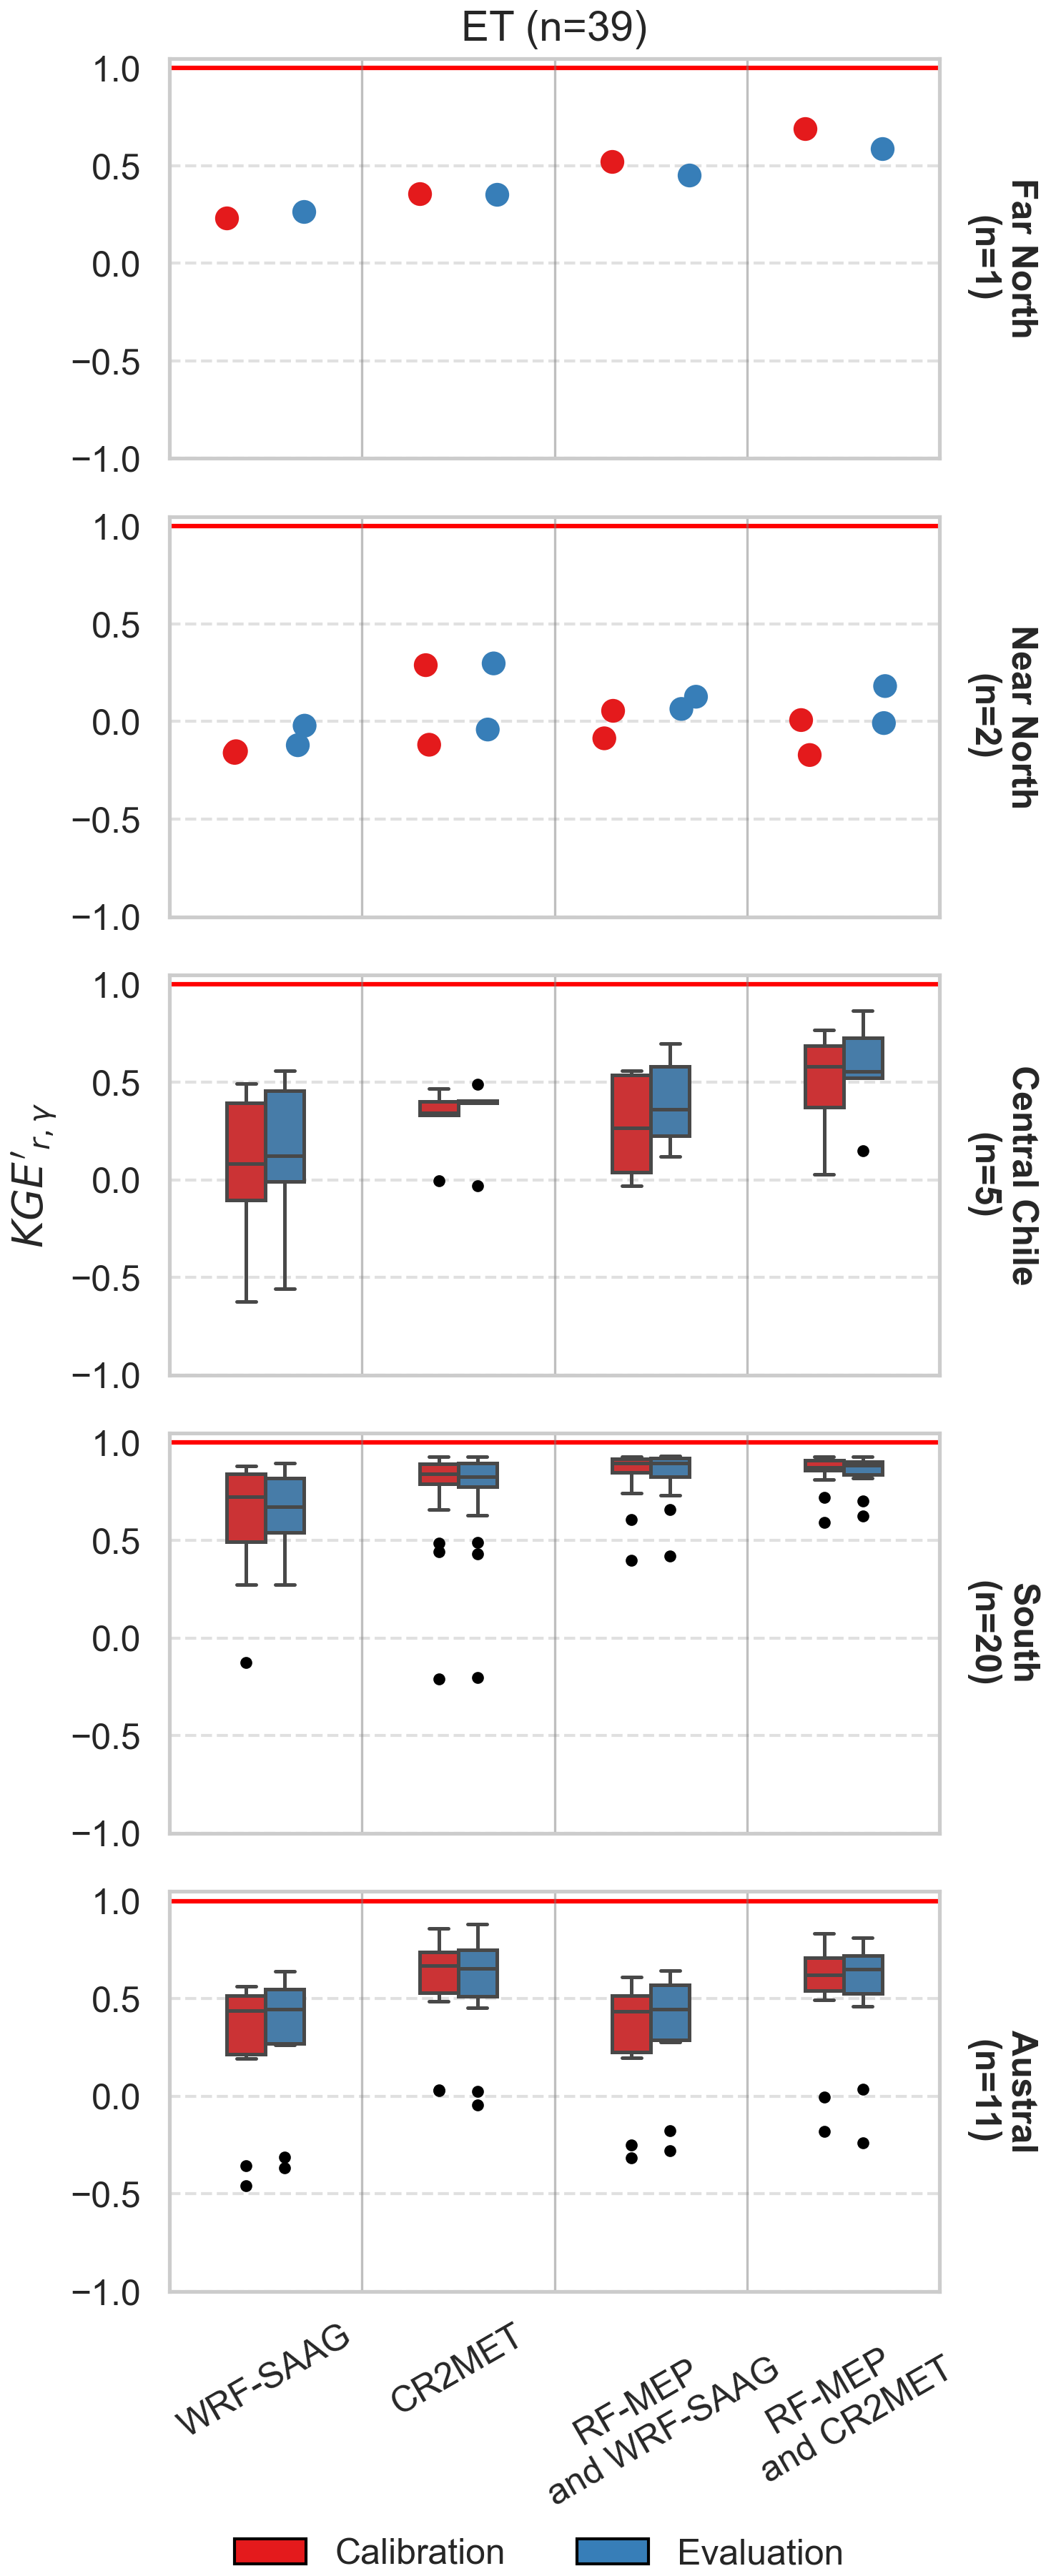
Figure 11Evaluation of ET simulated with the TUW model during the calibration (April/2005–March/2011) and evaluation (April/2011–March/2018) periods for 39 case-study basins, using different input forcing combinations: WRF-SAAG (precipitation and temperature); CR2MET (precipitation and temperature); RF-MEP (precipitation) with WRF-SAAG (temperature); and RF-MEP (precipitation) with CR2MET (temperature). The boxes represent the interquartile range (IQR; i.e., the 25th and 75th percentiles), the horizontal line within each box indicates the median, and the whiskers extend to ±1.5 ⋅ IQR across the ensemble of stations. Points are shown (instead of boxplots) for catchments located in the Far North (first row) and Near North (second row), as only one and two basins were evaluated in these macrozones, respectively.
For the case of soil moisture (Fig. 12), median Pearson correlation coefficients ranged 0.61–0.71 (0.66–0.73) during the calibration (evaluation) period across all forcing combinations. WRF-SAAG provided the highest correlations in both periods, with median r values of 0.71 and 0.73 during the calibration and evaluation periods, respectively.
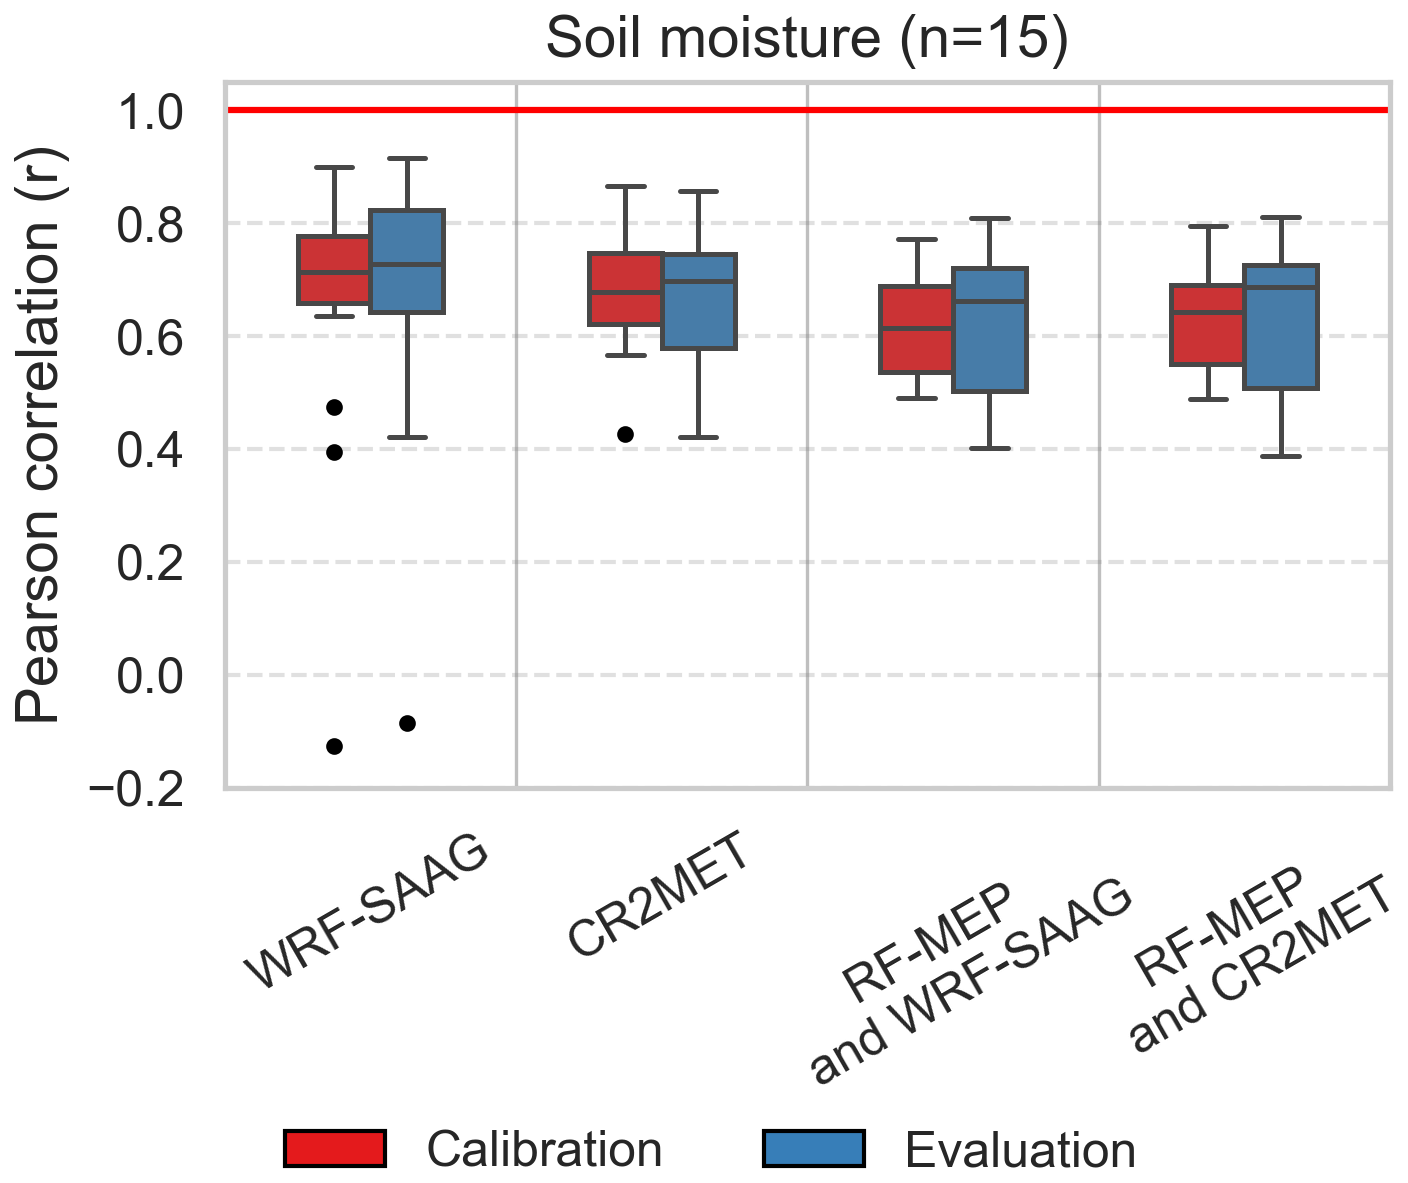
Figure 12Evaluation of soil moisture simulated with the TUW model during the calibration (April/2005–March/2011) and evaluation (April/2011–March/2018) periods for 15 case-study basins, using different input forcing combinations: WRF-SAAG (precipitation and temperature); CR2MET (precipitation and temperature); RF-MEP (precipitation) with WRF-SAAG (temperature); and RF-MEP (precipitation) with CR2MET (temperature). The analyzed basins include 14 located in the South macrozone and one in the Central Chile macrozone. The boxes represent the interquartile range (IQR; i.e., the 25th 75th percentiles), the horizontal line within each box indicates the median, and the whiskers extend to ±1.5 ⋅ IQR across the ensemble of stations.
Finally, the evaluation of SWE simulations (Fig. 13) revealed similar Pearson correlation medians across all forcing configurations, with median r ranging 0.79–0.87 (0.74–0.83) during the calibration (evaluation) period. The highest median KGE′ values during the calibration period were obtained with CR2MET (0.6) and WRF-SAAG (0.61). In contrast, KGE′ medians decreased considerably during the evaluation period (0.09–0.37).
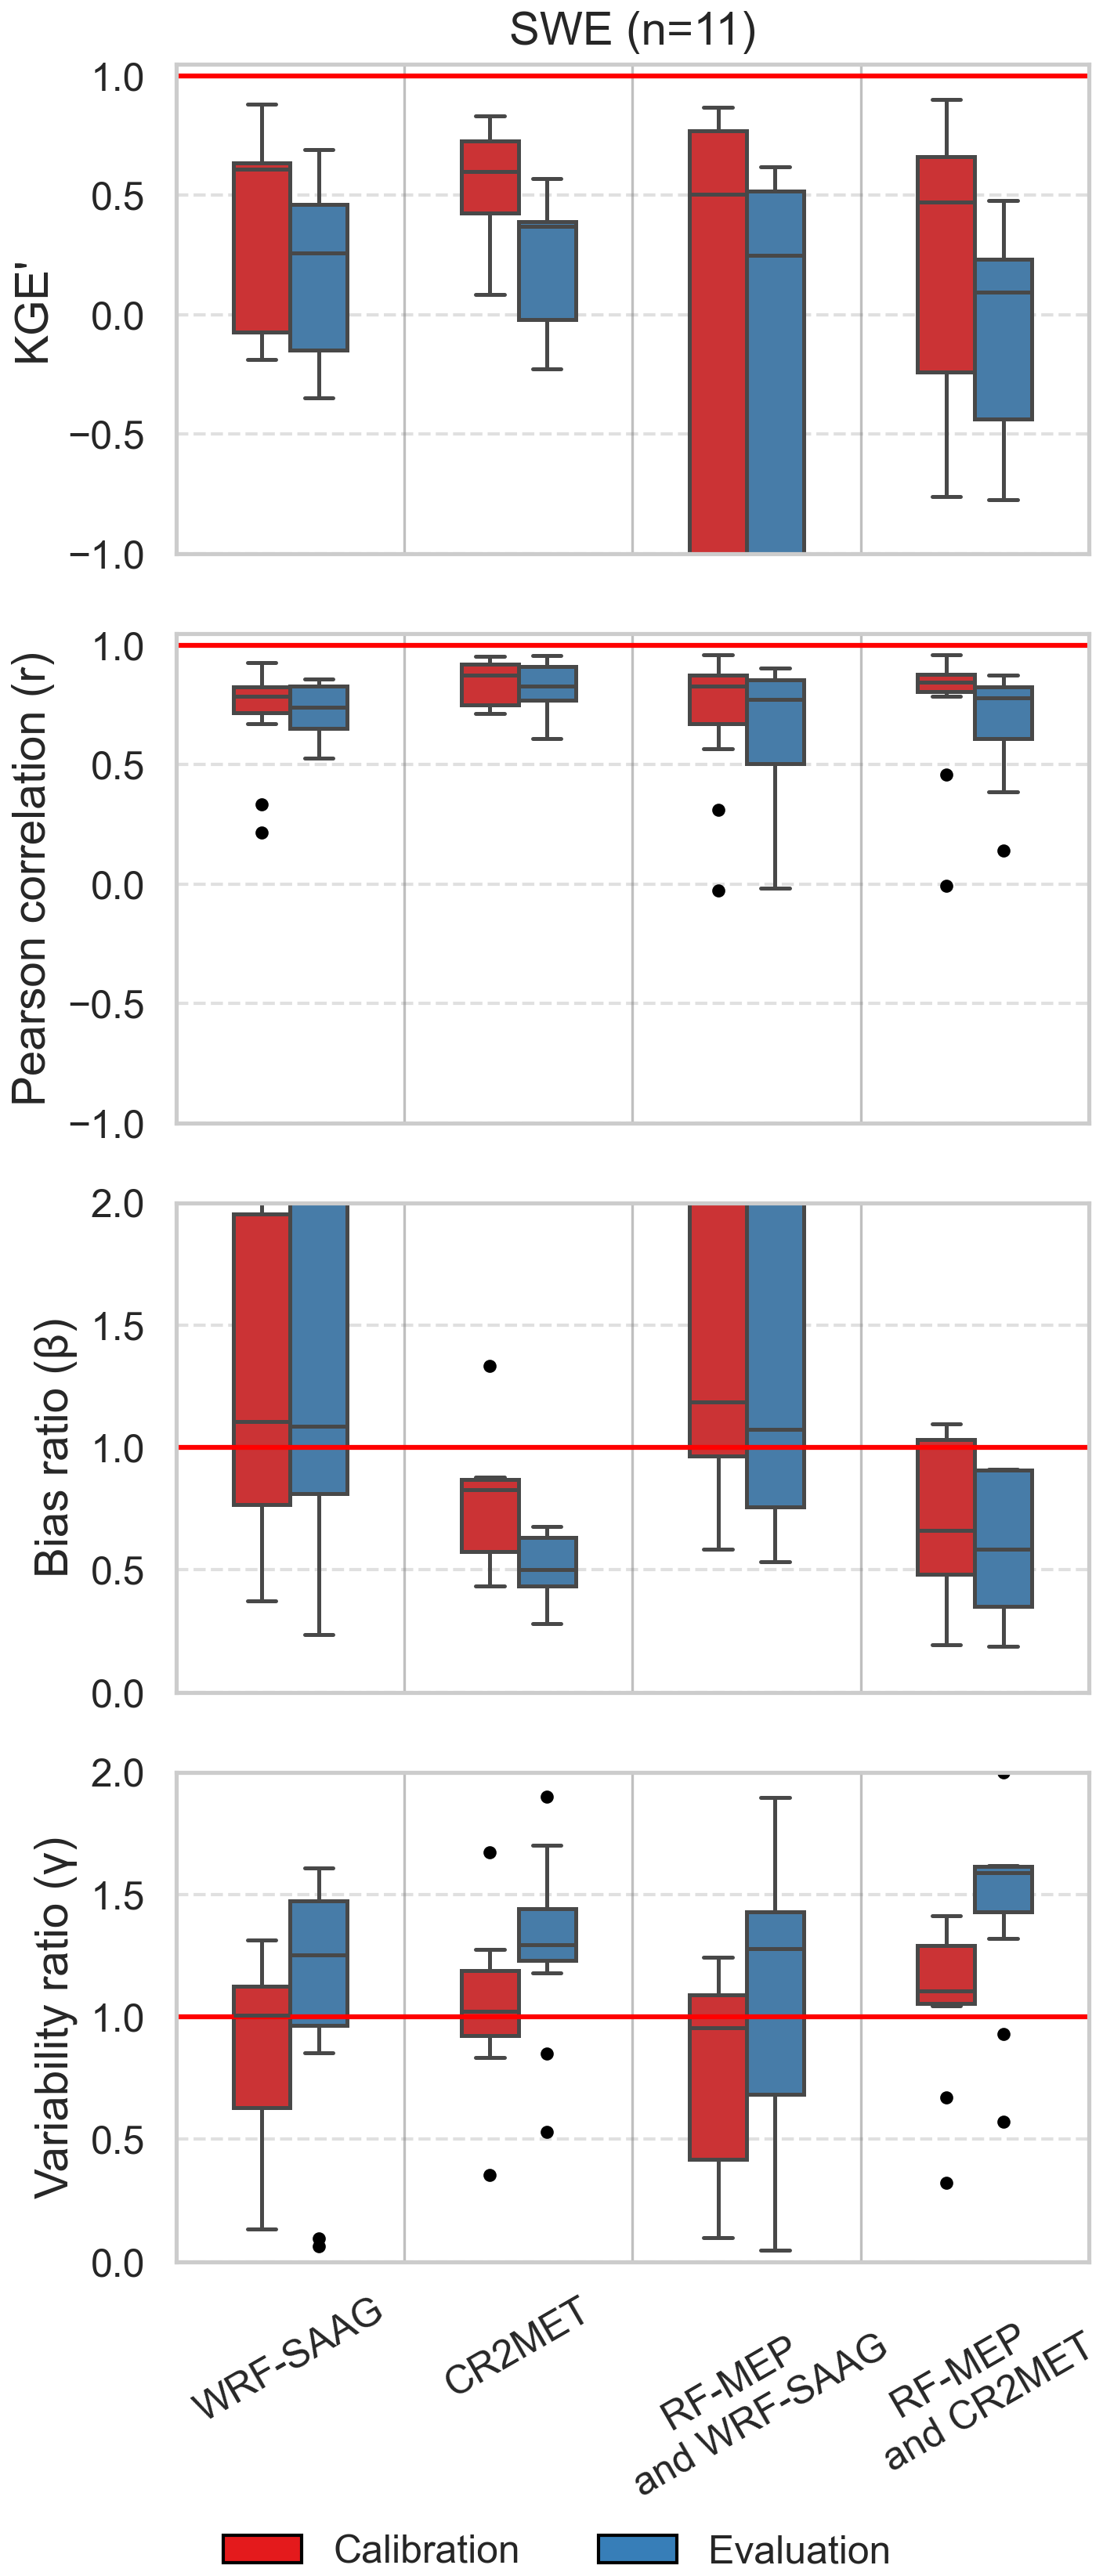
Figure 13Evaluation of snow water equivalent (SWE) simulated with the TUW model during the calibration (April/2005–March/2011) and the first four years of the evaluation period (April/2011–March/2015) for 11 case-study basins, using different input forcing combinations: WRF-SAAG (precipitation and temperature); CR2MET (precipitation and temperature); RF-MEP (precipitation) with WRF-SAAG (temperature); and RF-MEP (precipitation) with CR2MET (temperature). Each boxplot includes five basins located in the Near North macrozone, five basins in Central Chile, and one basin in the Southern macrozone. The boxes represent the interquartile range (IQR; i.e., the 25th and 75th percentiles), the horizontal line within each box indicates the median, and the whiskers extend to ±1.5 ⋅ IQR across the ensemble of stations. Please note that the evaluation period is shorter than the one used for ET and soil moisture since the reference SWE data set covers until March/2015.
6.1 Precipitation simulations
The climatological precipitation gradients obtained with WRF-SAAG are consistent with previous investigations on Chilean climatology and the influence of the Andes on precipitation distribution (Aceituno et al., 2021; Viale et al., 2019). The comparison of climatological annual precipitation amounts revealed that large differences persist between WRF-SAAG and the two station based products (i.e, CR2MET and RF-MEP) in Southern Chile, and with CR2MET (RF-MEP) in Austral (Central) Chile. Additionally, CR2MET and RF-MEP provide overall larger seasonal precipitation amounts in Central and Southern Chile compared to WRF-SAAG, whereas the opposite occurs in high-elevation grid cells along the Andes. WRF-SAAG simulations struggled to replicate observed daily precipitation events of different magnitudes compared to CR2MET and RF-MEP, which integrate ground observations in their development. This result is somewhat expected, since the evaluation dataset is fully independent of WRF-SAAG, as opposed to CR2MET and RF-MEP. Additionally, this result aligns well with Zambrano-Bigiarini et al. (2017), who showed that station-corrected datasets performed considerably better than purely satellite-based estimates in estimating daily precipitation events in Chile. The largest discrepancies among the datasets were observed in the Far North macrozone, where convective precipitation, characterized by intense and localized rainfall in the Altiplano region (Garreaud, 2000), poses a considerable challenge for replicating such events. However, it is important to note that WRF-SAAG is a free-running climate simulation that was not designed to reproduce specific convective events, but rather to capture large-scale statistical characteristics of hydroclimatic variables, as synoptic-scale activity (e.g., large circulations, atmospheric rivers), as it is forced with ERA5 reanalysis. As such, the evaluation conducted here, based on event-scale comparisons at point locations, represents a particularly stringent benchmark. Given these constraints, the ability of WRF-SAAG to approximate observed precipitation patterns across diverse climatic regions is noteworthy and highlights its potential value for long-term climate change studies in Chile. On the other hand, RF-MEP stood out for its ability to replicate historically observed precipitation events >5 mm between the Near North and Southern macrozones, with comparatively higher POD and CSI values than the other two datasets. This is consistent with the well-known ability of the RF technique to enhance the precision of daily precipitation detection by incorporating topographic information, particularly in regions with complex terrain (Mohammed et al., 2023).
Daily precipitation amounts are generally better simulated by the three datasets during winter in Central and Southern macrozones, mainly due to the stronger influence of synoptic-scale forcing and the associated more frequent and larger-scale precipitation events. However, large discrepancies arise in the northernmost and southernmost regions. Modeling daily precipitation in Northern Chile during summer is particularly challenging due to the difficulty of representing convective precipitation in arid and semi-arid zones (Cattani et al., 2016; Dinku et al., 2011). Previous studies have reported similar problems with reanalysis and satellite-based gridded products over this region, regardless of the station corrections (e.g., Schumacher et al., 2020b). The last may be attributed to a misplacement of the mesoscale convective systems simulated by WRF-SAAG due to a misrepresentation of surface processes, schemes, parameterizations, and/or the reanalysis forcing used.
The results presented here show that CR2MET outperforms WRF-SAAG at the station level, as expected, since CR2MET combines reanalysis and ground-based observations. In areas with lower station density, ERA5 gains greater relevance in the generation of the CR2MET and RF-MEP products, and the WRF-SAAG simulations yield significant differences, especially in the Andes regions of the Far and Near North (> 100 mm yr−1). Schumacher et al. (2020a) compared high-resolution WRF precipitation simulations against ERA-Interim (ERA-I; Dee et al., 2011) reanalysis estimates in the Andean sector of central Chile. They found that WRF outputs outperform ERA-I in representing precipitation, latitudinal gradients, seasonal variability, and extreme events in the central Andes due to its higher horizontal resolution, which enables capturing orographic effects, particularly at elevations above 1300 m a.s.l.
Although both CR2MET and RF-MEP are built upon ERA5 outputs, they have large differences in terms of annual precipitation amounts (Baez-Villanueva et al., 2021), which translate into differences in their ability to replicate daily precipitation events (Fig. 4) and the accuracy of daily precipitation amounts (Figs. 5 and 6). A detailed examination of discrepancies between CR2MET and RF-MEP is outside the scope of this study; nevertheless, we speculate that such differences can be attributed to (i) the target application for which those products were designed, (ii) the sample of meteorological stations used to develop the products, and (iii) the statistical models and methodological decisions (e.g., training period, predictors, optimization algorithms) adopted for calibration and verification.
6.2 Daily maximum and minimum temperature
The spatial variability of climatological WRF-SAAG temperature averages aligns well with the topographic and climatological patterns reported in previous studies for continental Chile (Aceituno et al., 2021; DGA, 2017). Our analyses also revealed that WRF-SAAG yields considerably warmer climatological averages (compared to CR2MET) of minimum temperatures from the Far North to Central Chile, excepting high-elevation Andean grid cells, and generally lower maximum temperatures compared to CR2MET, especially along the Andes and Patagonia.
The evaluation of daily extreme temperature estimates revealed that meteorological products generally exhibit better performance for maximum temperature than for minimum, in agreement with previous studies (e.g., Schubert and Henderson-Sellers, 1997; Kostopoulou et al., 2007). This is primarily because minimum temperature typically occurs at dawn, when the atmosphere is most vertically stratified. When synoptic-scale atmospheric mixing is weak, the minimum temperature tends to be spatially heterogeneous, highly influenced by surface processes. Moreover, a point measurement may not be locally representative in regions with complex topography (Thorne et al., 2016).
6.3 Potential for hydrological modeling
The hydrological modeling results showed that, in general, WRF-SAAG produced similar OF values compared to CR2MET, which was originally conceived for water balance calculations under historical and future climate scenarios (e.g., DGA, 2017, 2018, 2019) and has since been used in several studies involving hydrological modeling (e.g., Vásquez et al., 2021; Murillo et al., 2022; Sepúlveda et al., 2022; Araya et al., 2023; Cortés-Salazar et al., 2023; Muñoz-Castro et al., 2023; Lema et al., 2025; Givovich et al., 2025). Further, RF-MEP precipitation time series provided generally worse OF results. The Far and Near North macrozones remain a challenge for hydrological modeling due to low observed precipitation amounts and low runoff, in agreement with previous studies covering arid domains (e.g., Newman et al., 2015b, 2017; Muñoz-Castro et al., 2026) and, in particular, with the results reported by Vásquez et al. (2021) for continental Chile. This is also reflected by the large biases obtained for hydrological signatures, especially the baseflow index. Our assessment of simulations based on streamflow signatures reinforces the higher adaptability of conceptual hydrological models in rainfall-driven systems and the overall better performance achieved with WRF-SAAG across Southern Chile in terms of streamflow metrics. Additionally, the large positive biases in runoff signatures obtained with RF-MEP in Patagonia align with the wet precipitation biases associated with that product (especially during winter).
Although the lowest values for ET and soil moisture were obtained for model simulations forced with WRF-SAAG, we stress that none of these variables were considered in the calibration process and, therefore, such performance can be largely improved. Indeed, recent studies have shown that the simulations of variables other than streamflow could be enhanced, with generally equal or slight decreases in Q performance, if they are incorporated into multi-objective calibration frameworks (e.g., Demirel et al., 2018; Dembélé et al., 2020; Pool et al., 2024).
It is worth noting that the TUW model may fail to replicate observed annual runoff cycles during the evaluation period (as shown in Fig. 8) due to (i) poor parameter transferability associated with differences in hydroclimatic conditions between the calibration (which includes wet, dry and normal years) and the evaluation (which includes the central Chile megadrought) periods, which is a well-documented problem in hydrological modeling (e.g., Merz et al., 2011; Fowler et al., 2018); (ii) differences in mean monthly precipitation among climate datasets (e.g., up to 100 mm/month during winter between RF-MEP and the other datasets at Emperador Guillermo) that the hydrological model is unable to compensate for through parameter calibration (e.g., Mendoza et al., 2016); and (iii) structural deficiencies of the TUW model. Indeed, the use of a simple bucket-style rainfall–runoff model, while advantageous for broad-scale applications involving large samples of catchments, may overlook key hydrological processes (Minville et al., 2014). The simplifications involved may particularly affect regions like the Far North, where subsurface and groundwater flows dominate (Magaritz et al., 1990), and the Near North and Central regions, where snow accumulation, sublimation, and melt play a critical role (Stehr and Aguayo, 2017; Jara et al., 2021). Therefore, the reduced model performance obtained in some catchments cannot be solely attributed to meteorological inputs, and additional work is required to examine other sources of uncertainty.
6.4 Limitations and future work
Although this study provides a comprehensive evaluation of WRF-SAAG precipitation and temperature fields over continental Chile, several limitations and opportunities for future work remain. First, the scope of the evaluation could be expanded to runoff, evapotranspiration, soil moisture, snow water equivalent (SWE), or other hydrological variables derived from the Noah-MP land surface model simulations included in the WRF-SAAG experiments. Secondly, since WRF-SAAG simulations showed limitations in replicating daily precipitation amounts, statistical post-processing techniques could be applied to improve precipitation estimates (e.g., Mendoza et al., 2015; Meech et al., 2020). Thirdly, the calibration and evaluation of offline hydrological simulations could benefit from incorporating a broader range of water years, especially given the influence of the persistent mega-drought in Chile from 2010 to 2018 (Garreaud et al., 2020). This is particularly important considering that the transfer of hydrological model parameters between calibration and evaluation periods with contrasting climatic conditions can lead to performance losses (Coron et al., 2012). Fourthly, WRF-SAAG simulates all atmospheric and land surface variables with physical consistency, making it a powerful resource for conducting offline numerical experiments with complex process-based hydrological models, which require not only precipitation and temperature but also wind speed, humidity, air pressure, and radiative fluxes. The performance of such models could be thoroughly evaluated in terms of process fidelity, especially in arid areas given the TUW model limitations regarding sublimation processes and baseflow generation mechanisms.
Future comparative assessments between WRF-SAAG and other gridded products could incorporate the effects of parameter equifinality on hydrological model simulations (e.g., Muñoz-Castro et al., 2023), examine model structural uncertainty (e.g., Saavedra et al., 2022), compare parameter regionalization results for streamflow prediction in ungauged basins (e.g., Baez-Villanueva et al., 2021), and conduct drought propagation analyses (e.g., Lema et al., 2025). Finally, the WRF-SAAG dataset could serve as a baseline for future climate change impact assessments aligned with the efforts of the SAAG community. Recently, Liu et al. (2026) conducted a climate perturbation experiment with the WRF model using the Pseudo Global Warming (PGW) approach (Schär et al., 1996; Kawase et al., 2009; Hara et al., 2008), which applies climate perturbations derived from global climate model projections to adjust the reanalysis-based initial and boundary forcings used in the baseline historical regional climate simulations. Since the method assumes that the storm tracks and frequency entering the domain remain the same in both control and future simulations, these could be used to examine changes in hydrologic processes because of a shift in thermodynamic conditions.
We evaluated the performance of two widely used gridded meteorological datasets in Chile; CR2MET and RF-MEP, alongside the recently released high-resolution convection-permitting regional simulations from the Weather Research and Forecasting for South America (WRF-SAAG). First, we examined spatial differences among climatological estimates from the three products over the period April/2001–March/2018. Secondly, we assessed daily precipitation and extreme temperature estimates from the three datasets against ground-based observations, with particular attention to their ability to replicate historically observed precipitation events. We also quantified their accuracy using a modified version of the Kling–Gupta Efficiency. Finally, we assessed the suitability of these products for hydrological modeling by calibrating the parameters of a conceptual, bucket-style rainfall runoff model in a suite of 44 hydroclimatically diverse catchments, and evaluated model simulations using hydrological signatures, SRS products and a SWE reanalysis dataset.
The main outcome of this work is that, despite substantial spatial differences in climatological averages and despite not being designed to replicate individual precipitation events in space and time, the performance of WRF-SAAG approaches that of CR2MET (the most used observation-based product in our domain) at the daily time scale in Central and Southern Chile where the spatial density of stations is higher, especially during winter.
The hydrological modeling results showed similar streamflow performance metrics and SWE model simulations for the three products, with differences in simulated hydrological signatures, ET and soil moisture that varied with macrozone. For streamflow simulations, the results suggest that in the Southern macrozone all forcing combinations provide reasonable performance. In contrast, in the Austral macrozone, configurations using RF-MEP precipitation as input tend to show lower performance compared to those forced with WRF-SAAG or CR2MET.
WRF-SAAG provides a vast number of physically-consistent atmospheric and surface variables, making it a promising resource for hydrological studies in regions with complex topography and sparse ground-based observations. Future research may benefit from exploring post-processing techniques to further enhance the representation of precipitation and temperature in km-scale convection-permitting models. Additionally, the results obtained here demonstrate the superiority of observation-based products, especially CR2MET, if the end goal is to examine precipitation extremes and temperature at point locations. Finally, the relatively poorer performance of the three datasets in arid domains and data scarce regions highlights areas for further research to improve gridded meteorological products.
The CR2METv2.5 dataset is available at https://www.cr2.cl/datos-productos-grillados/ (last access: 23 October 2023; Boisier et al., 2018, https://doi.org/10.5281/zenodo.7529682). The RF-MEP dataset used in this study was developed by Baez-Villanueva et al. (2021) and is described in detail in their publication. It was generated using the RFmerge R package by combining daily records from 334 rain gauges (http://www.cr2.cl/datos-de-precipitacion/, last access: 10 January 2021), ERA5 reanalysis data, and SRTMv4.1 elevation data. The dataset covers continental Chile at a horizontal resolution of 0.05° for the period 1990–2018. The WRF-SAAG climate simulations used in this study are available at https://gdex.ucar.edu/datasets/d616000/ (last access: 15 January 2025).
The supplement related to this article is available online at https://doi.org/10.5194/hess-30-6481-2026-supplement.
SS, PM, and MLZ conceptualized the study, designed the overall approach, and wrote the manuscript. SS conducted all the evaluations of meteorological datasets, the calibration and evaluation of the hydrological model, performed the data analyses, and produced all the figures. LS provided assistance for processing the WRF-SAAG climate simulations. AP provided support in setting up the scripts used in this study. All authors contributed to refining the methodology and analysis framework, interpreting the results, and reviewing and editing the manuscript.
The contact author has declared that none of the authors has any competing interests.
Publisher's note: Copernicus Publications remains neutral with regard to jurisdictional claims made in the text, published maps, institutional affiliations, or any other geographical representation in this paper. The authors bear the ultimate responsibility for providing appropriate place names. Views expressed in the text are those of the authors and do not necessarily reflect the views of the publisher.
Miguel Lagos-Zúñiga acknowledges the Center for Interdisciplinary Research on Disaster Risk, Resilience and Recovery (CIGIDEN R+), ANID/CIN250023, and ANID/Fondecyt/Iniciación 1126132. All authors acknowledge support from the supercomputing infrastructure of the NLHPC (CCSS210001), Powered@NLHPC.
Pablo Mendoza received financial support from ANID PIA (grant no. CIA250010) (AMTC) and Fondecyt Project (grant no. 1262450).
This paper was edited by Yi He and reviewed by three anonymous referees.
Aceituno, P., Boisier, J. P., Garreaud, R., Rondanelli, R., and Rutllant, J. A.: Climate and weather in Chile, in: Water resources of Chile, edited by: Fernández, B. and Gironás, J., Springer, 7–29, https://doi.org/10.1007/978-3-030-56901-3_2, 2021. a, b, c, d
Al-Saeedi, B. A., M. Baez-Villanueva, O., and Ribbe, L.: An optimized representation of precipitation in Jordan: Merging gridded precipitation products and ground-based measurements using machine learning and geostatistical approaches, EGU General Assembly 2024, Vienna, Austria, 14–19 Apr 2024, EGU24-11510, https://doi.org/10.5194/egusphere-egu24-11510, 2024. a
Alvarez-Garreton, C., Mendoza, P. A., Boisier, J. P., Addor, N., Galleguillos, M., Zambrano-Bigiarini, M., Lara, A., Puelma, C., Cortes, G., Garreaud, R., McPhee, J., and Ayala, A.: The CAMELS-CL dataset: catchment attributes and meteorology for large sample studies – Chile dataset, Hydrol. Earth Syst. Sci., 22, 5817–5846, https://doi.org/10.5194/hess-22-5817-2018, 2018. a, b
Alvarez-Garreton, C., Boisier, J. P., Garreaud, R., Seibert, J., and Vis, M.: Progressive water deficits during multiyear droughts in basins with long hydrological memory in Chile, Hydrol. Earth Syst. Sci., 25, 429–446, https://doi.org/10.5194/hess-25-429-2021, 2021. a
AppEEARS Team: Application for Extracting and Exploring Analysis Ready Samples (AppEEARS), https://appeears.earthdatacloud.nasa.gov (last access: 28 February 2026), 2026. a
Araya, D., Mendoza, P. A., Muñoz-Castro, E., and McPhee, J.: Towards robust seasonal streamflow forecasts in mountainous catchments: impact of calibration metric selection in hydrological modeling, Hydrol. Earth Syst. Sci., 27, 4385–4408, https://doi.org/10.5194/hess-27-4385-2023, 2023. a, b, c
Baez-Villanueva, O. M., Zambrano-Bigiarini, M., Beck, H. E., McNamara, I., Ribbe, L., Nauditt, A., Birkel, C., Verbist, K., Giraldo-Osorio, J. D., and Thinh, N. X.: RF-MEP: A novel Random Forest method for merging gridded precipitation products and ground-based measurements, Remote Sens. Environ., 239, 111606, https://doi.org/10.1016/j.rse.2019.111606, 2020. a, b, c
Baez-Villanueva, O. M., Zambrano-Bigiarini, M., Mendoza, P. A., McNamara, I., Beck, H. E., Thurner, J., Nauditt, A., Ribbe, L., and Thinh, N. X.: On the selection of precipitation products for the regionalisation of hydrological model parameters, Hydrol. Earth Syst. Sci., 25, 5805–5837, https://doi.org/10.5194/hess-25-5805-2021, 2021. a, b, c, d, e, f, g
Barrios, A., Trincado, G., and Garreaud, R.: Alternative approaches for estimating missing climate data: application to monthly precipitation records in South-Central Chile, Forest Ecosystems, 5, 1–10, 2018. a
Bartsotas, N., Anagnostou, E., Nikolopoulos, E., and Kallos, G.: Investigating satellite precipitation uncertainty over complex terrain, J. Geophys. Res.-Atmos., 123, 5346–5359, 2018. a
Beck, H. E., van Dijk, A. I. J. M., Levizzani, V., Schellekens, J., Miralles, D. G., Martens, B., and de Roo, A.: MSWEP: 3-hourly 0.25° global gridded precipitation (1979–2015) by merging gauge, satellite, and reanalysis data, Hydrol. Earth Syst. Sci., 21, 589–615, https://doi.org/10.5194/hess-21-589-2017, 2017. a
Bergström, S.: Development and application of a conceptual runoff model for Scandinavian catchments, Report RHO 7, SMHI, Norrköping, Sweden, http://www.diva-portal.org/smash/record.jsf?pid=diva2:1456191&dswid=-4221 (last access: 8 March 2023), 1976. a
Boisier, J. P., Alvarez-Garretón, C., Cepeda, J., Osses, A., Vásquez, N., and Rondanelli, R.: CR2MET:Ahigh-resolution precipitation and temperature dataset for hydroclimatic research in Chile, EGU General Assembly, Vienna, Austria, 4–13 April 2018, EGU2018-19739, 2018. a, b, c, d
Bozkurt, D., Rojas, M., Boisier, J. P., Rondanelli, R., Garreaud, R., and Gallardo, L.: Dynamical downscaling over the complex terrain of southwest South America: present climate conditions and added value analysis, Clim. Dynam., 53, 6745–6767, 2019. a
Buishand, T.: Tests for detecting a shift in the mean of hydrological time series, J. Hydrol., 73, 51–69, 1984. a
Cattani, E., Merino, A., and Levizzani, V.: Evaluation of monthly satellite-derived precipitation products over East Africa, J. Hydrometeorol., 17, 2555–2573, 2016. a
Chen, C., He, M., Chen, Q., Zhang, J., Li, Z., Wang, Z., and Duan, Z.: Triple collocation-based error estimation and data fusion of global gridded precipitation products over the Yangtze River basin, J. Hydrol., 605, 127307, https://doi.org/10.1016/j.jhydrol.2021.127307, 2022. a, b
Chen, C., He, Q., and Li, Y.: Downscaling and merging multiple satellite precipitation products and gauge observations using random forest with the incorporation of spatial autocorrelation, J. Hydrol., 632, 130919, https://doi.org/10.1016/j.jhydrol.2024.130919, 2024. a
Clark, M. P. and Slater, A. G.: Probabilistic quantitative precipitation estimation in complex terrain, J. Hydrometeorol., 7, 3–22, 2006. a
Condom, T., Martínez, R., Pabón, J. D., Costa, F., Pineda, L., Nieto, J. J., López, F., and Villacis, M.: Climatological and hydrological observations for the South American Andes: in situ stations, satellite, and reanalysis data sets, Frontiers in Earth Science, 8, 92, https://doi.org/10.3389/feart.2020.00092, 2020. a
Copernicus Climate Change Service: Soil moisture gridded data from 1978 to present, Copernicus Climate Change Service (C3S) Climate Data Store (CDS) [data set], https://doi.org/10.24381/cds.d7782f18, 2018. a, b
Coron, L., Andréassian, V., Perrin, C., Lerat, J., Vaze, J., Bourqui, M., and Hendrickx, F.: Crash testing hydrological models in contrasted climate conditions: An experiment on 216 Australian catchments, Water Resour. Res., 48, W05552, https://doi.org/10.1029/2011WR011721, 2012. a
Coron, L., Delaigue, O., Thirel, G., Dorchies, D., Perrin, C., Michel, C., Andréassian, V., Bourgin, F., Brigode, P., Moine, N. L., Mathevet, T., Mouelhi, S., Oudin, L., and Pushpalatha, R.: Suite of GR Hydrological Models for Precipitation-Runoff Modelling, https://doi.org/10.32614/CRAN.package.airGR, 2023. a
Cortés, G. and Margulis, S.: Impacts of El Niño and La Niña on interannual snow accumulation in the Andes: Results from a high-resolution 31 year reanalysis, Geophys. Res. Lett., 44, 6859–6867, 2017. a
Cortés-Salazar, N., Vásquez, N., Mizukami, N., Mendoza, P. A., and Vargas, X.: To what extent does river routing matter in hydrological modeling?, Hydrol. Earth Syst. Sci., 27, 3505–3524, https://doi.org/10.5194/hess-27-3505-2023, 2023. a, b
Daly, C., Neilson, R. P., and Phillips, D. L.: A statistical-topographic model for mapping climatological precipitation over mountainous terrain, J. Appl. Meteorol. Clim., 33, 140–158, 1994. a
Daly, C., Halbleib, M., Smith, J. I., Gibson, W. P., Doggett, M. K., Taylor, G. H., Curtis, J., and Pasteris, P. P.: Physiographically sensitive mapping of climatological temperature and precipitation across the conterminous United States, Int. J. Climatol., 28, 2031–2064, 2008. a
Dee, D. P., Uppala, S., Simmons, A. J., Berrisford, P., Poli, P., Kobayashi, S., Andrae, U., Balmaseda, M., Balsamo, G., Bauer, d. P., et al.: The ERA-Interim reanalysis: Configuration and performance of the data assimilation system, Q. J. Roy. Meteor. Soc., 137, 553–597, 2011. a
Dembélé, M., Hrachowitz, M., Savenije, H. H., Mariéthoz, G., and Schaefli, B.: Improving the predictive skill of a distributed hydrological model by calibration on spatial patterns with multiple satellite data sets, Water Resour. Rees., 56, e2019WR026085, https://doi.org/10.1029/2019WR026085, 2020. a
Demirel, M. C., Mai, J., Mendiguren, G., Koch, J., Samaniego, L., and Stisen, S.: Combining satellite data and appropriate objective functions for improved spatial pattern performance of a distributed hydrologic model, Hydrol. Earth Syst. Sci., 22, 1299–1315, https://doi.org/10.5194/hess-22-1299-2018, 2018. a
Derin, Y. and Yilmaz, K. K.: Evaluation of multiple satellite-based precipitation products over complex topography, J. Hydrometeorol., 15, 1498–1516, 2014. a
DGA: Actualización del Balance Hídrico Nacional, Tech. Rep. SIT No. 417, Dirección General de Aguas, Ministerio de Obras Públicas, Santiago, Chile, realizado por: Universidad de Chile & Pontificia Universidad Católica de Chile, https://repositoriodirplan.mop.gob.cl/biblioteca/items/fc5370ee-1498-41b7-8ff9-58d529168e0a (last access: 1 October 2026), 2017. a, b, c, d
DGA: Aplicación de La Metodología de Actualización del Balance Hídrico Nacional en las Cuencas de la Macrozona Norte y Centro, Tech. rep., Dirección General de Aguas, Ministerio de Obras Públicas, Santiago, Chile, https://repositoriodirplan.mop.gob.cl/biblioteca/items/468153aa-b133-4bfa-93e6-618e53d0e3dd/full (last access: 1 October 2026), 2018. a
DGA: Aplicación de La Metodología de Actualización del Balance Hídrico Nacional en las Cuencas de la Macrozona Sur y Parte de la Macrozona Austral, Tech. rep., Dirección General de Aguas, Ministerio de Obras Públicas, Santiago, Chile, https://repositoriodirplan.mop.gob.cl/biblioteca/items/c0634d0a-a41c-49de-abc8-45a2912dbcd6 (last access: 1 October 2026), 2019. a
Dinku, T., Ceccato, P., and Connor, S. J.: Challenges of satellite rainfall estimation over mountainous and arid parts of east Africa, Int. J. Remote Sens., 32, 5965–5979, 2011. a
Dominguez, F., Rasmussen, R., Liu, C., et al.: Advancing South American water and climate science through multidecadal Convection-Permitting Modeling, B. Am. Meteorol. Soc., 105, E32–E44, 2024. a, b, c, d, e, f, g
Duan, Q., Gupta, V. K., and Sorooshian, S.: Shuffled complex evolution approach for effective and efficient global minimization, J. Optimiz. Theory App., 76, 501–521, 1993. a
Evin, G., Le Lay, M., Fouchier, C., Penot, D., Colleoni, F., Mas, A., Garambois, P.-A., and Laurantin, O.: Evaluation of hydrological models on small mountainous catchments: impact of the meteorological forcings, Hydrol. Earth Syst. Sci., 28, 261–281, https://doi.org/10.5194/hess-28-261-2024, 2024. a
Fernández, A., Schumacher, V., Ciocca, I., Rifo, A., Muñoz, A. A., and Justino, F.: Validation of a 9-km WRF dynamical downscaling of temperature and precipitation for the period 1980–2005 over Central South Chile, Theor. Appl. Climatol., 143, 361–378, 2021. a
Fosser, G., Kendon, E. J., Stephenson, D., and Tucker, S.: Convection-permitting models offer promise of more certain extreme rainfall projections, Geophys. Res. Lett., 47, e2020GL088151, https://doi.org/10.1029/2020GL088151, 2020. a
Fowler, K., Peel, M., Western, A., and Zhang, L.: Improved rainfall-runoff calibration for drying climate: Choice of objective function, Water Resour. Res., 54, 3392–3408, 2018. a
Funk, C., Peterson, P., Landsfeld, M., Pedreros, D., Verdin, J., Shukla, S., Husak, G., Rowland, J., Harrison, L., Hoell, A., and Michaelsen, J.: The climate hazards infrared precipitation with stations – a new environmental record for monitoring extremes, Scientific Data, 2, 1–21, 2015. a
Garcia, F., Folton, N., and Oudin, L.: Which objective function to calibrate rainfall–runoff models for low-flow index simulations?, Hydrolog. Sci. J., 62, 1149–1166, 2017. a
Garreaud, R.: Intraseasonal variability of moisture and rainfall over the South American Altiplano, Mon. Weather Rev., 128, 3337–3346, 2000. a
Garreaud, R., Vuille, M., and Clement, A. C.: The climate of the Altiplano: observed current conditions and mechanisms of past changes, Palaeogeogr. Palaeocl., 194, 5–22, 2003. a
Garreaud, R. D., Boisier, J. P., Rondanelli, R., Montecinos, A., Sepúlveda, H. H., and Veloso-Aguila, D.: The central Chile mega drought (2010–2018): a climate dynamics perspective, Int. J. Climatol., 40, 421–439, 2020. a
Gateño, F., Mendoza, P. A., Vásquez, N., Lagos-Zúñiga, M., Jiménez, H., Jerez, C., Vargas, X., Rubio-Álvarez, E., and Montserrat, S.: Screening CMIP6 models for Chile based on past performance and code genealogy, Climatic Change, 177, 87, https://doi.org/10.1007/s10584-024-03742-1, 2024. a
Gebrechorkos, S. H., Leyland, J., Dadson, S. J., Cohen, S., Slater, L., Wortmann, M., Ashworth, P. J., Bennett, G. L., Boothroyd, R., Cloke, H., Delorme, P., Griffith, H., Hardy, R., Hawker, L., McLelland, S., Neal, J., Nicholas, A., Tatem, A. J., Vahidi, E., Liu, Y., Sheffield, J., Parsons, D. R., and Darby, S. E.: Global-scale evaluation of precipitation datasets for hydrological modelling, Hydrol. Earth Syst. Sci., 28, 3099–3118, https://doi.org/10.5194/hess-28-3099-2024, 2024. a
Givovich, F., Mendoza, P. A., Vásquez, N. A., Murillo, O., Muñoz-Castro, E., and Ayala, Á.: Representing subgrid precipitation variability in snowpack and hydrological modeling: Is adding complexity worth it?, J. Hydrol., 662, 134038, https://doi.org/10.1016/j.jhydrol.2025.134038, 2025. a
Gupta, H. V., Kling, H., Yilmaz, K. K., and Martinez, G. F.: Decomposition of the mean squared error and NSE performance criteria: Implications for improving hydrological modelling, J. Hydriol., 377, 80–91, 2009. a
Hara, M., Yoshikane, T., Kawase, H., and Kimura, F.: Estimation of the impact of global warming on snow depth in Japan by the pseudo-global-warming method, Hydrological Research Letters, 2, 61–64, 2008. a
Henn, B., Newman, A. J., Livneh, B., Daly, C., and Lundquist, J. D.: An assessment of differences in gridded precipitation datasets in complex terrain, J. Hydrol., 556, 1205–1219, 2018. a
Hernandez, D., Mendoza, P. A., Boisier, J. P., and Ricchetti, F.: Hydrologic sensitivities and ENSO variability across hydrological regimes in central Chile (28°–41° S), Water Resour. Res., 58, e2021WR031860, https://doi.org/10.1029/2021WR031860, 2022. a, b
Herrera, S., Kotlarski, S., Soares, P. M., Cardoso, R. M., Jaczewski, A., Gutiérrez, J. M., and Maraun, D.: Uncertainty in gridded precipitation products: Influence of station density, interpolation method and grid resolution, Int. J. Climatol., 39, 3717–3729, 2019. a
Hersbach, H., Bell, B., Berrisford, P., Hirahara, S., Horányi, A., Muñoz-Sabater, J., Nicolas, J., Peubey, C., Radu, R., Schepers, D., Simmons, A., Soci, C., Abdalla, S., Abellan, X., Balsamo, G., Bechtold, P., Biavati, G., Bidlot, J., Bonavita, M., De Chiara, G., Dahlgren, P., Dee, D., Diamantakis, M., Dragani, R., Flemming, J., Forbes, R., Fuentes, M., Geer, A., Haimberger, L., Healy, S., Hogan, R. J., Hólm, E., Janisková, M., Keeley, S., Laloyaux, P., Lopez, P., Lupu, C., Radnoti, G., de Rosnay, P., Rozum, I., Vamborg, F., Villaume, S., and Thépaut, J.-N.: The ERA5 global reanalysis, Q. J. Roy. Meteor. Soc., 146, 1999–2049, 2020. a, b, c, d
Hobouchian, M. P., Salio, P., Skabar, Y. G., Vila, D., and Garreaud, R.: Assessment of satellite precipitation estimates over the slopes of the subtropical Andes, Atmos. Res., 190, 43–54, 2017. a
Hong, S.-Y., Noh, Y., and Dudhia, J.: A new vertical diffusion package with an explicit treatment of entrainment processes, Mon. Weather Rev., 134, 2318–2341, 2006. a
Iacono, M. J., Delamere, J. S., Mlawer, E. J., Shephard, M. W., Clough, S. A., and Collins, W. D.: Radiative forcing by long-lived greenhouse gases: Calculations with the AER radiative transfer models, J. Geophys. Res.-Atmos., 113, D13103, https://doi.org/10.1029/2008JD009944, 2008. a
Ikeda, K., Rasmussen, R., Liu, C., Newman, A., Chen, F., Barlage, M., Gutmann, E., Dudhia, J., Dai, A., Luce, C., and Musselman, K.: Snowfall and snowpack in the Western US as captured by convection permitting climate simulations: Current climate and pseudo global warming future climate, Clim. Dynam., 57, 2191–2215, 2021. a
Isotta, F. A., Frei, C., Weilguni, V., Percec Tadic, M., Lassegues, P., Rudolf, B., Pavan, V., Cacciamani, C., Antolini, G., Ratto, S. M., Munari, M., Micheletti, S., Bonati, V., Lussana, C., Ronchi, C., Panettieri, E., Marigo, G., and Vertačnik, G.: The climate of daily precipitation in the Alps: development and analysis of a high-resolution grid dataset from pan-Alpine rain-gauge data, Int. J. Climatol., 34, 1657–1675, 2014. a
Jahanshahi, A., Roshun, S. H., and Booij, M. J.: Comparison of satellite-based and reanalysis precipitation products for hydrological modeling over a data-scarce region, Clim. Dynam., 62, 3505–3537, 2024. a, b
Jara, F., Lagos-Zúñiga, M., Fuster, R., Mattar, C., and McPhee, J.: Snow processes and climate sensitivity in an arid mountain region, Northern Chile, Atmosphere, 12, 520, https://doi.org/10.3390/atmos12040520, 2021. a
Katiraie-Boroujerdy, P.-S., Nasrollahi, N., Hsu, K.-l., and Sorooshian, S.: Evaluation of satellite-based precipitation estimation over Iran, J. Arid Environ., 97, 205–219, 2013. a
Kawase, H., Yoshikane, T., Hara, M., Kimura, F., Yasunari, T., Ailikun, B., Ueda, H., and Inoue, T.: Intermodel variability of future changes in the Baiu rainband estimated by the pseudo global warming downscaling method, J. Geophys. Res.-Atmos., 114, D24110, https://doi.org/10.1029/2009JD011803, 2009. a
Kidd, C. and Huffman, G.: Global precipitation measurement, Meteorol. Appl., 18, 334–353, 2011. a
Kling, H., Fuchs, M., and Paulin, M.: Runoff conditions in the upper Danube basin under an ensemble of climate change scenarios, J. Hydrol., 424, 264–277, 2012. a
Kostopoulou, E., Giannakopoulos, C., Anagnostopoulou, C., Tolika, K., Maheras, P., Vafiadis, M., and Founda, D.: Simulating maximum and minimum temperature over Greece: a comparison of three downscaling techniques, Theor. Appl. Climatol., 90, 65–82, 2007. a
Kouakou, C., Paturel, J.-E., Satgé, F., Tramblay, Y., Defrance, D., and Rouché, N.: Comparison of gridded precipitation estimates for regional hydrological modeling in West and Central Africa, Journal of Hydrology: Regional Studies, 47, 101409, https://doi.org/10.1016/j.ejrh.2023.101409, 2023. a, b
Lagos-Zúñiga, M., Mendoza, P. A., Campos, D., and Rondanelli, R.: Trends in seasonal precipitation extremes and associated temperatures along continental Chile, Clim. Dynam., 62, 4205–4222, 2024. a
Lema, F., Mendoza, P. A., Vásquez, N. A., Mizukami, N., Zambrano-Bigiarini, M., and Vargas, X.: Technical note: What does the Standardized Streamflow Index actually reflect? Insights and implications for hydrological drought analysis, Hydrol. Earth Syst. Sci., 29, 1981–2002, https://doi.org/10.5194/hess-29-1981-2025, 2025. a, b, c
Li, Z., Gao, S., Chen, M., Gourley, J. J., and Hong, Y.: Spatiotemporal characteristics of US floods: Current status and forecast under a future warmer climate, Earth's Future, 10, e2022EF002700, https://doi.org/10.1029/2022EF002700, 2022. a
Lindström, G., Johansson, B., Persson, M., Gardelin, M., and Bergström, S.: Development and test of the distributed HBV-96 hydrological model, J. Hydrol., 201, 272–288, 1997.
Liu, C., Ikeda, K., Prein, A., Scaff, L., Dominguez, F., Rasmussen, R., Huang, Y., Dudhia, J., Wang, W., Chen, F., Xue, L., Fita, L., Lagos-Zúñiga, M., Lavado-Casimiro, W., Masiokas, M., Puhales, F., and Yepes, L. J.: Convection-permitting climate simulations over South America: Experimentation during different phases of ENSO, Atmos. Res., 316, 107936, https://doi.org/10.1016/j.atmosres.2025.107936, 2025. a, b, c
Liu, C., Ikeda, K., Dominguez, F., Prein, A. F., Rasmussen, R. M., Zhang, Z., Xue, L., Neale, R. B., Chun, K. P., He, C., Rios-Berrios, R., Simões Reboita, M., Huang, Y., Gomes, H. B., Llopart, M., Dudhia, J., Tian, Y., Scaff, L., Varble, A. C., Morales-Marin, L., Risanto, C. B., Dougherty, E., Llamocca Huamani, J., Veloso-Aguila, D., Rasmussen, K. L., Dai, A., Núñez Ocasio, K. M., Moon, Z. L., Bettolli, M. L., Mu, Y., Paixão Veiga, J. A., Barreiros de Souza, E., Claros, E., Hernandez Rodriguez, L. C., Chen, F., Feng, Z., da Silva, M. L., Fita, L., Balmaceda-Huarte, R., Lagos-Zúñiga, M., Guzmán-Zabalaga, D., Hernández, K. S., Silvestre Espinoza, E., Scremin Puhales, F., Mantovani Jr., J. A., Somos-Valenzuela, M., Giraldo-Osorio, J. D., Müller, O. V., Schneider, T., Newman, A. J., Mendoza, P. A., Bacmeister, J. T., Callaghan, P., Wang, W., Dai, D., Martinez-Villalobos, C., Urdiales-Flores, D., Gonçalves de Gonçalves, L. G., Petry, I., Zhang, Z., Januário, T. E., Wong, A. I., Nuñez Mejia, S., Mayta, V. C., Justino, F., Poveda, G., van Oevelen, P. J., Porfírio da Rocha, R., Ossandón, Á., Minder, J. R., Rehbein, A., Fu, R., Zamuriano, M., Di, L., and Gutmann, E. D.:: Multi-Decadal Convection Permitting Dynamical Downscaling of Current and Future Climates over South America, Version 1, Research Square [preprint], https://doi.org/10.1007/s00382-026-08376-w, 2026. a
Lockhoff, M., Zolina, O., Simmer, C., and Schulz, J.: Evaluation of satellite-retrieved extreme precipitation over Europe using gauge observations, J. Climate, 27, 607–623, 2014. a
Lucas-Picher, P., Argüeso, D., Brisson, E., Tramblay, Y., Berg, P., Lemonsu, A., Kotlarski, S., and Caillaud, C.: Convection-permitting modeling with regional climate models: Latest developments and next steps, WIREs Climate Change, 12, e731, https://doi.org/10.1002/wcc.731, 2021. a
Lundquist, J., Abel, M. R., Gutmann, E., and Kapnick, S.: Our skill in modeling mountain rain and snow is bypassing the skill of our observational networks, B. Am. Meteorol. Soc., 100, 2473–2490, 2019. a, b, c
Magaritz, M., Aravena, R., Peña, H., Suzuki, O., and Grilli, A.: Source of ground water in the deserts of northern Chile: evidence of deep circulation of ground water from the Andes, Groundwater, 28, 513–517, 1990. a
Meech, S., Alessandrini, S., Chapman, W., and Delle Monache, L.: Post-processing rainfall in a high-resolution simulation of the 1994 Piedmont flood, Bulletin of Atmospheric Science and Technology, 1, 373–385, 2020. a
Mendoza, P. A., Rajagopalan, B., Clark, M. P., Ikeda, K., and Rasmussen, R. M.: Statistical postprocessing of high-resolution regional climate model output, Mon. Weather Rev., 143, 1533–1553, 2015. a, b
Mendoza, P. A., Clark, M. P., Mizukami, N., Gutmann, E. D., Arnold, J. R., Brekke, L. D., and Rajagopalan, B.: How do hydrologic modeling decisions affect the portrayal of climate change impacts?, Hydrol. Process., 30, 1071–1095, 2016. a
Merz, R., Parajka, J., and Blöschl, G.: Time stability of catchment model parameters: Implications for climate impact analyses, Water Resour. Res., 47, W02531, https://doi.org/10.1029/2010WR009505, 2011. a
Miguez-Macho, G., Fan, Y., Weaver, C. P., Walko, R., and Robock, A.: Incorporating water table dynamics in climate modeling: 2. Formulation, validation, and soil moisture simulation, J. Geophys. Res.-Atmos., 112, D13108, https://doi.org/10.1029/2006JD008112, 2007. a
Minville, M., Cartier, D., Guay, C., Leclaire, L.-A., Audet, C., Le Digabel, S., and Merleau, J.: Improving process representation in conceptual hydrological model calibration using climate simulations, Water Resour. Res., 50, 5044–5073, 2014. a
Mohammed, J., Mengiste, Y., and P. Singh, V.: Improving spatio-temporal precipitation estimates in data scarce river basins: an application of machine learning-based multi-source data merging, Stoch. Env. Res. Risk A., 37, 1353–1369, 2023. a, b
Muñoz, R., Vaghefi, S., Drenkhan, F., Santos, M., Viviroli, D., Muccione, V., and Huggel, C.: Assessing water management strategies in data-scarce mountain regions under uncertain climate and socio-economic changes, Water Resour. Manage., 38, 4083–4100, 2024. a
Muñoz-Castro, E., Mendoza, P. A., Vásquez, N., and Vargas, X.: Exploring parameter (dis) agreement due to calibration metric selection in conceptual rainfall–runoff models, Hydrolog. Sci. J., 68, 1754–1768, 2023. a, b
Muñoz-Castro, E., Anderson, B. J., Astagneau, P. C., Swain, D. L., Mendoza, P. A., and Brunner, M. I.: How well do hydrological models simulate streamflow extremes and drought-to-flood transitions?, Hydrol. Earth Syst. Sci., 30, 825–848, https://doi.org/10.5194/hess-30-825-2026, 2026. a
Murillo, O., Mendoza, P. A., Vásquez, N., Mizukami, N., and Ayala, Á.: Impacts of subgrid temperature distribution along elevation bands in snowpack modeling: Insights from a suite of Andean catchments, Water Resour. Res., 58, e2022WR032113, https://doi.org/10.1029/2022WR032113, 2022. a, b, c
Naabil, E., Lamptey, B., Arnault, J., Olufayo, A., and Kunstmann, H.: Water resources management using the WRF-Hydro modelling system: Case-study of the Tono dam in West Africa, Journal of Hydrology: Regional Studies, 12, 196–209, 2017. a
Nashwan, M. S., Shahid, S., Dewan, A., Ismail, T., and Alias, N.: Performance of five high resolution satellite-based precipitation products in arid region of Egypt: An evaluation, Atmos. Res., 236, 104809, https://doi.org/10.1016/j.atmosres.2019.104809, 2020. a
Newman, A. J., Clark, M. P., Craig, J., Nijssen, B., Wood, A., Gutmann, E., Mizukami, N., Brekke, L., and Arnold, J. R.: Gridded ensemble precipitation and temperature estimates for the contiguous United States, J. Hydrometeorol., 16, 2481–2500, 2015a. a, b
Newman, A. J., Clark, M. P., Sampson, K., Wood, A., Hay, L. E., Bock, A., Viger, R. J., Blodgett, D., Brekke, L., Arnold, J. R., Hopson, T., and Duan, Q.: Development of a large-sample watershed-scale hydrometeorological data set for the contiguous USA: data set characteristics and assessment of regional variability in hydrologic model performance, Hydrol. Earth Syst. Sci., 19, 209–223, https://doi.org/10.5194/hess-19-209-2015, 2015b. a
Newman, A. J., Mizukami, N., Clark, M. P., Wood, A. W., Nijssen, B., and Nearing, G.: Benchmarking of a physically based hydrologic model, J. Hydrometeorol., 18, 2215–2225, 2017. a
Newman, A. J., Clark, M. P., Longman, R. J., and Giambelluca, T. W.: Methodological intercomparisons of station-based gridded meteorological products: Utility, limitations, and paths forward, J. Hydrometeorol., 20, 531–547, 2019. a
Newman, A. J., Clark, M. P., Wood, A. W., and Arnold, J. R.: Probabilistic spatial meteorological estimates for Alaska and the Yukon, J. Geophys. Res.-Atmos., 125, e2020JD032696, https://doi.org/10.1029/2020JD032696, 2020. a
Niu, G.-Y., Yang, Z.-L., Mitchell, K. E., Chen, F., Ek, M. B., Barlage, M., Kumar, A., Manning, K., Niyogi, D., Rosero, E., Tewari, M., and Xia, Y.: The community Noah land surface model with multiparameterization options (Noah-MP): 1. Model description and evaluation with local-scale measurements, J. Geophys. Res.-Atmos., 116, D12109, https://doi.org/10.1029/2010JD015139, 2011. a
Núñez Ocasio, K. M. and Moon, Z. L.: TAMS: a tracking, classifying, and variable-assigning algorithm for mesoscale convective systems in simulated and satellite-derived datasets, Geosci. Model Dev., 17, 6035–6049, https://doi.org/10.5194/gmd-17-6035-2024, 2024. a
Oudin, L., Hervieu, F., Michel, C., Perrin, C., Andréassian, V., Anctil, F., and Loumagne, C.: Which potential evapotranspiration input for a lumped rainfall–runoff model?: Part 2—Towards a simple and efficient potential evapotranspiration model for rainfall–runoff modelling, J. Hydrol., 303, 290–306, 2005. a
Parajka, J., Merz, R., and Blöschl, G.: Uncertainty and multiple objective calibration in regional water balance modelling: case study in 320 Austrian catchments, Hydrol. Process., 21, 435–446, 2007. a
Pool, S., Fowler, K., and Peel, M.: Benefit of multivariate model calibration for different climatic regions, Water Resour. Res., 60, e2023WR036364, https://doi.org/10.1029/2023WR036364, 2024. a, b
Prein, A. F. and Gobiet, A.: Impacts of uncertainties in European gridded precipitation observations on regional climate analysis, Int. J. Climatol., 37, 305–327, 2017. a
Prein, A. F., Langhans, W., Fosser, G., Ferrone, A., Ban, N., Goergen, K., Keller, M., Tölle, M., Gutjahr, O., Feser, F., Brisson, E., Kollet, S., Schmidli, J., van Lipzig, N. P. M., and Leung, R.: A review on regional convection-permitting climate modeling: Demonstrations, prospects, and challenges, Rev. Geophys., 53, 323–361, 2015. a
Prein, A. F., Ban, N., Ou, T., Tang, J., Sakaguchi, K., Collier, E., Jayanarayanan, S., Li, L., Sobolowski, S., Chen, X., Zhou, X., Lai, H.-W., Sugimoto, S., Zou, L., Hasson, S. l. Ekstrom, M., Pothapakula, P. K., Ahrens, B., Stuart, R., Steen-Larsen, H. C., Leung, R., Belusic, D., Kukulies, J., Curio, J., and Chen, D.: Towards ensemble-based kilometer-scale climate simulations over the third pole region, Clim. Dynam., 60, 4055–4081, 2023. a
Prein, A. F., Feng, Z., Fiolleau, T., Moon, Z. L., Núñez Ocasio, K. M., Kukulies, J., Roca, R., Varble, A. C., Rehbein, A., Liu, C., Ikeda, K., Mu, Y., and Rasmussen, R. M..: Km-scale simulations of mesoscale convective systems over South America – A feature tracker intercomparison, J. Geophys. Res.-Atmos., 129, e2023JD040254, https://doi.org/10.1029/2023JD040254, 2024. a
Rabus, B., Eineder, M., Roth, A., and Bamler, R.: The shuttle radar topography mission – a new class of digital elevation models acquired by spaceborne radar, ISPRS J. Photogramm., 57, 241–262, 2003. a, b
Rasmussen, R., Liu, C., Ikeda, K., Gochis, D., Yates, D., Chen, F., Tewari, M., Barlage, M., Dudhia, J., Yu, W., Miller, K., Arsenault, K., Grubišić, V., Thompson, G., and Gutmann, E.: High-resolution coupled climate runoff simulations of seasonal snowfall over Colorado: A process study of current and warmer climate, J. Climate, 24, 3015–3048, 2011. a
Rasmussen, R., Baker, B., Kochendorfer, J., Meyers, T., Landolt, S., Fischer, A. P., Black, J., Thériault, J. M., Kucera, P., Gochis, D., Smith, C., Nitu, R., Hall, M., Ikeda, K., and Gutmann, E.: How well are we measuring snow: The NOAA/FAA/NCAR winter precipitation test bed, B. Am. Meteorol. Soc., 93, 811–829, 2012. a
Rehbein, A., Prein, A. F., Ambrizzi, T., Ikeda, K., Liu, C., and Rasmussen, R. M.: 20 Years of MCSs simulations over South America using a convection-permitting model, Clim. Dynam., 63, 1–14, 2025. a
Rienecker, M. M., Suarez, M. J., Gelaro, R., Todling, R., Bacmeister, J., Liu, E., Bosilovich, M. G., Schubert, S. D., Takacs, L., Kim, G.-K., Bloom, S., Chen, J., Collins, D., Conaty, A., da Silva, A., Gu, W., Joiner, J., Koster, R. D., Lucchesi, R., Molod, A., Owens, T., Pawson, S., Pegion, P., Redder, C. R., Reichle, R., Robertson, F. R., Ruddick, A. G., Sienkiewicz, M., and Woollen, J.: MERRA: NASA’s modern-era retrospective analysis for research and applications, J. Climate, 24, 3624–3648, 2011. a
Rondanelli, R.: Cutoff Lows Over Southwestern South America, in: Oxford Research Encyclopedia of Climate Science, Oxford University Press, Oxford, https://doi.org/10.1093/acrefore/9780190228620.013.976, 2025. a
Rummukainen, M.: Added value in regional climate modeling, WIREs Climate Change, 7, 145–159, 2016. a
Running, S., Mu, Q., Zhao, M., and Moreno, A.: MODIS/Terra Net Evapotranspiration Gap-Filled 8-Day L4 Global 500m SIN Grid V061, NASA Land Processes Distributed Active Archive Center [data set], https://doi.org/10.5067/MODIS/MOD16A2GF.061, 2021. a
Saavedra, D., Mendoza, P. A., Addor, N., Llauca, H., and Vargas, X.: A multi-objective approach to select hydrological models and constrain structural uncertainties for climate impact assessments, Hydrol. Process., 36, e14446, https://doi.org/10.1002/hyp.14446, 2022. a
Saha, S., Moorthi, S., Pan, H.-L., et al.: The NCEP climate forecast system reanalysis, B. Am. Meteorol. Soc., 91, 1015–1058, https://doi.org/10.1175/2010BAMS3001.1, 2010. a
Sanhueza, C.: Uso de simulaciones climáticas de alta resolución (SAAG-NCAR) en la modelación hidrológica del río Huasco, Chile, tesis de Ingeniería Civil, Universidad de Chile, Santiago, Chile, https://doi.org/10.58011/e8zv-ar89, 2024. a
Sarricolea, P., Herrera-Ossandon, M., and Meseguer-Ruiz, Ó.: Climatic regionalisation of continental Chile, J. Maps, 13, 66–73, 2017. a
Schär, C., Frei, C., Lüthi, D., and Davies, H. C.: Surrogate climate-change scenarios for regional climate models, Geophys. Res. Lett., 23, 669–672, 1996. a
Scheel, M. L. M., Rohrer, M., Huggel, Ch., Santos Villar, D., Silvestre, E., and Huffman, G. J.: Evaluation of TRMM Multi-satellite Precipitation Analysis (TMPA) performance in the Central Andes region and its dependency on spatial and temporal resolution, Hydrol. Earth Syst. Sci., 15, 2649–2663, https://doi.org/10.5194/hess-15-2649-2011, 2011. a
Schubert, S. and Henderson-Sellers, A.: A statistical model to downscale local daily temperature extremes from synoptic-scale atmospheric circulation patterns in the Australian region, Clim. Dynam., 13, 223–234, 1997. a
Schumacher, V., Fernández, A., Justino, F., and Comin, A.: WRF high resolution dynamical downscaling of precipitation for the Central Andes of Chile and Argentina, Frontiers in Earth Science, 8, 328, https://doi.org/10.3389/feart.2020.00328, 2020a. a
Schumacher, V., Justino, F., Fernández, A., Meseguer Ruiz, O., Sarricolea, P., Comin, A., Peroni Venancio, L., and Althoff, D.: Comparison between observations and gridded data sets over complex terrain in the Chilean Andes: Precipitation and temperature, Int. J. Climatol., 40, 5266–5288, 2020b. a, b
Sepúlveda, U. M., Mendoza, P. A., Mizukami, N., and Newman, A. J.: Revisiting parameter sensitivities in the variable infiltration capacity model across a hydroclimatic gradient, Hydrol. Earth Syst. Sci., 26, 3419–3445, https://doi.org/10.5194/hess-26-3419-2022, 2022. a, b
Serrano-Notivoli, R. and Tejedor, E.: From rain to data: A review of the creation of monthly and daily station-based gridded precipitation datasets, WIREs Water, 8, e1555, https://doi.org/10.1002/wat2.1555, 2021. a
Skamarock, W. C. and Klemp, J. B.: A time-split nonhydrostatic atmospheric model for weather research and forecasting applications, J. Comput. Phys., 227, 3465–3485, 2008. a
Skamarock, W. C., Klemp, J. B., Dudhia, J., Gill, D. O., Liu, Z., Berner, J., Wang, W., Powers, J. G., Duda, M. G., Barker, D. M., and Huang, X.-Y.: A description of the advanced research WRF model version 4, National Center for Atmospheric Research, Tech. Note NCAR/TN-556+STR, 145 pp., Boulder, Colorado, United States, https://doi.org/10.5065/1dfh-6p97, 2019. a
Sreeparvathy, V. and Srinivas, V.: A Bayesian Fuzzy Clustering Approach for Design of Precipitation Gauge Network Using Merged Remote Sensing and Ground-Based Precipitation Products, Water Resour. Res., 58, e2021WR030612, https://doi.org/10.1029/2021WR030612, 2022. a
Stehr, A. and Aguayo, M.: Snow cover dynamics in Andean watersheds of Chile (32.0–39.5° S) during the years 2000–2016, Hydrol. Earth Syst. Sci., 21, 5111–5126, https://doi.org/10.5194/hess-21-5111-2017, 2017. a
Tang, G., Clark, M. P., Newman, A. J., Wood, A. W., Papalexiou, S. M., Vionnet, V., and Whitfield, P. H.: SCDNA: a serially complete precipitation and temperature dataset for North America from 1979 to 2018, Earth Syst. Sci. Data, 12, 2381–2409, https://doi.org/10.5194/essd-12-2381-2020, 2020. a
Tang, G., Clark, M. P., and Papalexiou, S. M.: SC-Earth: A station-based serially complete Earth dataset from 1950 to 2019, J. Climate, 34, 6493–6511, 2021. a
Terink, W., Leijnse, H., van den Eertwegh, G., and Uijlenhoet, R.: Spatial resolutions in areal rainfall estimation and their impact on hydrological simulations of a lowland catchment, J. Hydrol., 563, 319–335, 2018. a
Thiemig, V., Rojas, R., Zambrano-Bigiarini, M., Levizzani, V., and De Roo, A.: Validation of satellite-based precipitation products over sparsely gauged African river basins, J. Hydrometeorol., 13, 1760–1783, 2012. a
Thompson, G., Field, P. R., Rasmussen, R. M., and Hall, W. D.: Explicit forecasts of winter precipitation using an improved bulk microphysics scheme. Part II: Implementation of a new snow parameterization, Mon. Weather Rev., 136, 5095–5115, 2008. a
Thorne, P., Menne, M., Williams, C., Rennie, J., Lawrimore, J., Vose, R., Peterson, T. C., Durre, I., Davy, R., Esau, I., Klein-Tank, A. M. G., and Merlone, A.: Reassessing changes in diurnal temperature range: A new data set and characterization of data biases, J. Geophys. Res.-Atmos., 121, 5115–5137, 2016. a
Torma, C., Giorgi, F., and Coppola, E.: Added value of regional climate modeling over areas characterized by complex terrain—Precipitation over the Alps, J. Geophys. Res.-Atmos., 120, 3957–3972, 2015. a
Torrez-Rodriguez, L., Goubanova, K., Muñoz, C., and Montecinos, A.: Evaluation of temperature and precipitation from CORDEX-CORE South America and Eta-RCM regional climate simulations over the complex terrain of Subtropical Chile, Clim. Dynam., 61, 3195–3221, 2023. a
Valdivieso-García, K., Vázquez-Patiño, A., Saritama, H., Contreras, J., Avilés, A., and García, F.: Influence of climate change on precipitation extremes in Ecuador, Climatic Change, 177, 165, https://doi.org/10.1007/s10584-024-03820-4, 2024. a
Valencia, S., Marín, D. E., Gómez, D., Hoyos, N., Salazar, J. F., and Villegas, J. C.: Spatio-temporal assessment of Gridded precipitation products across topographic and climatic gradients in Colombia, Atmos. Res., 285, 106643, https://doi.org/10.1016/j.atmosres.2023.106643, 2023. a
Vásquez, N., Cepeda, J., Gómez, T., Mendoza, P. A., Lagos, M., Boisier, J. P., Álvarez-Garretón, C., and Vargas, X.: Catchment-scale natural water balance in Chile, in: Water resources of Chile, edited by: Fernández, B. and Gironás, J., Springer, 189–208, https://doi.org/10.1007/978-3-030-56901-3_9, 2021. a, b, c
Vásquez, N., Mendoza, P. A., Knoben, W. J., Arnal, L., Lagos-Zúñiga, M., Clark, M., and Vargas, X.: The Key role of temporal stratification for GCM bias correction in climate impact assessments, Earth's Future, 12, e2023EF004242, https://doi.org/10.1029/2023EF004242, 2024. a
Vásquez, N., Mendoza, P. A., Lagos-Zuñiga, M., Scaff, L., Muñoz-Castro, E., and Vargas, X.: Robust spatial changes in climate classes: insights from bias-corrected CMIP6 models across Chile, Environ. Res. Lett., 20, 014061, https://doi.org/10.1088/1748-9326/ad9d5b, 2025. a
Vautard, R., Kadygrov, N., Iles, C., Boberg, F., Buonomo, E., Bülow, K., Coppola, E., Corre, L., van Meijgaard, E., Nogherotto, R., Sandstad, M., Schwingshackl, C., Somot, S., Aalbers, E., Christensen, O. B., Ciarlo, J. M., Demory, M.-E., Giorgi, F., Jacob, D., Jones, R. G. Keuler, K., Kjellström, E., Lenderink, G., Levavasseur, G., Nikulin, G., Sillmann, J., Solidoro, C., Sørland, S, L., Steger, C., Teichmann, C., Warrach-Sagi, K., and Wulfmeyer, V.: Evaluation of the large EURO-CORDEX regional climate model ensemble, J. Geophys. Res.-Atmos., 126, e2019JD032344, https://doi.org/10.1029/2019JD032344, 2021. a
Verdin, A., Rajagopalan, B., Kleiber, W., and Funk, C.: A Bayesian kriging approach for blending satellite and ground precipitation observations, Water Resour. Res., 51, 908–921, 2015. a
Viale, M., Bianchi, E., Cara, L., Ruiz, L. E., Villalba, R., Pitte, P., Masiokas, M., Rivera, J., and Zalazar, L.: Contrasting climates at both sides of the Andes in Argentina and Chile, Frontiers in Environmental Science, 7, 69, https://doi.org/10.3389/fenvs.2019.00069, 2019. a
Vicuña, S., Vargas, X., Boisier, J. P., Mendoza, P. A., Gómez, T., Vásquez, N., and Cepeda, J.: Impacts of climate change on water resources in Chile, in: Water resources of Chile, edited by: Fernández, B. and Gironás, J., 347–363, https://doi.org/10.1007/978-3-030-56901-3_19, Springer, 2021. a
Viglione, A. and Parajka, J.: TUWmodel: Lumped/Semi-Distributed Hydrological Model for Education Purposes, R package version 1.1-1, CRAN [code], https://CRAN.R-project.org/package=TUWmodel (last access: 23 October 2023), 2019. a
Viviroli, D., Archer, D. R., Buytaert, W., Fowler, H. J., Greenwood, G. B., Hamlet, A. F., Huang, Y., Koboltschnig, G., Litaor, M. I., López-Moreno, J. I., Lorentz, S., Schädler, B., Schreier, H., Schwaiger, K., Vuille, M., and Woods, R.: Climate change and mountain water resources: overview and recommendations for research, management and policy, Hydrol. Earth Syst. Sci., 15, 471–504, https://doi.org/10.5194/hess-15-471-2011, 2011. a
Wagner, S., Fersch, B., Yuan, F., Yu, Z., and Kunstmann, H.: Fully coupled atmospheric-hydrological modeling at regional and long-term scales: Development, application, and analysis of WRF-HMS, Water Resour. Res., 52, 3187–3211, 2016. a
Wilks, D. S.: Statistical Methods in the Atmospheric Sciences, Elsevier, 4th edn., https://doi.org/10.1016/C2017-0-03921-6, 2019. a, b
Xie, K., Li, L., Chen, H., and Xu, C.-Y.: Assessing the performance of convection-permitting climate model in reproducing basin-scale hydrological extremes: A western Norway case study, J. Hydrol., 656, 132989, https://doi.org/10.1016/j.jhydrol.2025.132989, 2025. a
Yan, H., Gao, Y., Wilby, R., Yu, D., Wright, N., Yin, J., Chen, X., Chen, J., and Guan, M.: Urbanization further intensifies short-duration rainfall extremes in a warmer climate, Geophys. Res. Lett., 51, e2024GL108565, https://doi.org/10.1029/2024GL108565, 2024. a
Yin, J., Guo, S., Gu, L., Zeng, Z., Liu, D., Chen, J., Shen, Y., and Xu, C.-Y.: Blending multi-satellite, atmospheric reanalysis and gauge precipitation products to facilitate hydrological modelling, J. Hydrol., 593, 125878, https://doi.org/10.1016/j.jhydrol.2020.125878, 2021. a
Zambrano, F., Wardlow, B., Tadesse, T., Lillo-Saavedra, M., and Lagos, O.: Evaluating satellite-derived long-term historical precipitation datasets for drought monitoring in Chile, Atmos. Res., 186, 26–42, 2017. a
Zambrano-Bigiarini, M., Nauditt, A., Birkel, C., Verbist, K., and Ribbe, L.: Temporal and spatial evaluation of satellite-based rainfall estimates across the complex topographical and climatic gradients of Chile, Hydrol. Earth Syst. Sci., 21, 1295–1320, https://doi.org/10.5194/hess-21-1295-2017, 2017. a, b, c
Zilli, M. T., Lemes, M. R., Hart, N. C., Halladay, K., Kahana, R., Fisch, G., Prein, A., Ikeda, K., and Liu, C.: The added value of using convective-permitting regional climate model simulations to represent cloud band events over South America, Clim. Dynam., 62, 10543–10564, 2024. a, b