
the Creative Commons Attribution 4.0 License.
the Creative Commons Attribution 4.0 License.
 | 09 Oct 2026
The influence of vapor pressure deficit changes on global terrestrial evapotranspiration
Yuxin Miao

Yuhao Wang
Enwei Huang
Qingyang Wang
Yani Gun
Zhijie Zheng
Jiangwei Yang
Wenmin Li
Ziwen Liu
Vapor pressure deficit (VPD) has been widely recognized as a key driver of uncertainty in future global evapotranspiration (E) trends. Accurately characterizing the spatiotemporal dynamics of VPD and elucidating its influence on terrestrial E are critical for understanding land–atmosphere water and energy feedback processes under climate warming. However, previous studies have largely focused on the physiological regulation of plant transpiration (Et) at the leaf or canopy scale, leaving the quantitative understanding of VPD–E interactions at the global scale incomplete. By integrating multi-source remote sensing products and reanalysis datasets, this study quantitatively evaluates the role of VPD in regulating global terrestrial E variability. The main findings are as follows: (1) Approximately 60.7 % of global land area exhibits positive apparent sensitivity of E to VPD, with a global mean sensitivity of 293.3±62.3 mm hPa−1, and stronger responses observed in warm and humid regions. (2) VPD is positively correlated with Et overall, particularly in mid-to-high latitudes of the Northern Hemisphere, whereas its correlation with bare soil evaporation (Eb) is weaker and tends to be negative in water-limited regions. (3) The VPD–E relationship exhibits a pronounced aridity-dependent threshold, which decreases progressively from arid (1.90 kPa) and semi-arid (1.46 kPa) regions to semi-humid (0.49 kPa) and humid (0.47 kPa) regions. Further path analysis reveals that VPD regulates E through interconnected pathways involving atmospheric demand, soil moisture, vegetation physiology, and energy supply, with an overall negative net effect on E. This study clarifies the dominant pathways and regional heterogeneity of VPD–E interactions at the global scale, providing quantitative constraints for predicting the response of the terrestrial water cycle to increasing atmospheric aridity.
- Article
(6089 KB) - Full-text XML
-
Supplement
(3189 KB) - BibTeX
- EndNote


Vapor pressure deficit (VPD) has been rising at an unprecedented rate, emerging as one of the core variables driving global land drying and vegetation moisture stress under climate warming (Hermann et al., 2024). As a combined measure of temperature and relative humidity (Shih et al., 2025), the increase of VPD directly reflects the stronger atmospheric demand for water, which in turn strongly influences stomatal conductance, photosynthetic rate, and vegetation evapotranspiration (Chai et al., 2025; Miner et al., 2017). Many studies have shown that VPD has become a key variable linking the carbon–water cycle, ecosystem water use efficiency, and extreme climate events such as heat waves and droughts (Hermann et al., 2024). Under global warming, terrestrial ecosystems are facing “dual stress”: on the one hand, rising VPD intensifies water shortage; on the other hand, traditional climate models struggle to reproduce its nonlinear feedbacks, thereby creating substantial uncertainty in predicting future carbon–water cycle trends (Kim and Johnson, 2025). Therefore, a clear understanding of how VPD changes regulate global evapotranspiration (E) is not only of scientific value but also of great practical significance for ecosystem adaptation to climate change.
Current research on terrestrial E relies on long-term observations and multi-source models to characterize its spatiotemporal variability and drivers (Bai et al., 2025; Yi et al., 2024; Zhang et al., 2016). Eddy covariance (EC) provides the most direct (Zahn et al., 2022), high-frequency measurements of water, energy, and CO2 fluxes between the land surface and the atmosphere, and the global FLUXNET network supplies essential cross-ecosystem constraints on surface exchange processes (Mauder et al., 2024). The Penman–Monteith framework has become a standard for regional-to-global E estimation, especially for diagnosing meteorological control of potential evaporation (Renner et al., 2019; Yang et al., 2017). With the rise of satellite remote sensing, energy-balance models such as SEBAL and SEBS use land-surface temperature and radiative fluxes to retrieve spatially explicit E, supporting basin hydrology, crop water-use assessment, and drought monitoring (Wang et al., 2025b). In parallel, land data assimilation systems (e.g., GLDAS, ERA5-Land) combine multi-source observations with land-surface models to produce physically consistent, temporally continuous global E fields (Miralles et al., 2011), thereby supporting climate simulations and energy–water budget closure analyses (Xia et al., 2019; Xu et al., 2024). More recently, machine-learning and data-fusion approaches (e.g., FLUXCOM, GLEAM) have increased effective resolution and improved partitioning of E components, enabling representation of nonlinear land–atmosphere interactions across diverse climates (Duque-Gardeazabal et al., 2025; Xu et al., 2018). The latest research further indicates that ignoring the land–atmosphere feedback would lead to a significant overestimation of the climate-driven increase in E (Zhou and Yu, 2025).
Although higher global CO2 concentrations should theoretically improve vegetation water use efficiency (WUE) (Peters et al., 2018), recent studies combining FLUXNET flux observations with machine learning have shown that global WUE has tended to level off since 2000. This slowdown is mainly due to the “asymmetric effect” of VPD on photosynthesis and E—while VPD promotes E, it suppresses carbon assimilation, thus offsetting the CO2 fertilization effect (Li et al., 2023a). In non-peatland areas, higher VPD generally limits vegetation growth and reduces carbon sink capacity. However, in high-water-level environments such as peatlands, this effect may be weakened or even reversed by the “open water strategy” (Chen et al., 2023; Yuan et al., 2019). Together, these findings highlight that VPD is not only a driver of E but also an important regulator in the carbon–water coupling process. Yet, the spatial differences in the global VPD–E relationship and its driving mechanisms remain poorly understood, and the specific pathways through which VPD operates under multi-factor interactions are still unclear.
In recent years, empirical research on the relationship between VPD and E has steadily expanded. At the microscopic scale, there is a daily lag between vegetation transpiration and VPD, with the size of the lag depending on the radiation–VPD delay. Both plant and soil water potential are key factors regulating this lagged E–VPD relationship, especially when soil moisture declines (Zhang et al., 2014). At the macroscopic scale, in arid regions, the persistent rise in VPD combined with soil drought restricts E, causing vegetation wilting and ecosystem degradation (Wang et al., 2025a). By contrast, in tropical rainforests where soil water is relatively abundant, although higher VPD induces stomatal closure, leaf renewal during the dry season can boost short-term carbon sequestration (Kumagai et al., 2009; Lebrija-Trejos et al., 2023). These contrasting responses indicate that the influence of VPD on E is shaped by aridity zones, soil water availability, vegetation types, and even human activities (Zhuang et al., 2021). Therefore, understanding the nonlinearities, threshold effects, and multi-factor interactions in this relationship has become a major challenge in Earth system science (Hsu and Dirmeyer, 2021). Although some studies have tried to explain this relationship using statistical or process-based models, the lack of quantitative identification of VPD pathways remains a key limitation for improving predictive capability.
Against this background, this study explores how VPD influences E across different land surfaces and AI-based aridity zones worldwide. The analysis was conducted for the period of 1981–2020, during which global satellite observations, reanalysis products, and land-surface datasets are available with relatively consistent temporal coverage. This period also captures substantial climate variability and increasing atmospheric dryness under global warming, enabling an assessment of long-term VPD–E interactions at the global scale. Specifically, we used VPD and E data derived from multiple remote sensing sources to examine the global response of E to VPD changes during this period. The research focuses on the following scientific questions: (1) How does VPD influence global terrestrial E? (2) How does VPD affect the spatial and temporal heterogeneity of global E? (3) What are the implications of the rapid rise of VPD under global warming for land–atmosphere feedback? Addressing these questions will not only improve our understanding of the mechanisms by which VPD regulates E but also provide a stronger basis for developing targeted global climate adaptation strategies.
2.1 Data Sources
Evapotranspiration (E) data used in this study were obtained from the Global Land Evaporation Amsterdam Model product (GLEAM v4.2a) (Miralles et al., 2025). This product provides not only total evapotranspiration, but also its major components, including transpiration (Et) and bare-soil evaporation (Eb). It has been widely used in studies of the global water cycle. In GLEAM v4.2a, E is estimated based on the Penman-Monteith framework, in which vapor pressure deficit (VPD) is included as an important atmospheric driver. The main VPD dataset in this study was calculated from monthly 2 m air temperature (Ta) and dew point temperature (Td) from the ERA5-Land reanalysis (Copernicus Climate Change Service, 2019). This choice ensures good consistency with the VPD forcing used in GLEAM, because the VPD input in GLEAM is derived from MSWX Ta and Td, and the MSWX dataset is itself a bias-corrected product partly based on ERA5-Land. In addition to Ta and Td, precipitation (Pre) and surface solar radiation (SR) were also taken from ERA5-Land. Root-zone soil moisture (SMrz) and surface soil moisture (SMs) were both obtained from the GLEAM product, in order to keep the soil water variables consistent with the evapotranspiration estimates and component partitioning used in this study. To assess the robustness of the main results, we further introduced one independent VPD dataset and one independent evapotranspiration dataset for cross-validation. The independent VPD dataset was derived from monthly near-surface air temperature (TMP) and vapor pressure (VAP) from CRU TS v4.09, and VPD was calculated following the method described by Xu et al. (2024). The independent evapotranspiration dataset was taken from the P-LSHv2 product, which is a multi-decadal global evapotranspiration dataset with explicit soil moisture constraints (Feng et al., 2025). These two independent datasets were used only for robustness evaluation and cross-validation of the main ERA5-Land- and GLEAM-based results, rather than for the primary analysis itself (Fig. S1 in the Supplement).
Land-use data were obtained from the MCD12C1 version 6.1 product on the Google Earth Engine platform, which provides annual land-cover classification at a spatial resolution of 0.05° (Friedl and Sulla-Menashe, 2022). In this study, the original land-cover classes were further grouped into broader categories for analysis. Leaf area index (LAI) data were taken from the GIMMS LAI V1.2 dataset (Cao et al., 2023a), which has good temporal consistency and has been evaluated against field measurements and Landsat-based LAI samples. Elevation data were obtained from the WorldClim elevation dataset and were used as an auxiliary geographic variable in the analysis (Fick and Hijmans, 2017). According to the aridity index (AI), global land areas were divided into four classes: arid, semi-arid, semi-humid, and humid regions (Lin et al., 2025).
2.2 Methods
2.2.1 Trend Analysis of Raster Data Using the Theil-Sen Slope and Mann-Kendall Test
The Mann-Kendall trend test was used to analyze the changing trends and significance of VPD and E globally from 1981 to 2020 (Mann, 1945), and the Theil-Sen slope was used to quantify the magnitudes of the changing trends of the two (Sen, 1968). This method determines the monotonic trend of a sequence by calculating the test statistic S (Eq. 2) and its symbolic function Sgn (Eq. 3), where β>0 indicates that the sequence has an upward trend (Eq. 1). The significance of the trend is evaluated by the test statistic Z (Eq. 4), and the Z value is calculated based on S and its Var(S) (Eq. 5). This method has no strict requirements for the distribution of data and belongs to non-parametric test methods. It has been widely used in the analysis of time series and can well reflect the changes of VPD and E. The equation is as follows:
Median() represents the calculation of the median value. When β is greater than 0, it indicates an increasing trend in the research subject.
The test statistic S is calculated as follows:
where Sgn() is the sign function, calculated as:
The trend significance is evaluated using the test statistic Z, which is computed as follows:
where Var (variance) is computed as:
where n represents the number of data points in the sequence.
When the absolute value of Z exceeds specific thresholds (1.64, 1.96, or 2.58), it indicates that the time series passes the significance test at confidence levels of 90 %, 95 %, and 99 %, respectively. Using a two-tailed trend test, the critical value is obtained from the normal distribution table under a given significance level. When , the null hypothesis is accepted, indicating no significant trend; when , the null hypothesis is rejected, indicating a significant trend.
2.2.2 Estimation of E Sensitivity to VPD
Due to the complex bidirectional interactions between local background climate and varying E conditions across different scales, this study adopts a moving window strategy inspired by the “space-for-time” approach to calculate the sensitivity of E to VPD (Li et al., 2023b). The core assumption of this approach is that the target pixel and qualified neighboring pixels share broadly similar background climatic and surface conditions within a local window. Therefore, spatial differences in E and VPD among these screened pixels can be used to estimate the apparent local sensitivity of E to VPD (Li et al., 2024). This estimate should not be interpreted as a fully isolated causal effect of VPD, because local VPD gradients may still be influenced by mesoscale atmospheric dynamics, topography, land-sea contrasts, and other unresolved surface heterogeneity. To reduce these confounding effects, candidate pixels were retained only when they shared the same dominant MODIS land-cover type as the target pixel, differed by <10 % in dominant-type fractional cover, and had an elevation difference of <100 m from the target pixel.
This study applies a spatial moving-window strategy to estimate values (Zhao and Feng, 2024). All analyses were conducted on a common 0.1° grid, corresponding to the native spatial resolution of both the ERA5-Land VPD data and the GLEAM evaporation data used in this study. For each target pixel, candidate comparison samples were selected from surrounding pixels within a 5×5 grid-cell moving window, i.e., a neighborhood of 0.5°×0.5° centered on the target pixel. To reduce the influence of surface heterogeneity, only pixels sharing the same dominant land-cover type as the target pixel were retained, and the difference in dominant land-cover fraction was required to be less than 10 % according to the MODIS MCD12C1 land-cover product. In addition, pixels with an elevation difference greater than 100 m from the target pixel were excluded to minimize topographic effects. The sensitivity for each target pixel was then estimated from the relationship between E differences and VPD differences between all qualified neighboring pixels and the target pixel. In this procedure, the nonparametric Theil-Sen slope estimator was used to reduce the influence of skewed sample distributions and outliers.
Here x and y indicate the E and VPD differences; i and j are the geolocations of samples within the moving window. The unit of is mm hPa−1. Positive values indicate that E tends to be higher in locations with higher VPD within the local window, whereas negative values indicate that E tends to be lower in locations with higher VPD. The Theil-Sen slope estimator adopts the median value of a range of possible slopes and is therefore insensitive to statistical outliers.
2.2.3 Detrending and Partial Correlation Analysis
We analyzed the relationships between VPD and two evapotranspiration components, namely Et and Eb, at the pixel scale. We first calculated annual anomalies for each variable by removing the multi-year mean during 1981–2020. We then removed the linear trend from each anomaly series to focus on interannual variability (Zantout et al., 2025).
We used partial correlation analysis to quantify the relationship between VPD and Et or Eb after accounting for the effects of water supply (Li et al., 2026). For the VPD–Et analysis, we controlled for SMrz and Pre. For the VPD–Eb analysis, we controlled for SMs and Pre. We calculated the partial correlation coefficient for each pixel using a residual-based method (Rahmani et al., 2026). In this method, we first regressed VPD and the target evaporation component against the control variables, respectively. We then calculated the Pearson correlation coefficient between the two residual series. The partial correlation coefficient was expressed as:
where x is VPD, y is Et or Eb, and z is the set of control variables. ex and ey are the residuals after removing the effects of z. We calculated the associated p-value for each pixel and considered correlations with p<0.05 as statistically significant. The spatial distribution of statistically significant correlations was indicated by hatching in the corresponding correlation maps. We retained only pixels with at least 20 valid yearly observations. We also calculated the global annual mean series of VPD, E, Et, and Eb over valid land pixels for 1981–2020 to describe their interannual variability.
2.2.4 Threshold Detection Using Piecewise Linear Regression and Generalized Additive Models (GAM)
We used piecewise linear regression and GAM to examine the nonlinear relationship between VPD and E and to identify possible threshold behavior. Piecewise linear regression is useful when the relationship between two variables changes across different intervals of the predictor, because it can estimate both the breakpoint location and the slopes on each side of the breakpoint (Yu et al., 2024). GAMs are flexible regression models that can describe nonlinear relationships by fitting smooth functions to the predictor without imposing a fixed functional form (Brunner and Naveau, 2023).
We first removed extreme values to reduce the influence of outliers. For both VPD and E, values below the 1st percentile and above the 99th percentile were excluded. We then analyzed the VPD–E relationship at the global scale and within different climate dryness classes to assess regional differences in nonlinearity and threshold behavior. For the piecewise regression analysis, we treated VPD as the independent variable and E as the dependent variable. We tested both a one-breakpoint model and a two-breakpoint model. The one-breakpoint model can be written as:
where x is VPD, y is E, x0 is the breakpoint, k1 and k2 are the slopes before and after the breakpoint, and 1 is the intercept. The two-breakpoint model extends this form by allowing two turning points and three linear segments. This model was used to test whether the VPD–E relationship contains more than one transition point. We also fitted a GAM to the same data:
where f(x) is a smooth spline function of VPD, β0 is the intercept, and ϵ is the residual error. We used the GAM to provide an independent description of the nonlinear VPD–E relationship and to check whether the threshold-like behavior inferred from the piecewise models was robust.
We compared model performance using the coefficient of determination (R2), root mean square error (RMSE), and corrected Akaike information criterion (AICc) (Qiu et al., 2025). ΔAICc was used to evaluate whether the two-breakpoint model improved the fit relative to the one-breakpoint model. We then used the comparison among the one-breakpoint model, the two-breakpoint model, and the GAM to determine whether a single threshold was sufficient to describe the VPD–E relationship, or whether a more complex nonlinear form was needed. The GAM curve was also used as a reference to evaluate the stability of the breakpoint inferred from the piecewise regression.
2.2.5 Quantifying the Influence of VPD on E Under Multi-Factor Coupling Using Structural Equation Modeling (SEM)
To elucidate the direct and indirect pathways of VPD on E under the coupling effects of multiple factors, this study used SEM to quantify the path relationships among atmospheric moisture demand, water supply, vegetation state, energy availability, and evapotranspiration. SEM, as a multivariate statistical path analysis tool, is widely utilized in ecohydrological systems to identify and disentangle complex inter-variable relationships, enabling simultaneous estimation of direct effects of multiple independent variables on a dependent variable, indirect effects mediated through intervening variables, and total effects (Guo et al., 2025). Here, SEM was used to test whether the observed VPD–E relationships were consistent with coupled ecohydrological pathways.
The variables included E, VPD, SMrz, LAI, T, Pre, and SR. For each aridity zone, all variables were first spatially averaged to obtain monthly regional time series. Therefore, the unit of analysis was the monthly regional-mean anomaly within each aridity zone. The model data were based on multi-source remote sensing and reanalysis products from 1982 to 2020. To reduce confounding from the seasonal cycle, we removed the 1982–2020 climatological monthly mean from each monthly time series and then standardized the deseasonalized anomalies using z-scores. Separate SEMs were fitted for arid, semi-arid, semi-humid, and humid regions to account for the climatic dependence of VPD–E relationships.
During the model construction process, T, Pre, and SR were treated as exogenous climatic drivers because they directly regulate atmospheric moisture demand. SMrz was included as an intermediate water-supply variable influenced by atmospheric dryness and background climatic conditions. LAI was included as a vegetation-state variable jointly associated with atmospheric moisture demand, soil-water availability, and climatic controls. E was specified as the final response variable, jointly regulated by atmospheric moisture demand, root-zone soil moisture, vegetation state, temperature, precipitation, and surface solar radiation. Correlations among the exogenous climatic variables, including T, Pre, and SR, were allowed in the SEM to account for their covariation.
A restricted SEM excluding the direct statistical association between VPD and LAI was first tested. Directed-separation tests indicated that a residual association between VPD and LAI remained after controlling for SMrz, T, Pre, and SR. Therefore, this association was retained in the final SEM. However, it was interpreted as a statistical control pathway rather than direct evidence that elevated VPD physiologically promotes LAI development. We used the “piecewiseSEM” package to build the path model and extracted standardized path coefficients (Std.Estimate) using the “coefs” function. Indirect effects were calculated by multiplying standardized coefficients along each mediation pathway, and total effects were obtained by summing direct and indirect effects. Model diagnostics and model comparison between the restricted and full SEMs are summarized in Table S1. Fisher's C and AIC were used to diagnose the restricted SEMs. After retaining the residual VPD-LAI association, the final full SEMs became saturated models and therefore had no remaining independence claims for Fisher's C tests. Accordingly, the final SEM interpretation was based on standardized path coefficients, R2 values, effect decomposition, and AIC comparison between the restricted and full SEMs.
3.1 Spatiotemporal Patterns of VPD and E
From 1981 to 2020, terrestrial VPD increased markedly at the global scale (0.002 kPa yr−1), but with pronounced spatial heterogeneity (Fig. 1a). The strongest VPD increases were mainly observed in southwestern North America, central Africa, parts of Central Asia, and eastern Australia. Broad increases were also found across northern Eurasia and parts of East Asia (Fig. 1a). The global land monthly climatology showed a pronounced seasonal cycle, with mean VPD increasing from 0.65 kPa in January to a maximum of 1.18 kPa in July, followed by a gradual decline to 0.65 kPa in December (Fig. 1b).
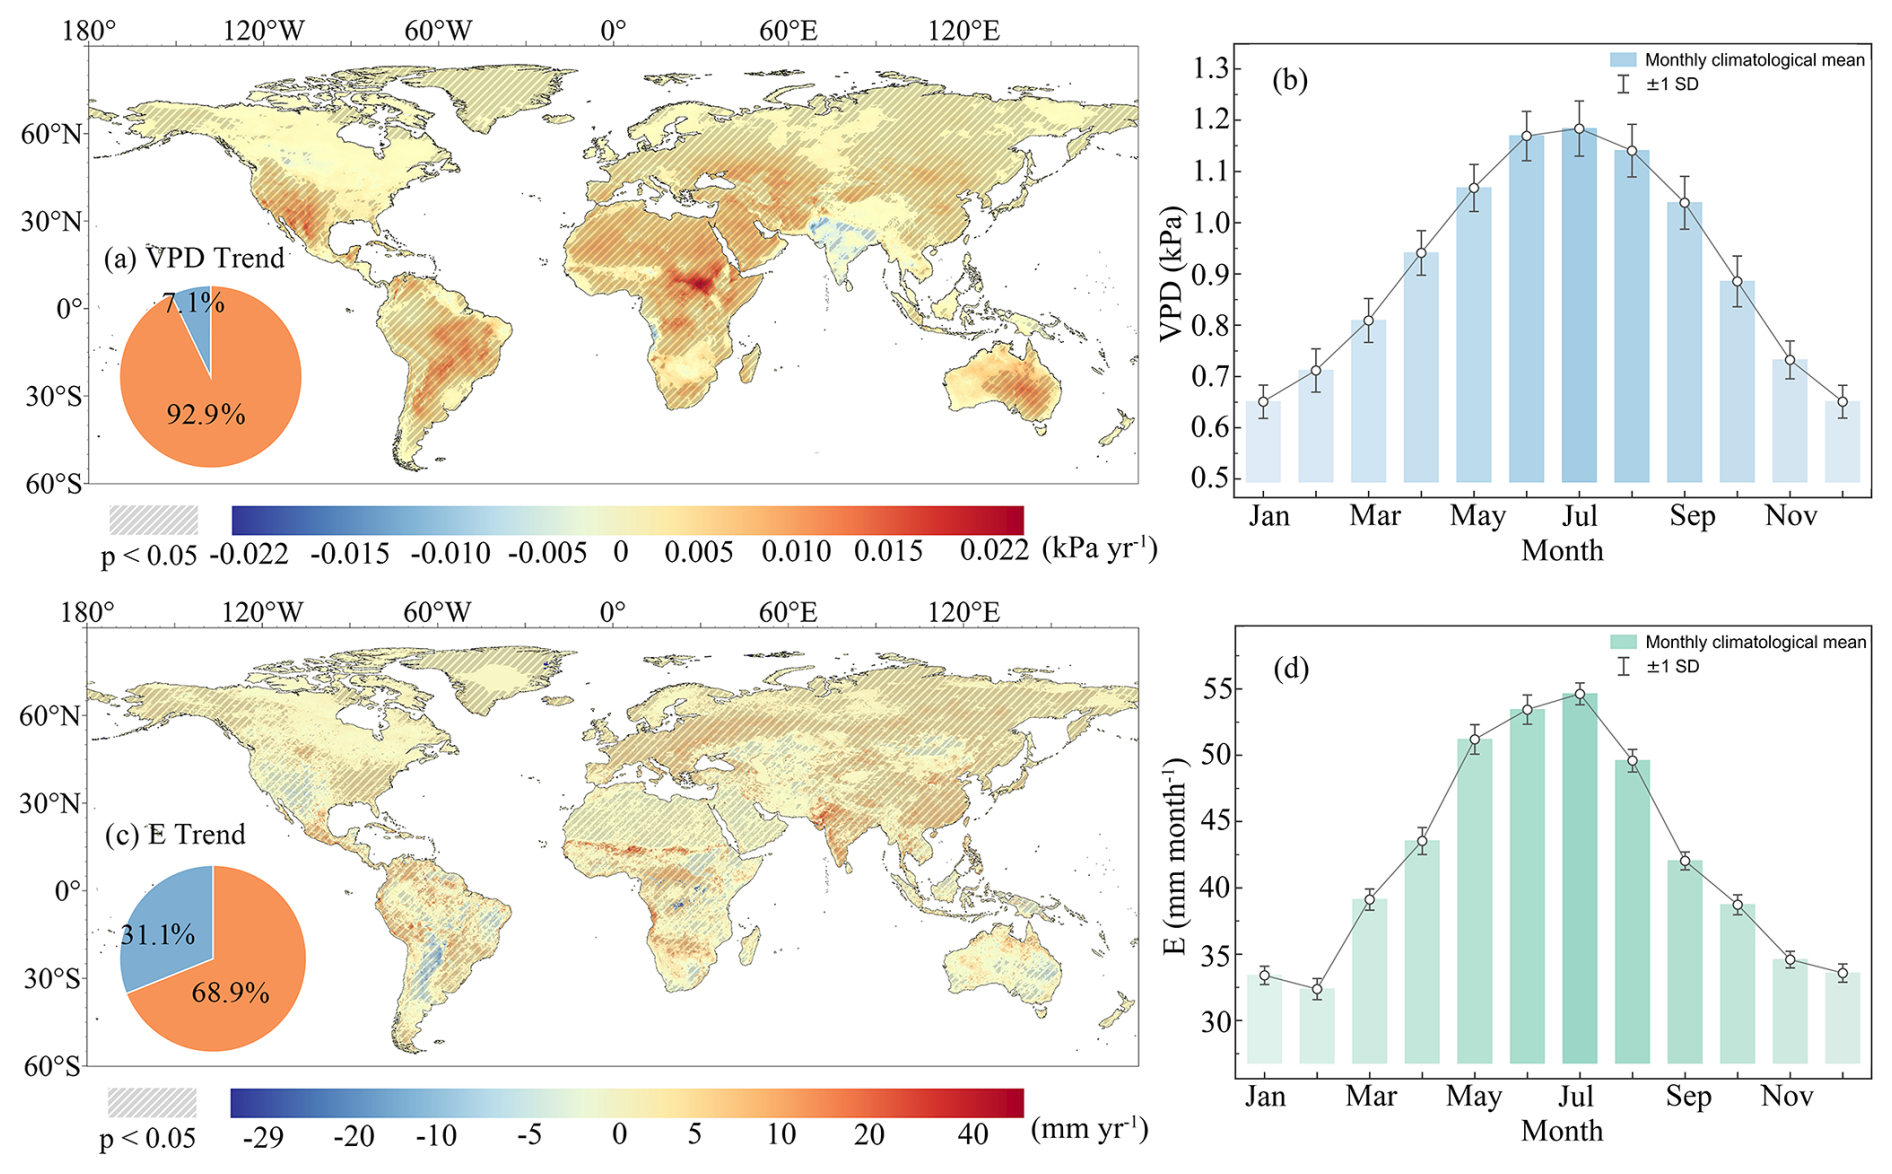
Figure 1Spatial trends and seasonal cycles of terrestrial VPD and E during 1981–2020. (a) Sen's slope of VPD. Red colors indicate increasing trends, and blue colors indicate decreasing trends. Hatched areas indicate trends significant at p<0.05. The inset shows the percentages of valid land pixels with positive and negative VPD trends. (b) Global land monthly climatology of VPD during 1981–2020. Bars represent the climatological monthly means, circles indicate the corresponding mean values, and error bars represent ±1 standard deviation (SD) across years. (c) Sen's slope of terrestrial E. Red colors indicate increasing trends, and blue colors indicate decreasing trends. Hatched areas indicate trends significant at p<0.05. The inset shows the percentages of valid land pixels with positive and negative E trends. (d) Global land monthly climatology of E during 1981–2020. Bars, circles, and error bars are defined as in (b). In the insets, orange indicates positive trends and blue indicates negative trends.
By contrast, terrestrial E showed a more spatially heterogeneous trend pattern (Fig. 1c). Positive trends occurred across 68.9 % of the valid land pixels, while 31.1 % showed negative trends. Increases in E were mainly observed in East Asia, northern Europe, and some high-latitude regions, whereas declines were concentrated in Africa, central South America, southwestern North America, and eastern Australia (Fig. 1c). The monthly climatology of E also exhibited a clear seasonal cycle, with the lowest mean value in February (32.4 mm per month) and the highest value in July (54.6 mm per month) (Fig. 1d). Comparison of the spatial trend patterns shows that some regions with pronounced VPD increases coincided with declining E, whereas E generally increased across many high-latitude regions despite relatively weaker VPD increases.
3.2 Global Terrestrial E Response to VPD
The apparent sensitivity of terrestrial E to VPD showed pronounced but spatially heterogeneous patterns at the global scale (Fig. 2a). Overall, 60.7 % of land areas exhibited positive apparent sensitivity to VPD, with a global mean sensitivity of 293.3±62.3 mm hPa−1 (mean ± spatial standard deviation). Here, denotes the moving-window-based apparent local sensitivity of E to VPD, rather than a regression-based interannual response. Spatially, negative sensitivity was concentrated mainly in arid and cold regions, whereas positive sensitivity dominated in relatively warm and humid regions (Fig. 2a). The climatic dependence of is shown in Fig. 2b. Negative or weak sensitivity occurred mainly under dry climate conditions, especially in warm and low-precipitation bins, whereas positive sensitivity became more widespread in wetter bins and in many cool-to-temperate bins. Overall, the apparent VPD–E relationship varied strongly along temperature and precipitation gradients, but the pattern did not indicate a simple response to temperature alone.
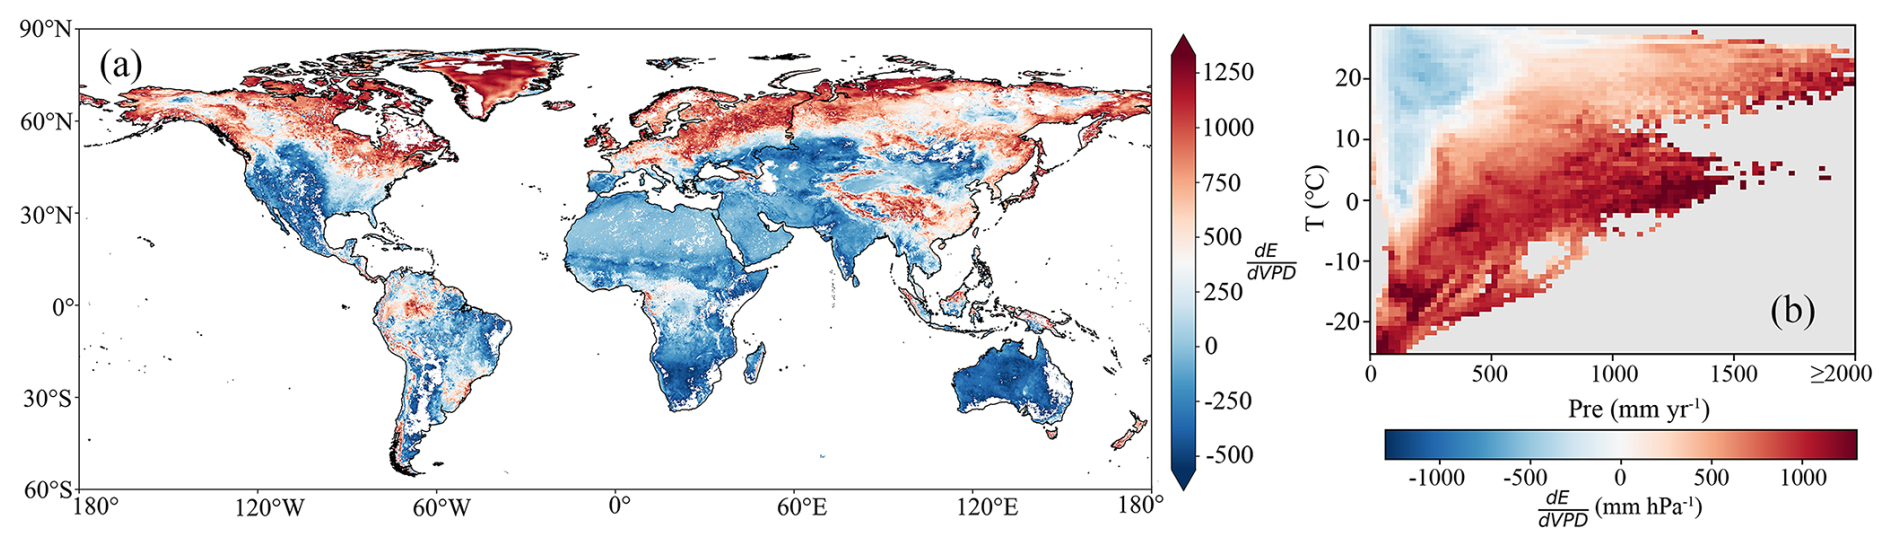
Figure 2Apparent sensitivity of terrestrial E to VPD during 1981–2020. (a) Spatial distribution of the sensitivity coefficient . Red colors indicate positive apparent sensitivity, and blue colors indicate negative apparent sensitivity. (b) Variation in across climate gradients. The x-axis represents mean annual precipitation during 1981–2020, and the y-axis represents mean annual air temperature during 1981–2020. Each climate bin contains valid land pixels within a given T-Pre range, and the color shows the area-weighted mean . Values with precipitation greater than 2000 mm yr−1 were included in the last precipitation bin. The unit of is mm hPa−1.
Across land-use types, we grouped the 16 original land-cover categories into four major classes consistent with Figs. 3 and S2: vegetation, grassland, cropland, and barren land. All classes generally showed positive apparent sensitivity to VPD, but with clear differences in magnitude. The vegetation class showed the strongest sensitivity (405.3 mm hPa−1), followed by grassland (342.3 mm hPa−1) and barren land (200.4 mm hPa−1), whereas cropland showed the weakest sensitivity (78.1 mm hPa−1). The latitudinal profiles further show that positive sensitivity was generally greater in vegetation and grassland than in cropland and barren land. Taken together, these results indicate that higher local VPD tended to be associated with higher E in densely vegetated regions under the moving-window estimate, while this apparent relationship was weaker in sparsely vegetated or managed cropland areas.
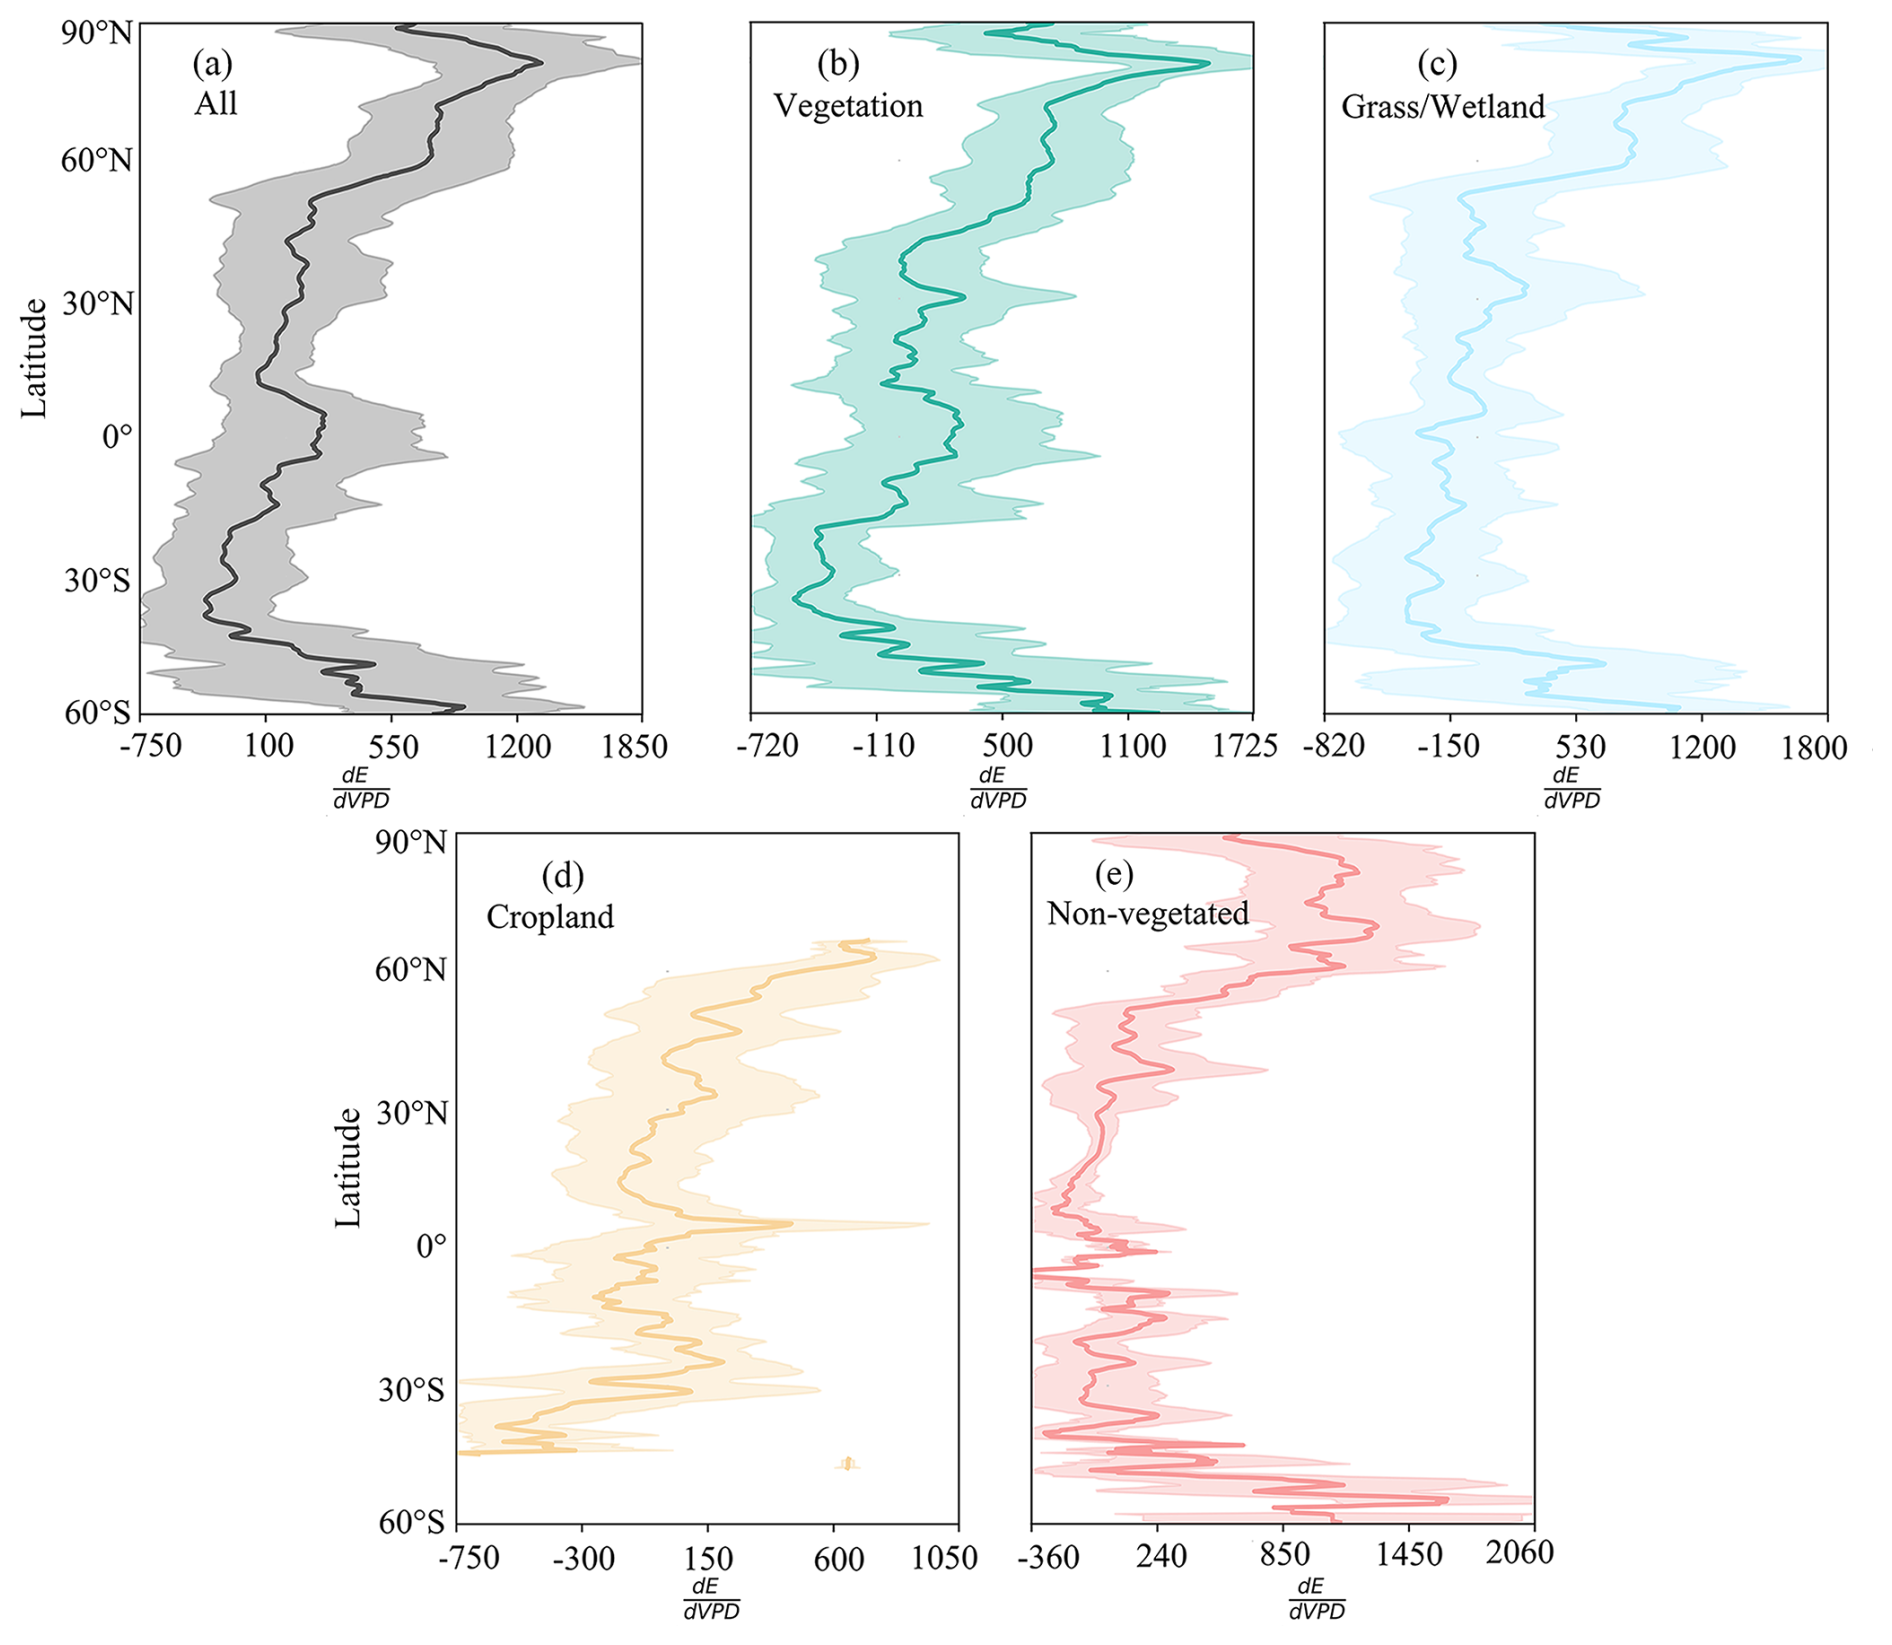
Figure 3Latitudinal distribution of the apparent sensitivity of terrestrial E to VPD during 1981–2020. Latitudinal profiles of are shown for all valid land pixels and different land-use classes. Solid lines represent the mean within each latitude band, and shaded areas represent the corresponding standard deviation. The unit of is mm hPa−1.
3.3 Global Patterns of the Relationships Between VPD and Et and Eb
VPD and total E both showed clear interannual variability during 1981–2020 (Fig. 4a, b). At the global scale, their annual mean series showed broadly consistent interannual variations, especially after 2000. Et showed relatively coherent interannual variations, whereas Eb exhibited stronger fluctuations (Fig. 4c, d).
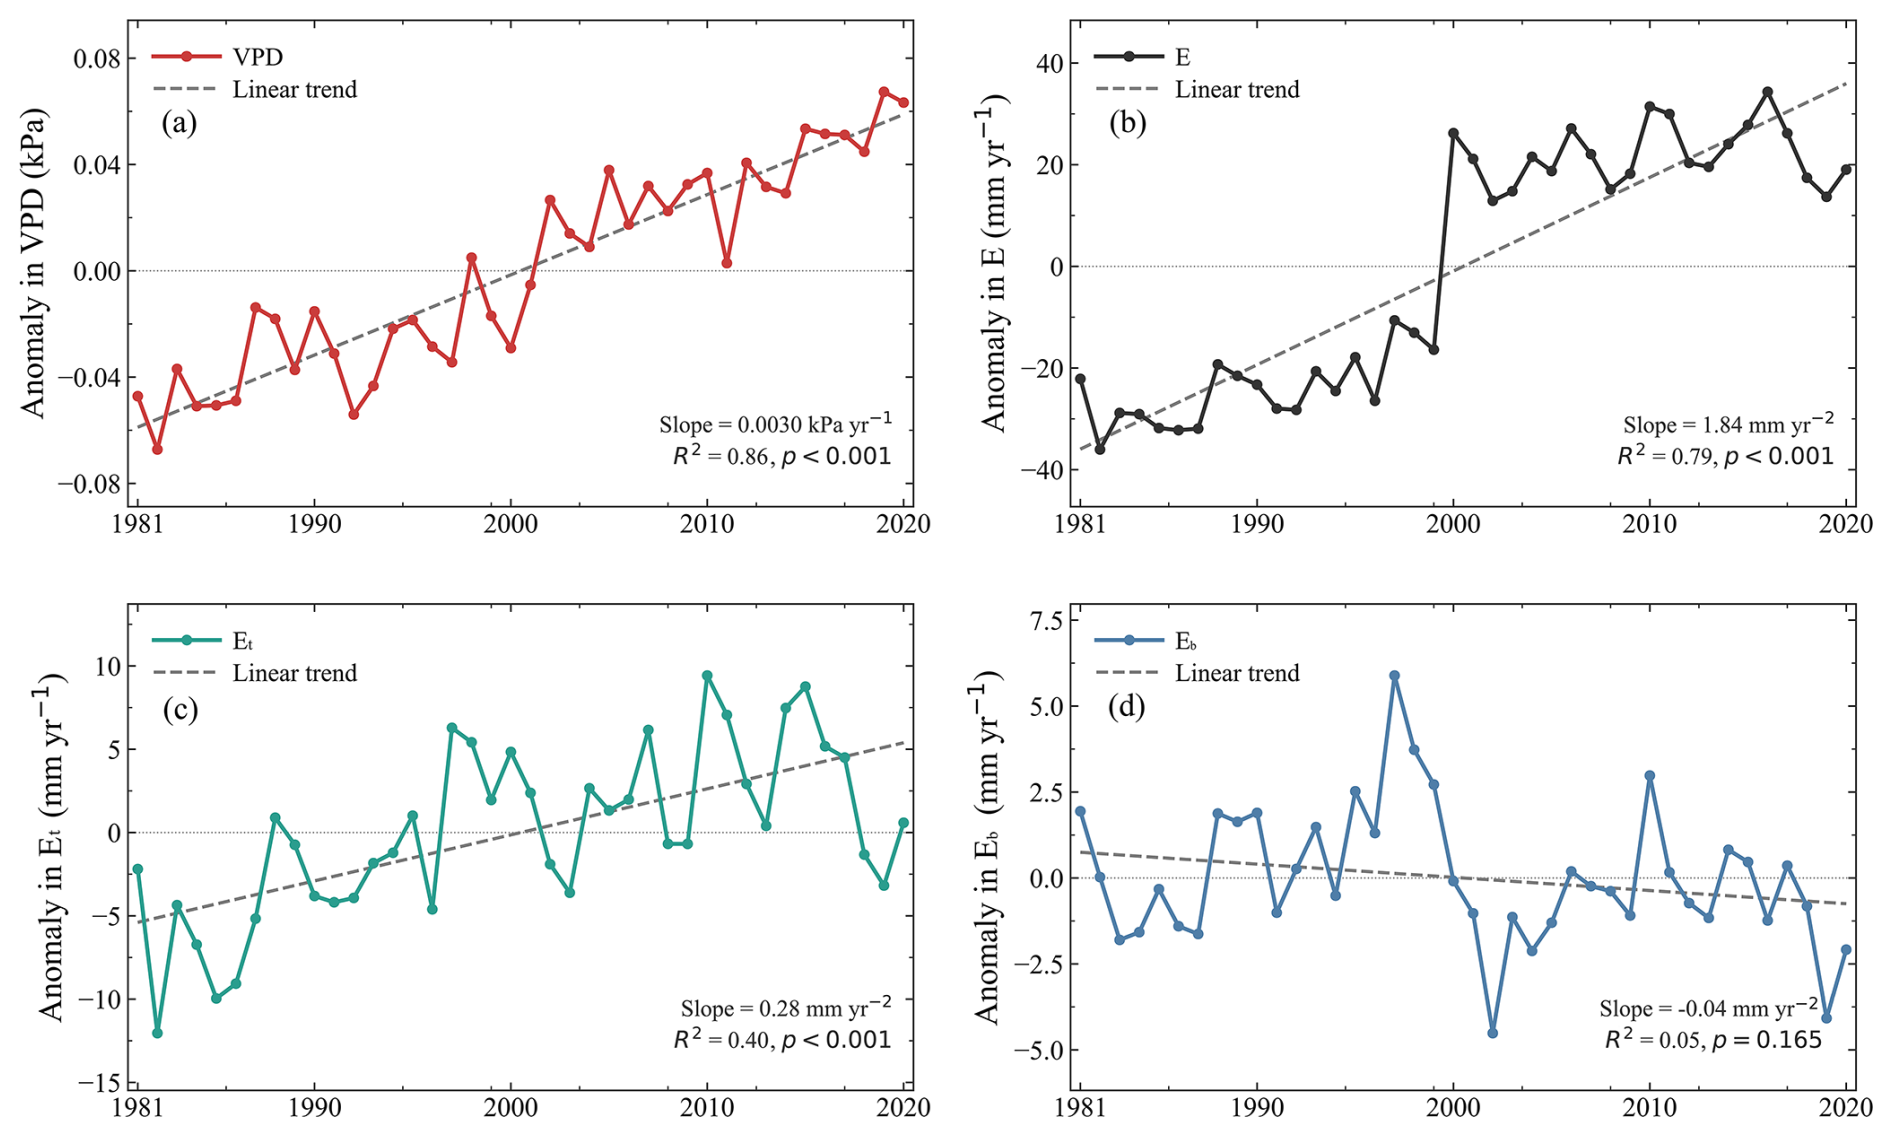
Figure 4Interannual variability of global mean annual anomalies of VPD and evapotranspiration components during 1981–2020. (a) Global mean annual anomaly of vapor pressure deficit (VPD). The dashed line indicates the linear trend. (b) Global mean annual anomaly of total evapotranspiration (E). The dashed line indicates the linear trend. (c) Global mean annual anomaly of transpiration (Et) over valid land pixels. The dashed line indicates the linear trend. (d) Global mean annual anomaly of bare-soil evaporation (Eb) over valid land pixels. The dashed line indicates the linear trend.
After controlling for SMrz and Pre, VPD showed mainly positive partial correlations with Et across global land areas (Fig. 5a). Significant positive correlations (p<0.05) were mainly distributed across the Northern Hemisphere, particularly in North America, Europe, and northern Asia. Positive partial correlations were observed in 65.8 % of valid pixels. Positive correlations also occurred in parts of East Asia, South America, and tropical regions, whereas negative correlations were limited and spatially scattered. Overall, after reducing the effects of water supply, VPD remained positively associated with Et across most land regions, especially in northern extratropical areas. After controlling for SMs and Pre, VPD showed a weaker relationship with Eb, with a more heterogeneous spatial pattern (Fig. 5b). Significant negative correlations (p<0.05) were mainly concentrated in dry and water-limited regions, including Australia, southern Africa, and parts of central Asia. Negative partial correlations were observed in 59.1 % of valid pixels. Negative correlations also appeared in other low-latitude and subtropical regions, while positive correlations occurred mainly in parts of Europe and East Asia with scattered distributions elsewhere.
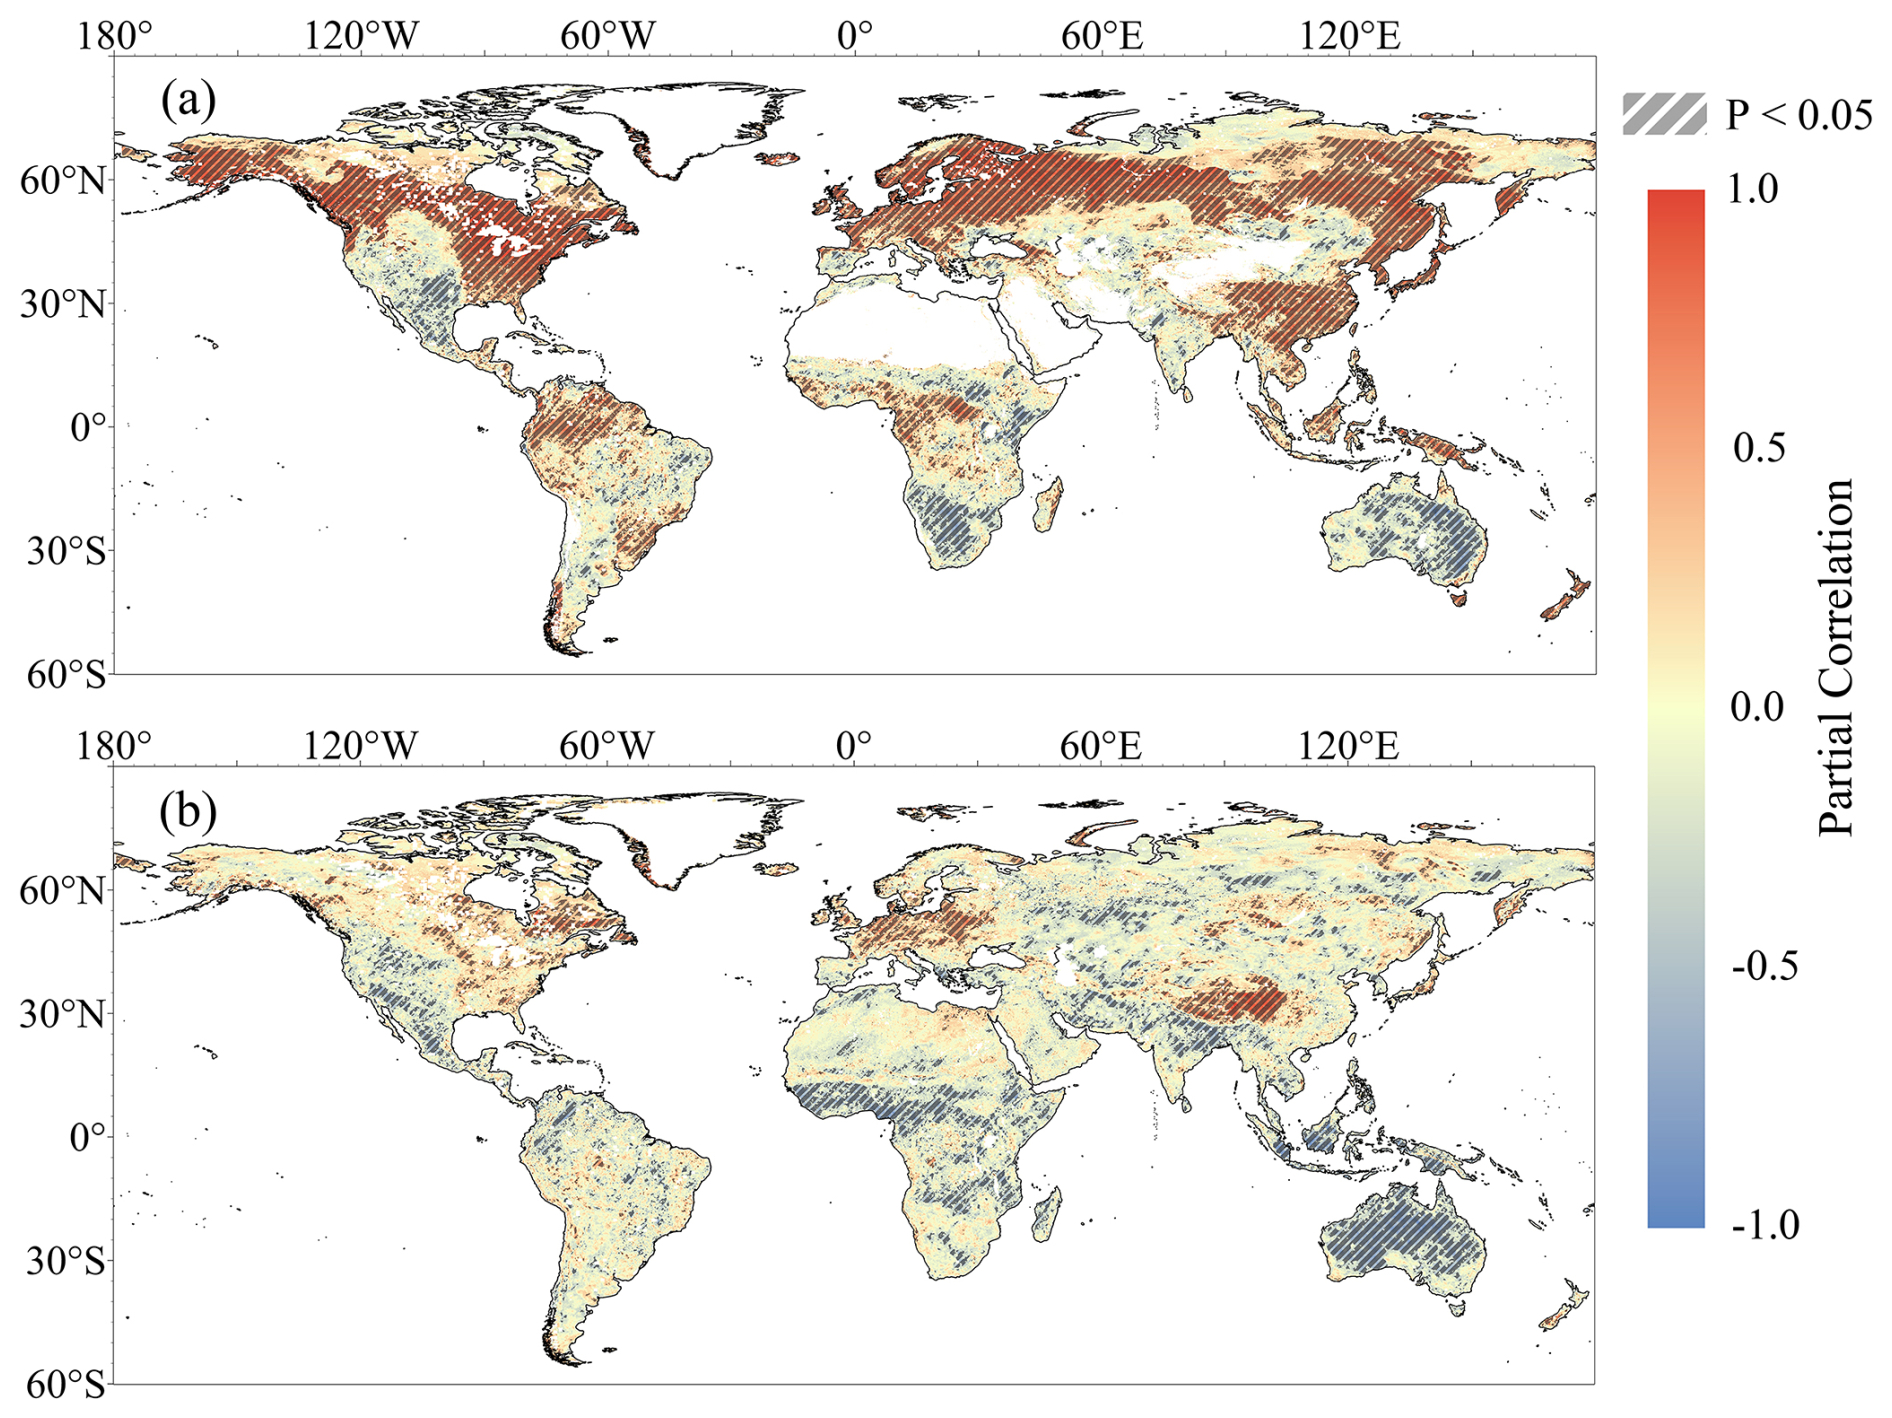
Figure 5Spatial partial correlations between VPD and evapotranspiration components during 1981–2020. (a) Spatial distribution of partial correlation coefficients between VPD and transpiration (Et) after controlling for root-zone soil moisture (SMrz) and precipitation (Pre). (b) Spatial distribution of partial correlation coefficients between VPD and bare-soil evaporation (Eb) after controlling for surface soil moisture (SMs) and precipitation (Pre). The partial correlations were calculated using detrended annual series, and hatched areas indicate regions with statistically significant correlations (p<0.05).
3.4 Threshold Effects and the Universality of Nonlinearity
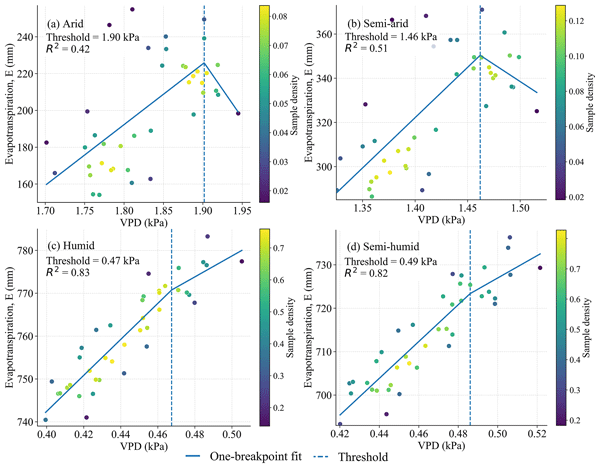
The nonlinear relationship between VPD and E varied clearly across AI-based aridity zones (Fig. 6). We compared the one-breakpoint piecewise model, the two-breakpoint piecewise model, and the GAM to identify the dominant transition points in the VPD–E relationship. The one-breakpoint model was used for the main threshold estimates because the two-breakpoint model did not show a clear improvement in model fit across the four aridity zones, based on ΔAICc values (Figs. S3 and S6). The GAM curves also showed similar nonlinear transition behavior, which supports the stability of the one-breakpoint estimates.
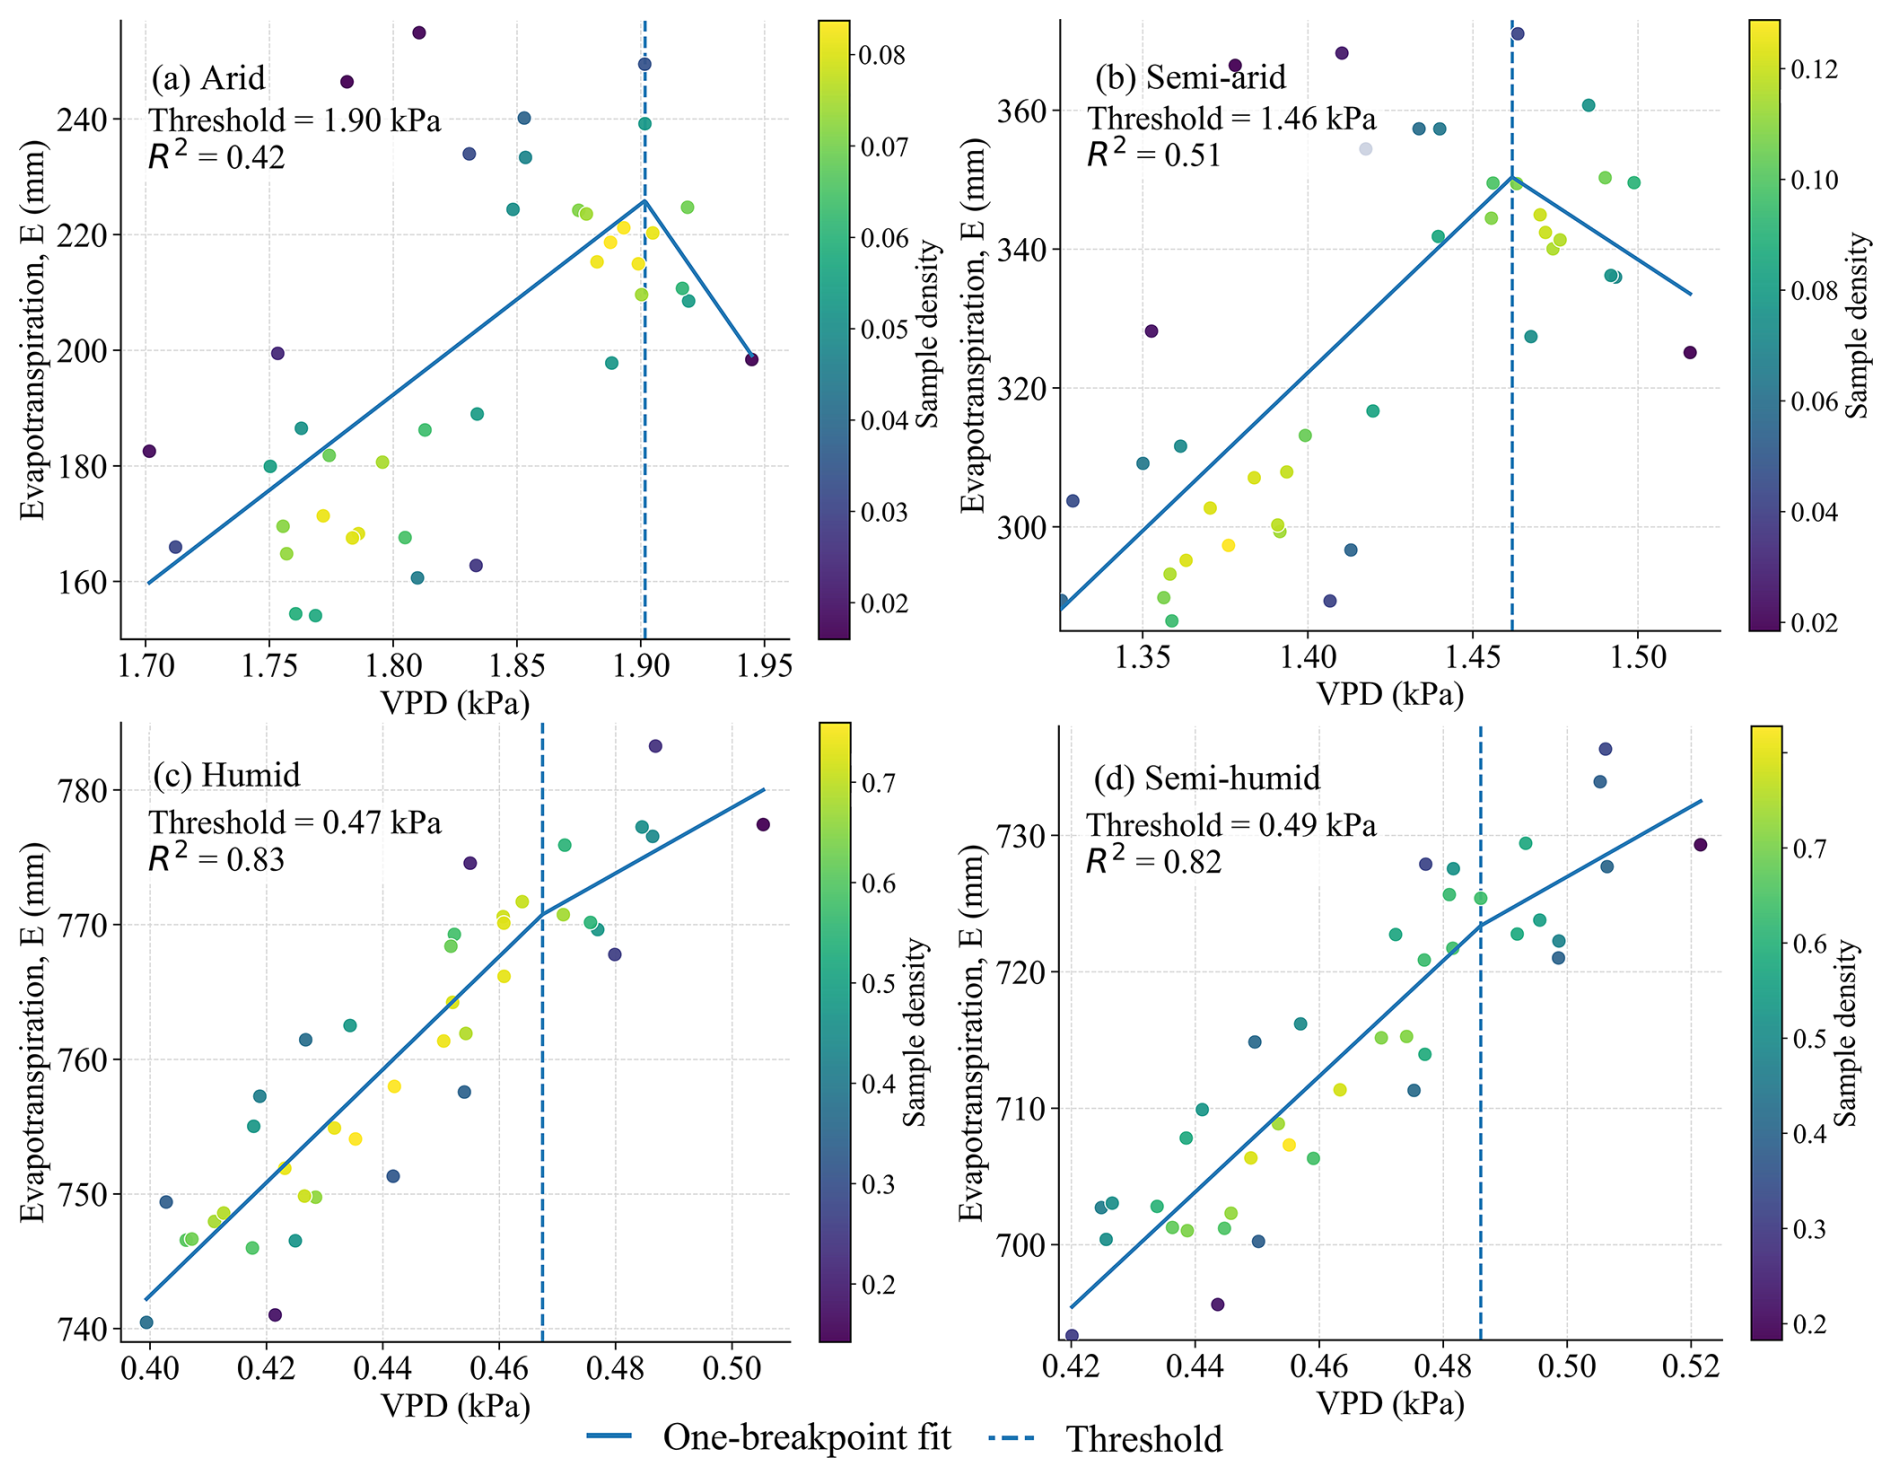
Figure 6Aridity-dependent thresholds in the nonlinear response of terrestrial evapotranspiration to vapor pressure deficit. (a–d) One-breakpoint piecewise fits between VPD and E for the arid, semi-arid, humid, and semi-humid aridity zones, respectively. Points show annual area-weighted means, coloured by sample density. Solid lines indicate fitted relationships, and dashed vertical lines indicate the estimated VPD transition points. The AI-based aridity zones are shown in Fig. S5.
The estimated thresholds showed a clear aridity gradient. The dominant transition point was highest in the arid zone (1.90 kPa), followed by the semi-arid zone (1.46 kPa). The thresholds were much lower in the semi-humid zone (0.49 kPa) and humid zone (0.47 kPa). These results show that the VPD–E relationship reached its main transition at higher VPD in dry regions but at lower VPD in wetter regions. Therefore, the thresholds reported here should be interpreted as dominant transition points in the observed nonlinear relationship, not as fixed ecological limits. The model comparison among the one-breakpoint model, two-breakpoint model, and GAM was used as a robustness check for the threshold estimates.
4.1 Ecohydrological Meaning of Aridity-Dependent VPD Thresholds
The aridity-dependent thresholds suggest that the relationship between VPD and E is jointly regulated by atmospheric water demand and land water supply. VPD can enhance E by increasing atmospheric evaporative demand, but this effect depends on whether sufficient water is available for soil evaporation and plant transpiration. When soil water becomes limited, higher VPD may no longer lead to further increases in E. Instead, it may intensify atmospheric drying and reinforce water limitation by accelerating soil moisture depletion and weakening land–atmosphere moisture feedbacks (Liu et al., 2020).
In arid and semi-arid regions, the higher thresholds indicate that the main transition in the VPD–E relationship tends to occur only under stronger atmospheric demand. This pattern is consistent with the fact that E in drylands is often constrained by water supply before atmospheric demand becomes the dominant control. Therefore, as water limitation intensifies, dry regions may show weak or even negative E responses to increasing VPD. Previous studies have also shown that changes in dryland aridity are controlled by multiple interacting factors, including precipitation, soil moisture, vegetation activity, and atmospheric demand, rather than by VPD alone (Lian et al., 2021). In humid and semi-humid regions, the lower thresholds indicate that the VPD–E relationship can shift at relatively lower VPD levels (Li et al., 2023a). These regions usually have greater water availability, allowing E to respond more directly to atmospheric demand. However, after the transition point, this response may weaken because vegetation regulation, stomatal adjustment, and declining near-surface humidity can limit further water loss. Vegetation responses to climate forcing also vary across hydroclimatic conditions, especially in humid, warm, and forested ecosystems (Gao et al., 2024; Zhou et al., 2019). Thus, the thresholds identified in this study should be interpreted as dominant transition points in the observed VPD–E relationship, rather than as fixed ecological boundaries. Their specific values may vary with vegetation type, soil water storage, climatic background, and the data products used.
4.2 Mechanisms of VPD Regulation of E Under Multi-Factor Coupling
The aridity-zone-specific SEM results indicate that VPD is statistically associated with variations in terrestrial E through linked atmospheric, soil-water, vegetation, and energy pathways. This relationship does not only reflect higher atmospheric water demand. It also depends on soil water supply, canopy state, and energy conditions. The SEM structure was built from known ecohydrological processes. The estimated paths were generally consistent with this process basis. VPD was negatively related to SMrz in all aridity zones, with standardized coefficients of −0.25, −0.61, −0.66, and −0.53 in arid, semi-arid, semi-humid, and humid regions, respectively (Fig. 7a–d). SMrz and LAI were generally positively related to E. These results suggest that soil water supply and canopy condition are important links between atmospheric drying and actual evapotranspiration. The SEM results should still be interpreted as aridity-zone-scale statistical pathways rather than direct causal effects at individual pixels. Because SEM relies on a predefined directional structure, the estimated pathways describe the relative associations among climatic, hydrological, vegetation, and energy factors within the specified framework, but do not explicitly represent reciprocal feedbacks among evapotranspiration, soil moisture, and atmospheric moisture. The restricted and full SEM comparison also supported the retention of the residual VPD-LAI association in the final model (Table S1).
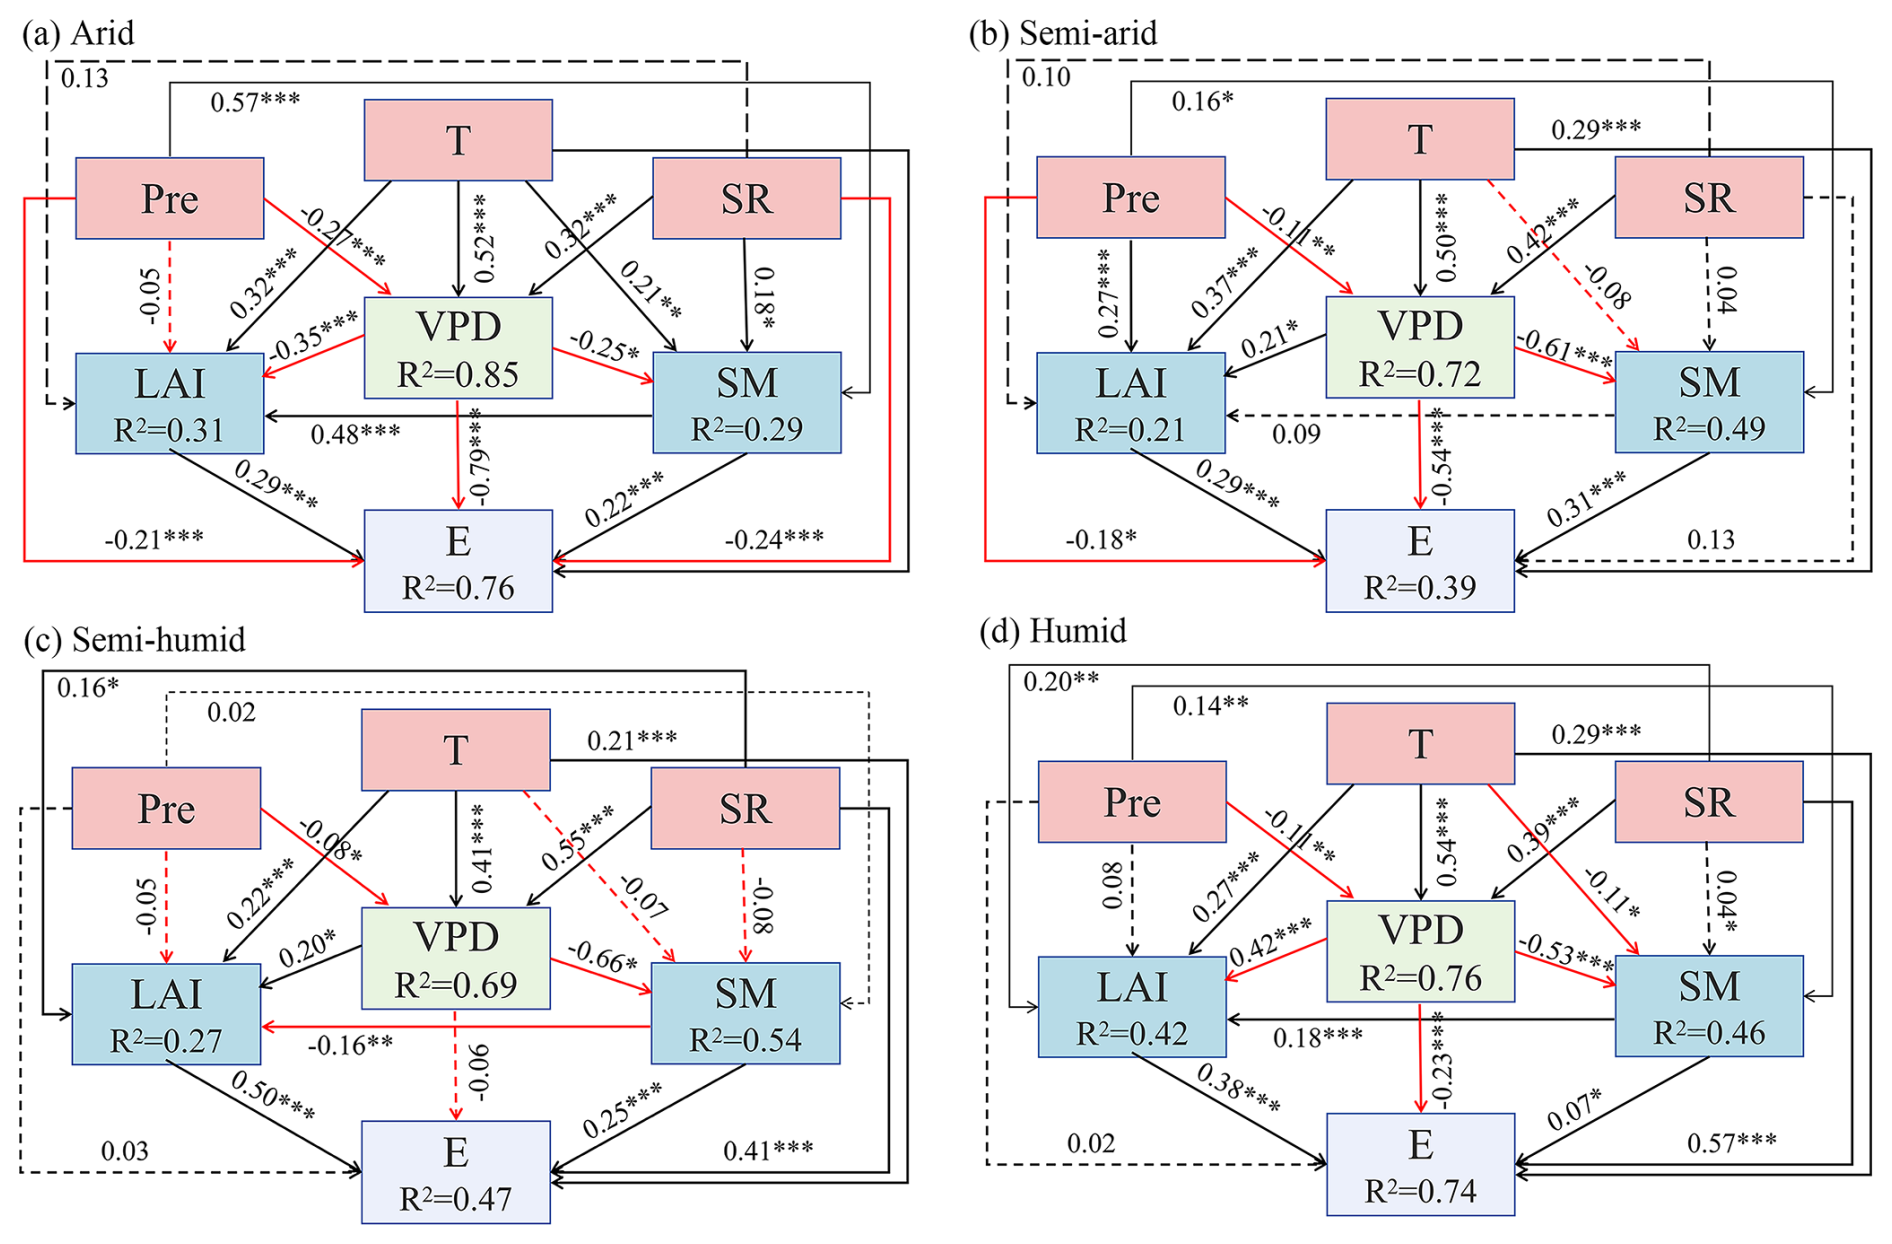
Figure 7Aridity-zone-specific structural equation models showing the pathways linking VPD and E under different hydroclimatic conditions. Panels show the SEM results for (a) arid, (b) semi-arid, (c) semi-humid, and (d) humid regions. Numbers on arrows indicate standardized path coefficients. Red and black arrows denote negative and positive path coefficients, respectively. Solid and dashed arrows indicate significant and non-significant pathways, respectively. Significance levels are denoted as p<0.05, p<0.01, and p<0.001. R2 values inside the boxes indicate the proportion of variance explained for each endogenous variable. Pre, precipitation; T, air temperature; SR, surface solar radiation; VPD, vapor pressure deficit; LAI, leaf area index; SM, root-zone soil moisture; E, evapotranspiration. The residual association between VPD and LAI was retained as a statistical control pathway and should not be interpreted as direct physiological evidence that elevated VPD promotes LAI development.
The direct pathway of VPD to E differed clearly among aridity zones. The effect was strongest and negative in arid regions (standardized coefficient = −0.79; Fig. 7a). It was also strongly negative in semi-arid regions (standardized coefficient = −0.55; Fig. 7b). The effect became weak and non-significant in semi-humid regions (standardized coefficient = −0.06; Fig. 7c). The effect was weaker but still negative in humid regions (standardized coefficient = −0.23; Fig. 7d). This pattern suggests that the remaining direct VPD path may represent statistical associations related to atmospheric drying stress and vegetation regulation after T, Pre, SR, SMrz, and LAI are included in the model. This path should not be read only as the effect of higher evaporative demand (Wang et al., 2025c). In water-limited regions, higher VPD can increase atmospheric water demand and also increase plant and soil water stress. These combined effects may constrain actual E when soil water availability is limited. Previous studies also reported that E responses to VPD depend on soil moisture, plant water regulation, and background dryness (Massmann et al., 2019; Zhang et al., 2023).
The effect decomposition further supports this climate-dependent mechanism (Fig. S6). The total effect of VPD on E was negative in all aridity zones. The negative effect was strongest in arid and semi-arid regions (standardized total effect = −0.96 and −0.69). The effect was much weaker in semi-humid and humid regions (standardized total effect = −0.06 and −0.14). The overall indirect effect of VPD on E also varied among aridity zones. It was negative in arid, semi-arid, and semi-humid regions (standardized indirect effect = −0.17, −0.14, and −0.01), but it became positive in humid regions (standardized indirect effect = 0.08). This positive indirect effect in humid regions likely reflects compensation from LAI-related and energy-related pathways. LAI had positive effects on E in all aridity zones, especially in semi-humid and humid regions (standardized coefficient = 0.50 and 0.38; Fig. 5c, d). However, the positive remaining relation between VPD and LAI in wetter regions should not be read as evidence that higher VPD directly promotes vegetation growth (Yuan et al., 2019). It more likely reflects remaining co-variation among atmospheric dryness, radiation, temperature, and vegetation activity after soil water and climate factors are controlled (Zhang et al., 2021). Overall, VPD regulation of E is climate dependent. Its main mechanism lies in the joint effects of higher atmospheric water demand, limited soil water supply, canopy state, and energy conditions.
4.3 Implications of land–atmosphere Feedback Under Future VPD Increase Scenarios
The projected increase in VPD is expected to further influence land–atmosphere interactions by modifying terrestrial E, with potential consequences for regional to global water cycling (Yuan et al., 2019). In the AI-based aridity zones, the threshold analysis shows clear differences in how E may respond under future VPD increase. In the arid and semi-arid regions, the one-breakpoint thresholds are high (1.90 and 1.46 kPa, respectively). This interpretation is consistent with the negative areas shown in Fig. 2a and with the Aridity-zone-specific SEM results, which showed negative statistical associations between VPD and SMrz across all aridity zones, especially in semi-arid and semi-humid regions. These results suggest that high VPD may be associated with stronger water limitation in dry regions, which may constrain E.
In the humid and semi-humid regions, the thresholds are much lower (0.47 and 0.49 kPa, respectively). This result suggests that ecosystems in wetter regions may reach the response transition under much lower VPD. These regions may therefore experience earlier response transitions as atmospheric dryness continues to increase, even though E can still rise with VPD over part of the observed range (Fig. 2a). This contrast suggests that future VPD increases may lead to different responses among climate zones, with humid and semi-humid regions potentially reaching response transitions earlier, while dry regions may experience stronger E suppression once water limitation dominates. Such differences may influence ecosystem vulnerability and alter water and carbon cycling, especially in forests and water-limited agricultural systems (Gentine et al., 2019; Will et al., 2013).
Collectively, the sustained rise in VPD may modify land–atmosphere interactions and introduce additional uncertainties into global water and carbon cycling (Gentine et al., 2019). Climate models and risk assessments should therefore better represent the threshold differences among arid, semi-arid, semi-humid, and humid regions. These threshold differences also imply that adaptation measures should be region-specific. Semi-humid and humid regions may need earlier warning because of their lower thresholds, while arid regions require stronger water-management measures under chronic water limitation. Targeted water resource management and ecological conservation measures are therefore needed to strengthen ecosystem resilience and reduce the ecological risks associated with rising VPD.
4.4 Uncertainties and Future Outlook
Data uncertainty remains an important limitation in this study. First, our analysis relies on ERA5-Land reanalysis and global E products. Although ERA5-Land provides broadly consistent land-surface variables, it may still contain uncertainties in soil moisture, especially in arid regions. This uncertainty can affect the inferred VPD–SMrz–E coupling. This issue is relevant to our SEM because VPD was negatively related to SMrz across all aridity zones. If soil moisture is biased in dry regions, the estimated strength of the SMrz-mediated pathway may also be affected. In this case, part of the VPD effect on E may be attributed differently between the direct VPD–E path and the indirect pathway through SMrz. Second, currently available E products still show substantial discrepancies in long-term means, temporal trends, and spatial patterns. Multi-product assessments have shown that annual E estimates can differ by nearly 50 % across products, with even larger disagreement in regional trends. In addition, the partitioning of total E into transpiration, interception evaporation, and soil evaporation remains highly uncertain among products, which may further affect the estimated magnitude and pathways of VPD regulation. Recent evidence also suggests that biases in E trends can propagate into simulations of near-surface humidity decline and atmospheric drying, implying that E uncertainty can influence not only flux estimates themselves but also the interpretation of land–atmosphere feedbacks. Therefore, the quantitative results reported here should be interpreted with caution, as they remain constrained by differences in input data quality, product algorithms, and E component partitioning schemes. Methodological uncertainty also deserves attention. In this study, threshold estimates describe the main transition in the observed VPD–E relationship but should not be treated as exact ecological thresholds. Their values may be affected by model choice and data uncertainty. In addition, the SEM framework represents directional statistical pathways and does not explicitly capture bidirectional land–atmosphere feedbacks among E, soil moisture, and atmospheric moisture. Future work should use more observations and more flexible nonlinear methods to better constrain the threshold behavior of E under rising VPD.
This study used multi-source remote sensing and reanalysis data from 1981 to 2020 to examine how global terrestrial E responds to VPD. The results show that terrestrial VPD increased widely during the study period, with positive trends in 92.9 % of global land areas. In contrast, changes in E were more spatially uneven. Global mean E increased only slightly, and many regions with rapid VPD increases showed declining E, especially in water-limited areas. At the global scale, the apparent response of E to VPD showed clear spatial differences. About 60.7 % of land areas showed positive apparent sensitivity to VPD, with a global mean sensitivity of 293.3±62.3 mm hPa−1. Positive sensitivity was mainly found in warm and humid regions, while negative sensitivity was mainly concentrated in arid and cold regions. Across land-use types, the vegetation class showed the strongest apparent sensitivity, while cropland showed the weakest response. At the component level, VPD remained mainly positively related to transpiration after controlling for precipitation and soil moisture, but its relationship with bare-soil evaporation was weaker and more often negative in water-limited regions. The VPD–E relationship also showed clear nonlinear behavior across aridity zones. The dominant transition points were higher in arid and semi-arid regions, but much lower in semi-humid and humid regions. This pattern shows that long-term climate dryness strongly shapes the way E responds to rising VPD. The Aridity-zone-specific SEM results further show that VPD regulates E through linked atmospheric, soil-water, vegetation, and energy pathways. VPD was negatively related to root-zone soil moisture in all aridity zones, and its total effect on E was negative across all aridity zones, with stronger negative effects in arid and semi-arid regions. Overall, this study shows that the influence of VPD on terrestrial E is widespread but not uniform. Its effect depends on climate background, land-use type, evaporation component, soil water supply, canopy state, and energy conditions. These results improve the understanding of how rising atmospheric dryness may affect future land–atmosphere interactions and the global water cycle.
The code used for data processing and analysis in this study is available from the corresponding author upon reasonable request.
The GLEAM v4.2a dataset can be accessed at https://www.gleam.eu/ (last access: 10 July 2025). ERA5-Land data can be downloaded from https://cds.climate.copernicus.eu/ (last access: 8 July 2025). The CRU TS v4.09 dataset is available from the Climatic Research Unit data portal. The P-LSHv2 evapotranspiration dataset is available from the corresponding published repository. The MCD12C1 v6.1 land-cover product can be accessed through the Google Earth Engine platform (https://earthengine.google.com/, last access: 3 June 2025). The GIMMS LAI V1.2 dataset is available from https://doi.org/10.5281/zenodo.8281930 (Cao et al., 2023b). The WorldClim elevation dataset can be downloaded from https://worldclim.org/ (last access: 19 May 2025). All data used in this study are publicly available from the corresponding data portals or references.
The supplement related to this article is available online at https://doi.org/10.5194/hess-30-6249-2026-supplement.
YM conceived the study and wrote the initial draft. YW and JY developed the software and curated the data. EH contributed to the methodology. QW was responsible for visualization. YG conducted the investigation. WL performed validation. ZL assisted with software development. GZ reviewed and edited the manuscript. All authors contributed to the interpretation of results and approved the final version of the paper.
The contact author has declared that none of the authors has any competing interests.
Publisher's note: Copernicus Publications remains neutral with regard to jurisdictional claims made in the text, published maps, institutional affiliations, or any other geographical representation in this paper. The authors bear the ultimate responsibility for providing appropriate place names. Views expressed in the text are those of the authors and do not necessarily reflect the views of the publisher.
We are grateful to the editor and the anonymous reviewers for their constructive comments and suggestions, which greatly improved the quality of this manuscript.
This research was financially supported by the National Natural Science Foundation of China (grant no. 42371040), the Western Light Young Scholars Program of the Chinese Academy of Sciences (grant no. 25JR6KA001), the Key Natural Science Foundation of Gansu Province (grant no. 23JRRA698), the Key Research and Development Program of Gansu Province (grant no. 22YF7NA122), the Cultivation Program of Major key projects of Northwest Normal University (grant no. NWNU-LKZD-202302), the Oasis Scientific Research achievements Breakthrough Action Plan Project of Northwest Normal University (grant no. NWNU-LZKX-202303).
This paper was edited by Adriaan J. (Ryan) Teuling and reviewed by Vagner Ferreira and one anonymous referee.
Bai, H., Zhong, Y., Ma, N., Kong, D., Mao, Y., Feng, W., Wu, Y., and Zhong, M.: Changes and drivers of long-term land evapotranspiration in the Yangtze River Basin: A water balance perspective, J. Hydrol., 653, 132763, https://doi.org/10.1016/j.jhydrol.2025.132763, 2025.
Brunner, M. I. and Naveau, P.: Spatial variability in Alpine reservoir regulation: deriving reservoir operations from streamflow using generalized additive models, Hydrol. Earth Syst. Sci., 27, 673–687, https://doi.org/10.5194/hess-27-673-2023, 2023.
Cao, S., Li, M., Zhu, Z., Wang, Z., Zha, J., Zhao, W., Duanmu, Z., Chen, J., Zheng, Y., Chen, Y., Myneni, R. B., and Piao, S.: Spatiotemporally consistent global dataset of the GIMMS leaf area index (GIMMS LAI4g) from 1982 to 2020, Earth Syst. Sci. Data, 15, 4877–4899, https://doi.org/10.5194/essd-15-4877-2023, 2023a.
Cao, S., Li, M., Zhu, Z., Wang, Z., Zha, J., Zhao, W., Duanmu, Z., Chen, J., Zheng, Y., Chen, Y., Myneni, R. B., and Piao, S.: Spatiotemporally consistent global dataset of the GIMMS Leaf Area Index (GIMMS LAI4g) from 1982 to 2020 (V1.2) (Version V1.2), Zenodo [data set], https://doi.org/10.5281/zenodo.8281930, 2023b.
Chai, Y., Yue, Y., Slater, L., and Miao, C.: Emergent constraints indicate slower increases in future global evapotranspiration, npj Clim. Atmos. Sci., 8, 46, https://doi.org/10.1038/s41612-025-00932-1, 2025.
Chen, N., Zhang, Y., Yuan, F., Song, C., Xu, M., Wang, Q., Hao, G., Bao, T., Zuo, Y., Liu, J., Zhang, T., Song, Y., Sun, L., Guo, Y., Zhang, H., Ma, G., Du, Y., Xu, X., and Wang, X.: Warming-induced vapor pressure deficit suppression of vegetation growth diminished in northern peatlands, Nat. Commun., 14, 7885, https://doi.org/10.1038/s41467-023-42932-w, 2023.
Copernicus Climate Change Service: ERA5-Land monthly averaged data from 1950 to present, Copernicus Climate Change Service (C3S), Climate Data Store (CDS) [data set], https://doi.org/10.24381/CDS.68D2BB30, 2019.
Duque-Gardeazabal, N., Friedman, A. R., and Brönnimann, S.: An Atlantic influence on evapotranspiration in the Orinoco and Amazon basins, Hydrol. Earth Syst. Sci., 29, 3277–3295, https://doi.org/10.5194/hess-29-3277-2025, 2025.
Feng, J., Zhang, K., Chao, L., Zhan, H., and Li, Y.: P-LSHv2: a multi-decadal global daily evapotranspiration dataset enhanced with explicit soil moisture constraints, Earth Syst. Sci. Data, 17, 5039–5064, https://doi.org/10.5194/essd-17-5039-2025, 2025.
Fick, S. E. and Hijmans, R. J.: WorldClim 2: new 1-km spatial resolution climate surfaces for global land areas, Int. J. Climatol., 37, 4302–4315, https://doi.org/10.1002/joc.5086, 2017.
Friedl, M. and Sulla-Menashe, D.: MODIS/Terra + Aqua Land Cover Type Yearly L3 Global 0.05Deg CMG V061, NASA EOSDIS Land Processes DAAC [data set], https://doi.org/10.5067/MODIS/MCD12C1.061, 2022.
Gao, X., Zhuo, W., and Gonsamo, A.: Humid, Warm and Treed Ecosystems Show Longer Time-Lag of Vegetation Response to Climate, Geophys. Res. Lett., 51, e2024GL111737, https://doi.org/10.1029/2024GL111737, 2024.
Gentine, P., Green, J. K., Guérin, M., Humphrey, V., Seneviratne, S. I., Zhang, Y., and Zhou, S.: Coupling between the terrestrial carbon and water cycles – a review, Environ. Res. Lett., 14, 083003, https://doi.org/10.1088/1748-9326/ab22d6, 2019.
Guo, M., Yang, L., Zhang, L., Shen, F., Meadows, M. E., and Zhou, C.: Hydrology, vegetation, and soil properties as key drivers of soil organic carbon in coastal wetlands: A high-resolution study, Environmental Science and Ecotechnology, 23, 100482, https://doi.org/10.1016/j.ese.2024.100482, 2025.
Hermann, M., Wernli, H., and Röthlisberger, M.: Drastic increase in the magnitude of very rare summer-mean vapor pressure deficit extremes, Nat. Commun., 15, 7022, https://doi.org/10.1038/s41467-024-51305-w, 2024.
Hsu, H. and Dirmeyer, P. A.: Nonlinearity and Multivariate Dependencies in the Terrestrial Leg of Land-Atmosphere Coupling, Water Resour. Res., 57, e2020WR028179, https://doi.org/10.1029/2020WR028179, 2021.
Kim, Y. and Johnson, M. S.: Deciphering the role of evapotranspiration in declining relative humidity trends over land, Commun. Earth Environ., 6, 105, https://doi.org/10.1038/s43247-025-02076-9, 2025.
Kumagai, T., Yoshifuji, N., Tanaka, N., Suzuki, M., and Kume, T.: Comparison of soil moisture dynamics between a tropical rain forest and a tropical seasonal forest in Southeast Asia: Impact of seasonal and year-to-year variations in rainfall, Water Resour. Res., 45, 2008WR007307, https://doi.org/10.1029/2008WR007307, 2009.
Lebrija-Trejos, E., Hernández, A., and Wright, S. J.: Effects of moisture and density-dependent interactions on tropical tree diversity, Nature, 615, 100–104, https://doi.org/10.1038/s41586-023-05717-1, 2023.
Li, F., Xiao, J., Chen, J., Ballantyne, A., Jin, K., Li, B., Abraha, M., and John, R.: Global water use efficiency saturation due to increased vapor pressure deficit, Science, 381, 672–677, https://doi.org/10.1126/science.adf5041, 2023a.
Li, T., He, B., Chen, D., Chen, H. W., Guo, L., Yuan, W., Fang, K., Shi, F., Liu, L., Zheng, H., Huang, L., Wu, X., Hao, X., Zhao, X., and Jiang, W.: Increasing Sensitivity of Tree Radial Growth to Precipitation, Geophys. Res. Lett., 51, e2024GL110003, https://doi.org/10.1029/2024GL110003, 2024.
Li, Y., Li, Z.-L., Wu, H., Zhou, C., Liu, X., Leng, P., Yang, P., Wu, W., Tang, R., Shang, G.-F., and Ma, L.: Biophysical impacts of earth greening can substantially mitigate regional land surface temperature warming, Nat. Commun., 14, 121, https://doi.org/10.1038/s41467-023-35799-4, 2023b.
Li, Z., Li, Y., Qin, Y., Liu, L., Bach, E., Armstrong, A., Li, G., Li, M., Wang, Z., Bai, Y., and Chen, Z.: National assessment reveals widespread wind farm impacts on land surface temperature and vegetation in China, Geography and Sustainability, 100460, https://doi.org/10.1016/j.geosus.2026.100460, 2026.
Lian, X., Piao, S., Chen, A., Huntingford, C., Fu, B., Li, L. Z. X., Huang, J., Sheffield, J., Berg, A. M., Keenan, T. F., McVicar, T. R., Wada, Y., Wang, X., Wang, T., Yang, Y., and Roderick, M. L.: Multifaceted characteristics of dryland aridity changes in a warming world, Nat. Rev. Earth Environ., 2, 232–250, https://doi.org/10.1038/s43017-021-00144-0, 2021.
Lin, X., Zhang, S., Zhao, X., Li, R., Wang, S., Yang, L., and Chen, X.: Global thresholds for the climate-driven effects of vegetation restoration on runoff and soil erosion, J. Hydrol., 647, 132374, https://doi.org/10.1016/j.jhydrol.2024.132374, 2025.
Liu, Y., Kumar, M., Katul, G. G., Feng, X., and Konings, A. G.: Plant hydraulics accentuates the effect of atmospheric moisture stress on transpiration, Nat. Clim. Change, 10, 691–695, https://doi.org/10.1038/s41558-020-0781-5, 2020.
Mann, H. B.: Nonparametric Tests Against Trend, Econometrica, 13, 245, https://doi.org/10.2307/1907187, 1945.
Massmann, A., Gentine, P., and Lin, C.: When Does Vapor Pressure Deficit Drive or Reduce Evapotranspiration?, J. Adv. Model. Earth Sy., 11, 3305–3320, https://doi.org/10.1029/2019MS001790, 2019.
Mauder, M., Jung, M., Stoy, P., Nelson, J., and Wanner, L.: Energy balance closure at FLUXNET sites revisited, Agr. Forest Meteorol., 358, 110235, https://doi.org/10.1016/j.agrformet.2024.110235, 2024.
Miner, G. L., Bauerle, W. L., and Baldocchi, D. D.: Estimating the sensitivity of stomatal conductance to photosynthesis: a review, Plant Cell Environ., 40, 1214–1238, https://doi.org/10.1111/pce.12871, 2017.
Miralles, D. G., De Jeu, R. A. M., Gash, J. H., Holmes, T. R. H., and Dolman, A. J.: Magnitude and variability of land evaporation and its components at the global scale, Hydrol. Earth Syst. Sci., 15, 967–981, https://doi.org/10.5194/hess-15-967-2011, 2011.
Miralles, D. G., Bonte, O., Koppa, A., Baez-Villanueva, O. M., Tronquo, E., Zhong, F., Beck, H. E., Hulsman, P., Dorigo, W., Verhoest, N. E. C., and Haghdoost, S.: GLEAM4: global land evaporation and soil moisture dataset at 0.1° resolution from 1980 to near present, Sci. Data, 12, 416, https://doi.org/10.1038/s41597-025-04610-y, 2025.
Peters, W., Van Der Velde, I. R., Van Schaik, E., Miller, J. B., Ciais, P., Duarte, H. F., Van Der Laan-Luijkx, I. T., Van Der Molen, M. K., Scholze, M., Schaefer, K., Vidale, P. L., Verhoef, A., Wårlind, D., Zhu, D., Tans, P. P., Vaughn, B., and White, J. W. C.: Increased water-use efficiency and reduced CO2 uptake by plants during droughts at a continental scale, Nature Geosci., 11, 744–748, https://doi.org/10.1038/s41561-018-0212-7, 2018.
Qiu, Z., Liu, D., Yan, N., Yan, Y., Yang, C., Zhang, C., and Duan, H.: Landsat and dual random forest modelling reveal sediment fining in the Yellow River shaped by ecological restoration on China's loess plateau, Remote Sens. Environ., 330, 114994, https://doi.org/10.1016/j.rse.2025.114994, 2025.
Rahmani, J., Creed, I. F., Badiou, P., and Ameli, A. A.: Wetlands set the pace of annual runoff in the northern Great Plains, Commun. Earth Environ., https://doi.org/10.1038/s43247-026-03318-0, 2026.
Renner, M., Brenner, C., Mallick, K., Wizemann, H.-D., Conte, L., Trebs, I., Wei, J., Wulfmeyer, V., Schulz, K., and Kleidon, A.: Using phase lags to evaluate model biases in simulating the diurnal cycle of evapotranspiration: a case study in Luxembourg, Hydrol. Earth Syst. Sci., 23, 515–535, https://doi.org/10.5194/hess-23-515-2019, 2019.
Sen, P. K.: Estimates of the Regression Coefficient Based on Kendall's Tau, J. Am. Stat. Assoc., 63, 1379–1389, https://doi.org/10.1080/01621459.1968.10480934, 1968.
Shih, C.-H., Jang, Y.-S., Yang, T.-Y., Huang, C.-Y., Juang, J.-Y., and Lo, M.-H.: Impact of diurnal temperature and relative humidity hysteresis on atmospheric dryness in changing climates, Sci. Adv., 11, eadu5713, https://doi.org/10.1126/sciadv.adu5713, 2025.
Wang, J., Niu, H., Zhang, S., Chen, X., Xia, X., Zhang, Y., Lu, X., He, B., Wu, T., Song, C., Fu, Z., Yao, J., and Yuan, W.: Higher warming rate in global arid regions driven by decreased ecosystem latent heat under rising vapor pressure deficit from 1981 to 2022, Agr. For. Meteorol., 371, 110622, https://doi.org/10.1016/j.agrformet.2025.110622, 2025a.
Wang, L., Wei, Z., Zhang, B., Wang, Y., Zhang, X., and Chen, A.: Exploiting the modified surface energy balance system (mSEBS) model and monitoring actual land surface evapotranspiration in China, J. Hydrol., 661, 133596, https://doi.org/10.1016/j.jhydrol.2025.133596, 2025b.
Wang, M., Wang, Y., Liu, X., Hou, W., Wang, J., Li, S., Zhao, L., and Hu, Z.: Vapor pressure deficit dominates vegetation productivity during compound drought and heatwave events in China's arid and semi-arid regions: Evidence from multiple vegetation parameters, Ecol. Inform., 88, 103144, https://doi.org/10.1016/j.ecoinf.2025.103144, 2025c.
Will, R. E., Wilson, S. M., Zou, C. B., and Hennessey, T. C.: Increased vapor pressure deficit due to higher temperature leads to greater transpiration and faster mortality during drought for tree seedlings common to the forest–grassland ecotone, New Phytol., 200, 366–374, https://doi.org/10.1111/nph.12321, 2013.
Xia, Y., Hao, Z., Shi, C., Li, Y., Meng, J., Xu, T., Wu, X., and Zhang, B.: Regional and Global Land Data Assimilation Systems: Innovations, Challenges, and Prospects, J. Meteorol. Res., 33, 159–189, https://doi.org/10.1007/s13351-019-8172-4, 2019.
Xu, T., Guo, Z., Liu, S., He, X., Meng, Y., Xu, Z., Xia, Y., Xiao, J., Zhang, Y., Ma, Y., and Song, L.: Evaluating Different Machine Learning Methods for Upscaling Evapotranspiration from Flux Towers to the Regional Scale, J. Geophys. Res.-Atmos., 123, 8674–8690, https://doi.org/10.1029/2018JD028447, 2018.
Xu, W., Xia, X., Piao, S., Wu, D., Li, W., Yang, S., and Yuan, W.: Weakened Increase in Global Near-Surface Water Vapor Pressure During the Last 20 Years, Geophys. Res. Lett., 51, e2023GL107909, https://doi.org/10.1029/2023GL107909, 2024.
Yang, Q., Ma, Z., Zheng, Z., and Duan, Y.: Sensitivity of potential evapotranspiration estimation to the Thornthwaite and Penman–Monteith methods in the study of global drylands, Adv. Atmos. Sci., 34, 1381–1394, https://doi.org/10.1007/s00376-017-6313-1, 2017.
Yi, K., Senay, G. B., Fisher, J. B., Wang, L., Suvočarev, K., Chu, H., Moore, G. W., Novick, K. A., Barnes, M. L., Keenan, T. F., Mallick, K., Luo, X., Missik, J. E. C., Delwiche, K. B., Nelson, J. A., Good, S. P., Xiao, X., Kannenberg, S. A., Ahmadi, A., Wang, T., Bohrer, G., Litvak, M. E., Reed, D. E., Oishi, A. C., Torn, M. S., and Baldocchi, D.: Challenges and Future Directions in Quantifying Terrestrial Evapotranspiration, Water Resour. Res., 60, e2024WR037622, https://doi.org/10.1029/2024WR037622, 2024.
Yu, H., Xiao, H., and Gu, X.: Integrating species distribution and piecewise linear regression model to identify functional connectivity thresholds to delimit urban ecological corridors, Comput. Environ. Urban, 113, 102177, https://doi.org/10.1016/j.compenvurbsys.2024.102177, 2024.
Yuan, W., Zheng, Y., Piao, S., Ciais, P., Lombardozzi, D., Wang, Y., Ryu, Y., Chen, G., Dong, W., Hu, Z., Jain, A. K., Jiang, C., Kato, E., Li, S., Lienert, S., Liu, S., Nabel, J. E. M. S., Qin, Z., Quine, T., Sitch, S., Smith, W. K., Wang, F., Wu, C., Xiao, Z., and Yang, S.: Increased atmospheric vapor pressure deficit reduces global vegetation growth, Sci. Adv., 5, eaax1396, https://doi.org/10.1126/sciadv.aax1396, 2019.
Zahn, E., Bou-Zeid, E., Good, S. P., Katul, G. G., Thomas, C. K., Ghannam, K., Smith, J. A., Chamecki, M., Dias, N. L., Fuentes, J. D., Alfieri, J. G., Kwon, H., Caylor, K. K., Gao, Z., Soderberg, K., Bambach, N. E., Hipps, L. E., Prueger, J. H., and Kustas, W. P.: Direct partitioning of eddy-covariance water and carbon dioxide fluxes into ground and plant components, Agr. Forest Meteorol., 315, 108790, https://doi.org/10.1016/j.agrformet.2021.108790, 2022.
Zantout, K., Balkovic, J., Billing, M., Folberth, C., Gosling, S. N., Hank, T., Hantson, S., Iizumi, T., Ito, A., Jägermeyr, J., Jain, A. K., Khabarov, N., Kou-Giesbrecht, S., Li, F., Li, M., Lin, T.-S., Liu, W., Müller, C., Okada, M., Ostberg, S., Otta, K., Rabin, S., Reyer, C. P. O., Scheer, C., Schneider, J. M., Zabel, F., Frieler, K., and Schewe, J.: Shifting dominant periods in extreme climate impacts under global warming, Nat. Commun., 16, 9746, https://doi.org/10.1038/s41467-025-65600-7, 2025.
Zhang, J., Guan, K., Peng, B., Pan, M., Zhou, W., Jiang, C., Kimm, H., Franz, T. E., Grant, R. F., Yang, Y., Rudnick, D. R., Heeren, D. M., Suyker, A. E., Bauerle, W. L., and Miner, G. L.: Sustainable irrigation based on co-regulation of soil water supply and atmospheric evaporative demand, Nat. Commun., 12, 5549, https://doi.org/10.1038/s41467-021-25254-7, 2021.
Zhang, Q., Manzoni, S., Katul, G., Porporato, A., and Yang, D.: The hysteretic evapotranspiration – Vapor pressure deficit relation, J. Geophys. Res.-Biogeo., 119, 125–140, https://doi.org/10.1002/2013JG002484, 2014.
Zhang, W., Koch, J., Wei, F., Zeng, Z., Fang, Z., and Fensholt, R.: Soil Moisture and Atmospheric Aridity Impact Spatio-Temporal Changes in Evapotranspiration at a Global Scale, J. Geophys. Res.-Atmos., 128, e2022JD038046, https://doi.org/10.1029/2022JD038046, 2023.
Zhang, Y., Peña-Arancibia, J. L., McVicar, T. R., Chiew, F. H. S., Vaze, J., Liu, C., Lu, X., Zheng, H., Wang, Y., Liu, Y. Y., Miralles, D. G., and Pan, M.: Multi-decadal trends in global terrestrial evapotranspiration and its components, Sci. Rep., 6, 19124, https://doi.org/10.1038/srep19124, 2016.
Zhao, Y. and Feng, Q.: Identifying spatial and temporal dynamics and driving factors of cultivated land fragmentation in Shaanxi province, Agr. Syst., 217, 103948, https://doi.org/10.1016/j.agsy.2024.103948, 2024.
Zhou, S. and Yu, B.: Neglecting land–atmosphere feedbacks overestimates climate-driven increases in evapotranspiration, Nat. Clim. Change, 15, 1099–1106, https://doi.org/10.1038/s41558-025-02428-5, 2025.
Zhou, S., Williams, A. P., Berg, A. M., Cook, B. I., Zhang, Y., Hagemann, S., Lorenz, R., Seneviratne, S. I., and Gentine, P.: Land–atmosphere feedbacks exacerbate concurrent soil drought and atmospheric aridity, P. Natl. Acad. Sci. USA, 116, 18848–18853, https://doi.org/10.1073/pnas.1904955116, 2019.
Zhuang, Y., Fu, R., Santer, B. D., Dickinson, R. E., and Hall, A.: Quantifying contributions of natural variability and anthropogenic forcings on increased fire weather risk over the western United States, P. Natl. Acad. Sci. USA, 118, e2111875118, https://doi.org/10.1073/pnas.2111875118, 2021.