
the Creative Commons Attribution 4.0 License.
the Creative Commons Attribution 4.0 License.
 | 20 Aug 2026
Lake Victoria to the Sudd Wetland: flood wave timing, connectivity and wetland buffering across the White Nile
Douglas Mulangwa
Evet Naturinda
Charles Koboji
Benon T. Zaake
Emily Black
Hannah Cloke
Elisabeth M. Stephens
The White Nile from Lake Victoria through Lakes Kyoga and Albert to the Sudd wetlands forms a complex connected lake-river-wetland system where flood propagation, storage, and attenuation remain poorly quantified. Following unprecedented and persistent flooding across South Sudan in 2022, this study quantified system-scale flood-wave transit time and examined how long it takes a flood wave to travel from Lake Victoria to the Sudd and how upstream storage and connectivity shape multi-year flood behaviour. Using daily lake levels, discharge, CHIRPS rainfall, and MODIS-derived inundation for 2002–2024, we tracked sequential flood peaks through the Victoria–Kyoga–Albert–Sudd cascade and mapped monthly wetland dynamics across five South Sudan sub-catchments. Flood-wave tracking showed a mean system transit time of approximately 17 months (16.84±1.95 months; range 13.0–20.9 months), substantially longer than the commonly inferred four-to-five-month timescale based on seasonal peak alignment. Segmental analysis revealed rapid transmission from Victoria to Kyoga (mean 4.2 months) but strong attenuation through the Albert–Sudd reach (mean 9.3 months), consistent with extensive floodplain storage and backwater control. Correlations between Lake Victoria peaks and downstream wetland extents strengthened markedly after 2019, with r2 exceeding 0.8 at 9–13-month lags, confirming strong hydraulic coupling and long system memory. These statistical lags complement, but do not represent, physical flood-wave transit times.
The 2019–2024 high-water regime was not a series of isolated rainfall events but a multi-year propagation of excess storage initiated by the 2019 positive Indian Ocean Dipole anomaly and consecutive rainfall seasons. Lake Victoria reached exceptional peak levels of 1136.48 m a.s.l. in 2020, 1136.50 m a.s.l. in 2021, and 1136.66 m a.s.l. in 2024, each exceeding the historical 1964 maximum (1136.42 m a.s.l.). Over the same period, the Sudd Wetland exceeded its previous MODIS-era maximum extent (81 496 km2 in 2016) in every year from 2019 to 2024, reaching annual maxima of 120 680, 111 684, 111 480, 163 475, 122 292, and 116 359 km2, respectively. Flood-persistence mapping shows a shift from rainfall-driven activation in the eastern Sudd (Baro-Akobbo-Sobat–White Nile) in 2019–2020 to sustained, inflow-driven inundation across the central and western Sudd (Bahr el Jebel–Bahr el Ghazal–Bahr el Arab) during 2020–2022, consistent with water pathway activation and backwater expansion under high antecedent storage. When compared with historical episodes in the 1870s and 1960s, the persistence and spatial reach of the 2019–2024 floods rank among the most extensive in the modern record. These results redefine the White Nile as a long-memory system in which upstream storage governs downstream flood risk over multi-season timescales and challenge interpretations of flood propagation based on seasonal timing alone, offering a new empirical basis for flood forecasting, wetland management, and anticipatory action in South Sudan and across the wider basin.
- Article
(6194 KB) - Full-text XML
-
Supplement
(1083 KB) - BibTeX
- EndNote


The White Nile from Lake Victoria through Lakes Kyoga and Albert to the Sudd forms a large, connected lake-river-wetland system. Within this system, flood timing and magnitude are governed by coupled processes including storage, lateral redistribution, tributary exchanges, groundwater interaction and backwater effects (Sutcliffe and Parks, 1999; Vanderkelen et al., 2018a, b). Additional complexity arises at and below Malakal, where the Bahr el Ghazal and the Sobat–Baro–Akobbo systems join, introducing low-gradient floodplains and distributary wetlands that further modulate hydrograph shape and persistence (Rebelo et al., 2012; Sutcliffe and Parks, 1999).
Within this system, the Sudd, Africa's largest and the world's second-largest freshwater wetland, plays a critical role in regulating downstream flow through strong storage, evaporation and pronounced attenuation of flood waves (Ramsar Secretariat, 2006; Rebelo et al., 2012; UNESCO, 2017). Acting as a natural sponge, the wetland absorbs and delays upstream floodwaters while buffering downstream reaches during high-flow periods (Kadykalo and Findlay, 2016; Mohamed et al., 2005a, b). Empirical and modelling studies of the Sudd wetland document multi-month lags between inflow and outflow and substantial water losses to evaporation and internal storage that reshape the downstream water budget and local hydroclimate, while also highlighting the difficulty of simulating inundation reliably in tropical wetlands (Marthews et al., 2022; Mohamed et al., 2005a, b; Mohamed and Savenije, 2014; Sutcliffe and Brown, 2018; Sutcliffe, 1974). In this study, the Sudd is therefore treated first as an integrated downstream storage zone and then, at sub-catchment scale, as a system through which recent flood peaks were transmitted and transformed during 2019–2024.
Across the historical record, Lake Victoria water levels typically peak around May, following the March to May long-rains season, whereas peak flooding in South Sudan generally occurs between September and October during or just after the JJAS rainfall (Nicholson, 2017; Sutcliffe and Parks, 1999). This four-to-five-month seasonal offset has often been interpreted as evidence that flood propagation from Lake Victoria to the Sudd occurs within roughly five months (Sutcliffe and Brown, 2018; Sutcliffe and Parks, 1999). However, this interpretation is based on seasonal peak alignment rather than explicit tracking of flood wave propagation, and it may therefore confuse seasonal synchronization with system-scale travel time. In many hydrological applications, similar interpretations arise from conceptualizations of runoff routing that emphasise channel processes and short response times, often neglecting the role of large-scale storage and delayed release in shaping basin-scale behaviour (Beven, 2012; McDonnell and Beven, 2014).
This distinction matters because the White Nile contains major intermediate storage elements, including Lakes Kyoga and Albert and the Sudd wetland, which can delay, attenuate, and redistribute floodwaters over multi-seasonal timescales (Mohamed et al., 2005a, b; Mohamed and Savenije, 2014; Sutcliffe and Brown, 2018). These processes, components and their roles in flood wave propagation are under-characterized for the White Nile. Existing studies describe seasonal phase differences, storage-controlled attenuation, and wetland buffering, but they do not quantify how long a floodwave takes to travel from Lake Victoria through Kyoga and Albert to the Sudd (Nicholson, 2017; Sutcliffe and Parks, 1999; Williams, 2018). Recent modelling work also indicates that flood propagation in South Sudan may involve dynamic routing and intermittent connectivity between the Nile and adjacent basins during high-flow periods, further challenging assumptions of fixed downstream pathways (Zhang et al., 2025). Quantifying floodwave transit time is therefore central to understanding basin connectivity, hydrological memory, and the persistence of flooding across South Sudan.
The need to resolve this timing problem became clear during the recent multi-year flood sequence. Beginning in 2019, the Sudd experienced a sequence of extreme floods that departed from recent norms. This rapid expansion and persistent inundation across multiple seasons and years culminated in record wetland extent in 2022 (Caldwell, 2022; Hardy et al., 2023; Marthews et al., 2022; UNHCR, 2022). Notably, although successive anomalous rainfall seasons between 2019 and 2021 primed the lake-river-wetland system, flooding persisted and peak inundation occurred in 2022 despite suppressed rainfall across parts of East Africa, indicating that local precipitation alone cannot explain the magnitude and duration of the event (Wainwright et al., 2021; KMD, 2023; UNMA, 2022; WMO, 2023).
These downstream flood conditions coincided with exceptional upstream storage and delayed outflow. Lake Victoria rose rapidly by approximately 1.44 m between September 2019 and May 2020, driven by anomalous precipitation and inflow, with attribution analysis indicating that anthropogenic climate change likely increased both the probability and magnitude of that event (Pietroiusti et al., 2024). Once the Sudd is saturated, its high storage capacity and slow drainage can sustain or amplify flooding over multiple years, even under near-normal rainfall conditions (Lamberts, 2009; Mohamed et al., 2005b; Sutcliffe, 1974). These observations are consistent with earlier studies highlighting strong attenuation and long hydrological memory within the White Nile–Sudd system potentially exceeding one year (Sutcliffe and Parks, 1999; Williams, 2018).
Historical records show that multi-year wet spells and high White Nile flows are part of the system's natural variability, including notable episodes in the 1870s, late 1910s, and early 1960s (Hurst and Phillips, 1938; Nicholson, 2017; Nicholson and Yin, 2001; Sutcliffe and Parks, 1999). These events show that large-scale storage and delayed propagation can sustain flooding beyond the rainfall season. However, the 2019–2024 period is distinguished by the persistence and spatial extent of inundation, including exceptional flooding in the Sudd wetlands in 2022 under conditions that cannot be explained by local rainfall alone. This points to antecedent storage, wetland retention, delayed drainage, and multi-year hydrological memory as central controls on flood duration and severity (Mohamed et al., 2005a; Sutcliffe and Brown, 2018).
The 2019 positive Indian Ocean Dipole event, one of the strongest on record, contributed to exceptional 2019 short-rains totals across East Africa and set up high lake levels into 2020, compounding downstream flood risk (Wainwright et al., 2021). Variability from ENSO and the IOD modulates regional rainfall on interannual scales, while long-term climate change is projected to increase the likelihood of extreme precipitation and flooding in many tropical basins, including eastern Africa (Hirabayashi et al., 2013; IPCC, 2021). Recent analyses of Lake Victoria extremes further indicate a climate-change signal in both over-lake rainfall and basin inflows, suggesting a shifting baseline flood risk in the White Nile (Pietroiusti et al., 2024). These drivers help explain the upstream high-water conditions, but they do not by themselves resolve how the flood signal was delayed, attenuated, and transmitted through Lakes Kyoga and Albert to the Sudd.
The hydrological persistence of these floods also translated into severe societal impacts, with more than 835 000 people affected in 2021 alone in South Sudan (Caldwell, 2022). Anecdotally, these floods have been described as unprecedented in Unity, Jonglei, and Upper Nile states of South Sudan, with the scale and persistence of inundation not seen before in living memory (Pal Mai Deng, Minister of Water Resources and Irrigation, personal communication, May 2024). Large areas of settlement remained inundated for months, and major disruptions to transport, water, education, and healthcare services were recorded (Caldwell, 2022; UNHCR, 2022). The duration and compound nature of these floods also exposed limitations in early warning and anticipatory action by both global and national early warning systems, where data availability, lead time, and forecast performance remain limited over South Sudan (Alfieri et al., 2024; Caldwell, 2022; Easton-Calabria, 2024). Anticipatory action pilots, which are based on pre-agreed early measures triggered by forecast thresholds before an event (Chaves-Gonzalez et al., 2022; Coughlan de Perez et al., 2015, 2016; IFRC, 2022; Stephens et al., 2015), were attempted but all faced these limitations.
The underlying drivers of these multi-year extreme floods, such as the early 1870s, 1916–1919, 1961–1965, and 2019–2022 flood sequences across the White Nile system, remain poorly understood in terms of system-scale hydrological controls and storage-driven propagation processes. During this period, the Sudd experienced rapid and persistent inundation, culminating in record wetland extent in 2022, where downstream flooding remained extreme despite reduced rainfall across parts of East Africa (Caldwell, 2022; Hardy et al., 2023; Marthews et al., 2022; UNHCR, 2022; KMD, 2023; UNMA, 2022; WMO, 2023). This mismatch between local rainfall and downstream flood extent points to the importance of upstream storage and delayed floodwave propagation, with wetland retention sustaining flooding beyond the rainfall season. However, the extent to which these processes control downstream inundation remains poorly constrained. This motivates a system-scale analysis of transit times, attenuation, and interannual memory from Lake Victoria through Kyoga and Albert to the Sudd and its South Sudan sub-catchments.
Although existing hydrological studies across the White Nile provide essential foundations in water balance, flow regimes, seasonal variability, wetland hydrology and climate influence, much of the literature treats individual components of the White Nile separately, including foundational Lake Victoria-specific water balance studies (Awange et al., 2008; Gibb, 1984; Hurst and Phillips, 1938; Kite, 1982; Mistry and Conway, 2003; Mugume et al., 2024; Pietroiusti et al., 2024; Sene, 2000; Swenson and Wahr, 2009; Vanderkelen et al., 2018a, b); reach-scale analyses treat the Victoria Nile through Lake Kyoga as a separate unit (Brown and Sutcliffe, 2013; Hurst and Phillips, 1938; Sutcliffe and Parks, 1999); separate studies focus on Lake Albert and the Albert Nile reach (NBI/NELSAP, 2008; Sutcliffe and Parks, 1999); wetland-focused work examines the Sudd (Conway and Hulme, 1996; Dong et al., 2024; Hardy et al., 2023; Lamberts, 2009; Mohamed et al., 2005b; Mohamed and Savenije, 2014; Rebelo et al., 2012; Sutcliffe and Brown, 2018; Sutcliffe, 1974; Williams, 2018); and a large body of research concentrates on the fast-response Blue Nile (Conway, 2000; Conway and Hulme, 1996; Rientjes et al., 2011; Tekleab et al., 2011, 2013). As a result, basin-wide slow flood wave propagation, storage-mediated delays, threshold-driven wetland expansion, backwater controls, and interannual variability remain under-evidenced in the published record across the connected Victoria, Kyoga, Albert and Sudd system. This study addresses that gap by treating the system as one connected hydrological corridor and resolving South Sudan sub-catchments within it to quantify floodwave timing, attenuation, and interannual memory.
Beyond regional flood dynamics, these processes have broader global relevance through their influence on biogeochemical cycles. Recent studies further demonstrate that variability in Sudd wetland inundation is associated with anomalously large increases in global atmospheric methane growth rates, identifying the Sudd as a globally significant natural methane source (Hardy et al., 2023). Methane is a major greenhouse gas, and variability in wetland extent can therefore influence global atmospheric composition. Recent atmospheric analyses further indicate that African wetland emissions contributed substantially to the global methane increase observed over 2019–2024, reinforcing the importance of accurately representing wetland dynamics in understanding recent methane trends (Balasus et al., 2026). Accurate estimation of methane emissions requires robust characterisation of seasonal and interannual wetland extent variability, which remains a major source of uncertainty in global methane budgets (Dong et al., 2024). Wetland extent in the Sudd is strongly influenced by delayed flood propagation from upstream lake systems; therefore, quantifying system-scale transit times provides a physical basis for linking upstream hydroclimatic variability to downstream wetland dynamics and associated greenhouse gas emissions (Mohamed and Savenije, 2014; Sutcliffe and Brown, 2018).
More broadly, wetlands cover approximately 6.4 % of the global land surface and are a key component of the terrestrial water and carbon cycles (Junk et al., 2013). Many large river basins contain extensive floodplain and wetland complexes where storage and connectivity strongly influence flood propagation and hydrological response (Bullock and Acreman, 2003). The White Nile system therefore provides a representative example of a wider class of storage-dominated basins, highlighting the broader relevance of understanding storage-mediated flood propagation for hydrological and Earth system modelling.
Hydrometeorological observations, particularly, across South Sudan remain sparse and discontinuous because of conflict over the years, which disrupted observation station networks. Several studies have relied on merged station-satellite products to compensate for gauge scarcity (Dinku et al., 2007, 2018; Gebrechorkos et al., 2018). In the absence of ground-based wetland-extent observations, satellite products partly fill the gap but cloud and sensor limitations still leave blind spots which introduce uncertainty, especially over the Sudd (Lin et al., 2019; Pekel et al., 2016; Rebelo et al., 2012). Lake Victoria outflow records are not publicly available, so many water-balance studies infer releases from the Agreed Curve or related reconstructions without the directly observed Lake Victoria discharge contribution through releases in Jinja (Pietroiusti et al., 2024; Sene, 2000; Vanderkelen et al., 2018a). Taken together, sparse gauges, satellite blind spots, and unavailable Lake Victoria outflow records constrain basin-scale attribution of drivers and impede precise quantification of flood wave propagation, storage, and timing across the White Nile system.
By resolving flood wave propagation across the Lake Victoria–White Nile–Sudd system, this study provides the first system-scale estimate of transit time within a large tropical lake-river-wetland cascade that has remained poorly characterised in the hydrological literature despite its regional and global importance. The results demonstrate that flood wave transit times are substantially longer than commonly inferred from seasonal peak alignment, revealing a dominant role for storage-mediated processes and long hydrological memory (Mohamed and Savenije, 2014; Sutcliffe and Parks, 1999). In doing so, the study provides empirical evidence that challenges prevailing assumptions regarding the speed and mechanism of flood propagation in large river systems, particularly where intermediate storage elements dominate system behaviour. More broadly, the findings highlight limitations in commonly applied approaches that infer transit time from rainfall–runoff timing or seasonal peak alignment and therefore neglect intermediate storage, attenuation, and delayed release, with implications for hydrological modelling, flood forecasting, and large-scale water resources assessment (Beven, 2012; McDonnell and Beven, 2014).
By providing observational constraints on storage-mediated flood propagation in a large connected lake–river–wetland system, the study contributes to improving the representation of hydrological connectivity, basin-scale memory, and inland water storage dynamics in both regional and global hydrological and Earth system models. In particular, because wetland extent in the Sudd is strongly controlled by delayed upstream flood propagation, these results provide a physical basis for linking basin-scale hydrological dynamics to variability in wetland inundation and associated methane emissions. Satellite and atmospheric analyses have shown that Sudd wetland dynamics are associated with globally significant methane emissions (Hardy et al., 2023), and recent inverse modelling studies indicate that African wetland emissions contributed substantially to the observed global methane increase over the period 2019–2024 (Balasus et al., 2026). Improving the representation of hydrologically driven wetland extent variability therefore remains critical for reducing uncertainty in global methane budgets (Dong et al., 2024).
In light of these basin-wide observational and process-based gaps; limited quantification of travel times, storage, attenuation, and floodplain exchange; insufficient sub-catchment resolution; weak separation of upstream forcing from local rainfall; missing Lake Victoria outflow records; and poor flood-forecast skill that hindered anticipatory action, this study investigates why there was unprecedented flooding in South Sudan in 2022. The analysis followed four steps that build from context to mechanism. First, we contrasted pre-2019 and 2019–2024 regimes for Lake Victoria and the Sudd to position the recent floods within the long-term historical variability. Second, we traced the propagation of flood peaks from Lake Victoria through Lakes Kyoga and Albert into the South Sudan sub-catchments, overlaying rainfall anomalies to test whether local rainfall or upstream inflow dominated. Third, we quantified connectivity between the upstream lakes and downstream wetlands using lag-correlation and persistence analyses to capture how hydrological memory and backwater effects shaped flood timing and extent across sub-catchments. Finally, we mapped monthly wetland extents to visualise spatial progression, activation pathways, and the geometry of connected flood parcels across the Sudd. The study is guided by the following objectives:
-
Contextualise Lake Victoria levels and Sudd extent of the 2020–2024 flood event relative to the historical record.
-
To establish the variation in transit time of the flood wave along the White Nile, comparing 2022 and the historical behaviour.
-
To evaluate sub-catchment-scale correlations and hydrological connectivity between the upstream lake system and South Sudan wetlands during the high-lake level phase.
-
To map spatial patterns of flood persistence and channel activation within the Sudd wetland during extreme flooding.
Study Area
This study focuses on the White Nile system from Lake Victoria in Uganda to the Sudd Wetland in South Sudan, encompassing a hydrologically complex integrated river-lake-wetland system segmented into three key reaches between the major lakes and Sudd wetland: Victoria–Kyoga, Kyoga–Albert, and Albert–Sudd. This segmentation reflects sharp transitions in flood wave behaviour, from rapid lake outflows to highly attenuated lake and wetland responses, governed by nonlinear processes such as storage, dispersion, and tributary inflow interactions.
Special emphasis is placed on the Albert–Sudd segment, which includes a geomorphologically diffuse transition zone between the unregulated outflow of Lake Albert and the expansive Sudd Wetland. This corridor is characterized by extended wetland interaction and multiple lake-like floodplain sinks, particularly along the Albert Nile corridor from Lake Albert exit at Pakwach Bridge to the Uganda–South Sudan border. This corridor includes swamp-dominated zones in Obongi District, where floodwaters often spread laterally across a broad floodplain, including areas such as Rhino Camp refugee settlement. Swamp-dominated river sections are prone to extensive lateral connectivity during high-flow periods, promoting floodplain storage, hydrodynamic diffusion, and delayed downstream routing (Sutcliffe and Parks, 1999; Williams, 2018).
Catchment delineation was based on HydroSHEDS sub-basins refined using national hydrological planning frameworks for Uganda and South Sudan to represent hydrologically coherent upstream-downstream units across the Victoria-Kyoga-Albert-Sudd system. Figure 1 illustrates the spatial arrangement of the sub-catchments, major lakes and rivers, the Sudd Wetland, and key observation stations used in this study, while detailed delineation procedures, hydrological connectivity, and geomorphological context are provided in Sect. S1 in the Supplement.
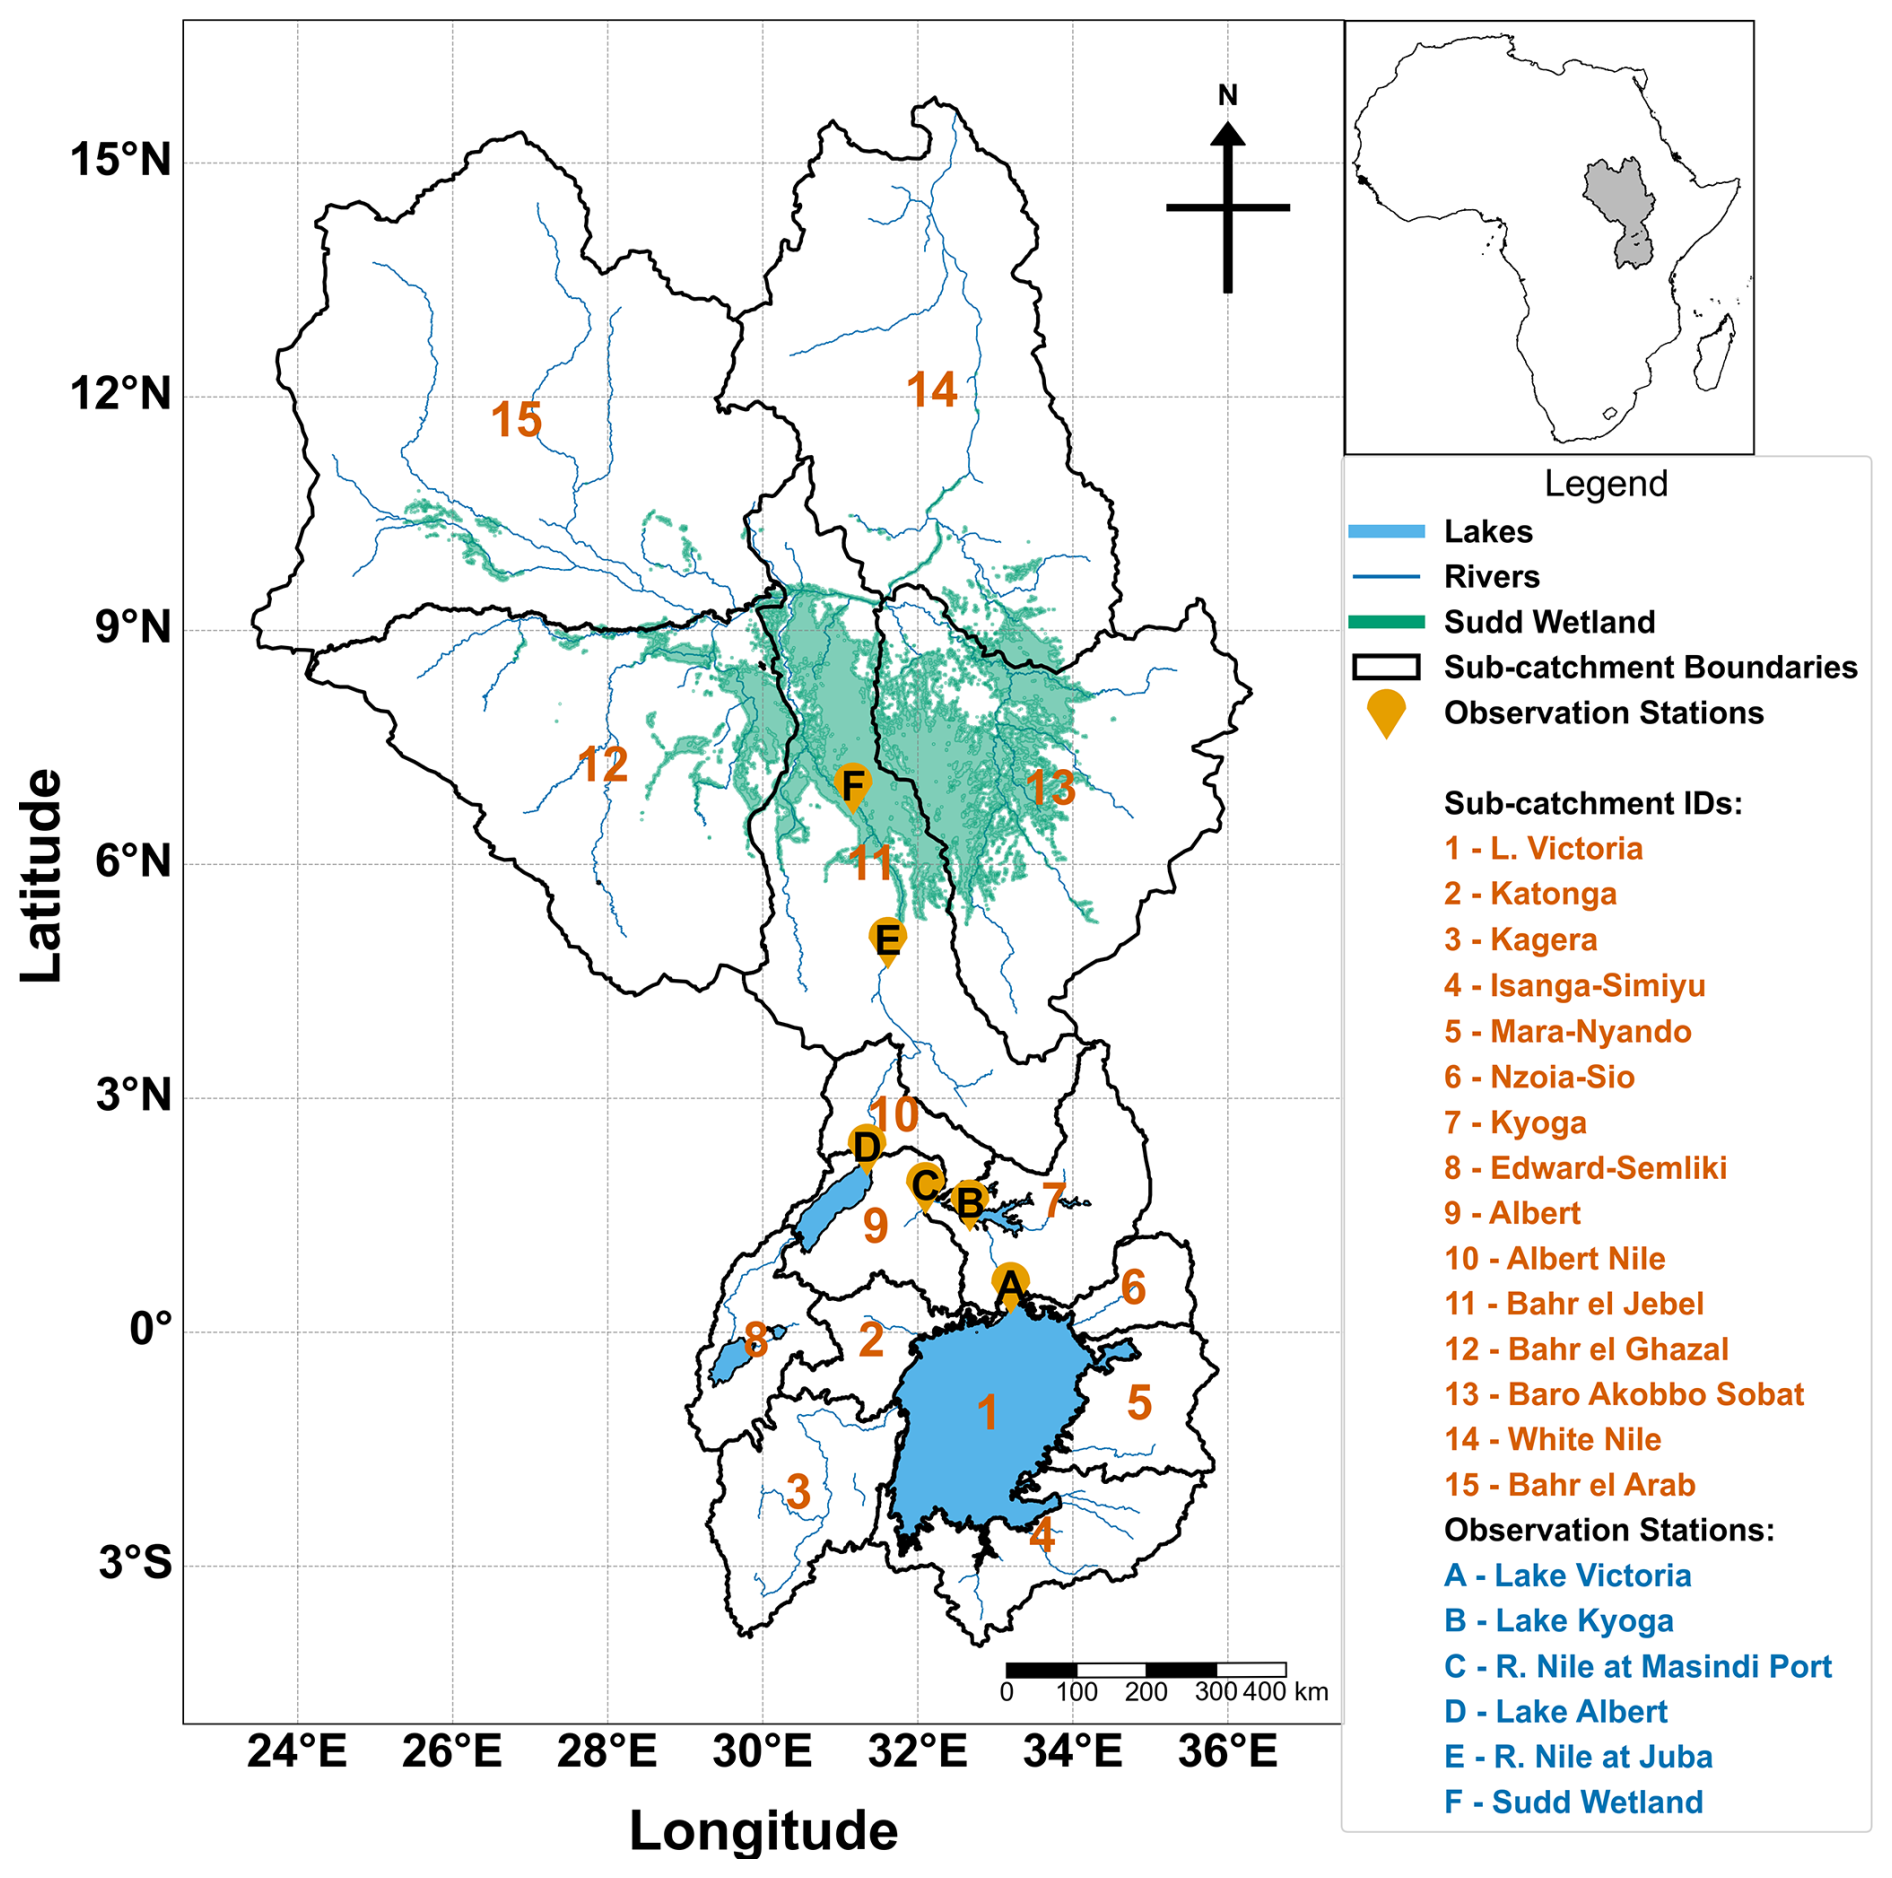
Figure 1Map of the White Nile Basin showing delineated sub-catchments, lakes, major rivers, and the Sudd Wetland extent. Sub-catchments are labelled numerically (1–15) with names listed in the legend. Observation stations (A)–(F) mark key hydrological data collection locations used in this study: Lake Victoria (A), Lake Kyoga (B), River Nile at Masindi Port (C), Lake Albert (D), River Nile at Juba (E), and the Sudd Wetland (F). Background river networks and sub-catchment boundaries are derived from the HydroSHEDS dataset, and wetland extent is based on MODIS flood mask composites. The map is projected in geographic coordinates (EPSG:4326) with a graduated scale bar for accurate distance representation using UTM Zone 36N.
The Sudd Wetland forms a low-gradient floodplain system where extensive wetland storage and lateral hydrological connectivity strongly influence downstream flood propagation. Consequently, hydrological responses within the Sudd depart from classical catchment behaviour, particularly during prolonged high-flow conditions.
This spatial framework underpins the flood wave segmentation used in this analysis (Victoria–Kyoga, Kyoga–Albert, Albert–Sudd) and supports a coherent structure for assessing upstream-downstream hydrological linkages.
This section outlines the data sources, study design, and analytical framework used to investigate flood wave propagation along the White Nile system. The analysis tracks the flow of water from Lake Victoria in Uganda through Lakes Kyoga and Albert into the Sudd Wetland in South Sudan. To highlight downstream flood anomalies, we also assess responses in key South Sudan sub-catchments adjacent to the main Nile channel that experienced severe inundation between 2019 and 2024. Beyond tracking the flood wave, the analysis quantifies timing, connectivity, and storage dynamics across the lake-river-wetland system.
This study follows a stepwise analytical framework linking (i) basin-scale rainfall forcing, (ii) lake storage response, (iii) event-based floodwave propagation, (iv) statistical connectivity analysis, and (v) spatial wetland dynamics. The event-based floodwave tracking framework is summarised in Fig. 2.
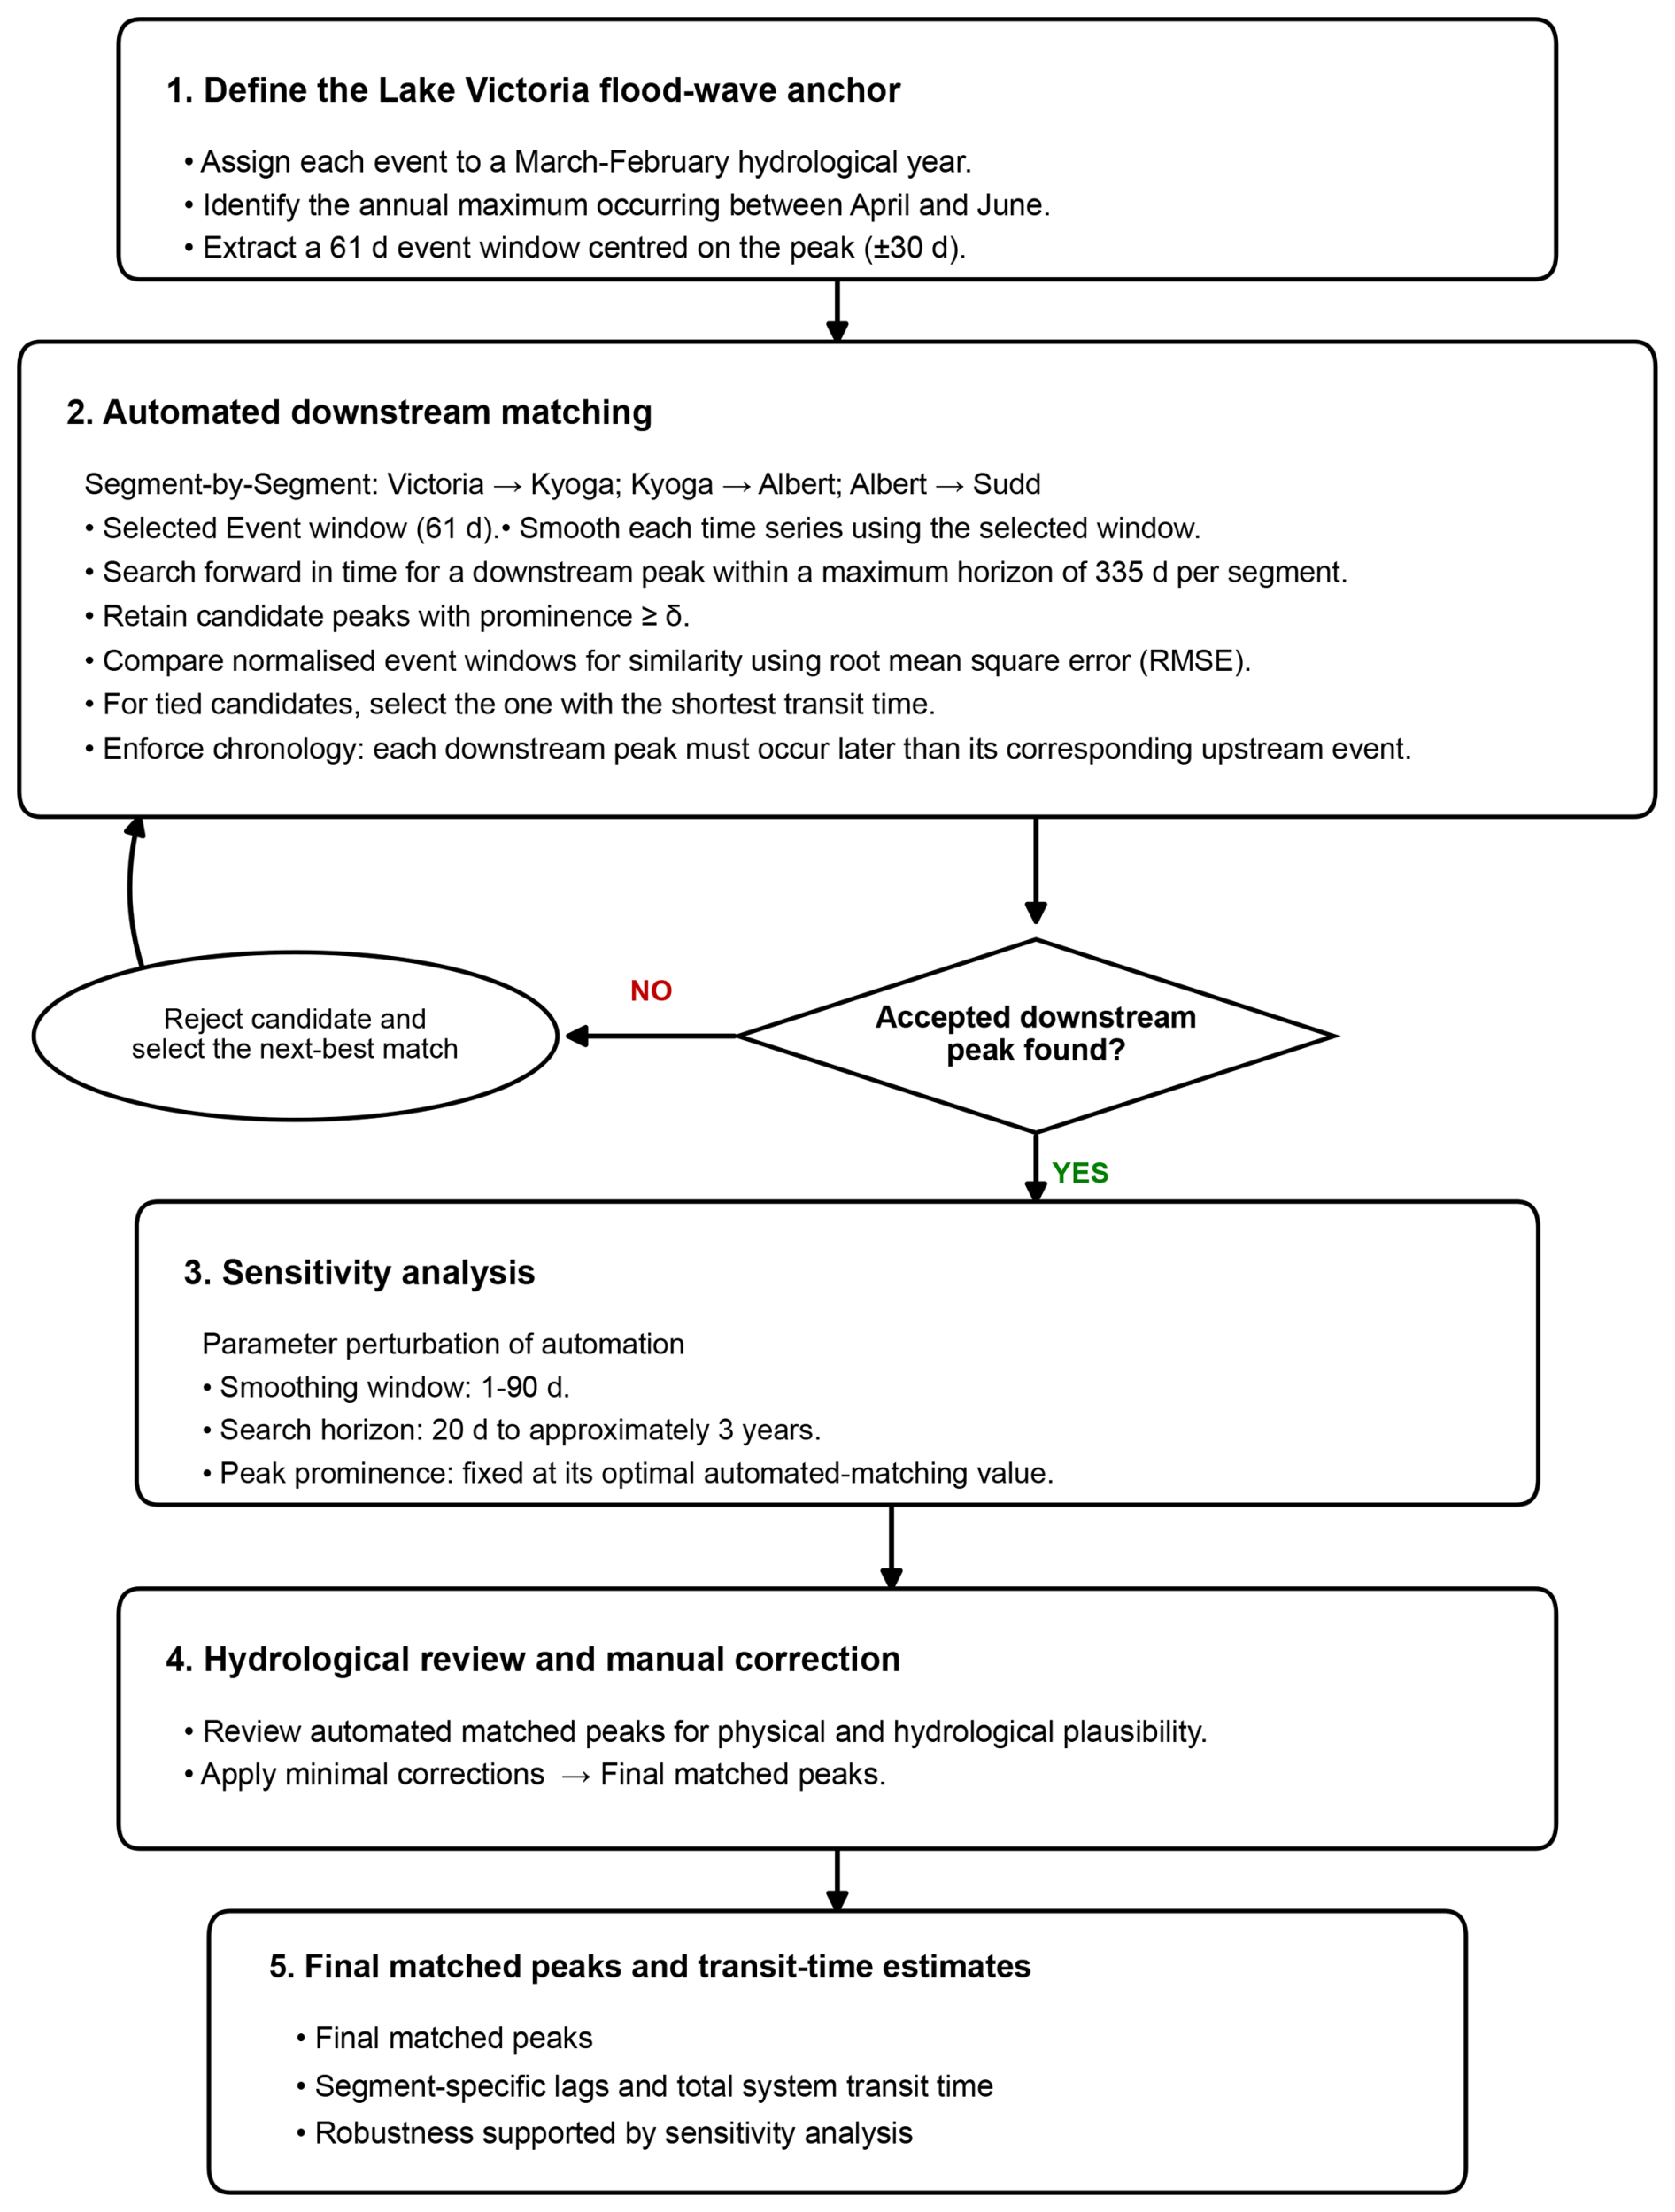
Figure 2Schematic workflow of the automated floodwave tracking framework used to estimate system transit times. The process includes identification of Lake Victoria anchor events, automated downstream peak matching across the Victoria–Kyoga–Albert–Sudd cascade, sensitivity analysis of matching parameters, and final manual verification before estimation of segment and system-scale transit times.
Section 2.1 describes the datasets used, while Sect. 2.2 to 2.6 detail the methodological steps: comparative hydrological benchmarking between Lake Victoria and the Sudd Wetland (Sect. 2.2); assessment of the seasonality of annual maxima across Lakes Victoria, Kyoga, and Albert (Sect. 2.3); flood wave event detection and lag estimation (Sect. 2.4); linking Lake Victoria annual maxima to downstream wetland extent in South Sudan sub-catchments (Sect. 2.5); and flood-persistence mapping to track Sudd Wetland activation (Sect. 2.6). Expanded rainfall-anomaly analysis, inter-lake timing diagnostics, sub-catchment delineation details, and event-matching sensitivity analysis are provided in the Supplement.
2.1 Data
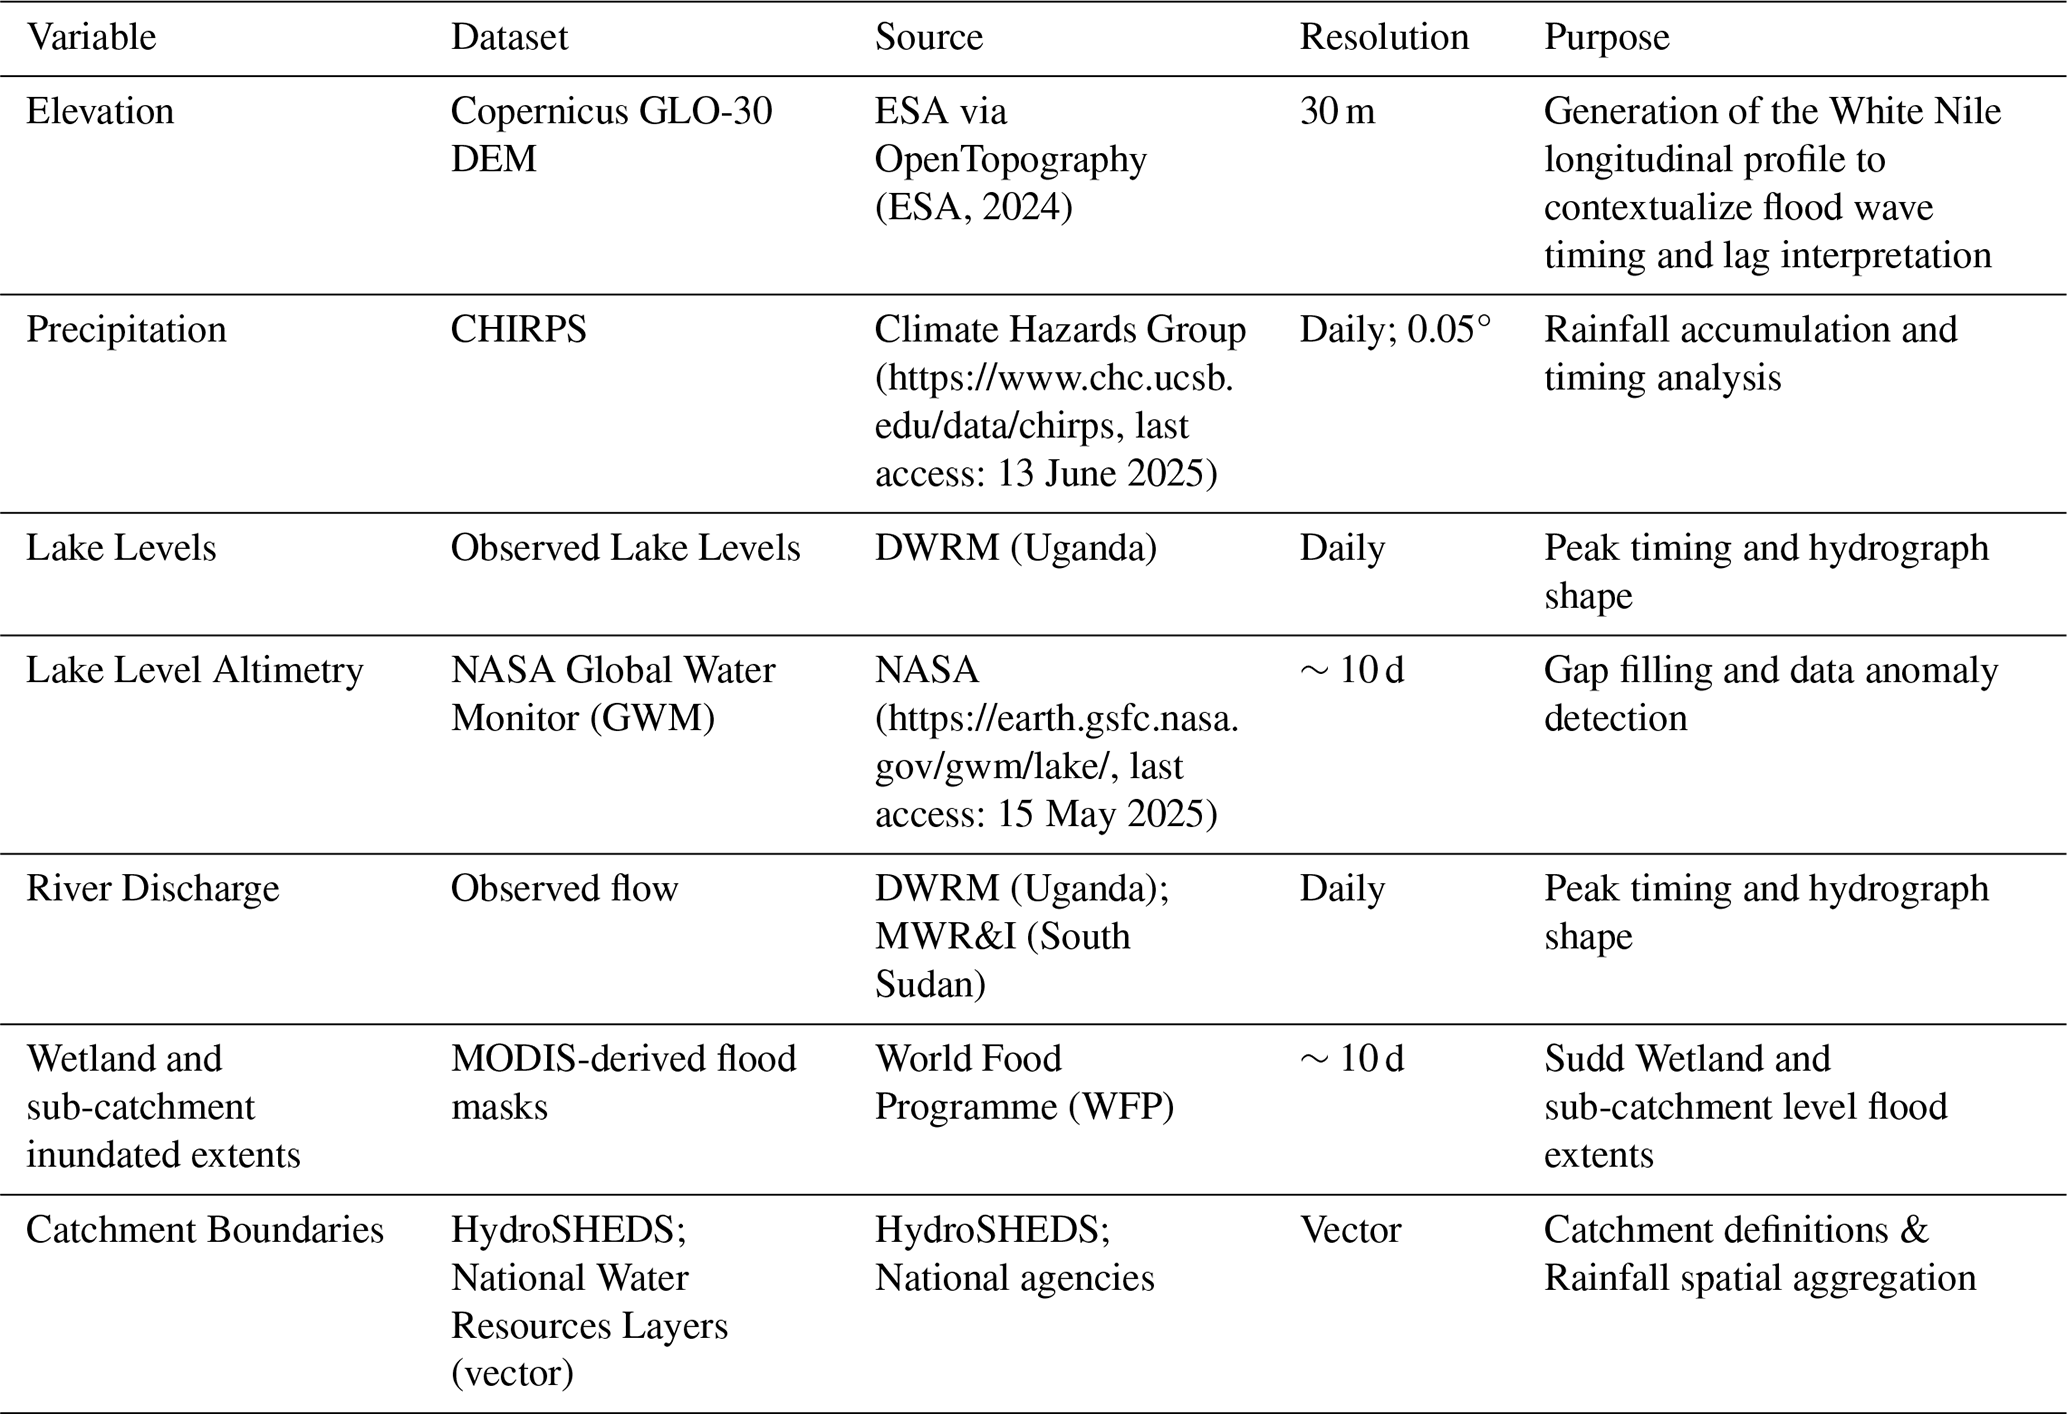
Rainfall, hydrological, and flood extent datasets with temporal resolutions from daily to dekadal were compiled for this study.
2.1.1 Rainfall Data
Due to sparse and uneven gauge coverage across Uganda and South Sudan, and documented issues in East African station networks such as outages, inconsistent reporting, and metadata gaps (Bamweyana et al., 2021; Dinku et al., 2007; Thiemig et al., 2012), ground-based rainfall observations were considered insufficient for basin-scale analysis. We therefore used CHIRPS to supply spatially complete rainfall estimates. CHIRPS produces daily 0.05° estimates from 1981 to present by blending infrared satellite retrievals with available station data, improving local bias where gauges exist while maintaining coverage over gauge-poor areas (Funk et al., 2015). Across East Africa, validations targeting hydrologically relevant properties, including the seasonal cycle, spatial rainfall patterns, wet-day frequency, and the timing and volume of heavy-rain events; CHIRPS reproduced these features and ranked among the best daily-scale products in Ethiopia, Kenya, and Tanzania (Dinku et al., 2018; Gebrechorkos et al., 2018; Thiemig et al., 2012). In Uganda, monthly agreement with gauges was high (Bamweyana et al., 2021). Evidence for South Sudan was limited with only five operating long-term stations available for recent evaluation, and records at key sites such as Juba, Malakal, Raga, Renk, and Wau contained substantial gaps (Basheer and Elagib, 2019; Zakaria Lukwasa et al., 2022). Nevertheless, CHIRPS has been used operationally for subnational rainfall indicators in South Sudan, although formal, country-specific validation studies are few (Humanitarian Data Exchange, 2025). These considerations supported the use of CHIRPS as the robust primary rainfall input for this study.
2.1.2 Hydrological Data
Daily river discharge and lake water levels were obtained from the Directorate of Water Resources Management (DWRM, Uganda). To place the 2019–2024 floods within the broader hydrological context of the White Nile system, we compiled long-term Lake Victoria records from 1950 to 2024. For the most recent decade, in which gauge data for Lake Victoria were not readily available from DWRM, the series was extended by gap filling with satellite altimetry from NASA's Global Water Monitor lake-level portal (https://earth.gsfc.nasa.gov/gwm/lake/, last access: 15 May 2025). This portal provides a 10 d multi-mission record suitable for anomaly screening and gap filling (NASA Goddard Space Flight Center, 2025). Discharge records for the South Sudan sections of the Nile were obtained from the Ministry of Water Resources and Irrigation (South Sudan).
2.1.3 Flood Extent Data
Flood extents for South Sudan, and the Sudd Wetland in particular, were derived from MODIS-based inundation masks produced and post-processed by the World Food Programme (WFP). These products apply a thermal-based water-detection approach using MODIS land surface temperature data, at 10 d intervals, combined with cloud filtering and temporal smoothing to improve consistency. The resulting dataset provides spatially continuous records of wetland and floodplain dynamics in the Sudd from 2002 onward. For this study, we retained the WFP product as provided, as an operationally generated inundation dataset designed for near-real-time flood monitoring, and used it to quantify wetland expansion–contraction cycles and extract sub-catchment-level flood extents for 2002–2024. While conceptually similar to other MODIS-based flood-mapping approaches (e.g. Lin et al., 2019; Ticehurst et al., 2014), which typically rely on reflectance-based detection, the WFP product differs in its use of thermal information, and no direct intercomparison was undertaken in this study. The dataset is proprietary and can be accessed upon request from the World Food Programme.
Table 1Summary of the datasets used, their resolution, and application.
2.2 Comparative Hydrological Benchmarking (Lake Victoria and the Sudd Wetland)
To place recent floods in historical context, we benchmarked Lake Victoria levels and Sudd Wetland extents. Lake Victoria records (observed gauge data extended with NASA's Global Water Monitor altimetry) and Sudd extents (MODIS-derived inundation from WFP) were separated into two periods: pre-2019 and 2019–2024. The decision to split the data periods that way was motivated by the 2019 positive Indian Ocean Dipole (IOD) event and the resulting unusually heavy and extended 2019–2020 short rains season (Wainwright et al., 2021) which elevated lake levels and initiated persistent wetness that carried forward into subsequent seasons. For each period, peak values were identified and compared.
Hydrographs were then constructed to display both periods together, with horizontal reference lines marking the peak levels. A reconstructed peak from the 1878 flood (1137.3 m a.s.l.), reported by Nicholson and Yin (2001), was added to the Lake Victoria record as a long-term historical benchmark. The Sudd was first analysed as an aggregated extent to establish system-scale context; subsequent analyses were disaggregated to sub-catchments. This benchmarking step established a reference framework for evaluating the persistence and magnitude of the 2019–2024 floods relative to earlier variability.
2.3 Seasonality of Annual Maxima in Lake Victoria, Lake Kyoga, and Lake Albert
Long-term changes in the timing of annual maximum lake levels for Lakes Victoria, Kyoga, and Albert, spanning 1950–2024 were analysed. Daily lake level records were aggregated into hydrological years, defined from March to February, to align with the main rainfall regime in the upper White Nile Basin (Nicholson, 2014; Sutcliffe and Parks, 1999). For each hydrological year, the annual peak was identified as the maximum daily lake level.
The seasonal timing of these peaks was then expressed relative to the hydrological calendar, converted to circular angles, and represented on polar diagrams where the radial dimension corresponded to relative peak magnitude (Fisher, 1995; Jammalamadaka and SenGupta, 2001). Circular mean dates were computed to capture the central tendency of peak timing, while median hydrological days were also calculated as a linear reference.
To investigate long-term shifts, peaks were aggregated by decade (1950s through 2020s). For each decade, circular mean peak dates and average magnitudes were computed, and only decades with at least five valid years were retained. The period 2018–2024 was highlighted separately, with individual years plotted in distinct colours and circular markers, to contrast recent anomalies against historical variability. This approach provided both a long-term baseline of seasonality and a detailed perspective on recent years when extreme wet conditions and widespread flooding were reported across the White Nile system (Pietroiusti et al., 2024; Tate et al., 2004; Vanderkelen et al., 2018a, 2018b). Detailed seasonal timing diagnostics and associated rainfall-anomaly analyses are provided in Sect. S2.
2.4 Flood wave Event Detection and Lag Estimation
Flood wave propagation was analysed using an event-based workflow (Fig. 2) anchored to Lake Victoria, the hydrological origin of the White Nile. The workflow defines events at the upstream boundary, tracks them sequentially through downstream segments, and estimates segmental lag from matched peak timing. Although MODIS-derived wetland extent began in mid-2002, a 2000 start date was retained for the remaining datasets to capture upstream events that originated before 2002 but produced delayed downstream impacts within the Sudd Wetland. A common analysis window from 2000 to 2024 was therefore adopted, with all datasets aligned to the Lake Victoria hydrological year. Supporting rainfall-anomaly and seasonal-timing analyses used for hydrological context are provided in Sect. S2.
Each flood wave was named by the hydrological year, defined from March to February, based on long-term Lake Victoria levels and regional hydrological dynamics, where February typically marks the annual minimum in the lake. This follows WMO guidance to align hydrological years with local natural flow regimes (WMO, 1994), grouping the March–May long-rains season, the May to early-June lake-level peak, and the September–November short rains within a single accounting cycle, while avoiding fragmentation of individual flood waves across calendar years (Camberlin and Philippon, 2002; Kite, 1982; Vanderkelen et al., 2018a).
Downstream segment peaks retained the Lake Victoria event name (hydrological year) even when occurring in the following calendar or hydrological year. For each hydrological year, the Lake Victoria peak was identified and the event was traced sequentially through three segments: Victoria–Kyoga, Kyoga–Albert, and Albert–Sudd Wetland (Fig. 2). The MODIS-derived Sudd Wetland extent was disaggregated into five sub-catchments (Bahr el Jebel, Bahr el Ghazal, Bahr el Arab, Baro Akobbo Sobat, and the White Nile; see Fig. 1) to examine spatial expansion and timing differences during high upstream lake level periods. Wetland extent was then derived for each sub-catchment, and the sequential analysis was extended to a fourth step linking Lake Albert to the sub-catchments. Subsequent analysis distinguished sub-catchments directly connected to the upstream lakes, for which this approach holds, from those responding primarily through spillover after the connected units. Chronology was enforced such that the downstream peak (DS) identified for a segment served as the upstream (US) reference for the next segment.
2.4.1 Peak Detection and Segmental Tracking
Peak detection and segmental tracking followed the event-based workflow illustrated in Fig. 2. For each hydrological year, the Lake Victoria event was defined as the annual maximum lake level occurring between April and June. This window coincides with the long-rains season and the typical timing of lake-level peaks near May (Camberlin and Philippon, 2002; Nicholson et al., 2021; Vanderkelen et al., 2018a, b), and restricting the search to this period reduces false detections outside the main wet season. Although continuous Lake Victoria outflow release records are not publicly available, the present analysis infers system-scale transit times from the timing of observed lake-level maxima and downstream hydrological responses rather than directly from regulated discharge series. Because Lake Victoria can store water over multi-season timescales, peak lake levels provide a robust indicator of basin-scale hydrological forcing propagating through the connected lake-river-wetland system. While regulated outflows may influence short-term discharge variability near the outlet, downstream propagation through Lakes Kyoga and Albert and the Sudd wetland is strongly moderated by large natural storage, attenuation, delayed release, and wetland buffering processes. Consequently, these regulations do not prevent the identification of the broader storage-mediated transit times that this study aims to quantify.
A centred 61 d window (±30 d) around the detected peak was extracted to represent the upstream event hydrograph. For each downstream segment, a forward 335 d search window was opened beginning the day after the upstream window ended. This one-year search horizon allows for slow transmission and storage effects while avoiding overlap with the next hydrological cycle.
The matched downstream peak became the upstream anchor for the next segment, where a new 335 d window was opened and the search repeated. Chronological consistency was enforced so that a downstream peak labelled year Y+1 could not occur earlier than any accepted peak from year Y. Any candidate violating this rule was discarded, and the next best match was evaluated. Years without a valid candidate within the search window were flagged as unmatched and were not propagated further downstream.
Within each downstream search window, the time series Qt were smoothed using a centered moving average following Eq. (1):
which suppresses short-lived oscillations without redefining event timing (Laaha et al., 2017; Van Lanen et al., 2013; Van Loon and Laaha, 2015). Candidate peaks were retained only if their prominence exceeds a site-specific threshold δ following Eq. (2):
Where and are the nearest local minima immediately preceding and following the candidate peak on the smoothed series. Prominence was measured relative to the higher of these two minima. Thresholds were tuned once per site after exploratory checks and then held fixed across years to prevent year-specific overfitting and to promote comparability.
From the pool of retained peaks within the downstream search window, we evaluated shape similarity to the upstream template by comparing centered 61 d, min–max-normalized windows and selecting the minimum root mean square error (RMSE) following Eq. (3):
where and are the min-max normalized values of upstream and downstream event hydrographs.
In cases of near-equal RMSE, the candidate with the smallest lag was selected to preserve chronological consistency, and hydrological plausibility, representing the earliest feasible downstream response which is the worst-case floodscenario which we should plan for in flood risk management. Years without a valid downstream match were flagged as signal degradation, typically due to flat hydrographs, merged peaks, or strong local forcing at the site. Automated matches were then visually reviewed, and manual adjustments were made only where automated picks clearly contradicted hydrological context, with the smallest change necessary to preserve event identity. This combined prominence-filtering and shape-matching framework, together with fixed windows and stable thresholds, provided a consistent basis for tracking flood-wave propagation across basins and years.
Sensitivity analysis of the event-matching framework is presented in Sect. S3 (Fig. S3). A one-at-a-time sensitivity analysis was conducted in which the smoothing-window length and downstream search horizon were systematically varied while the prominence threshold was held fixed at its baseline value. The smoothing window was varied from 1 to 90 d and the downstream search horizon from 20 d to approximately 3 years, extending beyond the parameter ranges adopted in the primary analysis. Results indicate that inferred system transit times remain comparatively insensitive to smoothing-window choice, whereas the downstream search horizon exerts the dominant control on lag estimation. For physically constrained search horizons ( years), inferred transit times consistently cluster around 15–17 months, supporting the mean Lake Victoria-to-Sudd transit time reported in this study (16.84±1.95 months).
Matched upstream and downstream peaks were subsequently connected using spline overlays over the time series to visualise flood-wave propagation through the system.
2.4.2 Lag Estimation
Once the peaks were identified and matched, segmental lag time was computed for each year i following Eq. (4):
where and represent the upstream and downstream matched peak dates. Lags estimates were computed for 2000 to 2024 and summarised by segment. Lags for 2019 to 2024 high-water period were additionally compared against the 2000 to 2018 baseline to assess departures associated with the prolonged high lake levels period and downstream wetland expansion.
2.5 Lake Victoria annual maxima and downstream wetland extent in South Sudan sub-catchments
To quantify how the annual Lake Victoria maximum levels relate to wetland extent in South Sudan sub-catchments, correlations were computed for each hydrological year. For each hydrological year, as already described in the previous sections of this paper, a single peak date when the Lake Victoria annual maxima occurs was taken as our starting point t=0. Flooded areas from MODIS satellite datasets at a dekadal scale were evaluated at fixed lags t=0 months to t=24 months. Correlations between the Lake Victoria annual maximum and lagged wetland extents are computed separately for 2002 to 2018 and 2019 to 2023 to contrast the longer baseline with recent high-water conditions.
Wetland area per evaluation date was derived using a four-dekad rolling union consisting of the current dekad and the preceding three dekads. A pixel was classified as wet if it was mapped wet at least once within that four-dekad window. This short compositing window reduces omission errors associated with cloud cover, haze, view geometry, and short-lived classification noise in optical surface-water products, while keeping hydrologically meaningful monthly-scale inundation dynamics. Short temporal compositing is widely used to stabilise water detection under intermittent obscuration and algorithm noise, and is suitable for large water bodies and floodplains observed by the Landsat and Sentinel series (Donchyts et al., 2016; Pekel et al., 2016). A one-month window is short relative to routing and storage in the Sudd and the Upper White Nile, yet long enough to bridge single contaminated scenes.
Lag definition follows the flood-wave tracking evidence for this basin from Sects. 2.4 and 3.2. Lags from zero to twenty four months are sufficient to capture responses from near-local wetting to the longest routed signals through the Sudd and upper White Nile, consistent with multi-month storage and travel times in this system (Nicholson, 2017; Sutcliffe and Parks, 1999). At each lag, the four-dekad union was formed and wet pixels inside each sub-catchment mask were counted to give flooded area in square kilometres. Using Pearson correlation, the relationship between the Lake Victoria peak level at t=0 and sub-catchment wetland area at lag L was summarised as r2 to emphasise variance. Visual diagnostics included r2 as a function of lag and wet-area curves by hydrological year with period means and min-max shading for context and spread (Wilks, 2011).
The four-dekad union can retain short-lived floods that decay within weeks, which may slightly inflate wet area at some lags, although the one-month window bounds this effect and mitigates larger omission errors from single scenes. Using a fixed average month length introduces a day-scale offset at long lags, which is minor relative to dekadal resolution. Pearson correlation measures linear association and does not separate rainfall forcing from storage and routing, so estimated relationships reflect the combined influence of upstream storage in Lake Victoria and local hydro-meteorological processes (Nicholson, 2017; Wilks, 2011).
2.6 Flood-Persistence Mapping to Track Sudd Wetland Activation
Flood persistence was assessed using the dekadal MODIS flood-extent series described in Sect. 2.1. For each month, we generated a four-dekad union by combining the file dated on the first of the month with the preceding three dekadal scenes. A pixel was considered wet if it was mapped wet in any of the four inputs. This short compositing window follows established surface-water mapping practice to stabilise detection under cloud and algorithm noise while retaining the signal of sustained inundation (Lin et al., 2019; Mueller et al., 2016; Pekel et al., 2016).
This monthly-union approach extends the method in Sect. 2.5 to a calendar-month scale, aligning with the 180 d SPI-6 framework (see Sect. S2) that captures multi-month hydrological memory. The analysis was applied across the five South Sudan sub-catchments to quantify persistence of inundation through successive months. These month-to-month persistence patterns were used to highlight zones exhibiting behaviour consistent with possible wetland water pathways activation, defined as the onset of inundation and hydraulic connectivity when inflow exceeds local wetland storage thresholds (Junk et al., 1989), and with backwater effects, in which elevated downstream water levels impede outflow or reverse tributary flow, raising upstream water levels (Zhang et al., 2023).
3.1 Evidence of a System-Wide Hydrological Anomaly (2019–2024)?
Between 2019 and 2024, the White Nile system experienced a sequence of multi-year basin-wide flood anomalies characterised by a sustained high-water regime across both upstream lakes and downstream wetlands. Lake Victoria reached peak water levels of 1136.48 m a.s.l. in 2020, 1136.50 m a.s.l. in 2021, and 1136.66 m a.s.l. in 2024, each exceeding the historical maximum of 1136.42 m a.s.l. observed in 1964. Over the same period, the Sudd Wetland expanded beyond all previously observed MODIS-era extents. The maximum inundated area reached 163 475 km2 in 2022, while each year from 2019 to 2024 exceeded the prior maximum extent of 81 496 km2 (2016), with annual maxima of 120 680, 111 684, 111 480, 163 475, 122 292, and 116 359 km2 respectively. Figure 3 shows these anomalies, with the 2019–2024 period highlighted in blue and 2022 marked explicitly as a grey vertical strip.
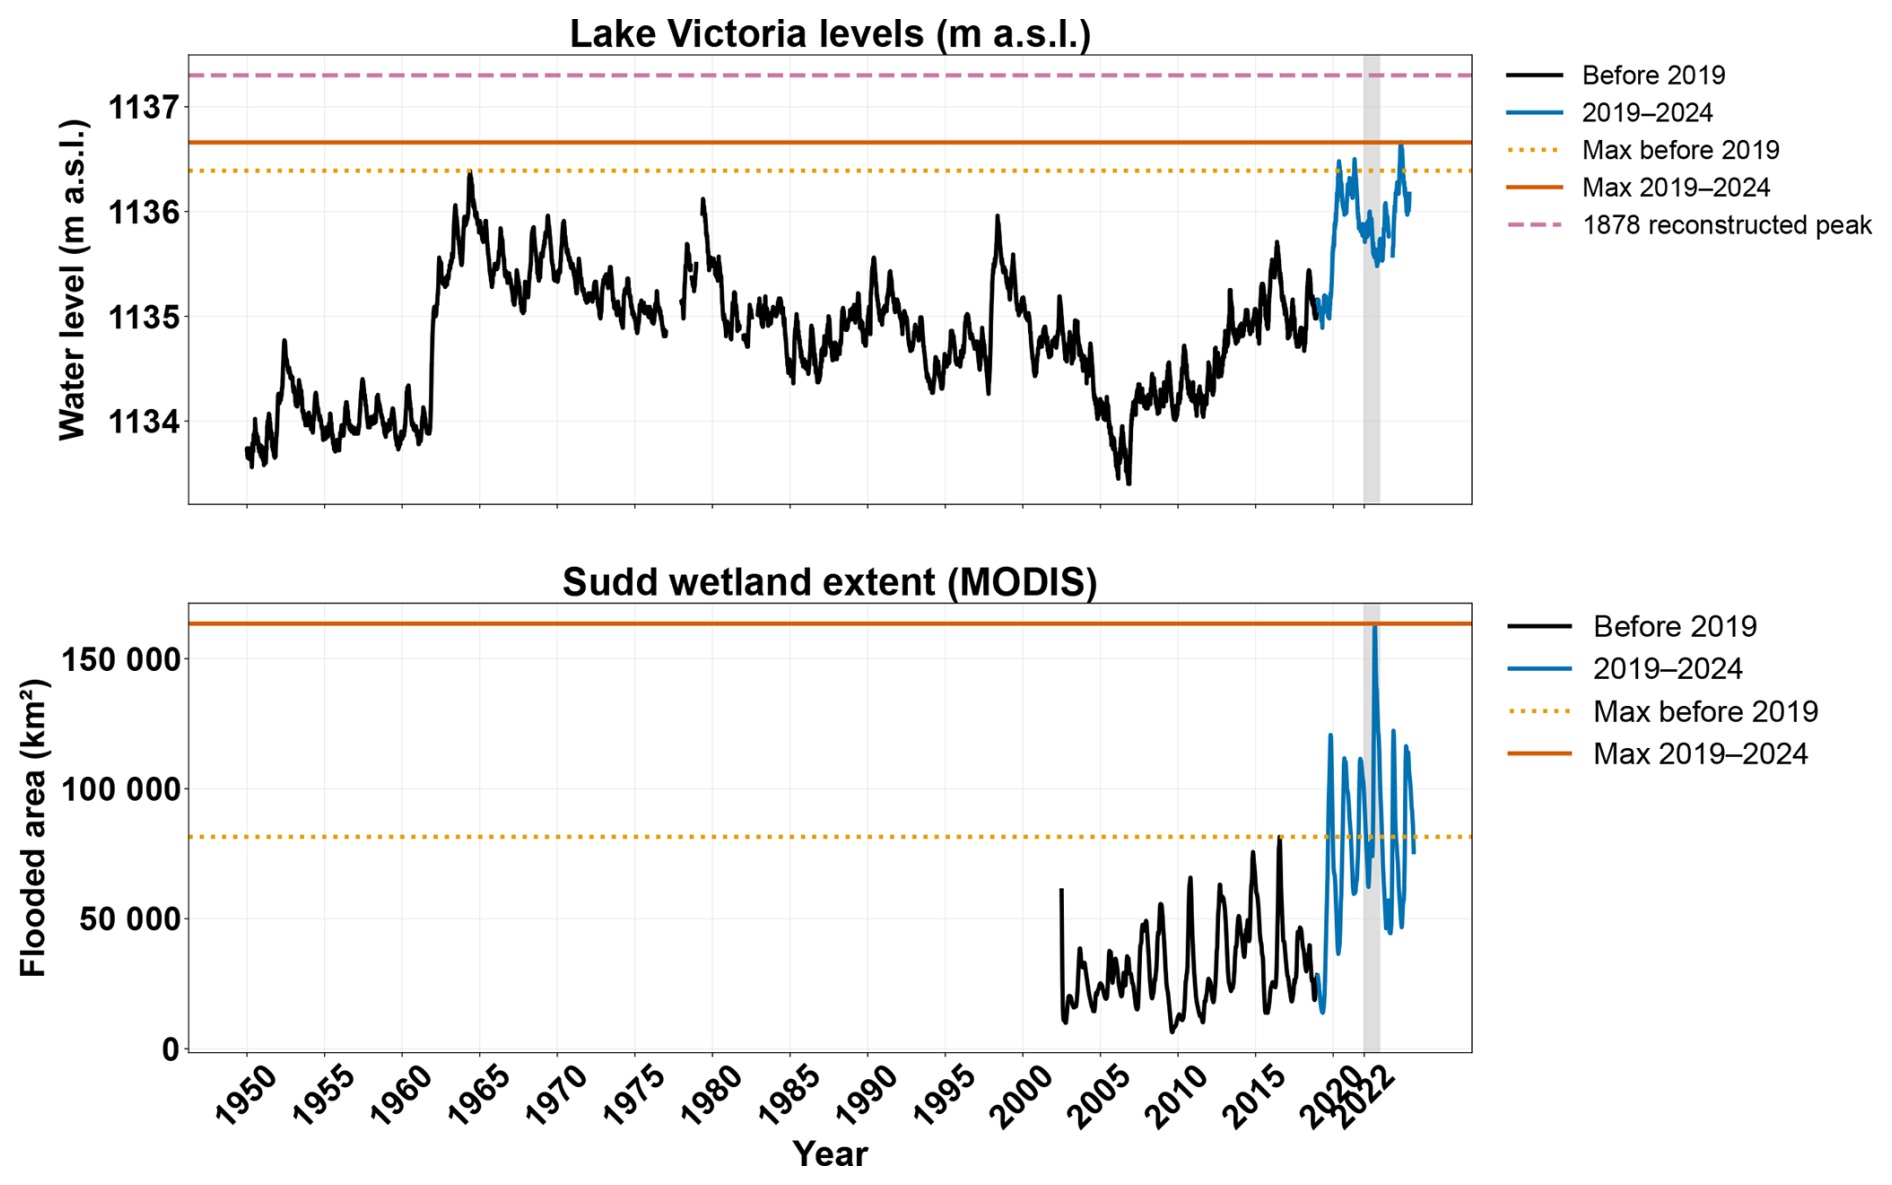
Figure 3Lake Victoria water levels (1950–2024) and Sudd Wetland extents (2002–2024), with the 2019–2024 anomalous period shown in dark blue and earlier observations in black. The orange dotted line marks the pre-2019 maximum, while the solid vermillion line denotes the highest peak observed during 2019–2024. The dashed magenta line represents the reconstructed 1878 Lake Victoria peak (1137.3 m a.s.l.) from Nicholson and Yin (2001). The shaded grey band highlights the 2022 flood year, when the Sudd reached its largest extent in the MODIS record.
These concurrent upstream and downstream extremes confirm that both the headwaters (Lake Victoria) and terminal floodplain (Sudd Wetland) remained at record levels during overlapping intervals between 2019 and 2024. Crucially, these multi-year anomalies persisted across consecutive years rather than occurring as isolated seasonal peaks in a single hydrological year. This persistence behaviour reflects a system-wide hydrological response across the lake–river–wetland complex system, rather than independent local events. This temporal persistence mirrors the duration of historical flood clusters, such as the 1961–1964 episode, signals a sustained high-water regime rather than a series of discrete seasonal peaks, but with a distinct spatial expression that simultaneously involves both upstream storage and downstream floodplain expansion.
3.2 Rainfall, Lake Response and Seasonal Timing
SPI-6 anomalies indicated a coherent multi-season wet period beginning in late 2019 and persisting through 2020–2021 across much of the Upper White Nile basin. The strongest positive anomalies occurred within the Lake Victoria contributing catchments, while downstream sub-catchments exhibited greater spatial variability. These prolonged wet conditions coincided with sustained high lake levels throughout the Victoria-Kyoga-Albert system during 2019–2024. Detailed SPI-6 diagnostics for all lake and Sudd sub-catchments are presented in Sect. S2 (Figs. S1–S2).
Annual maxima exhibited a clear downstream progression in seasonal timing from Lake Victoria to Lakes Kyoga and Albert, consistent with increasing storage-mediated attenuation and delayed propagation through the lake-river cascade. During the 2019–2024 high-water period, however, peak timing became more irregular, with sustained elevated levels persisting across multiple hydrological seasons in both the lake and wetland systems. Detailed seasonal timing diagnostics and rainfall-anomaly analyses are presented in Sect. S2.
3.3 Flood wave Propagation Through the White Nile System
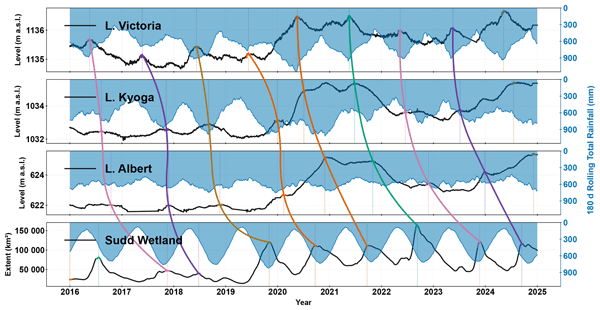
Flood wave tracking between 2000 and 2024 reveals pronounced spatial and interannual variability in lag times from Lake Victoria to the Sudd Wetland (Fig. 4). Total system transit times ranged from 13.0 to 20.9 months, with a mean of 16.84±1.95 months. Propagation was fastest during 2019–2021, coinciding with sustained high upstream storage and releases from Lake Victoria, whereas the 2022 hydrological year exhibited the strongest delays, particularly across the low-gradient Albert-Sudd reach. These fluctuations highlight the dominant control of intermediate storage and wetland attenuation within the White Nile corridor (Mohamed et al., 2005a; Mohamed and Savenije, 2014; Nicholson, 2017; Sutcliffe and Parks, 1999).
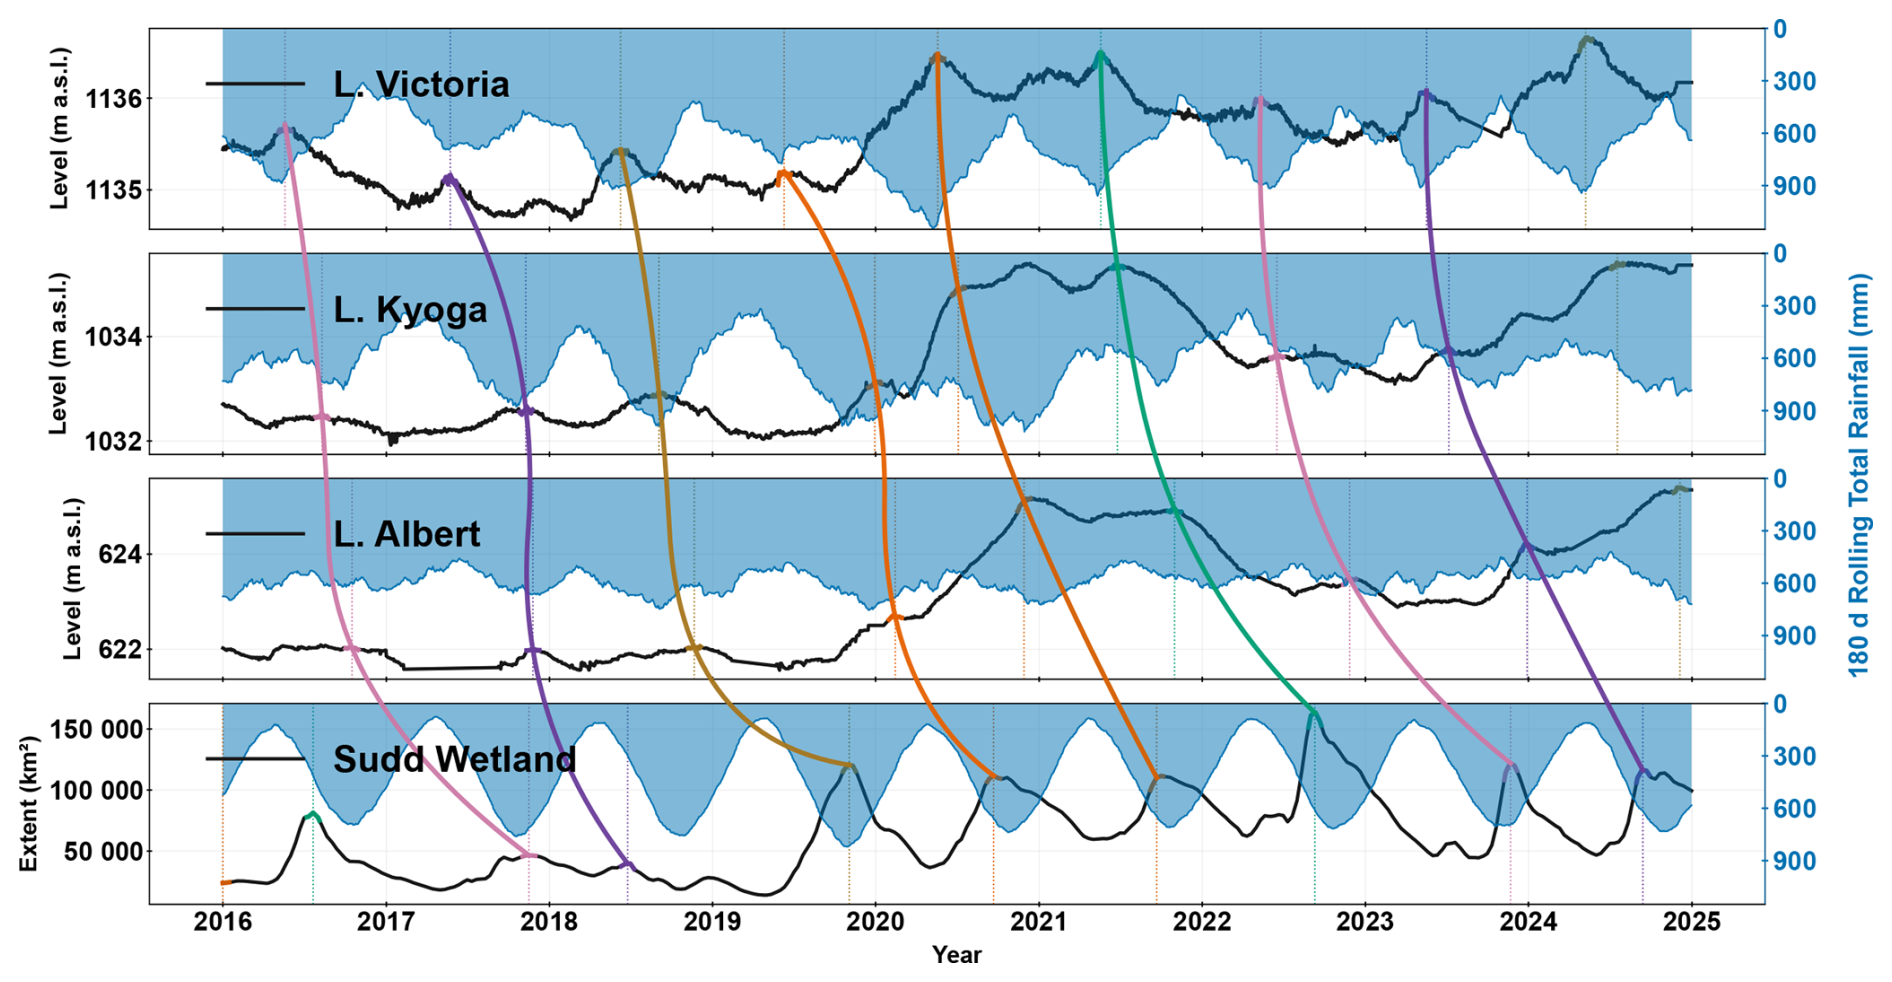
Figure 4Lake Victoria, Lake Kyoga, and Lake Albert water levels, and Sudd Wetland inundated extent, from 2016 to 2024. Coloured spline curves indicate annual flood-wave trajectories traced from the timing of Lake Victoria annual maxima through the downstream of the White Nile system. Blue shading on the secondary (right) axis shows 180 d rolling rainfall totals over each basin. The panel sequence (Victoria–Kyoga, Kyoga–Albert, Albert–Sudd) highlights the progressive translation of flood waves through the connected lake–river–wetland network.
Crucially, the derived mean transit time of approximately 17 months is substantially longer than the four-to-five-month timescale commonly inferred from seasonal peak alignment between Lake Victoria and the Sudd wetlands, overturning the long standing assumption that flood translation from Lake Victoria to South Sudan occurs within approximately four-to-five months. This difference shows that the observed seasonal offset does not represent direct flood-wave propagation, but instead reflects the combined effects of storage, attenuation, and delayed release across the lake–wetland system. Seasonal alignment therefore captures the timing of system response rather than the physical translation of water through the basin. Flood-wave tracking provides a direct measure of propagation by following individual events through the Victoria–Kyoga–Albert–Sudd cascade. In contrast, the lagged correlations between Lake Victoria levels and downstream wetland extent, presented in Sect. 2.5, quantify the strength and timing of association between upstream and downstream states. These correlations are essential for identifying hydraulic connectivity and system memory, but they integrate the combined influence of upstream storage, routing, local rainfall, and wetland dynamics, and therefore do not represent transit time itself. The agreement between the two approaches, with strongest correlations emerging at multi-month to annual lags, supports a long-memory system while distinguishing statistical association from physical propagation.
To provide meteorological context, Figs. 4 and 5 overlay 180 d rolling rainfall totals aggregated over each contributing basin. This accumulation window mirrors the SPI-6 approach discussed earlier and captures the multi-month persistence of the 2019–2021 pluvial episode. The rainfall series show that the sharp system-wide wave initiated in 2019 was driven by the basin-wide positive IOD-forced rainfall anomaly, while its continued downstream propagation through 2020–2022 reflects long multi-year hydrological memory and slow drainage rather than renewed rainfall input. In contrast, the Baro Akobbo Sobat basin displayed an independent flood pulse during 2019, closely aligned with its local rainfall peak, confirming its rainfall-dominated flood response and only limited hydraulic coupling with the upstream lake system (Alfieri et al., 2024; Nicholson et al., 2021; Wainwright et al., 2021). This contrast highlights that while the main Nile corridor is governed by upstream storage and propagation, parts of the eastern basin retain strong local rainfall control.
Across the main lake chain, Lake Victoria annual maxima generally occur toward the end of the MAM long rains, often coinciding with or shortly following the month of highest rainfall over the Victoria basin. Lake Kyoga peaks follow with a clear lag, reflecting both local rainfall and delayed inflow from Victoria, while Lake Albert peaks occur after Kyoga, indicating a dominant contribution from the upstream flood wave rather than local rainfall timing. Within the Sudd, however, this rainfall–response relationship breaks down. Rainfall follows a JJAS regime, and under a rainfall-dominated system the inundation peak would be expected to align with this period. Instead, observed Sudd maxima occur later in the season, indicating a dominant contribution from the upstream flood wave rather than local rainfall timing. This delay reflects the influence of the Sudd's low-relief paleo-lake surface, which promotes extensive storage, slow drainage, and sustained backwater effects. Other sources may also contribute, for example groundwater inputs, which were not examined in this study. The rainfall series are spatially aggregated over contributing areas, and the Sudd extent shown is an area-wide total; both choices limit attribution.
3.3.1 Segmental Transit Times (Victoria–Kyoga–Albert–Sudd)
-
Victoria–Kyoga segment. For the hydrological years 2000 to 2024, the Victoria–Kyoga segment, characterized by confined channel morphology, exhibited a mean lag of 4.20 months (±2.52 months), with values ranging from 0.3 to 11.1 months, indicating substantial variability in this short reach. In 2018, the Victoria-Kyoga lag was 2.8 months, close to the long-term mean. It shortened to 1.5 months in 2019, and reached minima of 1.5 and 1.2 months in 2020 and 2021 respectively, coinciding with sustained high levels in Lake Victoria. The segment remained fast in 2022 (1.2 months) and 2023, confirming the dominant influence of high upstream storage on the transit times in this segment (Pietroiusti et al., 2024; Sutcliffe and Parks, 1999).
-
Kyoga–Albert segment. This transitional reach, influenced by extensive wetlands and floodplain storage around Lake Kyoga, exhibited more pronounced delays than the Victoria–Kyoga segment. From 2000 to 2024, lags ranged from 0.5 to 10.5 months, with a mean of 3.39 months (±2.55 months). In 2018, the lag was 2.6 months, decreasing to 1.5 months in 2019. However, the segment slowed markedly in 2020 (4.8 months) and 2021 (4.2 months), despite fast upstream passage, reflecting the buffering role of wetlands around Lake Kyoga. It remained prolonged in 2022 (5.4 months) and 2023 (5.7 months), both above the long-term mean.
-
Albert–Sudd segment. This long, low-gradient reach contributed the largest share of the overall system delay, reflecting the extensive floodplain and wetland storage that characterise the Sudd region. Between 2000 and 2024, transit times ranged from 6.8 to 12.5 months, with a mean of 9.25 months. In 2018, the lag was 11.4 months, close to the system average. It shortened sharply in 2019 to 7.2 months, the fastest since 2000, before increasing to 9.8 and 10.3 months in 2020 and 2021. These longer lags indicate the onset of pronounced attenuation within the wetland system, which culminated in the extreme flooding observed in 2022 as a downstream response to the 2021 Lake Victoria peak (Fig. 4). The longest lag in the 2018–2024 sequence occurred in 2022 (11.8 months), reflecting a delayed manifestation of the multi-year high-storage phase and the gradual reversal of attenuation processes as upstream lake levels began to decline in late 2022 into 2023. The 2022 inundation in the Sudd therefore reflects not a single-season rainfall anomaly but the compounded influence of sustained high inflows, prolonged wetland saturation, and backwater propagation through the White Nile corridor.
The Sudd extent used in the analysis in this analysis represents the combined flooded area across Bahr el Jebel, Bahr el Ghazal, Baro Akobbo Sobat, Bahr el Arab, and the White Nile sub-catchments. While this aggregate captures the overall hydrological response of the lower basin, not all these sub-catchments are directly influenced by lake-fed flows. Baro Akobbo Sobat and Bahr el Arab, for instance, respond mainly to local rainfall and tributary inflow, whereas Bahr el Jebel and Bahr el Ghazal are strongly affected by upstream discharges, wetland activation and backwater effects. These differences are examined further in Sect. 3.3.2, where the Sudd is disaggregated into its component sub-catchments to clarify spatial connectivity and coupling to upstream lakes.
-
Victoria–Sudd (White Nile). At the system scale, the Victoria-Sudd lag averaged 16.84±1.95 months (∼17 months) over 2000–2024, ranging from 13.0 to 20.9 months. In 2018 it was 16.8 months, effectively equal to the long-term mean of approximately 17 months. Rapid downstream passage in 2019 shortened the lag to 15.4 months. In 2020 and 2021 the totals were below the mean, consistent with very short Victoria–Kyoga lags, but longer Kyoga–Albert transits (4.8 and 4.2 months) and longer Albert–Sudd transits (9.8 and 10.3 months) prevented the system from matching the 2019 minimum. The maximum occurred in 2022 at 18.4 months, driven by slowdowns in Kyoga–Albert and Albert–Sudd, before shortening again in 2023 to 15.9 months due to a faster Albert–Sudd passage.
3.3.2 Transit Time Variability at Sub-Catchment Scale in South Sudan
Flood wave transit times across the South Sudan sub-catchments varied spatially with proximity to the White Nile main channel, degree of hydraulic connectivity to upstream lakes, and tributary influence. Hydrological years 2018 to 2023 are considered, focusing on downstream progression of flood signals from Lakes Victoria, Kyoga, and Albert into five major sub-catchments: Bahr el Jebel (BeJ), Bahr el Ghazal (BeG), Baro Akobbo Sobat (BAS), Bahr el Arab (BeA), and the White Nile (WN). Interpretation requires caution given the exceptionally flat paleo-lake topography in South Sudan. In the Sudd Wetland and surrounding zones, minimal elevation gradients allow extensive lateral flow and seasonal inundation that blur hydrological boundaries between adjacent catchments. The delineated sub-catchment borders should therefore be treated as indicative rather than hydrologically rigid. During high flows, water from Bahr el Jebel can spill laterally into Bahr el Ghazal and Bahr el Arab via braided channels; wetland expansion can also propagate from Bahr el Jebel into the White Nile corridor, even though the White Nile functions as the wetland outlet. On the eastern side, Baro Akobbo Sobat can connect to both Bahr el Jebel and the White Nile through seasonal overflow and wetland growth; between Baro Akobbo Sobat and Bahr el Jebel the linkage is bi-directional, with either sub-catchment able to spill into the other depending on which is more flooded. These dynamics support inclusion of all five sub-catchments in the transit-time analysis, even where observed responses are not strictly downstream of Lake Victoria. Results therefore should be read as indicative of regional flood coherence and wetland-scale connectivity, rather than direct channel routing alone within specific sub-catchments.
Bahr el Jebel (BeJ), positioned immediately downstream of Lake Albert, recorded an average flood wave transit time of 18.01 months from Lake Victoria between 2002 and 2023, with a standard deviation of 2.16 months and a range of 11.9 to 21.2 months. Transit times from Lake Albert to BeJ over the same period averaged 11.66 months, with a standard deviation of 2.39 months and a range of 4.8 to 14.6 months. Annual lags from Victoria to BeJ were 17.0 months in 2018, 16.9 in 2019, 17.1 in 2020, 17.2 in 2021, 18.3 in 2022, and 17.5 in 2023. Corresponding lags from Lake Albert were 11.6 months in 2018, 8.7 in 2019, 10.7 in 2020, 11.8 in 2021 and 2022, and 10.1 in 2023. The flood extent in BeJ closely followed hydrograph peaks of the upstream lakes, particularly Lake Albert, with sharp and sustained rises evident in 2020, 2021, and 2022 indicating strong hydraulic connectivity (Fig. 5).
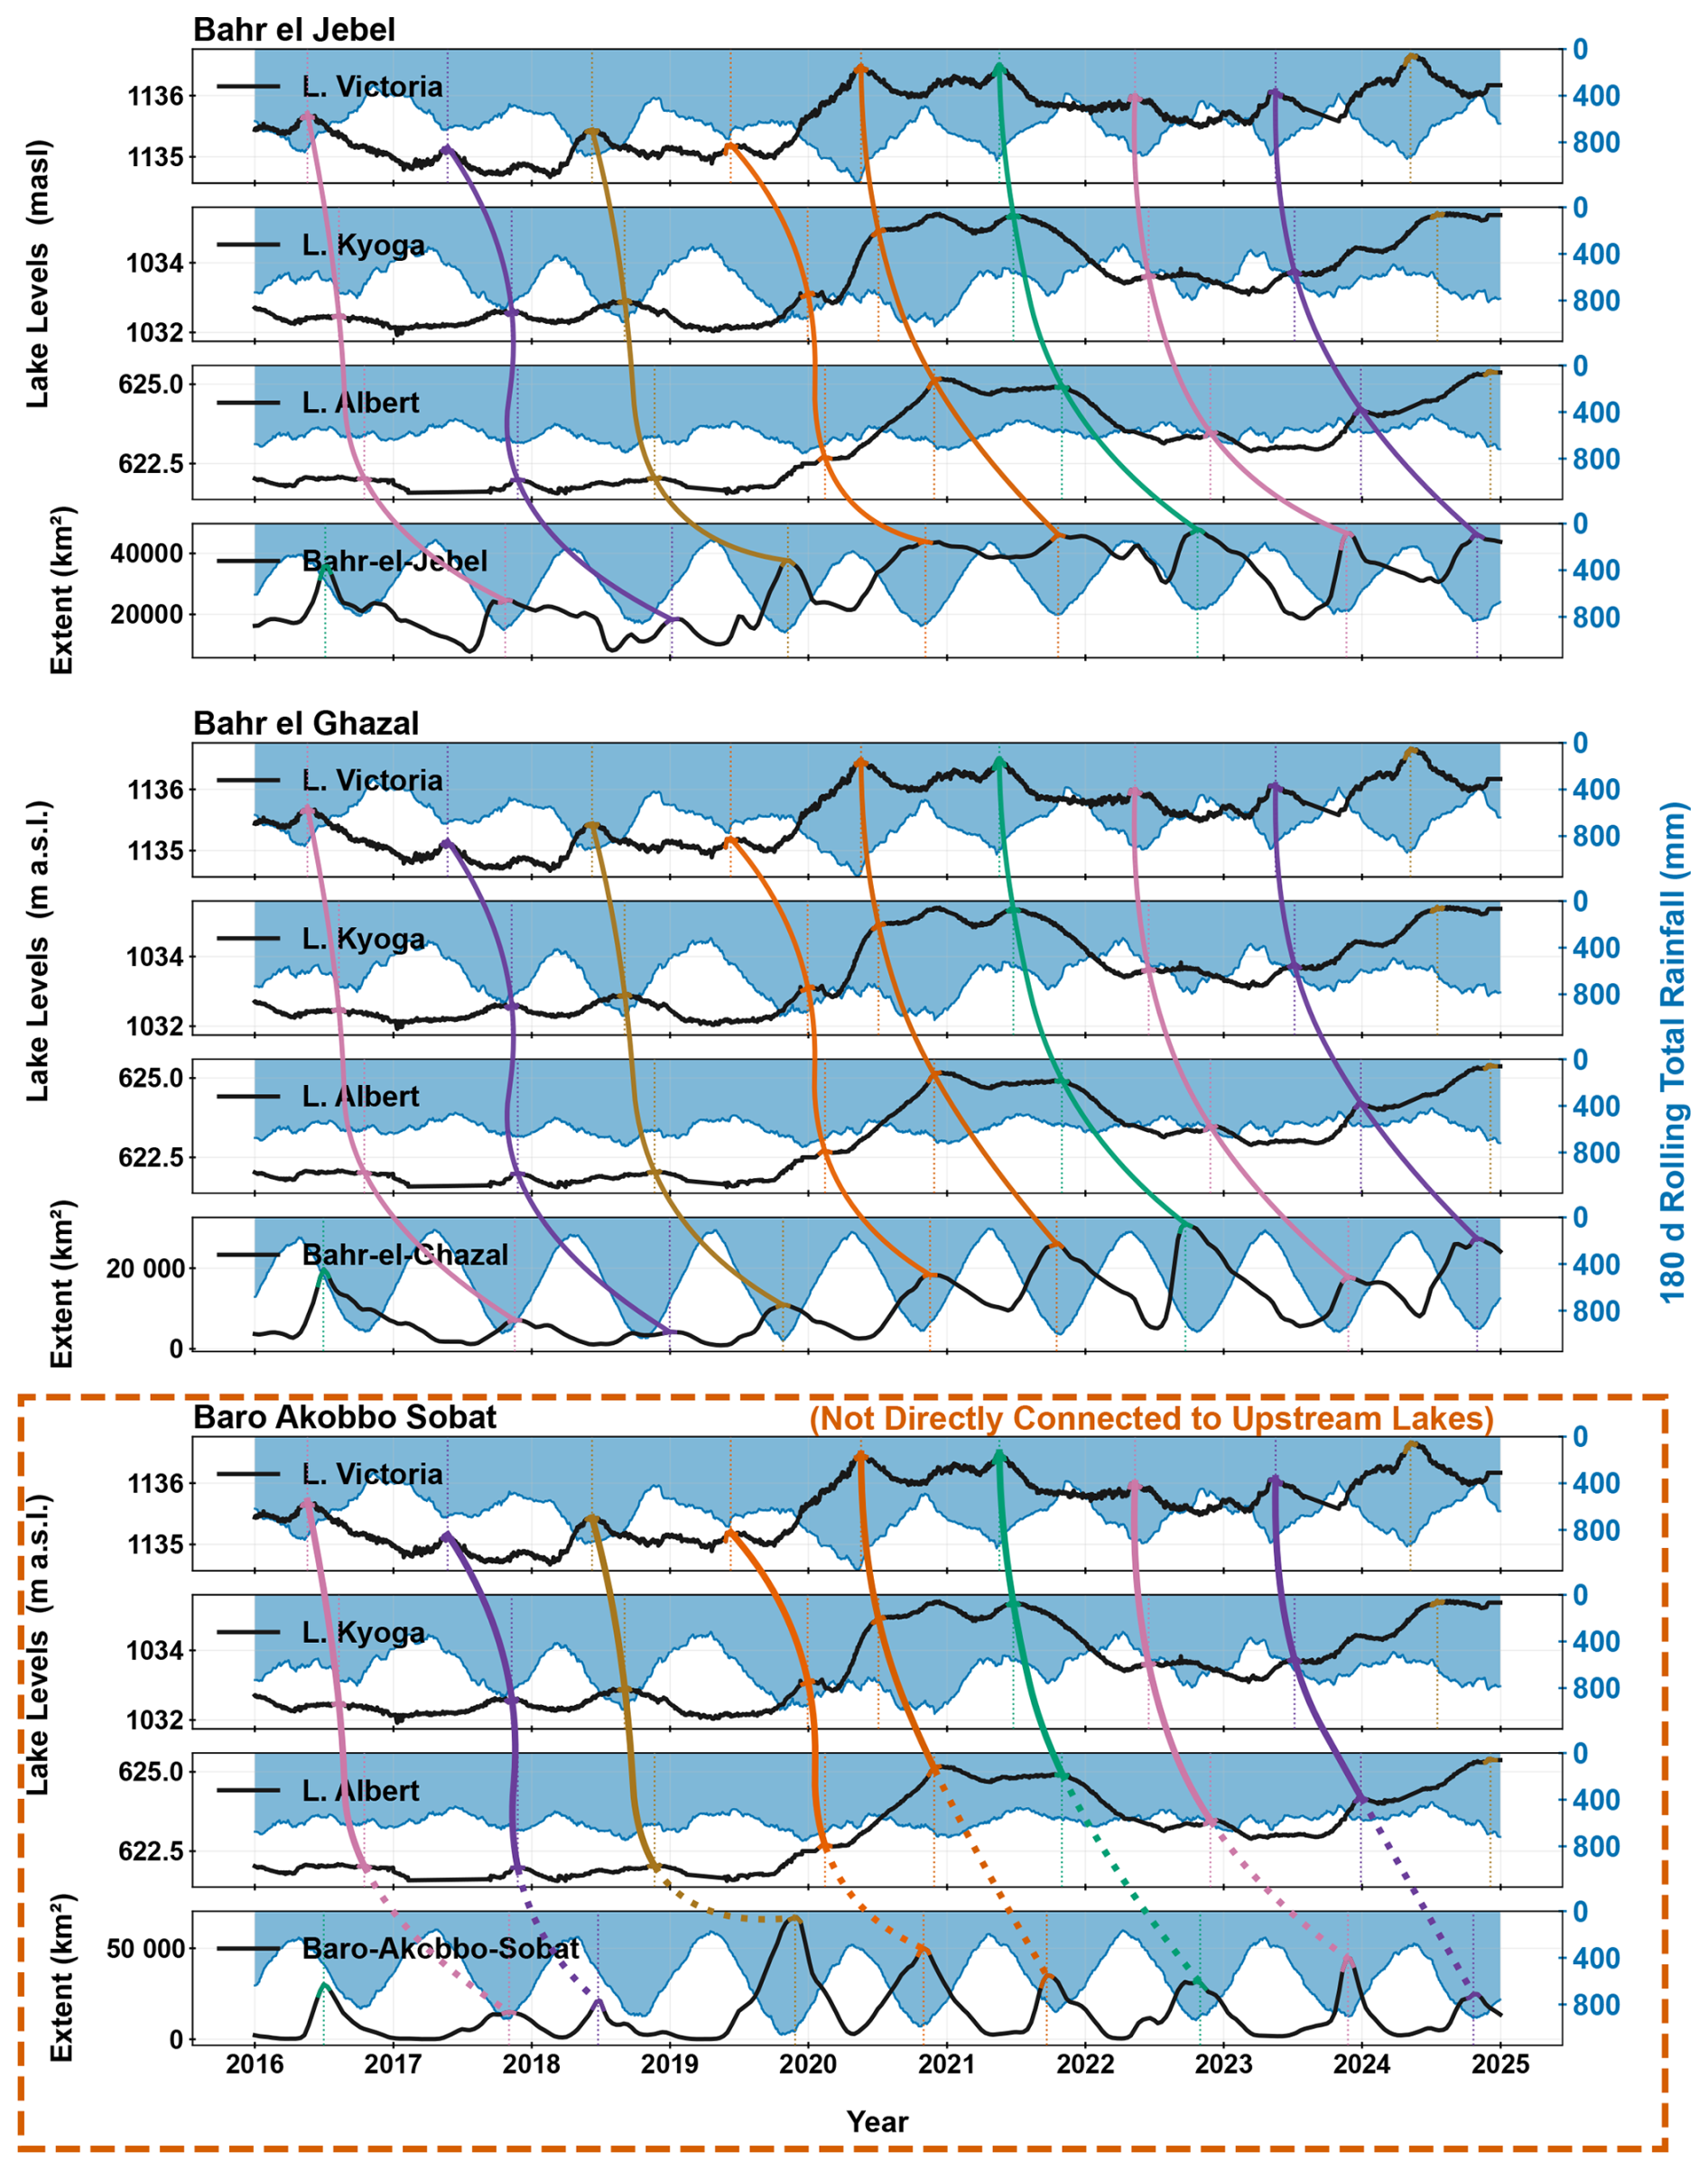
Figure 5Lake levels for Lake Victoria, Lake Kyoga, and Lake Albert, with dekadal wetland extent shown in the bottom panel of each subplot for the Sudd sub-catchments (Bahr el Jebel, Bahr el Ghazal, and Baro-Akobbo-Sobat) from 2016 to 2024. The top three panels are identical across subplots, while the bottom panel varies by sub-catchment. Coloured spline curves show annual flood-wave trajectories tracked from Lake Victoria through the lake-river-wetland system. The shaded blue areas on the secondary (right) axis represent 180 d rolling rainfall totals for each sub-catchment. The Baro-Akobbo-Sobat panel is outlined to highlight its limited direct hydraulic connection to the upstream lake chain.
Bahr el Ghazal (BeG) recorded a mean flood wave transit time of 17.01 months from Lake Victoria between 2002 and 2024, with a standard deviation of 1.25 months and a range of 13.0 to 19.3 months. From Lake Albert, the average lag was 10.65 months, with a standard deviation of 1.65 months and a range of 6.0 to 13.4 months. Year-specific lags from Lake Victoria were 16.6 months in 2018, 17.3 in 2019, 17.0 in 2020, 16.1 in 2021, 18.5 in 2022, and 17.5 in 2023. Corresponding lag times from Lake Albert were 11.1 months in 2018, 9.1 in 2019, 10.6 in 2020, 10.7 in 2021, 12.0 in 2022, and 10.1 in 2023. The BeG hydrograph showed a consistent lag behind Albert with visibly dampened peaks. During high BeJ stages, braided channels into BeG and partial backwater connectivity were activated. These conditions suggest delayed transmission, slowed by Bahr el Jebel flooding that activated braided connections into BeG, and by partial backwater influence within BeG rather than direct propagation from the upstream lakes (Fig. 5).
Baro Akobbo Sobat (BAS) recorded a mean flood wave transit time of 16.32 months from Lake Victoria between 2002 and 2023, with a standard deviation of 1.56 months and a range of 13.0 to 18.5 months. From Lake Albert, the mean lag was 9.98 months (standard deviation 2.03 months; range 6.0 to 13.2 months). Year-specific lag times from Lake Victoria were 17.6 months in 2018, 16.7 in 2019, 16.1 in 2020, 17.4 in 2021, 18.5 in 2022, and 17.1 in 2023. From Lake Albert, lags were 12.2 months in 2018, 8.5 in 2019, 9.8 in 2020, 12.0 in 2021, 11.9 in 2022, and 9.8 in 2023. The 2019 flood extent in BAS showed a sharp and early rise that appeared disconnected from upstream trajectories, reinforcing the segment's local rainfall sensitivity and limited coupling to upstream lake-fed flows. Other sources may also contribute, for example groundwater inputs, which were not examined in this study (Fig. 5).
Bahr el Arab (BeA) recorded the shortest average transit time among the Sudd sub-catchments, with a mean lag of 15.60 months from Lake Victoria (standard deviation 1.35 months; range 14.3 to 19.7 months). The corresponding lag from Lake Albert averaged 9.26 months (standard deviation 1.50 months; range 6.8 to 12.6 months). Year-specific lag times from Lake Victoria were 14.7 months in 2018, 14.9 in 2019, 15.5 in 2020, 15.6 in 2021, 14.6 in 2022, and 15.7 in 2023. From Lake Albert, the lags were 9.2 months in 2018, 6.8 in 2019, 9.1 in 2020, 10.2 in 2021, 8.0 in 2022, and 8.3 in 2023. BeA showed isolated flood pulses with steep rises that aligned more with seasonal rainfall than with upstream wave propagation. Connectivity with Bahr el Jebel was intermittent. In 2022, partial alignment was evident and coincided with the very large extent in BeJ that followed multi-year high upstream lake levels; during this period, BeA showed wetland activation attributed to lateral spill from BeJ.
The White Nile (WN) sub-catchment recorded a mean transit time of 18.02 months from Lake Victoria between 2018 and 2024 (standard deviation 1.01 months; range 16.1 to 19.5 months), and 11.67 months from Lake Albert (standard deviation 1.30 months; range 9.3 to 14.6 months). Year-by-year lags from Lake Victoria were 16.7 months in 2018, 19.5 in 2019, 19.4 in 2020, 16.1 in 2021, 18.5 in 2022, and 19.5 in 2023. The corresponding lags from Lake Albert were 11.3 months in both 2018 and 2019, 13.0 in 2020, 10.7 in 2021, 11.9 in 2022, and 12.2 in 2023. Relative to other WN years, 2021 and 2022 showed notably larger extents, coincident with very large extents in Bahr el Jebel. During these periods, lateral spill from BeJ activated wetland areas within the WN corridor. The White Nile sub-catchment extent hydrograph demonstrated a stable, dampened and smoothed flood response consistent with its role as the integrated outlet of the upstream lake and wetland system.
Overall, the downstream delay sequence (Bahr el Jebel–Bahr el Ghazal–Bahr el Arab/White Nile) and the local rainfall signal in Baro Akobbo Sobat demonstrate that flood wave behaviour across the Sudd region reflects both longitudinal translation and lateral connectivity. The morphology of this former lake plain, coupled with extensive wetlands and distributary channels, supports spill, backwater, and seasonal re-activation processes that prolong flood residence and modulate peak timing (Hardy et al., 2023; Mohamed and Savenije, 2014). These spatial patterns and timings establish the foundation for the correlation analysis in Sect. 3.4, where we quantify how the Lake Victoria signal is expressed across the South Sudan sub-catchments.
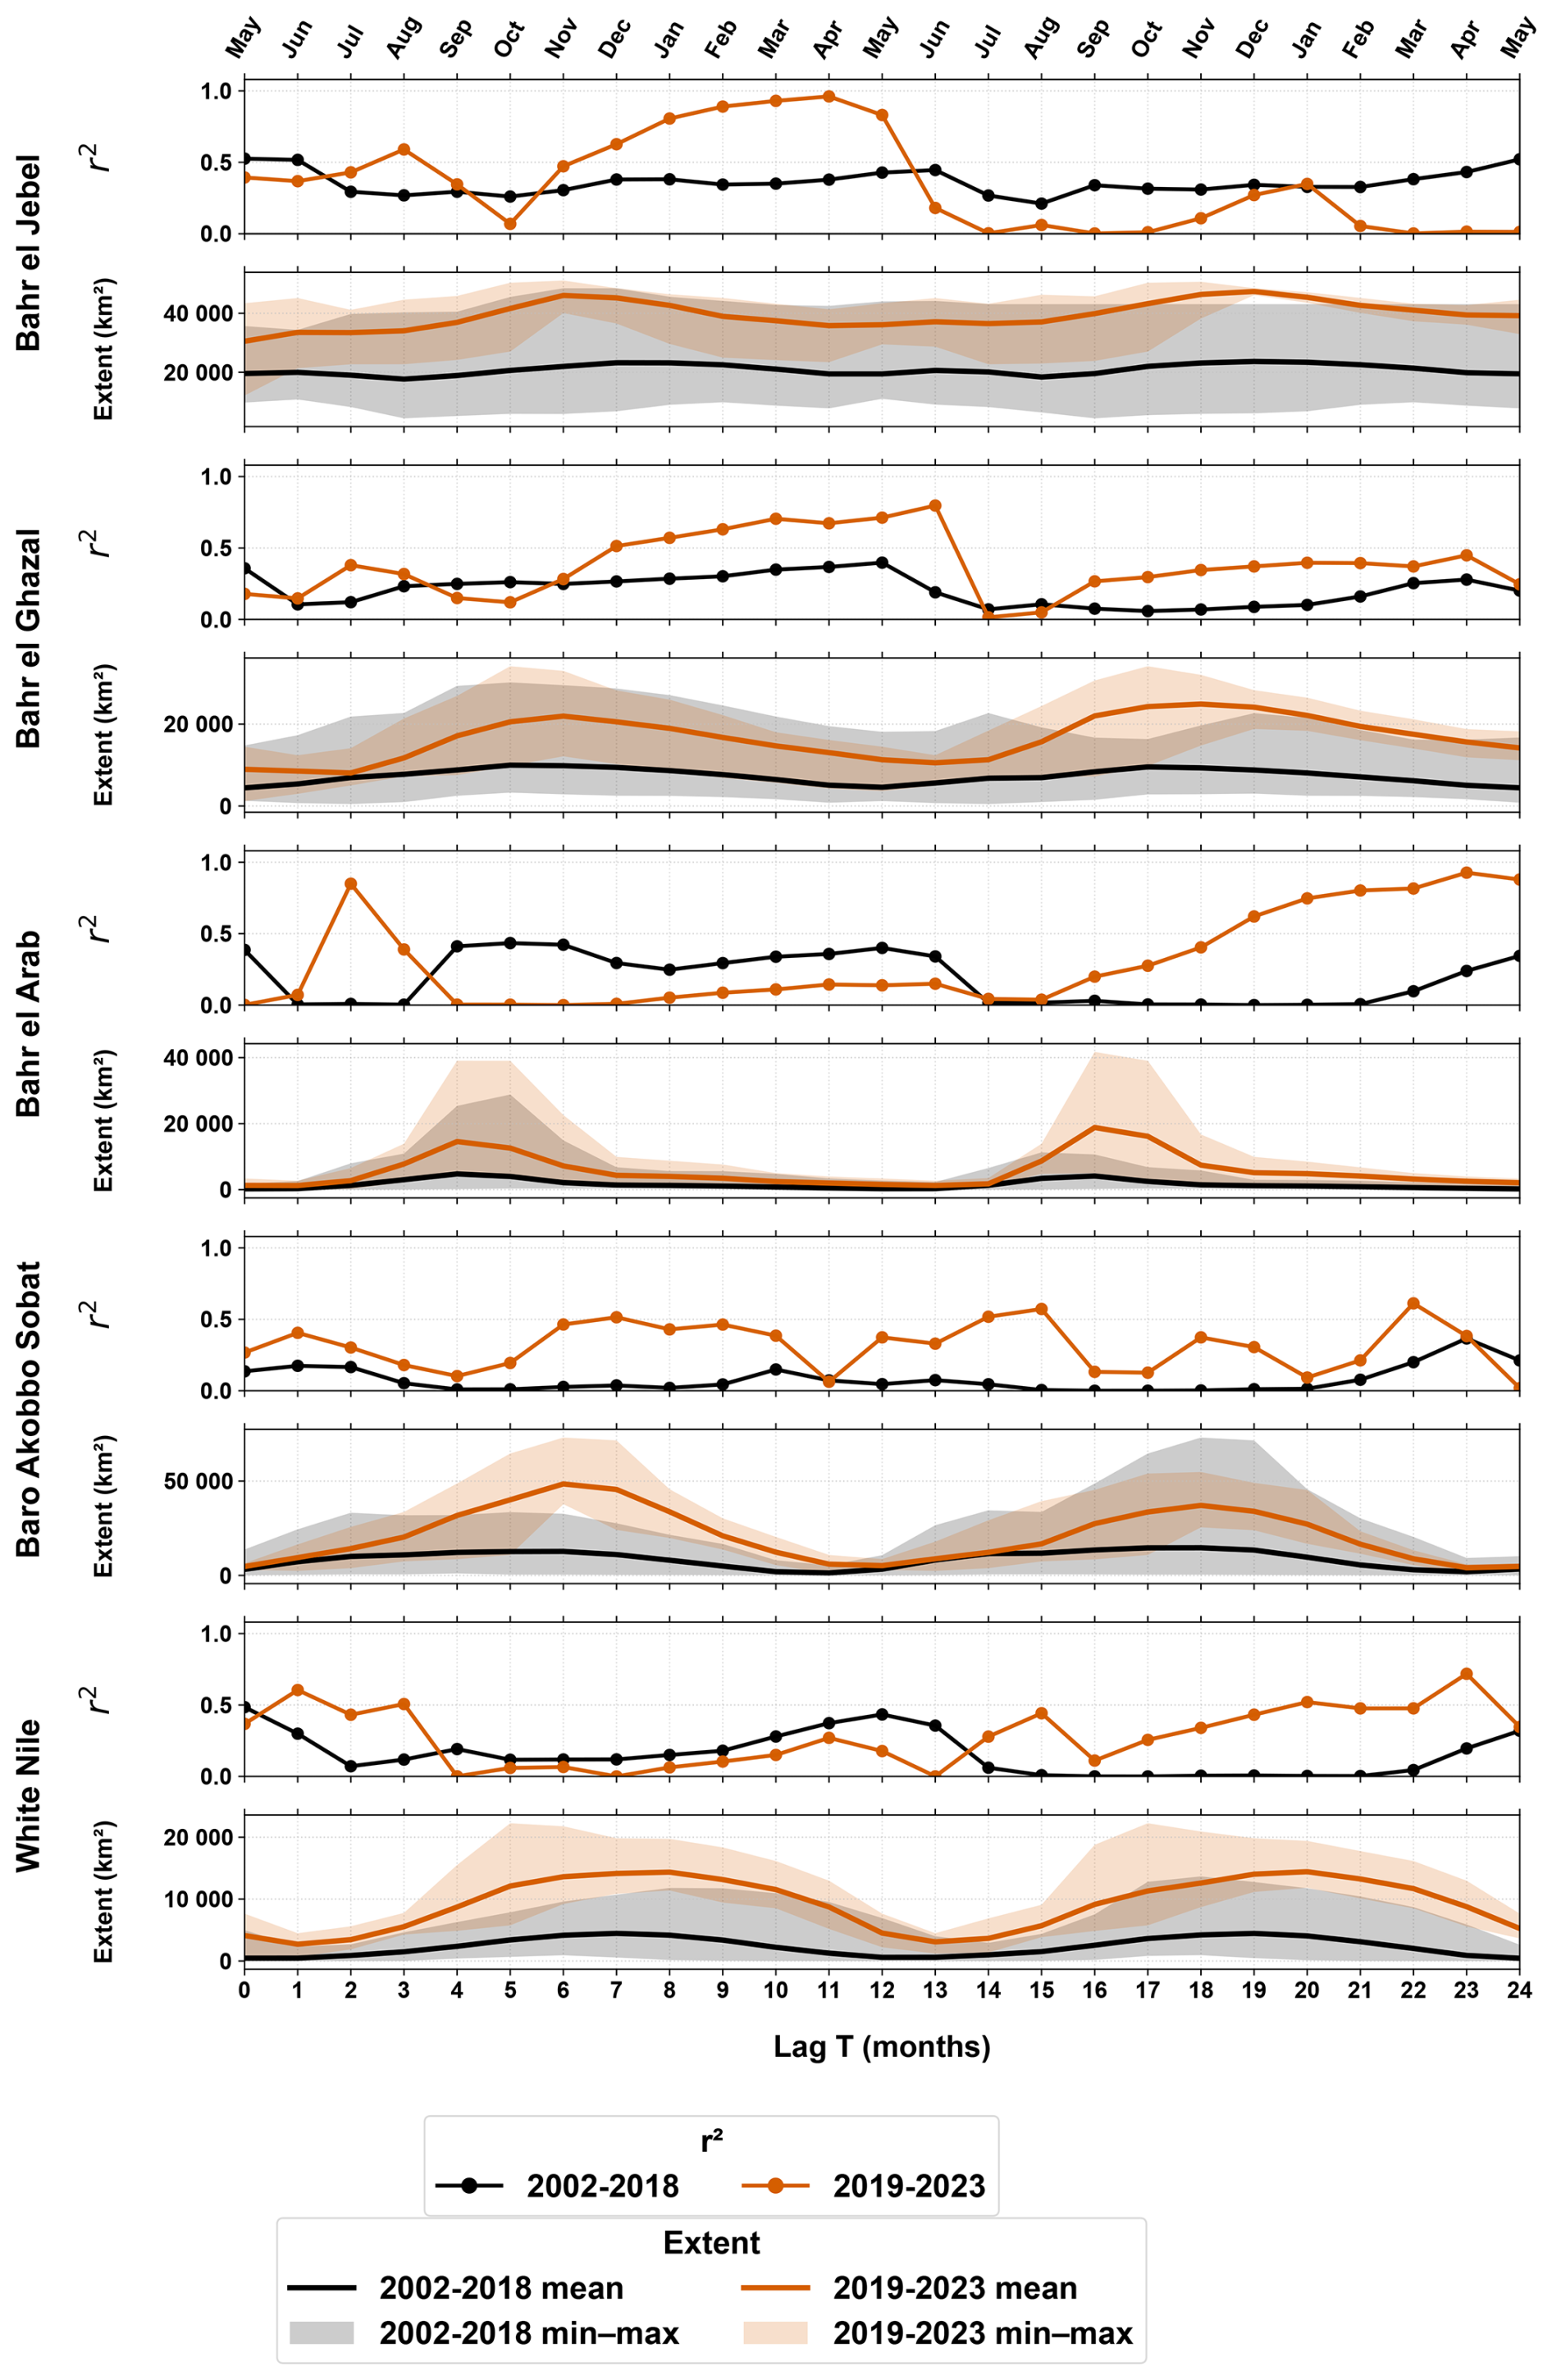
Figure 6Evolution of the relationship between Lake Victoria annual maxima at time T and wetland extent across South Sudan sub-catchments as a function of lag T(0–24 months). In each row, the upper panel shows the squared correlation (r2) between the Lake Victoria peak level and downstream extent; the lower panel shows the corresponding extent variability (mean line and min–max envelope) for the pre-2019 period (2002–2018) and the post-2019 period (2019–2023). Month labels at the top align lags to a May reference month (T=0). Results highlight the progressive downstream delay and attenuation of the Victoria-origin flood signal from Bahr el Jebel to Bahr el Ghazal, Bahr el Arab, Baro Akobbo Sobat, and the White Nile.
3.4 Correlations Between Lake Victoria Peaks and Wetland Extent in the South Sudan Sub-catchments (Evidence of System Memory)
Across the White Nile system, correlations between annual Lake Victoria (LV) maxima and downstream wetland extents reveal a consistent lagged structure from the upper lakes to the Sudd (Fig. 6). These correlation lags reflect the timing of maximum statistical association (coherence) rather than physical flood wave translation and should therefore not be interpreted as actual transit times. Although correlation does not imply causation, the spatial and temporal patterns are physically consistent with (i) persistent high outflows associated with elevated Lake Victoria water levels, (ii) large intermediate storage within Lakes Kyoga and Albert, and (iii) stage-dependent backwater and spill interactions throughout the Sudd wetlands. Together these processes impart strong hydrological memory, meaning that current inundation states continue to reflect inflows from previous seasons or even previous years. Building on the physical flood-wave propagation framework established in Sect. 3.3, this analysis therefore focuses on persistence and connectivity rather than transport time.
During the 2019–2023 high-storage period, correlation magnitudes increased sharply and peaks occurred predominantly during months of minimum wetland extent in the following hydrological year (roughly February–June). For a typical LV peak in mid-May, the corresponding correlation maxima at 9–13 months align with these dry-season minima, indicating that elevated upstream storage sustained base levels downstream long after the rainfall season. Such persistence is expected in a low-gradient, storage-dominated system where continuous but regulated LV outflow propagates slowly through Kyoga, Albert, and the Sudd. Consequently, the minimum extent becomes the clearest expression of the upstream signal, explaining why correlations are strongest during this period.
While correlation peaks outline the timing of maximum statistical association, they are supplementary to the physical flood wave tracking-based lags established in Sect. 3.3. The latter quantify actual flood wave propagation, whereas the former indicate the persistence of hydraulic linkage and memory and do not represent propagation speed or travel time.
3.4.1 Bahr el Jebel (BeJ)
The reach most directly connected to LV through the main Nile trunk shows the earliest and sharpest response. During 2019–2023, r2 rose from 0.39 (at 0 months) to 0.93 (at 10 months) and 0.96 (at 11 months), compared with ≤0.45 before 2019. These 9–12-month peaks (February–May of the following year) coincide with seasonal minima, confirming strong hydraulic linkage through Kyoga and Albert. These lags represent the timing of maximum statistical coherence and should not be interpreted as physical transit times. High BeJ stage also preconditions the Sudd by raising its baseline and promoting subsequent lateral storage and spill.
3.4.2 Bahr el Ghazal (BeG)
Pre-2019 correlations were weak (≤0.40). After 2019, r2 exceeded 0.70 for months 10–13 lags and peaked at 0.80 (13 months). The delayed and weaker response indicates possible backwater and lateral spill from BeJ high stages rather than direct propagation. With BeG's very low gradients, elevated main-stem levels retard drainage and spread water across the distributary floodplains, producing strong statistical association during the next-year minima without implying direct wave translation.
3.4.3 Bahr el Arab (BeA)
Pre-2019 correlations were moderate (approximately 0.4 at 4–6 months) but strengthened sharply post-2019, with r2 ranging from 0.75 to 0.93 between 20–23 months. This almost 2-year lag potentially implies slow backwater transmission and prolonged storage within the Sudd corridor. Water first raises BeJ and Sudd stage, then progressively backs into the western floodplains and BeA channels. The signal potentially reflects progressive backwater influence and storage redistribution across the western floodplains, maintaining elevated extents long after the original LV peak.
3.4.4 Baro-Akobbo-Sobat (BAS)
Dual peaks emerged post-2019 with r2 approximately 0.55 at 14–15 months and 0.61 at 22 months. The 14–15-month peak corresponds to the JJAS rainfall season and local tributary response, while the 22-month band reflects remote influence from cumulative White Nile/Sudd storage. The coexistence of these peaks highlights the mixed local-and-remote regulation of the eastern Sudd sector and limited hydraulic coupling to the upstream lake system.
3.4.5 White Nile (WN)
Below the Sudd, a dual behaviour appears. An early peak (r2=0.60 at 1–3 months) reflects direct routing of LV contribution from the previous year through the lake chain. A later maximum (r2=0.72 at 23 months) mirrors the delayed Sudd storage signal and backwater influence, demonstrating long-term transmission modes of system memory rather than direct routing.
3.4.6 System-Wide Shift After 2019
Across all sub-catchments, correlation magnitudes and persistence increased markedly after 2019. Before 2019, r2 rarely exceeded 0.4 and peaks occurred within 6 months. After 2019, r2 of greater than 0.6 was common and peaks migrated to 9–13 months (BeJ, BeG) and approximately 22 months (BeA, BAS, WN). The transition suggests a high-storage, long-memory regime driven by sustained LV elevation and prolonged Sudd inundation.
3.4.7 Antecedent Wetland Minima as Predictors
The pronounced correlation during seasonal minima highlights the controlling role of antecedent wetland extent. Smaller minima indicate less residual storage and greater capacity for expansion in the upcoming rains, whereas large residuals imply saturation and limited additional spread. Thus, the dry-season baseline conditions have become a reliable predictor of subsequent flood extent, reinforcing the system's strong inter-seasonal memory.
Overall, while these correlations do not represent physical flood wave transit times, their spatial coherence and lag structure confirm persistent hydraulic connectivity, multi-season residence within the Sudd–White Nile corridor, and tributary modulation through backwater and spill effects.
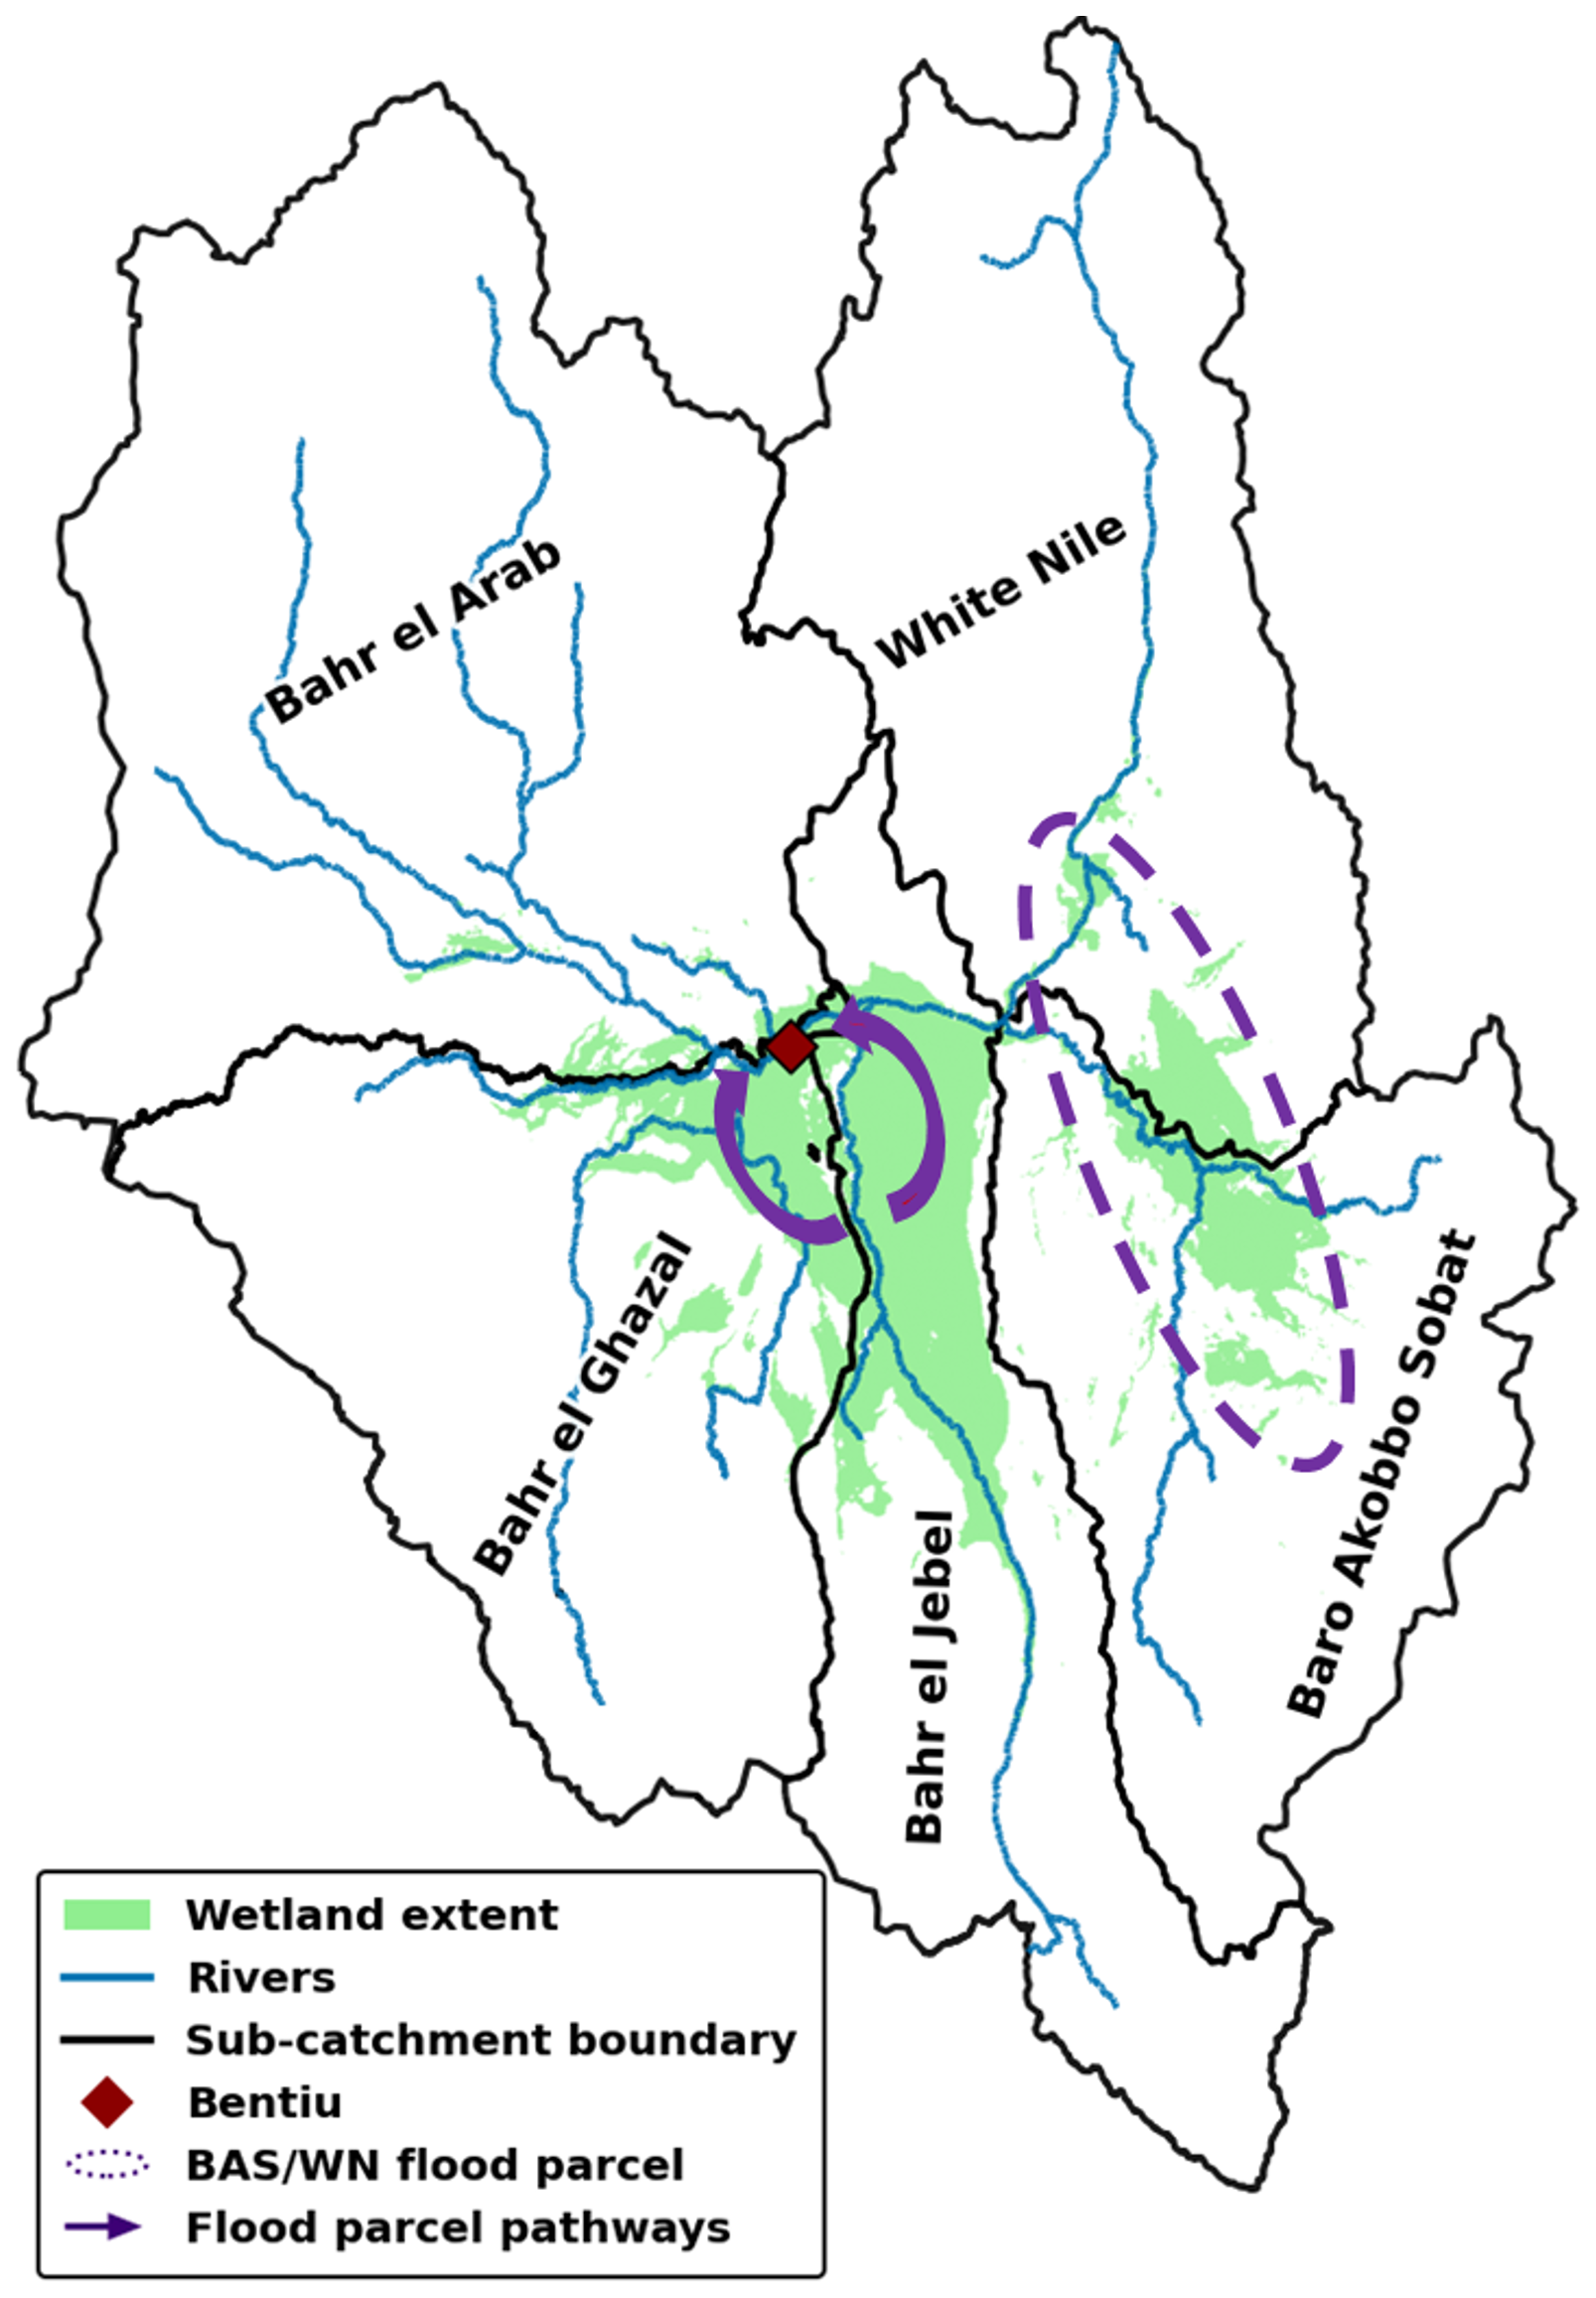
Figure 7Flood water pathways activation and wetland connectivity across the South Sudan sub-catchments during the 2019–2024 high-water period. Green shading represents MODIS-derived wetland extent, blue lines show river networks, and black outlines mark sub-catchment boundaries. Dark purple arrows indicate the primary flood activation pathways from Bahr el Jebel into Bahr el Ghazal and Bahr el Arab, while dashed purple ellipses highlight the Baro-Akobbo-Sobat and White Nile (BAS/WN) flood parcel zones. The red diamond marks Bentiu, which remained inundated during the 2022 flood peak.
3.5 Sudd Wetland Flood Persistence
Flood-persistence mapping captures the spatial evolution and duration of inundation across the Sudd and provides evidence of alternating rainfall- and inflow-driven activation (Fig. 7), expressed here as shifting water pathway activations across the wetland system. The patterns show that wetland connectivity and flood longevity varied both seasonally and inter-annually, reflecting the joint influence of local rainfall, upstream inflow, and backwater effects, and providing a spatial counterpart to the propagation and memory processes identified in Sect. 3.3 and 3.4.
In 2019, wetland expansion was concentrated in the eastern Sudd, particularly within the Baro-Akobbo-Sobat (BAS) and White Nile (WN) sub-catchments. The two sub-catchments exhibited concurrent wetland expansion during July–October 2019, with flood parcels merging along their shared boundary. These are patterns consistent with two-way hydraulic interaction between BAS and WN. Later in 2019 and early 2020, the combined BAS-WN parcel receded eastward while Bahr el Jebel (BeJ) remained largely unconnected. This separation suggests that the 2019 activation was primarily rainfall-driven and locally sustained rather than propagated from the upstream lakes in line with the limited hydraulic coupling identified for BAS in Sect. 3.3.
From May 2020 onward, wetland parcels from BeJ extended laterally westward to Bahr el Ghazal (BeG) and northwest toward Bahr el Arab (BeA). The westward arm through BeG connected with the Rivers Wau and Sue confluence. This arm extended northwards and converged with the other arm near Rubkona, forming a continuous flooded corridor through 2020, marking the first sustained activation of a basin-spanning water pathway linking BeJ, BeG, and BeA and coinciding with the onset of flooding around Bentiu during this period. During February–May 2021, peripheral areas slowly receded, but the core BeJ–BeG–BeA linkage remained intact, showing sustained storage and weak drainage despite limited rainfall input, consistent with upstream-controlled persistence following the multi-month transit behaviour described in Sect. 3.3.
Late 2021 to early 2022 brought alternating pulses of expansion and contraction along the same corridor, followed by widespread flooding in August–September 2022. The latter event was most pronounced in BeA, consistent with intense local rainfall superimposed on high antecedent storage within the BeJ–BeG–BeA system. The combined influence of local rainfall and persistent upstream connectivity produced extreme inundation and the isolation of Bentiu during 2022, representing a re-activation and amplification of established water pathways under saturated conditions.
Overall, the mapped sequences show a clear alternation between eastern (BAS–WN) activation in 2019–2020 and central-western (BeJ–BeG–BeA) activation in 2020–2022. These spatial and temporal patterns are consistent with wetland activation and backwater effects: rainfall initially expands wetlands locally, while elevated BeJ and Sudd stages subsequently sustain or re-activate flooding through lateral and backwater pathways. Together, these patterns provide spatial evidence of the Sudd's long hydrological memory and the strong coupling between local rainfall and upstream inflow under prolonged high-lake conditions, linking the spatial organisation of flooding to the propagation (Sect. 3.3) and lagged memory (Sect. 3.4) identified earlier.
Taken together, the results demonstrate that the 2019–2024 flood episode was characterised by coupled flood-wave propagation, prolonged hydrological memory, and spatially evolving wetland connectivity across the White Nile system. The combined timing, correlation, and flood-persistence analyses indicate that sustained upstream storage, delayed downstream translation, and lateral wetland activation jointly controlled the evolution and persistence of flooding within the White Nile basin and in particular the Sudd region. These interacting controls are examined further in the Discussion, where the governing hydrological processes and broader implications for large lake-river-wetland systems are considered.
4.1 How do flood waves propagate in the White Nile basin?
This study overturns the long-held assumption that flood translation from Lake Victoria to South Sudan occurs within five months. Flood wave tracking-based analysis establishes a mean system transit time of approximately 17 months, confirming that the Victoria–Kyoga–Albert-Sudd corridor behaves as a slow-release, storage-dominated system rather than a rapid rainfall-runoff chain.
Flood wave propagation across the White Nile basin follows a spatially heterogeneous but hydrologically coherent pattern, influenced by the morphology of river channels, lakes and wetland connectivity. From Lake Victoria to Lake Kyoga, the Victoria Nile channel operates as a relatively confined fluvial corridor where the flood wave is rapidly transmitted during high-flow years, in contrast to the downstream reaches with wetland sections connected to the river leaving a wide river channel. This behaviour is consistent with open channel routing theory, where narrow channels with low storage propagate hydrograph peaks with minimal delay and attenuation (Beven, 2012; Chow et al., 1988). The persistence of short lags in this reach during dry years, including 2022, despite pronounced rainfall deficits (KMD, 2023; UNMA, 2022; WMO, 2023), underscores a system where flood wave celerity is governed by upstream hydraulic gradients and antecedent storage rather than local rainfall as the primary control in this short segment.
Downstream of Kyoga and especially below Albert, the system transitions from channel-dominated to storage-dominated flow. The Kyoga–Albert–Sudd system contains extensive swamps, floodplain pockets, and lake-like storage zones. Along the Albert Nile between Pakwach and the Uganda–South Sudan border, including the swamp-rich Obongi area, lateral connectivity during high flows promotes storage, diffusion, and delayed routing (Sutcliffe and Parks, 1999; Williams, 2018). Under high flow antecedent conditions, these landscape-driven attenuation effects can induce non-linear flood wave delays (Pappenberger et al., 2005). After Nimule, confinement through the Nimule–Juba corridor permits relatively fast local passage, then floodplain engagement increases sharply from Terekeka toward Bor and into the Sudd. Despite a broadly uniform low slope, the Albert–Sudd segment showed the longest and most variable travel times, confirming that slope alone is a weak predictor of flood-wave velocity in this lake-wetland system. Internal storage, saturation thresholds, and wetland attenuation capacity dominate the response (Mertes, 1997). These dynamics affirm the necessity of explicitly modelling hydrological memory and nonlinear routing rather than assuming gradient-driven conveyance.
Rainfall diagnostics align with this routing picture. Annual-maxima circular plots and 180 d accumulations show JJAS peaks over South Sudan and over the Ethiopian Highlands, plus OND short-rains pulses that strongly affected the Lake Victoria basin in 2019. Lake Victoria maxima generally respond to the MAM rains. Correlation analysis highlights coherent 9–13-month lags between Lake Victoria maxima and downstream wetland extent in Bahr el Jebel and Bahr el Ghazal, representing statistical alignment rather than physical travel time but consistent with the approximately 17-month flood wave tracking-based mean propagation. These correlations indicate translation through Kyoga and Albert, then storage and backwater effects within the Sudd that preserve the lake signal into the next dry season, when the upstream control is clearest against low local rainfall.
A sub-catchment lens clarifies how flood energy is transmitted and redistributed. Immediately below Lake Albert, the Albert Nile conveys the lake-sourced pulse northwards through swamp-dominated sections in Obongi District, where local storage dampens the wave. Downstream, the river becomes confined again through the Nimule-Juba corridor, allowing faster passage before it enters a broad floodplain at Bahr el Jebel (BeJ). From there, the flood progressively engages wetland storage through Mongalla and into the Sudd, where channel-floodplain exchange becomes the dominant control on timing and persistence (Mohamed et al., 2005a, b; Sutcliffe and Parks, 1999; Williams, 2018). Flood-persistence maps show spatial water pathway activations, particularly between July 2021 to October 2022, with a dominant arm from BeJ into the White Nile corridor that tracked via Fangak and the Lake No complex toward Rubkona, together with a second arm along the BeG–BeA fringe via Adok and Koch. The two arms connected near Rubkona and enclosed Bentiu for months before recession. This geometry and duration are consistent with an upstream lakes signal interacting with floodplain storage and backwater, not a short, through-going wave.
Responses in Bahr el Ghazal and Bahr el Arab illustrate intermittently connected fringe behaviour controlled by distributary links and partial backwater west of the main stem. Broad floodplains and shallow relief around Bentiu and Rubkona promote ponding and lateral exchange, which damps and delays peaks relative to BeJ and facilitates faster local clearance once lateral links close. The Baro Akobbo Sobat system is the most rainfall-sensitive sector. JJAS inputs from the Ethiopian Highlands and the Sobat tributary produce early, sharp expansions that can be largely decoupled from lake peaks. Under exceptional stages, two-way connectivity can occur between BAS and BeJ across wetland expanses, so either sector can spill toward the other depending on which is more flooded, with significant transmission losses that prolong recession once storage is engaged (Mohamed et al., 2005b; Sutcliffe and Parks, 1999; Williams, 2018).
These behaviours together explain fast upstream transmission into BeJ, slow and variable propagation once floodplain storage engages, and long memory within the wetland complex that extends down the White Nile corridor. They also explain why correlation maxima often occur during the following year's minima: antecedent wetland extent and residual storage set the baseline from which the next season expands.
Operationally, this has consequences. In the absence of national forecasts, global systems showed limited skill around Bentiu and the Sudd (Caldwell, 2022; Easton-Calabria, 2024). The wetland water pathway activations we document, including storage-driven attenuation, lateral spill, two-way coupling across the BeJ-BeG–BeA interface and the BAS confluence, and backwater effects, disrupts simple rainfall-only or channel-only routing. This matches established Sudd hydrology and loss processes (Alfieri et al., 2024; Mohamed et al., 2005a; Rebelo et al., 2012; Sutcliffe and Parks, 1999) and points to the need for models that represent long lake memory, floodplain exchange and backwater explicitly.
4.2 What dominated the 2019–2024 flooding sequence and its severity?
Evidence across timing, persistence, and spatial coherence indicates that rainfall-driven multi-year high levels in the upstream lakes, interacting with downstream wetland storage, were the dominant control on flooding between 2019 and 2024. Basin-scale concurrence is clear. Lake Victoria set new instrumented highs in 2020, 2021, and 2024, surpassing the 1964 maximum, while the Sudd reached its largest MODIS-era extent in 2022. The simultaneous inundation of lake shores and far-downstream plains demonstrates system-wide coherence from Victoria through Kyoga and Albert into the Sudd. The event was not a single shock but a multi-year cluster driven by four consecutive seasons of above-average rainfall between 2019 and 2021 that limited recession and recharged storage. Even when rains weakened during 2022–2023, delayed drainage and wetland retention maintained high levels (Caldwell, 2022). The lake and wetland storage transformed these multi-season anomalies into multi-year high lake levels persistence.
Rainfall anomalies and lake annual-maxima circular plots show that the exceptional 2019/20 positive Indian Ocean Dipole (IOD) produced intense OND rainfall over East Africa (Ratna et al., 2021; Wainwright et al., 2021). These above-average rains, that persisted over several consecutive rain seasons until 2021, initiated a sharp rise across Lakes Victoria, Kyoga, and Albert, and the Sudd, pushing the entire lake-wetland chain into a high-storage phase. Correlation analysis demonstrates a strong statistical coherence between this elevated state and downstream wetland response, reflecting persistent hydraulic connectivity rather than direct flood wave transmission. The observed 9–13-month correlation peaks indicate coherence with the upstream forcing but not the full physical transit time, which our flood wave tracking analysis quantifies at approximately 17 months between Lake Victoria and the Sudd. These correlations therefore complement, rather than replace, the flood wave tracking-derived transit times that describe the actual propagation through the lake-wetland system. They are strongest after 2019, when the system entered a persistent high-lake phase, and support the interpretation that hydrological memory, not renewed rainfall, was the principal control on downstream flooding.
Flood-persistence mapping reinforces this interpretation. In 2019–2020, activation began in the eastern Sudd (BAS–WN), consistent with intense JJAS rainfall over South Sudan and the Ethiopian Highlands. In 2020–2022, activation shifted westward to BeJ–BeG–BeA, coinciding with high lake stages and sustained inflow. The persistence and geometry of the connected BeJ–BeG–BeA parcel, which enclosed the Bentiu region for months, are physically consistent with wetland water pathway activation and backwater expansion from the main stem and limited recession due to high antecedent storage.
Historical analogues reveal similar compound behaviour. The 1878 flood, reconstructed at approximately 1137 m a.s.l. for Lake Victoria, followed several wet years and produced extensive flooding along Bahr el Jebel and Lake Albert, with reports of large White Nile discharges and broad Sudd expansion near Mongalla (Gibb, 1984; Howell et al., 1988; Johnson, 1992; Nicholson and Yin, 2001).
Together, these patterns support a two-phase dynamic: initial rainfall-driven activation in the east followed by inflow- and storage-driven persistence in the central and western Sudd. The result was not a single flood pulse but a compound event sequence in which each wet season added to the existing storage base. This cumulative behaviour mirrors historical high-stand episodes (1878, 1916–1919, 1961–1964) where consecutive wet years generated prolonged flooding throughout the White Nile corridor (Gibb, 1984; Howell et al., 1988; Johnson, 1992; Nicholson and Yin, 2001; Sutcliffe and Parks, 1999). The 1916–1919 wet period likewise elevated Nile flows and refilled the lakes (Hurst and Phillips, 1938; Sutcliffe, 1974). The 1961–1964 event, linked to a strong El Nino, raised Lake Victoria by about 2.5 m and again produced prolonged downstream flooding (Black et al., 2003; Gibb, 1984; Kite, 1982). Together, these historical comparisons indicate that the 2019–2024 sequence fits within the basin's low-frequency, high-impact variability envelope, where hydrological memory translates climatic forcing into multi-season persistence (Hurst and Phillips, 1938; Nicholson and Yin, 2001; Sutcliffe and Parks, 1999).
By 2022, the Sudd reached its largest MODIS-era extent, representing a lagged response to multiple years of high inflow from the upstream lakes. This persistence illustrates the basin's long hydrological memory. Once Lakes Victoria, Kyoga, and Albert entered their high-storage phase, downstream discharge and wetland levels remained elevated for several seasons even after rainfall weakened. During 2022–2023, when basin rainfall declined, stored water in the lake-wetland chain maintained extensive inundation and delayed recession. The exceptional August/September 2022 flooding in Bahr el Arab, likely intensified by local rainfall superimposed on the BeJ–BeG–BeA activated wetland system, exemplifies this compounding mechanism where antecedent storage, hydraulic coupling, and local input converge.
Hence, the severity of the 2019–2024 sequence reflects three interacting controls: (i) strong positive IOD forcing of rainfall in 2019 that initiated basin-wide recharge; (ii) cumulative lake and wetland storage that sustained and expanded flooding through long-term attenuation; and (iii) localized rainfall reinforcement during later years that amplified already saturated conditions.
This interaction between climate variability and long-term hydrological memory was likely strengthened by background climate change. Indian Ocean warming is projected to increase the frequency and intensity of strong positive IOD events and to enhance short-rains over East Africa, while March–May long-rains trends remain mixed (Cai et al., 2014, 2018; Dunning et al., 2018; Endris et al., 2019; IPCC, 2021). Event-attribution studies place the 2019–2021 Lake Victoria rise within a multi-decadal return period under the present climate but acknowledge a modest anthropogenic contribution to its likelihood and magnitude (Pietroiusti et al., 2024).
In short, climate variability provided the trigger, storage translated it into persistence, and emerging climate trends may increase recurrence probability. As wetland areas activated, attenuation increased, lateral spill spread water across floodplains, and backwater effects reinforced the high stand. By the time the flood wave reached the Sudd, the signal was governed less by short-term outlet variability and more by cumulative lake storage, rainfall anomalies, and floodplain exchange (Sene, 2000; Sutcliffe and Parks, 1999; Vanderkelen et al., 2018a).
4.3 Are these floods exceptional, or do they signal a hydrological shift?
While the magnitude and persistence of the 2019–2024 floods are striking, they are not without precedent. Nonetheless, the question remains whether this marks the beginning of a more permanent shift in hydrological functioning. The approximately 17-month mean transit time identified here provides the clearest measure yet of how slowly flood energy moves through the basin, contextualising the 2019–2024 sequence within the system's inherent long-memory behaviour. Current evidence is insufficient to confirm a hydrological regime change; rather, it points to an exceptional cluster of events driven by a combination of climatic and hydrological factors. Given this uncertainty, it becomes essential to critically examine the underlying climatic anomalies, hydrological precursors, and system memory processes that may signal an emerging transition or alternatively, reaffirm the episodic nature of flood behaviour in the White Nile basin.
One possible explanation is that this 2019–2024 period represents a rare recurrence within the basin's natural long-term hydrological variability. Comparable flood episodes in the 1870s and 1960s also featured exceptionally high lake levels and multi-year persistence. Statistical analysis suggests that the 2019–2020 rise in Lake Victoria was approximately a 63-year event under current climate conditions (Pietroiusti et al., 2024). This indicates that floods of this magnitude are infrequent but not unprecedented and are expected only once in several decades. Paleoclimatic and documentary evidence from East Africa supports the view that clustered extreme wet years have occurred in the past (Gibb, 1984). In this context, the 2019–2024 sequence is best viewed as a rare expression of the system's intrinsic low-frequency, high-impact dynamics.
Another line of interpretation considers the antecedent state of the system. Prior to the onset of heavy rains in 2019, Lake Victoria had been recovering from a pronounced low stand experienced between 2000 and 2006. A combination of drought and increased outflows following the Nalubaale dam expansion in 2000 drew the lake down to unusually low levels by 2005 (Kull, 2006). From 2007 onward, the lake level trended upward again, regaining storage. By the late 2010s the system was primed with additional storage capacity although still below the mid-1960s peak. When the heavy rains hit in 2019–2020, the initial dry “buffer” may have been overcome relatively quickly, but the prior low conditions could have influenced management decisions or downstream impacts. The net effect of the prior low conditions and management decisions is complex, but one could hypothesize that the sharp rise was facilitated in part by the lake's post-2006 rebound and then amplified once that buffer filled. In summary, the sequence and severity of recent floods might reflect an interplay of natural climate variability with antecedent conditions set by the preceding dry period.
A third possibility, which carries more profound implications, is that the floods observed from 2019 to 2024 could represent early indications of a shift toward a more flood-prone regime under a changing climate. Tropical river basins, particularly those with flat floodplain topography like the White Nile, are projected to have increasing frequency and intensity of flood events by the end of the 21st century under warming scenarios (Hirabayashi et al., 2013, 2021; IPCC, 2021). While attribution remains complex, several studies suggest that warming in the Indian Ocean, along with global climate change, is increasingly influencing rainfall extremes in East Africa (Black et al., 2003; Endris et al., 2019; Kolstad et al., 2021; Manatsa et al., 2012; Manatsa and Behera, 2013; Roxy et al., 2011; Ummenhofer et al., 2009; Wenhaji Ndomeni et al., 2018). Notably, the extreme positive Indian Ocean Dipole (IOD) event of late 2019 played a significant role in generating unusually heavy rainfall across the region (Ratna et al., 2021; Wainwright et al., 2021). One event attribution study suggests that the lake-level rise was approximately 1.8 times more likely to occur under present-day climatic conditions than under a pre-industrial baseline, with an estimated 7 cm increase in magnitude attributable to anthropogenic warming although with broad confidence intervals (Pietroiusti et al., 2024). This range of uncertainty necessitates caution in drawing definitive conclusions about systemic regime change. Nevertheless, these observations align with broader projections of increasing extreme rainfall events over East Africa under warming scenarios (Endris et al., 2019). In addition, recent analyses suggest a strengthening of the October–December short rains and a weakening of the March–May long rains across East Africa (Dunning et al., 2016, 2018; Nicholson, 2017), potentially altering flood seasonality and compounding the risk of back-to-back high-flow years. Continued monitoring over the coming years will therefore be critical to determine whether water levels and wetland extents return toward their historical range following the current flood sequence, as observed after previous high-water periods, or whether a more persistent elevated baseline begins to emerge.
4.4 What else do we need to do next?
The findings highlight urgent needs across forecasting, modelling, and observation for lake-river-wetland systems like the White Nile. Rainfall-only triggers are insufficient where flood dynamics are dominated by long-term storage and backwater effects. Predictive frameworks must explicitly account for lake levels, antecedent wetland extent, and hydraulic connectivity derived from correlation and persistence analyses. Without representing these slow components, forecasts will continue to misplace flood peaks and recessions.
Existing global and regional flood forecasting and early warning systems show limited skill across wetland-dominated reaches such as the Sudd (Caldwell, 2022; Easton-Calabria, 2024). The long-memory behaviour documented here, including delayed correlations, multi-year persistence, and two-way connectivity, requires systems that integrate lake level monitoring, cumulative rainfall anomalies, and wetland extent into seasonal flood outlooks. Impact-based early warnings should assimilate these storage and connectivity indicators, not only rainfall thresholds, and should be calibrated for the specific trackwave-based lags of approximately 17 months observed between upstream lake maxima and downstream wetland responses. The current configuration of regional early warning systems does not fully capture the long-memory behaviour of lake-river-wetland systems, leaving downstream populations at risk.
Hydrodynamic modelling should treat the Victoria–Kyoga–Albert-Sudd corridor as a single connected hydrologic unit from Jinja through Kyoga and Albert to Mongalla and the Sudd, with two-dimensional routing and explicit parameterisation of floodplain exchange, attenuation, and backwater effects. The mapped water pathway activation from BeJ toward Fangak, Lake No, and Rubkona, together with the parallel arm along the BeG–BeA fringe, indicates connectivity that 1-D routing or lumped models will under-resolve. Process-consistent bathymetry, floodplain roughness, and channel bifurcations are needed to simulate how storage propagates through the system (Mertes, 1997; Mohamed et al., 2005a, b; Sutcliffe and Parks, 1999; Williams, 2018). Boundary conditions should couple lake water balances and outflows at Jinja where available, precipitation and evaporation over Lakes Kyoga and Albert, and tributary inflows at the Sobat confluence, while internal model physics must allow lateral spill between BeJ, BeG, and BeA and backwater effects along the White Nile corridor. Calibration and validation should use lake level and river gauge observations where available and supplemented with altimetry, and SAR-derived inundation for the reaches from Obongi and Nimule through Juba, Terekeka, Bor, Lake No, and Malakal, so that storage and exchange are constrained by observations rather than inferred indirectly (Pietroiusti et al., 2024; Sene, 2000; Vanderkelen et al., 2018a, b).
Observation gaps limit both this analysis and operational readiness. MODIS-based extents capture the footprint of inundation but not volume, and they struggle where emergent or floating vegetation masks open water, which can bias storage inference. Pairing the MODIS time series with C-band SAR from Sentinel-1 for open-water detection under vegetation, and with lake and river observations or altimetry data where available, would improve both extent and water level estimates, and allow volumetric change to be constrained more tightly (Rebelo et al., 2012; Ticehurst et al., 2014). Within our study, the lack of operator outflow records from Jinja prevented a direct quantitative partition of managed versus natural contributions. That constraint should be addressed through transparent data sharing on outlet rules and realised discharges, alongside consistent, cross-border gauge maintenance at key control sections such as Jinja, Pakwach, Mongalla, and Malakal (Sene, 2000; Sutcliffe and Parks, 1999).
Rainfall datasets also carry uncertainty. CHIRPS is widely used and performs well over much of East Africa, yet sparse gauge networks in South Sudan and northern Uganda reduce its calibration density, which can degrade local accuracy, especially for mesoscale convective systems. Future attribution and early-warning work should quantify this uncertainty and, where feasible, blend satellite products with expanded rain-gauge networks to strengthen calibration in the Sudd and along the Albert Nile corridor (Funk et al., 2015).
Design standards and planning thresholds need to be revisited in view of non-stationarity. Teleconnections and projected shifts in seasonal rainfall over East Africa increase the chance of back-to-back wet seasons and shortened recession windows, which changes the effective return period of compound high-water years. Updating thresholds to reflect non-stationary risk, and making those thresholds impact-based, will better serve communities along BeJ, BeG, BeA, BAS, and the WN corridor (Endris et al., 2019; Hirabayashi et al., 2013, 2021; IPCC, 2021).
Methods used here carry important limits. Event alignment and correlation lags are referenced to sub-catchment specific baseline windows, so inferred timings and strengths are sensitive to the chosen pre-peak months, detrending choices, and any smoothing of anomalies. Transit time estimates from trackwave analyses summarise coherent propagation but do not prove causality, especially where two-way spill can occur between BAS and BeJ or where backwater reversals arise along the BeJ, BeG, and BeA interface. Flood-persistence maps quantify recurrence within monthly composites; they do not measure water depth or volume and may miss short-lived connections or open water masked by emergent or floating vegetation. Sub-catchment boundaries in the Sudd are indicative rather than hydraulically rigid, so mapped responses should be interpreted as zones of coherence and connectivity, not as fixed routing within strict borders. These synoptic choices are defensible for a basin-scale analysis, but they should be complemented by targeted observations and process-based, two-dimensional modelling to test specific hypotheses about storage, exchange, and backwater control.
Finally, sustained monitoring within the Sudd is indispensable. Priorities include higher-resolution altimetry over lake and river tracks, routine flow gauging at wetland inlets and outlets, and classification of evolving flow pathways as vegetation and siltation modify channel geometry. Establishing groundwater observation networks along floodplain margins would clarify the role of subsurface storage in delaying recession. Integrating these observations into data-assimilative hydrodynamic frameworks would allow near-real-time estimation of storage and connectivity, improving both science and operational readiness.
Flood wave propagation in the White Nile is shaped less by hydraulic slope and more by storage, wetland attenuation, and antecedent state. The Victoria–Kyoga reach behaves as a comparatively confined corridor with short lags, whereas Kyoga–Albert and especially Albert–Sudd show longer, more variable transit due to floodplain exchange and lake-like sinks in Obongi. Local damping through the Obongi–Rhino Camp swamps, fast passage along the Nimule–Juba corridor, and progressive wetland engagement from Terekeka through Bor and Lake No illustrate how morphology and connectivity jointly determine flood wave behaviour. Flood wave tracking-based analysis shows that the mean system transit time from Lake Victoria to the Sudd is approximately 17 months, overturning the long-held belief that flood translation occurs within only five months. The White Nile therefore behaves not as a rapidly responding river system, but as a connected lake-river-wetland cascade in which storage, attenuation, and delayed release govern the timing and persistence of downstream flooding. These features underline the importance of hydrological memory and nonlinear routing in both interpretation and modelling.
The 2019–2024 floods were driven primarily by rainfall-forced multi-year high stands in the upstream lakes, compounded by wetland storage downstream. Correlation and persistence analyses confirm coherent statistical transmission of the lake signal through Kyoga and Albert into Bahr el Jebel and Bahr el Ghazal, with peak correlations occurring 9–13 months after Lake Victoria maxima. These patterns indicate sustained hydraulic connectivity and system memory but do not represent physical transit times. Flood-persistence mapping confirms these lags, revealing sequential water pathway activation: rainfall-driven expansion in the eastern Sudd (BAS–WN) in 2019–2020, followed by sustained inundation in the central and western Sudd (BeJ–BeG–BeA) during 2020–2022. The connected BeJ–BeG–BeA parcel that enclosed Bentiu for months exemplifies how antecedent storage, lateral spill, and backwater effects combined to sustain high levels long after direct rainfall ceased.
The sequence and severity of the 2019–2024 floods reflect a compound process: extreme rainfall associated with the 2019 positive Indian Ocean Dipole initiated the rise; consecutive wet seasons limited recession and recharged storage; and long system memory in the lake-wetland chain carried elevated levels into later years. Historical analogues in 1878, 1916–1919, and 1961–1964 show that such basin-wide high-water states recur under clusters of wet years, confirming that 2019–2024 represents a rare but plausible recurrence within the system's natural variability envelope. The newly quantified approximately 17-month system-scale transit time provides a physical measure of this persistence and contextualises the 2019–2024 sequence within the long-term behaviour of the White Nile. However, projected increases in the frequency of strong positive IOD events and shifts in East African rainfall seasonal patterns may heighten the likelihood of back-to-back wet years and shorten recession windows in the future.
Future progress will require forecasting, modelling, and monitoring approaches at the system scale that explicitly account for long-term storage and wetland connectivity across the full lake-river-wetland system. Predictive frameworks must go beyond rainfall-only triggers to include lake levels, antecedent wetland extent, and hydraulic connectivity indicators derived from correlation and persistence analyses. Forecast calibration should account for the flood wave tracking-based lag of approximately 17 months between Lake Victoria peaks and downstream wetland response. Hydrodynamic models should represent the Victoria–Kyoga–Albert–Sudd corridor as a single continuous system with explicit floodplain exchange, attenuation, and backwater effects. At the same time, observational capacity should be strengthened through combined optical and radar remote sensing, satellite altimetry, and strategically distributed in situ observations capable of constraining flood extent, storage, connectivity, and lag dynamics.
Improving forecast skill and anticipatory action within the White Nile basin will ultimately depend on forecasting systems that explicitly represent long-memory behaviour, floodplain exchange, and delayed downstream propagation, supported by shared data, co-designed hindcasts, and transparent evaluation between national hydrological services and model developers. More broadly, this study demonstrates that understanding flood risk in large lake-river-wetland systems requires moving beyond simple rainfall-response assumptions toward frameworks that recognise the dominant role of storage, attenuation, and multi-season hydrological persistence. Design standards and flood planning thresholds should therefore account for non-stationary hydroclimatic risk and the increasing likelihood of compound multi-season high-water periods in storage-dominated systems such as the White Nile.
The analytical scripts used in this study are available in accordance with the INFLOW project data-sharing protocols. Access may be granted upon reasonable request to the corresponding author subject to project data-governance agreements.
The data and code that support the findings of this study are available in accordance with the INFLOW project data-sharing protocols. Access may be granted upon reasonable request to the corresponding author and subject to project data-governance agreements.
The supplement related to this article is available online at https://doi.org/10.5194/hess-30-5297-2026-supplement.
DM designed the research and carried out the analysis, interpretation, and discussion. HC, EB, and ES guided the research design and contributed extensively to the analysis, discussion, and interpretation. EN contributed to the flood persistence, wetland water pathways activation analysis, and remote sensing components. CK and BZ contributed to the interpretation of results. All co-authors contributed to the discussion, and writing of the manuscript.
The contact author has declared that none of the authors has any competing interests.
Publisher's note: Copernicus Publications remains neutral with regard to jurisdictional claims made in the text, published maps, institutional affiliations, or any other geographical representation in this paper. The authors bear the ultimate responsibility for providing appropriate place names. Views expressed in the text are those of the authors and do not necessarily reflect the views of the publisher.
The authors thank all colleagues and collaborators within the INFLOW project for their valuable contributions, discussions, and support throughout this research. We also acknowledge the cooperation and engagement of institutional partners, including Makerere University, the Uganda Ministry of Water and Environment (MWE), the South Sudan Ministry of Water Resources and Irrigation (MWRI), the World Food Programme (WFP), the IGAD Climate Prediction and Applications Centre (ICPAC), and Médecins Sans Frontières (MSF), whose inputs and data support strengthened this work. We also appreciate the coordination and engagement of the broader CLARE programme partners during the study period. The authors further thank Jo Coles for their constructive feedback and encouragement during this study.
This work was supported by the Improved Anticipation of Floods on the White Nile (INFLOW) project, a CLARE-funded project supported by UK aid from the UK government through the UK Foreign, Commonwealth & Development Office (FCDO), and by the International Development Research Centre (IDRC), Canada. Additional support was provided by the National Centre for Atmospheric Science through the NERC National Capability International Programmes (grant no. NC/X006263/1 EB).
This paper was edited by Wouter Buytaert and reviewed by two anonymous referees.
Alfieri, L., Libertino, A., Campo, L., Dottori, F., Gabellani, S., Ghizzoni, T., Masoero, A., Rossi, L., Rudari, R., Testa, N., Trasforini, E., Amdihun, A., Ouma, J., Rossi, L., Tramblay, Y., Wu, H., and Massabò, M.: Impact-based flood forecasting in the Greater Horn of Africa, Nat. Hazards Earth Syst. Sci., 24, 199–224, https://doi.org/10.5194/nhess-24-199-2024, 2024.
Awange, J. L., Ogalo, L., Bae, K. H., Were, P., Omondi, P., Omute, P., and Omullo, M.: Falling Lake Victoria water levels: Is climate a contributing factor?, Clim. Change, 89, 281–297, https://doi.org/10.1007/s10584-008-9409-x, 2008.
Balasus, N., Jacob, D. J., Bloom, A. A., East, J. D., Estrada, L. A., Hancock, S. E., He, M., Mooring, T. A., Turner, A. J., and Worden, J. R.: 2019–2024 trends in African livestock and wetland emissions as contributors to the global methane rise, Atmos. Chem. Phys., 26, 4601–4617, https://doi.org/10.5194/acp-26-4601-2026, 2026.
Bamweyana, I., Musinguzi, M., and Kayondo, L. M.: Evaluation of CHIRPS satellite gridded dataset as an alternative rainfall estimate for localized modelling over Uganda, Atmos. Clim. Sci., 11, 797–811, https://doi.org/10.4236/acs.2021.114046, 2021.
Basheer, M. and Elagib, N. A.: Performance of satellite-based and GPCC 7.0 rainfall products in an extremely data-scarce country in the Nile Basin, Atmos. Res., 215, 128–140, https://doi.org/10.1016/j.atmosres.2018.08.028, 2019.
Beven, K. J.: Rainfall-Runoff Modelling: The Primer, 2nd edn., Wiley-Blackwell, Chichester, UK, 488 pp., https://doi.org/10.1002/9781119951001, 2012.
Black, E., Slingo, J., and Sperber, K. R.: An observational study of the relationship between excessively strong short rains in coastal East Africa and Indian Ocean SST, Mon. Weather Rev., 131, 74–94, https://doi.org/10.1175/1520-0493(2003)131<0074:AOSOTR>2.0.CO;2, 2003.
Brown, E. and Sutcliffe, J. V.: The water balance of Lake Kyoga, Uganda, Hydrol. Sci. J., 58, 342–353, https://doi.org/10.1080/02626667.2012.753148, 2013.
Bullock, A. and Acreman, M.: The role of wetlands in the hydrological cycle, Hydrol. Earth Syst. Sci., 7, 358–389, https://doi.org/10.5194/hess-7-358-2003, 2003.
Cai, W., Santoso, A., Wang, G., Weller, E., Wu, L., Ashok, K., Masumoto, Y., and Yamagata, T.: Increased frequency of extreme Indian Ocean Dipole events due to greenhouse warming, Nature, 510, 254–258, https://doi.org/10.1038/nature13327, 2014.
Cai, W., Wang, G., Gan, B., Wu, L., Santoso, A., Lin, X., Chen, Z., Jia, F., and Yamagata, T.: Stabilised frequency of extreme positive Indian Ocean Dipole under 1.5 °C warming, Nat. Commun., 9, https://doi.org/10.1038/s41467-018-03789-6, 2018.
Caldwell, S.: Flood Risk for South Sudan's 2022 Rainy Season, The Centre for Humanitarian Data, https://centre.humdata.org/flood-risks-for-south-sudans-2022-rainy-season/ (last access: 13 May 2026), 2022.
Camberlin, P. and Philippon, N.: The East African March–May rainy season: Associated atmospheric dynamics and predictability over the 1968–97 period, J. Climate, 15, 1002–1019, https://doi.org/10.1175/1520-0442(2002)015<1002:TEAMMR>2.0.CO;2, 2002.
Chaves-Gonzalez, J., Milano, L., Omtzigt, D.-J., Pfister, D., Poirier, J., Pople, A., Wittig, J., and Zommers, Z.: Anticipatory action: Lessons for the future, Front. Clim., 4, 932336, https://doi.org/10.3389/fclim.2022.932336, 2022.
Chow, V. T., Maidment, D. R., and Mays, L. W.: Applied Hydrology, McGraw-Hill, New York, USA, 572 pp., ISBN 978-0-07-010810-3, 1988.
Conway, D.: The climate and hydrology of the Upper Blue Nile River, Geogr. J., 166, 49–62, https://doi.org/10.1111/j.1475-4959.2000.tb00006.x, 2000.
Conway, D. and Hulme, M.: The impacts of climate variability and future climate change in the Nile Basin on water resources in Egypt, Int. J. Water Resour. Dev., 12, 277–296, https://doi.org/10.1080/07900629650178, 1996.
Coughlan de Perez, E., van den Hurk, B., van Aalst, M. K., Jongman, B., Klose, T., and Suarez, P.: Forecast-based financing: an approach for catalyzing humanitarian action based on extreme weather and climate forecasts, Nat. Hazards Earth Syst. Sci., 15, 895–904, https://doi.org/10.5194/nhess-15-895-2015, 2015.
Coughlan de Perez, E., van den Hurk, B., van Aalst, M. K., Amuron, I., Bamanya, D., Hauser, T., Jongma, B., Lopez, A., Mason, S., Mendler de Suarez, J., Pappenberger, F., Rueth, A., Stephens, E., Suarez, P., Wagemaker, J., and Zsoter, E.: Action-based flood forecasting for triggering humanitarian action, Hydrol. Earth Syst. Sci., 20, 3549–3560, https://doi.org/10.5194/hess-20-3549-2016, 2016.
Dinku, T., Ceccato, P., Grover-Kopec, E., Lemma, M., Connor, S. J., and Ropelewski, C. F.: Validation of satellite rainfall products over East Africa's complex topography, Int. J. Remote Sens., 28, 1503–1526, https://doi.org/10.1080/01431160600954688, 2007.
Dinku, T., Funk, C., Peterson, P., Maidment, R., Tadesse, T., Gadain, H., and Ceccato, P.: Validation of the CHIRPS satellite rainfall estimates over eastern Africa, Q. J. Roy. Meteor. Soc., 144, 292–312, https://doi.org/10.1002/qj.3244, 2018.
Donchyts, G., Schellekens, J., Winsemius, H., Eisemann, E., and van de Giesen, N.: A 30 m resolution surface water mask including estimation of positional and thematic differences using Landsat 8, SRTM and OpenStreetMap: A case study in the Murray–Darling Basin, Australia, Remote Sens., 8, 386, https://doi.org/10.3390/rs8050386, 2016.
Dong, B., Peng, S., Liu, G., Pu, T., Gerlein-Safdi, C., Prigent, C., and Lin, X.: Underestimation of methane emissions from the Sudd wetland: Unraveling the impact of wetland extent dynamics, Geophys. Res. Lett., 51, e2024GL110690, https://doi.org/10.1029/2024GL110690, 2024.
Dunning, C. M., Black, E. C. L., and Allan, R. P.: The onset and cessation of seasonal rainfall over Africa, J. Geophys. Res. Atmos., 121, 11405–11424, https://doi.org/10.1002/2016JD025428, 2016.
Dunning, C. M., Black, E., and Allan, R. P.: Later wet seasons with more intense rainfall over Africa under future climate change, J. Climate, 31, 9719–9738, https://doi.org/10.1175/JCLI-D-18-0102.1, 2018.
Easton-Calabria, E.: Possibilities and limitations of anticipatory action in complex crises: Acting in advance of flooding in South Sudan, Disasters, https://doi.org/10.1111/disa.12654, 2024.
Endris, H. S., Lennard, C., Hewitson, B., Dosio, A., Nikulin, G., and Artan, G. A.: Future changes in rainfall associated with ENSO, IOD and changes in the mean state over Eastern Africa, Clim. Dynam., 52, 2029–2053, https://doi.org/10.1007/s00382-018-4239-7, 2019.
European Space Agency (ESA): Copernicus Global Digital Elevation Model, OpenTopography [data set], https://doi.org/10.5069/G9028PQB, 2024.
Fisher, N. I.: Statistical Analysis of Circular Data, Cambridge University Press, Cambridge, UK, 277 pp., ISBN 978-0-521-56890-6, 1995.
Funk, C., Peterson, P., Landsfeld, M., Pedreros, D., Verdin, J., Shukla, S., Husak, G., Rowland, J., Harrison, L., Hoell, A., and Michaelsen, J.: The climate hazards infrared precipitation with stations: A new environmental record for monitoring extremes, Sci. Data, 2, 150066, https://doi.org/10.1038/sdata.2015.66, 2015.
Gebrechorkos, S. H., Hülsmann, S., and Bernhofer, C.: Evaluation of multiple climate data sources for managing environmental resources in East Africa, Hydrol. Earth Syst. Sci., 22, 4547–4564, https://doi.org/10.5194/hess-22-4547-2018, 2018.
Gibb, A.: A review of the hydrology of Lake Victoria and the Victoria Nile, Institute of Hydrology, Wallingford, UK, http://nora.nerc.ac.uk/507639/1/N507639CR.pdf (last access: 13 May 2026), 1984.
Hardy, A., Palmer, P. I., and Oakes, G.: Satellite data reveal how Sudd wetland dynamics are linked with globally significant methane emissions, Environ. Res. Lett., 18, https://doi.org/10.1088/1748-9326/ace272, 2023.
Hirabayashi, Y., Mahendran, R., Koirala, S., Konoshima, L., Yamazaki, D., Watanabe, S., Kim, H., and Kanae, S.: Global flood risk under climate change, Nat. Clim. Change, 3, 816–821, https://doi.org/10.1038/nclimate1911, 2013.
Hirabayashi, Y., Tanoue, M., Sasaki, O., Zhou, X., and Yamazaki, D.: Global exposure to flooding from the new CMIP6 climate model projections, Sci. Rep., 11, 3740, https://doi.org/10.1038/s41598-021-83279-w, 2021.
Howell, P. P., Lock, M., and Cobb, S. (Eds.): The Jonglei Canal: Impact and Opportunity, Cambridge University Press, Cambridge, UK, 537 pp., ISBN 978-0-521-30286-9, 1988.
Humanitarian Data Exchange: South Sudan: Rainfall Indicators at Subnational Level, HDX [data set], https://data.humdata.org/dataset/ssd-rainfall-subnational (last access: 10 June 2025), 2025.
Hurst, H. E. and Phillips, P.: The Hydrology of the Lake Plateau and Bahr el Jebel, The Nile Basin, Vol. V, Government Press, Cairo, Egypt, 251 pp., 1938.
IFRC: Operational Framework for Anticipatory Action 2021–2025, International Federation of Red Cross and Red Crescent Societies, https://www.ifrc.org/document/operational-framework-anticipatory-action-2021-2025 (last access: 13 May 2026), 2022.
IPCC: Climate Change 2021: The Physical Science Basis, Working Group I contribution to the Sixth Assessment Report of the Intergovernmental Panel on Climate Change, https://www.ipcc.ch/report/ar6/wg1/ (last access: 13 May 2026), 2021.
Jammalamadaka, S. R. and SenGupta, A.: Topics in Circular Statistics, Series on Multivariate Analysis, vol. 5, World Scientific Publishing, 336 pp., https://doi.org/10.1142/4031, 2001.
Johnson, D. H.: Reconstructing a history of local floods in the Upper Nile region of the Sudan, Int. J. Afr. Hist. Stud., 25, 607–616, https://doi.org/10.2307/219027, 1992.
Junk, W. J., Bayley, P. B., and Sparks, R. E.: The flood pulse concept in river-floodplain systems, in: Proceedings of the International Large River Symposium, edited by: Dodge, D. P., Canadian Special Publication of Fisheries and Aquatic Sciences, 106, 110–127, ISBN 9780660132594, 1989.
Junk, W. J., An, S., Finlayson, C. M., Gopal, B., Květ, J., Mitchell, S. A., Mitsch, W. J., and Robarts, R. D.: Current state of knowledge regarding the world's wetlands and their future under global climate change: A synthesis, Aquat. Sci., 75, 151–167, https://doi.org/10.1007/s00027-012-0278-z, 2013.
Kadykalo, A. N. and Findlay, C. S.: The flow regulation services of wetlands, Ecosyst. Serv., 20, 91–103, https://doi.org/10.1016/j.ecoser.2016.06.005, 2016.
Kite, G. W.: Analysis of Lake Victoria levels, Hydrol. Sci. J., 27, 99–110, https://doi.org/10.1080/02626668209491093, 1982.
Kenya Meteorological Department (KMD): State of the Climate Kenya 2022, Kenya Meteorological Department, Nairobi, Kenya, https://meteo.go.ke/wp-content/uploads/2023/06/State-of-the-Climate-Kenya-2022.pdf (last access: 13 May 2026), 2023.
Kolstad, E. W., MacLeod, D., and Demissie, T. D.: Drivers of subseasonal forecast errors of the East African short rains, Geophys. Res. Lett., 48, e2021GL093292, https://doi.org/10.1029/2021GL093292, 2021.
Kull, D.: Connections between recent water level drops in Lake Victoria, dam operations and drought, International Rivers Network, http://www.internationalrivers.org/files/attached-files/full_report_pdf.pdf (last access: 13 May 2026), 2006.
Laaha, G., Gauster, T., Tallaksen, L. M., Vidal, J.-P., Stahl, K., Prudhomme, C., Heudorfer, B., Vlnas, R., Ionita, M., Van Lanen, H. A. J., Adler, M.-J., Caillouet, L., Delus, C., Fendekova, M., Gailliez, S., Hannaford, J., Kingston, D., Van Loon, A. F., Mediero, L., Osuch, M., Romanowicz, R., Sauquet, E., Stagge, J. H., and Wong, W. K.: The European 2015 drought from a hydrological perspective, Hydrol. Earth Syst. Sci., 21, 3001–3024, https://doi.org/10.5194/hess-21-3001-2017, 2017.
Lamberts, E.: The effects of Jonglei Canal operation scenarios on the Sudd swamps in Southern Sudan, M.Sc. thesis, University of Twente, Enschede, the Netherlands, 64 pp., https://essay.utwente.nl/fileshare/file/59163/scriptie_E_Lamberts.pdf (last access: 12 May 2026), 2009.
Lin, L., Di, L., Tang, J., Yu, E., Zhang, C., Rahman, M. S., Shrestha, R., and Kang, L.: Improvement and validation of NASA/MODIS NRT global flood mapping, Remote Sens., 11, 205, https://doi.org/10.3390/rs11020205, 2019.
Manatsa, D. and Behera, S. K.: On the epochal strengthening in the relationship between rainfall of East Africa and IOD, J. Climate, 26, 5655–5673, https://doi.org/10.1175/JCLI-D-12-00568.1, 2013.
Manatsa, D., Chipindu, B., and Behera, S. K.: Shifts in IOD and their impacts on association with East Africa rainfall, Theor. Appl. Climatol., 110, 115–128, https://doi.org/10.1007/s00704-012-0610-5, 2012.
Marthews, T. R., Dadson, S. J., Clark, D. B., Blyth, E. M., Hayman, G. D., Yamazaki, D., Becher, O. R. E., Martínez-de la Torre, A., Prigent, C., and Jiménez, C.: Inundation prediction in tropical wetlands from JULES-CaMa-Flood global land surface simulations, Hydrol. Earth Syst. Sci., 26, 3151–3175, https://doi.org/10.5194/hess-26-3151-2022, 2022.
McDonnell, J. J. and Beven, K.: Debates: The future of hydrological sciences: A (common) path forward? A call to action aimed at understanding velocities, celerities and residence time distributions of the headwater hydrograph, Water Resour. Res., 50, 5342–5350, https://doi.org/10.1002/2013WR015141, 2014.
Mertes, L. A. K.: Documentation and significance of the perirheic zone on inundated floodplains, Water Resour. Res., 33, 1749–1762, https://doi.org/10.1029/97WR00658, 1997.
Mistry, V. V. and Conway, D.: Remote forcing of East African rainfall and relationships with fluctuations in levels of Lake Victoria, Int. J. Climatol., 23, 67–89, https://doi.org/10.1002/joc.861, 2003.
Mohamed, Y. A. and Savenije, H. H. G.: Impact of climate variability on the hydrology of the Sudd wetland: Signals derived from long term (1900–2000) water balance computations, Wetl. Ecol. Manag., 22, 191–198, https://doi.org/10.1007/S11273-014-9337-7, 2014.
Mohamed, Y. A., van den Hurk, B. J. J. M., Savenije, H. H. G., and Bastiaanssen, W. G. M.: Hydroclimatology of the Nile: results from a regional climate model, Hydrol. Earth Syst. Sci., 9, 263–278, https://doi.org/10.5194/hess-9-263-2005, 2005a.
Mohamed, Y. A., van den Hurk, B. J. J. M., Savenije, H. H. G., and Bastiaanssen, W. G. M.: Impact of the Sudd wetland on the Nile hydroclimatology, Water Resour. Res., 41, W08405, https://doi.org/10.1029/2004WR003792, 2005b.
Mueller, N., Lewis, A., Roberts, D., Ring, S., Melrose, R., Sixsmith, J., Lymburner, L., McIntyre, A., Tan, P., Curnow, S., and Ip, A.: Water observations from space: Mapping surface water from 25 years of Landsat imagery across Australia, Remote Sens. Environ., 174, 341–352, https://doi.org/10.1016/j.rse.2015.11.003, 2016.
Mugume, S. N., Abasabyoona, G., Engwau, J., Sempewo, J., van de Sande, B., and Butler, D.: Assessment of the impact of the rise in Lake Victoria water levels on urban flooding using a GIS-based spatial flood modelling approach, Urban Water J., 21, 219–233, https://doi.org/10.1080/1573062X.2023.2284960, 2024.
NASA Goddard Space Flight Center: Global Water Monitor, Lake Victoria 1 (000314), https://earth.gsfc.nasa.gov/gwm/lake/314 (last access: 13 May 2026), 2025.
Nicholson, S. E.: The predictability of rainfall over the Greater Horn of Africa, Part I: Prediction of seasonal rainfall, J. Hydrometeorol., 15, 1011–1027, https://doi.org/10.1175/JHM-D-13-062.1, 2014.
Nicholson, S. E.: Climate and climatic variability of rainfall over eastern Africa, Rev. Geophys., 55, 590–635, https://doi.org/10.1002/2016RG000544, 2017.
Nicholson, S. E. and Yin, X.: Rainfall conditions in equatorial East Africa during the nineteenth century as inferred from the record of Lake Victoria, Clim. Change, 48, 387–398, https://doi.org/10.1023/A:1010736008362, 2001.
Nicholson, S. E., Klotter, D., and Hartman, A. T.: Lake-effect rains over Lake Victoria and their association with mesoscale convective systems, J. Hydrometeorol., 22, 1353–1368, https://doi.org/10.1175/JHM-D-20-0244.1, 2021.
Nile Basin Initiative/Nile Equatorial Lakes Subsidiary Action Program (NELSAP): Integrated Lakes Management Plan (ILMP) for the Fisheries and Ecosystems of Lakes Edward and Albert, Final Report, Volume 1, Lakes Edward and Albert Fisheries (LEAF) Pilot Project, submitted by Development Consultants International Limited (DCI) Consortium, 146 pp., https://nilebasin.org/node/12562 (last access: 13 August 2026), 2008.
Pappenberger, F., Beven, K. J., Hunter, N. M., Bates, P. D., Gouweleeuw, B. T., Thielen, J., and de Roo, A. P. J.: Cascading model uncertainty from medium range weather forecasts (10 days) through a rainfall-runoff model to flood inundation predictions within the European Flood Forecasting System (EFFS), Hydrol. Earth Syst. Sci., 9, 381–393, https://doi.org/10.5194/hess-9-381-2005, 2005.
Pekel, J. F., Cottam, A., Gorelick, N., and Belward, A. S.: High-resolution mapping of global surface water and its long-term changes, Nature, 540, 418–422, https://doi.org/10.1038/nature20584, 2016.
Pietroiusti, R., Vanderkelen, I., Otto, F. E. L., Barnes, C., Temple, L., Akurut, M., Bally, P., van Lipzig, N. P. M., and Thiery, W.: Possible role of anthropogenic climate change in the record-breaking 2020 Lake Victoria levels and floods, Earth Syst. Dynam., 15, 225–264, https://doi.org/10.5194/esd-15-225-2024, 2024.
Ramsar Secretariat: Sudd, Ramsar Sites Information Service, https://rsis.ramsar.org/ris/1622 (last access: 10 June 2024), 2006.
Ratna, S. B., Cherchi, A., Osborn, T. J., Joshi, M., and Uppara, U.: The extreme positive Indian Ocean Dipole of 2019 and associated Indian summer monsoon rainfall response, Geophys. Res. Lett., 48, e2020GL091497, https://doi.org/10.1029/2020GL091497, 2021.
Rebelo, L. M., Senay, G. B., and McCartney, M. P.: Flood pulsing in the Sudd wetland: Analysis of seasonal variations in inundation and evaporation in South Sudan, Earth Interact., 16, 1–19, https://doi.org/10.1175/2011EI382.1, 2012.
Rientjes, T. H. M., Haile, A. T., Kebede, E., Mannaerts, C. M. M., Habib, E., and Steenhuis, T. S.: Changes in land cover, rainfall and stream flow in Upper Gilgel Abbay catchment, Blue Nile basin – Ethiopia, Hydrol. Earth Syst. Sci., 15, 1979–1989, https://doi.org/10.5194/hess-15-1979-2011, 2011.
Roxy, M., Gualdi, S., Drbohlav, H. K. L., and Navarra, A.: Seasonality in the relationship between El Niño and Indian Ocean Dipole, Clim. Dynam., 37, 221–236, https://doi.org/10.1007/s00382-010-0876-1, 2011.
Sene, K. J.: Theoretical estimates for the influence of Lake Victoria on flows in the Upper White Nile, Hydrol. Sci. J., 45, 125–145, https://doi.org/10.1080/02626660009492310, 2000.
Stephens, E., Coughlan de Perez, E., Kruczkiewicz, A., Boyd, E., and Suarez, P.: Forecast-based Action, University of Reading, Red Cross Red Crescent Climate Centre, and International Research Institute for Climate and Society, https://www.climatecentre.org/wp-content/uploads/RCCC-FbA-Report.pdf (last access: 9 May 2024), 2015.
Sutcliffe, J. and Brown, E.: Water losses from the Sudd, Hydrol. Sci. J., 63, 527–541, https://doi.org/10.1080/02626667.2018.1438612, 2018.
Sutcliffe, J. V.: A hydrological study of the southern Sudd region of the Upper Nile, Hydrol. Sci. Bull., 19, 237–255, https://doi.org/10.1080/02626667409493903, 1974.
Sutcliffe, J. V. and Parks, Y. P.: The Hydrology of the Nile, IAHS Special Publication No. 5, International Association of Hydrological Sciences (IAHS Press), Wallingford, Oxfordshire, UK, ISBN 1-901502-75-9, 1999.
Swenson, S. and Wahr, J.: Monitoring the water balance of Lake Victoria, East Africa, from space, J. Hydrol., 370, 163–176, https://doi.org/10.1016/j.jhydrol.2009.03.008, 2009.
Tate, E., Sutcliffe, J., Conway, D., and Farquharson, F.: Water balance of Lake Victoria: Update to 2000 and climate change modelling to 2100, Hydrol. Sci. J., 49, 563–574, https://doi.org/10.1623/hysj.49.4.563.54422, 2004.
Tekleab, S., Mohamed, Y., and Uhlenbrook, S.: Hydro-climatic trends in the Abay/Upper Blue Nile basin, Ethiopia, Phys. Chem. Earth, 61–62, 32–42, https://doi.org/10.1016/j.pce.2013.04.017, 2013.
Tekleab, S., Uhlenbrook, S., Mohamed, Y., Savenije, H. H. G., Temesgen, M., and Wenninger, J.: Water balance modeling of Upper Blue Nile catchments using a top-down approach, Hydrol. Earth Syst. Sci., 15, 2179–2193, https://doi.org/10.5194/hess-15-2179-2011, 2011.
Thiemig, V., Rojas, R., Zambrano-Bigiarini, M., Levizzani, V., and de Roo, A.: Validation of satellite-based precipitation products over sparsely gauged African river basins, J. Hydrometeorol., 13, 1760–1783, https://doi.org/10.1175/JHM-D-12-032.1, 2012.
Ticehurst, C., Guerschman, J. P., and Chen, Y.: The strengths and limitations in using the daily MODIS open water likelihood algorithm for identifying flood events, Remote Sens., 6, 11791–11809, https://doi.org/10.3390/rs61211791, 2014.
Uganda National Meteorological Authority (UNMA): The State of Climate of Uganda in 2022, Uganda National Meteorological Authority, Kampala, Uganda, https://mwe.go.ug/publications/meteorological/state-of-uganda-climate-in-2022 (last access: 18 August 2026), 2022.
Ummenhofer, C. C., Gupta, A. S., England, M. H., and Reason, C. J. C.: Contributions of Indian Ocean sea surface temperatures to enhanced East African rainfall, J. Climate, 22, 993–1013, https://doi.org/10.1175/2008JCLI2493.1, 2009.
UNESCO: Sudd wetland, UNESCO World Heritage Centre Tentative Lists, https://whc.unesco.org/en/tentativelists/6276/ (last access: 14 August 2024), 2017.
UNHCR: UNHCR warns of dire impact from floods in South Sudan as new wet season looms, UNHCR Briefing Notes, https://www.unhcr.org/news/briefing-notes/unhcr-warns-dire-impact-floods-south-sudan-new-wet-season-looms (last access: 9 August 2024), 2022.
Vanderkelen, I., van Lipzig, N. P. M., and Thiery, W.: Modelling the water balance of Lake Victoria (East Africa) – Part 1: Observational analysis, Hydrol. Earth Syst. Sci., 22, 5509–5525, https://doi.org/10.5194/hess-22-5509-2018, 2018a.
Vanderkelen, I., van Lipzig, N. P. M., and Thiery, W.: Modelling the water balance of Lake Victoria (East Africa) – Part 2: Future projections, Hydrol. Earth Syst. Sci., 22, 5527–5549, https://doi.org/10.5194/hess-22-5527-2018, 2018b.
Van Lanen, H. A. J., Wanders, N., Tallaksen, L. M., and Van Loon, A. F.: Hydrological drought across the world: impact of climate and physical catchment structure, Hydrol. Earth Syst. Sci., 17, 1715–1732, https://doi.org/10.5194/hess-17-1715-2013, 2013.
Van Loon, A. F. and Laaha, G.: Hydrological drought severity explained by climate and catchment characteristics, J. Hydrol., 526, 3–14, https://doi.org/10.1016/j.jhydrol.2014.10.059, 2015.
Wainwright, C. M., Finney, D. L., Kilavi, M., Black, E., and Marsham, J. H.: Extreme rainfall in East Africa, October 2019–January 2020 and context under future climate change, Weather, 76, 26–31, https://doi.org/10.1002/wea.3824, 2021.
Wenhaji Ndomeni, C., Cattani, E., Merino, A., and Levizzani, V.: An observational study of the variability of East African rainfall with respect to sea surface temperature and soil moisture, Q. J. Roy. Meteor. Soc., 144, 384–404, https://doi.org/10.1002/qj.3255, 2018.
Wilks, D. S.: Statistical Methods in the Atmospheric Sciences, 3rd edn., Vol. 100, Academic Press, Oxford, UK, ISBN 9780123850225, 2011.
Williams, M.: The Sudd swamps and the White Nile, in: The Nile Basin, Cambridge University Press, Cambridge, UK, 107–126, https://doi.org/10.1017/9781316831885.009, 2018.
WMO: Guide to Hydrological Practices: Data Acquisition and Processing, Analysis, Forecasting and Other Applications, 5th edn., WMO-No. 168, World Meteorological Organization, Geneva, Switzerland, 1994.
WMO (World Meteorological Organization): State of the Climate in Africa 2022, WMO-No. 1330, Geneva, Switzerland, 2023.
Zakaria Lukwasa, A., Ayal, D. Y., Zeleke, T. T., and Beketie, K. T.: Spatio-temporal rainfall variability and its linkage with large scale climate oscillations over the Republic of South Sudan, Clim. Serv., 28, 100322, https://doi.org/10.1016/j.cliser.2022.100322, 2022.
Zhang, T., Dong, Z., Wang, W., Qian, Z., Zhang, J., Lu, P., Han, Y., Li, Z., Ji, J., Hou, Y., and Li, H.: Flood risk assessment in data-scarce South Sudan using a flood modeling framework, J. Hydrol. Reg. Stud., 61, 102743, https://doi.org/10.1016/j.ejrh.2025.102743, 2025.
Zhang, X., Bi, Z., Sun, X., Wang, P., Xu, Z., and Jia, B.: Backwater effects in rivers and lakes: Case study of Dongping Lake in China, Water, 15, 3850, https://doi.org/10.3390/w15213850, 2023.
This study traced how water moved from Lake Victoria to the Sudd wetlands to explain the prolonged flooding in South Sudan between 2019 and 2024. Using satellite observations, rainfall records, and lake and river measurements, we found that water takes about 17 months to travel through the system, much longer than previously assumed 5 months. The results show that lakes and wetlands can store and slowly release water over several years, helping improve flood forecasting and early warning.
This study traced how water moved from Lake Victoria to the Sudd wetlands to explain...