
the Creative Commons Attribution 4.0 License.
the Creative Commons Attribution 4.0 License.
 | 23 Jul 2026
The 2022–2023 snow drought in the Italian Alps doubled glacier contribution to summer streamflow
Martina Leone

Francesco Avanzi
Umberto Morra di Cella
Simone Gabellani
Edoardo Cremonese
Michel Isabellon
Paolo Pogliotti
Riccardo Scotti
Andrea Monti
Luca Ferraris
Roberto Colombo
Snow droughts are increasingly affecting mountain regions, raising concerns about downstream water availability in glacierized catchments. Here, we quantified the role of glaciers in mitigating snow-drought impacts on downstream streamflow during the severe 2022–2023 event in the Italian Alps. In order to do so, we compared glacier-melt contribution to streamflow during these years with the 2011–2023 historical period in two catchments, Dora Baltea (Aosta Valley) and Adda (Lombardy). We employed spatially distributed estimates of glacier melt, snow water equivalent (SWE), air temperature and total precipitation over glaciers from an operational cryospheric model (S3M Italy), and compared these estimates with downstream observations of streamflow at the closure sections of both catchments. Results showed a severe snow water equivalent deficit over glaciers across both catchments and both years (between ∼ −45 % at 4000 m in 2022 and ∼ −75 % at 2000 m a.s.l. during both years), which was largely driven by anomalous air temperatures and seasonal-precipitation patterns (up to +2–3 °C and −73 %, respectively). Air-temperature anomalies displayed a clear signature of elevation – dependent warming, with anomalies at 4000 m a.s.l. that were 1 to 1.5 °C higher than at 2000 m a.s.l.. Glacier contribution to streamflow doubled to tripled during these snow droughts in both catchments, a process that manifested itself through four mechanisms: an earlier-than-usual onset of the glacier melt season, an intensification of glacier melt contribution to streamflow, an earlier-than-usual seasonal peak in glacier melt contribution, and an extension of the glacier melt season. Still, glacier melt contribution to streamflow remained highly sensitive to short-term meteorological events, such as a sudden drop of temperatures, as well as early/late season snowfalls. These results highlight the critical role of glacier melt in maintaining streamflow during severe droughts and emphasize the need to integrate glacier dynamics into water management strategies for alpine areas facing increasingly frequent and intense drought events.
- Article
(4493 KB) - Full-text XML
- BibTeX
- EndNote


Glaciers play a crucial role in regulating water availability in and from mountainous regions (Viviroli et al., 2007; Immerzeel et al., 2010). They do so by significantly contributing to streamflow, especially during summer, and thus providing a vital source of freshwater for human use and ecosystems (Viviroli et al., 2020; Soruco et al., 2015; Barnett et al., 2005; Immerzeel et al., 2010; Hanus et al., 2024). However, glacier coverage is shrinking at an unmatched rate as the climate warms (Hugonnet et al., 2021; Zemp et al., 2015; Sommer et al., 2020), driven by decreased snowfall and snow cover (Colombo et al., 2022; Bozzoli et al., 2024; Marty et al., 2017; Mote et al., 2018; Ngoma et al., 2021), which lead to negative glacier mass balances (Zemp et al., 2023; Zekollari et al., 2019; Huss et al., 2017). Projections for the European Alps indicate a potential loss of 50 % of the 2017 glacier volume by 2050, and up to the complete disappearance by the end of the century, depending on the considered emission scenario (Zekollari et al., 2019). The supportive and often decisive role of glaciers as global “water towers” is thus under pressure (Viviroli et al., 2020; Gobiet et al., 2014; van der Wiel et al., 2021; Stahl et al., 2022).
In this context of climate warming, a growing concern in the hydrology of world-wide mountains is the emergence of snow droughts, that is, periods characterized by a significant lack of snowfall, or a lack of snow accumulation during winters with near normal winter precipitation but higher-than-usual temperatures (Harpold et al., 2017; Huning and Aghakouchak, 2020; Hatchett et al., 2022). Low snow accumulation has significant negative consequences: it poses challenges for water management (Harpold et al., 2017), threatens food security, and harms wildlife and ecosystems (Barsugli et al., 2020). Furthermore, a deficit of meltwater runoff due to a snow drought can diminish hydropower potential, as observed in Northern Italy during 2022 (Koehler et al., 2022). Snow droughts – arising from reduced snowfall, anomalously warm temperatures, or both – have the potential to exacerbate glacier shrinkage by limiting snow accumulation, advancing the onset and prolonging the duration of the melt season, and enhancing ice melt (Vargo et al., 2020).
Although the impact of reduced snow cover on glacier melt and mass balance is well established, the propagation of these processes to downstream water supply deficits during snow droughts remains less well quantified (Van Tiel et al., 2021). Understanding this chain of processes is urgent, as some early studies have shown that glacier melt can compensate for low flows during droughts in alpine regions (Van Tiel et al., 2021, 2023). Following these early studies, it appears that glaciers may offset precipitation-driven water shortages by exceeding normal ice melt (Van Tiel et al., 2021), due to increased meltwater during periods of lack of snow and heatwaves. This enhanced glacier melt, coupled with lower-than-usual streamflow due to the lack of precipitation, increases the contribution of glaciers to streamflow during droughts. However, these previous studies also indicate that the compensatory role of glaciers is rarely straightforward, and significantly varies with local factors and hydrological regimes.
Also, previous studies on the contributing role of glaciers during streamflow droughts have mostly been in temperate regions, whereas elucidating the chain of events at play during these events is particularly important in Mediterranean regions, where water supply is asynchronous between wet-cold winters and dry-warm summers (Bales et al., 2018). In such climates, glaciers may seasonally represent a predominant source of water for all sectors and uses, with little to no contribution from summer precipitation (Ayala et al., 2020; Huss, 2011; Farinotti et al., 2012). This is the case of the southern side of the European Alps, a region acting as a crucial link between the climate regimes of northern Europe and the Mediterranean. This transitional climate zone is projected to face increasingly intense and severe droughts under future climate scenarios (Bednar-Friedl et al., 2022). Consequently, glaciers in the southern Alps are becoming vital for both upstream communities relying on meltwater and downstream economies dependent on consistent water resources (Beniston et al., 2018).
The snow droughts of 2022 and 2023 in the Italian Alps (Colombo et al., 2023) present an opportunity to investigate the contribution of glaciers to streamflow during snow droughts. 2022 was globally the fifth warmest year on record (World Meteorological Organization, 2023), with Europe experiencing its hottest summer since 1950, and was marked by a persistent high pressure, heatwaves up to +2.5 °C above normal (Tripathy and Mishra, 2023), and significant precipitation deficits (Copernicus Climate Change Service, 2023). Northern Italy was particularly affected by combined drought and heat, leading to a record-low snow water equivalent (SWE) in March 2022, down −70 % compared to the reference period (Avanzi et al., 2024). This extreme warmth and lack of snow resulted in unprecedented glacier losses (Cremona et al., 2023; Voordendag et al., 2023) and the most severe streamflow drought in the Po river basin in two centuries (Montanari et al., 2023). 2023 followed as the warmest year globally since 1880 (World Meteorological Organization, 2024), and the second warmest in Europe (Copernicus Climate Change Service, 2024). While Europe saw varied conditions, northern Italy and the Alps consistently experienced a winter snow drought, followed by a warm and dry summer with prolonged heatwaves (Copernicus Climate Change Service, 2024). The standardized snow water equivalent index (SSWEI), representing the long-term winter anomaly in snow water equivalent, reached −2.8 in March 2023 (winter 2022–2023; for a definition of the snow water equivalent index, see Colombo et al., 2023), further underscoring the severity of these two years. Both 2022 and 2023 were characterized by intense heat and exceptionally low snowfall accumulation (Avanzi et al., 2022b), demonstrating the growing vulnerability of alpine regions to water scarcity, and providing a suitable example for studying the compensatory role of glaciers during snow droughts (Cremona et al., 2023).
Here, we aim to quantify the temporal and spatial patterns of glacier-melt contribution to streamflow in the Italian Alps during the intense 2022 and 2023 winter snow drought. We use spatially distributed estimates of snow water equivalent and glacier melt from two of Italy's most glacierized regions, Aosta Valley and Lombardy, along with streamflow data, over a period of 13 years (2010–2023), including the most recent 2022–2023 snow droughts. We aim to answer the following two research questions: (i) what are the key mechanisms driving the response of glacier melt to a snow drought? (ii) How much does glacier melt contribute to river flow during snow droughts compared to average years?
The Italian Alps represent a major glacial landscape in southern Europe. Here, we focus on two highly glaciated regions in particular: Aosta Valley and Lombardy (Smiraglia et al., 2015), illustrated in Fig. 1.
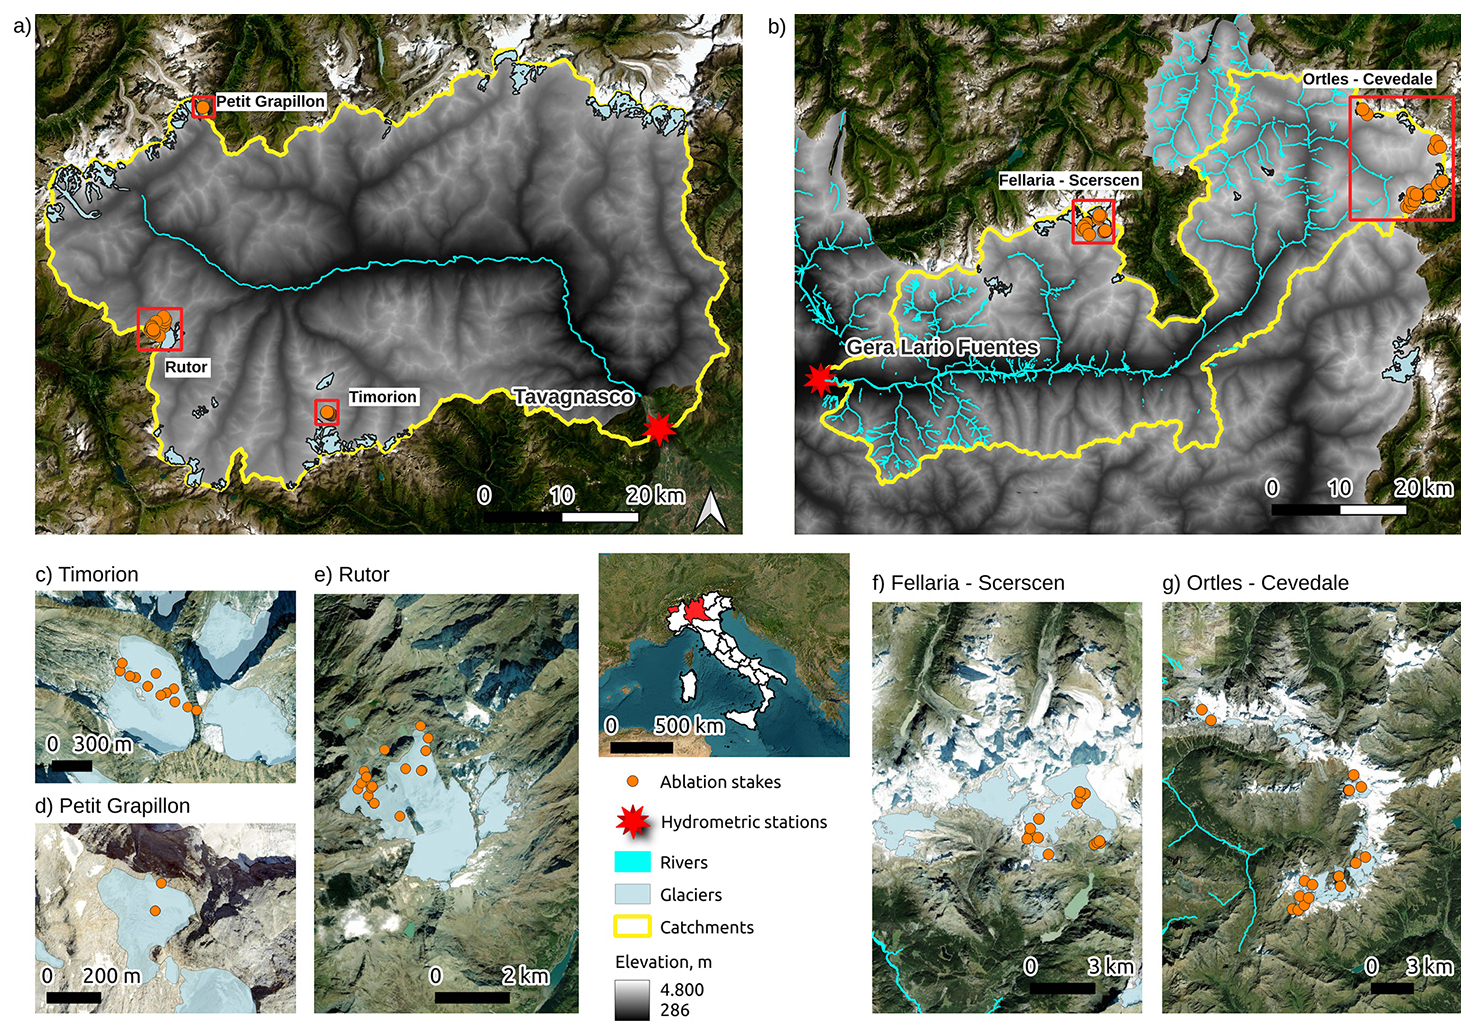
Figure 1Study area. The top left panel represents Aosta Valley (a), while the top right panel represents northern Lombardy (b). The blue lines represent the Dora Baltea and Adda rivers, while the pale blue areas represent glaciers. The orange dots correspond to ablation-stake data used in this study. The red squares refer to various inset maps (panels c–g). The red stars represent streamflow-data stations used in this study: Tavagnasco and Gera Lario Fuentes. The yellow outlines are the modelled catchments. The digital elevation model of the Italian Alps is shown in grey scale for reference. On the left portion, it is possible to observe a zoom on the following glacier areas: Timorion (c), Petit Grapillon (d) and Rutor (e), all in Aosta Valley; on the right portion, it is possible to observe a zoom on the following glacier areas: Ortles-Cevedale (f) and Fellaria-Scerscen (g), both located in Lombardy. Base map: Esri, Maxar, Earthstar Geographics, and the GIS User Community. Glacier outlines from updated datasets by the Regione Autonoma Valle d'Aosta (2019) and the Servizio Glaciologico Lombardo (2021). Digital elevation data from S3M Italy. Map generated using open-source GIS tools.
In Aosta Valley, 3.37 % of the territory (110 km2) is glacier-covered, encompassing 172 glaciers (Fondazione Montagna Sicura, 2025) (accessed January 2026). For the validation of glacier-melt simulations (see Sect. 3), we used available data on the Timorion, Rutor, and Petit Grapillon glaciers, which represent a range of glacial environments within Aosta Valley with available data (see Sect. 3). The Dora Baltea river flows through this valley, with Tavagnasco being the representative closure section for the basin (Fig. 1). This catchment has a total area of 3304 km2 (Fig. 1).
In Lombardy, glaciers cover 73 km2 across 203 glaciers (Bonardi, 2012), that is, about 0.3 % of the total area. Again for validation purposes (see Sect. 3), we focused on two distinct glacial systems with available data: Ortles-Cevedale, with multiple glaciers such as Alpe Sud, Cedec, Cevedale, Forni, Dosegù and Vitelli, and Bernina, including East and West Fellaria and Scerscen glaciers. These glaciers feed the Adda River, with Gera Lario Fuentes representing the closure section (Fig. 1, glaciers represent the 1.77 % of the basin area). The catchment has a total area of 2344 km2.
3.1 S3M Italy
To estimate glacier melt, we used output from the S3M Italy operational chain (Avanzi et al., 2023), which relies on the S3M snow-glacier melt model (Avanzi et al., 2022a). Among the wide range of cryospheric models, S3M strikes a balance between physical complexity and computational efficiency, providing spatially explicit estimates of snow water resources and glacier melt. In this paper, we used both daily maps of Snow Water Equivalent (see Sect. 3.3) and glacier melt (see Sect. 3.4). Note that S3M is a cryospheric model designed to simulate snow and glacier melt processes; it does not simulate river discharge or hydrological routing. Also, in this study, SWE, air temperature and precipitation were analyzed only over glacierized areas, to characterize how snow drought conditions affected glaciers; although S3M simulates SWE both on and off glaciers, off glacier snowmelt contributions to discharge were not considered here. While the S3M Italy system simulates snow water equivalent and snowmelt both on and off glaciers at the national scale, our analysis focuses only on meltwater generated over glacierized areas. Isolating the contribution of off-glacier snowmelt would require a fully coupled hydrological model capable of representing runoff routing, groundwater storage, and evapotranspiration processes. As a result, this study concentrates on glacier melt as a distinct and directly quantifiable component of the catchment water balance, while off-glacier snowmelt remains implicitly included in the observed streamflow signal.
The model uses a hybrid temperature index and radiation-driven melt approach and is fed by hourly inputs of incoming shortwave radiation, air temperature, total precipitation, and relative humidity. Precipitation-phase partitioning relies on both air temperature and relative humidity (Froidurot et al., 2014), an approach that has proved to provide reliable estimates across mountain landscapes (Zhang et al., 2017). The snow module also includes settling and snow hydraulics, based on a viscoplastic parametrization and the Darcy law, respectively (Avanzi et al., 2022a). In S3M, equations are solved for each pixel with no exchange of mass or energy across pixels, including no wind redistribution.
In the S3M Italy operational chain, S3M works with a 200 m spatial resolution and simulates hourly snapshots of snow water equivalent (SWE), snow depth, bulk snow density, and glacier melt across the whole of the Italian territory (period: September 2010 to present). Input data are routinely obtained from the database of the Italian Regional Administrations, Autonomous Provinces, and the Italian Civil Protection. Input maps are cropped over the 20 computational domains, each corresponding to one Italian administrative region, originally derived from a 20 m digital elevation model provided by the Italian Institute for Environmental Protection and Research (ISPRA), which was resampled at 200 m resolution using an averaging method. The vertical accuracy of the DEM is therefore consistent with that of a resampled elevation dataset at 200 m resolution, and does not retain the fine scale topographic variability present in the original DEM.
Besides elevation, S3M Italy employs static glacier maps from the Randolph Glacier Inventory v 6.0. The outputs are maps of snow accumulation and melt, as well as glacier melt on snow-free glacier surfaces. S3M Italy does not include glacier movement or debris coverage. Given the relatively short study period, assuming static glacier geometry represents a reasonable simplifying assumption, whereas the implications of neglecting debris cover are further discussed in Sect. 5.
S3M has been extensively calibrated and validated. The original model setup was calibrated in north-western Italy based on minimizing errors with respect to snow depth from 50+ ultrasonic sensors and thousands of manual measurements at peak accumulation (period: 2010–2019). This calibration targeted the optimization of the two melt parameters, one for incoming shortwave radiation and another one for air temperature. Results returned Root Mean Square Errors and Kling-Gupta Efficiencies (Kling et al., 2012) that are in line with the literature, 12–37 cm and 0.66–0.72, respectively. S3M Italy has been further validated with regard to its snow component at the national scale (Avanzi et al., 2023), showing little to no mean bias compared to Sentinel-1-based maps of snow depth, and root mean square errors are of the typical order of 30–60 cm and 90–300 mm for in situ, measured snow depth and snow water equivalent, respectively. Estimates of peak snow water equivalent by S3M Italy are also well correlated with annual streamflow at the closure section of 102 basins across Italy (correlation coefficient = 0.87), with the ratio between peak snow water equivalent volume and total annual streamflow volume averaging 22 % (median: 12 %).
Regarding the glacier component, only a general validation of this model suite for a different setup was published in Avanzi et al. (2022a). This validation in Aosta valley returned a correlation between simulated and observed change in thickness of 0.6. The sensitivity of the two melt parameters was found to be low in previous studies, because explicitly separating the radiation- and temperature-driven components of melt brings these parameters closer to a first-principles energy balance model than standard degree-day approaches (Avanzi et al., 2022a).
3.2 Glacier ablation stakes and streamflow data
To validate glacier-melt estimates, we employed a dataset of 32 ablations stakes in Aosta Valley and 39 in Lombardy, installed on the various glaciers shown in Fig. 1 at elevations from 2546 to 3545 m a.s.l.. Altogether, 208 measurements were collected from 2009 to 2022 by the Environmental Protection Agency of Aosta Valley and the Lombardy Glaciological Service, the two institutions responsible for glacier data collection in Aosta Valley and Lombardy, respectively (the latter in collaboration with the Regional Environmental Protection Agency of Lombardy and the Snow and Meteorology Monitoring Center of Bormio). Despite the inherent uncertainty and spatial limitations of ablation stake data (Cuffey and Paterson, 2006; Fountain and Vecchia, 1999), comparing modelled glacier melt to these measurements represents the most informative validation of S3M glacial melt component feasible to date.
Streamflow data for the Dora Baltea and Adda rivers were provided by the Autonomous Region of Aosta Valley and the Environmental Protection Agency of Lombardy, respectively. The dataset consisted of water-stage measurements, which were converted into flow rates using flow rating curves provided by the two respective institutions and accounting for morphological changes. For both datasets, we removed unreliable measurements to ensure data quality, mainly through visual screening. Both basins have a high degree of anthropization, especially due to hydropower, which may alter the timing and magnitude of river flow. As we will further discuss in Sect. 5.1, however, several pieces of evidence show that this alteration was minor for our scopes and at our scales.
In this paper, we will always refer to water years, defined as periods of time between 1 September and 31 August.
3.3 Snow drought characterization
We characterized the snow drought events of 2022 and 2023 by using daily maps of air temperature, total precipitation, and snow water equivalent (SWE) as available from S3M Italy across our study area (Avanzi et al., 2023). These data were processed to extrapolate daily trajectories of air temperature, precipitation, and mean snow water equivalent across select elevation bands over glaciers (every 500 m between 2000 and 4500 m a.s.l.). In this context, SWE was used to describe snow storage conditions over glaciers during these drought events.
To highlight the deviations from typical conditions, we first computed daily quartiles of air temperature, total precipitation, and snow water equivalent over the period 2010–2023, and then plotted these quartiles along with the trajectories of daily air temperature, total precipitation, and snow water equivalent for 2022 and 2023. Air temperature and snow water equivalent data were smoothed using a 10 d moving average to better highlight key events during these two years at different elevations. Precipitation data were cumulated by elevation band.
We also calculated seasonal anomalies for air temperature and precipitation in 2022 and 2023 relative to the mean seasonal values from 2010 to 2023. Each season corresponded to a three-month period according to meteorological conventions for this region: winter (December, January, February), spring (March, April, May), summer (June, July, August), and autumn (September, October, November).
3.4 Quantification of the glacier melt and validation strategy
To validate S3M Italy for the glacier component, we compared point mass balance data from 32 ablation stakes with co-located glacier melt model estimates. Since each ablation-stake data reports the mass balance over a certain period of time (usually, from summer to summer), for each data point we accumulated glacier melt for the same location and the same period of time. Subsequently, we computed the correlation index, bias (mean difference between simulated and observed values), a confusion matrix, the Root Mean Squared Error, and the coefficient of determination between observed and modelled cumulative glacier melt.
A rigorous quantification of glacier melt contribution would require knowing the proportion of total discharge that is directly attributable to glaciers, and thus a complex glacio-hydrologic model incorporating evapotranspiration, groundwater recharge, and flow routing processes. Lacking such a model, we adopt a simplified approach, estimating this contribution as the ratio of cumulative glacier melt to total observed discharge over a given period (Gascoin, 2024). We acknowledge that this approach likely overestimates the absolute glacier contribution, since observed streamflow integrates losses due to evapotranspiration and groundwater recharge from all runoff components. Therefore, the reported glacier contribution should be interpreted as an indicator of the relevance of glacier melt for streamflow generation, rather than as an exact partitioning of runoff sources.
We converted cumulative glacier melt in mm into a flow rate with units matching streamflow (m3 s−1), by multiplying glacier melt by the pixel area (40 000 m2). Then, we computed weekly ratios between cumulative, basin wide glacier melt and cumulative streamflow as a proxy for the contribution of glacier melt to streamflow. We chose a weekly resolution for our analysis in order to account for the time needed by glacier melt to reasonably influence streamflow at the closure sections. Since no definitive estimate of this lag time is available for these regions, this temporal resolution should be seen as a trade-off between shorter (such as daily) or longer (such as monthly) resolutions, which would both be inevitably too short or too long to capture driving factors of the glacier-streamflow interaction. We also evaluated the relationship between annual and daily glacier melt and streamflow to gain further insights.
4.1 S3M Italy model validation
Despite the significant spatial mismatch between stake measurements and a 200 × 200 m2 model, melt-estimate biases were generally within a ±1 m w.e. range (Fig. 2). Overall, S3M slightly underestimated glacier melt, with mean biases of −0.89 m w.e. in Lombardy and −0.39 m w.e. in Aosta Valley. Corresponding RMSE values are 1.66 m w.e. and 1.15 m w.e., respectively.
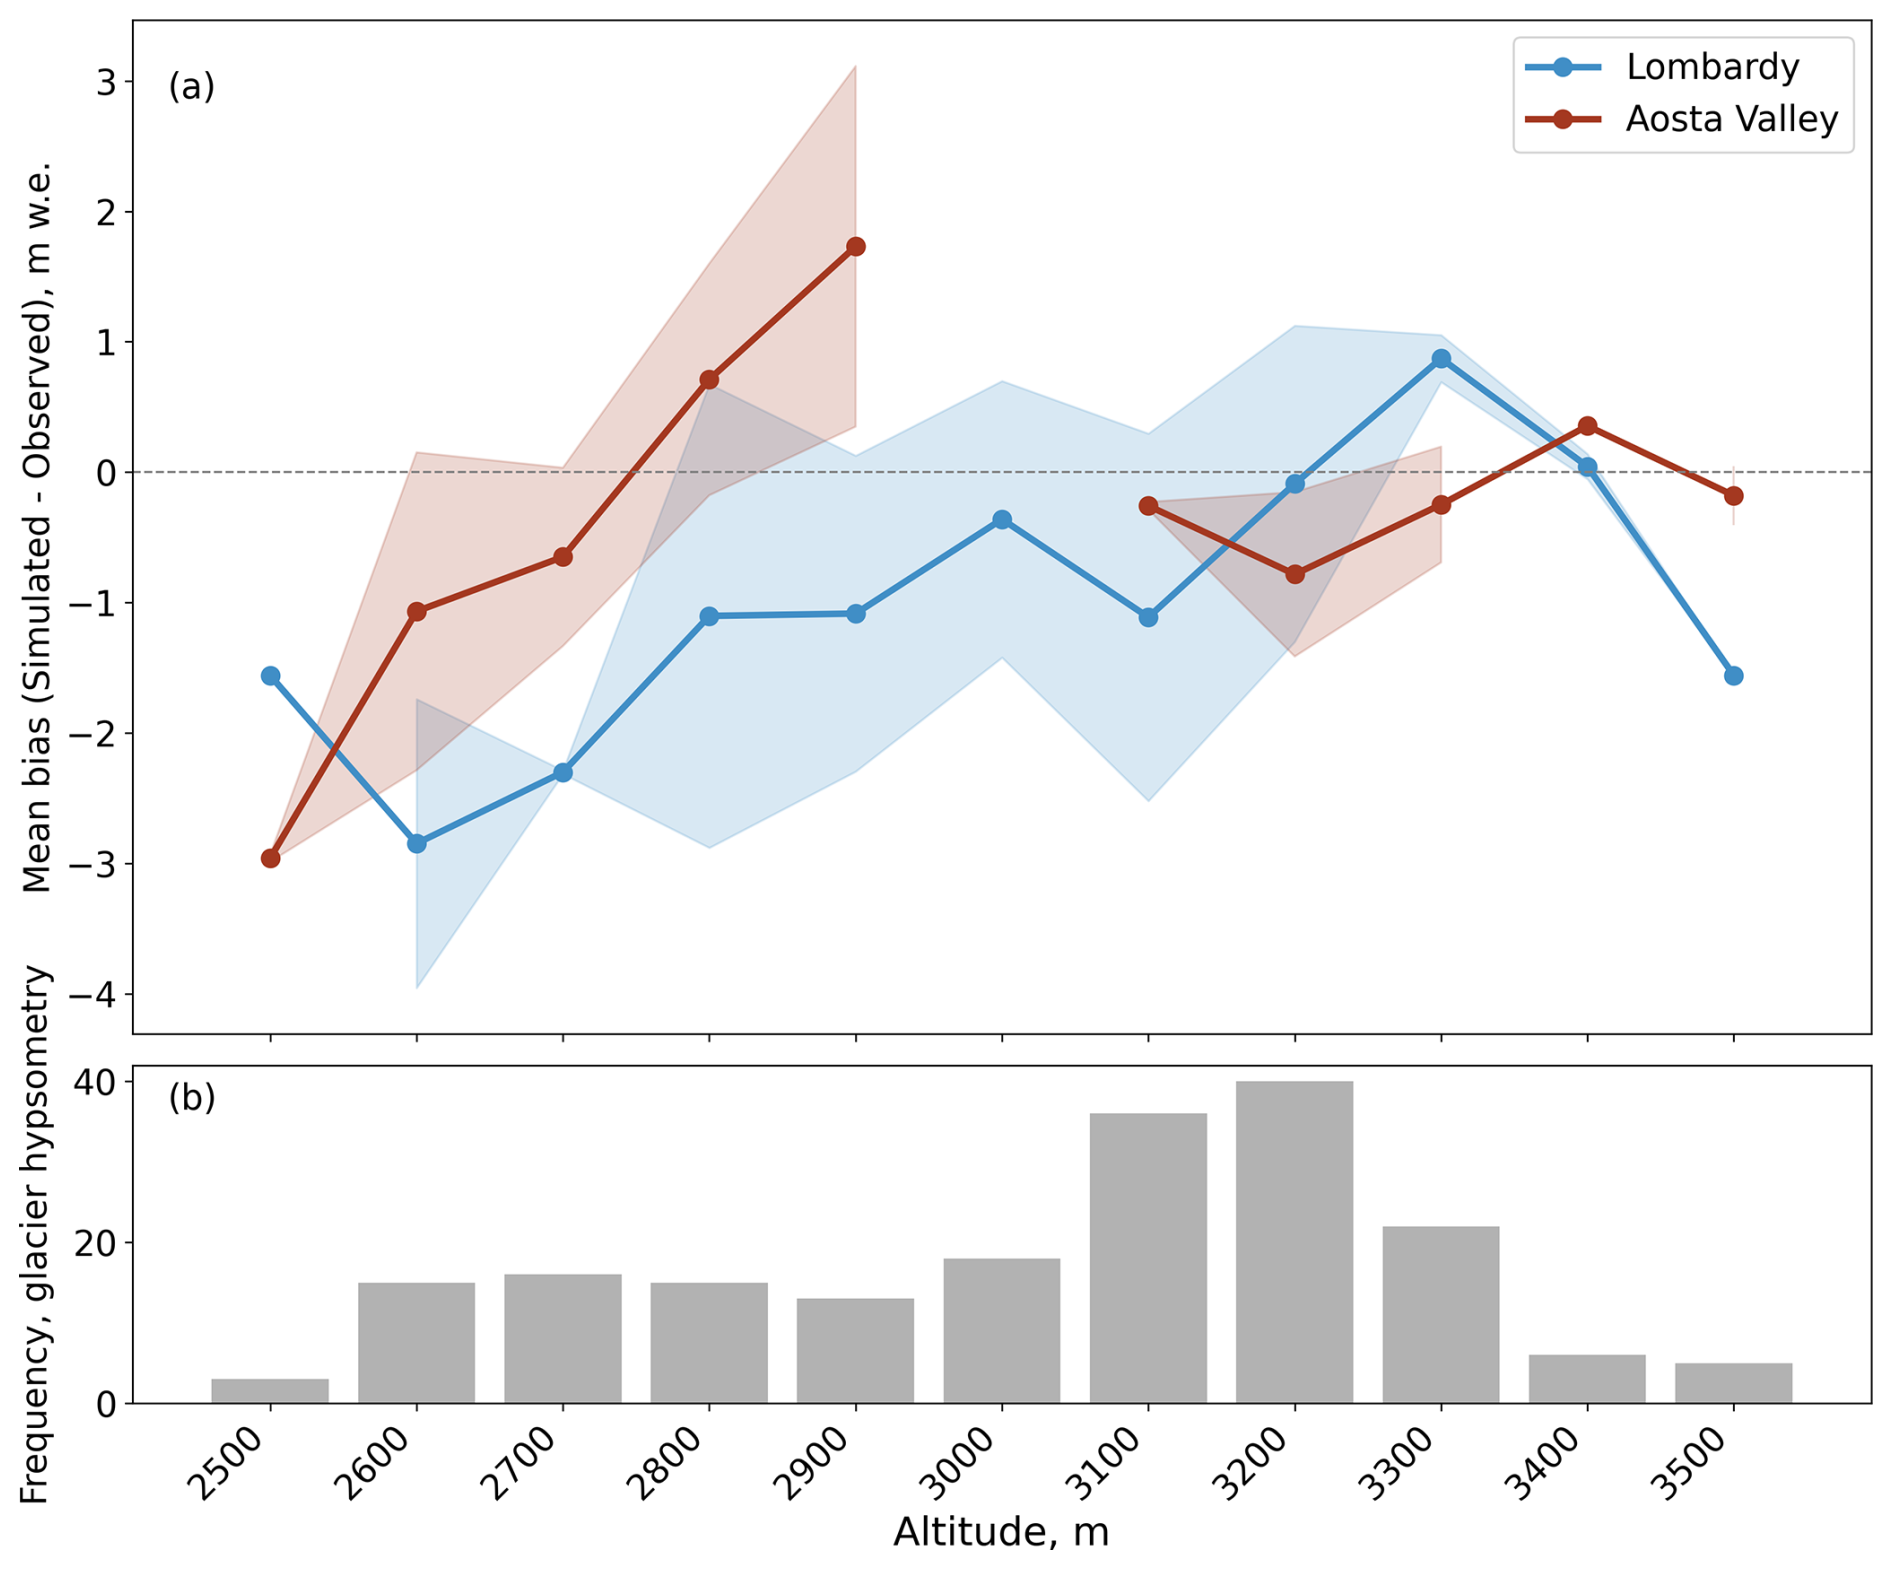
Figure 2In panel (a), the mean bias of S3M (modelled values) against stake measurements (observed values), binned by elevation, for both Aosta Valley (in red) and Lombardy (in blue). Shaded areas show the standard deviation of the model − observations differences. Missing data points for Aosta Valley are because data were unavailable between 2900–3000 and 3000–3100 m a.s.l. Panel (b) shows the frequency distribution of glacier elevations in both regions.
The model performed best between 2800 and 3200 m a.s.l., which is the most critical zone, as a significant portion of glacier mass currently lies at these elevations (see Fig. 2). At lower elevations, the model generally underestimated melt, likely due to the model struggling to represent the presence of debris on the glacier surface or other tongue processes. Above about 3300 m a.s.l., the model exhibited a more variable behavior depending on region and elevation, with evidence of both over and underestimation of melt. This likely reflects uncertainties in representing snow accumulation and melt processes at high elevations. Overall, these biases suggest that our estimates of glacier contribution to streamflow are conservative.
4.2 Air temperature and precipitation over glaciers
In Aosta Valley, both 2022 and 2023 were warmer than the 2010–2023 average, particularly during winter (DJF) and summer (JJA) (Figs. 3 and 4). Daily temperatures remained above the climatological median for prolonged periods, especially during the early-summer heatwave of 2022. Seasonal anomalies show that winter 2022 exhibited the strongest positive anomalies across elevation bands, followed by summer, whereas spring anomalies were generally smaller.
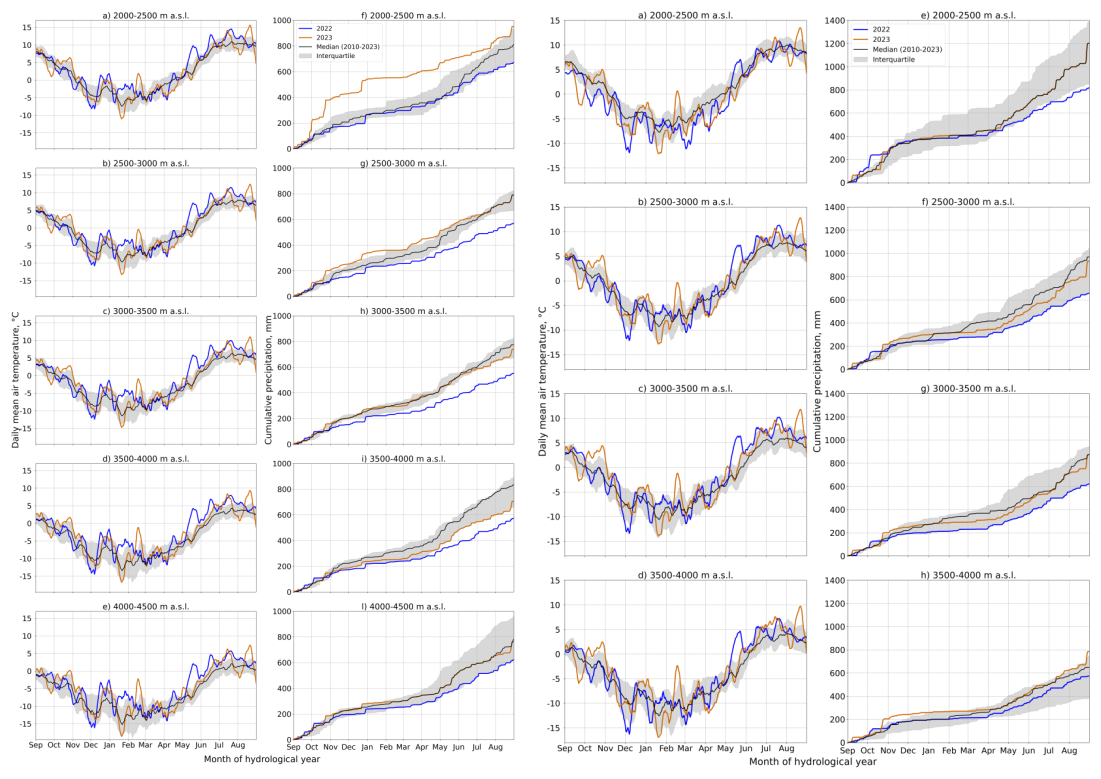
Figure 3Daily mean air temperature (a–e) and cumulative precipitation (f–l) by elevation bands over the glaciers of Aosta Valley (left) and Lombardy (right) during 2022 (blue) and 2023 (orange), compared to the 2010–2023 median (black) and interquartile range (grey area).
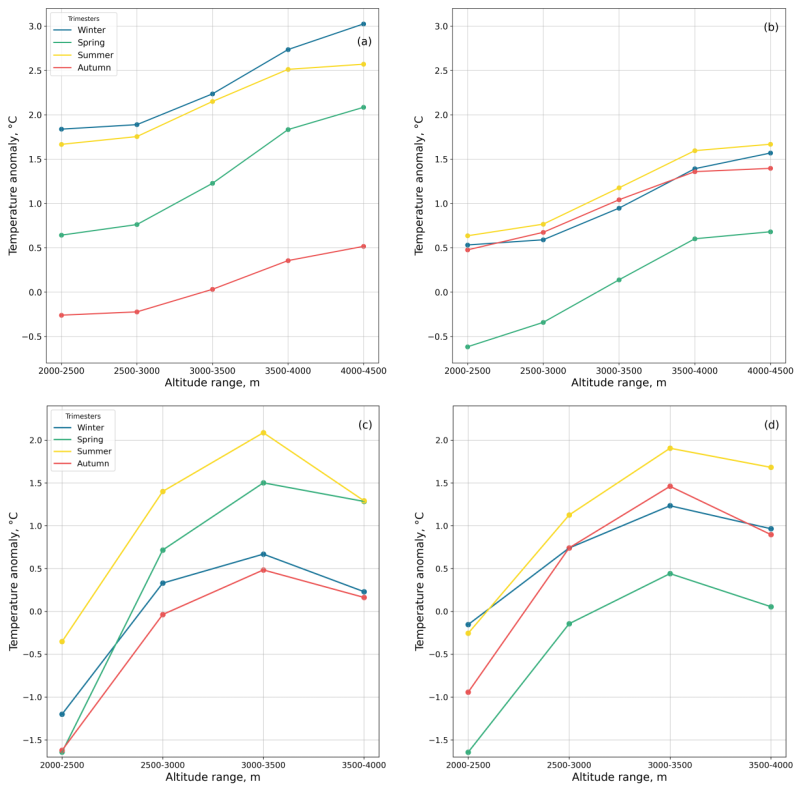
Figure 4Seasonal air temperature anomalies as a function of elevation bands for Aosta Valley (top row) and Lombardy (bottom row) in 2022 (left column) and 2023 (right column).
In contrast, spring 2023 was markedly cooler, with locally negative anomalies at lower elevations that favoured late-spring snowfall events, while winter and summer remained warmer than average. A comparable pattern emerged in Lombardy, although winter 2022 was slightly colder than average at the lowest elevations before predominantly above-average summer temperatures.
Warmer-than-average conditions during summer were driven by different mechanisms in 2022 vs. 2023. In 2022, warm spells during late-spring and early summer played a key role, with distinct periods of high temperatures observed in May, June, and July (see again Fig. 3). 2023, on the other hand, saw later and more concentrated hot spells, mainly during July and August, coupled with a cooler spring. Results were similar in Lombardy (Fig. 3), with 2022 characterized by distinct warm spells in late-spring and early summer (e.g., 11–28 May), while 2023 experienced later and more concentrated hot spells, particularly in August (e.g., 10–27 Augsut).
In terms of precipitation (Fig. 3, right column), Aosta Valley experienced a markedly drier-than-average 2022, particularly in winter and spring, with widespread negative anomalies across elevation bands. Precipitation deficits generally ranged between about −25 % and −30 % at mid to high elevations. After near-average conditions in September and October, precipitation deficits re-emerged from November onward. At the highest elevations (4000–4500 m a.s.l.), cumulative precipitation remained closer to the climatological median, generally within the interquartile range.
By contrast, 2023 exhibited a generally wetter pattern at lower elevations, particularly between 2000 and 3000 m a.s.l., largely driven by a small number of intense storm events. Spring precipitation was moderately above average at these elevations, while cumulative precipitation remained close to climatological values at higher elevations (3000–4500 m a.s.l.).
A similar pattern emerged in Lombardy (Fig. 3). The year 2022 was predominantly drier than average across most seasons and elevations, with particularly severe winter deficits at 2000–2500 m a.s.l. (around −30 % to −65 %). In contrast, 2023 was characterized by generally wetter conditions, especially in summer, when precipitation at 2000–2500 m a.s.l. was approximately +30 % to +35 % above average. However, winter precipitation remained substantially below normal, comparable to 2022.
Fig. 4 summarizes the seasonal temperature anomalies across elevation bands. In both regions, positive temperature anomalies generally increased with elevation, with winter 2022 exhibiting the strongest warming (up to about +3 °C), followed by summer. Compared with 2022, spring 2023 showed substantially smaller and locally negative temperature anomalies, particularly at lower elevations. This cooler spring favored late-spring snowfall events and delayed snow depletion on glaciers, despite above average temperatures returning during summer.
4.3 Snow water equivalent over glaciers
Both 2022 and 2023 saw substantial and widespread snow water equivalent (SWE) deficits over glaciers across all elevations in Aosta Valley (Fig. 5). In 2022, the snow water equivalent anomaly reached approximately −76 % across the 2000–3500 m a.s.l. range. This deficit decreased slightly at higher elevations, recording −64 % for 3500–4000 m a.s.l. and −47 % for 4000–4500 m a.s.l.. Similarly, 2023 exhibited substantial snow water equivalent deficits, though with slightly different altitudinal patterns. The anomaly was approximately −75 % from 2000–3500 m a.s.l., −71 % at 3500–4000 m a.s.l., and −64 % at 4000–4500 m a.s.l..
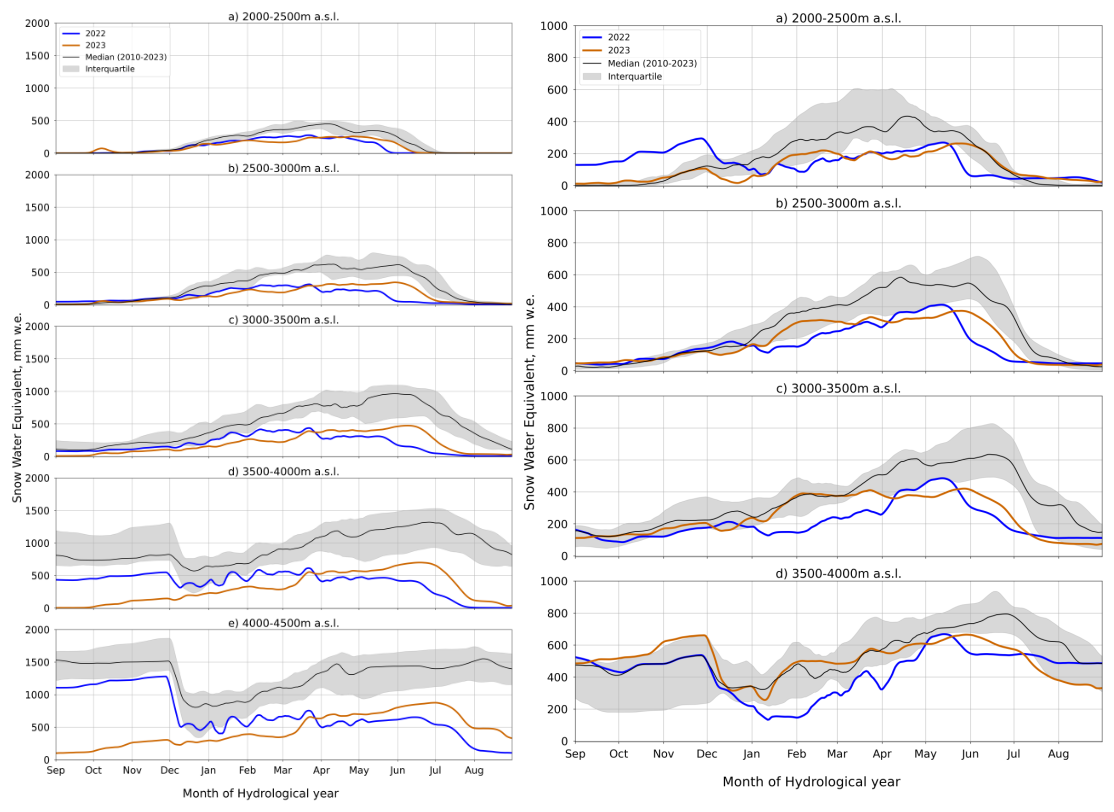
Figure 5Daily snow water equivalent (SWE) by elevation range over glaciers in Aosta Valley (left) and Lombardy (right) during 2022 (blue) and 2023 (orange), compared to the 2010–2023 median (black) and interquartile range (gray area).
While this significant snow water equivalent deficit persisted in both 2022 and 2023 in Aosta valley, the timing of snow accumulation and melt differed notably: 2022 saw an earlier than usual end to the snow accumulation season at all elevations (up to two months), which was directly attributable to the combined effect of consistently higher temperatures and lower precipitation. This premature end of accumulation inevitably led to an earlier onset of the snowmelt season, which reduced the duration of snow cover on glacier, with seasonal snow depletion and initial ice exposure occurring approximately 1.5 months earlier than usual at 2000–2500 m a.s.l. in 2022. Conversely, in 2023, the lower temperatures during spring, coupled with late-spring snowfalls as visible in Fig. 5, extended the snow accumulation season closer to its average end date.
Similar to the patterns observed in Aosta Valley, Lombardy also faced severe and widespread snow water equivalent (SWE) deficits across all analyzed elevations in both 2022 and 2023 (Fig. 5), clearly highlighting severe snow drought conditions. In 2022, SWE deficits ranged between approximately −70 % and −63 % across elevations from 2000 to 3500 m a.s.l., generally decreasing with altitude and becoming substantially smaller at the highest elevation band (3500–4000 m a.s.l.). A similar situation was observed in 2023, with SWE deficits ranging from about −71 % to −56 % between 2000 and 3500 m a.s.l., again showing a marked reduction at the highest elevations.
4.4 Glacier melt contribution to streamflow
The 2022 and 2023 droughts markedly altered hydrology in both catchments, with extremely low river flows highlighting an intense summer hydrologic drought following the winter snow drought (Fig. 6): annual mean streamflow in 2022 and 2023 was approximately −32 % lower than the 2011–2021 average, contrasting with a higher-than-usual glacier melt ( 148 % mean annual glacier melt compared to 2011–2021).
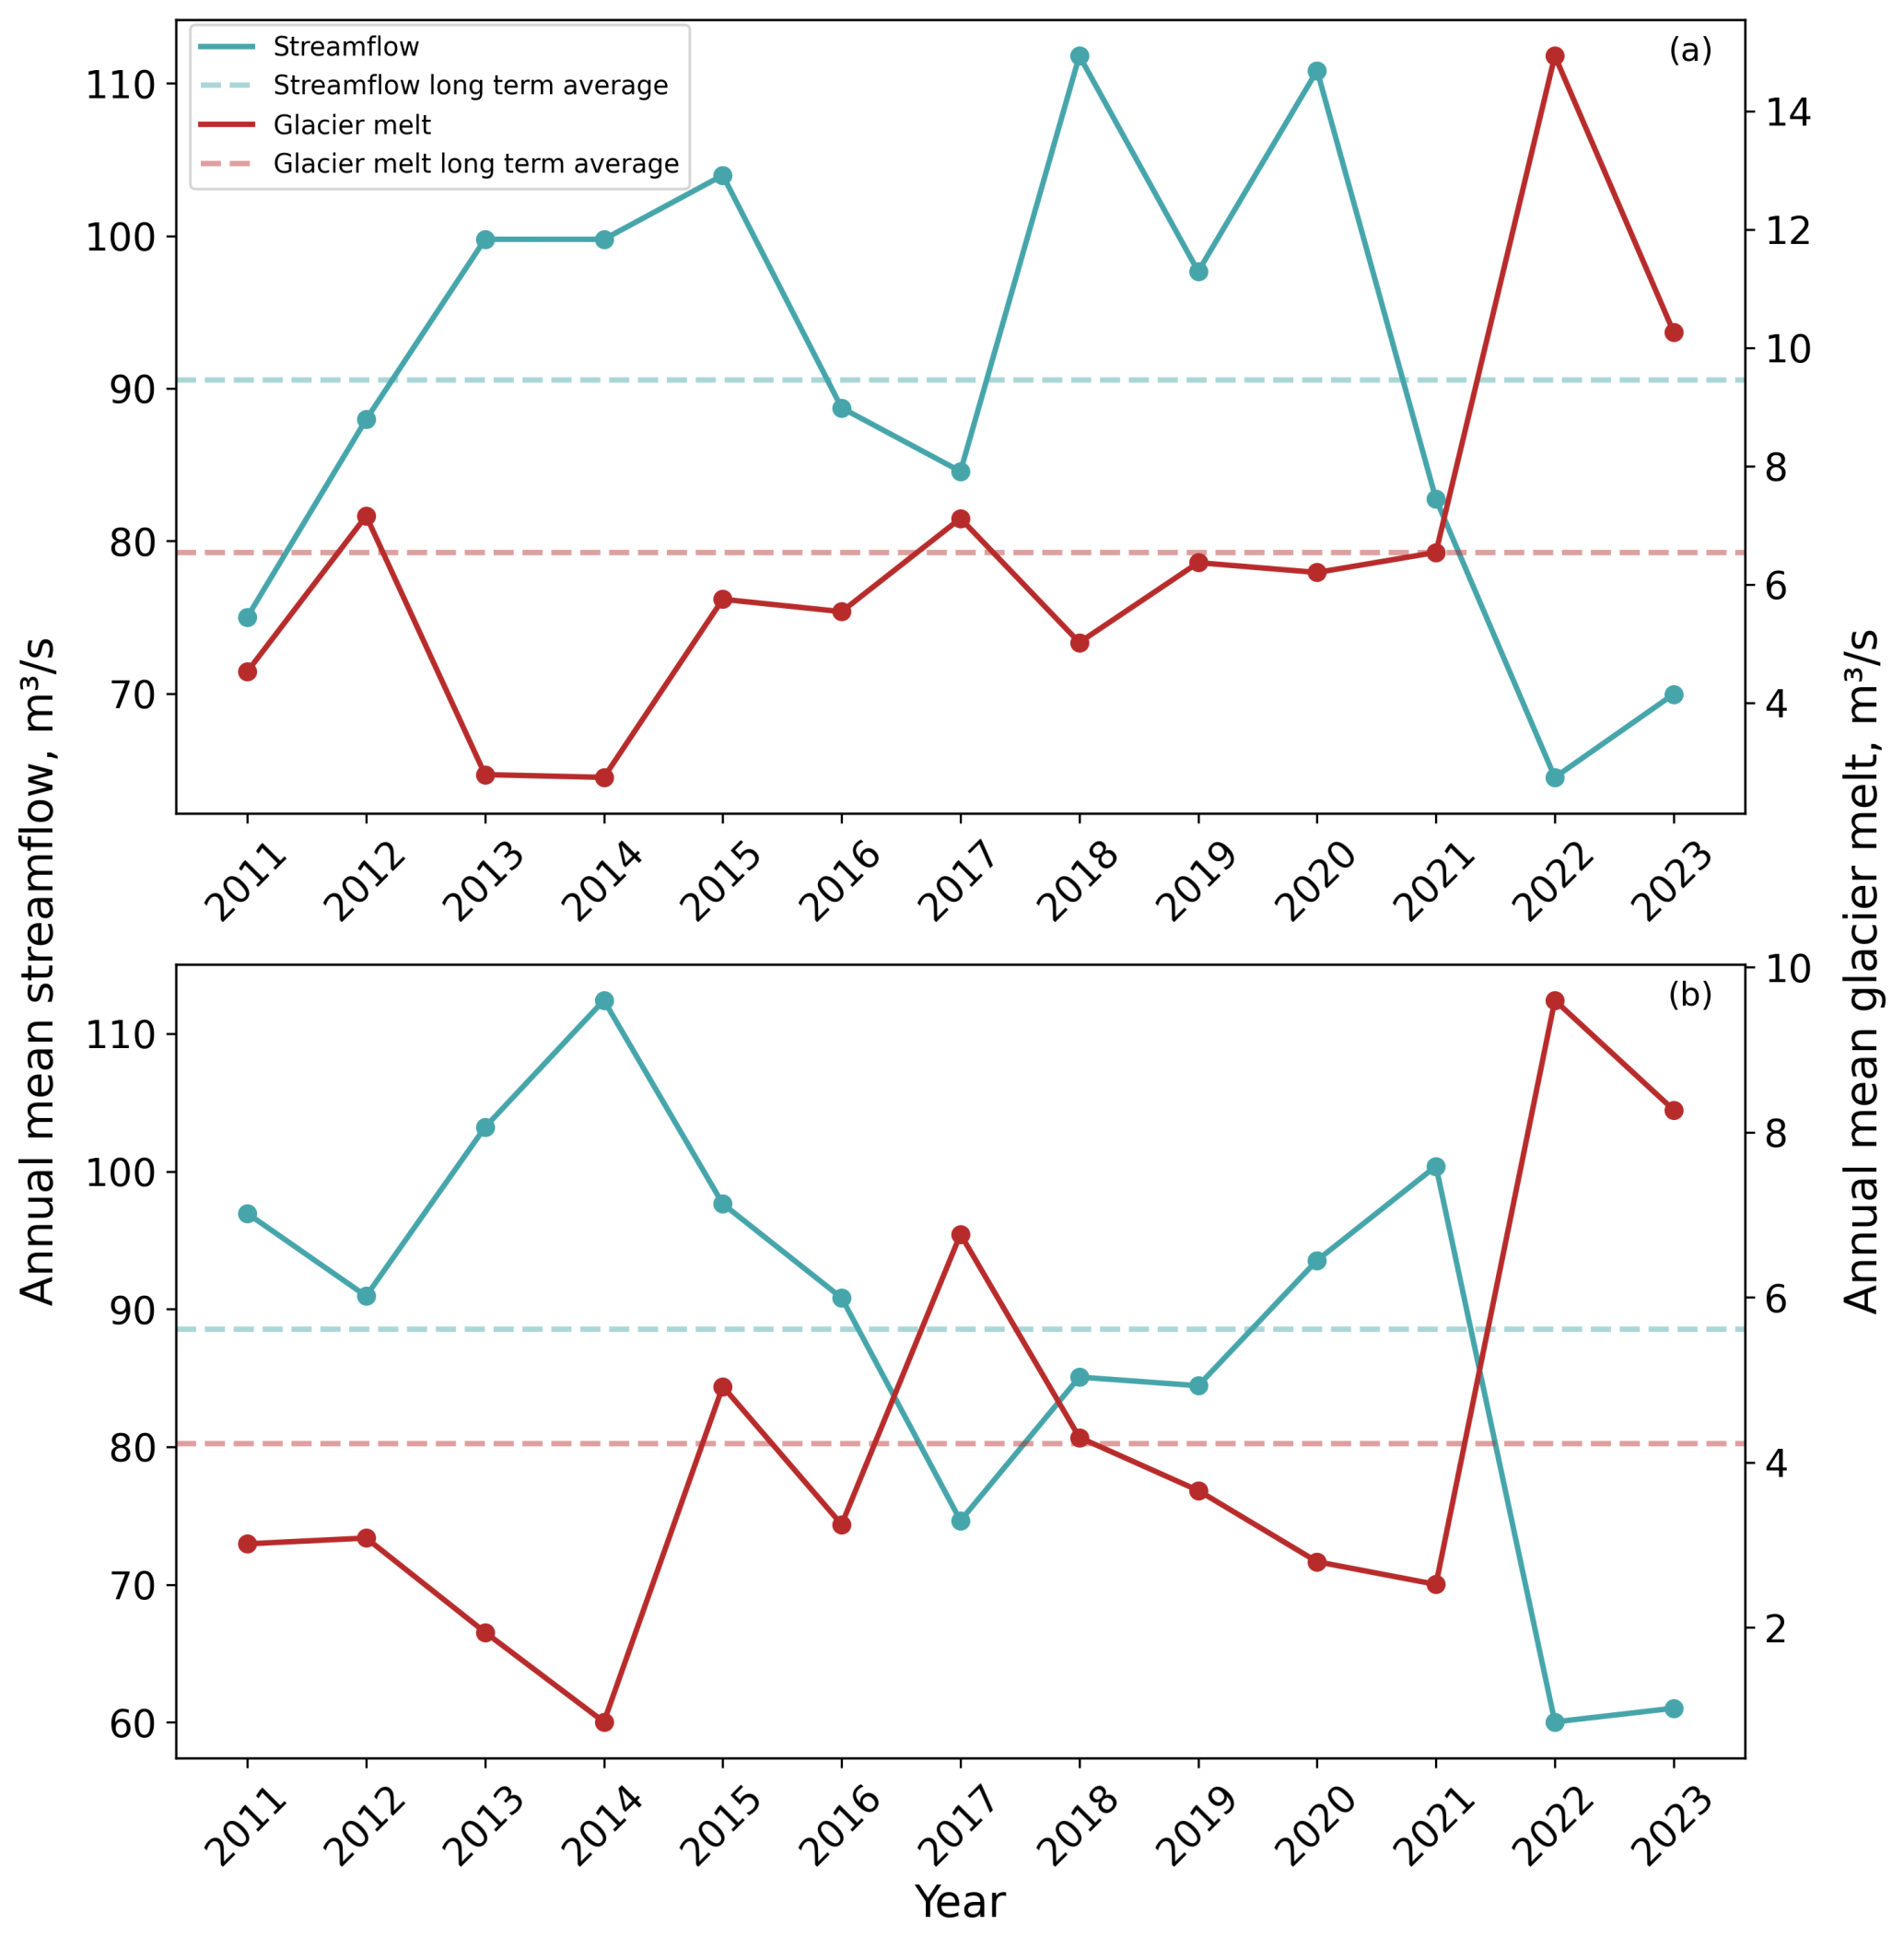
Figure 6Comparison between annual mean streamflow (in blue) and annual mean glacier melt (in red, simulated), and relative long term averages in dashed lines. Dora Baltea at Tavagnasco is represented in panel (a) and Adda at Fuentes is represented in panel (b). Water years 2011 through 2023.
Specifically, a clear contrast was observed during the 2022 water year. Along the Dora Baltea at Tavagnasco, average annual streamflow was among the lowest recorded during the study period (64.5 m3 s−1), while annual mean glacier melt reached its maximum value (14.9 m3 s−1). Similarly, along the Adda river, mean annual streamflow was low (60 m3 s−1), despite the highest glacier melt contribution of record (9.5 m3 s−1).
In 2023, both mean annual streamflow and glacier melt were slightly lower than in 2022 at both sites. At Tavagnasco (Dora Baltea), mean streamflow increased to 69.9 m3 s−1 while glacier melt averaged 10.2 m3 s−1. At Gera-Lario-Fuentes (Adda), mean streamflow was 61 m3 s−1 and glacier melt averaged 8.3 m3 s−1. Despite enhanced glacier melt in both years, streamflow remained below long-term average conditions (Fig. 6), indicating that glacier melt could not fully compensate for precipitation deficit and reduced snowmelt during drought.
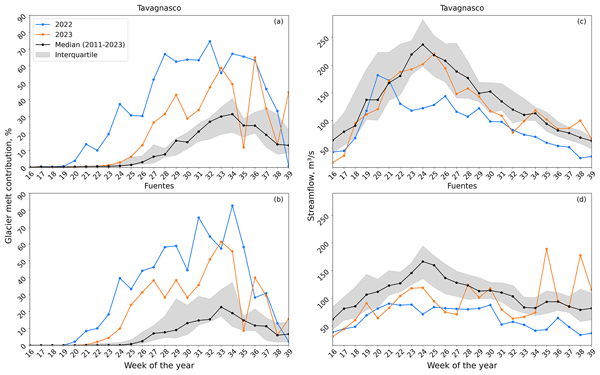
Glacier melt contribution to streamflow during summer doubled, or nearly tripled, in both catchments during 2022 and 2023 compared to pre-2022 water years (Fig. 7). This increase in glacier melt and the concurrent decline in streamflow highlighted a clear signature of snow droughts on the link between glacier melt and water supply – a signature that resolves around four significant mechanisms (Fig. 7).
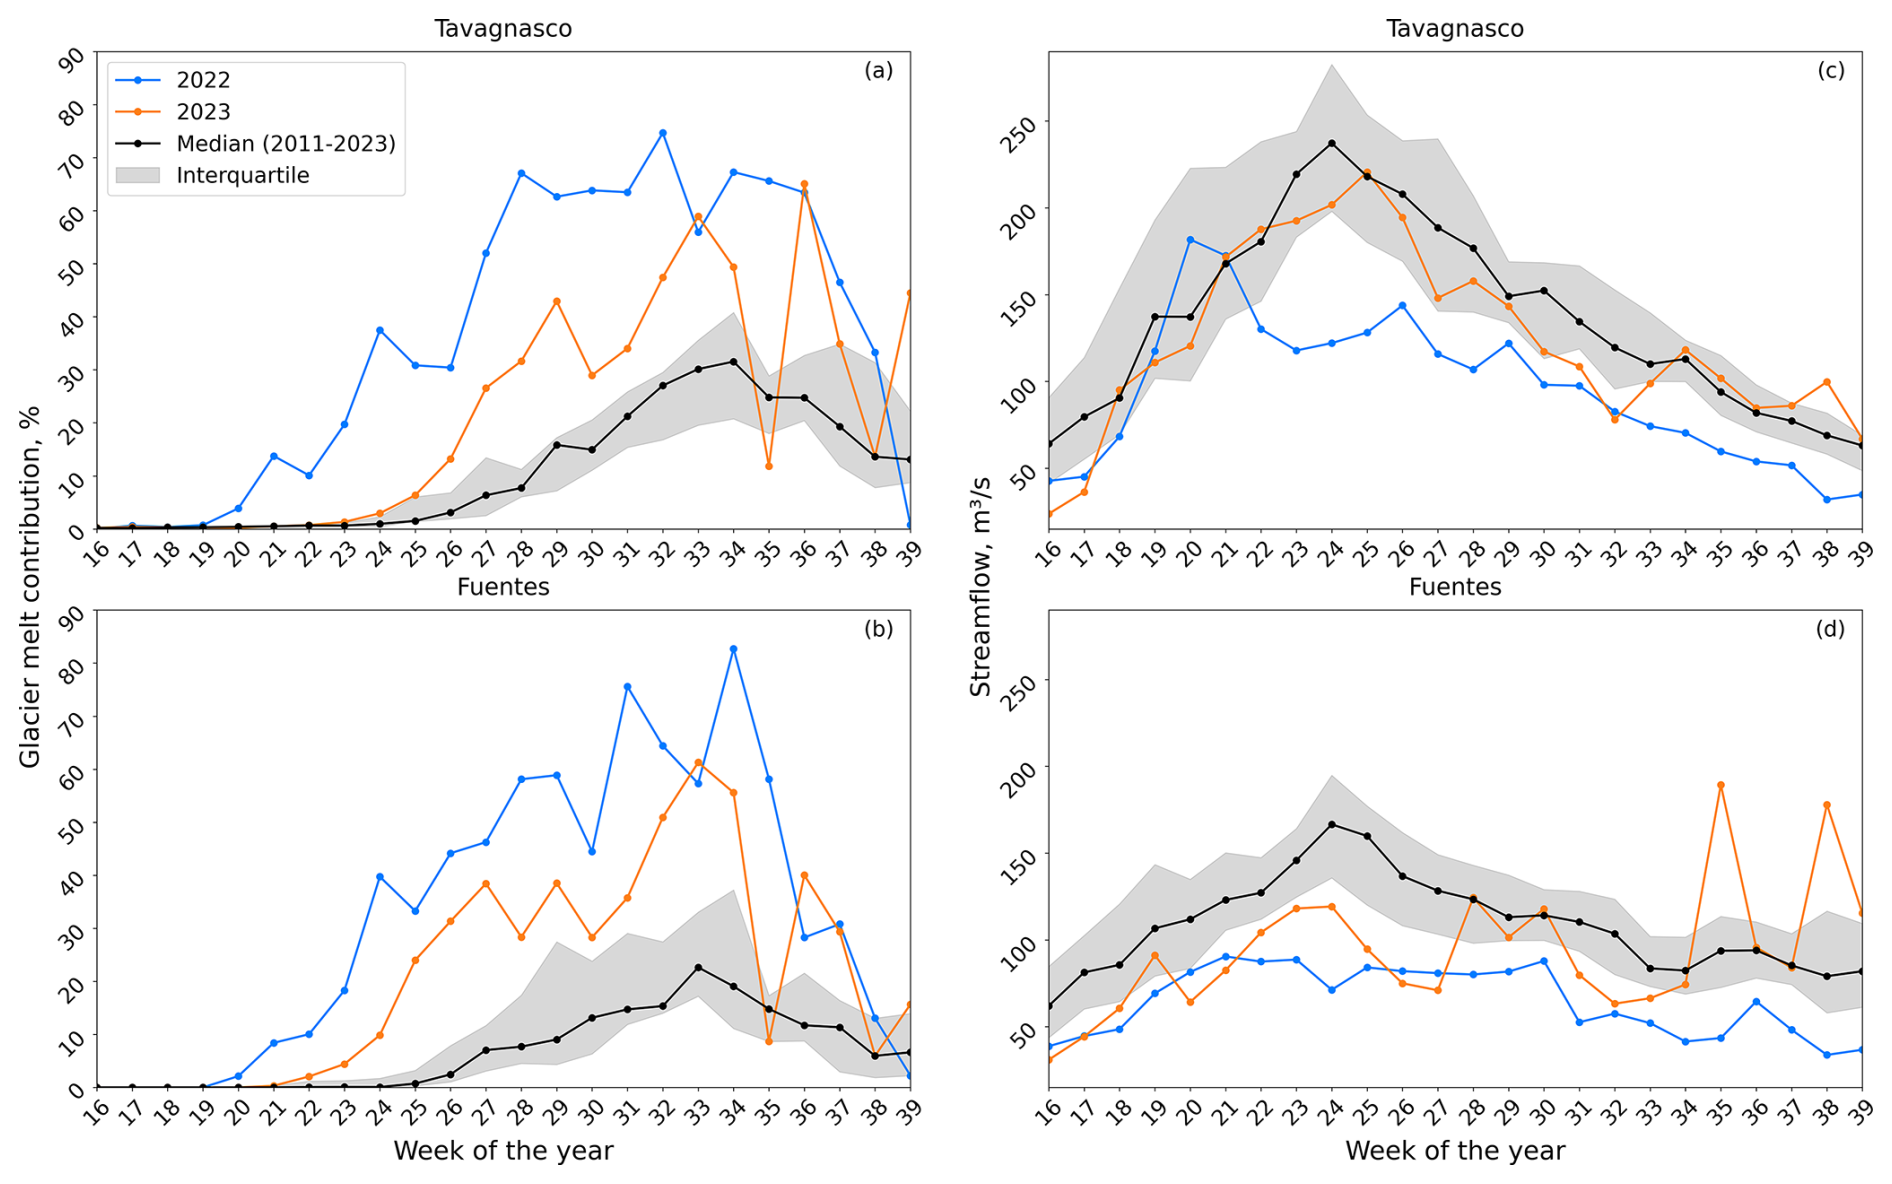
Figure 7Weekly glacier melt contribution to streamflow (a, b) and weekly mean streamflow (c, d) for hydrological year 2022 (in blue) and hydrological year 2023 (in orange) compared to the median and the interquartile range for water years 2011–2023, Tavagnasco (a, c) and Fuentes (a, d). Note that we included water years 2022 and 2023 in the interquartile range due to the comparatively short period of record.
The first mechanism is an earlier-than-usual start of the glacier-melt season (defined here as the week when glacier contribution first exceeded 5 %): in both Aosta Valley and Lombardy, the 2022 melt season began six weeks earlier than the median for 2011–2021. This earlier-than-usual start took place also in 2023: two weeks ahead of the median in Aosta Valley and three weeks ahead in Lombardy.
The second mechanism is an increase in the contribution of glaciers to streamflow during the whole of the melt season, and not just the peak summer-melt period. In 2022, peak glacier-melt contribution to streamflow reached 75 % in Tavagnasco, while it reached 65 % in 2023, two to three times the usual contribution for this region (31.5 %). At Fuentes, the impact was even more pronounced: in 2022, peak contribution nearly quadrupled (83 %), and in 2023, it almost tripled (61 %) compared to the median values (22.6 %).
The third mechanism is a potential shift in the timing of the seasonal glacier melt peak, which was particularly evident in Tavagnasco in 2022, when reduced summer rainfall (Avanzi et al., 2024) led to an earlier and more distinct glacier melt peak. During this year, peak contribution occurred two weeks earlier than usual, shifting from the median timing of week 34 (22–28 August) to week 32 (8–14 August). At Fuentes, the glacier melt peak during 2022 was recorded during week 34, that is, close to the median timing (week 33, 15–21 August), although an earlier sub-peak was already observed in week 31 (1–7 August). In 2023, on the other hand, sporadic rainfall during summer increased short-term discharge variability, making the identification of a distinct glacier melt peak less robust and partially masking melt driven signals.
The fourth and final mechanism observed is a potential prolongation of the melt season, which underpinned a higher-than-usual glacier melt contribution than the median even during late summer/early autumn. In Tavagnasco, glacier melt in 2022 accounted for 33 % of the streamflow even during week 38 (25–19 September), which was significantly above the median of 13 %. Similarly, at Fuentes, glacier melt during week 37 (12–18 September) reached 31 %, compared to the median of 11 %. This effect was even more pronounced in 2023 due to higher late-summer temperatures, as shown in Fig. 8. During 2023, in Tavagnasco, glacier melt during week 39 (26 September–2 October) contributed 44 % of streamflow, well above the median of 13 %, while in Fuentes, the contribution during week 39 was 15 %, compared to the median of 7 %.
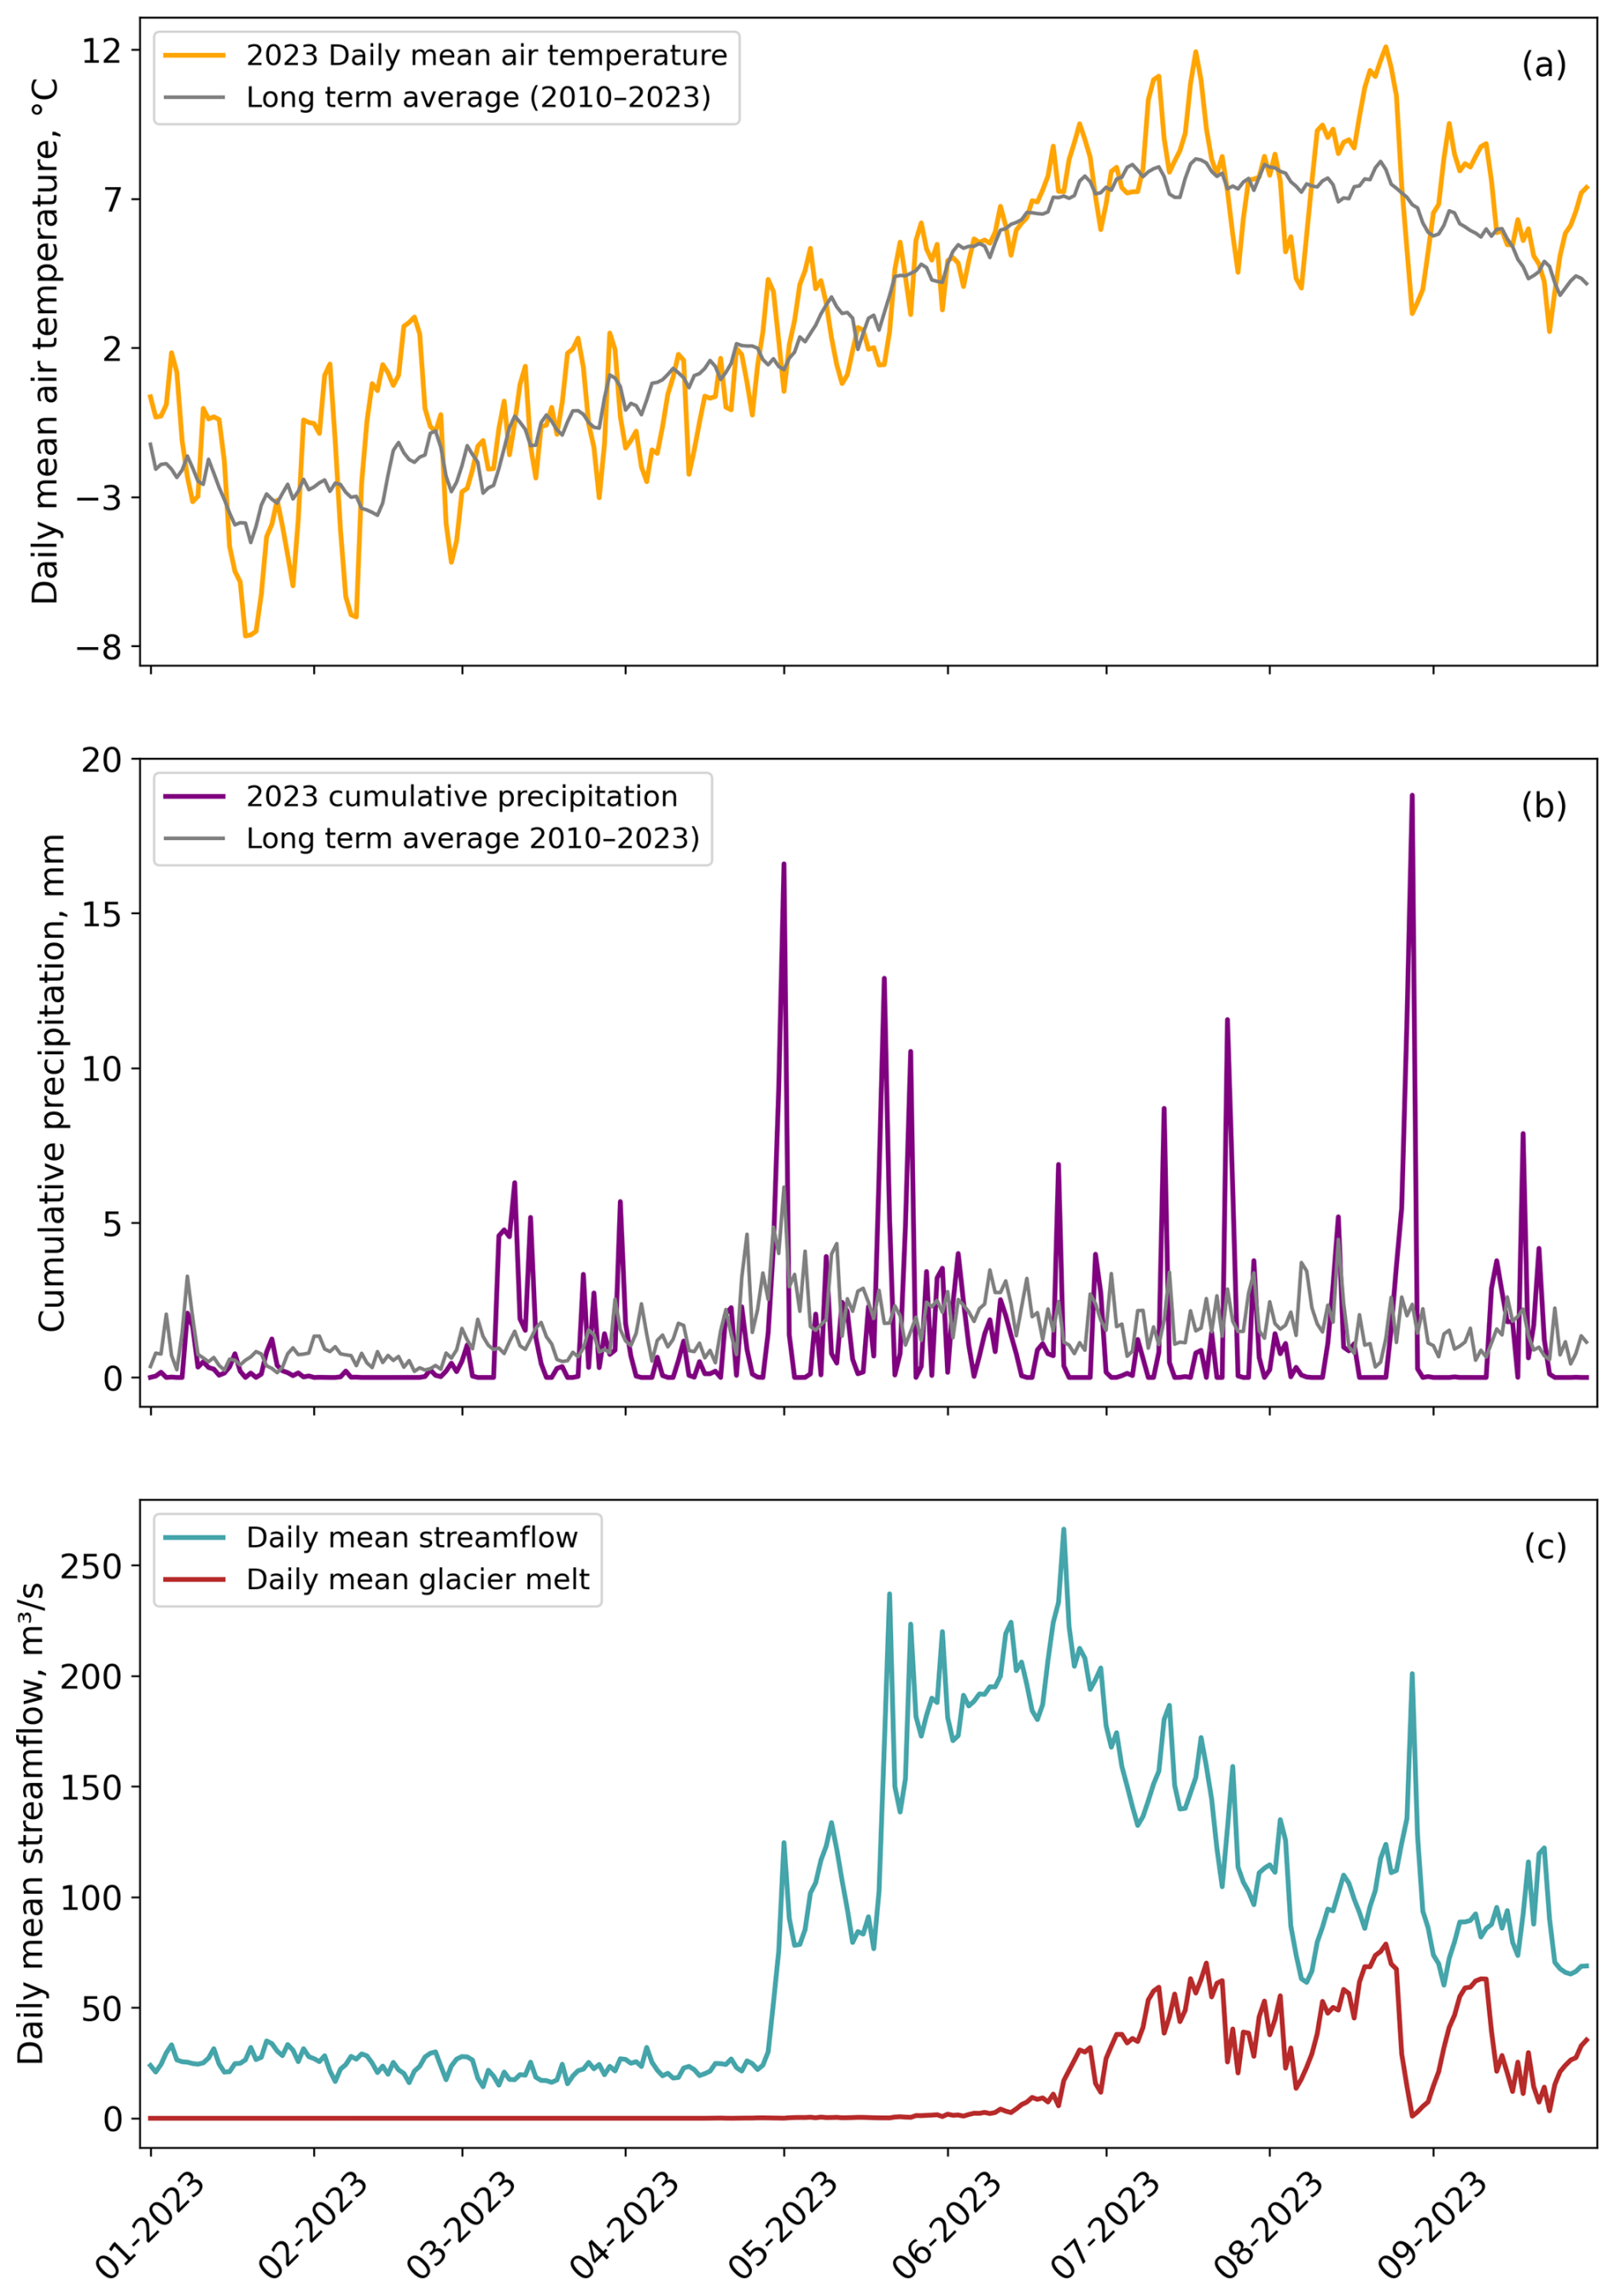
Figure 8Daily mean air temperature (a), cumulative precipitation (b) across Aosta Valley, and daily streamflow and glacier melt for water year 2023 in Tavagnasco (c).
Despite these four general mechanisms, glacier melt contribution to streamflow remained sensitive to short-term meteorological events, such as temperature drops and early or late snowfalls (Fig. 8). For instance, between April and May 2023, streamflow quickly increased in Aosta valley due to the seasonal freshet, which continued until June. Then, streamflow decreased slightly as seasonal snow waned. In June, glacier melt increased, quickly becoming a dominant contributor to streamflow. Glacier melt peaked in late August, coinciding with the peak of the glacier melt season. A sudden drop of temperatures between late August and early September, however, led to a quick and sudden glacier melt decrease, and to a pairwise decline in streamflow (Fig. 8a and b). In early September, finally, glacier melt rapidly rose as temperature increased again, growing to 63 m3 s−1 in Tavagnasco and 42.3 m3 s−1 in Fuentes.
This study highlights the particularly significant role of glacier melt during the extreme 2022–2023 snow drought events in the Italian Alps. While the individual mechanisms linking snow deficits to glacier melt have been described in previous studies, our results demonstrate the magnitude and persistence of glacier melt contribution during these recent drought conditions. In both catchments, glacier melt increased substantially compared to the historical period and remained elevated throughout the melt season, despite overall below-average discharge. We synthesize these findings through four signature mechanisms: (i) an earlier onset of the glacier melt season, (ii) an intensification of glacier melt contribution, (iii) an earlier seasonal peak in glacier melt contribution, and (iv) an extension of the glacier melt season. The links across these mechanisms and their relationship with snow-drought conditions are summarized in Fig. 9.
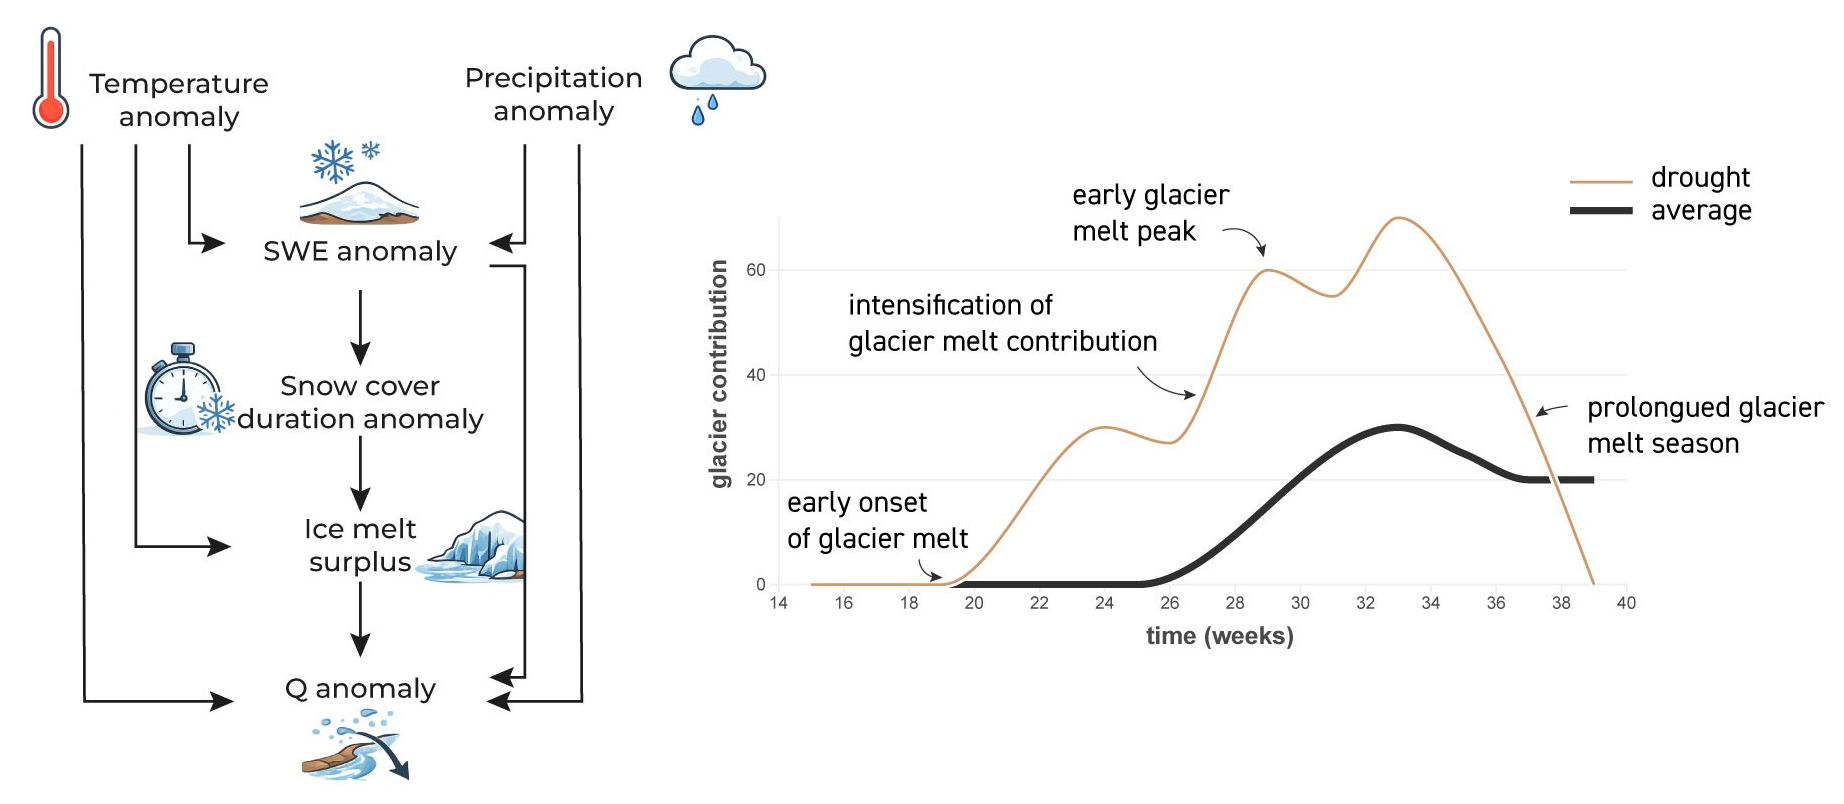
Figure 9Causal chain between snow droughts, temperature and precipitation anomalies, snow cover loss, glacier melt and streamflow.
Regarding the earlier-than-usual onset of the melt season (mechanism i), previous research by Thibert et al. (2018) has already established a long-term trend towards an earlier onset of the melt season, consistent with our findings. For example, Farinotti et al. (2012) found that future runoff in the Swiss Alps will be characterized by a significant shift towards earlier melt runoff, progressively advancing with each decade. Our study further substantiates this trend, showing how snow droughts are a pivotal driver in such long-term trends and a potential harbinger of conditions to come in a warmer and drier world. In such future conditions with less snow on the ground, glaciers will therefore be even more central in the mitigation of hydrologic droughts (Van Tiel et al., 2021).
The intensification in glacier melt contribution to streamflow (mechanism ii) also aligns with previous studies (Huss, 2011; Huss and Hock, 2018; Farinotti et al., 2012), which have shown that this intensification takes place particularly during droughts (Pellicciotti et al., 2010; van Tiel et al., 2026). In this context, van Tiel et al. (2026) showed that during the extreme 2022 drought in Switzerland, increased glacier melt partly compensated for precipitation and snowmelt deficit, buffering summer water deficit by up to 70 % in highly glacierized basins and maintaining relatively high glacier melt contributions to streamflow compared to previous extreme drought years.
Despite greater meteorological variability during summer 2023, glacier melt contribution remained elevated throughout this season as well. This second mechanism means that, in glacierized regions, glacier melt sustains streamflow throughout the season, rather than only during the peak-melt period, and that this holds particularly during snow droughts and periods of warm, dry weather (Cremona et al., 2023). This enhancement in glacier contribution to streamflow during droughts has also been reported in past and recent studies (van Tiel et al., 2026).
Regarding the potential shift in the seasonal peak-melt timing (mechanism iii), Farinotti et al. (2012) predicted a dramatic shift in runoff patterns in the Swiss Alps due to climate change, with both the onset and peak of the melt season occurring progressively earlier. Such a shift was clearly observed in our study region during 2022 in Tavagnasco, while results for 2023 and in general at Fuentes are less conclusive in this regard. We interpret this as follows: the winter snow drought in 2022 resulted in substantially reduced snow cover on glacier surfaces at the beginning of the melt season (Avanzi et al., 2024), to the extent that glacier melt was then strongly radiation-dominated, with an obvious peak in July. Under these conditions, earlier exposure of bare ice lowered surface albedo, increasing the absorption of shortwave radiation and enhancing radiation-driven melt (Malmros et al., 2018). This likely contributed to a more pronounced and earlier melt peak in July 2022. During 2023, several late-winter–spring snowfall events (particularly in March and April) temporarily restored a marginal snowpack over glaciers in the Italian Alps. These events were associated with positive snowfall anomalies relative to the 2011–2021 mean, and briefly increased surface albedo, thus hindering the shift in peak-melt timing. While this analysis would clearly benefit from more data, it nonetheless points to the often overlooked, but likely important role of marginal snowpack and out-of-season snowfalls on glacier preservation (Fyffe et al., 2021).
The fourth observed mechanism (iv) is a lengthening of the melt season. In 2023, glacier melt remained elevated into September and October at both Tavagnasco and Fuentes, highlighting the growing importance of late-season melt in compensating for reduced snow cover, low precipitation, and high temperatures (Cremona et al., 2023). We interpret this as due to the substantial downwasting of residual snow on glacier surfaces as a result of summer heatwaves, which left large portions of glaciers exposed well into autumn. Under such conditions, even brief periods of anomalously high air temperature in early autumn triggered enhanced melt due to lower surface albedo and high absorption of shortwave radiation. These events are a potential example of compound drought-heatwave conditions, where reduced snow accumulation (snow drought) coincides with warm atmospheric anomalies. Such compound events can generate cascading cryosphere-hydrological droughts, where reduced snow cover enhances glacier melt, which temporarily sustains discharge, but in the long run may accelerate ice mass loss and thus prolong future hydrological droughts downstream (Ultee et al., 2022).
This outcome further emphasizes the crucial role of late-season glacier melt in sustaining streamflow and the potential for snow droughts to disrupt typical glacier melt patterns.
5.1 Assumption and limitations
This study employed S3M Italy for glacier melt estimates.
In its current operational setting, this model does not account for glacier movement and debris cover on glaciers (Avanzi et al., 2022a). As already pointed out, glacier evolution over the relatively short 13-year study period is expected to influence melt outputs only modestly compared to the interannual variability driven by climatic conditions (Huss et al., 2010; Bongio et al., 2016). In this sense, coupling S3M with simplified glacier-evolution schemes (e.g., parameterized retreat models; Huss et al., 2010) or more advanced ice-flow modelling approaches and emulators (Jouvet and Cordonnier, 2023) would allow for a dynamic representation of glacier geometry and its feedback on melt and runoff.
On the other hand, thick debris typically acts as a protective layer for the underlying ice (Fyffe et al., 2019), which may have led to a local overestimation of glacier melt at very low elevations (note that these elevations are outside the validation range we considered in Fig. 2). To account for both aspects, future research with S3M should explore the inclusion of spatially distributed estimates of debris cover, such as that by Rounce et al. (2021). Another direction of future work is the adoption of enhanced melt models that are specifically designed for debris-covered glaciers (Carenzo et al., 2016).
S3M Italy also employs static glacier maps from the Randolph Glacier Inventory v 6.0 (Avanzi et al., 2023), which is a globally complete inventory intended to capture the world's glacier outlines near the beginning of the 21st century (RGI Consortium, 2017). Consequently, these static glacier outlines may overestimate current glacier extent, particularly during the drought years taken into consideration. To assess this discrepancy, we leveraged more recent glacier outlines provided by the Aosta Valley Autonomous Region (2019 data) and the Lombardy Glaciological Service (SGL) (2021 data) and compared them against the Randolph Glacier Inventory v 6.0 used by S3M Italy. Our analysis revealed a glacier area loss of 7 % in Aosta Valley between 2000 and 2019. Lombardy experienced a 18.7 % reduction in glacier coverage from 2000 to 2021. We then quantified the effect of these changes in glacier area by computing glacier melt contribution to streamflow using the updated regional glacier inventories. Compared with the RGI v6.0 glacier outlines, the updated inventories reduced the estimated mean annual glacier contribution from 10.5 % to 6.4 % during 2011–2021 and from 23.8 % to 19.1 % during 2022–2023 in Tavagnasco. In Fuentes, the corresponding values decreased from 4.9 % to 2.9 % and from 22.8 % to 11.1 %, respectively. While the reduction in glacier area caused an expected decrease in the absolute glacier contribution to streamflow, the amplification observed during 2022 and 2023 compared to historical patterns remains robust. In Tavagnasco, mean annual glacier contribution increased from 6.4 % (2011–2021) to 19.1 % (2022–2023), corresponding to nearly a threefold increase. In Fuentes, the increase was from 2.9 % to 11.1 %, equivalent to almost a fourfold amplification. In terms of peak weekly contributions, the median annual peak during 2011–2021 was 28.4 % in Tavagnasco, compared to 61.1 % in 2022 and 53 % in 2023. In Fuentes, the median baseline peak was 13 %, whereas peak values reached 47.5 % in 2022 and 35.2 % in 2023 (up to nearly fourfold amplification).
Our estimate of glacier contribution to discharge is based on the ratio between modelled glacier melt and observed streamflow. This simplified metric does not explicitly account for evapotranspiration losses or groundwater recharge. Because these processes remove water from the runoff signal, our approach likely leads to a modest overestimation of the absolute glacier contribution to discharge. However, because the investigated basins are largely energy limited, evapotranspiration is expected to remain small relative to other hydrologic fluxes (van Tiel et al., 2024). The values reported here should still be interpreted primarily as indicators of the relative importance and temporal variability of glacier melt as a driver of streamflow, rather than as a rigorous partitioning of runoff sources.
Both the Adda and Dora Baltea basins include artificial reservoirs, which may have impacted the natural timing of water transit and thus our quantification of glacier contributions to streamflow. While reservoir impacts depend on energy market fluctuations (Guo et al., 2021), we in general expect hydropower to shift runoff from early to late summer, as spring freshet is accumulated to meet later peaks in energy prices. With regard to our study region, a recent study by Amaranto et al. (2023) has reconstructed the naturalized streamflow of the Adda basin close to Fuentes, and demonstrated that the effect of high-elevation reservoirs is below 10 % when comparing naturalized and measured streamflow. As for Aosta Valley, another study performed in the context of the Regional Water Protection Plan (https://pta.regione.vda.it/, last access: 5 March 2026) confirmed the same order of magnitude between naturalized and measured streamflow. In both regions, the largest percentage discrepancies between naturalized and measured streamflow is expected during winter, when nonetheless streamflow is low and glaciers do not contribute to runoff. By July, these differences decrease markedly, tend to less than 10 %, and remain minimal throughout the remainder of summer and fall. The importance of glaciers in sustaining summer water supply during droughts regardless of reservoir operations is also clear if one looks at annual rather than weekly time scales. In fact, the mean annual glacier melt contribution in Aosta Valley more than doubled from 6 % (2011–2021) to 18 % (2022–2023). In Lombardy, the increase was even more pronounced, with glacier melt contribution nearly quadrupling from 4 % (2011–2021) to 15 % (2022–2023).
This study examined the 2022 and 2023 snow droughts in the Italian Alps and found that significantly increased glacier melt (up to +148 % compared to 2011–2021) and low streamflow led to glacier melt contribution to summer streamflow in the Aosta Valley and Lombardy regions reaching peak levels of 75 % and 83 % in 2022 and 65 % and 61 % in 2023, respectively, highlighting the crucial role of glacier melt in mitigating snow drought impacts. Four key mechanisms were identified: an earlier melt season onset (up to six weeks compared to the 2011–2021 median), intensified glacier melt contributions, a potential shift in peak melt timing, and a prolonged melt season into late autumn, all demonstrating the increased importance of glaciers in sustaining streamflow during severe droughts and emphasizing the vulnerability of alpine water resources.
Sources of data used in this paper are reported in Sect. 3 and are derived from the Aosta Valley Regional Authority (https://cf.regione.vda.it/it/, last access: 18 November 2024), the Aosta Valley Environmental Protection Agency (https://www.arpa.vda.it/, last access: 18 November 2024), the Lombardy Environmental Protection Agency (https://www.arpalombardia.it/, last access: 18 November 2024), and the Lombardy Glaciological Service (https://www.servizioglaciologicolombardo.it, last access: 21 July 2026). These data were made available by such third parties, which retain copyright. Outputs by S3M Italy are available at https://doi.org/10.5281/zenodo.6861722 (Avanzi et al., 2025).
M. L. designed the study, processed the data, performed the analyses, and wrote the manuscript. F. A. designed the study and contributed to the modeling strategy, data interpretation, and manuscript revision. U. M. D. C., E. C., M. I., and P. P. provided cryospheric data and regional expertise for Aosta Valley. R. S. and A. M. contributed with glacier data for Lombardy and regional expertise for Lombardy. L. F. and R. C. supervised the research and contributed to manuscript refinement. All authors reviewed and approved the final version of the manuscript.
The contact author has declared that none of the authors has any competing interests.
Publisher's note: Copernicus Publications remains neutral with regard to jurisdictional claims made in the text, published maps, institutional affiliations, or any other geographical representation in this paper. The authors bear the ultimate responsibility for providing appropriate place names. Views expressed in the text are those of the authors and do not necessarily reflect the views of the publisher.
This research has been supported by the European Commission, NextGenerationEU (grant no. PE0000000). This research was partially funded by the European Union – NextGenerationEU and by the Ministry of University and Research (MUR), National Recovery and Resilience Plan (NRRP), Mission 4, Component 2, Investment 1.3 “The creation of extended partnerships with universities, research centers, and companies for the funding of basic research projects” PE00000005 “Multi-Risk sciEnce for resilienT commUnities undeR a changiNg climate (RETURN)” CUP B57G22001180002.
This paper was edited by Jan Seibert and reviewed by two anonymous referees.
Amaranto, A., Bartesaghi, G., Castagna, A., Chiaradia, E., Giuliani, M., Micotti, M., Rienzner, M., Sangiorgio, M., Weber, E., Gandolfi, C., and Castelletti, A.: Rapporto finale del progetto ADDApt, Tech. rep., Regione Lombardia, Università degli Studi di Milano e Politecnico di Milano, https://www.ei.deib.polimi.it/research-projects/addapt/ (last access: 21 July 2026), 2023. a
Avanzi, F., Gabellani, S., Delogu, F., Silvestro, F., Cremonese, E., Morra di Cella, U., Ratto, S., and Stevenin, H.: Snow Multidata Mapping and Modeling (S3M) 5.1: a distributed cryospheric model with dry and wet snow, data assimilation, glacier mass balance, and debris-driven melt, Geosci. Model Dev., 15, 4853–4879, https://doi.org/10.5194/gmd-15-4853-2022, 2022a. a, b, c, d, e
Avanzi, F., Gabellani, S., Pulvirenti, L., Toniazzo, A., Mascitelli, A., Puca, S., and the H SAF team: Case study The 2021–2022 snow deficit in Italy and the H SAF TEAM 1, CIMA Research Foundation 2, Italian Civil Protection Department, Tech. rep., EUMETSAT H SAF, https://hsaf.meteoam.it/sites/default/files/case-studies/docs/Italy_snow_deficit.pdf (last access: 21 July 2026), 2022b. a
Avanzi, F., Gabellani, S., Delogu, F., Silvestro, F., Pignone, F., Bruno, G., Pulvirenti, L., Squicciarino, G., Fiori, E., Rossi, L., Puca, S., Toniazzo, A., Giordano, P., Falzacappa, M., Ratto, S., Stevenin, H., Cardillo, A., Fioletti, M., Cazzuli, O., Cremonese, E., Morra di Cella, U., and Ferraris, L.: IT-SNOW: a snow reanalysis for Italy blending modeling, in situ data, and satellite observations (2010–2021), Earth Syst. Sci. Data, 15, 639–660, https://doi.org/10.5194/essd-15-639-2023, 2023. a, b, c, d
Avanzi, F., Munerol, F., Milelli, M., Gabellani, S., Massari, C., Girotto, M., Cremonese, E., Galvagno, M., Bruno, G., Morra Di Cella, U., Rossi, L., Altamura, M., and Ferraris, L.: Winter snow deficit was a harbinger of summer 2022 socio-hydrologic drought in the Po Basin, Italy, Commun. Earth Environ., 5, https://doi.org/10.1038/s43247-024-01222-z, 2024. a, b, c
Avanzi, F., Gabellani, S., Delogu, F., Silvestro, F., Pignone, F., Bruno, G., Pulvirenti, L., Squicciarino, G., Fiori, E., Rossi, L., Puca, S., Toniazzo, A., Giordano, P., Falzacappa, M., Ratto, S., Stevenin, H., Cardillo, A. O., Fioletti, M., Cazzuli, O., Cremonese, E., Morra di Cella, U., and Ferraris, L.: IT-SNOW: a snow reanalysis for Italy blending modeling, in-situ data, and satellite observations, in: IT-SNOW: a snow reanalysis for Italy blending modeling, in situ data, and satellite observations (2010–2021) (Version v5, Vol. 15, pp. 639–660), Zenodo [data set], https://doi.org/10.5281/zenodo.17226478, 2025. a
Ayala, Á., Farías-Barahona, D., Huss, M., Pellicciotti, F., McPhee, J., and Farinotti, D.: Glacier runoff variations since 1955 in the Maipo River basin, in the semiarid Andes of central Chile, The Cryosphere, 14, 2005–2027, https://doi.org/10.5194/tc-14-2005-2020, 2020. a
Bales, R. C., Goulden, M. L., Hunsaker, C. T., Conklin, M. H., Hartsough, P. C., O'Geen, A. T., Hopmans, J. W., and Safeeq, M.: Mechanisms controlling the impact of multi-year drought on mountain hydrology, Sci. Rep., 8, https://doi.org/10.1038/s41598-017-19007-0, 2018. a
Barnett, T. P., Adam, J. C., and Lettenmaier, D. P.: Potential impacts of a warming climate on water availability in snow-dominated regions, Nature, 438, 303–309, https://doi.org/10.1038/nature04141, 2005. a
Barsugli, J. J., Ray, A. J., Livneh, B., Dewes, C. F., Heldmyer, A., Rangwala, I., Guinotte, J. M., and Torbit, S.: Projections of Mountain Snowpack Loss for Wolverine Denning Elevations in the Rocky Mountains, Earth's Future, 8, e2020EF001537, https://doi.org/10.1029/2020EF001537, 2020. a
Bednar-Friedl, B., Biesbroek, R., Schmidt, D., Alexander, P., Børsheim, K., Carnicer, J., Georgopoulou, E., Haasnoot, M., Le Cozannet, G., Lionello, P., Lipka, O., Möllmann, C., Muccione, V., Mustonen, T., Piepenburg, D., and Whitmarsh, L.: Europe, in: Climate Change 2022: Impacts, Adaptation and Vulnerability. Contribution of Working Group II to the Sixth Assessment Report of the Intergovernmental Panel on Climate Change, edited by Pörtner, H.-O., Roberts, D., Tignor, M., Poloczanska, E., Mintenbeck, K., Alegría, A., Craig, M., Langsdorf, S., Löschke, S., Möller, V., Okem, A., and Rama, B., pp. 1817–1927, Cambridge University Press, Cambridge, UK and New York, NY, USA, https://doi.org/10.1017/9781009325844.015, 2022. a
Beniston, M., Farinotti, D., Stoffel, M., Andreassen, L. M., Coppola, E., Eckert, N., Fantini, A., Giacona, F., Hauck, C., Huss, M., Huwald, H., Lehning, M., López-Moreno, J.-I., Magnusson, J., Marty, C., Morán-Tejéda, E., Morin, S., Naaim, M., Provenzale, A., Rabatel, A., Six, D., Stötter, J., Strasser, U., Terzago, S., and Vincent, C.: The European mountain cryosphere: a review of its current state, trends, and future challenges, The Cryosphere, 12, 759–794, https://doi.org/10.5194/tc-12-759-2018, 2018. a
Bonardi, L.: Il valore dei ghiacciai lombardi, in: I ghiacciai della Lombardia, pp. 3–9, Hoepli, ISBN 978-88-203-5165-6, 2012. a
Bongio, M., Avanzi, F., and De Michele, C.: Hydroelectric power generation in an Alpine basin: future water-energy scenarios in a run-of-the-river plant, Adv. Water. Resour., 94, 318–331, https://doi.org/10.1016/j.advwatres.2016.05.017, 2016. a
Bozzoli, M., Crespi, A., Matiu, M., Majone, B., Giovannini, L., Zardi, D., Brugnara, Y., Bozzo, A., Cat Berro, D., Mercalli, L., and Bertoldi, G.: Long-term snowfall trends and variability in the Alps, Int. J. Climatol., https://doi.org/10.1002/joc.8597, 2024. a
Carenzo, M., Pellicciotti, F., Mabillard, J., Reid, T., and Brock, B.: An enhanced temperature index model for debris-covered glaciers accounting for thickness effect, Adv. Water. Resour., 94, 457–469, https://doi.org/10.1016/j.advwatres.2016.05.001, 2016. a
Colombo, N., Valt, M., Romano, E., Salerno, F., Godone, D., Cianfarra, P., Freppaz, M., Maugeri, M., and Guyennon, N.: Long-term trend of snow water equivalent in the Italian Alps, J. Hydrol., 614, https://doi.org/10.1016/j.jhydrol.2022.128532, 2022. a
Colombo, N., Guyennon, N., Valt, M., Salerno, F., Godone, D., Cianfarra, P., Freppaz, M., Maugeri, M., Manara, V., Acquaotta, F., Petrangeli, A. B., and Romano, E.: Unprecedented snow-drought conditions in the Italian Alps during the early 2020s, Environ. Res. Lett., 18, https://doi.org/10.1088/1748-9326/acdb88, 2023. a, b
Copernicus Climate Change Service (C3S): European State of the Climate 2022, Full report, https://climate.copernicus.eu/ESOTC/2022 (last access: 21 July 2026), 2023. a
Copernicus Climate Change Service (C3S): European State of the Climate 2023, Full report, https://climate.copernicus.eu/ESOTC/2023 (last access: 21 July 2026), 2024. a, b
Cremona, A., Huss, M., Landmann, J. M., Borner, J., and Farinotti, D.: European heat waves 2022: contribution to extreme glacier melt in Switzerland inferred from automated ablation readings, The Cryosphere, 17, 1895–1912, https://doi.org/10.5194/tc-17-1895-2023, 2023. a, b, c, d
Cuffey, K. and Paterson, W.: The Physics of Glaciers, Elsevier, 4th edn., ISBN 9780123694614, 2006. a
Farinotti, D., Usselmann, S., Huss, M., Bauder, A., and Funk, M.: Runoff evolution in the Swiss Alps: Projections for selected high-alpine catchments based on ENSEMBLES scenarios, Hydrol. Proc., 26, 1909–1924, https://doi.org/10.1002/hyp.8276, 2012. a, b, c, d
Fondazione Montagna Sicura: sottoZero, https://www.sottozerovda.it/sezione-ghiacciai/ (last access: 9 February 2026), 2025. a
Fountain, A. and Vecchia, A.: How Many Stakes Are Required to Measure the Mass Balance of a Glacier?, Geogr. Ann. Ser. A., 81, 563–573, http://www.jstor.org/stable/521494 (last access: 21 July 2026), 1999. a
Froidurot, S., Zin, I., Hingray, B., and Gautheron, A.: Sensitivity of Precipitation Phase over the Swiss Alps to Different Meteorological Variables, J. Hydrometeorol., 15, 685–696, https://doi.org/10.1175/JHM-D-13-073.1, 2014. a
Fyffe, C., Brock, B., Kirkbride, M., Mair, D., Arnold, N., Smiraglia, C., Diolaiuti, G., and Diotri, F.: Do debris-covered glaciers demonstrate distinctive hydrological behaviour compared to clean glaciers?, J. Hydrol., 570, 584–597, https://doi.org/10.1016/j.jhydrol.2018.12.069, 2019. a
Fyffe, C. L., Potter, E., Fugger, S., Orr, A., Fatichi, S., Loarte, E., Medina, K., Hellström, R. Å., Bernat, M., Aubry-Wake, C., Gurgiser, W., Perry, L. B., Suarez, W., Quincey, D. J., and Pellicciotti, F.: The energy and mass balance of Peruvian glaciers, J. Geophys. Res.: Atmos., 126, e2021JD034911, https://doi.org/10.1029/2021JD034911, 2021. a
Gascoin, S.: A call for an accurate presentation of glaciers as water resources, Wiley Interdisciplinary Reviews: Water, 11, https://doi.org/10.1002/wat2.1705, 2024. a
Gobiet, A., Kotlarski, S., Beniston, M., Heinrich, G., Rajczak, J., and Stoffel, M.: 21st century climate change in the European Alps – A review, Sci. Tot. Environ., 493, 1138–1151, https://doi.org/10.1016/j.scitotenv.2013.07.050, 2014. a
Guo, H., Conklin, M., Maurer, T., Avanzi, F., Richards, K., and Bales, R.: Valuing Enhanced Hydrologic Data and Forecasting for Informing Hydropower Operations, Water, 13, https://doi.org/10.3390/w13162260, 2021. a
Hanus, S., Burek, P., Smilovic, M., Seibert, J., and Viviroli, D.: Seasonal variability in the global relevance of mountains to satisfy lowland water demand, Environ. Res. Lett., 19, https://doi.org/10.1088/1748-9326/ad8507, 2024. a
Harpold, A. A., Dettinger, M., and Rajagopal, S.: Defining snow drought and why it matters, EOS, https://doi.org/10.1029/2017eo068775, 2017. a, b
Hatchett, B., Rhoades, A., and McEvoy, D.: Monitoring the daily evolution and extent of snow drought, Nat. Hazards Earth Syst. Sci., 22, 869–890, https://doi.org/10.5194/nhess-22-869-2022, 2022. a
Hugonnet, R., McNabb, R., Berthier, E., Menounos, B., Nuth, C., Girod, L., Farinotti, D., Huss, M., Dussaillant, I., Brun, F., and Kääb, A.: Accelerated global glacier mass loss in the early twenty-first century, Nature, 592, 726–731, https://doi.org/10.1038/s41586-021-03436-z, 2021. a
Huning, L. S. and Aghakouchak, A.: Global snow drought hot spots and characteristics, Proc. Natl. Aca. Sci. USA, 117, 19753–19759, https://doi.org/10.6084/m9.figshare.c.5055179, 2020. a
Huss, M.: Present and future contribution of glacier storage change to runoff from macroscale drainage basins in Europe, Water Resour. Res., 47, https://doi.org/10.1029/2010WR010299, 2011. a, b
Huss, M. and Hock, R.: Global-scale hydrological response to future glacier mass loss, Nat. Clim. Change, 8, 135–140, https://doi.org/10.1038/s41558-017-0049-x, 2018. a
Huss, M., Jouvet, G., Farinotti, D., and Bauder, A.: Future high-mountain hydrology: a new parameterization of glacier retreat, Hydrol. Earth Syst. Sci., 14, 815–829, https://doi.org/10.5194/hess-14-815-2010, 2010. a, b
Huss, M., Bookhagen, B., Huggel, C., Jacobsen, D., Bradley, R., Clague, J., Vuille, M., Buytaert, W., Cayan, D., Greenwood, G., Mark, B., Milner, A., Weingartner, R., and Winder, M.: Toward mountains without permanent snow and ice, Earth's Future, 5, 418–435, https://doi.org/10.1002/2016EF000514, 2017. a
Immerzeel, W. W., Van Beek, L. P. H., and Bierkens, M. F. P.: Climate change will affect the Asian water towers, Science, 328, 1382–1385, https://doi.org/10.1126/science.1183188, 2010. a, b
Jouvet, G. and Cordonnier, G.: Ice-flow model emulator based on physics-informed deep learning, J. Glaciol., pp. 1–15, https://doi.org/10.1017/jog.2023.73, 2023. a
Kling, H., Fuchs, M., and Paulin, M.: Runoff conditions in the upper Danube basin under an ensemble of climate change scenarios, J. Hydrol., 424–425, 264–277, https://doi.org/10.1016/j.jhydrol.2012.01.011, 2012. a
Koehler, J., Dietz, A. J., Zellner, P., Baumhoer, C. A., Dirscherl, M., Cattani, L., Vlahovć, Å., Alasawedah, M. H., Mayer, K., Haslinger, K., Bertoldi, G., Jacob, A., and Kuenzer, C.: Drought in Northern Italy: Long Earth Observation Time Series Reveal Snow Line Elevation to Be Several Hundred Meters Above Long-Term Average in 2022, Remote Sens., 14, https://doi.org/10.3390/rs14236091, 2022. a
Malmros, J., Mernild, S., Wilson, R., Tagesson, T., and Fensholt, R.: Snow cover and snow albedo changes in the central Andes of Chile and Argentina from daily MODIS observations (2000–2016), Remote Sens. Environ., 209, 240–252, https://doi.org/10.1016/j.rse.2018.02.072, 2018. a
Marty, C., Tilg, A., and Jonas, T.: Recent Evidence of Large-Scale Receding Snow Water Equivalents in the European Alps, J. Hydrometeorol., 18, 1021–1031, https://doi.org/10.1175/JHM-D-16-0188.1, 2017. a
Montanari, A., Nguyen, H., Rubinetti, S., Ceola, S., Galelli, S., Rubino, A., and Zanchettin, D.: Why the 2022 Po River drought is the worst in the past two centuries, Sci. Adv., 9, eadg8304, https://doi.org/10.1126/sciadv.adg8304, 2023. a
Mote, P., Li, S., Lettenmaier, D., Xiao, M., and Engel, R.: Dramatic declines in snowpack in the western US, NPJ Clim. Atmos. Sci., https://doi.org/10.1038/s41612-018-0012-1, 2018. a
Ngoma, H., Wen, W., Ayugi, B., Babaousmail, H., Karim, R., and Ongoma, V.: Evaluation of precipitation simulations in CMIP6 models over Uganda, Int. J. Climatol., 41, 4743–4768, https://doi.org/10.1002/joc.7098, 2021. a
Pellicciotti, F., Bauder, A., and Parola, M.: Effect of glaciers on streamflow trends in the Swiss Alps, Water Resour. Res., 46, https://doi.org/10.1029/2009WR009039, 2010. a
Regione Autonoma Valle d'Aosta: Catasto Ghiacciai, Geoportale della Regione Autonoma Valle d'Aosta, http://catastoghiacciai.partout.it/ghiacciai (last access: 21 July 2026), 2019. a
RGI Consortium: Randolph Glacier Inventory (RGI) – A Dataset of Global Glacier Outlines: Version 6.0, Tech. rep., Global Land Ice Measurements from Space, Boulder, Colorado, USA, https://doi.org/10.7265/N5-RGI-60, 2017. a
Rounce, D. R., Hock, R., McNabb, R. W., Millan, R., Sommer, C., Braun, M. H., Malz, P., Maussion, F., Mouginot, J., Seehaus, T. C., and Shean, D. E.: Distributed Global Debris Thickness Estimates Reveal Debris Significantly Impacts Glacier Mass Balance, Geophys. Res. Lett., 48, e2020GL091311, https://doi.org/10.1029/2020GL091311, 2021. a
Servizio Glaciologico Lombardo: Catasto Ghiacciai, 2021. a
Smiraglia, G., Diolaiuti, G., and Azzoni, R.: The Glaciers of Aosta Valley, Tech. rep., Gruppo di Ricerca Glaciologica, Università degli Studi di Milano (UNIMI), Dipartimento di Scienze della Terra, http://sites.unimi.it/glaciol/wp-content/uploads/2019/02/4-valle-daosta.pdf (last access: 21 July 2026), 2015. a
Sommer, C., Malz, P., Seehaus, T. C., Lippl, S., Zemp, M., and Braun, M. H.: Rapid glacier retreat and downwasting throughout the European Alps in the early 21st century, Nat. Commun., 11, https://doi.org/10.1038/s41467-020-16818-0, 2020. a
Soruco, A., Vincent, C., Rabatel, A., Francou, B., Thibert, E., Sicart, J. E., and Condom, T.: Contribution of glacier runoff to water resources of La Paz city, Bolivia (16° S), Ann. Glaciol., 56, 147–154, https://doi.org/10.3189/2015AoG70A001, 2015. a
Stahl, K., Weiler, M., van Tiel, M., Kohn, I., Hänsler, A., Freudiger, D., Seibert, J., Gerlinger, K., and Moretti, G.: Impact of climate change on the rain, snow and glacier melt components of streamflow of the river Rhine and its tributaries. CHR report no. I 28. International Commission for the Hydrology of the Rhine basin (CHR), Lelystad, 12–13, ISBN 978-90-70980-44-3, 2022. a
Thibert, E., Dkengne Sielenou, P., Vionnet, V., Eckert, N., and Vincent, C.: Causes of Glacier Melt Extremes in the Alps Since 1949, Geophys. Res. Lett., 45, 817–825, https://doi.org/10.1002/2017GL076333, 2018. a
Tripathy, K. and Mishra, A.: How Unusual Is the 2022 European Compound Drought and Heatwave Event?, Geophys. Res. Lett., 50, https://doi.org/10.1029/2023GL105453, 2023. a
Ultee, L., Coats, S., and Mackay, J.: Glacial runoff buffers droughts through the 21st century, Earth Syst. Dynam., 13, 935–959, https://doi.org/10.5194/esd-13-935-2022, 2022. a
van der Wiel, K., Lenderink, G., and de Vries, H.: Physical storylines of future European drought events like 2018 based on ensemble climate modelling, Weather Clim. Extrem., 33, 100350, https://doi.org/10.1016/j.wace.2021.100350, 2021. a
Van Tiel, M., Van Loon, A. F., Seibert, J., and Stahl, K.: Hydrological response to warm and dry weather: do glaciers compensate?, Hydrol. Earth Syst. Sci., 25, 3245–3265, https://doi.org/10.5194/hess-25-3245-2021, 2021. a, b, c, d
Van Tiel, M., Weiler, M., Freudiger, D., Moretti, G., Kohn, I., Gerlinger, K., and Stahl, K.: Melting Alpine Water Towers Aggravate Downstream Low Flows: A Stress-Test Storyline Approach, Earth's Future, 11, https://doi.org/10.1029/2022EF003408, 2023. a
van Tiel, M., Aubry-Wake, C., Somers, L., Andermann, C., Avanzi, F., Baraer, M., Chiogna, G., Daigre, C., Das, S., Drenkhan, F., Farinotti, D., Fyffe, C. L., de Graaf, I., Hanus, S., Immerzeel, W., Koch, F., McKenzie, J. M., Müller, T., Popp, A. L., Saidaliyeva, Z., Schaefli, B., Schilling, O. S., Teagai, K., Thornton, J. M., and Yapiyev, V.: Cryosphere–groundwater connectivity is a missing link in the mountain water cycle, Nat. Water, 2, 624–637, https://doi.org/10.1038/s44221-024-00277-8, 2024. a
van Tiel, M., Huss, M., Zappa, M., Jonas, T., and Farinotti, D.: Swiss glacier mass loss during the 2022 drought: persistent streamflow contributions amid declining melt water volumes, Hydrol. Earth Syst. Sci., 30, 23–43, https://doi.org/10.5194/hess-30-23-2026, 2026. a, b, c
Vargo, L., Anderson, B., Dadic, R., Horgan, H., Mackintosh, A., King, A., and Lorrey, A.: Anthropogenic warming forces extreme annual glacier mass loss, Nat. Clim. Change, 10, https://doi.org/10.1038/s41558-020-0849-2, 2020. a
Viviroli, D., Dürr, H. H., Messerli, B., Meybeck, M., and Weingartner, R.: Mountains of the world, water towers for humanity: Typology, mapping, and global significance, Water Resour. Res., 43, https://doi.org/10.1029/2006WR005653, 2007. a
Viviroli, D., Kummu, M., Meybeck, M., Kallio, M., and Wada, Y.: Increasing dependence of lowland populations on mountain water resources, Nat. Sustain., 3, 917–928, https://doi.org/10.1038/s41893-020-0559-9, 2020. a, b
Voordendag, A., Prinz, R., Schuster, L., and Kaser, G.: Brief communication: The Glacier Loss Day as an indicator of a record-breaking negative glacier mass balance in 2022, The Cryosphere, 17, 3661–3665, https://doi.org/10.5194/tc-17-3661-2023, 2023. a
World Meteorological Organization: State of the Global Climate 2022, ISBN 978-92-63-11316-0, 2023. a
World Meteorological Organization: State of the Global Climate 2023, ISBN 978-92-63-11347-4, 2024. a
Zekollari, H., Huss, M., and Farinotti, D.: Modelling the future evolution of glaciers in the European Alps under the EURO-CORDEX RCM ensemble, The Cryosphere, 13, 1125–1146, https://doi.org/10.5194/tc-13-1125-2019, 2019. a, b
Zemp, M., Frey, H., Gärtner-Roer, I., Nussbaumer, S. U., Hoelzle, M., Paul, F., Haeberli, W., Denzinger, F., Ahlstrøm, A. P., Anderson, B., Bajracharya, S., Baroni, C., Braun, L. N., Càceres, B. E., Casassa, G., Cobos, G., Dàvila, L. R., Delgado Granados, H., Demuth, M. N., Espizua, L., Fischer, A., Fujita, K., Gadek, B., Ghazanfar, A., Hagen, J. O., Holmlund, P., Karimi, N., Li, Z., Pelto, M., Pitte, P., Popovnin, V. V., Portocarrero, C. A., Prinz, R., Sangewar, C. V., Severskiy, I., Sigurdsson, O., Soruco, A., Usubaliev, R., and Vincent, C.: Historically unprecedented global glacier decline in the early 21st century, J. Glaciol., 61, 745–762, https://doi.org/10.3189/2015JoG15J017, 2015. a
Zemp, M., Gärtner-Roer, I., Nussbaumer, S. U., Welty, E. Z., Dussaillant, I., and Bannwart, J.: A contribution to the Global Terrestrial Network for Glaciers (GTN-G) as part of the Global Climate Observing System (GCOS) and its Terrestrial Observation Panel for Climate, Global Glacier Change Bulletin No. 5, https://doi.org/10.5904/wgms-fog-2023-09, 2023. a
Zhang, Z., Glaser, S., Bales, R., Conklin, M., Rice, R., and Marks, D.: Insights into mountain precipitation and snowpack from a basin-scale wireless-sensor network, Water Resour. Res., 53, 6626–6641, https://doi.org/10.1002/2016WR018825, 2017. a