
the Creative Commons Attribution 4.0 License.
the Creative Commons Attribution 4.0 License.
 | 21 Jul 2026
Proposing sources for discrete groundwater discharges to patterned pools in three regional raised northern peat bogs
Henry E. Moore
Xavier Comas
Martin A. Briggs
Andrew S. Reeve
Khondaker Md. Nur Alam
Lee Slater
Raised northern peat bogs are generally assumed to be entirely precipitation-fed (ombrogenous), suggesting they are void of groundwater (minerogenous) inflow from underlying sediments. Patterned pools in raised bogs have often been attributed to surficial flow filling depressions along the peat surface that produces subtle differences in peat pore-water chemistry. However, we present evidence that certain patterned pools may be partially fed by localized upwelling of minerogenous groundwater from underlying glacial sediments in three northern peat bogs of Maine, USA. Underlying permeable glacial deposits, embedded in hydraulically confining glacio-marine clay deposits, were delineated using ground-penetrating radar and transient electromagnetic surveys. Paired point measurements of temperature and specific conductance (SpC) were surveyed around pools, and statistical relationships indicative of groundwater upwelling were established. Uncrewed aerial systems (UAS) thermal infrared (TIR) mapping was conducted, augmented by handheld TIR imaging, to examine characteristic groundwater temperatures in cold and warm seasons across pool surfaces. Surface water samples were acquired to assess the relationship between SpC temperature signals and elevated iron and manganese concentrations that could be indicative of glacial aquifer sources. The combined datasets present evidence for localized upwelling in pools underlain by glacial structures, and the possibility of minerogenous groundwater contributions. Upwelling through the peat matrix is possibly partially facilitated by macropore, “peat pipe” features that serve as preferential flowpaths of varying lengths to the surface. Such upwelling could drive a positive feedback loop where elevated concentrations of ionic constituents repeatedly dilate the peat matrix and/or terminal electron acceptors enhance anaerobic respiration and microbial activity, accelerating the humification of peat around patterned pools and potentially magnifying carbon loss.
- Article
(16541 KB) - Full-text XML
-
Supplement
(13038 KB) - BibTeX
- EndNote


1.1 Background
Raised northern peat bogs are generally regarded as precipitation-fed (ombrogenous) systems isolated from minerogenous groundwater inflows (Gorham, 1957), due in part to low relief topography and the prevalence of underlying low permeability clays. Near-complete saturation of raised northern peat bogs is commonly assumed, with water level fluctuations attributed to seasonal variations in ombrogenous water inputs and evapotranspiration (Ingram, 1982; Siegel, 1983; Siegel and Glaser, 1987). Changes in the bog hydrology over time (Foster et al., 1988) and changes in the underlying mineral sediment slope from which peat development initiates (Boatman et al., 1981; Belyea and Lancaster, 2002) result in a characteristic alternating hummock-hollow morphology. Hydrologic changes lead to variable rates of peat accumulation, peat degradation, and the preferential clustering of vegetative cover (Foster, 1988). In response to water level changes from direct precipitation to the peatland, water fills shallow hollows and coalesces along the topographic gradient, leading to the unique patterned geometry of alternating pools and hummocks across many raised bogs (Moore, 1977; Smart, 1982; Foster and Glaser, 1986; Foster and Fritz, 1987; Foster and Wright, 1990). Ombrogenous inflows are thought to help form and maintain pools by providing oxygenated waters to the hollows (Boatman et al., 1981; Moore, 1982; Foster et al., 1983, 1988). Once formed, pools range in depths from 0.1 to upwards of 4 m (Belyea and Lancaster, 2002; Comas et al., 2011; Turner et al., 2016).
Hydrological modeling of patterned pool development suggests that lateral spreading exerts a dominant control on development, whereby hollows are inundated with ombrogenous inflows along the topographic gradient of peat bogs (Belyea and Lancaster, 2002). Climate wetness index and surficial microtopography are key variables that are argued to define rates of lateral spreading of patterned pools (Belyea, 2007). Previous work describes inflows using a “fill and spill” model in which pools along the surface exceed the storage capacity and resulting in flow across the surface or through the acrotelm to topographically lower pools or depressions (Quinton and Roulet, 1998; Spence and Woo, 2003; McCarter and Price, 2017). Hydraulic connectivity between the pools at the surface via the fill and spill model is seasonal with dependance on local climate driving runoff dynamics and highlighting the importance of spatiotemporal dynamics (McCarter and Price, 2017; Balliston and Price, 2022). However, basin scale hydrologic models are limited by coarse spatiotemporal sampling of hydrologic state variables, leading to a lack of specificity in describing the hydraulic connections between patterned pools (Belyea and Lancaster, 2002). Additionally, localized hydraulic connectivity between patterned pools has been argued to occur through a network of near-surface, horizontal peat pipes serving as conduits between the pools (Belyea and Baird, 2006). Pipe networks may enhance the lateral expansion of pools as they coalesce during flooding, further leading to the observed clustering patterns (Belyea and Lancaster, 2002; Belyea and Baird, 2006). Although evidence for pipe networks has been observed in the field (Belyea and Baird, 2006), the formation of these preferential conduits and their distribution throughout the peat matrix is poorly understood. Individual pipes have been instrumented and shown to impact flow in blanket peat bogs (Holden et al., 2001; Holden and Burt, 2002), emphasizing their important hydraulic function for infiltration and drainage.
Although patterned pool development in bogs is described from the perspective of an ombrogenous system (Belyea and Lancaster, 2002; Belyea, 2007), some hydrological models indicate that permeable mineral sediments at the base of a raised bog can significantly alter bog hydrology (Siegel and Glaser, 1987; Glaser et al., 1997; Reeve et al., 2009; Lowry et al., 2009; Bourgault et al., 2019; Lambert et al., 2022). Much of this work has focused on investigations of the raised bogs of northern Minnesota. Siegel (1981) reports hydrogeological evidence of recharge from groundwater mounds occurring underneath these bogs with the presence of relatively permeable mineral sediment lenses embedded within till and lake sediments inferred from seismic profiles (Miller et al., 1992). Precipitation patterns changed the direction of groundwater flow in these bogs, with wet climates decreasing minerogenous inputs and dry climates increasing minerogenous inputs via “flushing” effects in the peat matrix (Siegel et al., 1995). However, near surface peat remains ombrogenous, with any groundwater inputs directed to the edges of the raised bogs under all conditions (Siegel and Glaser, 1987).
Since these studies, variations in the geologic materials beneath raised bogs have been imaged using electrical geophysical methods, showing that coarser-grained deposits can, in places, be in direct contact with the base of a raised bog (Comas et al., 2005, 2011; Chen et al., 2020; Moore et al., 2024). Glaciofluvial esker structures have been modeled to exert changes in the vertical movement of peat pore water, attributed to changes in the topography of the mineral sediment along the base of a bog and the hydraulic conductivity (K) contrasts between eskers and lower K peat (Reeve et al., 2000, 2009). Comas et al. (2011) argued that permeable eskers influence raised bog hydrology and are associated with patterned pool formation and development. They hypothesized that peat formation is locally reduced where eskers are in contact with peat due to inputs of terminal electron acceptors (TEAs) from upwelling minerogenous groundwater, contributing to the formation of depressions in the peat surface (Comas et al., 2011). Moore et al. (2024) recently reported a strong spatial correspondence between underlying glaciofluvial esker structures and hydrological upwelling signatures around several isolated pools in a northern raised bog of Maine, USA. Peat matrix upwelling was documented around some pools, but other pools showed evidence of surficial peat pipe terminations that appeared to control flow to the pools. Further, vertical peat pipe flow to the pools was interpreted to be activated following strong precipitation events.
In this study, we address the question, “Where is upwelling water supplying patterned pools sourced; and, what implications does this have for patterned pool formation and development?” Our study defines groundwater as all water sourced from depth, minerogenous groundwater as water sourced from underlying glacial aquifers beyond the peat-mineral sediment interface, and ombrogenous peat pore water as precipitation-derived pore water saturating the peat matrix from the surface of the peat down to the mineral sediment interface. We report on a hydrogeophysical investigation of three raised northern peat bogs in Maine, USA, containing patterned pools. Utilizing contrasts in temperature and specific conductance between groundwater and surface pool water, supplemented with geophysical imaging, we find evidence of upwelling that is associated with geologic variations in the mineral sediments and deeper lithology beneath the raised bogs. Challenging previous notions, data indicates that groundwater reaches the surface of the raised bogs via discrete inputs to pools following major precipitation events. Results imply the potential for vertical groundwater discharge to pools underlain by high K geologic units via either ombrogenous or minerogenous flowpaths through the peat matrix.
1.2 Hydrogeologic Setting
Three raised northern peat bogs in Maine were selected for this study based on similarities in local geological setting, including proximity to mapped esker deposits, and pool patterning along the surface. The locations of the three raised bogs used for this study, Caribou Bog (central unit), Thousand Acre (Crystal) Bog, and Meddybemps Heath (southern unit), are shown in Fig. 1.
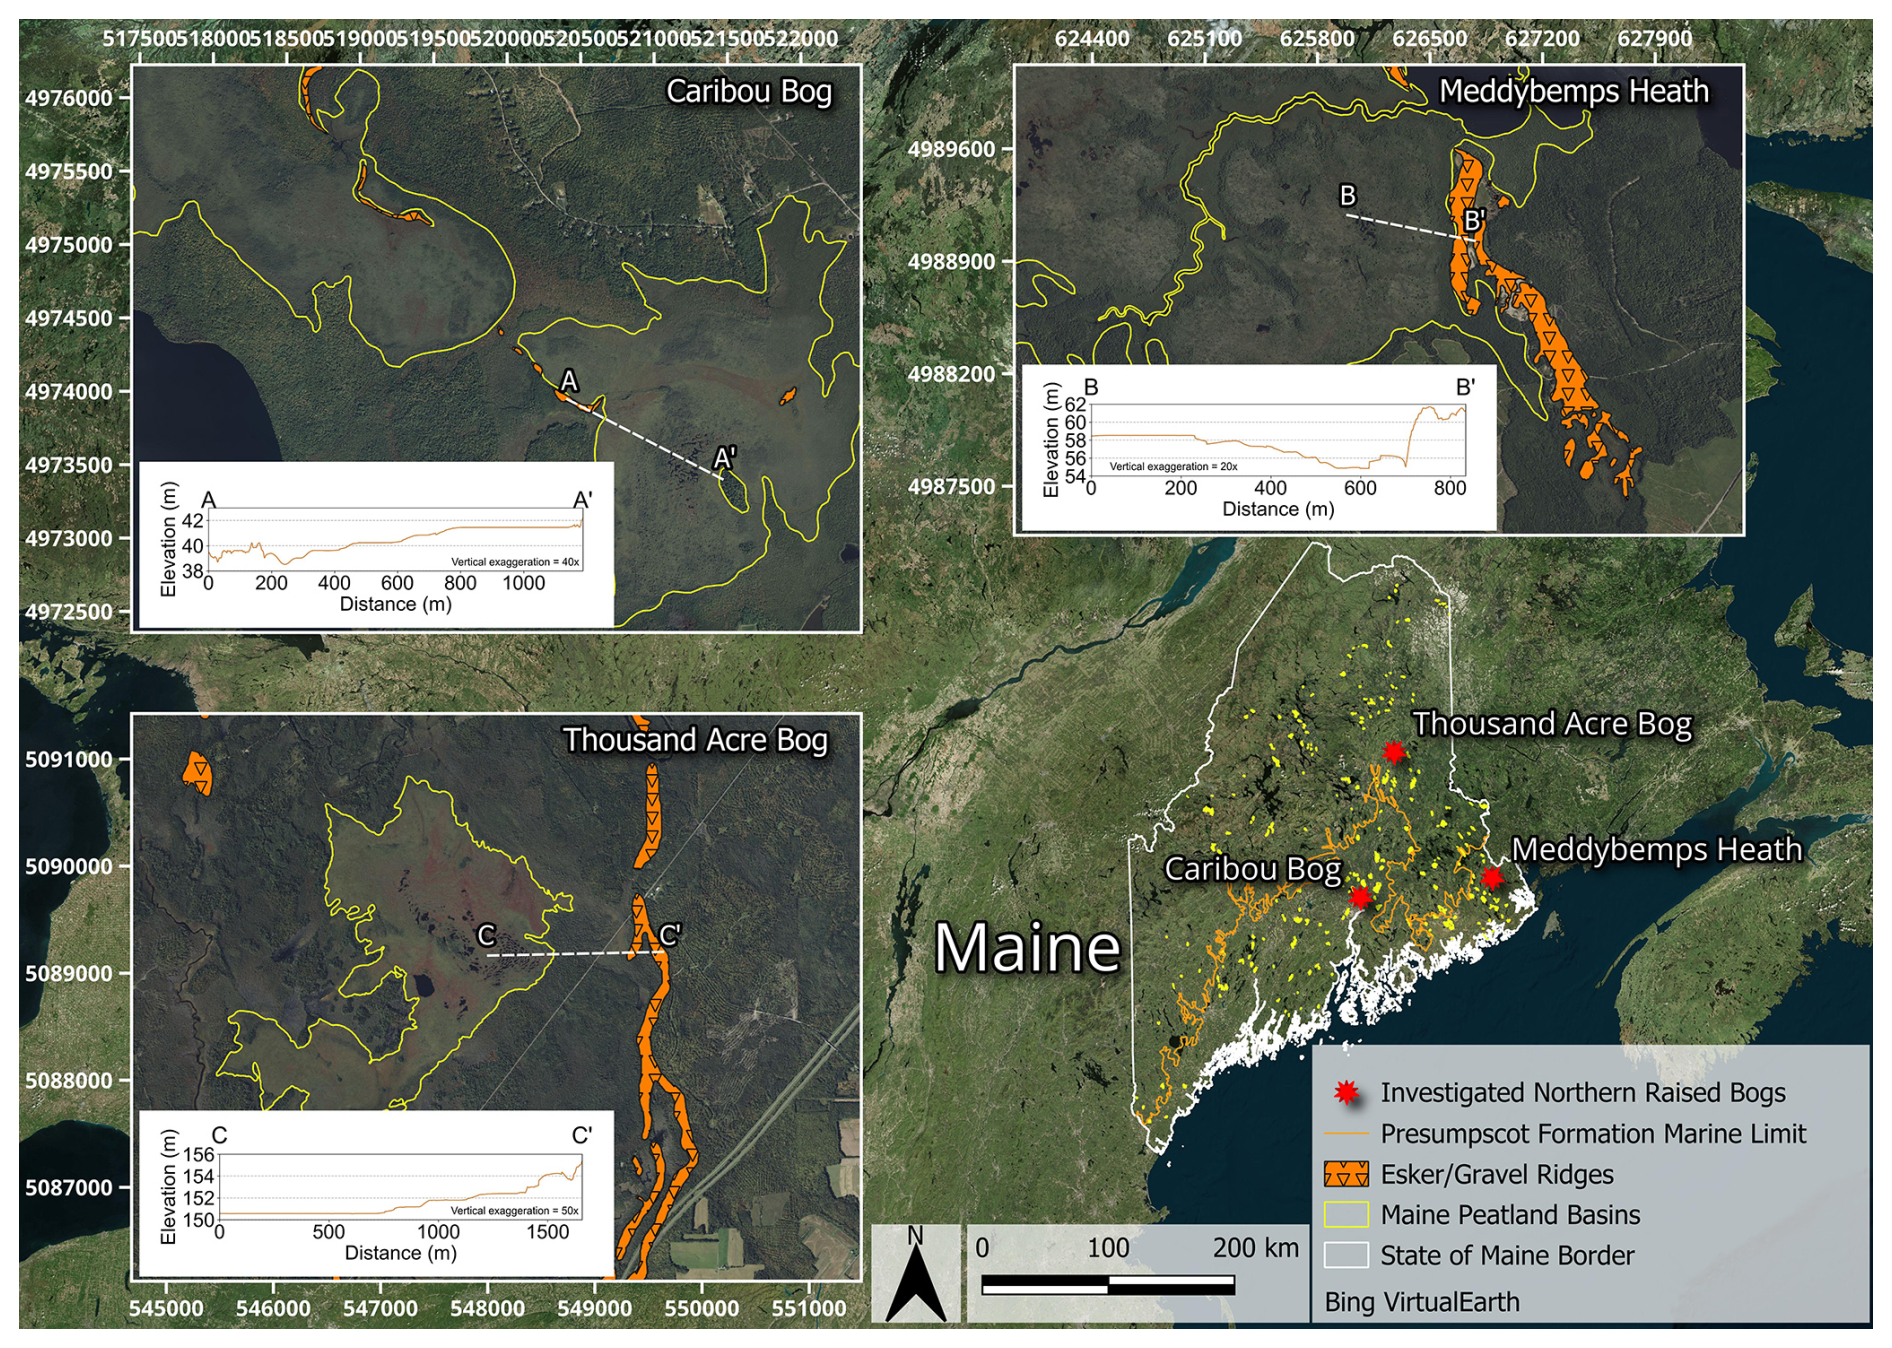
Figure 1Images (© Microsoft) of Caribou Bog (central unit), Thousand Acre (Crystal) Bog, and Meddybemps Heath (southern unit) in Maine (USA) with nearby mapped glaciofluvial eskers/gravel deposits (Newman, 1980; Cameron et al., 1984; Shreve, 1985; Thompson and Borns, 1985). Elevation profiles (white) from the State of Maine (2020) between the patterned pools investigated and the nearest esker/gravel deposits are presented for the three peat bogs. All images are displayed using the WGS 84 / UTM Zone 19 N (EPSG 32619) coordinate reference system, and tick marks are distances in meters.
Extensive hydrogeophysical studies have been conducted in the central unit of Caribou Bog (Fig. 1), hereafter referred to as Caribou Bog, located northwest of the town of Orono, Maine, USA (Slater and Reeve, 2002; Reeve et al., 2009; Comas et al., 2011). Caribou Bog is underlain by a metasedimentary bedrock deposited between the middle Ordovician and middle Devonian periods (Thompson and Borns, 1985). Regional till deposits, with variable thicknesses and grain sizes, overlie the bedrock (Slater and Reeve, 2002). As the glaciers retreated during the last ice age, eskers were deposited overlying the till deposits (Shreve, 1985; Thompson and Borns, 1985). Caribou Bog falls within the marine transgressional limit of the Presumpscot Formation, a glacio-marine clay deposited over low-topography regional glacial deposits during the late Pleistocene epoch (Thompson and Borns, 1985; Lyford et al., 1998). Ground-penetrating radar (GPR), paired with coring efforts, imaged and corroborated peat depths and the slope along the mineral sediment interface underlying the peat. Comas et al. (2004, 2005) reported a spatial correspondence between underlying esker deposits in direct contact with peat, overlying patterned pools, and vegetation patterns in the raised bog. A beaded esker system, in places in contact with the peat matrix, was traced along the arc of a system of patterned pools where it was in direct contact with the peat (Comas et al., 2011). The patterned pools of Caribou Bog consist of approximately 18 distinct pools, eccentrically patterned (Davis and Anderson, 1991) westwards over 0.091 km2.
Thousand Acre (Crystal) Bog (Fig. 1), referred to hereafter as Thousand Acre Bog, is located over slate-dominated bedrock, consisting of poorly metamorphosed siltstone and sandstone lenses, found between the towns of Island Falls and Sherman, Maine, USA (Roy, 1981; Roy et al., 1983). Extensive coring completed by Cameron (1975) revealed glacial deposits overlying the bedrock. Sand and gravel lenses embedded in clay exist at the base of the raised bog (Cameron, 1975) and are consistent with surrounding glacial stream and esker deposits (Newman, 1980; Shreve, 1985; Thompson and Borns, 1985). Sediment cores contain sand and gravel lenses embedded within and beneath a hydraulically confining clay layer (Cameron, 1975; Newman, 1980). This raised bog is located 16 km north of the boundaries of the glacio-marine Presumpscot Formation, and therefore underlying clays likely originate from paleo-lacustrine environments, formed after land emerged from the sea following deglaciation and isostatic rebound (Borns, 1963; Cameron, 1975; Thompson and Borns, 1985). In Thousand Acre Bog, the patterned pools consist of approximately 54 distinct pools, concentrically patterned eastwards over 0.24 km2.
Meddybemps Heath (Fig. 1) is located along the southwest shoreline of Meddybemps Lake and comprises three raised bog units separated by two streams. For this study, work was conducted in the southern-most raised bog unit. This bog is underlain by two intrusive geologic bodies of the Meddybemps Granite and a gabbro deposited during the Devonian Period (Osberg et al., 1985; Lyford et al., 1998). Surficial esker deposits that correspond with the regional late Pleistocene deglaciation are readily observed along the eastern and western boundaries of the bog (Cameron et al., 1984; Thompson and Borns, 1985). Previous coring revealed the thickest peat deposit (just over 7 m) encountered within the bogs of this study area and a clay deposit in contact with the peat matrix at many locations (Cameron et al., 1984). Based on the location of the transgressional boundary and nearby local surficial deposits, the clay deposit is likely to be the Presumpscot Formation. The patterned pools of Meddybemps Heath consist of approximately 15 distinct pools, patterned eastwards over 0.034 km2.
All hydrogeophysical methods implemented across the three bogs containing patterned pools for this study are summarized in Table S1 in the Supplement provided for this study.
2.1 Resolving Mineral Sediment Stratigraphy Using Ground-Penetrating Radar
Ground-penetrating radar (GPR) is sensitive to the relative dielectric permittivity (εr), which determines the velocity of an electromagnetic (EM) wave as it travels within the subsurface. Dielectric permittivity is primarily controlled by water content and, under saturated conditions, contrasts in ε are primarily attributed to contrasts in soil texture that control water content. Reflections of an EM wave from a transmitter, based on εr contrasts in the subsurface, are recorded by a receiver. EM wave travel times are converted to depths using the εr of the peat matrix (and, when known, the εr of underlying mineral sediments) to generate an image of the subsurface stratigraphy. The attenuation of the EM wave is approximately proportional to the electrical conductivity of the subsurface. The EM wave will often penetrate at least ten meters of peat due to the relatively resistive peat matrix (Theimer, 1990; Theimer et al., 1994). Depth of investigation is also partly controlled by antenna frequency, with lower frequency antennas resulting in greater depth of investigation at the expense of reduced resolution. Higher electrical conductivity sediments at the mineral sediment interface, typically associated with clays, excessively attenuate the EM wave (Slater and Reeve, 2002). However, more resistive sediments at the mineral sediment interface, such as coarse-grained esker deposits, allow for deeper transmission of the EM wave into mineral sediments (Slater and Reeve, 2002; Comas and Slater, 2004).
Previously acquired GPR data (Comas et al., 2011) were used to characterize variations along the mineral sediment interface relative to the pools in Caribou Bog. GPR acquisition in Thousand Acre Bog and Meddybemps Heath was conducted using a MALÅ ProEx control unit (MALÅ Geoscience AB, Malå, Sweden) paired with MALÅ Rough Terrain Antennas (RTAs) (MALÅ Geoscience AB, Malå, Sweden) with frequencies of 100 MHz (Thousand Acre Bog), 50 MHz (Meddybemps Heath), and a shielded 250 MHz antenna (Thousand Acre Bog). A lower frequency of 50 MHz was selected for Meddybemps Heath, given the substantially thicker peat deposits in this bog (Cameron et al., 1984). Transects from these surveys were spatially referenced using a Trimble GPS unit (Trimble Inc., Westminster, CO, USA) for lines collected with the RTAs and a SparkFun RTK Facet GPS unit (SparkFun Electronics, Niwot, CO, USA) for lines collected with the shielded antenna. GPR data were acquired during August 2023, November 2023, and June 2024. All historical and newly acquired GPR data were processed using GPRPy software (Plattner, 2020) and spatially referenced using QGIS software (QGIS, 2023). Processing parameters used for these datasets were limited to the removal of the air wave by setting a zero-time, application of a “dewow” filter to remove low-frequency components from the data, and a “tpow” amplitude gain correction. The velocity of the EM wave was set to 0.036 m ns−1 based on well-constrained velocity values for an almost fully saturated (90 %–96 % saturation) peat matrix (Comas et al., 2011).
2.2 Imaging Hydrogeologic Structures Using Transient Electromagnetic Induction (TEM) Surveys
Transient (time-domain) electromagnetic induction (TEM) surveys were deployed to characterize the deeper hydrogeologic structure beneath the mineral sediments of the patterned pools in select bogs. The TEM method involves transmitting a primary EM field into the earth and measuring the decay of the secondary EM field induced in the subsurface over time. An impulse response , proportional to the change in the secondary EM field, from the instrument is recorded after the transmitter is shut off. Changes in the secondary field are recorded during the off time of the system over a logarithmic set of time steps to measure the signal decay. Ratios of the voltage (V) versus the current (I) injected are recorded as for these time steps. Apparent electrical resistivities (ρa) can then be solved using Eq. (1) where M is the magnetic moment defined by the number of turns of the transmitter (N), current circulating from the transmitter (I), and the area of the transmitter loop (A), μ0 is the permittivity of free space, and t is the time step of the response recorded.
In the bogs, a portable Loupe TEM system (Loupe Geophysics, Perth, WA, Australia) was used to collect spatially continuous data in the three select bogs between the dates of 2 and 5 May 2025, across targeted transects where permeable mineral sediments had been identified with GPR. The set-up consisted of an operator carrying the transmitter backpack connected to another operator carrying the receiver backpack, connected by a cable and maintaining a 10 m offset. For data collection, the current of the transmitter was set to 100 A, and the frequency was set to 450 Hz during surveys. The geometry of the transmitter coil consisted of an area of 0.358 m2 and 13 turns of the coil, resulting in a magnetic moment of 465.4 Am2 for the survey set up. Receiver gain of the system was set to a value of 10 to optimize the signal to noise ratio of the data. The system has a square wave form with a 50 % duty cycle, with turn on/turn-off ramps of 8 µs and a cycle time of 13.33 ms for each measurement. Data were georeferenced using the internal RTK GPS system built into the Loupe TEM system.
Data collected from the TEM surveys were inverted using Aarhus Workbench software (Aarhus GeoSoftware, Aarhus, Denmark). Negative and visually noisy apparent electrical resistivity data were removed prior to running the inversion to minimize noise artifacts in the inversion. A smooth, laterally constrained inversion of the TEM data was run using the impulse responses recorded by the z-axis coil of the receiver. The model domain was set up with between 20 and 25 layers with logarithmically increasing thickness from 2.0 up to 80.0 m depth. A minimum number of three data points per TEM sounding was implemented with a maximum of 50 inversion iterations for the model. All inversion misfits reached a total residual of less than two.
Electrical resistivity imaging (ERI) performed over similar transects to the TEM survey in Caribou Bog (Comas et al., 2004, 2011) provide insights into the ranges of electrical conductivity expected in the TEM surveys. Bedrock and till were characterized by low electrical conductivity structures of less than 0.3 mS m−1, eskers were characterized by electrical conductivity ranging between 3.3 to 0.3 mS m−1 and glacio-marine clays were characterized by electrical conductivity ranging from 20 to 3.3 mS m−1 (Comas et al., 2004, 2011). Based on these values, all TEM inversions were categorized into these ranges of high, intermediate, and low electrical conductivity regions of the inversion. All electrical conductivity values of TEM inversion models are presented in exponential format. Surficial features of pools and vegetation patterning previously characterized by Davis and Anderson (1999) compared to the electrical conductivity structures in the inversion models to determine associations.
2.3 Point-Scale Groundwater Indicators Based on Temperature and Specific Conductance
Upwelling of groundwater is known to propagate discrete temperature (T) and specific conductance (SpC) signatures from depth into a wide range of surface water types (Hayashi, 2004; Anderson, 2005). Temperature signals of groundwater in the summer are typically cooler relative to the atmospheric warming of surface water bodies (Constantz, 2008). Inversely, temperature signals of groundwater in the winter are warmer relative to the atmospheric cooling of surface water bodies. Groundwater discharging to hydraulically confined, presumed ombrogenous surface water bodies can have higher SpC due to the dissolved ionic constituents (Hayashi, 2004) originating from contact with the bounding mineral sediments or transported from the underlying aquifer. Paired point temperature and SpC measurements were taken at a depth of 0.25 m in the water column a few centimeters from the perimeter of pools in Caribou Bog, Meddybemps Heath, and Thousand Acre Bog. Due to the significant area of the pool systems, temperature and SpC data were not collected in the center of the pools. The sampling interval for point measurements around all pools was approximately every five meters around the perimeters. Temperature measurements were taken using a Digi-Sense Single Input Type T thermocouple meter (±0.4 °C) (Cole-Parmer Instrument Company, LLC, Vernon Hills, IL, USA). In Caribou Bog, SpC was measured on 23 and 24 August 2023, using a Hach sensION 5 Conductivity Meter (±0.86 µS cm−1) (Hach Company, Loveland, CO, USA). In Meddybemps Heath, SpC was measured on 7 and 17 August 2023, using a YSI Pro30 Conductivity Meter (±1.0 µS cm−1). Both a YSI Pro30 Conductivity Meter (±1.0 µS cm−1) (Xylem Analytics, Yellow Springs, OH, USA) and EcoSense EC300A Conductivity Meter (±2.0 µS cm−1) (Xylem Analytics, Yellow Springs, OH, USA) were used to survey Thousand Acre Bog on 8, 10, and 15 August 2023. All specific conductivity meters used for measurements were calibrated according to corresponding manufacturer instructions using standards of 84, 1413, and 12.88 µS cm−1 KCl solution standards at 25 °C.
Surveys of Caribou Bog and Meddybemps Heath were conducted around all pools making up a patterned assemblage. In contrast, only a representative portion of the much larger pool system in Thousand Acre Bog was surveyed due to the size of the system. An inverse linear relationship between T (°C) versus SpC (µS cm−1) was anticipated for discharge to pool water during the summer season, as groundwater is expected to have elevated dissolved solids (Sorensen and Glass, 1987; Hayashi, 2004; Cox et al., 2007) compared to ombrogenous pool surface waters. A comparative measure of groundwater influence (Gi) was defined in Eq. (2), with high values (high SpC, low T) expected to be representative of groundwater inflows during summer months.
Principal component analysis was performed to define the major and minor axes about the Gi value points surrounding the pools. The axis almost perpendicular to the direction of the inferred direction of the pool lateral spreading was used to group points into two clusters of approximately equal size, consisting of (1) numerous mineral sediment structures and (2) few or no mineral sediment structures imaged from GPR surveys. Hydraulic gradients across the patterned pools were estimated from elevation data over the pools in each bog (State of Maine, 2020) following a method described by Chen et al. (2020) to establish the direction of lateral spreading. Histograms were then used to plot normalized frequency and Gi values to examine the distribution of the two defined populations for each system of patterned pools. A non-parametric Mann-Whitney Unbiased-Test (U-Test) was run comparing the non-Gaussian distribution of the Gi values of the two defined populations to produce a U-statistic to establish statistical differences in the Gi values between the hydraulically upgradient and hydraulically downgradient sides of the pools. The U-statistic was normalized relative to the upgradient and downgradient populations to define a probability of superiority measure, where a value of zero concludes that all Gi values on the hydraulically upgradient side of the pools were smaller than the Gi values on the hydraulically downgradient side of the pools. A value of one concludes that all Gi values on the hydraulically upgradient side of the pools were larger than the Gi values on the hydraulically downgradient side of the pools. A p-value was also produced to determine the statistical significance of the difference between the Gi values in the two populations, where a value of p< 0.05 was deemed significant. The magnitude of the difference between the hydraulically upgradient and hydraulically downgradient sides of the pools was calculated using rank-biserial correlation coefficient from the calculated probability of superiority measures.
2.4 Temperature Signals from Uncrewed Aerial System (UAS) Thermal Infrared(TIR) Mapping and Handheld TIR Imaging
Uncrewed aerial system (UAS) Thermal Infrared (TIR) mapping was completed using a DJI Mavic 2 Enterprise Advanced (DJI M2EA) system (SZ DJI Technology Co., Ltd., Shenzhen, China) with RBG and FLIR TIR (Teledyne FLIR LLC, Wilsonville, Oregon, USA) cameras attached to an integrated gimbal. Surveys were flown over contiguous assemblages of multiple pools in Caribou Bog, Meddybemps Heath, and Thousand Acre Bog. An area of 0.116 km2 was flown over Caribou Bog, 0.0380 km2 was flown over Meddybemps Heath, and 0.227 km2 was flown over Crystal Bog. Flights targeted periods after substantial precipitation events (> 4.0 mm d−1) when groundwater inflows were expected to be enhanced (Moore et al., 2024). Additional flight settings for the UAS are available in the description of Text S1. In Caribou Bog, flights were conducted less than 2 h following 4.06 mm d−1 of local precipitation (NOAA, 2023d) on 9 June 2023. In Meddybemps Heath, flights were conducted on 9 August 2023, less than 8 h after 29.0 mm d−1 of local precipitation (NOAA, 2023a). In Thousand Acre Bog, flights were performed on 10 August 2023, less than 36 h after 19.8 mm d−1 of local precipitation (NOAA, 2023c). UAS TIR mapping efforts in Thousand Acre Bog were limited due to battery capacity. For comparison against a period of less precipitation, a flight was conducted in Meddybemps Heath on 15 June 2023, following three days of 0.51 mm d−1 of local precipitation (NOAA, 2023b). To contrast the cooler temperature signal of upwelling water in the summer season, a flight was conducted in Meddybemps Heath during the winter season on 3 November 2023, when a warmer temperature signal of upwelling water was expected.
To further investigate features in the UAS TIR temperature mapping, handheld TIR imaging was applied in Meddybemps Heath. Handheld TIR surveying was conducted in the summer season on 6 June 2024, following noted local precipitation a day prior. Images were captured with a sensor resolution of 320×240 temperature-sensitive pixels, using a FLIR E8-XT camera (±2.0 °C, < 50 mK) (Teledyne FLIR LLC, Wilsonville, OR USA). The thermal emissivity of water (0.98) was set using the FLIR camera prior to capturing all imagery. All images were processed using FLIR Tools software (Teledyne, 2018) to constrain temperature ranges.
2.5 Aqueous Geochemistry
Ten surface water samples were collected in all three raised bogs (n= 30 total) using 250 mL Nalgene bottles and were subsequently analyzed using Inductively Coupled Plasma Optical Emission Spectrometry (ICP-OES). Water sample locations were selected based on the point temperature and SpC data acquired in the three raised bogs to compare concentrations in locations both with and without groundwater signatures. Water samples were collected on 4 November 2023, in Caribou Bog (CB), 15 August 2023, in Thousand Acre Bog (TAB), and 18 August 2023, in Meddybemps Heath (MH). All samples were refrigerated after field collection and prior to ICP-OES analysis. Iron and manganese trace elements were selected for analysis based on their prevalence in regional glacial aquifers across the northeastern United States (Groschen et al., 2009; Erickson et al., 2019) similar to the local esker deposits underlying the three bogs. It was assumed that redox conditions were relatively stable at 0.25 m depth near the pool edges where the water was collected over the short sampling periods. The background solution for the ICP-OES analysis consisted of a 5 % hydrochloric acid solution. Water samples (n= 30 total) were prepared by filtering 10 mL of the raw sample using a filter size of 0.22 µm. Six standards containing from 0 to 5 ppm of iron and manganese in the background solution were prepared for machine calibration over the two rounds of analyses. Analyses were conducted using a paired Agilent Technologies 5110 ICP OES unit (Agilent Technologies Inc., Santa Clara, CA, USA) with an Agilent Technologies SPS 4 Autosampler (Agilent Technologies Inc., Santa Clara, CA, USA) for all samples (n= 30). The autosampler was rinsed with 5 % nitric acid solution after each sample analysis, and a quality control of 3 ppm iron and manganese in the background solution was used to ensure the continued calibration of the instrument. A wavelength of 234.350 nm was selected for iron (Fe), and a wavelength of 294.921 nm was selected for manganese (Mn) based on the regression fit of the processed water samples against instrument standards.
3.1 Resolving Mineral Sediment Stratigraphy Using Ground-Penetrating Radar
The GPR surveys show structures along the mineral sediment interface of the three raised bogs studied. GPR surveys reported by Comas et al. (2011) identified two distinct esker beads located beneath the eastern margin of the Caribou Bog pools (Fig. S1). Transect A (Fig. S1) highlights the transition from the attenuation of the EM wave at the base of the peat due to the underlying electrically conductive glaciomarine clay (between 0 to 70 m) to the substantial EM wave transmission through resistive eskers (between 70 and 120 m). Two esker beads representing these structures underlying the pools are further highlighted in Transect B (Fig. S1), with the crests of the beads located 2 to 3 m below the peat surface. GPR surveys revealed similar features along the mineral sediment interface beneath Thousand Acre Bog. The base of the peat underlying this more extensive pool system is characterized by a multitude of mineral sediment interface changes, stretching from the western to the eastern margin of the pools. Transect A (Fig. 2) shows a transition from the total EM wave attenuation at the base of peat (0 to 36 m) to signal transmission associated with a topographic high in the mineral sediment interface observed between 36 to 66 m. Eastward, Transect C (Fig. 2) runs along this more transmissive section of the mineral sediment interface from 0 to 64 m. A transition from EM signal attenuation to transmission through the mineral sediment interface is observed in Transect D (Fig. 2), starting at 48 m. Topographic highs along the mineral sediment interface within these transects are observed at 4 to 5 m depth. Variations in the mineral sediment interface are further highlighted in Transect I (Fig. S2), where the EM signal changes at the end of the survey along the eastern margin of the patterned pools. The subtle slope in the GPR reflectors in this transect highlights the thinning of peat towards the edge of the basin (Fig. S2).
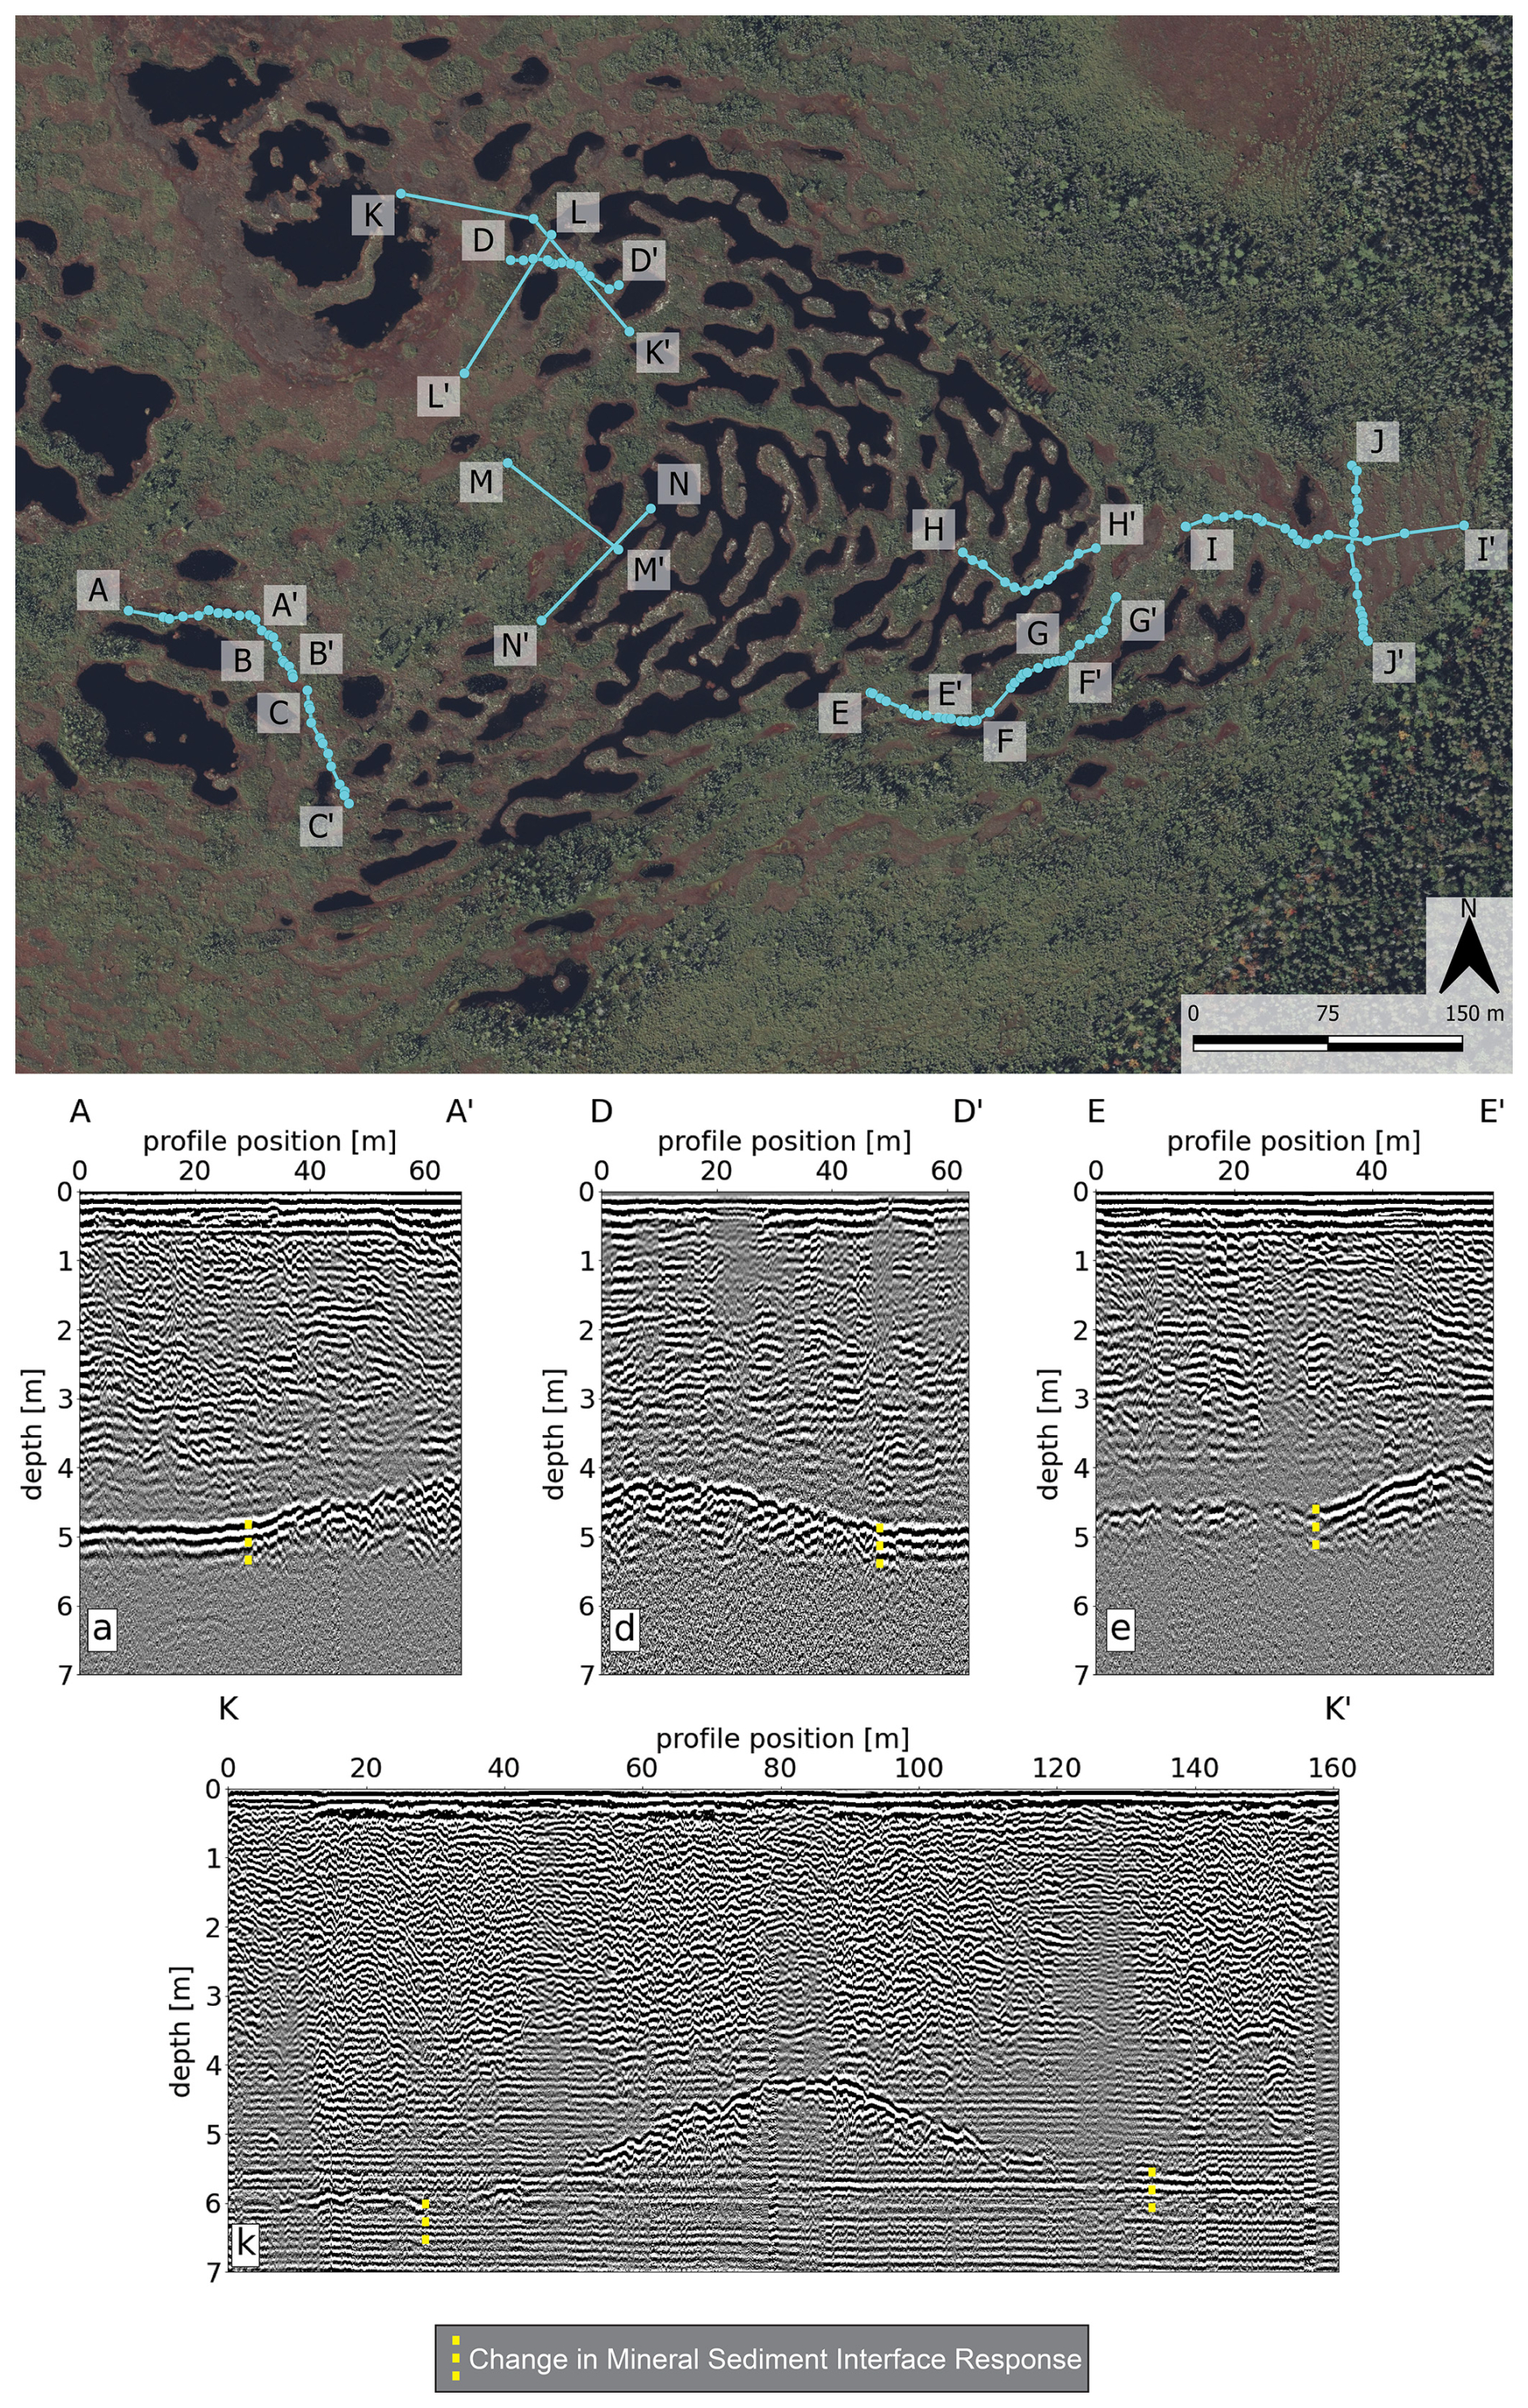
Figure 2Transects selected from GPR data collected in Thousand Acre Bog (velocity = 0.036 m ns−1), highlighting the changes in the mineral sediment interface reflectors beneath the patterned pools. Basemap data from © Microsoft (2024).
Topographic highs along the mineral sediment interface are observed in the northern section of the pools within Meddybemps Heath (Figs. S3; S4). Transect C (Fig. S3) shows the transition from EM wave attenuation from 0 to 75 m to EM wave transmission between 75 and 138 m. Mineral sediment interface topographic highs underlying Meddybemps Heath are noted between 6 and 8 m depth (Figs. S3; S4). Topographic variations in the mineral sediment interface along Transect E and Transect F (Fig. S3) are more subtle than observed along Transect C (Fig. S3). Additional GPR profiles showing variations along the mineral sediment interface are shown in Fig. S1 (Caribou Bog), Fig. S2 (Thousand Acre Bog), Fig. S3 (Meddybemps Heath), and Fig. S4 (Meddybemps Heath).
3.2 Imaging Hydrogeologic Structures Using Transient Electromagnetic Induction (TEM) Surveys
Electrical conductivity structures embedded in the mineral sediments bounding the bogs and the extension of such structures beneath the mineral sediments are shown throughout the TEM surveys (Figs. 3, 4, 5). In Caribou Bog, the TEM data collected highlight similar findings by Comas et al. (2004, 2011) along the southern section of the patterned pools. Low electrical conductivity layers (< 0.3 mS m−1) are observed beneath the high electrical conductivity layers (> 3.3 mS m−1) and transition to the upland on the eastern boundary of the survey (Fig. 3). An intermediate electrical conductivity structure (> 1.0 mS m−1) is observed approximately 150 m along the survey, interrupting the otherwise continuous high conductivity layer (Fig. 3). The highest elevation of this intermediate electrical conductivity structure (> 1.0 mS m−1) is observed approximately 190 m along the survey and corresponds with the eastern edge of the pool at the surface of Caribou Bog (Fig. 3). Layers of high electrical conductivity (> 3.3 mS m−1) are observed towards the upper section of the model (Fig. 3). Sharp breaks in both the surficial vegetation patterning (Davis and Anderson, 1999) and the underlying electrical conductivity structure correspond spatially (Fig. 3), as previously noted by Comas et al. (2004).
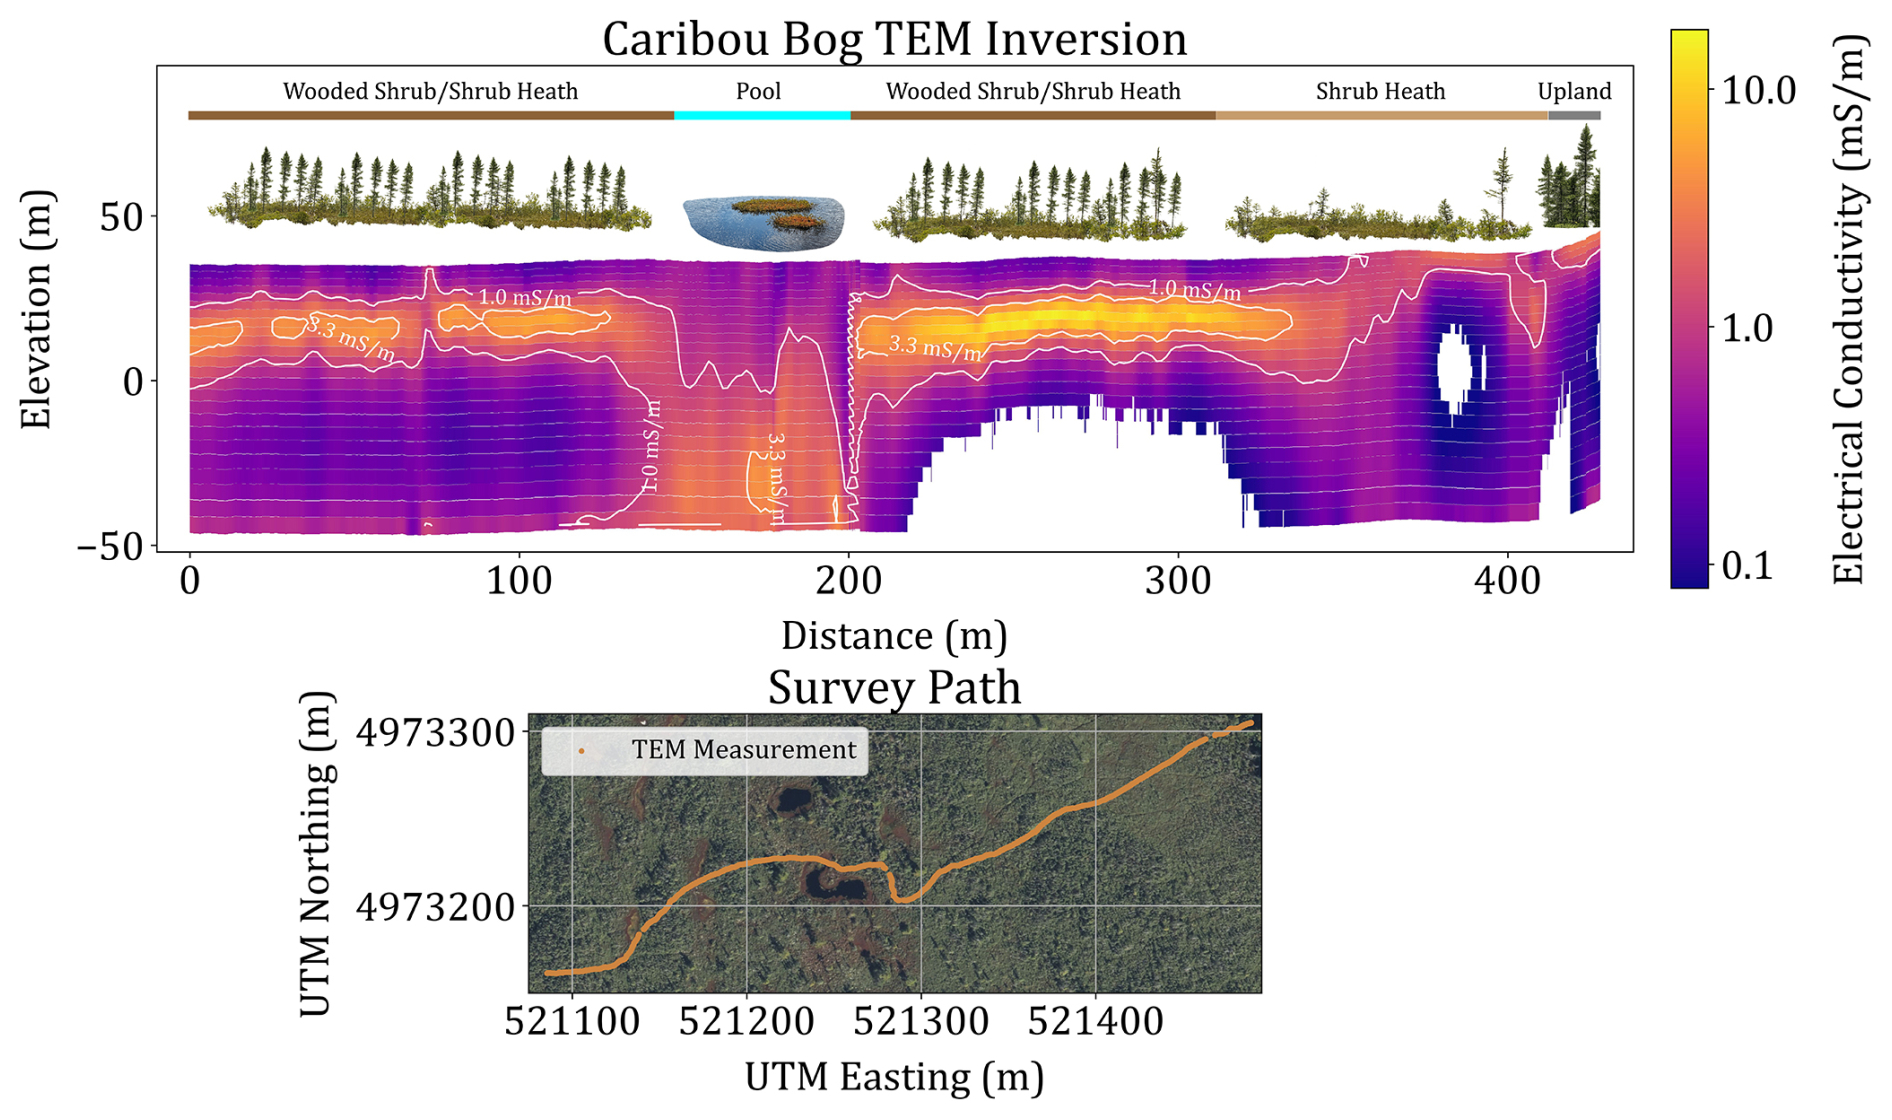
Figure 3Transient electromagnetic induction (TEM) electrical conductivity (mS m−1) inversion results from surveys conducted in Caribou Bog, indicating variations in the electrical conductivity structures beneath the patterned pools and correspondence to surficial vegetation patterning (Davis and Anderson, 1999). Sensitivity of the TEM inversion was filtered using a standard deviation of less than four to remove low sensitivity portions of the model (white). Basemap data from © Microsoft (2024).
The TEM data collected in Thousand Acre Bog feature variations in the underlying electrical conductivity structures that exist beneath the mineral sediments (Fig. 4). A low electrical conductivity layer (< 0.3 mS m−1) exists at the base of the inversion model, with undulating patterns emphasized towards the center of the survey path (Fig. 4). Four structures of intermediate electrical conductivity (> 0.3 mS m−1) are present in the center of the survey from 125 to 230 m and overly low electrical conductivity structures (< 0.3 mS m−1). Centers of these structures appear more electrically conductive than the rest of the intermediate electrically conductive layer (> 0.3 mS m−1) and have similar lateral widths (Fig. 4). The intermediate electrical conductivity layer (> 1.0 mS m−1) appears to dip towards the center of the bog (Fig. 4). The top layers of the inversion are characterized by the highest electrical conductivities observed in the model (> 1.0 mS m−1) (Fig. 4). Deeper electrical structures correspond with surficial vegetation (Davis and Anderson, 1999) and pool patterning along the surface of Thousand Acre Bog (Fig. 4).
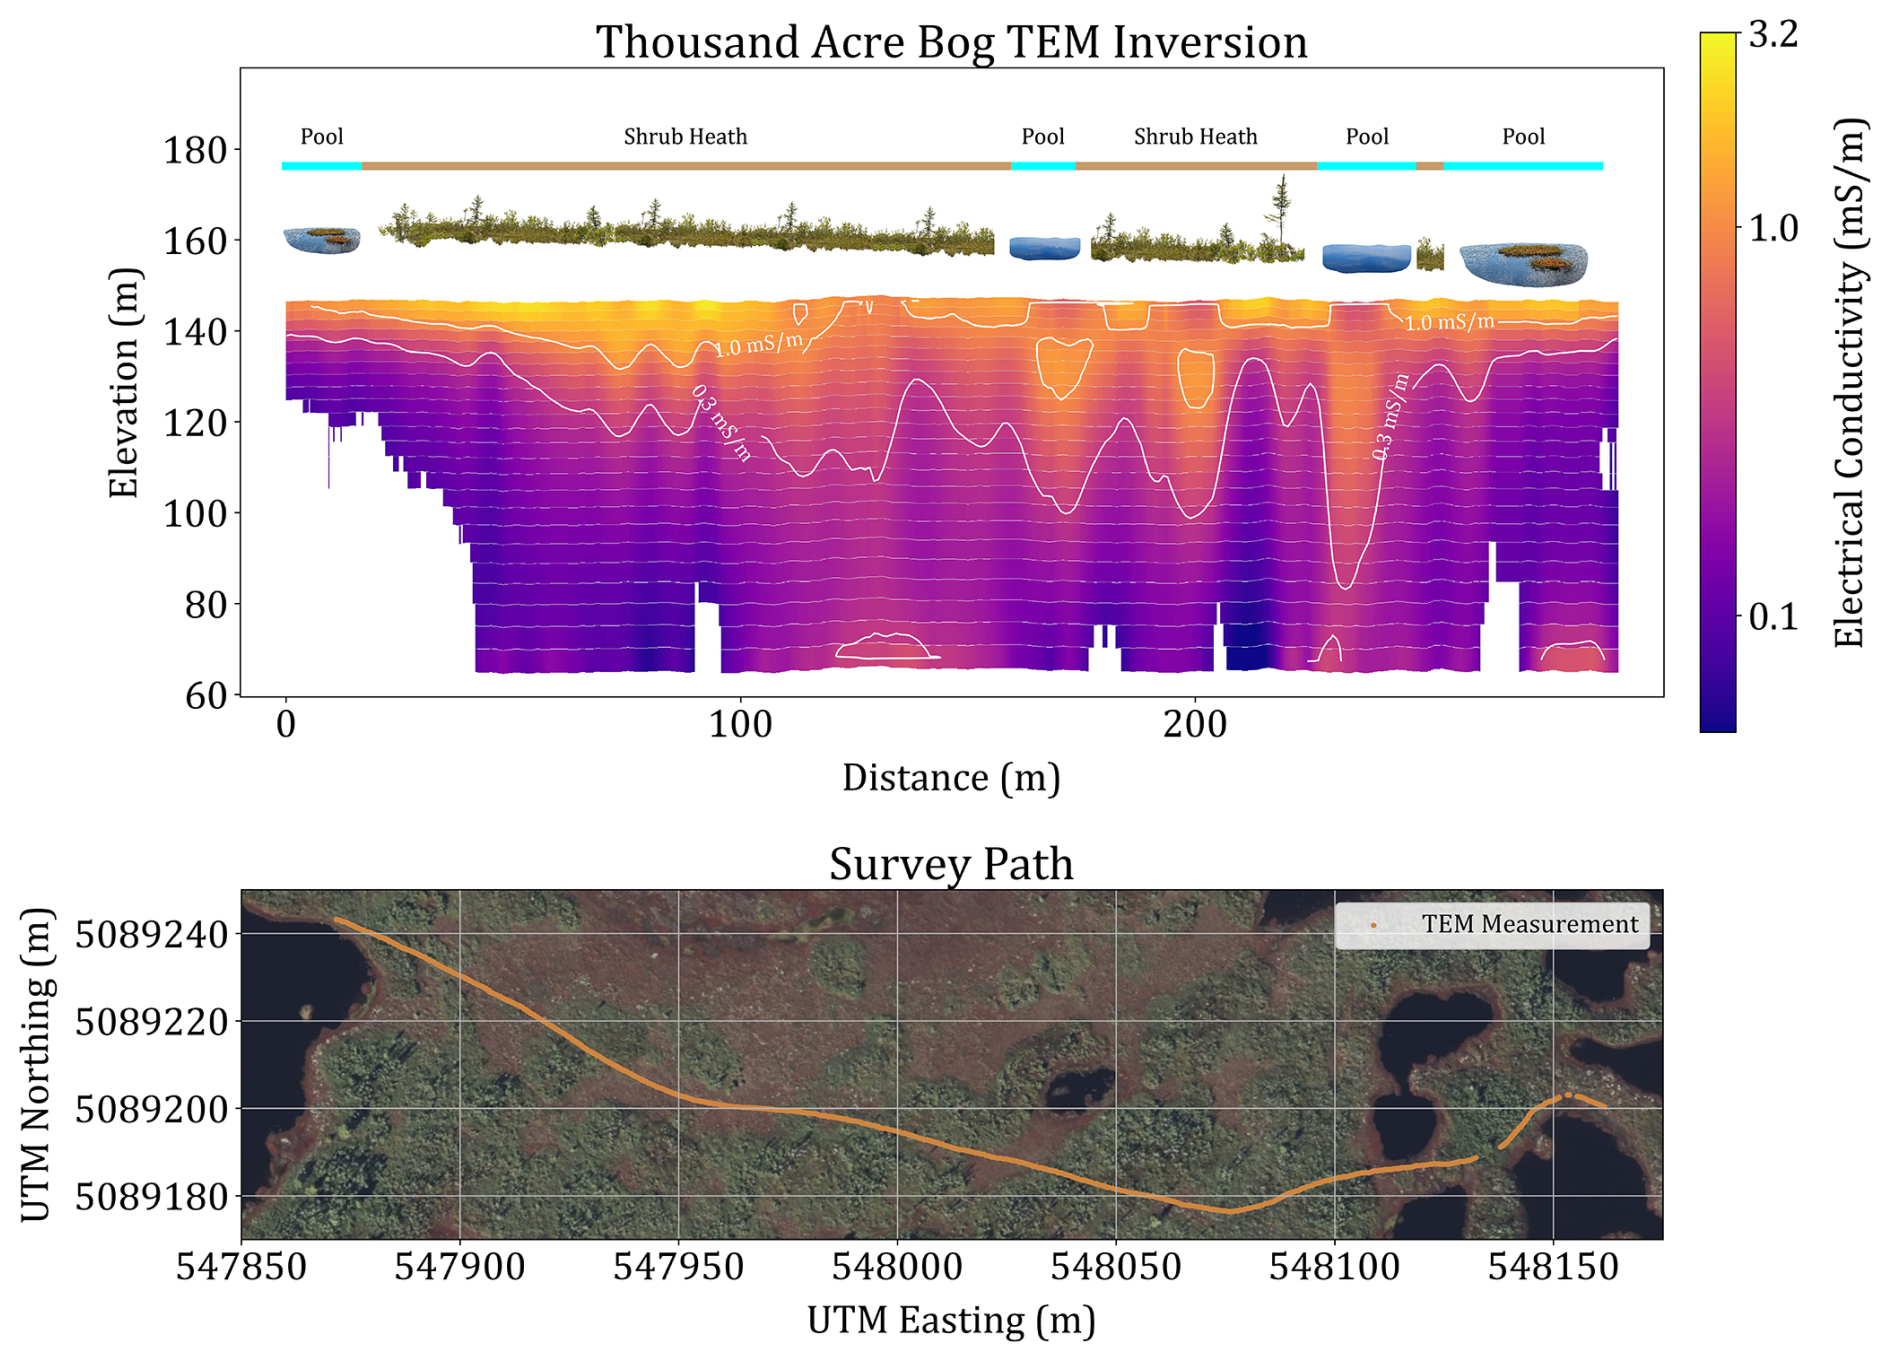
Figure 4Transient electromagnetic induction (TEM) electrical conductivity (mS m−1) inversion results from surveys conducted in Thousand Acre Bog, indicating variations in the electrical conductivity structures beneath the patterned pools and correspondence to surficial vegetation patterning (Davis and Anderson, 1999). Sensitivity of the TEM inversion was filtered using a standard deviation of less than four to remove low sensitivity portions of the model (white). Basemap data from © Microsoft (2024).
In Meddybemps Heath, the TEM data collected reveals a similar structure of an undulating low electrical conductivity layer (< 0.3 mS m−1) present along the bottom boundary of the survey, with the highest point found at approximately 220 m distance and the greatest depth at approximately 70 m (Fig. 5). An intermediate electrical conductivity layer (> 0.3 mS m−1) exists above the low conductivity layer, with undulations in the intermediate electrical conductivity structures from 400 and from 460 m to the end of the survey (Fig. 5). These structures observed in the intermediate electrical conductivity layer (> 0.3 mS m−1) contain similar lateral widths (Fig. 5). High electrical conductivity (> 1.0 mS m−1) is observed in the upper layers of the inverse model (Fig. 5), thickening to the west in the survey and reaching the thickest point at approximately 450 m (Fig. 5). Changes in surficial vegetation patterning (Davis and Anderson, 1999) and pools correspond with changes in the deeper electrical structures beneath Meddybemps Heath (Fig. 5).
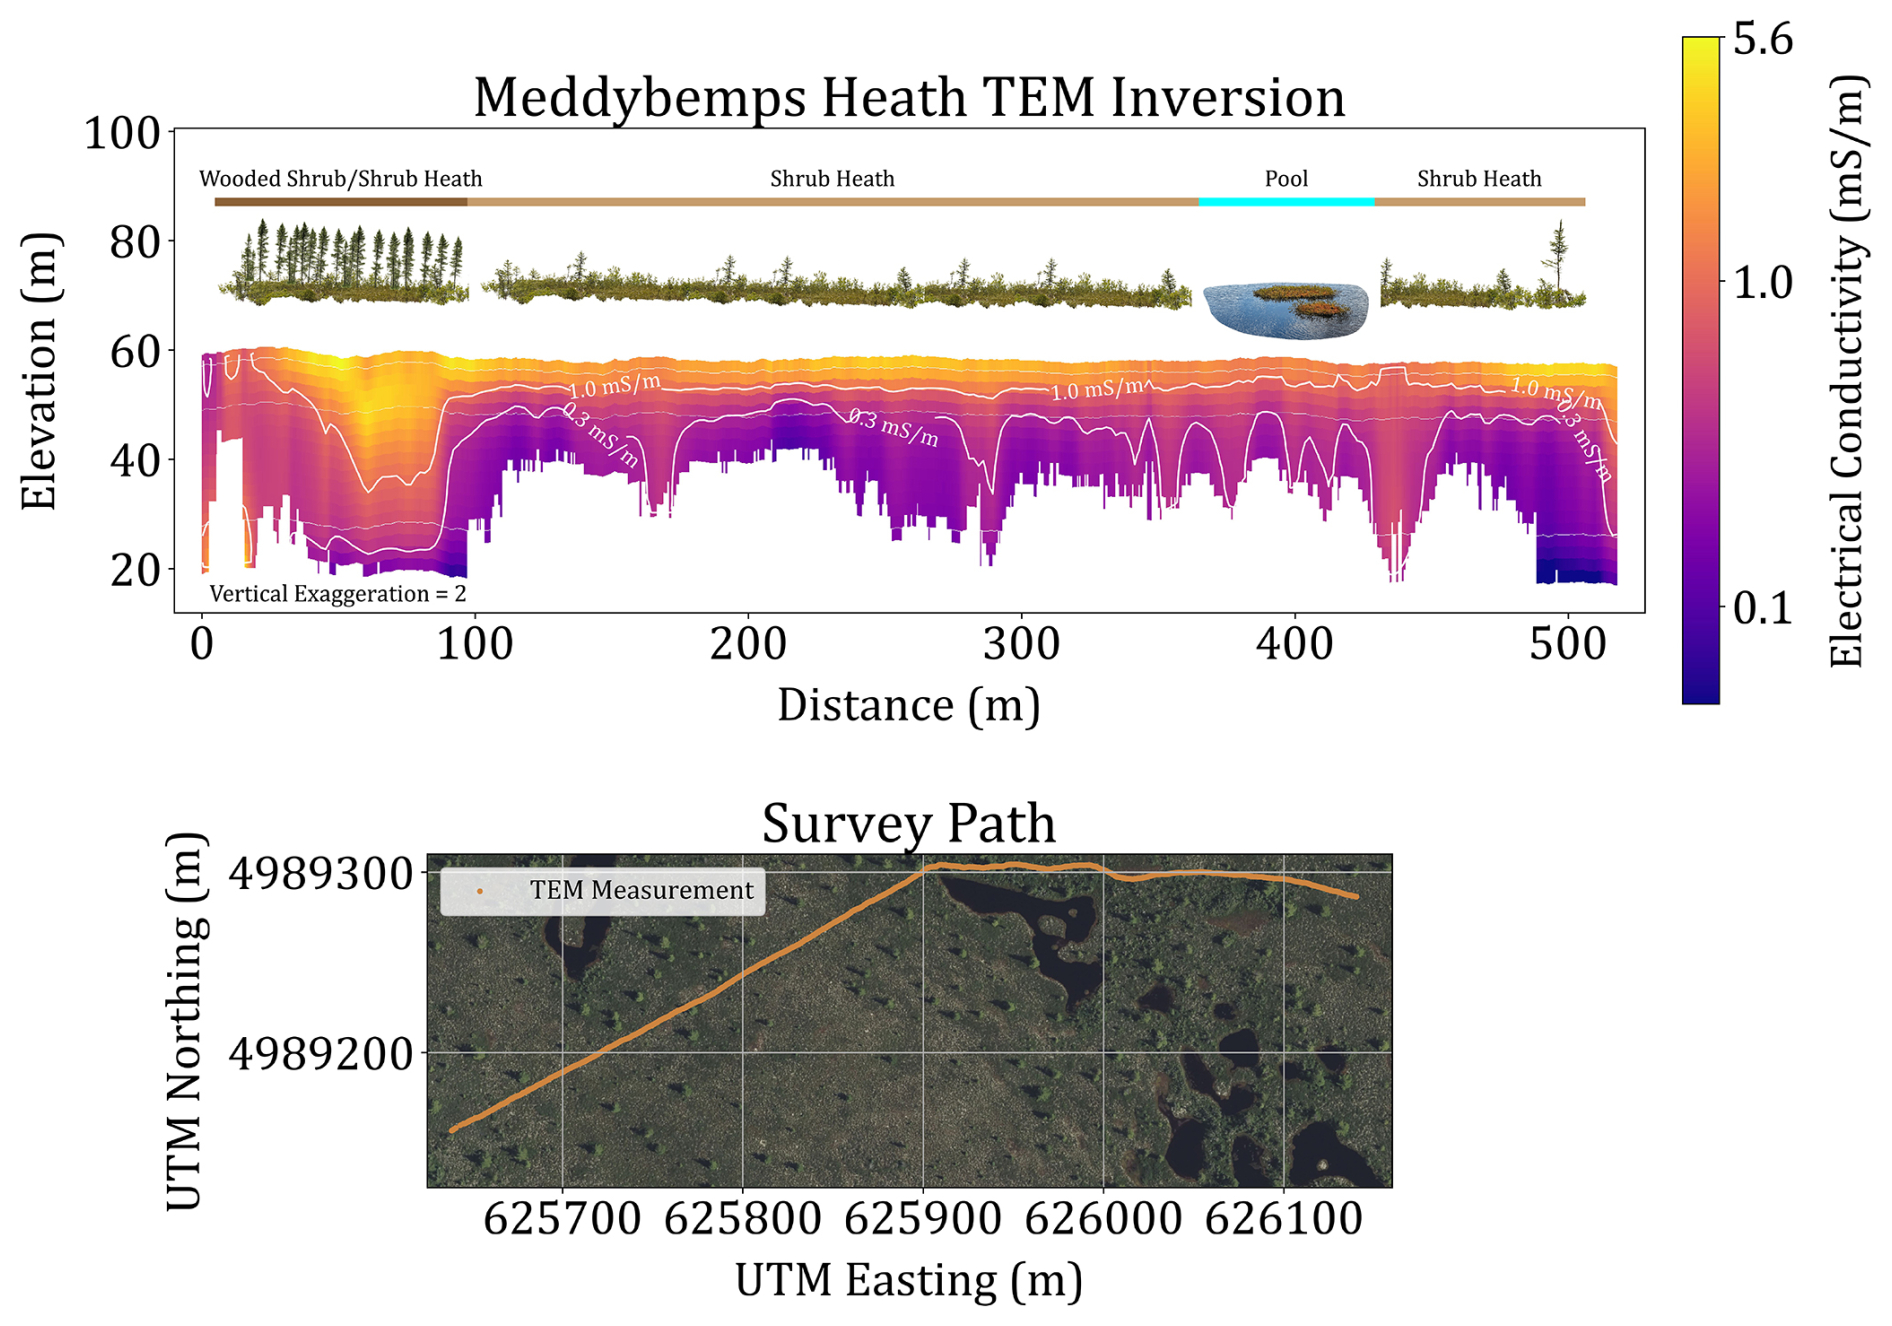
Figure 5Transient electromagnetic induction (TEM) electrical conductivity (mS m−1) inversion results from surveys conducted in Meddybemps Heath, indicating variations in the electrical conductivity structures beneath the patterned pools and correspondence to surficial vegetation patterning (Davis and Anderson, 1999). Sensitivity of the TEM inversion was filtered using a standard deviation of less than four to remove low sensitivity portions of the model (white). Basemap data from © Microsoft (2024).
3.3 Point-Scale Groundwater Indicators Based on Temperature and Specific Conductance
Point measurements of temperature and SpC show significant variations along the perimeter of pools in the three raised bogs. In Caribou Bog, the 13 patterned pools surveyed reveal trends of lower temperature and higher SpC along the eastern margin relative to the rest of the pools. Temperature ranged from a minimum of 16.3 to a maximum of 24.1 °C (Fig. S5), and SpC ranged from a minimum of 49.1 to a maximum of nearly 173 µS cm−1 (Fig. S5). Sample sizes for the linear regressions of temperature versus SpC for individual pools ranged from a minimum of n= 4 to a maximum of n= 55 (Table S2). Coefficients of determination (R2) ranged from 0.005 to 0.960 (Table S2). Regression coefficients were both positive (n= 5) and negative (n= 8) from the 13 pools (Table S2). P-values from the regressions are reported in Table S2. Pools with statistically significant relationships (n= 5) between these two variables had p-values ranging from less than 0.001 to 0.006 (Table S2). Calculated Gi values for Caribou Bog ranged from a minimum of 2.43 to a maximum of 8.49, with higher Gi values more common along the upgradient side of the pool system than the downgradient side, corresponding with the direction of lateral spreading (Fig. 6). The Mann-Whitney U-Test comparing the Caribou Gi values of the upgradient and downgradient populations on either side of the major axis of the pool system produced a probability of superiority of 0.648 and p< 0.001 (Fig. 6). This test states that the Gi values of the upgradient population are statistically larger than the Gi values of the downgradient population, again corresponding to the direction of lateral spreading. Further, the p-value corroborates a statistically significant difference between the two populations. The magnitude of difference between the upgradient and downgradient populations was described by a rank-biserial correlation coefficient of 0.295, representing a modest but consistent tendency towards higher Gi values in the upgradient population.
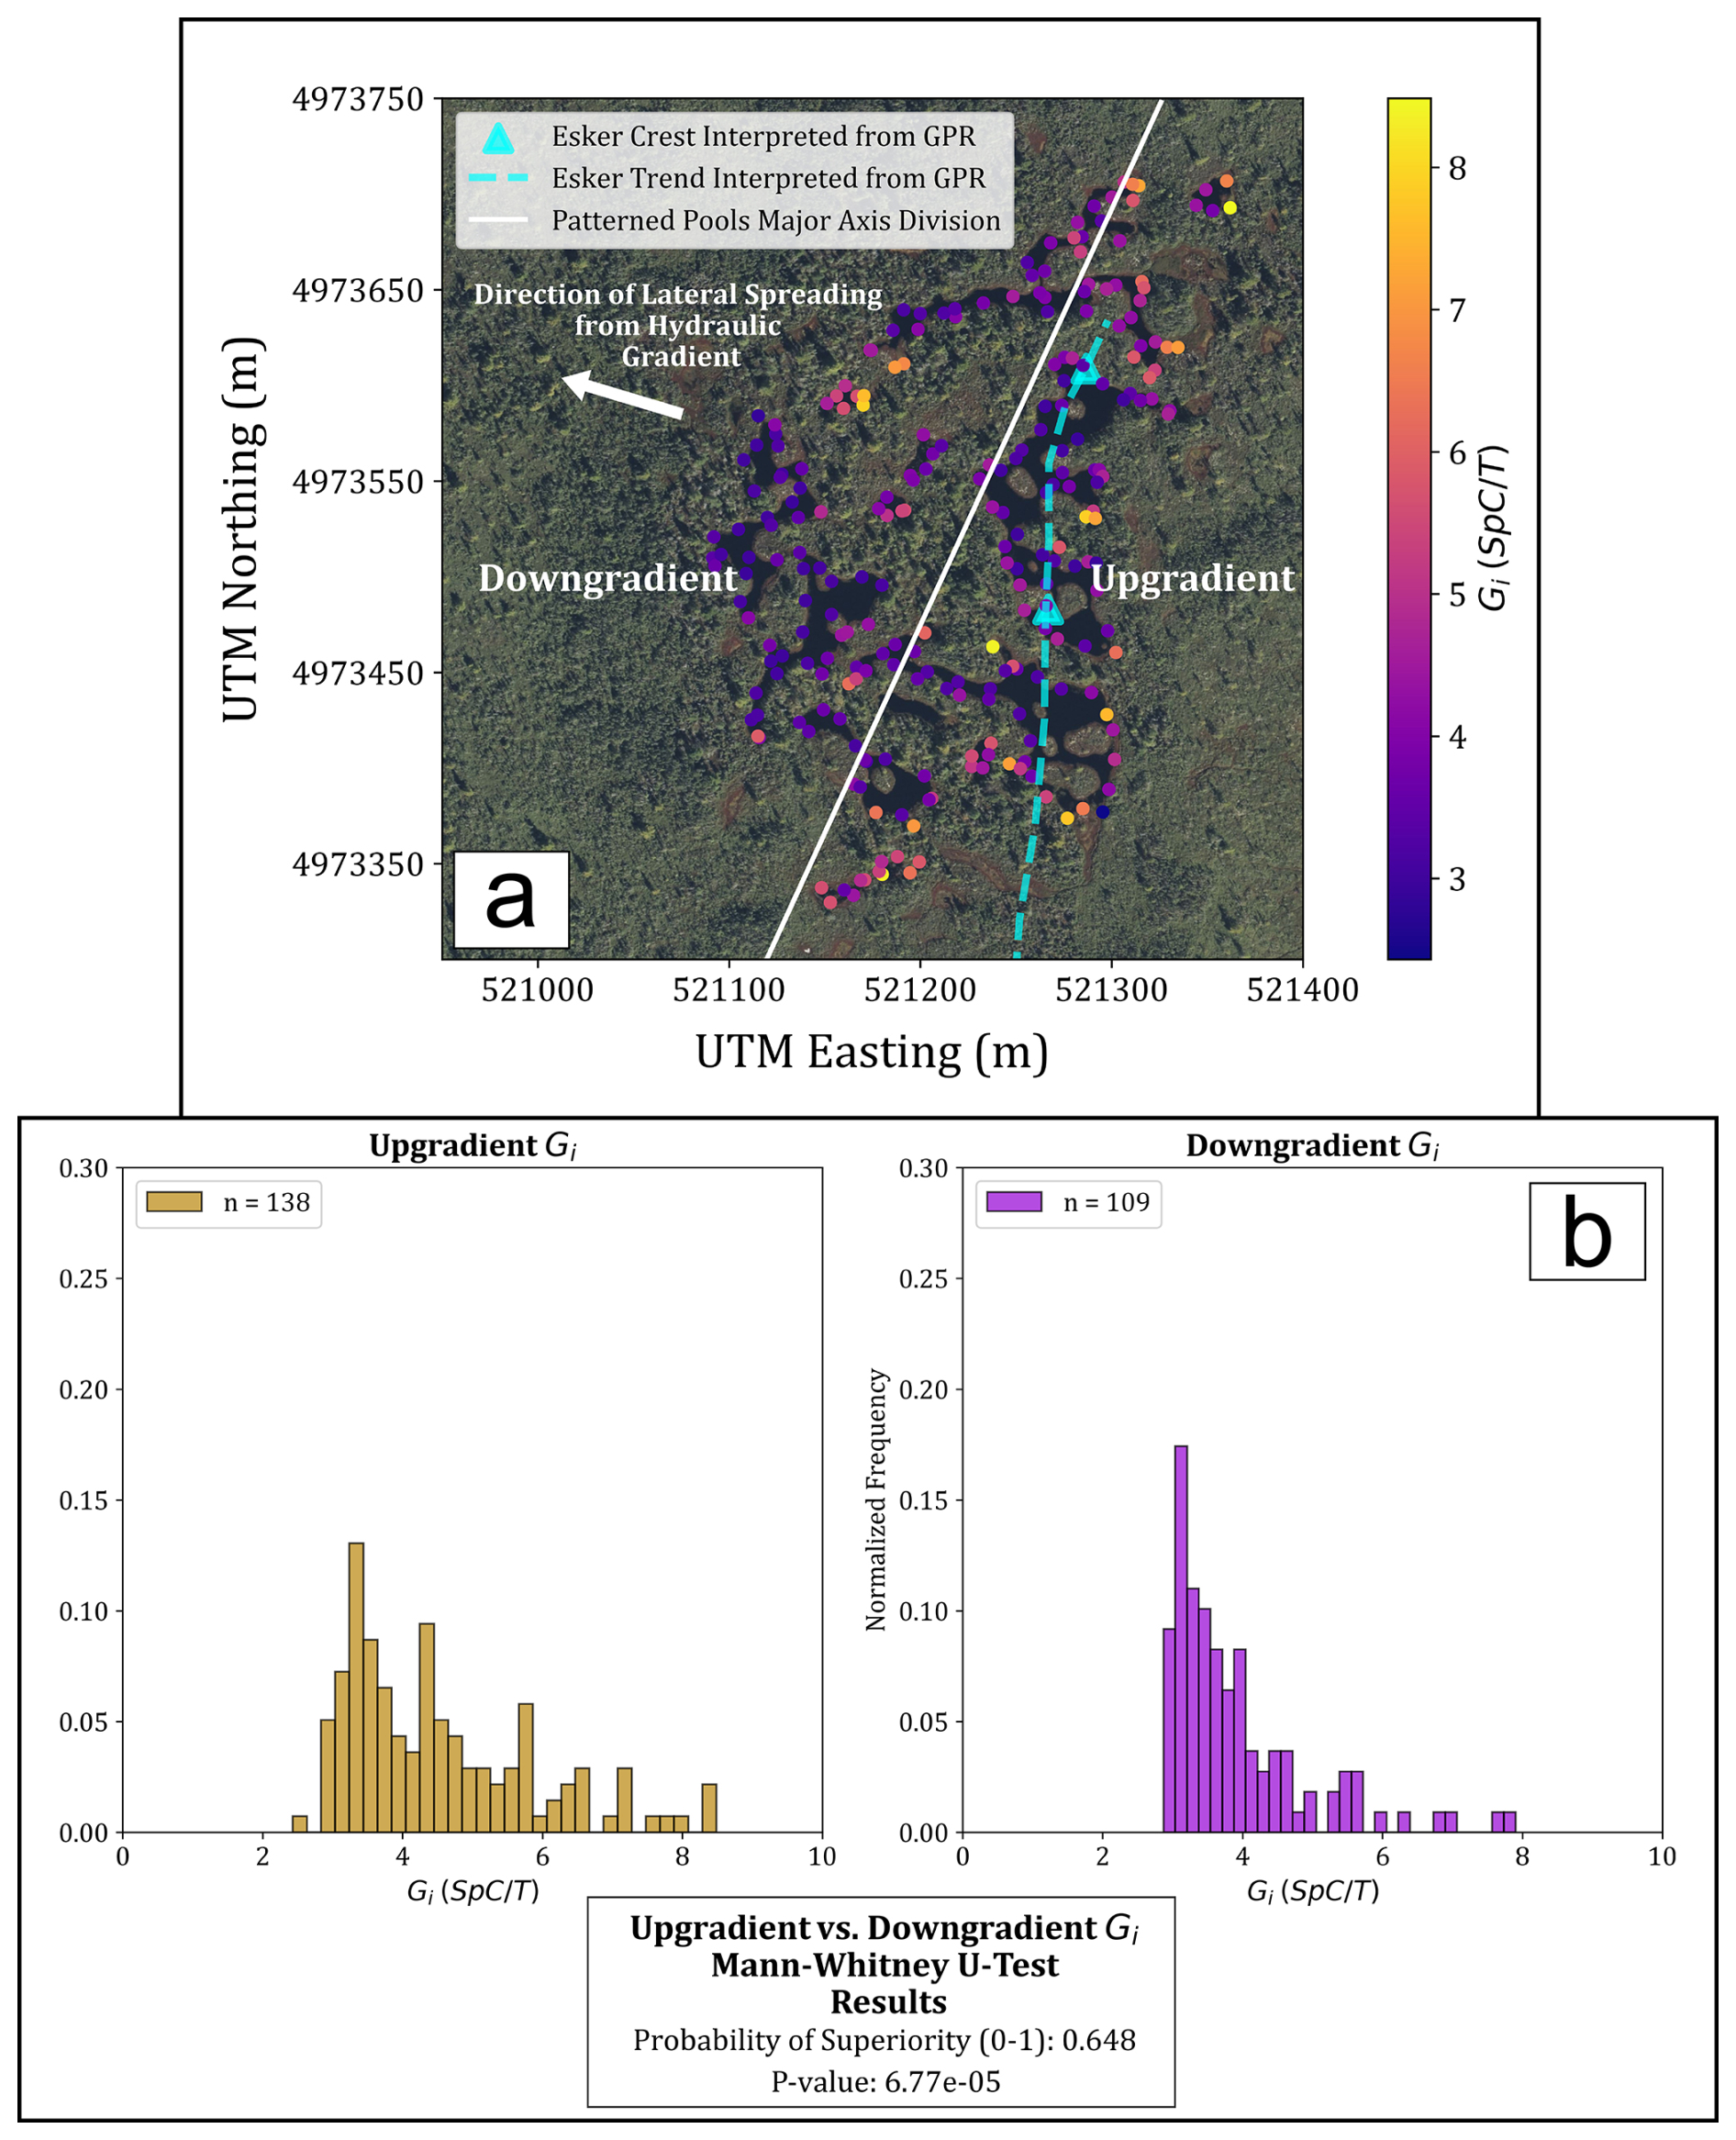
Figure 6Groundwater indicator (Gi) values (n= 247), in (a) given as ratios of specific conductance (µS cm−1) to temperature (°C) collected at 0.25 m depth along the perimeter of patterned pools (n= 13) of Caribou Bog (23 and 24 August 2022) with interpreted trends of underlying esker deposits inferred from GPR data, and the inferred direction of lateral spreading for the pool system. Histograms in (b) show the normalized frequency of Gi values of the upgradient and downgradient sections, split by the major axis of the system of patterned pools. In (b), a Mann-Whitney U-Test shows a significant p-value for the difference between the two populations. The probability of superiority demonstrates that the upgradient side of the pools has statistically larger Gi values than the downgradient side of the pools. Basemap data from © Microsoft (2024).
Temperature and SpC data were collected in 37 individual pools in Thousand Acre Bog and revealed trends of lower temperature and higher SpC along the western and eastern margins of the system relative to the rest of the pools (Fig. S6). The minimum temperature recorded in the pool system was 15.6 °C, and the maximum temperature was 31.1 °C (Fig. S6). The range of SpC spanned a minimum of 13.3 to a maximum of 98.5 µS cm−1 in all pools (Fig. S6). Sample sizes for linear regressions of temperature and SpC in individual pools ranged from a minimum of n= 7 to a maximum of n= 294 (Table S3), with R2 ranging from 0.007 to 0.709 (Table S3). The majority of regression coefficients were negative (n= 33), with statistically significant p-values for pools (n= 16) ranging from less than 0.001 to 0.023 (Table S3). Values of Gi in Thousand Acre Bog ranged from a minimum of 0.65 to a maximum of 4.99, with larger visually apparent Gi values along the western edge and in the northeastern section of the pool system (Fig. S7). Comparison of the upgradient and downgradient populations, divided by the minor axis of the pool system, using the Mann-Whitney U-Test yielded a probability of superiority of 0.626 and p< 0.001 (Fig. S7). The probability of superiority states that the Gi values in the upgradient population are statistically larger than the Gi values in the downgradient population, corresponding to the direction of lateral spreading, and the p-value concludes there is a statistically significant difference between the two populations. The magnitude of difference between the upgradient and downgradient populations was described by a rank-biserial correlation coefficient of 0.252, representing a modest but consistent tendency towards higher Gi values in the upgradient population.
In Meddybemps Heath, temperature and SpC data were collected in 15 different pools showing lower temperature and higher SpC measurements throughout the north-central section of the system relative to the rest of the pools (Fig. S8). The minimum temperature recorded in this pool system was 14.6 °C and the maximum temperature was 26.4 °C (Fig. S8), and SpC ranged from 23.7 to 78.6 µS cm−1 (Fig. S8). Sample sizes for linear regressions ranged from n= 9 to n= 51, primarily depending on the size of the pools (Table S4). Coefficients of determination (R2) ranged from 0.001 to 0.501, whereas regression coefficients were split with both positive (n= 7) and negative (n= 8) values (Table S4). Pools with statistically significant p-values from the regressions (n= 5) ranged from less than 0.001 to 0.0442 (Table S4). Meddybemps Heath had Gi values ranging from a minimum of 1.08 to a maximum of 4.51, with localized points of higher values in the northwestern section of the pool system (Fig. S9). The Mann-Whitney U-Test comparing the Gi values of the upgradient and downgradient populations, divided by the major axis of the pool system, produced a probability of superiority of 0.622 and p< 0.001 (Fig. S9). The probability of superiority demonstrates that Gi values in the upgradient population are statistically larger than the Gi values in the downgradient population, corresponding to the direction of lateral spreading, and the p-value shows a statistically significant difference between the two populations. The magnitude of difference between the upgradient and downgradient populations was described by a rank-biserial correlation coefficient of 0.244, representing a modest but consistent tendency towards higher Gi values in the upgradient population.
3.4 Temperature Signals from Uncrewed Aerial System (UAS) Thermal Infrared (TIR) Mapping and Handheld TIR Imaging
The five UAS TIR mapping surveys, conducted over the three pool systems, revealed distinct temperature contrasts at the surface of patterned pools. Cooler water temperatures were observed in the central and eastern portions of the pool system of Caribou Bog (Fig. 7). The surface temperature of the pool water changes substantially, especially in the center of the Caribou Bog system, where the temperature ranges from 17.0 (Fig. 7a) to 23.6 °C, with local points of cooler temperatures. Localized points of cooler water, measuring between 17.2 and 17.8 °C, are highlighted in the southeastern portion of the Caribou Bog pools, showing compelling evidence of these points feeding the pool hydraulically downgradient (Fig. 7b). The overall minimum temperature observed in the Caribou Bog pools from this TIR map was 15.3 °C (Fig. 7).
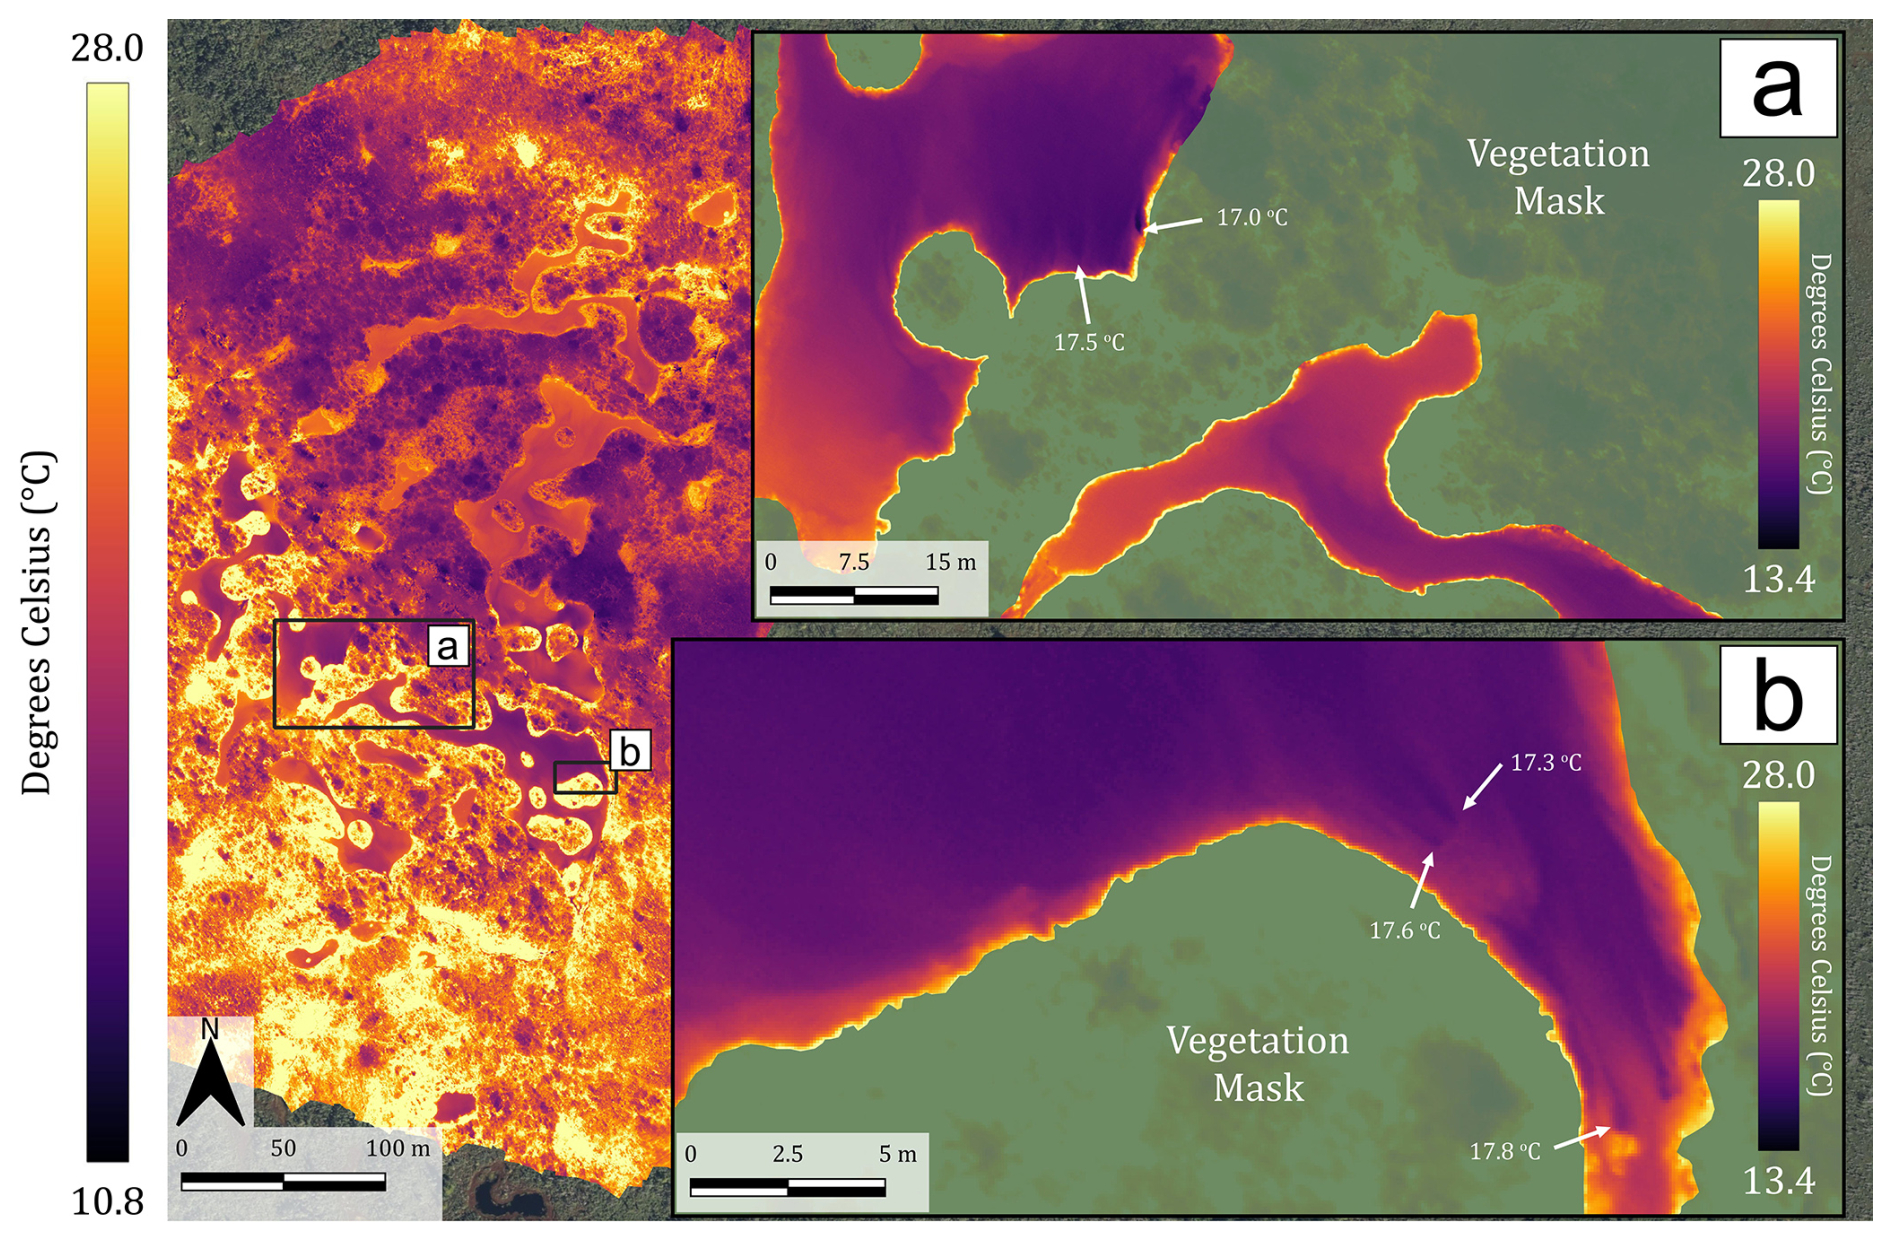
Figure 7Uncrewed aerial system (UAS) Thermal Infrared (TIR) orthomosaic map of Caribou Bog patterned pools captured on 9 June 2023, and calibrated against the thermal emissivity of water (left, 10.8 to 28.0 °C). Discrete points of cooler water are highlighted (right masked, 13.4 to 28.0 °C) in the (a) the center of the pools and (b) on the upgradient edges of the pools, highlighting localized groundwater discharge hydraulically downgradient in the direction of lateral pool spreading. The resolution of the TIR orthomosaic map is 8.09 cm pixel. Digital basemap data from © Microsoft (2024).
Temperature data collected by UAS TIR mapping in Thousand Acre Bog shows a thermal gradient originating from the hydraulically upgradient side of the pools (Fig. S10). The temperature in the upgradient northern pools of Thousand Acre Bog (Fig. S10a) increases from 22.0 to 27.1 °C moving hydraulically downgradient. Temperatures in the center of the upgradient, large western pool of Thousand Acre Bog were as low as 16.9 (circled in black, Fig. S10b) for the upgradient point and 17.3 °C (circled in black, Fig. S10b) for the more downgradient point, closer to the center of the pool.
Three UAS TIR surveys conducted in Meddybemps Heath reveal seasonal variability in the temperature observed at the surface of the pools. More minor temperature variations were observed in the Meddybemps Heath pools during the June survey, with a minimum temperature of 17.5 and a maximum temperature of 21.2 °C, yielding a range of 3.7 °C (Fig. S11). The minimum temperature was observed in the center of the Meddybemps Heath pools along the hydraulically upgradient boundary of the system, whereas the maximum temperature was observed in smaller pools along the hydraulically downgradient boundary (Fig. S11). For the August survey, cooler temperatures originate from the hydraulically upgradient, northern-most pool and central pools of the Meddybemps Heath system (Fig. S12). A minimum temperature of 18.3 °C was observed in the Meddybemps Heath northern pool, with cooler water transitioning to warmer water downgradient (Fig. S12a). A maximum temperature of 28.3 °C was recorded in the center of the Meddybemps Heath system along the downgradient side (Fig. S12). For the August survey, temperature ranged over 10.0 °C, with cooler waters hydraulically upgradient transitioning to warmer waters hydraulically downgradient of these pools (Fig. S12). Surface temperatures of the pools varied during the November survey, with a minimum temperature of −12.0 °C observed in the hydraulically upgradient north central Meddybemps Heath pools and a maximum temperature of − 0.84 °C (Fig. 8a). Localized inflows of warmer water from upgradient pools contrast strongly against the frozen surfaces of the two elongated Meddybemps Heath pools encountered downgradient (Fig. 8a). Localized temperatures of − 1.42 and − 0.84 °C in the more northern, upgradient Meddybemps Heath pool were recorded (Fig. 8a).
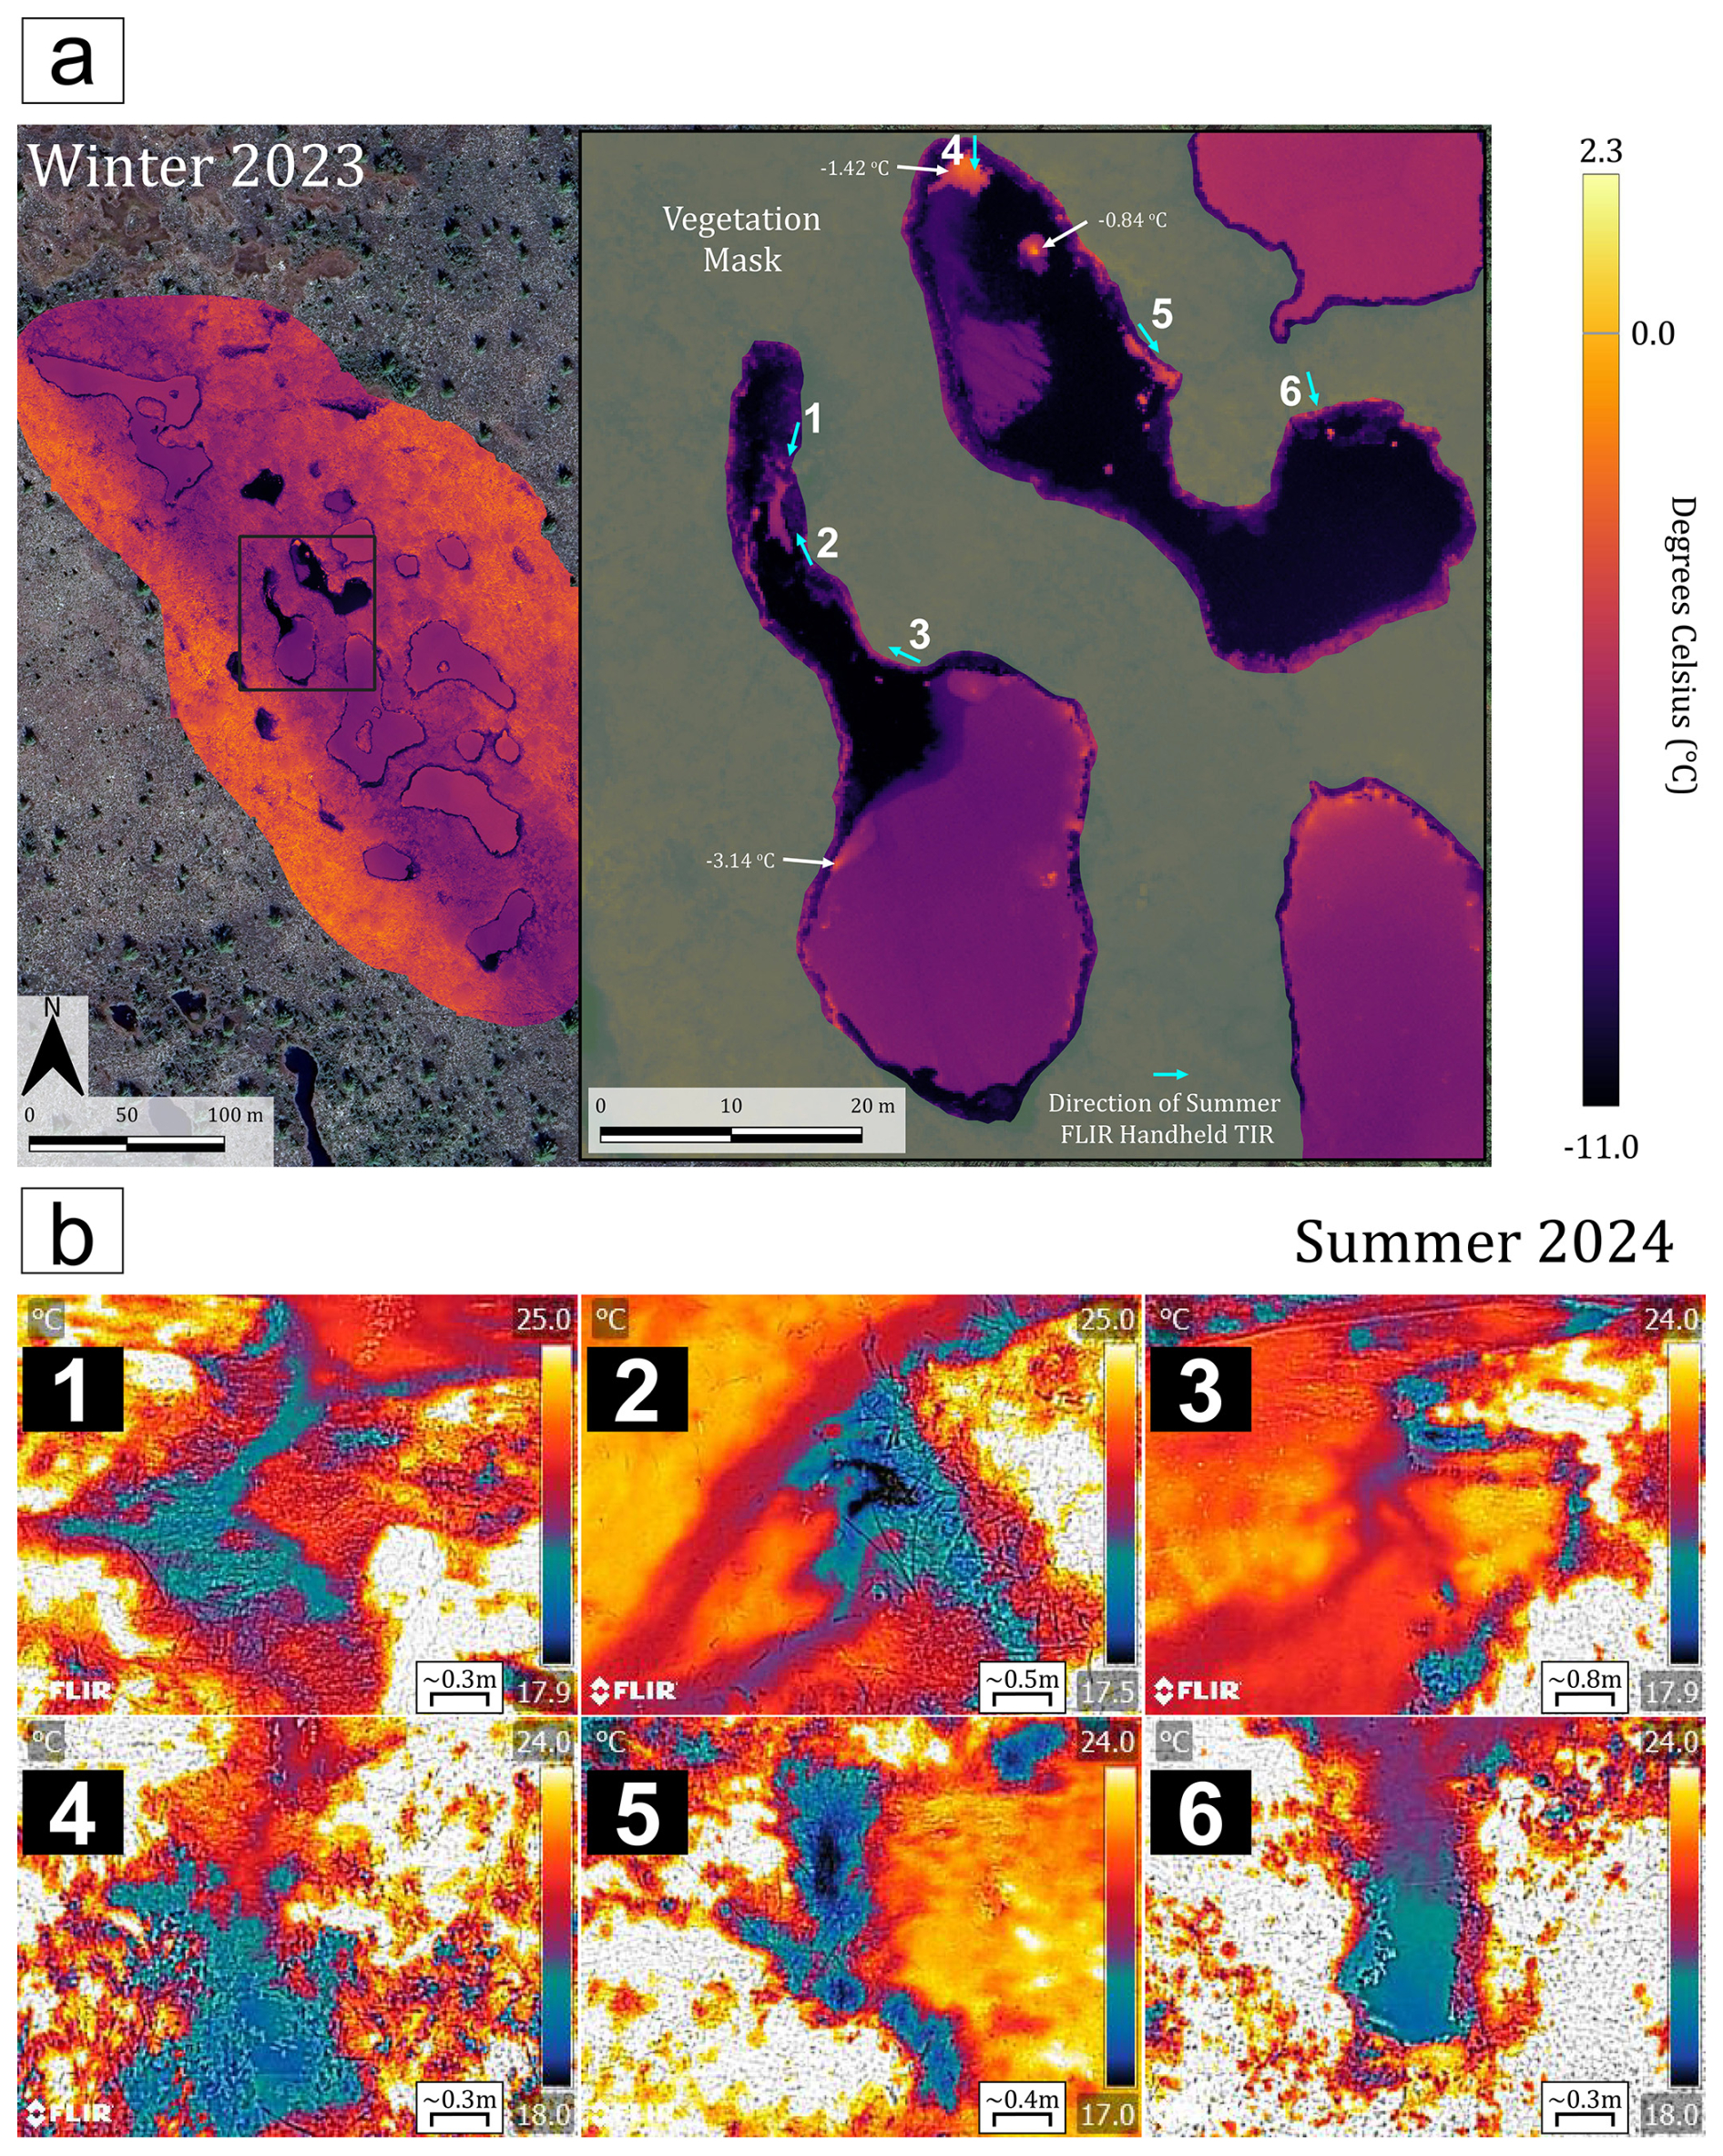
Figure 8(a) Uncrewed aerial system (UAS) Thermal Infrared (TIR) orthomosaic map of the patterned pools in Meddybemps Heath captured on 3 November 2023, and calibrated against the thermal emissivity of water (top left, − 11.0 to 2.3 °C). Points of warmer water highlight the localized discharge of groundwater to the patterned pools moving hydraulically downgradient during the winter season (top right masked, − 11.0 to 2.3 °C). Resolution of the TIR orthomosaic map is 19.1 cm pixel and basemap data was retrieved from © Microsoft (2024). (b) Handheld TIR imagery of seepage in Pool 8 imaged facing downgradient (1), imaged facing upgradient (2), imaged facing upgradient (3) and seepage in Pool 9 imaged facing upgradient (4), imaged facing downgradient (5), imaged facing downgradient (6). All imagery was captured on 6 June 2024, at previously established groundwater discharge locations of Meddybemps Heath, highlighting cooler temperature signals during the summer season.
The warmer temperature signals from the winter 2023 UAS TIR survey (Fig. 8a) correspond with the cooler temperature signals from the summer 2024 handheld TIR survey (Fig. 8b, Images 1–6), particularly in the north-central Meddybemps Heath pools. The coolest temperatures observed in the summer surveys were 17.1 °C compared to the surface water of the Meddybemps Heath pools, which measured a maximum of 24.1 °C. Discharge of cooler water to the Meddybemps Heath pools is highly focused, highlighted by the localized nature of the minimum temperatures observed in the handheld imagery (Fig. 8b).
3.5 Aqueous Geochemistry
Surface water samples collected from targeted points with high SpC and low temperature around the three raised bogs revealed high dissolved concentrations of Fe and Mn trace elements. Water samples from Caribou Bog (CB) pools showed higher concentrations of Fe and Mn clustered around the upgradient edge of the pool system (Figs. 9; S13a). A sample from the center of the pool systems (CB 2) had the minimum recorded concentration of Fe of 77.7 ppb and a low Mn concentration of 3.72 ppb (Figs. 9; S13a). Samples CB 5 and CB 7 had the highest concentration of Fe, and the CB 4 sample had the highest concentration of Mn (Figs. 9; S13a). Moving downgradient, samples CB 1, CB 9, and CB 10 had lower concentrations of Fe and Mn (Figs. 9; S13a). downgradient in the north, CB 4 had low concentrations of Fe but a higher concentration of Mn (Figs. 9; S13a).
Water samples processed from Thousand Acre Bog (TAB) indicate decreasing Fe and Mn concentrations moving downgradient to the east, towards the center of the pool system (Figs. 9; S13b). The maximum Fe concentration (72.8 ppb) was observed for TAB 8 along the upgradient edge, while the minimum concentration of Fe was found for TAB 2 along the downgradient edge, measuring 3.66 ppb (Figs. 9; S13b). Higher Fe concentrations were found for TAB 1, TAB 3, TAB 5, TAB 8, and TAB 9 water samples (Figs. 9; S13b). The maximum Mn concentration (25.8 ppb) was found in TAB 2 along the downgradient edge, while the minimum Mn concentration (0.23 ppb) was found for TAB 8 along the upgradient edge (Figs. 9; S13b). TAB 1, TAB 4, and TAB 10 were the only samples with an Mn concentration greater than 1 ppb (Figs. 9; S13b).
Higher Fe and Mn concentrations were found for samples acquired from the north-central pools of Meddybemps Heath (MH) along the upgradient edge (Figs. 9; S13c). The highest Fe concentration (292.8 ppb) was found in water at MH 8 in the center of the pools, whereas the minimum concentration (39.8 ppb) was found for MH 9 along the downgradient edge (Figs. 9; S13c). Increased concentrations of Fe were found along the upgradient boundary in the center of the pools in MH 4 (140.0 ppb) and along the downgradient boundary in the southern section of the pools in MH 10 (81.19 ppb) relative to the other samples (Figs. 9; S13c). Sample MH 10 had the maximum Mn concentration (40.1 ppb) along the downgradient boundary, while MH 1 had the minimum concentration (0.62 ppb) along the most downgradient section of the pools (Figs. 9; S13c). Altogether, the three bogs showed varying concentrations of Fe and Mn trace minerals (Fig. 9). Caribou Bog had the most consistently elevated concentrations of Fe throughout the pool system (Fig. 9). Thousand Acre Bog had Fe concentrations an order of magnitude less than the other two bogs, but Mn concentrations are similar for all three bogs (Fig. 9). Meddybemps Heath displays the greatest variation in Fe and Mn concentrations between pools, with stark variations observed in samples MH 8 and MH 10.
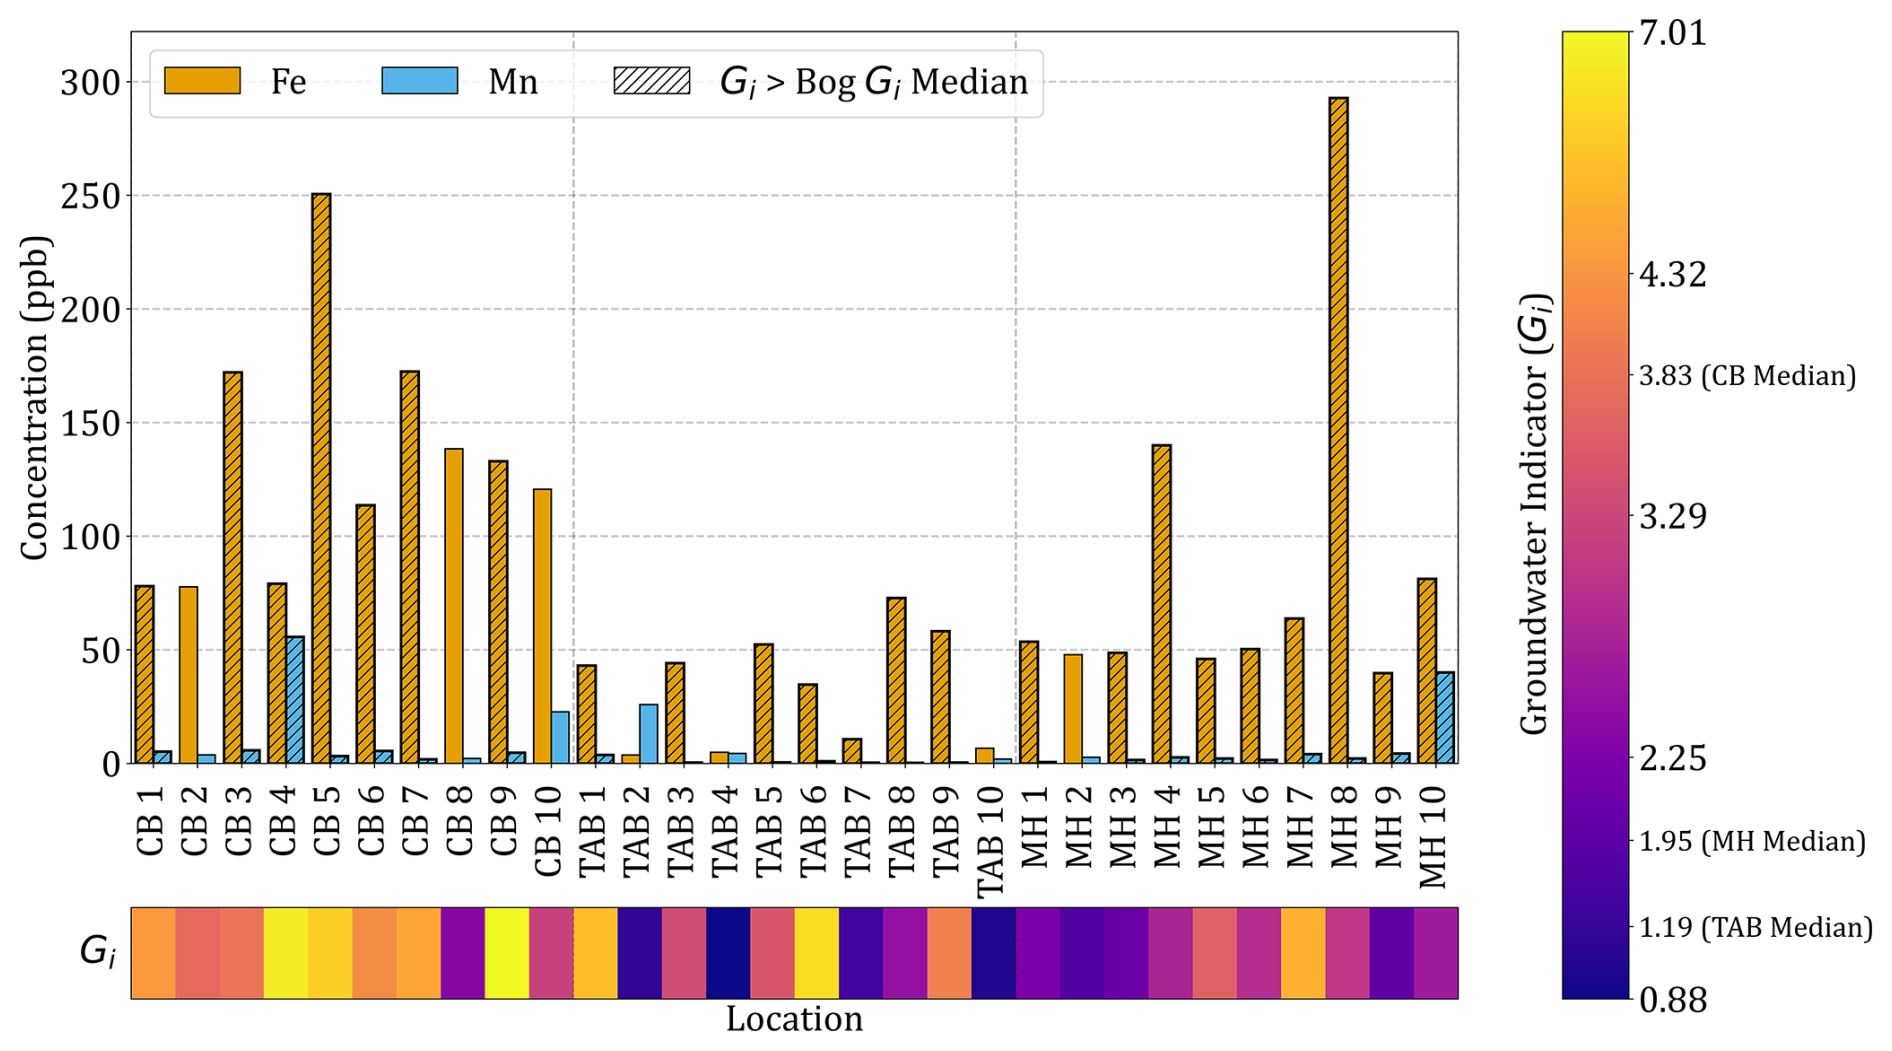
Figure 9Concentrations of iron (Fe, orange) and manganese (Mn, blue) trace elements and a heatmap of associated groundwater indicator (Gi) variables for the thirty surface water samples collected from Caribou Bog (CB), Thousand Acre Bog (TAB), and Meddybemps Heath (MH). Samples collected at zones with Gi values greater than the bog Gi median value are denoted with hatch marks to compare with associated trace element concentrations.
Evidence for focused discharges of groundwater into patterned pools found in the three regional raised northern peat bogs investigated in this study provide field insights into localized hydrological processes unaccounted for. Previous studies (i.e., Glaser, 1992; Siegel, 1992; Glaser et al., 1997) have noted the importance of the variations in the underlying mineral sediment on peat bog hydrology, but this is the first study to our knowledge that cites evidence for the potential of hydraulic connections from underlying permeable mineral sediments to the surface of patterned pools across regional raised northern peat bogs. Point temperature and SpC measurements vary substantially around the pool margins of the three patterned systems. Localized points of cooler temperature and higher SpC are observed in numerous pools during the summer season, with these pools overlying esker beads, defined as distinct mounds of sands and gravels often occurring in series (Hebrand and Åmark, 1989), as inferred from GPR and TEM data containing more electrically resistive structures. Corresponding electrical signals between the GPR and the TEM data are attributed to the subsurface structure based on the dominant ombrogenous hydrology of the bogs with low concentrations of dissolved ionic constituents in the saturating fluid (i.e., Theimer et al., 1994). The TEM surveys show intermediate electrical conductivity structures that extend with depth and spatially correspond with the interpreted eskers from the GPR data. Esker beads appear to be overlaid on topographically variable low conductivity layers that likely represent bedrock or till beneath all three bogs. Surficial vegetation patterning (Davis and Anderson, 1999) in all three bogs is shown to strongly spatially correlate with the underlying electrical structure imaged in the TEM surveys, suggesting possible hydrological controls from depth. Strong negative correlations between temperature and SpC in summer months (n= 24 for m< 0 and p< 0.05) combined with TIR images showing warmer temperature in the winter and cold temperatures in the summer are consistent with groundwater inputs. Many of the coefficients of the regression of temperature and SpC were negative, consistent with the assumed relationship of groundwater inflows to pools in summer months. Statistically significant relationships between the two variables for pools proximal to esker deposits (Tables S2; S3; S4) further support the possibility of minerogenous groundwater sourcing some of these pools. In total, 37 % of the pools sampled of the three patterned pool systems were calculated to have a statistically significant relationship between temperature and SpC. While these statistics support our hypothesis for localized groundwater inflow to pools, patterned pools remain dominated by ombrogenous water signals. Directionality of these trends is also evident based on the additional statistical analysis, with significant differences in populations and larger Gi values on the lateral spreading initiation side of each of the three systems. The larger Gi values correspond to the patterned pools where most glacial structures underlying the pools were imaged with both GPR and TEM. Correlations of the temperature and SpC variables are consistent with minerogenous groundwater sources, although we cannot eliminate the possibility of ombrogenous water circulation in the peat driving these signals. Circulation of peat pore water via flow cells driven by topography and permeability contrasts of the mineral sediments (e.g., Reeve et al., 2009) along both clay and esker sediments may lead to increased ionic constituents present in the water. Similar ranges in SpC values have been reported in previous studies (Orlova and Branfireun, 2014; Balliston et al., 2024) and are noted as a potential limitation for our defined Gi variable.
Previously, Siegel et al. (1995) suggested that precipitation events dampen minerogenous groundwater contributions from basin-scale groundwater mounds beneath raised bogs, with minerogenous groundwater only elevating towards, but never reaching, the surface during drought periods. However, further evidence of focused groundwater discharge to the patterned pools is highlighted in temperature data from UAS TIR mapping efforts occurring after major rainfall events. These surveys captured the effect of flow through the underlying aquifer (via precipitation recharge through the unsaturated zone) on the temperature signals at the surface of pools, with cooler temperature signals observed during the summer season and warmer temperature signals during the winter season. Previous estimates for the precipitation required to pressurize the underlying glaciofluvial aquifer and drive upwelling to isolated peatland pools yielded a minimum precipitation of 25.0 mm d−1, with a response in vertical hydrological flux recorded between 24 to 48 h afterwards (Moore et al., 2024). In this study, temperature responses in the TIR maps show evidence of precipitation enhancing discharge to the pools over a range of precipitation from 4.06 to a maximum of 29.0 mm d−1, and similar temporal minerogenous groundwater flowpath response. Temperature maps generated from the UAS TIR illuminate localized points of cooler water during the summer and warmer water during the winter. Handheld TIR imagery further details temperature anomalies suggesting locations of focused groundwater discharge with clear temperature gradients from the point sources into the pool surface water (Fig. 8b).
Temperature anomalies at discrete points in the TIR maps correspond to pools proximal to mineral sediment interface structures (characteristic of eskers) confirmed with geophysical imaging and with statistically significant relationships between temperature and SpC. Similar discrete points have previously been interpreted as the surficial termination of vertical, lateral, or angled peat pipes (Hare et al., 2017; Moore et al., 2024). These peat pipes may act as dominantly vertical preferential hydrologic pathways for ombrogenous water circulating in the peat matrix or minerogenous groundwater originating from glacial sediments. Digital images of peat pipes were captured at some locations characterized by SpC temperature signals indicative of minerogenous groundwater discharge in all three investigated bogs (Fig. S14). The peat thicknesses of raised bogs in our study were measured using GPR and ranged from 1.8 to 7.9 m. Rossi et al. (2012) reported vertical peat pipes occurring up to 8 m in depth over esker structures, and we therefore hypothesize that similar vertical peat pipes exist within our study area. However, the data collected are unable to discern the orientation of such peat pipes within the larger peat matrix. Peat pipes have previously been documented as dominantly lateral conveyances of water within the peat matrix (Belyea and Lancaster, 2002; Belyea and Baird, 2006). In the peat matrix, previous studies show evidence for larger horizontal K values than vertical K values and decreasing K with depth in the laboratory and field settings (Beckwith et al., 2003a, b; Rezanezhad et al., 2010). This could suggest that temperature signals from discrete points in TIR maps and imagery over the pools may also originate from lateral flow induced by surface topography of the bogs.
Peat thickness also appears to correlate with the groundwater signals, with thinner peat deposits over glacial structures (i.e. Caribou Bog) generally corresponding to higher Gi values and stronger TIR temperature gradients. Conversely, thicker peat deposits over glacial structures (i.e. Meddybemps Heath) generally correspond with lower Gi values and weaker TIR temperature gradients. The GPR data also yielded insights into the clay confining layers that prevent the exchange of ombrogenous peat pore water with minerogenous groundwater in the three raised bogs. Reflection patterns from the base of Caribou Bog have been previously used to differentiate glaciomarine clay (Presumpscot Formation, local to the area) (Thompson and Borns, 1985) from beaded eskers (Comas et al., 2011). Reflections from the base of Meddybemps Heath (e.g., Fig. S4: Transect D) are similar, as might be expected given that this raised bog also falls within the bounds of the mapped transgressional limit of the glacio-marine clay (Thompson and Borns, 1985). Interpretation of the GPR data from Meddybemps Heath is further corroborated by past coring efforts (Cameron et al., 1984). Reflectors along the base of Thousand Acre Bog differ, with greater penetration of the EM wave in certain areas. This may indicate glacial sand or gravel (e.g., eskers) embedded between other clays in contact with peat matrix, consistent with the coring cross sections by Cameron (1975), who noted the presence of sand and gravel lenses beneath the bog. The location of Thousand Acre Bog north of the transgressional limit of the Presumpscot Formation likely explains the different mineral sediment interface reflections in the GPR profiles for this bog. Multiple sections of greater EM wave penetration, interpreted as glacial sands and gravels, are observed in the western and eastern sections of the pool system (Figs. 2; S2). Further, the width of imaged beads is consistent with mapped surficial esker/gravel units to the east of the northern raised peat bog (Fig. 1). A mineral sediment interface geometry consistent with an esker bead is also observed north of the pools in Meddybemps Heath (Figs. S3; S4). Additional mineral sediment interface structures exist in the GPR profiles from Meddybemps Heath (Figs. S3; S4) but are poorly imaged due to the greater burial depths.
These structures are shown to extend with depth in the intermediate electrical conductivity layers of the TEM surveys, with lateral widths consistent with the expected esker geometries. Conductivity data from the TEM surveys also show significant lateral variations in the underlying low conductivity layer, likely to be bedrock and/or till. This low conductivity layer may serve as another hydraulic boundary for the esker systems above and the variations in layer topography could change flowpaths within the glaciofluvial aquifer. Intermediate electrical conductivity layers are shown to laterally angle towards the center of the bogs (Figs. 3, 4, 5), potentially allowing flow through the confined glaciofluvial aquifer towards ridges embedded within the clays. Significant changes in the interpreted glaciofluvial aquifer slope are observed to correspond with shallower, low conductivity structures beneath the intermediate electrical conductivity layer. Such changes to the slope could drive the upwelling of minerogenous groundwater through permeable lenses of esker ridges underlying the pools in the bogs. The TEM data highlight the importance of understanding the underlying hydrogeologic structure beneath bogs. Within all three raised bogs, geoelectric structures consistent with eskers are observed along edges of the pool systems and do not exist beneath all pools. Pools underlain by distinct mineral sediment interface structures that extend with depth are spatially associated with statistically significant temperature versus SpC relationships.
Lateral temperature gradients and anomalies across pools captured by UAS TIR maps may provide evidence of lateral peat pipe connections between the pools. Glaser et al. (1981) observed similar infrared patterns in open waters of a patterned mire, with a gradient of cooler water to warmer water in the summer consistent with the direction of water flow at the surface. Hydraulic gradient models of the patterned pools in all three bogs (Chen et al., 2020; Fig. S15) agree well with the temperature gradients observed across the surfaces of the pools. Temperature gradients between pools may indicate hydraulic connections via lateral, vertical, or combined peat pipes, as temperature and SpC signals indicative of groundwater from depth extend beyond pools directly underlain by variations in the mineral sediment interface (Figs. 7; 8; S10; S11; S12). Upwelling groundwater could enhance the flooding of hummocks and lead to enhanced lateral expansion of patterned pools. Inflows of groundwater appear to mix with peat pore water and subsequently move downgradient following local microtopography to supply other pools within the patterned system.
Concentrations of Fe and Mn, typical of glacial aquifers characterized by Groschen et al. (2009), may suggest that minerogenous groundwater could be plumbed from an underlying glacial aquifer through the peat matrix to discharge in and around the pools. Caribou Bog and Meddybemps Heath contained similar concentrations of these trace elements, suggesting related hydrogeologic origins of the upwelling groundwater. The sampled pools in Thousand Acre Bog had lower concentrations of Fe than the other two pool systems, which may partly be attributed to point discharges occurring towards the center of pools (not sampled for aqueous chemistry) as indicated by UAS TIR maps. The highest concentrations of Fe were observed in pools underlain by interpreted esker deposits and showed strong inverse relationships between temperature and SpC. However, CB 4, TAB 2, and MH 10 water samples contained high levels of Mn despite being located away from interpreted groundwater-fed pools. This could support previous ideas of lateral transmissivity through the pools (i.e., Quinton and Roulet, 1998; Spence and Woo, 2003; McCarter and Price, 2017), or potentially plumbing groundwater not only vertically but also laterally throughout pool systems. Given the complexity of the redox reactions occurring in peat bogs, the aqueous geochemistry could also indicate deeper circulation of ombrogenous peat pore water. Similar or higher concentrations of Fe and Mn have been reported in pools in bogs (Chauhan et al., 2024; Osborne et al., 2024) suggesting potential autogenic sourcing of these trace elements.
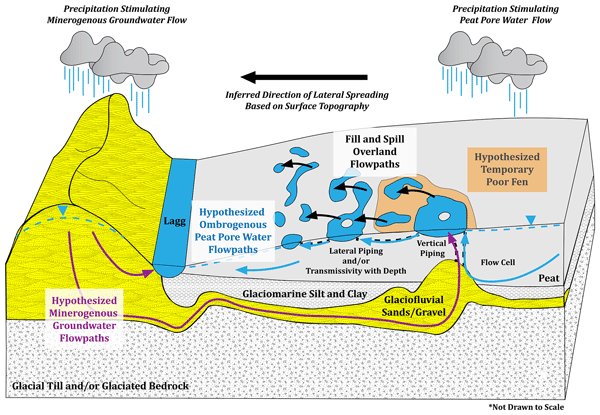
Based on the results of this study, we propose a conceptual model exploring groundwater-influenced pool formation and spreading based on internal peat pore water circulation and the potential hydraulic connectivity to the underlying glaciofluvial aquifer indicators of groundwater from depth include (a) proximity to underlying mineral sediments transmissive to the EM signals of both GPR and TEM surveys, (b) statistically significant (p< 0.05), linear relationships between temperature and SpC consistent with minerogenous groundwater inflows (primarily an inverse relationship between temperature and SpC in summer months), (c) changes in the temperature signal, observed in point measurements and TIR imagery directly following significant precipitation, (d) discrete zones of water with a different temperature signal than the surrounding surface water, identified in UAS TIR maps and (e) elevated concentrations of Fe and Mn trace elements. Potential groundwater flowpaths through the glaciofluvial aquifer and peat matrix are depicted conceptually in Fig. 10.
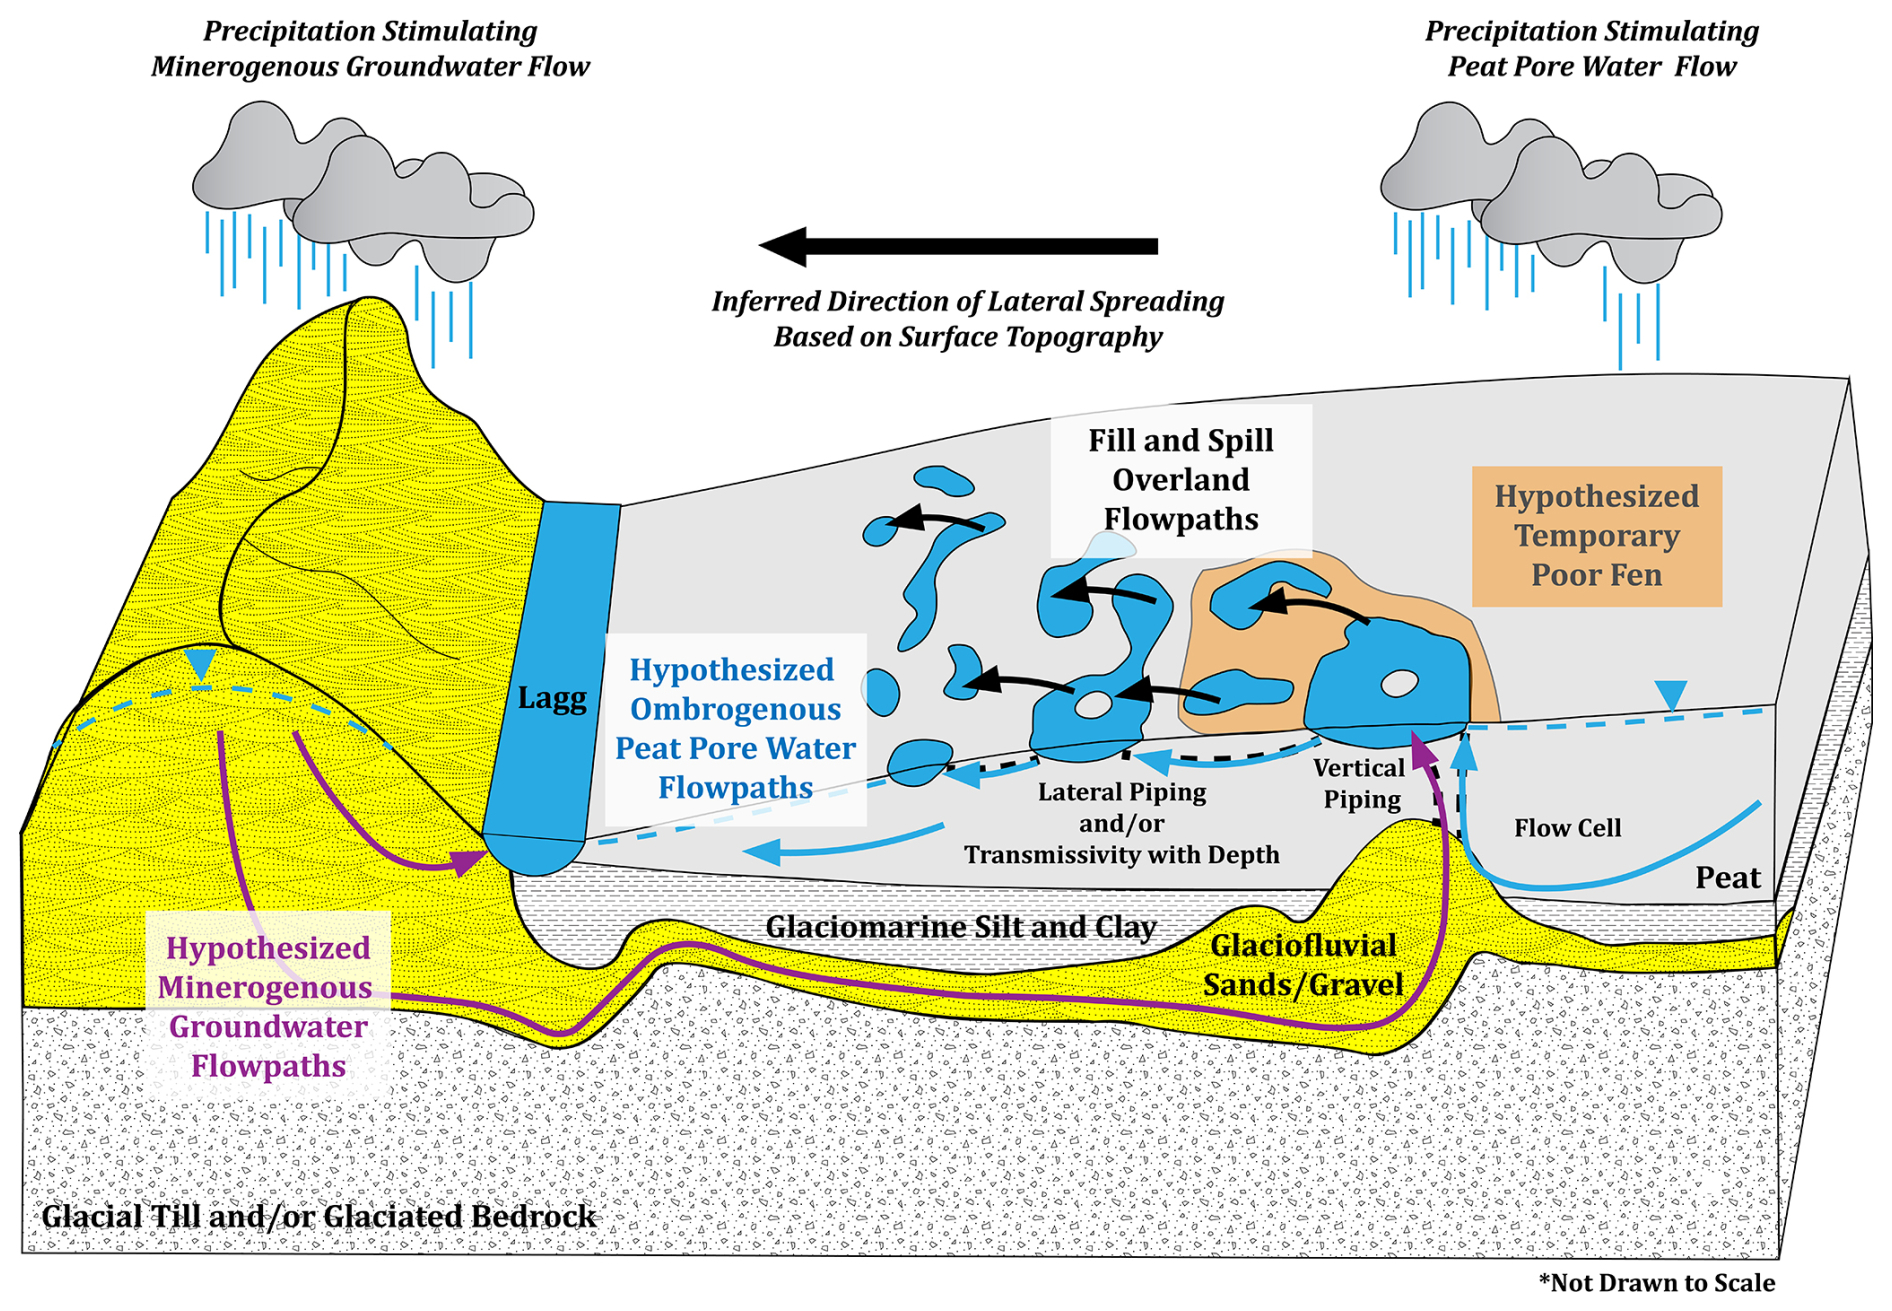
Figure 10Conceptual hydrogeologic model of ombrogenous and minerogenous flows to patterned pools, Precipitation is shown to stimulate both ombrogenous and minerogenous groundwater flowpaths. Shallow minerogenous groundwater flowpaths would discharge to the lagg in the system. The deepest minerogenous groundwater flowpaths occur through the glaciofluvial aquifer and result in vertical flows to pools immediately above or adjacent to the aquifer connection. Minerogenous groundwater contributions to pools would result in a temporary change in peatland type. Ecology on the surface may potentially show characteristics of a poor fen around pools local to the esker. Ombrogenous flow cells of peat pore water (Reeve et al., 2009) are shown to originate from the center of the bog, driven by the topography and permeability of the underlying mineral sediments, causing vertical flow to the pool immediately above or adjacent to the esker. Both forms of vertical flux to the pools would result in enhanced lateral transmissivity via piping or peat matrix flow in the subsurface. Additionally, when the pools up topographic gradient reach storage capacity, fill and spill overland flow may also be observed between pools. These chain reactions in changes of flow would subsequently enhance lateral spreading of the pool system.
The conceptual hydrogeologic model (Fig. 10) highlights the important influence of the topographic variability in the underlying till and/or bedrock bounding the glaciofluvial aquifer. Minerogenous groundwater is otherwise discharged to the lagg bounding the raised bog via shallower groundwater flowpaths, commonly regarded as the only place for this water to discharge. Topographic variability is likely an effect of the glaciation that occurred across the state of Maine during the last ice age, resulting in highly variable glacial erosion of regional bedrock (Shreve, 1985; Thompson and Borns, 1985). Changes in the slope of the glaciofluvial aquifer provide the basis for deep minerogenous groundwater flowpaths to exist with the potential for hydraulic connections to reach the pools at the surface of these northern raised peat bogs. These pools are visibly surrounded by denser vegetation relative to the rest of the bog (Comas et al., 2004), suggesting minerogenous groundwater inputs could provide temporary changes in the peatland type. Limited minerogenous groundwater inputs correspond well with the observed upwelling signals captured dependent upon the precipitation. Reeve et al. (2009) also highlights the ability of ombrogenous peat pore water flow cells to form based on the topography and permeability contrasts of the underlying mineral sediments surrounding esker structures. This could also stimulate vertical flow to the pools above or adjacent to the esker structures, resulting in data indicating groundwater. Upwelling of both minerogenous groundwater and deeper peat pore water may alter lateral flow processes through the pools. As the vertical flux to pools underlain by eskers increases, lateral transmissivity between pools will increase via lateral peat pipes (i.e., Belyea and Baird, 2006) or lateral peat matrix flow (i.e., Belyea, 2007). If the storage capacity of these pools is exceeded by these vertical fluxes, fill and spill overland flow may be observed between pools (i.e., Balliston and Price, 2022).
Long-term hydrological well data from wells instrumented at shallow depths between 1.10 and 1.30 m and one instrumented deeper at 7.4 m, show distinct responses to the precipitation events (Figs. S16; S17). Observation well MB2 highlights significant gains in hydraulic head from the start of 9 to 11 August 2024 (Figs. S16; S17). Hydraulic head in well MB2 rapidly increases compared to observation well MB1 on 11 August 2024, 49.5 h following the initial precipitation event (Fig. S16) (NOAA, 2024). However, the hydraulic head measured between well MB5 and MB2 shows downwelling to the southeast (Figs. S16; S17), contradicting the hydrogeophysical observations made in the pools adjacent to the hydraulic transect between these wells. Future targeted hydrological monitoring efforts based on hydrogeophysical data could yield further insight into localized changes in the hydraulic gradient driven by underlying mineral sediment stratigraphy.
Despite these contradictions, our conceptual model remains consistent with previously established concepts that: (1) patterned pool size decreases radially from the focal point of the patterned pool initiation (Glaser and Janssens, 1986; Foster and Fritz, 1987), (2) minerogenous and ombrogenous water sources, dependent on the underlying mineral sediment, create variability in types of peatlands (Glaser, 1992), (3) lateral spreading controls patterned pool formation in raised bogs (Belyea and Lancaster, 2002), (4) hydraulic connections to regional groundwater aquifers underlying the raised bogs exist (Glaser et al., 1997), (5) fill and spill dynamics occur when pools reach storage capacity (Quinton and Roulet, 1998; Spence and Woo, 2003; McCarter and Price, 2017). If vertical inflows to pools are minerogenous, there may be implications for the hydrology, ecology, and geochemistry of raised peat bogs. Inputs of TEAs from minerogenous groundwater have implications for the redox state of the peat matrix that is traditionally considered methanogenic. A wetter climate with more intense rainfall (Trenberth, 2011), could result in greater fluxes of these trace elements into the raised bogs and thus influence carbon sequestration and methane cycling, with the inverse also holding true. We recognize that the water balance of the raised bogs is predominantly controlled by rainfall, otherwise these systems with low concentrations of ionic constituents would not be established in the first place. Our findings suggest that localized points of discharge might have considerable (while temporary in this case) effects on the hydrology and biogeochemistry of patterned pools. Exchange zones of ionic constituents from minerogenous groundwater entering other surface water bodies have been shown to disproportionally affect the hydrology of these systems (Brunke and Gonser, 1997; Winter et al., 1998; Hare et al., 2021; Olid et al., 2022). Our findings suggest that ombrogenous peat bogs are influenced in the same way by upwelling, possibly through the formation of peat pipes from depth that may enhance pool formation. Previous studies also suggest that the hydraulic interaction between peatlands and glaciofluvial aquifers locally alters vertical groundwater flow patterns in peatlands (e.g., Rossi et al., 2012; Ala-aho, 2014; Berthot et al., 2016; Quillet et al., 2017; Lambert et al., 2022).
Future research should target the origin of these TEAs from peat pipes or macropores facilitating preferential flow to the pools. We recognize the limitations of this study with the use of non-conservative trace elements of Fe and Mn to trace groundwater potentially originating from the underlying glacial aquifer. The presence of organic, acidic bog environments could alter the concentrations of these trace elements observed in the samples, potentially explaining the more variable results observed in this study. This warrants additional inquiry using other tracers, such as stable isotopes or environmental radon, in future studies to more confidently delineate groundwater sources to the pools. While the use of temperature and SpC have been consistently used to track groundwater discharge as a snapshot in time (e.g., Hayashi, 2004; Anderson, 2005; Cox et al., 2007), additional hydrological parameters (such as pH, dissolved oxygen, dissolved inorganic carbon, etc.) could be considered to further develop the Gi variable in future studies with prolonged sampling periods. Exploration into the presence, spatial orientation, and extent with depth of peat pipes also serves as an exciting new avenue for further research in understanding preferential flow to the surface of bogs. Implementing induced polarization to separate the contributions of the electrolytic conductivity component and the surface conductivity component to the bulk electrical conductivity could serve to further delineate these groundwater flowpaths from depth in future studies. Targeted deployments of piezometers or wells in the esker deposits beneath the bogs and in esker deposits in nearby surficial esker deposits could yield further insights into the hydrological responses of these systems. These measures will serve to test and improve the conceptual hydrological model presented based on the observations made in this study. Finally, the impacts of such preferential flows on carbon-cycling in the peat matrix should be explored to understand potential links between localized groundwater upwelling and carbon ebullition in pools.
Temperature and SpC data from this study suggest raised northern peat bog pools receive vertical groundwater inflows across three bog systems. These inflows spatially correspond to variations in the underlying mineral sediment, imaged using GPR and TEM surveys, which may promote upwelling from the underlying glaciofluvial aquifer or peat pore water flow cells. Variations in temperature, SpC, and trace mineral concentrations in pools suggest that groundwater is plumbed upwards through the peat matrix via preferential peat piping. Imagery from UAS TIR mapping and handheld TIR indicate the termination of this plumbing at the surface of the pools as localized discharge zones, indicated by cooler minerogenous groundwater in the summer, and warmer minerogenous groundwater in the winter. Periods of local precipitation may pressurize the underlying glaciofluvial aquifer or drive amplified peat pore water flow from depth, with enhanced temperature and SpC signals observed in pools immediately following these periods. Differences in water temperature at localized points during summer and winter seasons further reinforce the interpretation of upwelling to patterned pools. Localized minerogenous inflows to raised bogs may have other consequences, with changes in the geochemical state of the peat matrix influencing peat degradation, pool formation, and carbon cycling.
Data have been made available publicly via the Hydroshare repository at: http://www.hydroshare.org/resource/8877eb61207c4ae28b66231b450efa0d (Moore et al., 2024).
The supplement related to this article is available online at https://doi.org/10.5194/hess-30-4587-2026-supplement.
HEM: Conceptualization, Data Curation, Formal Analysis, Investigation, Methodology, Project Administration, Supervision, Validation, Visualization, Writing (original draft preparation), Writing (review and editing). XC: Conceptualization, Data Curation, Funding Acquisition, Investigation, Methodology, Project Administration, Resources, Supervision, Writing (review and editing). MAB: Conceptualization, Methodology, Resources, Supervision, Validation, Writing (review and editing). ASR: Conceptualization, Data Curation, Funding Acquisition, Investigation, Project Administration, Resources, Supervision, Validation, Writing (review and editing). KMNA: Formal Analysis, Investigation, Methodology, Writing (review and editing). LS: Conceptualization, Funding Acquisition, Investigation, Methodology, Project Administration, Resources, Supervision, Validation, Writing (review and editing).
The contact author has declared that none of the authors has any competing interests.
Publisher's note: Copernicus Publications remains neutral with regard to jurisdictional claims made in the text, published maps, institutional affiliations, or any other geographical representation in this paper. The authors bear the ultimate responsibility for providing appropriate place names. Views expressed in the text are those of the authors and do not necessarily reflect the views of the publisher.
This material is based upon work supported by the National Science Foundation under Grant Number 2152119. Any use of trade, firm, or product names is for descriptive purposes only and does not imply endorsement by the U.S. Government. The authors thank Nicolette Filippone, Joshua Thompson, Alexander Avelar, Klaudio Peshtani, Victoria Niedzinski, Shelley Pierce, Asyra Arceneaux, and Raymond Hess for their assistance with collecting these data in the field. Appreciation from the authors is extended to Scott Ducar for his time reviewing this manuscript. Further, the authors would like to thank the University of Maine (Caribou Bog), The Nature Conservancy of Maine (Thousand Acre (Crystal) Bog), and the Passamaquoddy Tribe (Meddybemps Heath) for land access to the respective raised northern peat bogs. This manuscript was improved thanks to the peer reviewer feedback provided by Eric Rosa, Efemena Emmanuel, and an Anonymous Reviewer.
This research has been supported by the National Science Foundation (grant no. 2152119).
This paper was edited by Genevieve Ali and reviewed by Eric Rosa, Efemena Emmanuel, and Erwin Don Racasa.
Ala-aho, P.: Groundwater–surface water interactions in esker aquifers: From field measurements to fully integrated numerical modelling, PhD thesis, University of Oulu, Oulu, Finland, https://oulurepo.oulu.fi/bitstream/handle/10024/35828/isbn978-952-62-0658-5.pdf?sequence=1 (last access: 6 July 2026), 2014.
Anderson, M. P.: Heat as a ground water tracer, Ground Water, 43, 951–968, https://doi.org/10.1111/j.1745-6584.2005.00052.x, 2005.
Balliston, N. and Price, J. S.: Beyond fill and spill: Hydrological connectivity in a sub-arctic bog-fen-tributary complex in the Hudson Bay Lowlands, Canada, Hydrol. Process., 36, e14575, https://doi.org/10.1002/hyp.14575, 2022.
Balliston, N., Sutton, O., and Price, J.: Solute depletion and reduced hydrological connectivity in subarctic patterned peatlands disturbed by mine dewatering, Sci. Total Environ., 913, 169442, https://doi.org/10.1016/j.scitotenv.2023.169442, 2024.
Beckwith, C. W., Baird, A. J., and Heathwaite, A. L.: Anisotropy and depth-related heterogeneity of hydraulic conductivity in a bog peat, I: Laboratory measurements, Hydrol. Process., 17, 89–101, https://doi.org/10.1002/hyp.1116, 2003a.
Beckwith, C. W., Baird, A. J., and Heathwaite, A. L.: Anisotropy and depth-related heterogeneity of hydraulic conductivity in a bog peat, II: Modelling the effects on groundwater flow, Hydrol. Process., 17, 103–113, https://doi.org/10.1002/hyp.1117, 2003b.
Belyea, L. R.: Climatic and topographic limits to the abundance of bog pools, Hydrol. Process., 21, 675–687, https://doi.org/10.1002/hyp.6275, 2007.
Belyea, L. R. and Baird, A. J.: Beyond “The limits to peat bog growth”: Cross-scale feedback in peatland development, Ecol. Monogr., 76, 299–322, https://doi.org/10.1890/0012-9615(2006)076[0299:BTLTPB]2.0.CO;2, 2006.
Belyea, L. R. and Lancaster, J.: Inferring landscape dynamics of bog pools from scaling relationships and spatial patterns, J. Ecol., 90, 223–234, https://doi.org/10.1046/j.1365-2745.2001.00647.x, 2002.
Berthot, L., Pinti, D. L., Larocque, M., Gagné, S., Ferlatte, M., and Cloutier, V.: Exploring 222Rn as a tool for tracing groundwater inflows from eskers and moraines into slope peatlands of the Amos region of Quebec, Canada, J. Environ. Radioactiv., 164, 344–353, https://doi.org/10.1016/j.jenvrad.2016.07.038, 2016.
Boatman, D. J., Goode, D. A., and Hulme, P. D.: The Silver Flowe, III: Pattern development on Long Loch B and Craigeazle mires, J. Ecol., 69, 897–918, https://doi.org/10.2307/2259644, 1981.
Borns Jr., H. W.: Preliminary report on the age and distribution of the late Pleistocene ice in north-central Maine, Am. J. Sci., 261, 738–740, https://doi.org/10.2475/ajs.261.8.738, 1963.
Bourgault, M.-A., Larocque, M., and Garneau, M.: How do hydrogeological setting and meteorological conditions influence water table depth and fluctuations in ombrotrophic peatlands?, J. Hydrol. X, 4, 100032, https://doi.org/10.1016/j.hydroa.2019.100032, 2019.
Brunke, M. and Gonser, T.: The ecological significance of exchange processes between rivers and groundwater, Freshwater Biol., 37, 1–33, https://doi.org/10.1046/j.1365-2427.1997.00143.x, 1997.
Cameron, C. C.: Some peat deposits in Washington and southeastern Aroostook Counties, Maine, U.S. Geol. Surv. Bull., 1317-C, 1–26, https://doi.org/10.3133/b1317C, 1975.
Cameron, C. C., Mullen, M. K., Lepage, C. A., and Anderson, W. A.: Peat Resources of Maine, Volume 5: Washington County, Maine Geol. Surv. Bull., 32, 143 pp., 1984.
Chauhan, A., Patzner, M. S., Bhattacharyya, A., Borch, T., Fischer, S., Obst, M., ThomasArrigo, L. K., Kretzschmar, R., Mansor, M., Bryce, C., Kappler, A., and Joshi, P.: Interactions between iron and carbon in permafrost thaw ponds, Sci. Total Environ., 946, 174321, https://doi.org/10.1016/j.scitotenv.2024.174321, 2024.
Chen, X., Comas, X., Reeve, A. S., and Slater, L. D.: Evidence for glacial geological controls on the hydrology of Maine (USA) peatlands, Geology, 48, 771–776, https://doi.org/10.1130/G46844.1, 2020.
Comas, X. and Slater, L. D.: Low-frequency electrical properties of peat, Water Resour. Res., 40, W12414, https://doi.org/10.1029/2004WR003534, 2004.
Comas, X., Slater, L. D., and Reeve, A. S.: Geophysical evidence for peat basin morphology and stratigraphic controls on vegetation observed in a northern peatland, J. Hydrol., 295, 173–184, https://doi.org/10.1016/j.jhydrol.2004.03.008, 2004.
Comas, X., Slater, L. D., and Reeve, A. S.: Stratigraphic controls on pool formation in a domed bog inferred from ground-penetrating radar (GPR), J. Hydrol., 315, 40–51, https://doi.org/10.1016/j.jhydrol.2005.04.020, 2005.
Comas, X., Slater, L. D., and Reeve, A. S.: Pool patterning in a northern peatland: Geophysical evidence for the role of postglacial landforms, J. Hydrol., 399, 173–184, https://doi.org/10.1016/j.jhydrol.2010.12.031, 2011.
Constantz, J.: Heat as a tracer to determine streambed water exchanges, Water Resour. Res., 44, W00D10, https://doi.org/10.1029/2008WR006996, 2008.
Cox, M. H., Su, G. W., and Constantz, J.: Heat, chloride, and specific conductance as ground water tracers near streams, Ground Water, 45, 187–195, https://doi.org/10.1111/j.1745-6584.2006.00276.x, 2007.
Davis, R. B. and Anderson, D. S.: The Eccentric Bogs of Maine: A Rare Wetland Type in the United States, Maine State Planning Office, Critical Areas Program, Planning Rep. 93, Tech. Bull. 146, https://www.cabidigitallibrary.org/doi/full/10.5555/19921966477 (last access: 16 May 2024), 1991.
Davis, R. B. and Anderson, D. S.: A numerical method and supporting database for evaluation of Maine peatlands as candidate natural areas, Maine Agric. For. Exp. Stn. Tech. Bull., 175, 68–175, 1999.
Erickson, M. L., Yager, R. M., Kauffman, L. J., and Wilson, J. T.: Drinking water quality in the glacial aquifer system, northern USA, Sci. Total Environ., 694, 133735, https://doi.org/10.1016/j.scitotenv.2019.133735, 2019.
Foster, D. R. and Fritz, S. C.: Mire development, pool formation, and landscape processes on patterned fens in Dalarna, central Sweden, J. Ecol., 75, 409–437, https://doi.org/10.2307/2260426, 1987.
Foster, D. R. and Glaser, P. H.: The raised bogs of south-eastern Labrador, Canada: Classification, distribution, vegetation and recent dynamics, J. Ecol., 74, 47–71, https://doi.org/10.2307/2260348, 1986.
Foster, D. R. and Wright Jr., H. E.: Role of ecosystem development and climate change in bog formation in central Sweden, Ecology, 71, 450–463, https://doi.org/10.2307/1940300, 1990.
Foster, D. R., King, G. A., Glaser, P. H., and Wright Jr., H. E.: Origin of string patterns in boreal peatlands, Nature, 306, 256–258, https://doi.org/10.1038/306256a0, 1983.
Foster, D. R., Wright Jr., H. E., Thelaus, M., and King, G. A.: Bog development and landform dynamics in central Sweden and south-eastern Labrador, Canada, J. Ecol., 76, 1164–1185, https://doi.org/10.2307/2260641, 1988.
Glaser, P. H.: Vegetation and water chemistry, in: Patterned Peatlands of Northern Minnesota, edited by: Wright Jr., H. E. and Coffin, B. A., University of Minnesota Press, Minneapolis, MN, USA, 15–26, ISBN 9781452903057, 1992.
Glaser, P. H. and Janssens, J. A.: Raised bogs in eastern North America: Transitions in landforms and gross stratigraphy, Can. J. Bot., 64, 395–415, https://doi.org/10.1139/b86-056, 1986.
Glaser, P. H., Wheeler, G. A., Gorham, E., and Wright Jr., H. E.: The patterned mires of the Red Lake Peatland, northern Minnesota: Vegetation, water chemistry, and landforms, J. Ecol., 69, 575–599, https://doi.org/10.2307/2259685, 1981.
Glaser, P. H., Siegel, D. I., Romanowicz, E. A., and Shen, Y. P.: Regional linkages between raised bogs and the climate, groundwater, and landscape of north-western Minnesota, J. Ecol., 85, 3–16, https://doi.org/10.2307/2960623, 1997.
Gorham, E.: The development of peatlands, Q. Rev. Biol., 32, 145–166, https://doi.org/10.1086/401755, 1957.
Groschen, G. E., Arnold, T. L., Morrow, W. S., and Warner, K. L.: Occurrence and distribution of iron, manganese, and selected trace elements in ground water in the glacial aquifer system of the northern United States, U.S. Geol. Surv. Sci. Investig. Rep., 2009–5006, 89 pp., 2009.
Hare, D. K., Boutt, D. F., Clement, W. P., Hatch, C. E., Davenport, G., and Hackman, A.: Hydrogeological controls on spatial patterns of groundwater discharge in peatlands, Hydrol. Earth Syst. Sci., 21, 6031–6048, https://doi.org/10.5194/hess-21-6031-2017, 2017.
Hare, D. K., Helton, A. M., Johnson, Z. C., Lane, J. W., and Briggs, M. A.: Continental-scale analysis of shallow and deep groundwater contributions to streams, Nat. Commun., 12, 1450, https://doi.org/10.1038/s41467-021-21651-0, 2021.
Hayashi, M.: Temperature–electrical conductivity relation of water for environmental monitoring and geophysical data inversion, Environ. Monit. Assess., 96, 119–128, https://doi.org/10.1023/B:EMAS.0000031719.83065.68, 2004.
Hebrand, M. and Åmark, M.: Esker formation and glacier dynamics in eastern Skåne and adjacent areas, southern Sweden, Boreas, 18, 67–81, https://doi.org/10.1111/j.1502-3885.1989.tb00372.x, 1989.
Holden, J. and Burt, T. P.: Piping and pipeflow in a deep peat catchment, Catena, 48, 163–199, https://doi.org/10.1016/S0341-8162(01)00189-8, 2002.
Holden, J., Burt, T. P., and Cox, N. J.: Macroporosity and infiltration in a blanket peat: The implications of tension disc infiltrometer measurements, Hydrol. Process., 15, 289–303, https://doi.org/10.1002/hyp.93, 2001.
Ingram, H. A. P.: Size and shape in raised mire ecosystems: A geophysical model, Nature, 297, 300–303, https://doi.org/10.1038/297300a0, 1982.
Lambert, C., Larocque, M., Gagné, S., and Garneau, M.: Aquifer–peatland hydrological connectivity and controlling factors in boreal peatlands, Front. Earth Sci., 10, 835817, https://doi.org/10.3389/feart.2022.835817, 2022.
Lyford, F. P., Stone, J. R., Nielsen, J. P., and Hansen, B. P.: Geohydrology and ground-water quality, Eastern Surplus Superfund Site, Meddybemps, Maine, U.S. Geol. Surv. Water-Resour. Investig. Rep., 98–4174, 76 pp., 1998.
Lowry, C. S., Fratta, D., and Anderson, M. P.: Ground-penetrating radar and spring formation in a groundwater-dominated peat wetland, J. Hydrol., 373, 68–79, https://doi.org/10.1016/j.jhydrol.2009.04.023, 2009.
McCarter, C. P. R. and Price, J. S.: Experimental hydrological forcing to illustrate water flow processes of a subarctic ladder fen peatland, Hydrol. Process., 31, 1578–1589, https://doi.org/10.1002/hyp.11127, 2017.
Miller, P., Shaw, G. H., Glaser, P. H., and Siegel, D. I.: Bedrock topography beneath the Red Lake Peatlands, Geological Society of America Annual Meeting, Cincinnati, OH, USA, October 1992, Abstracts with Programs, https://www.osti.gov/biblio/5808031 (last access: 16 May 2024), 1992.
Moore, H., Comas, X., Briggs, M. A., Reeve, A. S., Alam, K. M. N., Slater, L.: Minerogenous Groundwater Inputs to Patterned Pools in Northern Raised Peat Bogs Supplementary Data, HydroShare [data set], http://www.hydroshare.org/resource/8877eb61207c4ae28b66231b450efa0d (last access: 16 September 2024), 2024.
Moore, H. E., Comas, X., Briggs, M. A., Reeve, A. S., and Slater, L. D.: Indications of preferential groundwater seepage feeding northern peatland pools, J. Hydrol., 638, 131479, https://doi.org/10.1016/j.jhydrol.2024.131479, 2024.
Moore, P. D.: Stratigraphy and pollen analysis of Claish Moss, north-west Scotland: Significance for the origin of surface-pools and forest history, J. Ecol., 65, 375–397, https://doi.org/10.2307/2259489, 1977.
Moore, P. D.: Pool and ridge patterns in peat mires, Nature, 300, 110, https://doi.org/10.1038/300110c0, 1982.
National Oceanic and Atmospheric Administration (NOAA): Record of Climatological Observations, August 2023, Station COOPER 0.5 SE, ME US (US1MEWS0004), Cooper, Maine, USA, National Centers for Environmental Information, https://www.ncei.noaa.gov/cdo-web/ (last access: 17 February 2024), 2023a.
National Oceanic and Atmospheric Administration (NOAA): Record of Climatological Observations, June 2023, Station COOPER 0.5 SE, ME US (US1MEWS0004), Cooper, Maine, USA, National Centers for Environmental Information, https://www.ncei.noaa.gov/cdo-web/ (last access: 17 February 2024), 2023b.
National Oceanic and Atmospheric Administration (NOAA): Record of Climatological Observations, August 2023, Station HOULTON 2.2 SW, ME US (US1MEAR0040), Houlton, Maine, USA, National Centers for Environmental Information, https://www.ncei.noaa.gov/cdo-web/ (last access: 17 February 2024), 2023c.
National Oceanic and Atmospheric Administration (NOAA): Record of Climatological Observations, June 2023, Station ORONO 1.1 SSW, ME US (US1MEPN0055), Orono, Maine, USA, National Centers for Environmental Information, https://www.ncei.noaa.gov/cdo-web/ (last access: 17 February 2024), 2023d.
National Oceanic and Atmospheric Administration (NOAA): Record of Climatological Observations, August 2024, Station 25 COOPER 0.5 SE, ME US (US1MEWS0004), Cooper, Maine, USA, National Centers for Environmental Information, https://www.ncei.noaa.gov/cdo-web/ (last access: 17 February 2024), 2024.
Newman, W. A.: Reconnaissance surficial geology of the Sherman Quadrangle, Maine, Maine Geological Survey, Department of Conservation, Open-File Rep. 80–17, https://digitalmaine.com/mgs_maps/636/ (last access: 16 May 2024), 1980.
Olid, C., Rodellas, V., Rocher-Ros, G., Garcia-Orellana, J., Diego-Feliu, M., Alorda-Kleinglass, A., and Karlsson, J.: Groundwater discharge as a driver of methane emissions from Arctic lakes, Nat. Commun., 13, 3667, https://doi.org/10.1038/s41467-022-31219-1, 2022.
Orlova, J. and Branfireun, B. A.: Surface water and groundwater contributions to streamflow in the James Bay Lowland, Canada, Arct. Antarct. Alp. Res., 46, 236–250, https://doi.org/10.1657/1938-4246-46.1.236, 2014.
Osberg, P. H., Hussey II, A. M., and Boone, G. M.: Bedrock geologic map of Maine, scale 1 : 500 000, Maine Geological Survey, Department of Conservation, Augusta, ME, USA, https://digitalmaine.com/mgs_maps/23/ (last access: 16 May 2024), 1985.
Osborne, C., Gilbert-Parkes, S., Spiers, G., Lamit, L. J., Lilleskov, E. A., Basiliko, N., and Watmough, S.: Global patterns of metal and other element enrichment in bog and fen peatlands, Arch. Environ. Contam. Toxicol., 86, 125–139, https://doi.org/10.1007/s00244-024-01051-3, 2024.
Plattner, A. M.: GPRPy: Open-source ground-penetrating radar processing and visualization software, Lead. Edge, 39, 332–337, https://doi.org/10.1190/tle39050332.1, 2020.
QGIS.org: QGIS Geographic Information System, QGIS Association, https://www.qgis.org/ (last access: 16 May 2024), 2023.
Quillet, A., Larocque, M., Pellerin, S., Cloutier, V., Ferlatte, M., Paniconi, C., and Bourgault, M.-A.: The role of hydrogeological setting in two Canadian peatlands investigated through 2D steady-state groundwater flow modelling, Hydrol. Sci. J., 62, 2541–2557, https://doi.org/10.1080/02626667.2017.1391387, 2017.
Quinton, W. L. and Roulet, N. T.: Spring and summer runoff hydrology of a subarctic patterned wetland, Arct. Alp. Res., 30, 285–294, https://doi.org/10.2307/1551976, 1998.
Reeve, A. S., Siegel, D. I., and Glaser, P. H.: Simulating vertical flow in large peatlands, J. Hydrol., 227, 207–217, https://doi.org/10.1016/S0022-1694(99)00183-3, 2000.
Reeve, A. S., Tyczka, Z. D., Comas, X., and Slater, L. D.: The influence of permeable mineral lenses on peatland hydrology, in: Carbon Cycling in Northern Peatlands, Geophysical Monograph Series, 184, American Geophysical Union, Washington, DC, 163–177, https://doi.org/10.1029/GM184, 2009.
Rezanezhad, F., Quinton, W. L., Price, J. S., Elliot, T. R., Elrick, D., and Shook, K. R.: Influence of pore size and geometry on peat unsaturated hydraulic conductivity computed from 3D computed tomography image analysis, Hydrol. Process., 24, 2983–2994, https://doi.org/10.1002/hyp.7709, 2010.
Rossi, P. M., Ala-aho, P., Ronkanen, A. K., and Kløve, B.: Groundwater–surface water interaction between an esker aquifer and a drained fen, J. Hydrol., 432–433, 52–60, https://doi.org/10.1016/j.jhydrol.2012.02.026, 2012.
Roy, D. C.: Reconnaissance bedrock geology of the Sherman, Mattawamkeag, and Millinocket 150 quadrangles, Maine, Maine Geological Survey, Augusta, ME, USA, https://digitalmaine.com/mgs_maps/317/ (last access: 16 May 2024), 1981.
Roy, D. C., Demarest, N. A., and Hill, M. J.: Stratigraphy and sedimentation in Silurian flysch east of Millinocket, Maine, in: The Greenville–Millinocket Regions, North Central Maine, New England Intercollegiate Geological Conference Guidebook, 75th Annual Meeting, edited by: Caldwell, D. W. and Hanson, L. S., 123–145, https://scholars.unh.edu/neigc/45/ (last access: 16 May 2024), 1983.
Shreve, R. L.: Esker characteristics in terms of glacier physics, Katahdin esker system, Maine, Geol. Soc. Am. Bull., 96, 639–646, https://doi.org/10.1130/0016-7606(1985)96<639:ECITOG>2.0.CO;2, 1985.
Siegel, D. I.: Hydrogeologic setting of the Glacial Lake Agassiz peatlands, northern Minnesota, U.S. Geol. Surv. Water-Resour. Investig. Rep. 81–24, https://pubs.usgs.gov/wri/1981/0024/report.pdf (last access: 16 May 2024), 1981.
Siegel, D. I.: Ground water and the evolution of patterned mires, Glacial Lake Agassiz peatlands, northern Minnesota, J. Ecol., 71, 913–921, https://doi.org/10.2307/2259601, 1983.
Siegel, D. I.: Groundwater hydrology, in: Patterned Peatlands of Northern Minnesota, edited by: Wright Jr., H. E. and Coffin, B. A., University of Minnesota Press, Minneapolis, MN, USA, 163–172, ISBN 9781452903057, 1992.
Siegel, D. I. and Glaser, P. H.: Groundwater flow in a bog-fen complex, Lost River Peatland, northern Minnesota, J. Ecol., 75, 743–754, https://doi.org/10.2307/2260203, 1987.
Siegel, D. I. and Glaser, P. H.: The hydrology of peatlands, in: Boreal Peatland Ecosystems, Ecological Studies, Vol. 188, Springer, Berlin, Heidelberg, 289–311, https://doi.org/10.1007/978-3-540-31913-9_13, 2006.
Siegel, D. I., Reeve, A. S., Glaser, P. H., and Romanowicz, E. A.: Climate-driven flushing of pore water in peatlands, Nature, 374, 531–533, https://doi.org/10.1038/374531a0, 1995.
Slater, L. and Reeve, A.: Investigating peatland stratigraphy and hydrogeology using integrated electrical geophysics, Geophysics, 67, 365–378, https://doi.org/10.1190/1.1468597, 2002.
Smart, P. J.: Stratigraphy of a site in the Munsary Dubh Lochs, Caithness, northern Scotland: Development of present pattern, J. Ecol., 70, 549–559, https://doi.org/10.2307/2259922, 1982.
Sorensen, J. A. and Glass, G. E.: Ion and temperature dependence of electrical conductance for natural waters, Anal. Chem., 59, 1594–1597, https://doi.org/10.1021/ac00140a003, 1987.
Spence, C. and Woo, M.-K.: Hydrology of subarctic Canadian Shield: soil-filled valleys, J. Hydrol., 279, 151–166, https://doi.org/10.1016/S0022-1694(03)00175-6, 2003.
State of Maine: Maine GeoLibrary Data Catalog: Maine Elevation Contours (2 ft), Maine GeoLibrary, https://www.maine.gov/geolib/catalog.html (last access: 16 May 2024), 2020.
Teledyne FLIR: Teledyne FLIR Tools / FLIR Tools+ (Version 6.4), Teledyne FLIR [code], https://www.flir.com/de-de/products/flir-tools/ (last access: 16 May 2024), 2018.
Theimer, B. D.: Principles of bog characterization using ground penetrating radar, MSc thesis, University of Waterloo, Waterloo, ON, Canada, ISBN 0315725303, 1990.
Theimer, B. D., Nobes, D. C., and Warner, B. G.: A study of the geoelectrical properties of peatlands and their influence on ground-penetrating radar surveying, Geophys. Prospect., 42, 179–209, https://doi.org/10.1111/j.1365-2478.1994.tb00205.x, 1994.
Thompson, W. B. and Borns, H. W.: Surficial geologic map of Maine, scale 1 : 500 000, Maine Geological Survey, Department of Conservation, Augusta, ME, USA, https://digitalmaine.com/mgs_maps/15/ (last access: 16 May 2024), 1985.
Trenberth, K. E.: Changes in precipitation with climate change, Clim. Res., 47, 123–138, https://doi.org/10.3354/cr00953, 2011.
Turner, T. E., Billett, M. F., Baird, A. J., Chapman, P. J., Dinsmore, K. J., and Holden, J.: Regional variation in the biogeochemical and physical characteristics of natural peatland pools, Sci. Total Environ., 545–546, 84–94, https://doi.org/10.1016/j.scitotenv.2015.12.101, 2016.
Winter, T. C., Harvey, J. W., Franke, O. L., and Alley, W. M.: The hydrologic cycle and interactions of ground water and surface water, in: Ground Water and Surface Water: A Single Resource, U.S. Geological Survey Circular 1139, 2–20, https://pubs.usgs.gov/circ/1998/1139/report.pdf (last access: 16 May 2024), 1998.