
the Creative Commons Attribution 4.0 License.
the Creative Commons Attribution 4.0 License.
 | 13 Jul 2026
Forest floor water storage and redistribution affect evaporation, retention, and infiltration in mixed temperate forests
Heinke Paulsen
Markus Weiler
The forest floor (FF) possesses a significant water retention capacity, facilitating the transfer of water between the atmosphere and the soil. However, knowledge on the water retention characteristics and water redistribution effects of the FF remain limited. Due to the dominance of laboratory data regarding the storage capacity of a forest's litter layer, we used a combined FF weighted grid-lysimeter and soil moisture network to directly and in-situ measure the dynamics of water storage of the FF and fluxes from and into the FF. The objective was to quantify storage capacities, retention durations, and resulting water redistribution patterns, as well as evaporation from the FF. We present the results of our network at three mixed temperate forest sites with different altitudes, and therefore diverging climatic conditions, located in the Black Forest, southwest Germany. The three sites have an annual mean temperature gradient from 6.3 to 10.3 °C, leading to humus forms that vary from typical F-Mull to typical Moder. Throughout the monitored period in 2024–2025, the storage capacity of the FF ranged between 1.4 and 4.2 g g−1 FF and was not only influenced by the type of litter but also by the rainfall characteristics themselves. With our field setup we could show that longer, low intensity rainfall events fill the FF storage more efficiently than shorter heavy rainfall events (− 24 %). Our gridded lysimeter design revealed small-scale spatio-temporal infiltration patterns, caused by a redistribution of rainfall along the passage through the FF. The findings of the lysimeter network provide a comprehensive understanding of how not only the thickness of the FF but rather characteristics like the share of organic fine material define the water cycle within forest ecosystems.
- Article
(2539 KB) - Full-text XML
-
Supplement
(818 KB) - BibTeX
- EndNote


Understanding the partitioning and movement of water within temperate forest ecosystems is essential for predicting hydrological responses to changing environmental conditions. At the interface between the atmosphere and the lithosphere, the forest floor (FF), comprising both the organic litter layer and the underlying, organic rich top mineral soil, serves as a critical mediator of water fluxes. This system regulates the movement of water through the interaction between its organic and mineral components, directly influencing runoff generation, soil moisture recharge, and evaporation. The organic layers interaction with the mineral soil dictates the fate of precipitation before it infiltrates deeper into the profile, thereby affecting water availability and overall ecosystem functioning (Ilek et al., 2021).
The interception of rainfall by the FF plays a significant role in the water balance of forest soils. This layer, characterized by varying leaf structures and organic material, undergoes temporal compositional changes due to canopy phenological phases and disturbances (Van Stan et al., 2017). Just like variations in canopy thickness result in different initial throughfall amount (Nanko et al., 2022), FF substantially influences the amount of water available for soil infiltration and runoff (Guevara-Escobar et al., 2007). But despite its importance, there is still relatively little data available on this phenomenon (Gerrits et al., 2007; Zagyvai-Kiss et al., 2019; Zhao et al., 2022).
During a typical rainfall event the FF shows different functions regarding the water cycle. Initial rainfall retention of litter refers to the capacity of the FF's layer of organic material – composed of leaves, twigs, and other decomposing plant matter – to temporarily hold or store rainfall at the onset of a rain event. This retention occurs before the water begins to infiltrate into the mineral soil or contributes to runoff. With further rainfall the FF will store more water until it reaches the maximum storage capacity (Cmax), also known as the interception capacity (Putuhena and Cordery, 1996). With ceasing rainfall and gravitational draining water leaving the FF it reaches the minimum storage capacity (Cmin). The than stored water is only available for evaporation. Higher evaporation occurs immediately after a rainfall event from the FF (EFF), whereas stable evaporation 3–4 d later primarily originates from the soil layer (Deguchi et al., 2008). Understanding these processes is essential to accurately assess water balances in forest ecosystems.
The ability of FF to intercept and temporarily store precipitation is critically dependent on the physical characteristics of the FF as well as rainfall conditions (Li et al., 2020). Lysimeter studies offer an accurate means to quantify flux and storage processes (Levia et al., 2011). At single leaf scale it has been observed that broadleaf litter has a larger interception capacity than needle litter, attributed to its higher surface area-to-weight ratio (Walsh and Voigt, 1977; Zhao et al., 2022). At the FF scale this interception can be influenced by additional factors like litter accumulation and decomposition rates, e.g. needle litter is characterized by the formation of more porous material due to slower decomposition rates (Sato et al., 2004). Structural differences in the litter layer lead to heterogeneous flow patterns, with water preferentially following in defined paths, leaving portions of the lower litter unwetted (Walsh and Voigt, 1977).
Post-rainfall grab sample observations reveal that the FF's ability to store and evaporate water is highly dependent on its thickness, pre-wetness condition, and the intensity and duration of rainfall. In natural rainfall conditions, interception storage capacities change with rainfall intensity and litter types due to differences in the morphological characteristics of litter flow pathways (Sato et al., 2004). Notably, the litter layer can retain and cycle up to 18 % of annual precipitation or approximately one-third of annual evapotranspiration (Floriancic et al., 2023). Although FF surfaces can store only a few millimetres of water, their impact becomes significant over longer time scales as the storage is frequently filled and depleted (evaporated) due to the high frequency of small rainfall events, thereby reducing soil moisture recharge and runoff generation (Levia et al., 2011). The importance of retention and storage capacity in maintaining forest hydrology cannot be overstated. Evaporation from a broadleaf FF can reach rates of around 0.2 ± 0.13 mm d−1 in a humid subtropical climate, with significant seasonal variations (Deguchi et al., 2008). While Magliano et al. (2017) found considerably higher first day evaporation to be 1.1 ± 0.3 mm d−1 also in a humid subtropical climate for forest litter.
Despite the theoretical understanding of FF dynamics, much of the existing data has been derived from controlled laboratory experiments or grab-sample studies, which often fail to capture the complex environmental variability of the field. There remains a critical shortage of high-resolution, in-situ data that accounts for the interaction between litter properties and thickness, varying pre-wetness conditions, and the lateral movement of water. Specifically, the relationship between organic layer depth and its actual impact on throughfall retention and mineral soil evaporation in a natural setting remains poorly quantified. To address these gaps and move beyond laboratory approximations, we established an extensive FF lysimeter network, installed at three different sites throughout the Black Forest, SW Germany, to test the following hypotheses: (1) thicker FF results in higher total water storage capacities and higher initial throughfall retention, depending on initial wetness conditions, (2) infiltration is highly heterogeneous on a small spatial scale, influenced not only by the spatially variable incoming canopy throughfall but enhanced by lateral redistribution of water in the FF, and (3) thicker FFs function as a barrier for evaporation from the mineral soil by increasing the diffusion path for water vapor and reducing capillary connectivity between the soil and the atmosphere.
2.1 Sites
This study utilizes a network of novel forest floor lysimeters (Paulsen and Weiler, 2025) and soil moisture probes deployed across three mixed beech-dominated (Fagus sylvatica) forest sites with patchy groups of spruce (Picea abies) trees. The sites are situated at different altitudes in the Black Forest region of southwestern Germany. Therefore, these sites have an annual mean temperature gradient ranging from 6.3 to 10.3 °C and a mean annual precipitation gradient between 1100 and 1770 mm, which results in varying humus forms from typical F-Mull to typical Moder, classified according to the KA6 system (AG Boden, 2024). In this classification the Mull is characterized by rapid decomposition rates of litter, resulting in thin organic and thick A-horizons, an Oh-layer (humified material) is never present. In contrast, Moder is characterized by moderately-to-poorly decomposable litter. Therefore, the A-horizon is thinner and the organic horizon is composed of fresh and fragmented litter. Ol and Of horizons are present all year while sometimes a thin or patchy Oh layer can occur (AG Boden, 2024). Additional information regarding the characteristics of these sites can be found in Table 1.
Table 1Detailed characteristics of the three research sites in the Black forest, Germany.
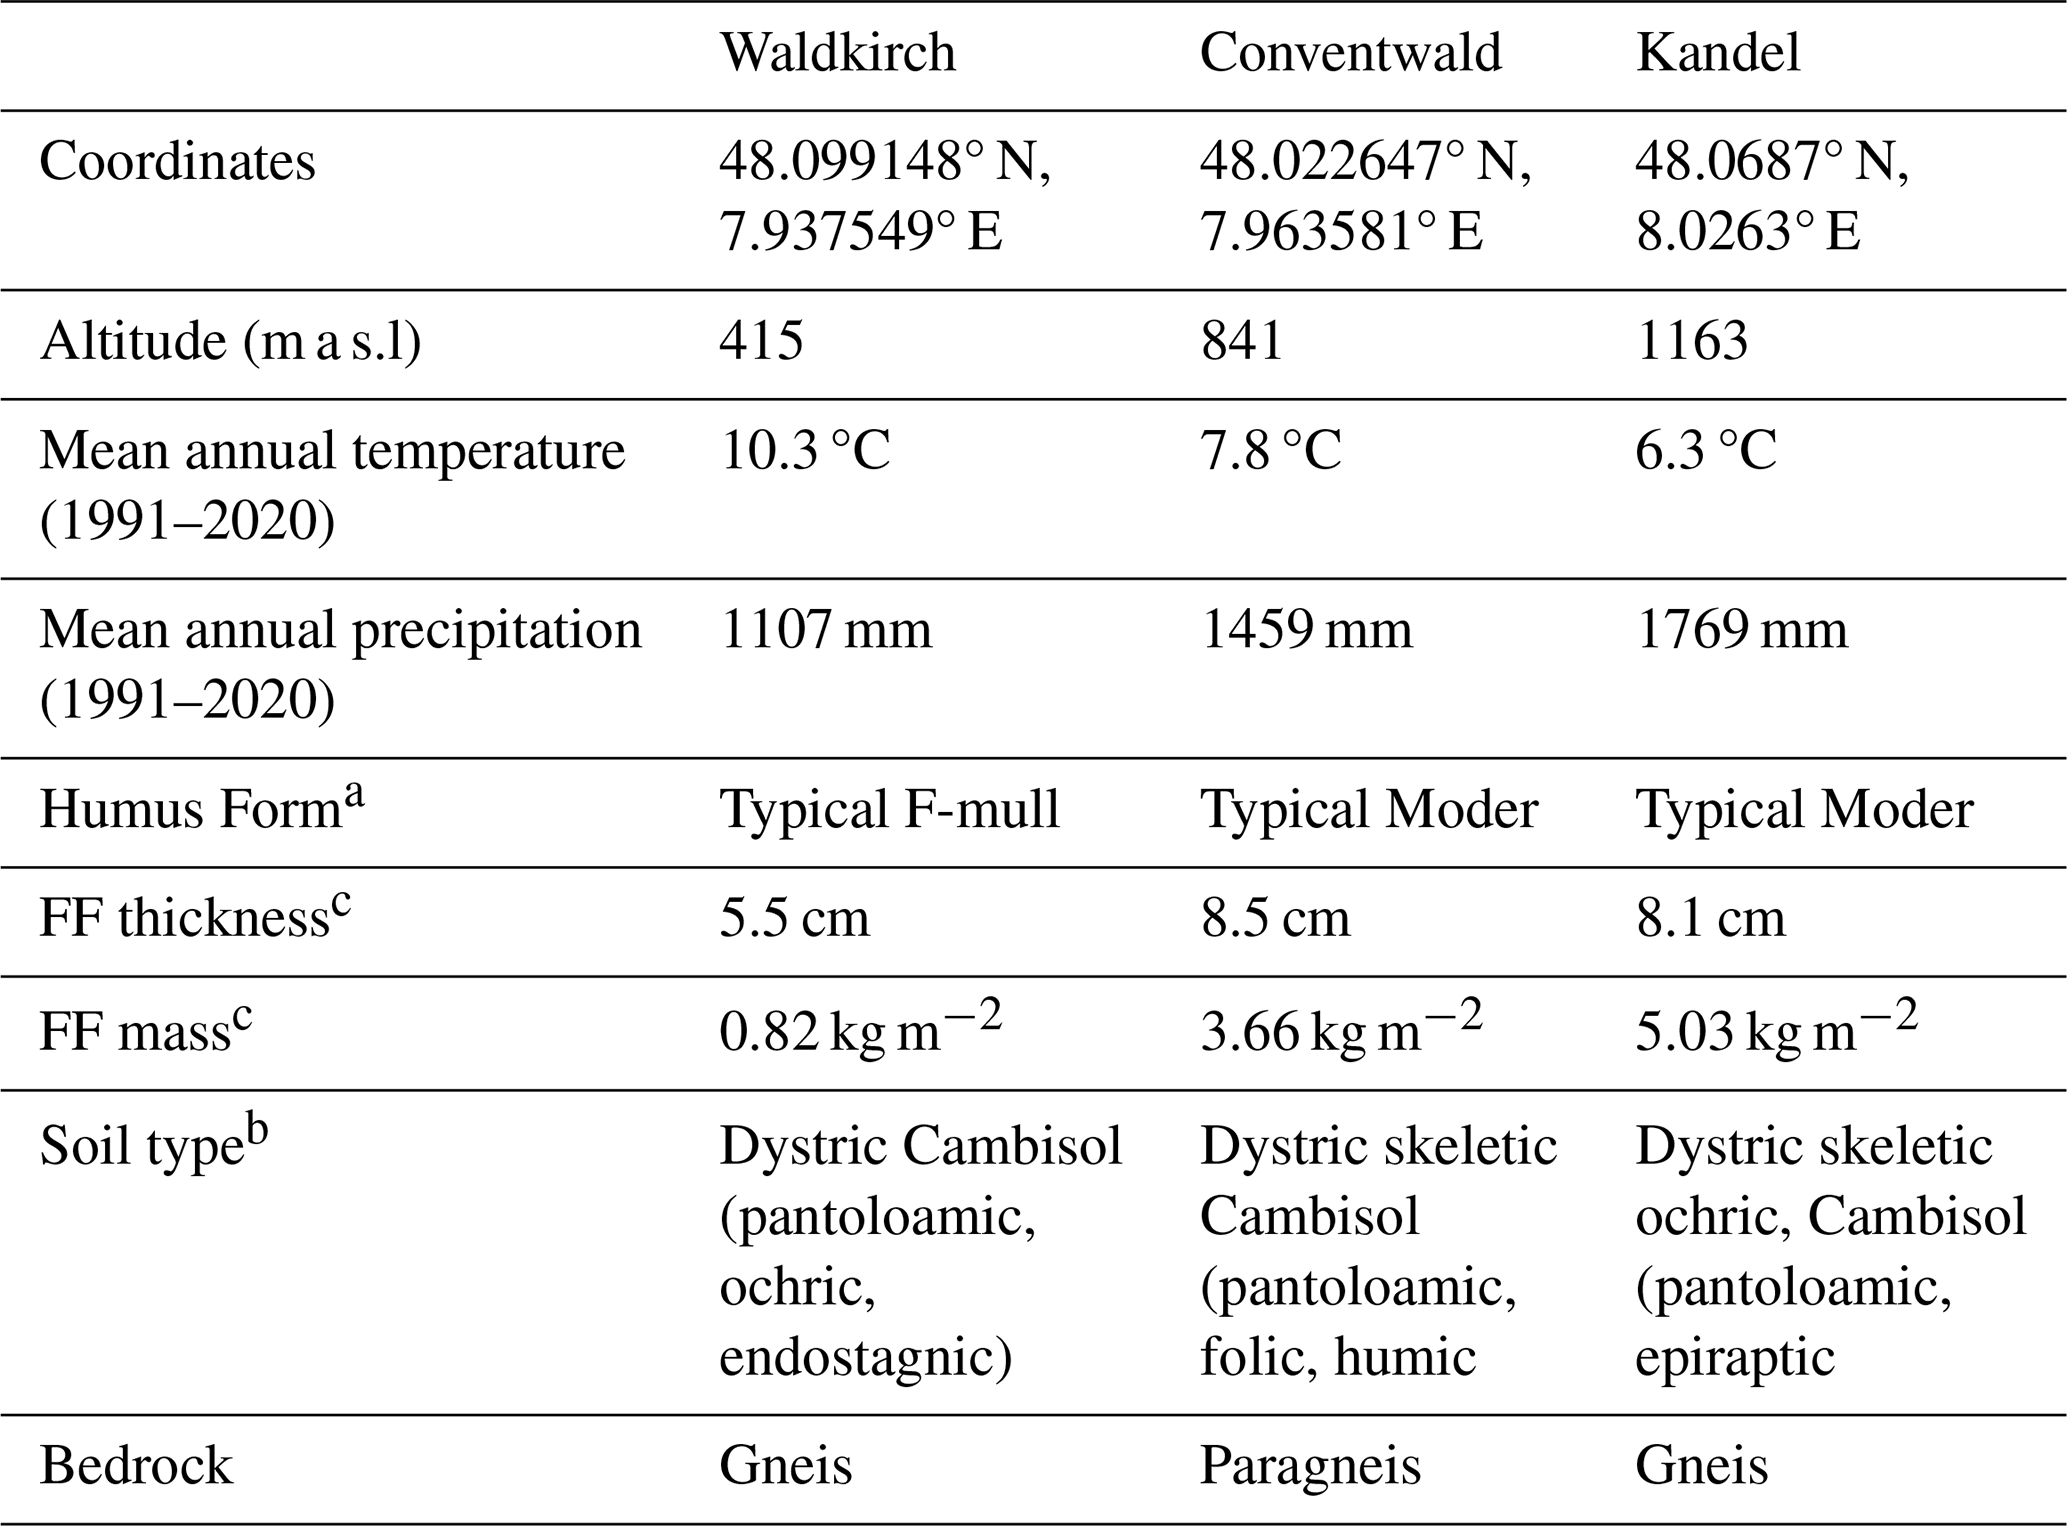
a KA 6 (AG Boden, 2024), b WRB 4th edn. (International Union of Soil Sciences, 2022), c sampling in autumn 2023.
2.2 Installations
At each of the three sites, we installed four weighted forest floor grid lysimeters (FFGL) in September/October 2023. The FFGLs were designed to generate data with high temporal resolution across multiple locations and varying spatial scales (Paulsen and Weiler, 2025). Therefore, a low-cost setup to install multiple lysimeters at several study sites was necessary. Figure 1a illustrates the FFGL, comprising a weighted box containing the FFs organic layer and top mineral soil, and a frame supporting the measurement equipment, like load cells and tipping buckets, and securing the system in the soil. The FFGL containers with a surface area of 25 × 100 cm were filled reconstructing the upper 15 cm of material from the surface, accommodating litterfall in autumn. To explore the small-scale heterogeneity of infiltration patterns, the lysimeter bottom was partitioned into four grids (each 0.0625 m2), facilitating a typical grid lysimeter approach that enables the observation of outflow from each grid with a tipping bucket independently. A detailed description of the FFGL system and filling procedure is provided in (Paulsen and Weiler, 2025). Each lysimeter is coupled with two soil moisture probes (SMT100, Truebner GmbH, Germany), positioned 50 cm adjacent to the lysimeter at two depths below the soil surface (5 and 15 cm), as depicted in Fig. 1. Additionally, microclimate parameters below the canopy, including air temperature, humidity, and radiation, were recorded at each site using two small meteorological stations (SnoMos; Pohl et al., 2014). To obtain a representative mean for each site, the lysimeters were strategically positioned relative to the two tree species beech (Fagus sylvatica) and spruce (Picea abies): one was placed beneath the crown edge, and the other was situated halfway between the crown edge and the tree stem. Since storage processes should be related to a certain dry mass of FF, we disentangled the lysimeters after almost 2 years in summer 2025, oven dried and weighed the material. The results are depicted in the Supplement.
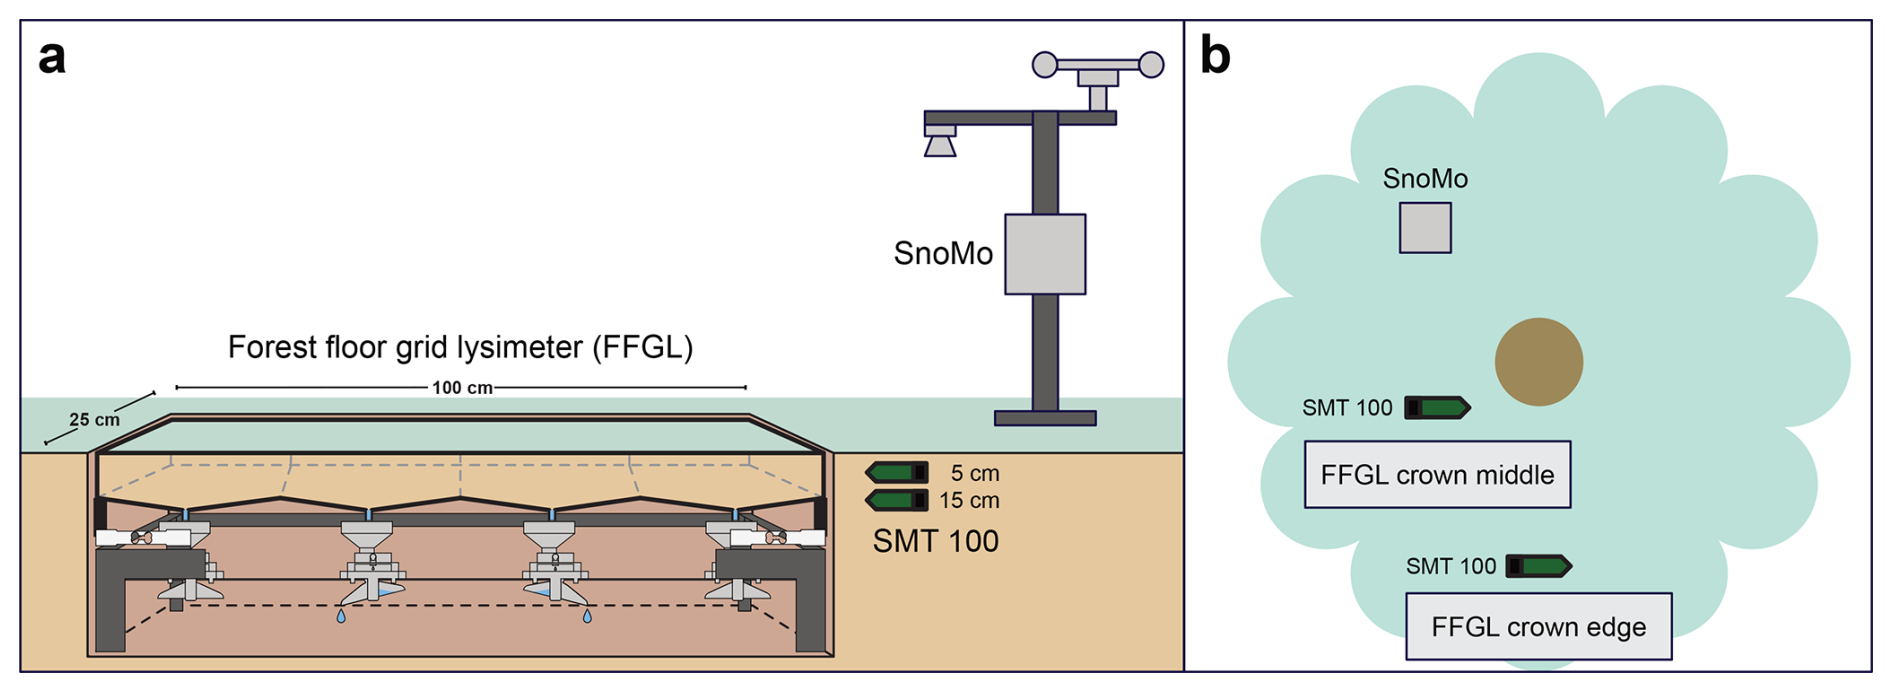
Figure 1Installed setup (a) containing a microclimate station (SnoMo), soil moisture probes (SMT100) and forest floor grid lysimeters (FFGL), and (b) the corresponding positioning to the tree.
2.3 Data processing
Forest floor grid lysimeter
The lysimeters microcontroller was programmed to measure the container weight with four load cells and number of tips for each of the four tipping buckets in a 10 min time step. We here present the data collected from May 2024 to August 2025. These measurements of the weighing FFGL can be used to determine the water balance of the FF for each observed time step. The amount of water percolating to the deeper soil D can be determined by multiplying the number of tipping bucket tips n with the specific tipping volume. This specific tipping volume was determined by calibration with 250 mL water in the field. With an average tipping volume of 2.1 mL and the area covered by each lysimeter grid (0.0625 m2), we reach a resolution of 0.03 mm for the draining water. The load cells continuously measure the storage mass S and, consequently, the mass of the lysimeter. If there is no drainage and the weight change is negative, we assume that this change is due to evaporation E from the FF.
A positive storage change is a signal for water input by precipitation and in our case of canopy throughfall (PTF), under the assumption there is no evaporation during a precipitation event. This precipitation/canopy throughfall can be calculated as:
Event analysis
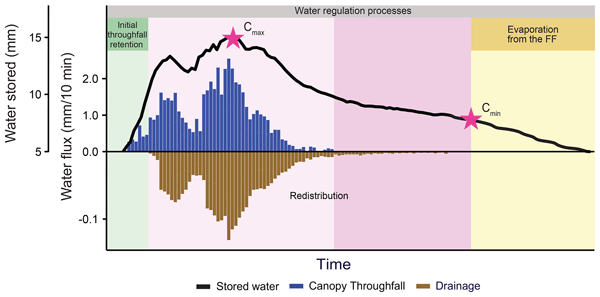
Figure 2 shows a schematic representation of an exemplary precipitation event. The event can be divided into several typical phases, calculated using the storage change (ΔS) and drainage (D) at 10 min resolution. The first phase, termed the initial throughfall retention phase, is characterized by the lysimeter gaining weight without any drainage occurring. In the subsequent phase, the lysimeter continues to gain weight until it reaches its maximum storage capacity (Cmax), known as the FF interception capacity. During this phase drainage from the lysimeter begins. As the rainfall ends, the weight of the lysimeter decreases due to ongoing drainage. Once drainage stops, the FF reaches Cmin, representing the minimum storage capacity or its water holding capacity. The water retained at this point can only be further depleted through evaporation (Putuhena and Cordery, 1996).
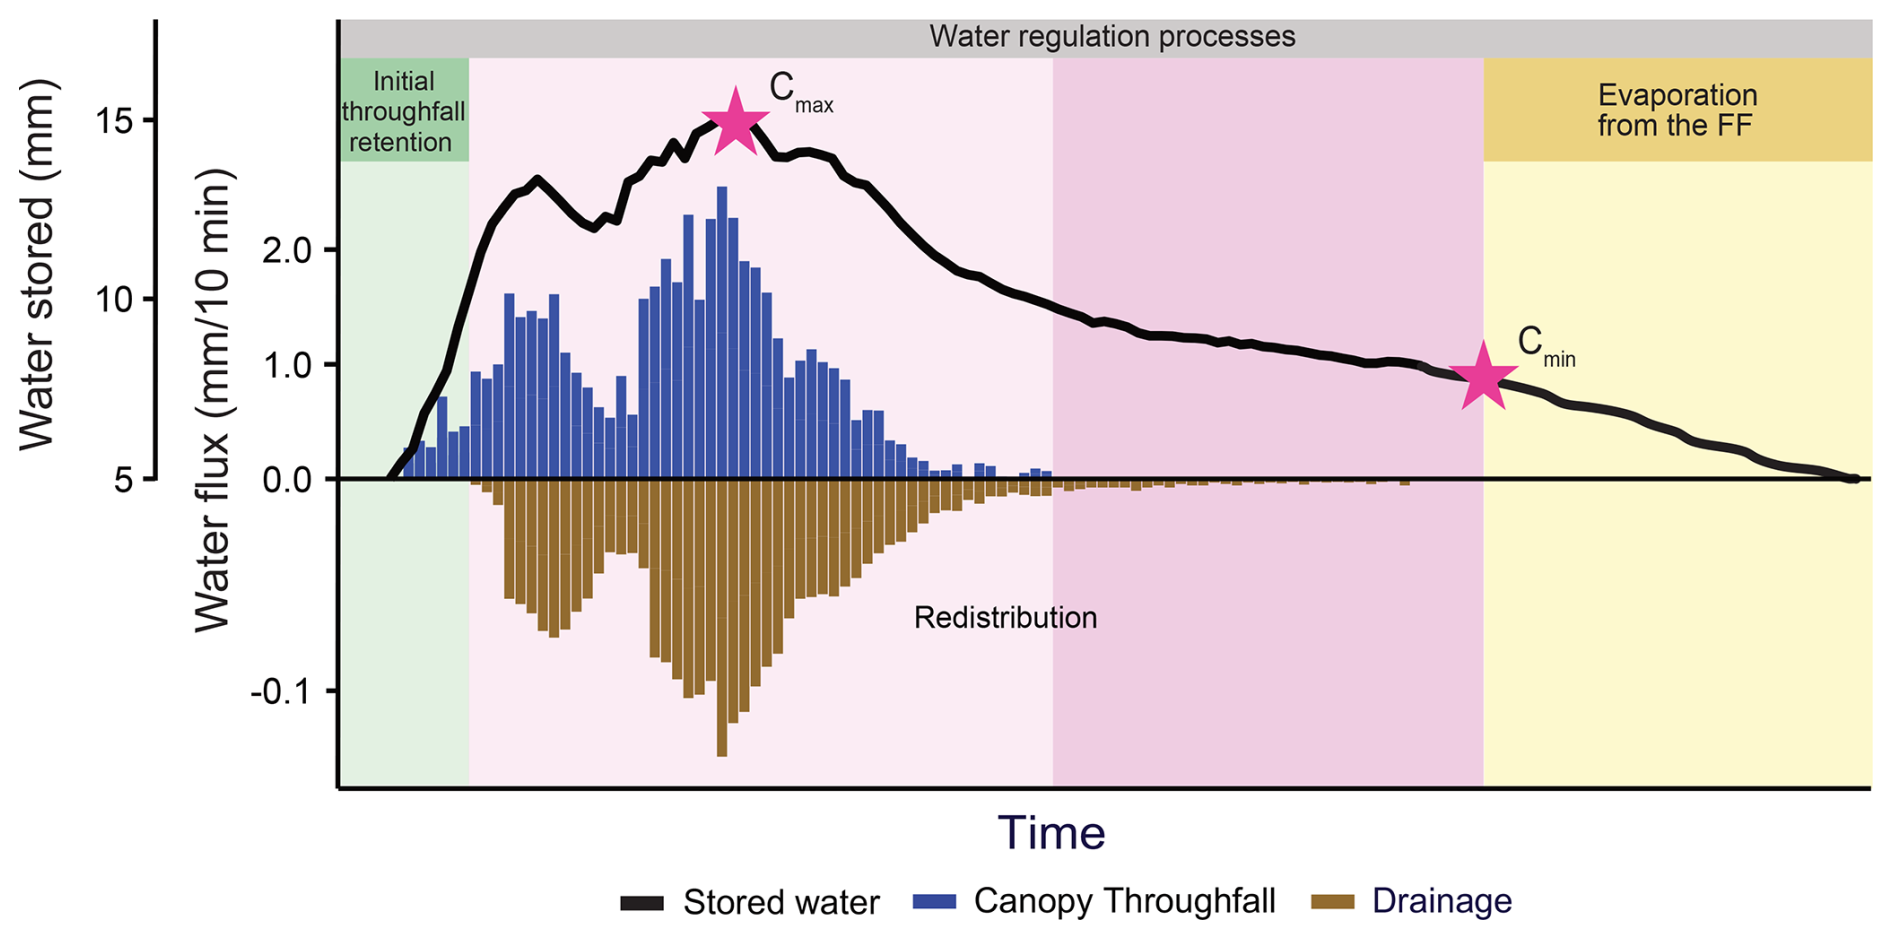
Figure 2Exemplary run of one precipitation event, including precipitation and drainage amount as well as the progression of lysimeter weight, showing the different phases initial throughfall retention, storage, redistribution and evaporation.
To analyze different types of precipitation events, we first established a clear definition of an event. For our purposes, an event is characterized by a positive storage increase exceeding 0.02 mm for more than three consecutive time steps, thus ensuring that isolated increases in weight (e.g., due to falling branches, needles or leaves) are not mistakenly classified as precipitation. An event is considered to have ended when there are 36 consecutive time steps (equivalent to 6 h) without a positive water flux (Deguchi et al., 2006; Dunkerley, 2008). Additionally, the total precipitation amount for the event must exceed 0.5 mm. With these criteria, we were able to identify events of varying amounts, intensities and durations. The statistical analysis was performed with R Studio (Version XY). Comparisons were analysed with t-tests.
Initial throughfall retention: We assessed the time lag between throughfall and drainage for different events, determining the period during which the FF can retain incoming water before it percolates to deeper soil layers, and examined the duration of this retention. We correlated retention sum and time to the initial soil moisture content for these events. We hypothesize that longer retention times would correspond to drier initial conditions. This relationship was tested for statistical significance.
Storage capacity: We can identify two different storage capacities of the FF (Putuhena and Cordery, 1996). The first one represents the minimum interception storage capacity (Cmin) of the litter layer. This is defined as the amount of water retained in the litter layer when free drainage ceases after rainfall. Cmin is comparable to the water holding capacity concept used in soil sciences for describing storage in porous media. It excludes gravitational water and is depleted solely by evaporation. In contrast Cmax is referred to as the FF interception capacity, which can also be defined as (Cmax) the maximum interception storage capacity of the FF, taken as the amount of water retained in the FF when the litter interception stops increasing during rainfall. It includes gravitational water.
Evaporation: Given that evaporation is a relatively slow and gradual process, we analyzed it using hourly data. During dry periods (i.e., intervals without rain events), we examined the hourly changes in weight. After accounting for drainage, the decrease in weight can be attributed to evaporation.
Infiltration Redistribution: By not only measuring the total weight of the lysimeter box but also recording the weight at each individual load cell at the corner of the rectangular container (Paulsen and Weiler, 2025), we are able to deduce the spatial distribution of canopy throughfall across the lysimeter surface. While we cannot provide absolute values, this approach still allows us to determine whether precipitation is preferentially reaching the surface at the left or right side of the lysimeter box, or if it is distributed relatively evenly across the surface. The gridded lysimeter bottom with its corresponding tipping bucket counts, allows us for direct observation of the spatial distribution of drainage.
3.1 Water fluxes
The FFGLs allow for detailed determination of the water fluxes into and from the FF. In Fig. 3 we show the absolute hourly water fluxes of one selected exemplary event during the observed time period including the corresponding cumulative water fluxes for all twelve studied lysimeters. This event was selected since it was captured from all twelve lysimeters.
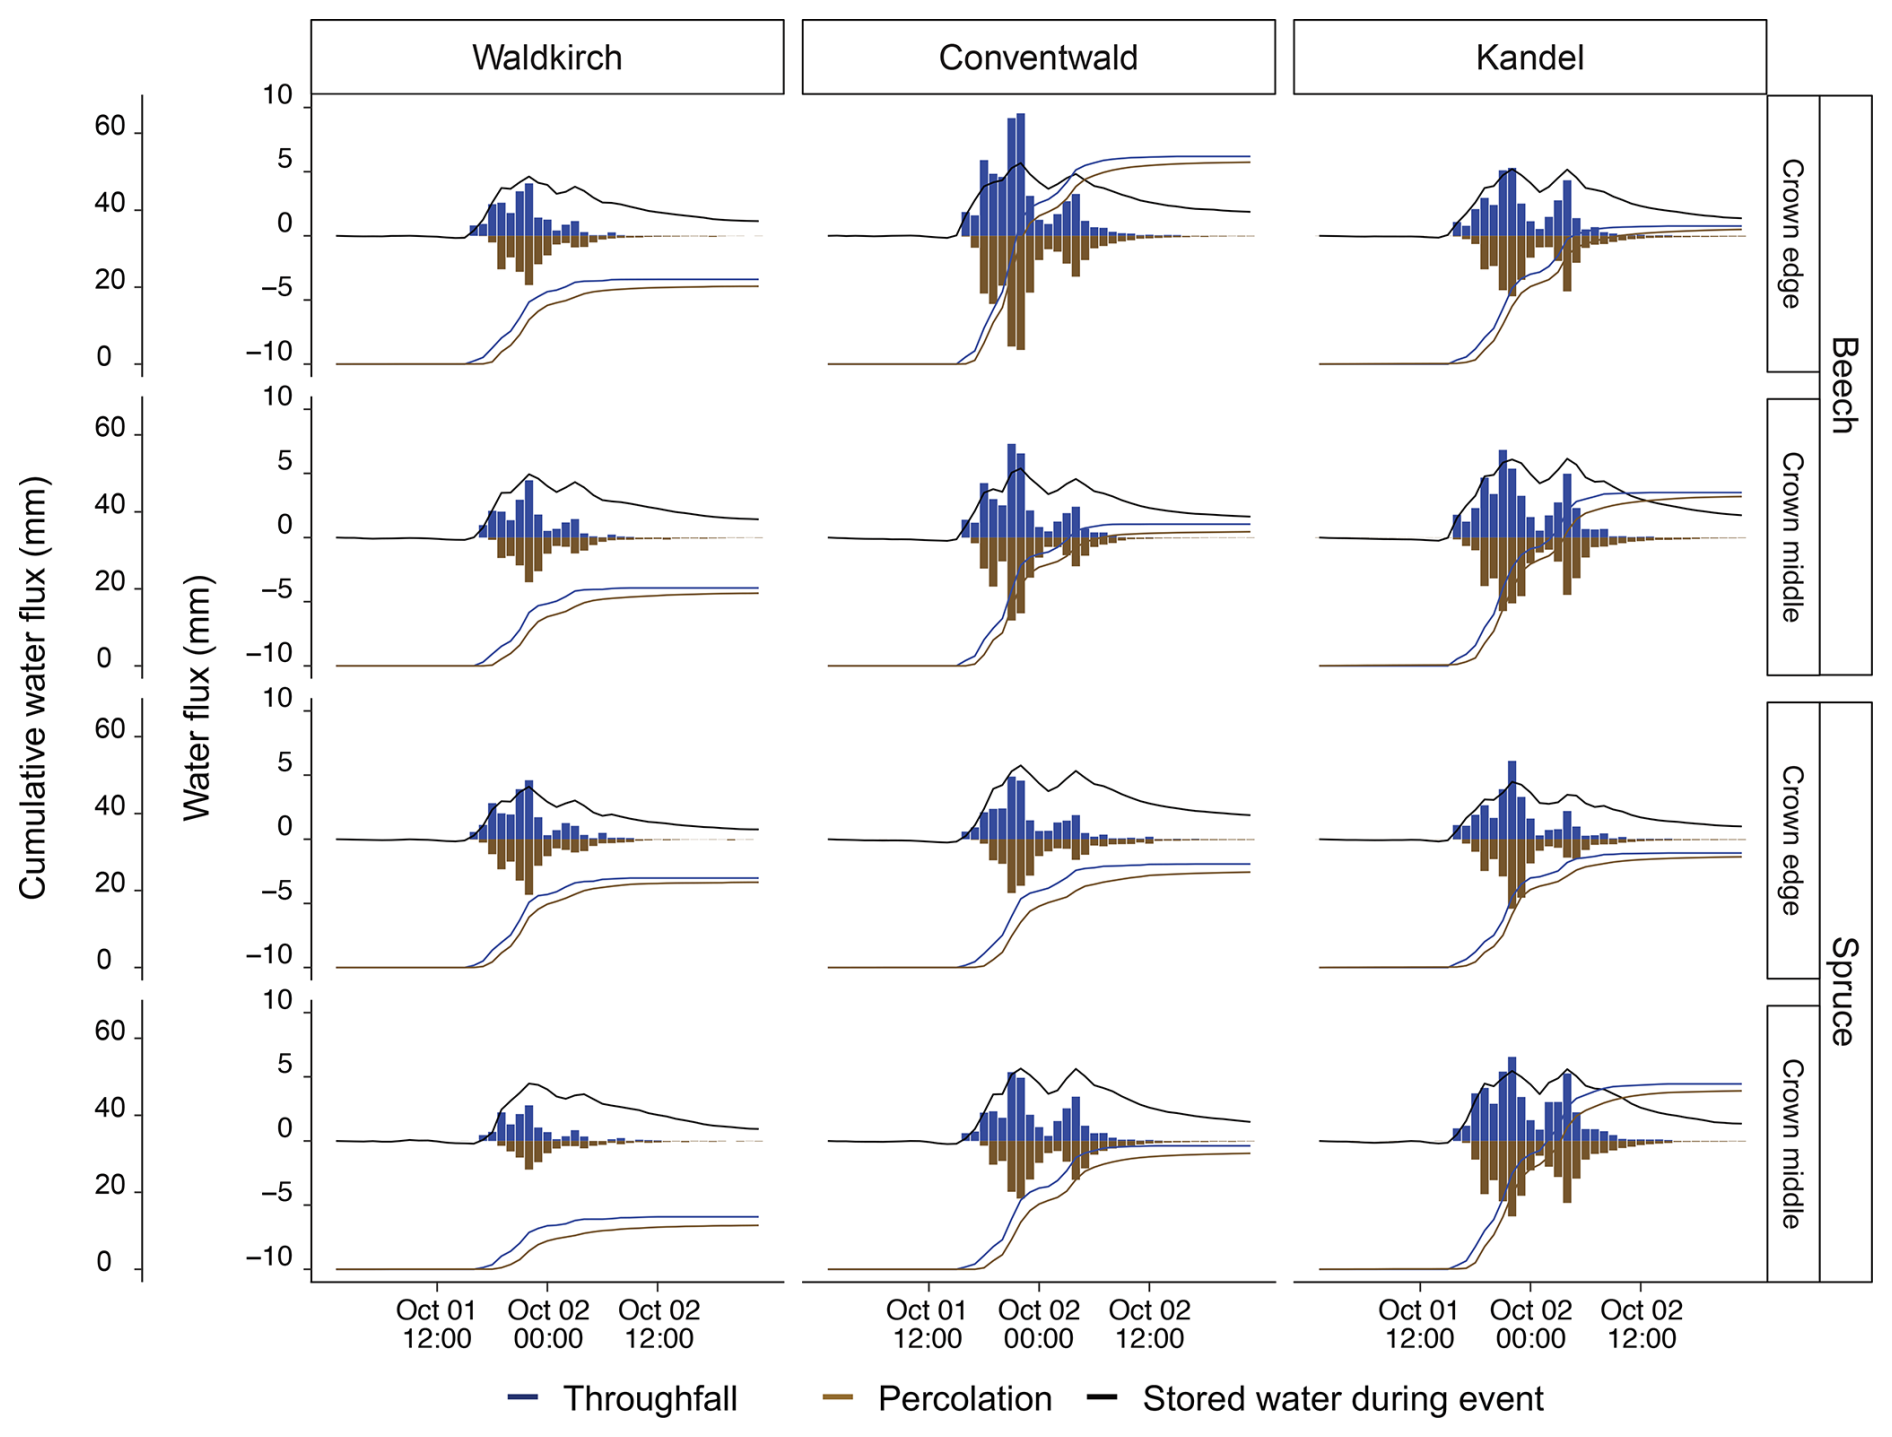
Figure 3Total and cumulative hourly water fluxes of precipitation and percolation, as well as amount of additionally stored water during the event for a selected rainfall event in fall 2024 (1 October 2024).
According to the different sites with their different altitudes, we see the highest precipitation amount on Kandel and slightly lower on Conventwald and much lower in Waldkirch (Table 2). Comparing the different locations under the trees it becomes evident that there are differences in canopy throughfall amount but the relation between throughfall and drainage is quite similar for all lysimeters.
Table 2Total mean amount of fluxes during the selected event 1 October 2024.
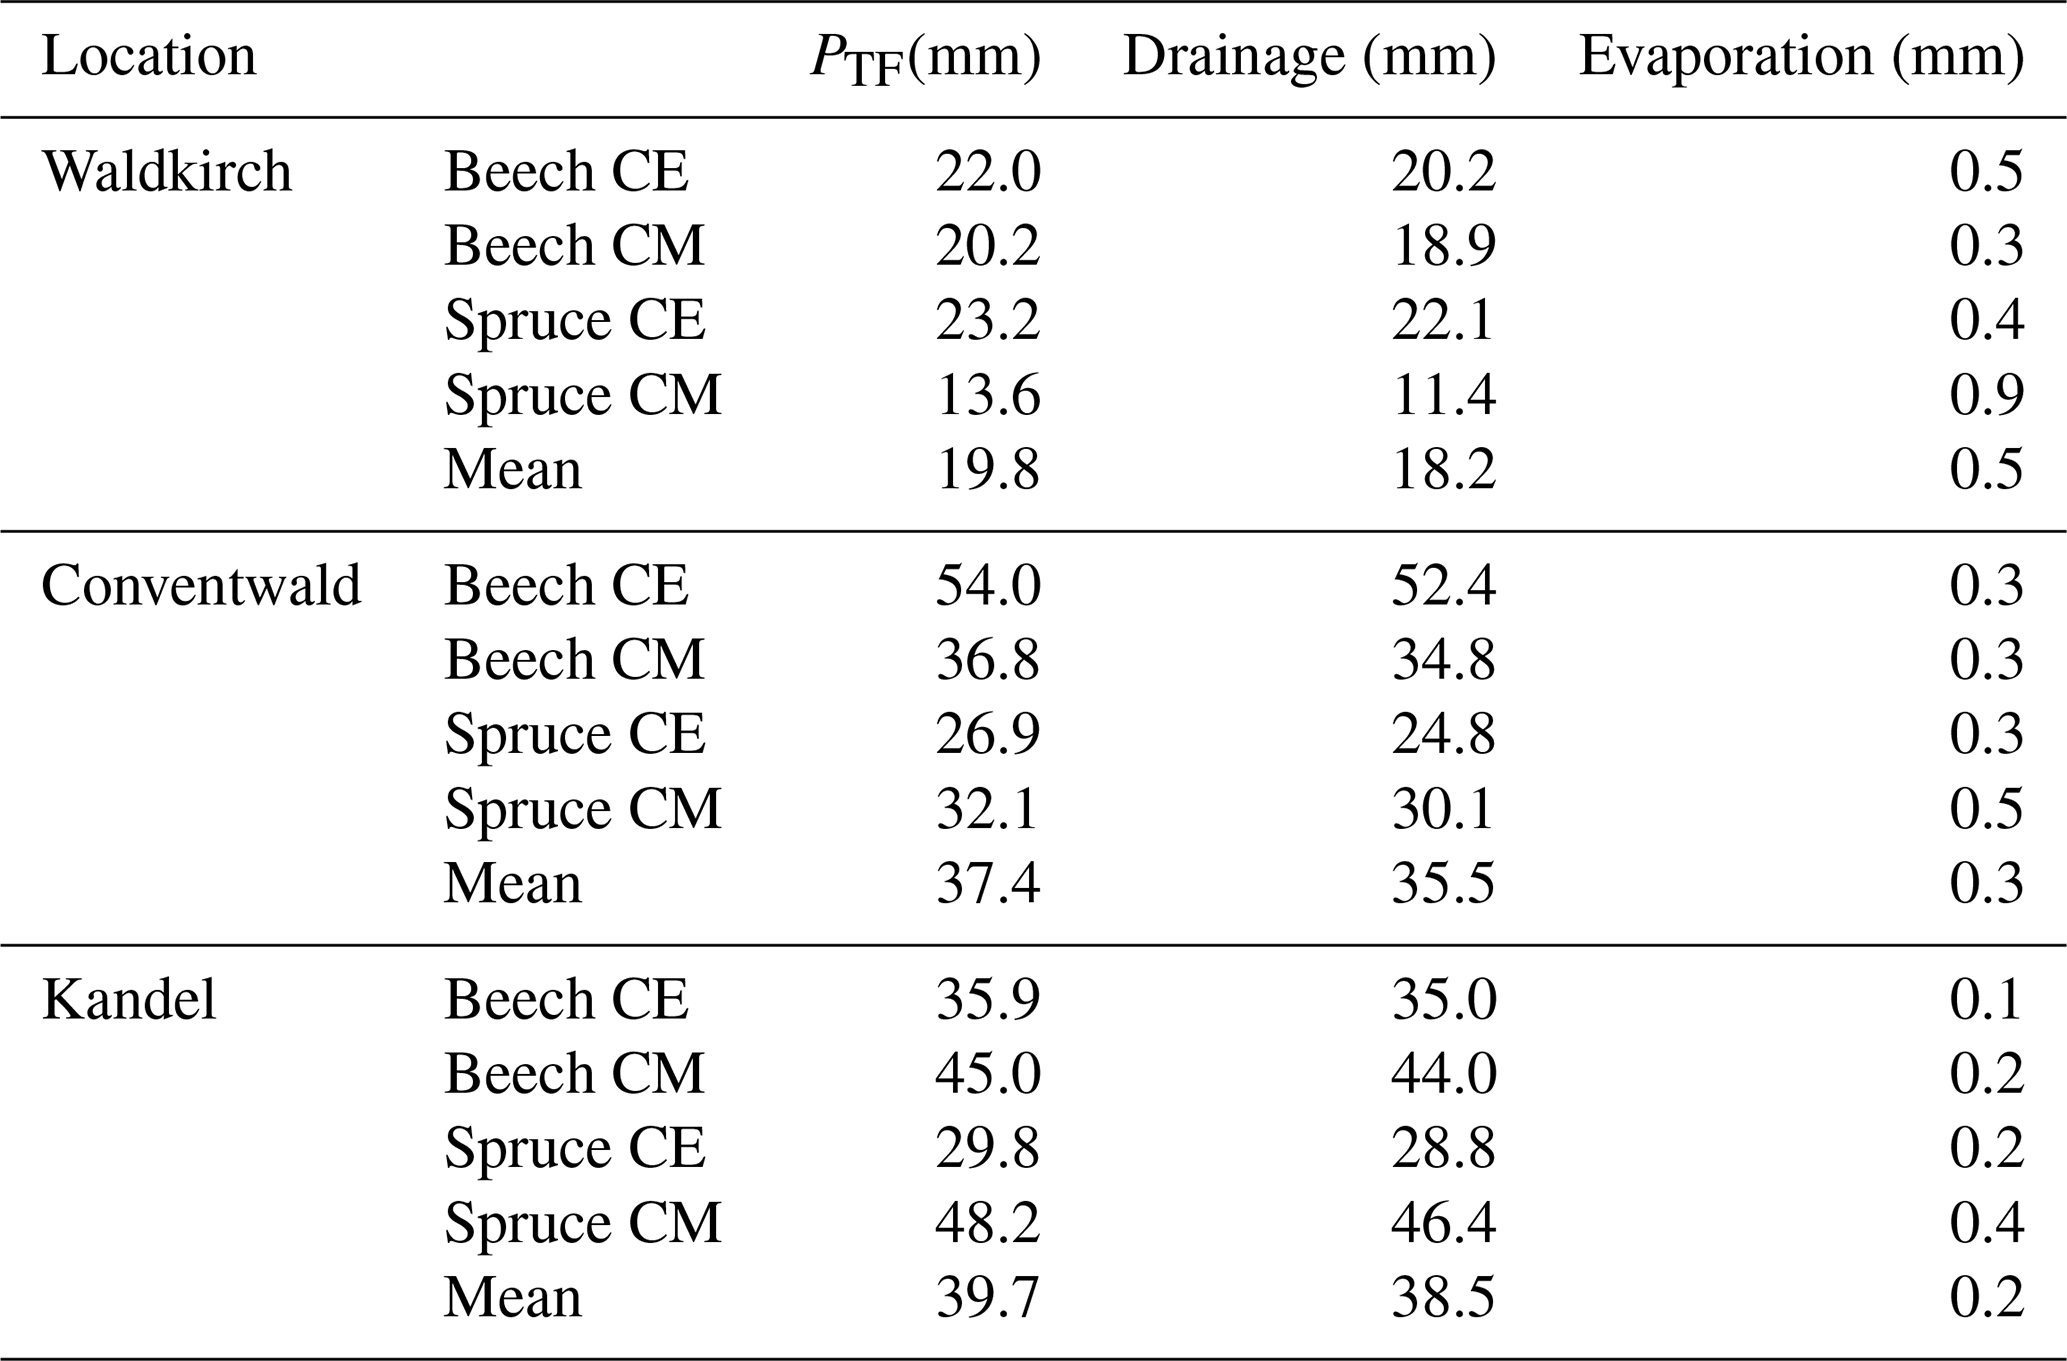
CE = crown edge, CM = crown middle, PTF= Throughfall
3.2 Precipitation events–identification
In total, we identified 1570 precipitation events from May 2024 to July 2025 across the three locations and differently positioned lysimeters (in average over 130 events per lysimeter). The winter period (November to February) was excluded from the analysis as frequently precipitation during this time involved snowfall and related snowmelt periods, which cannot be accurately measured with the lysimeters alone. The temporal resolution, including the duration and timing of the identified events (Fig. 4), was consistent among the lysimeters at each site, and the measured intensities were also comparable. We recorded the highest number of events (n= 551) in Conventwald. At the other two sites, we identified 511 events in Waldkirch and 508 events in Kandel. The number of events recorded by individual lysimeters varied, ranging from 91 to 172 events. Differences in the total numbers are caused by data gaps in single lysimeters due to various technical difficulties.
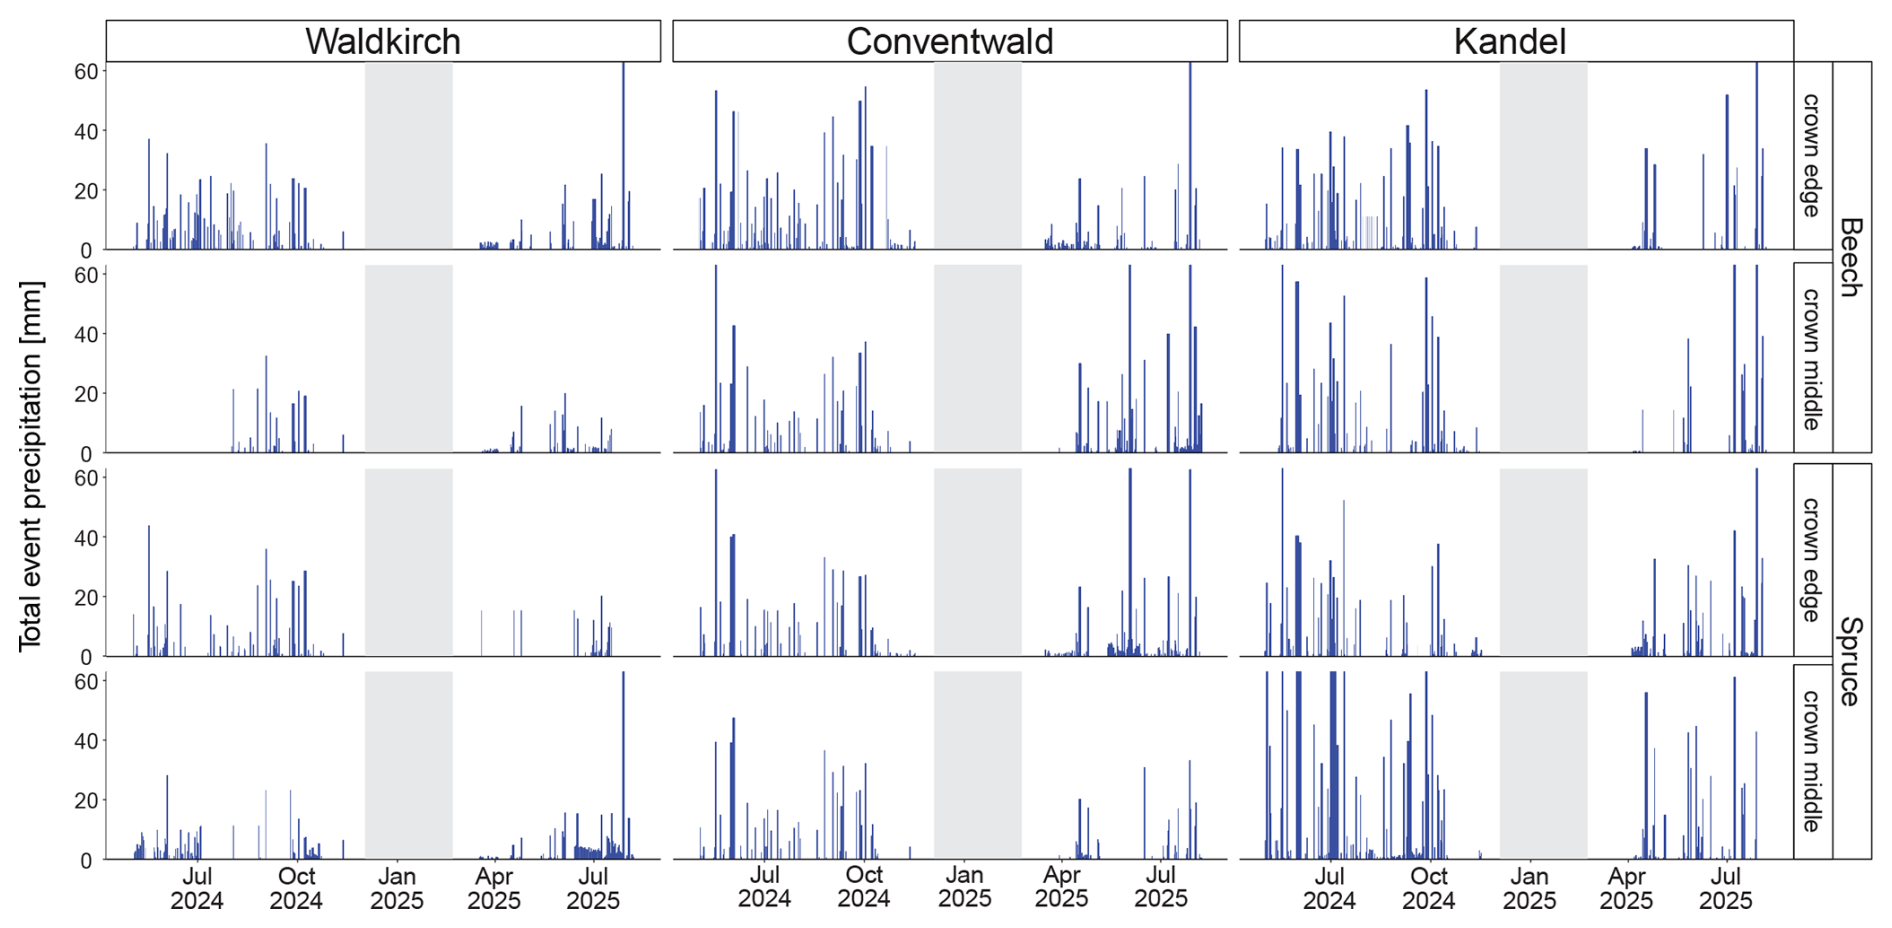
Figure 4Identified rainfall events and their total Throughfall (PTF) for all twelve lysimeters, the snow-affected period which was excluded from the statistical analysis is rendered in grey.
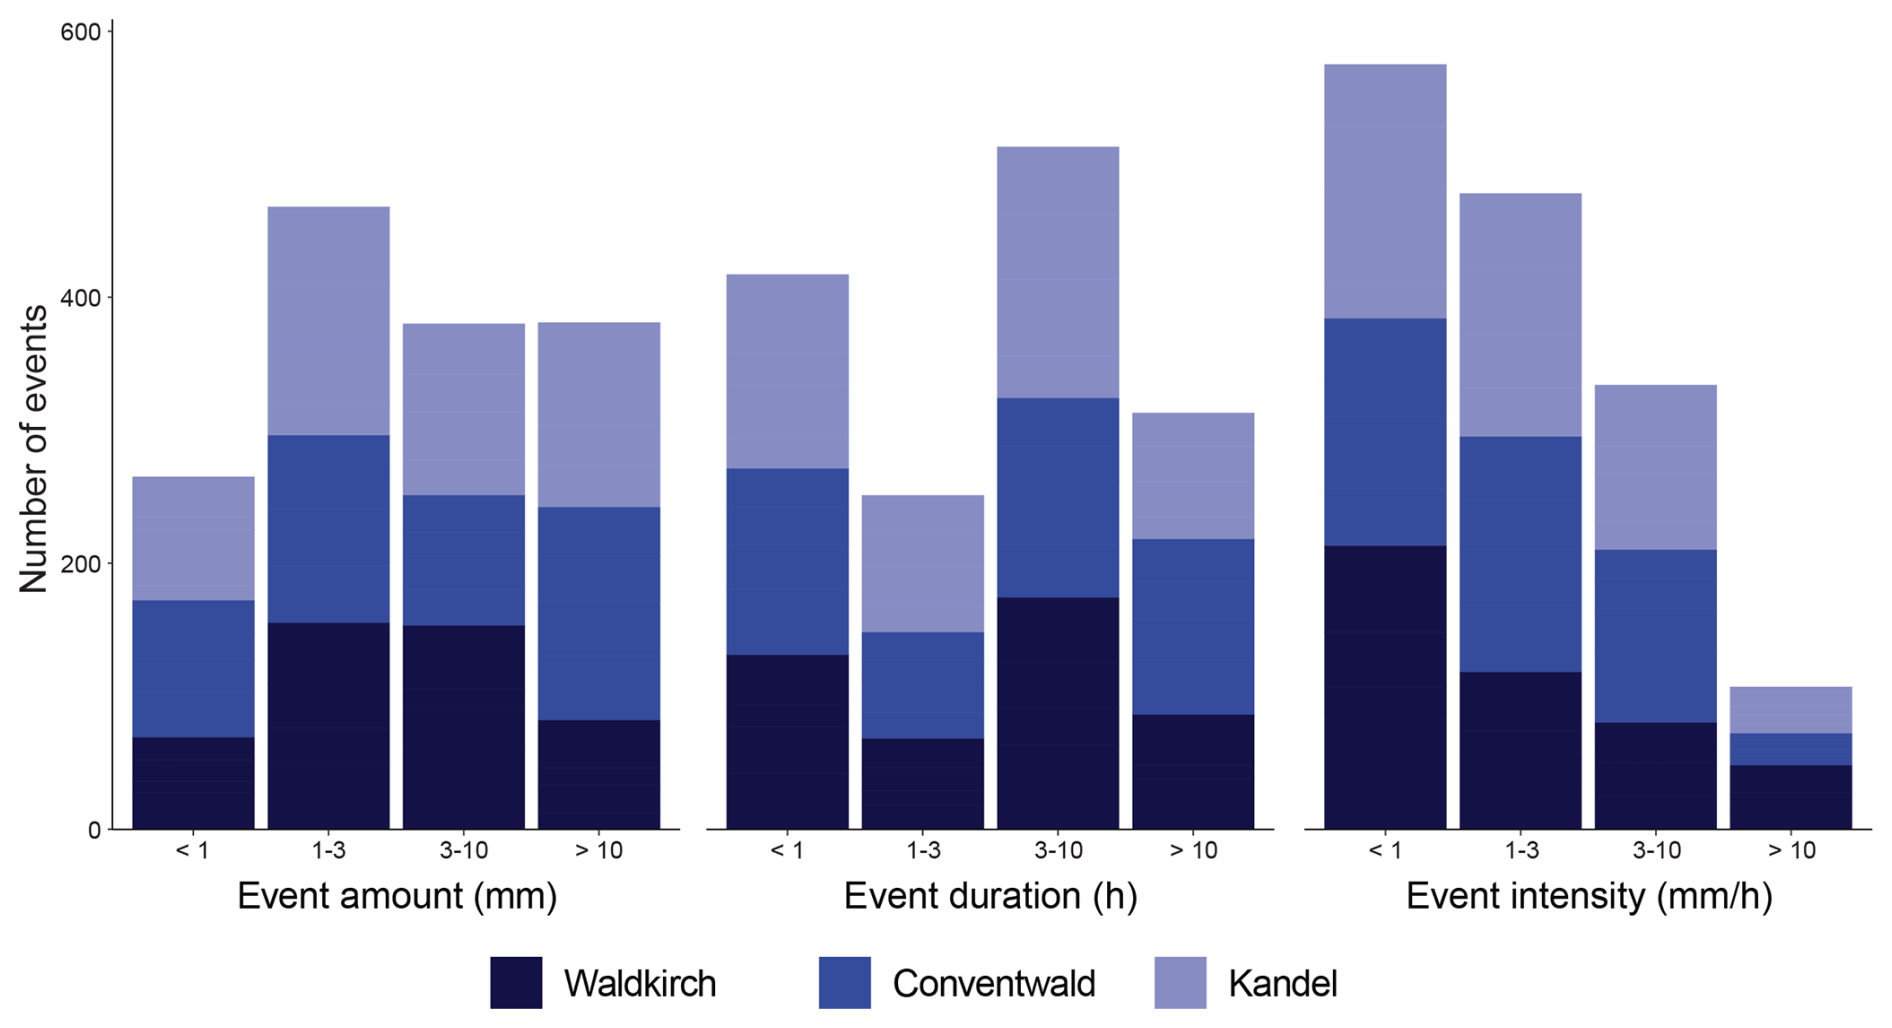
For a characterization of these events, we analyzed their throughfall amount, intensity, and duration. Figure 5 illustrates the distribution of these characteristics. To highlight some specific cases: 18 % of the events are very small, ranging between 0.5 and 1 mm, whereas 25 % exhibit a total precipitation amount exceeding 10 mm. The majority of events (70 %) show average rainfall intensities below 3 mm h−1, with only 7 % experiencing intensities greater than 10 mm h−1. The duration distribution presents a slightly different pattern, with a substantial portion of events lasting less than 1 h (28 %) and another high portion between 3 and 10 h (33 %). Only 17 % of the events last between 1 and 3 h, and 21 % exceed a duration of 10 h. Notably, we also identified 83 events that lasted longer than 24 h.
3.3 Retention and moisture content
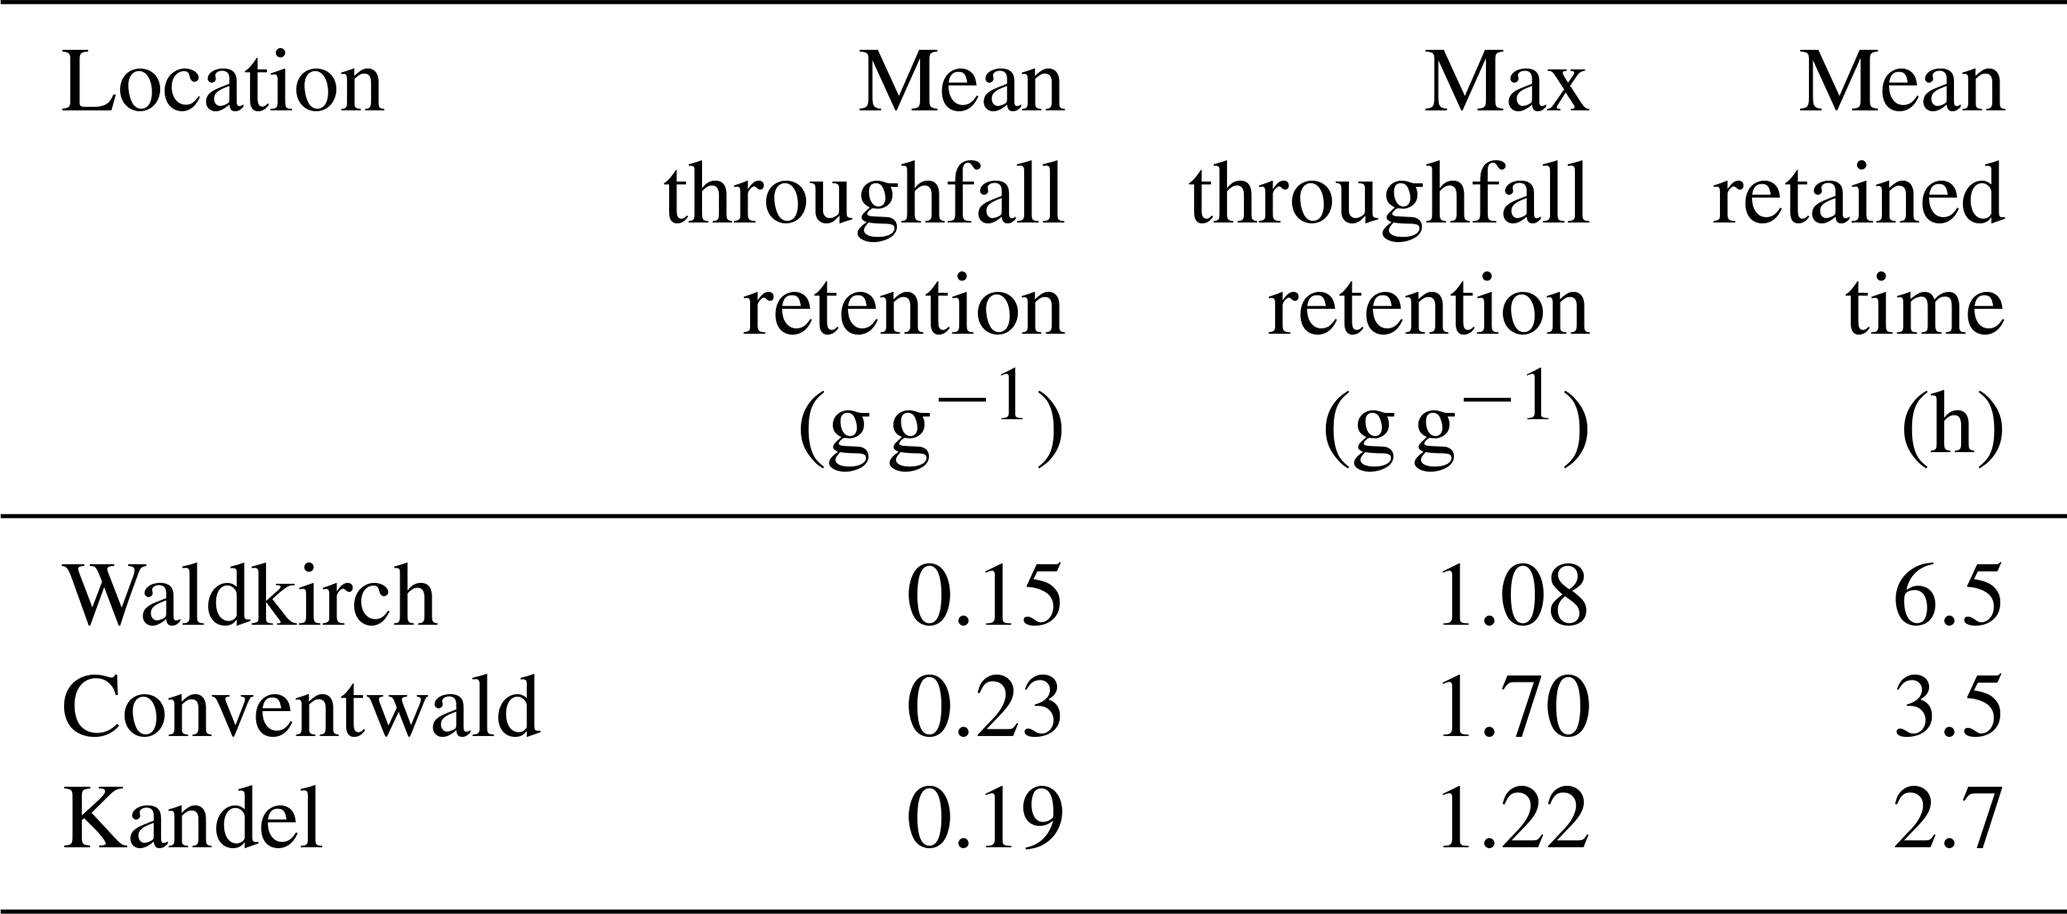
Approximately 72 % of the observed precipitation events showed throughfall retention of water in the FF for periods exceeding 10 min. The average amount of initially retained rainfall water varied, ranging from 0.23 g g−1 FF at the Kandel site to 0.15 g g−1 at the Waldkirch site (Table 3). The maximum retained throughfall amounts before drainage started was detected between 1.08 g g−1 at Waldkirch and 1.22 g g−1 at Kandel. In terms of duration, the longest throughfall retention times were recorded at the Waldkirch site. Notably, the volume of retained water tended to increase with higher precipitation totals (Supplement).
Table 3Initial throughfall retention statistics for the three research sites.
Given the absence of clear differences in throughfall retention amounts and durations among the three sites, we investigated other potential influencing factors, such as pre-event soil moisture. Our findings indicate that pre-event soil moisture significantly affects the likelihood of initial throughfall retention (duration > 10 min) at Conventwald and Kandel site. Retention characteristics can not only be affected by pre-event conditions but also by event characteristics like amount, intensity, duration or intra-event variability. Figure 6 illustrates the comparison of relative soil moistures for events with and without throughfall retention, revealing a tendency for retention to occur at lower soil moisture levels.
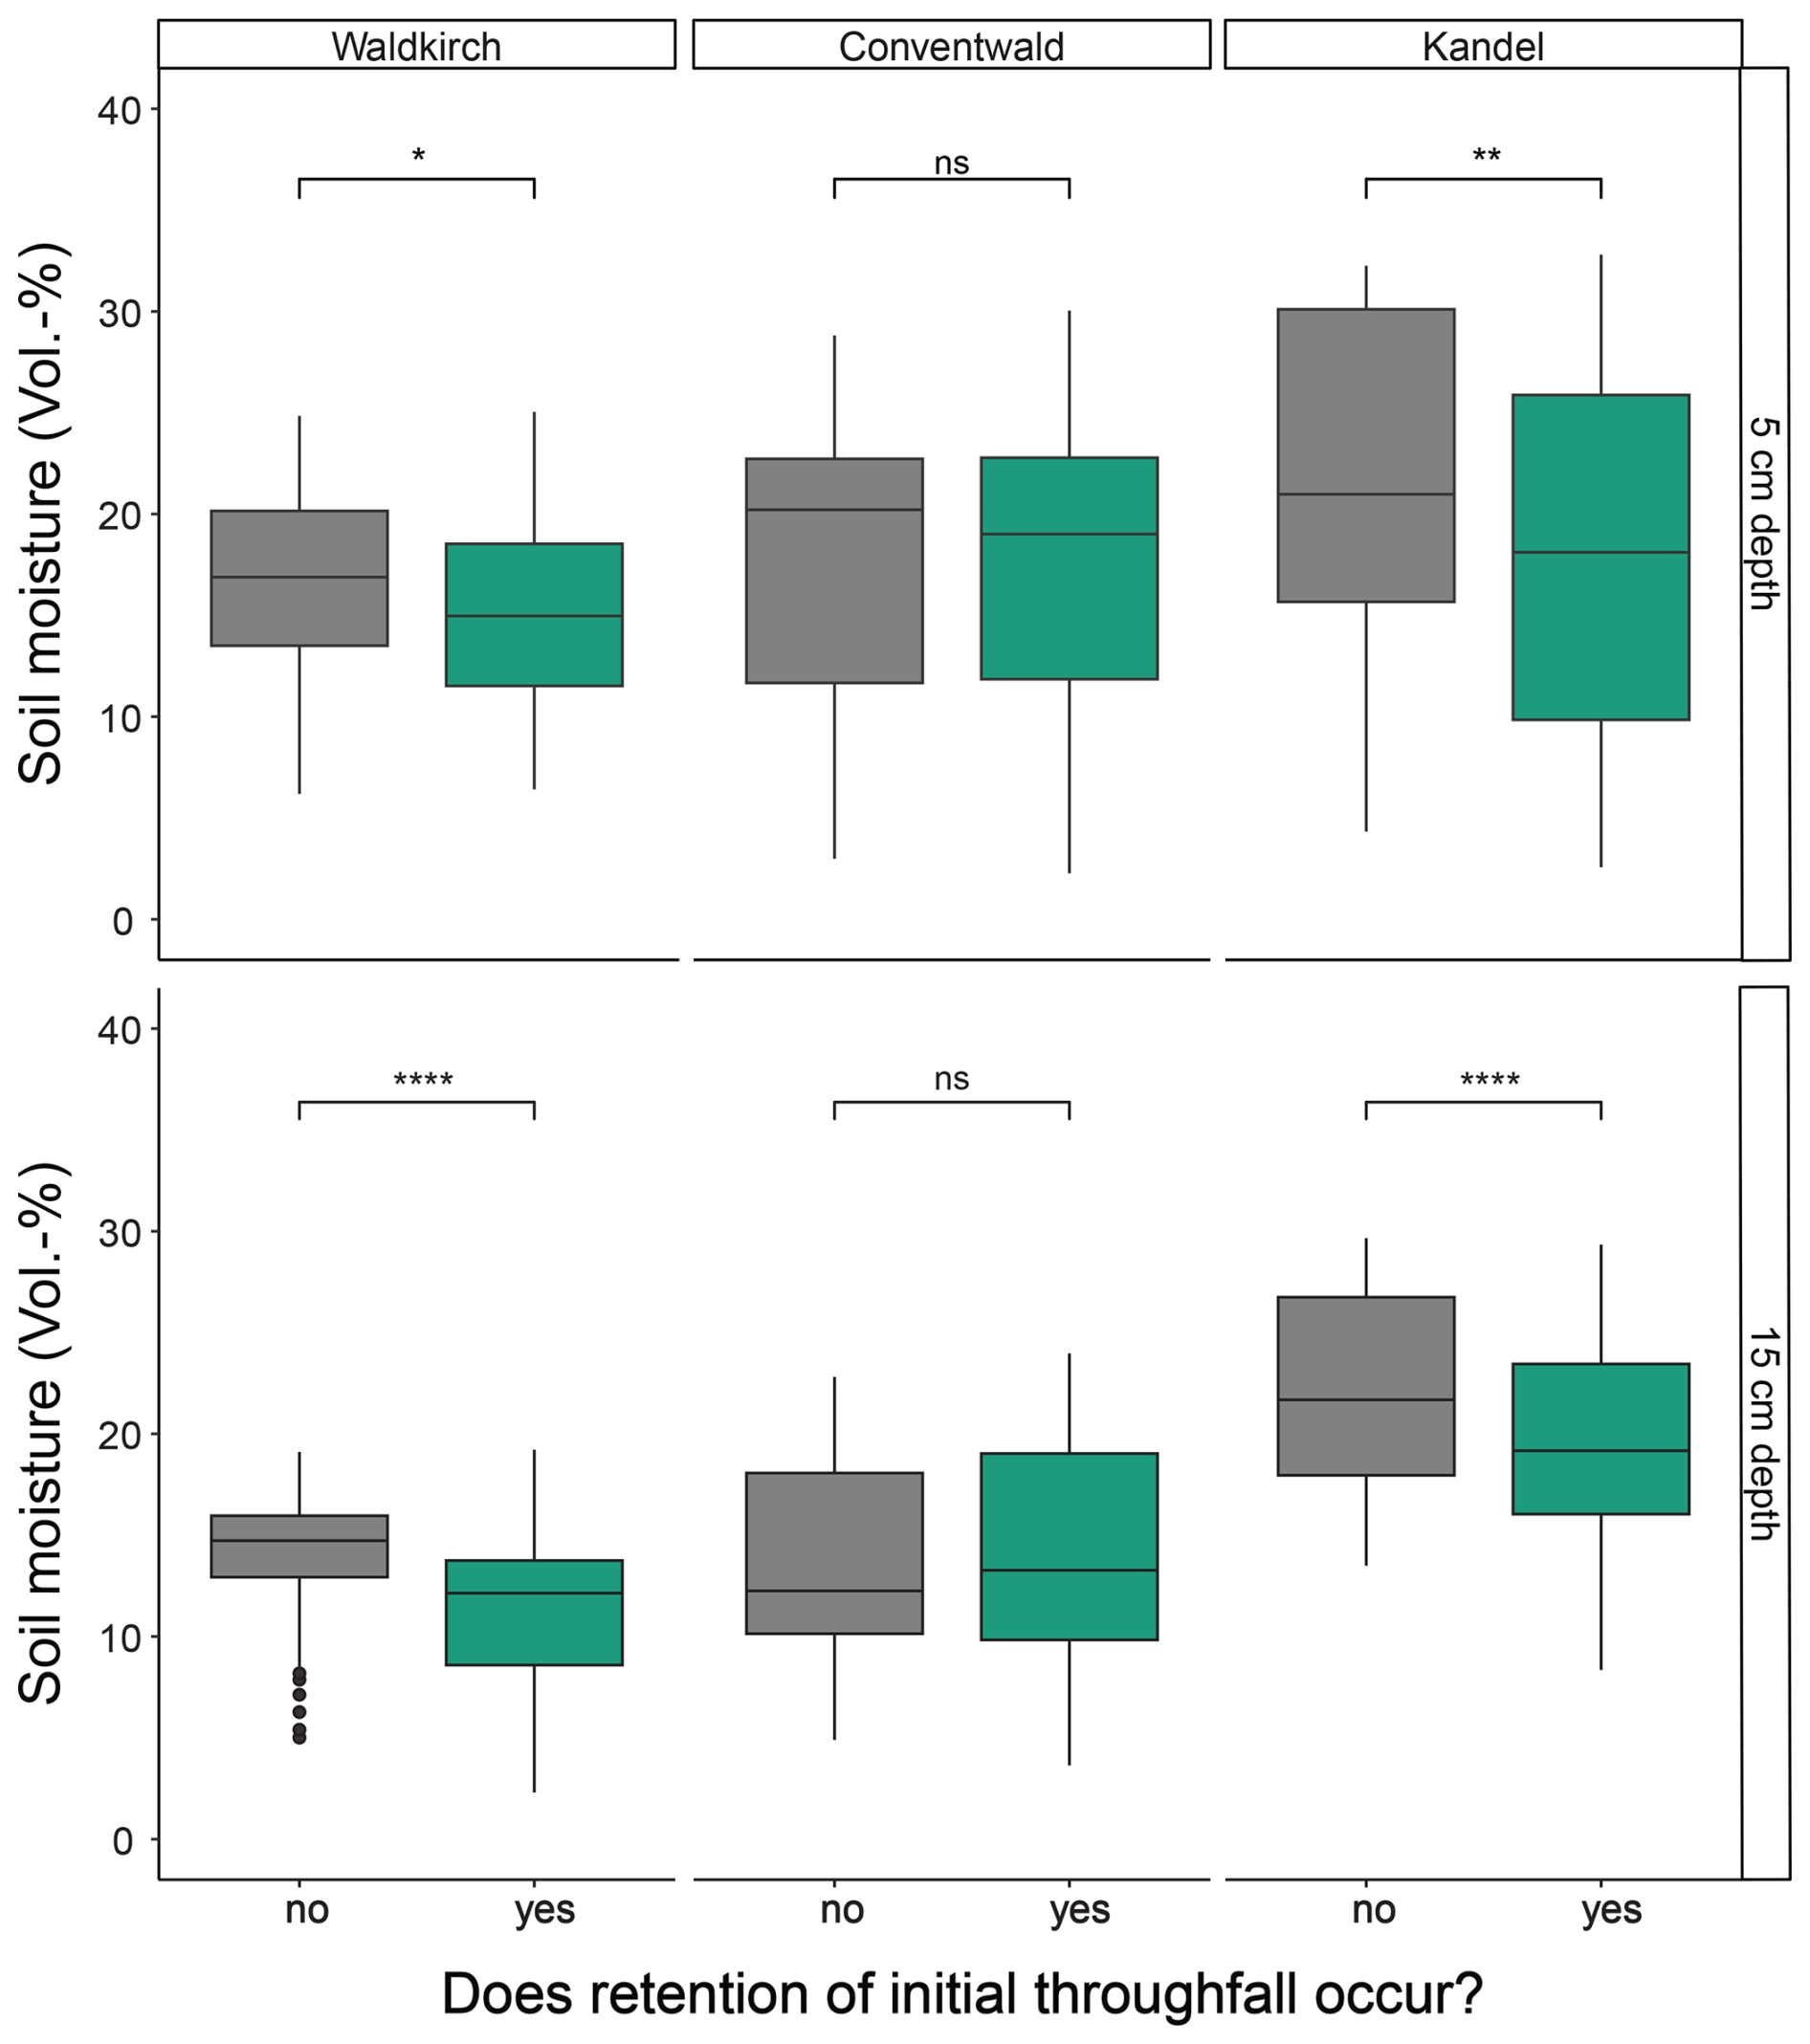
Figure 6Tendency for throughfall retention to occur in relation to soil moisture at 5 and 15 cm depth. No = There is no retention occurring in the first interval of an event, yes = retention occurs during the first interval (10 min) of the event. We found a significant difference in soil moisture leading to initial throughfall retention or not in Waldkirch and at Kandel. Retention usually occurs swith lower soil moisture contents. Overlaid significance symbols indicate the results of statistical t-tests between the groups. The significance levels are represented as follows: 0.05), 0.01), 0.001), 0.0001), and ns (p> 0.05)
3.4 Storage capacity
The mean water holding capacity (Cmin) of the FF exhibits high variation across the three sites (Fig. 7a), ranging from 1.4 g g−1 FF in Waldkirch and 4.2 g g−1 at Kandel. A statistically significant difference in the mean Cmin values is observed between all sites. The pattern observed for interception capacity (Cmax), which corresponds to short-term storage (Fig. 7b), resembles that of Cmin, but is higher since gravitational water is included. The mean interception capacity ranges from 1.5 g g−1 at the Waldkirch site to 4.4 g g−1 at Kandel. Once again, Conventwald and Kandel exhibit higher values at a similar level, suitable to their similar FF characteristics (typical Moder). The interception capacity for all sites differs significantly.
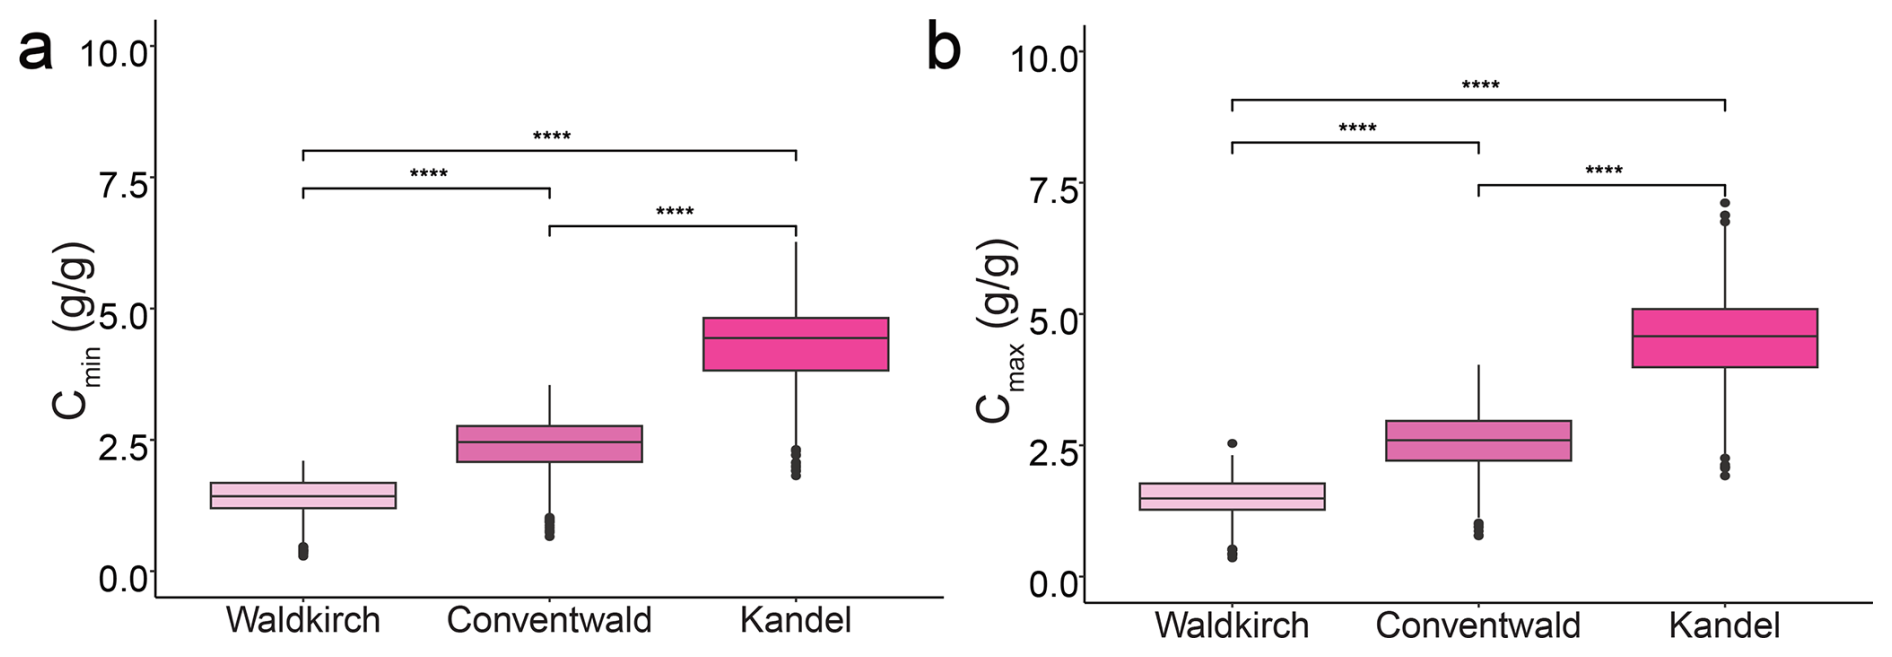
Figure 7Mean minimum (a) and maximum (b) water holding capacity (Cmin and Cmax) on the three different research sites. Overlaid significance symbols indicate the results of statistical t-tests between the sites. The significance levels are represented as follows: 0.0001).
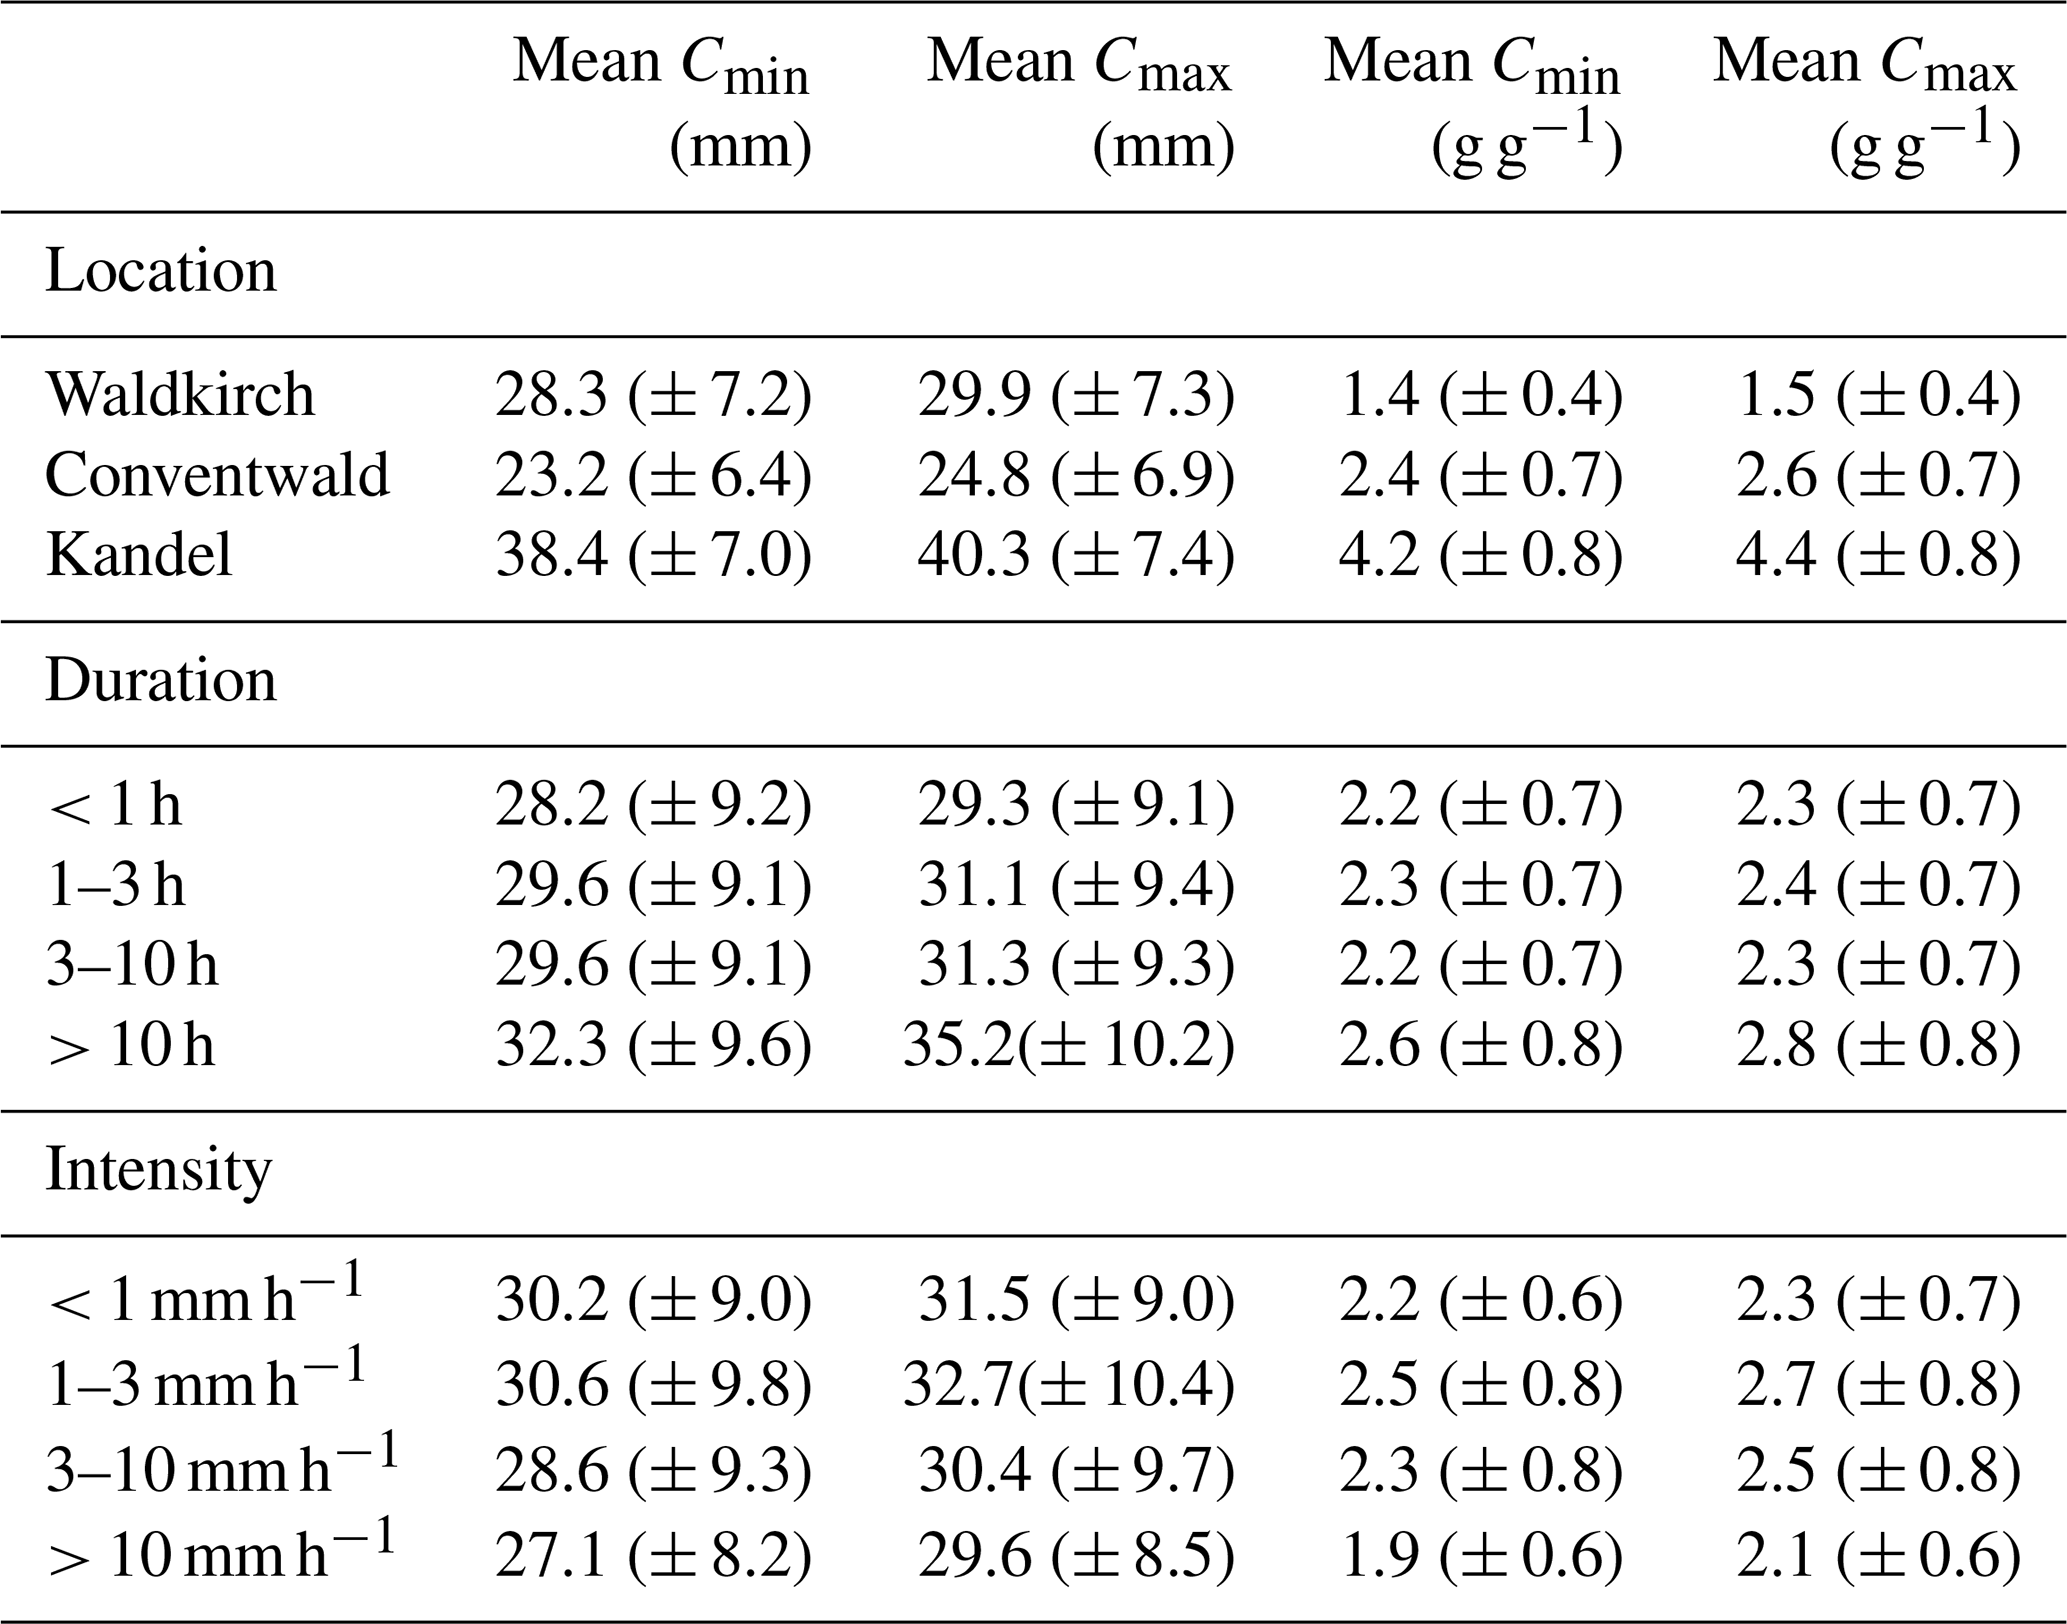
The water holding capacity (Cmin) is significantly influenced by the duration and, consequently, the intensity of rainfall events (Fig. 8a). Longer event durations, typically associated with lower intensities (Fig. 8b), allow for more effective filling of the storage capacity, resulting in an increase in Cmin with extended rainfall durations Conversely, during higher intensity events, water tends to flow rapidly through the relatively large pores of the FF, preventing effective filling of the storage. Detailed analysis of varying precipitation intensities and durations reveals that Cmin is getting much higher with prolonged rainfall events 2.2 g g−1 for a rainfall event lasting less than 1 h up to mean Cmin 2.6 g g−1 for very long events (> 10 h). For the intensity data it becomes especially visible that for intensities higher 10 mm h−1 the mean storage capacity drops down to 1.9 g g−1. Likewise, Cmax is influenced by the duration of precipitation events. Here, the values are ranging from 2.3 g g−1 for events lasting less than 1 h to 2.8 g g−1 for events exceeding 10 h. Also, the Cmax values for events with an intensity higher than 10 mm h−1 are much smaller with 2.1 g g−1. All corresponding numbers can be found in Table 4.
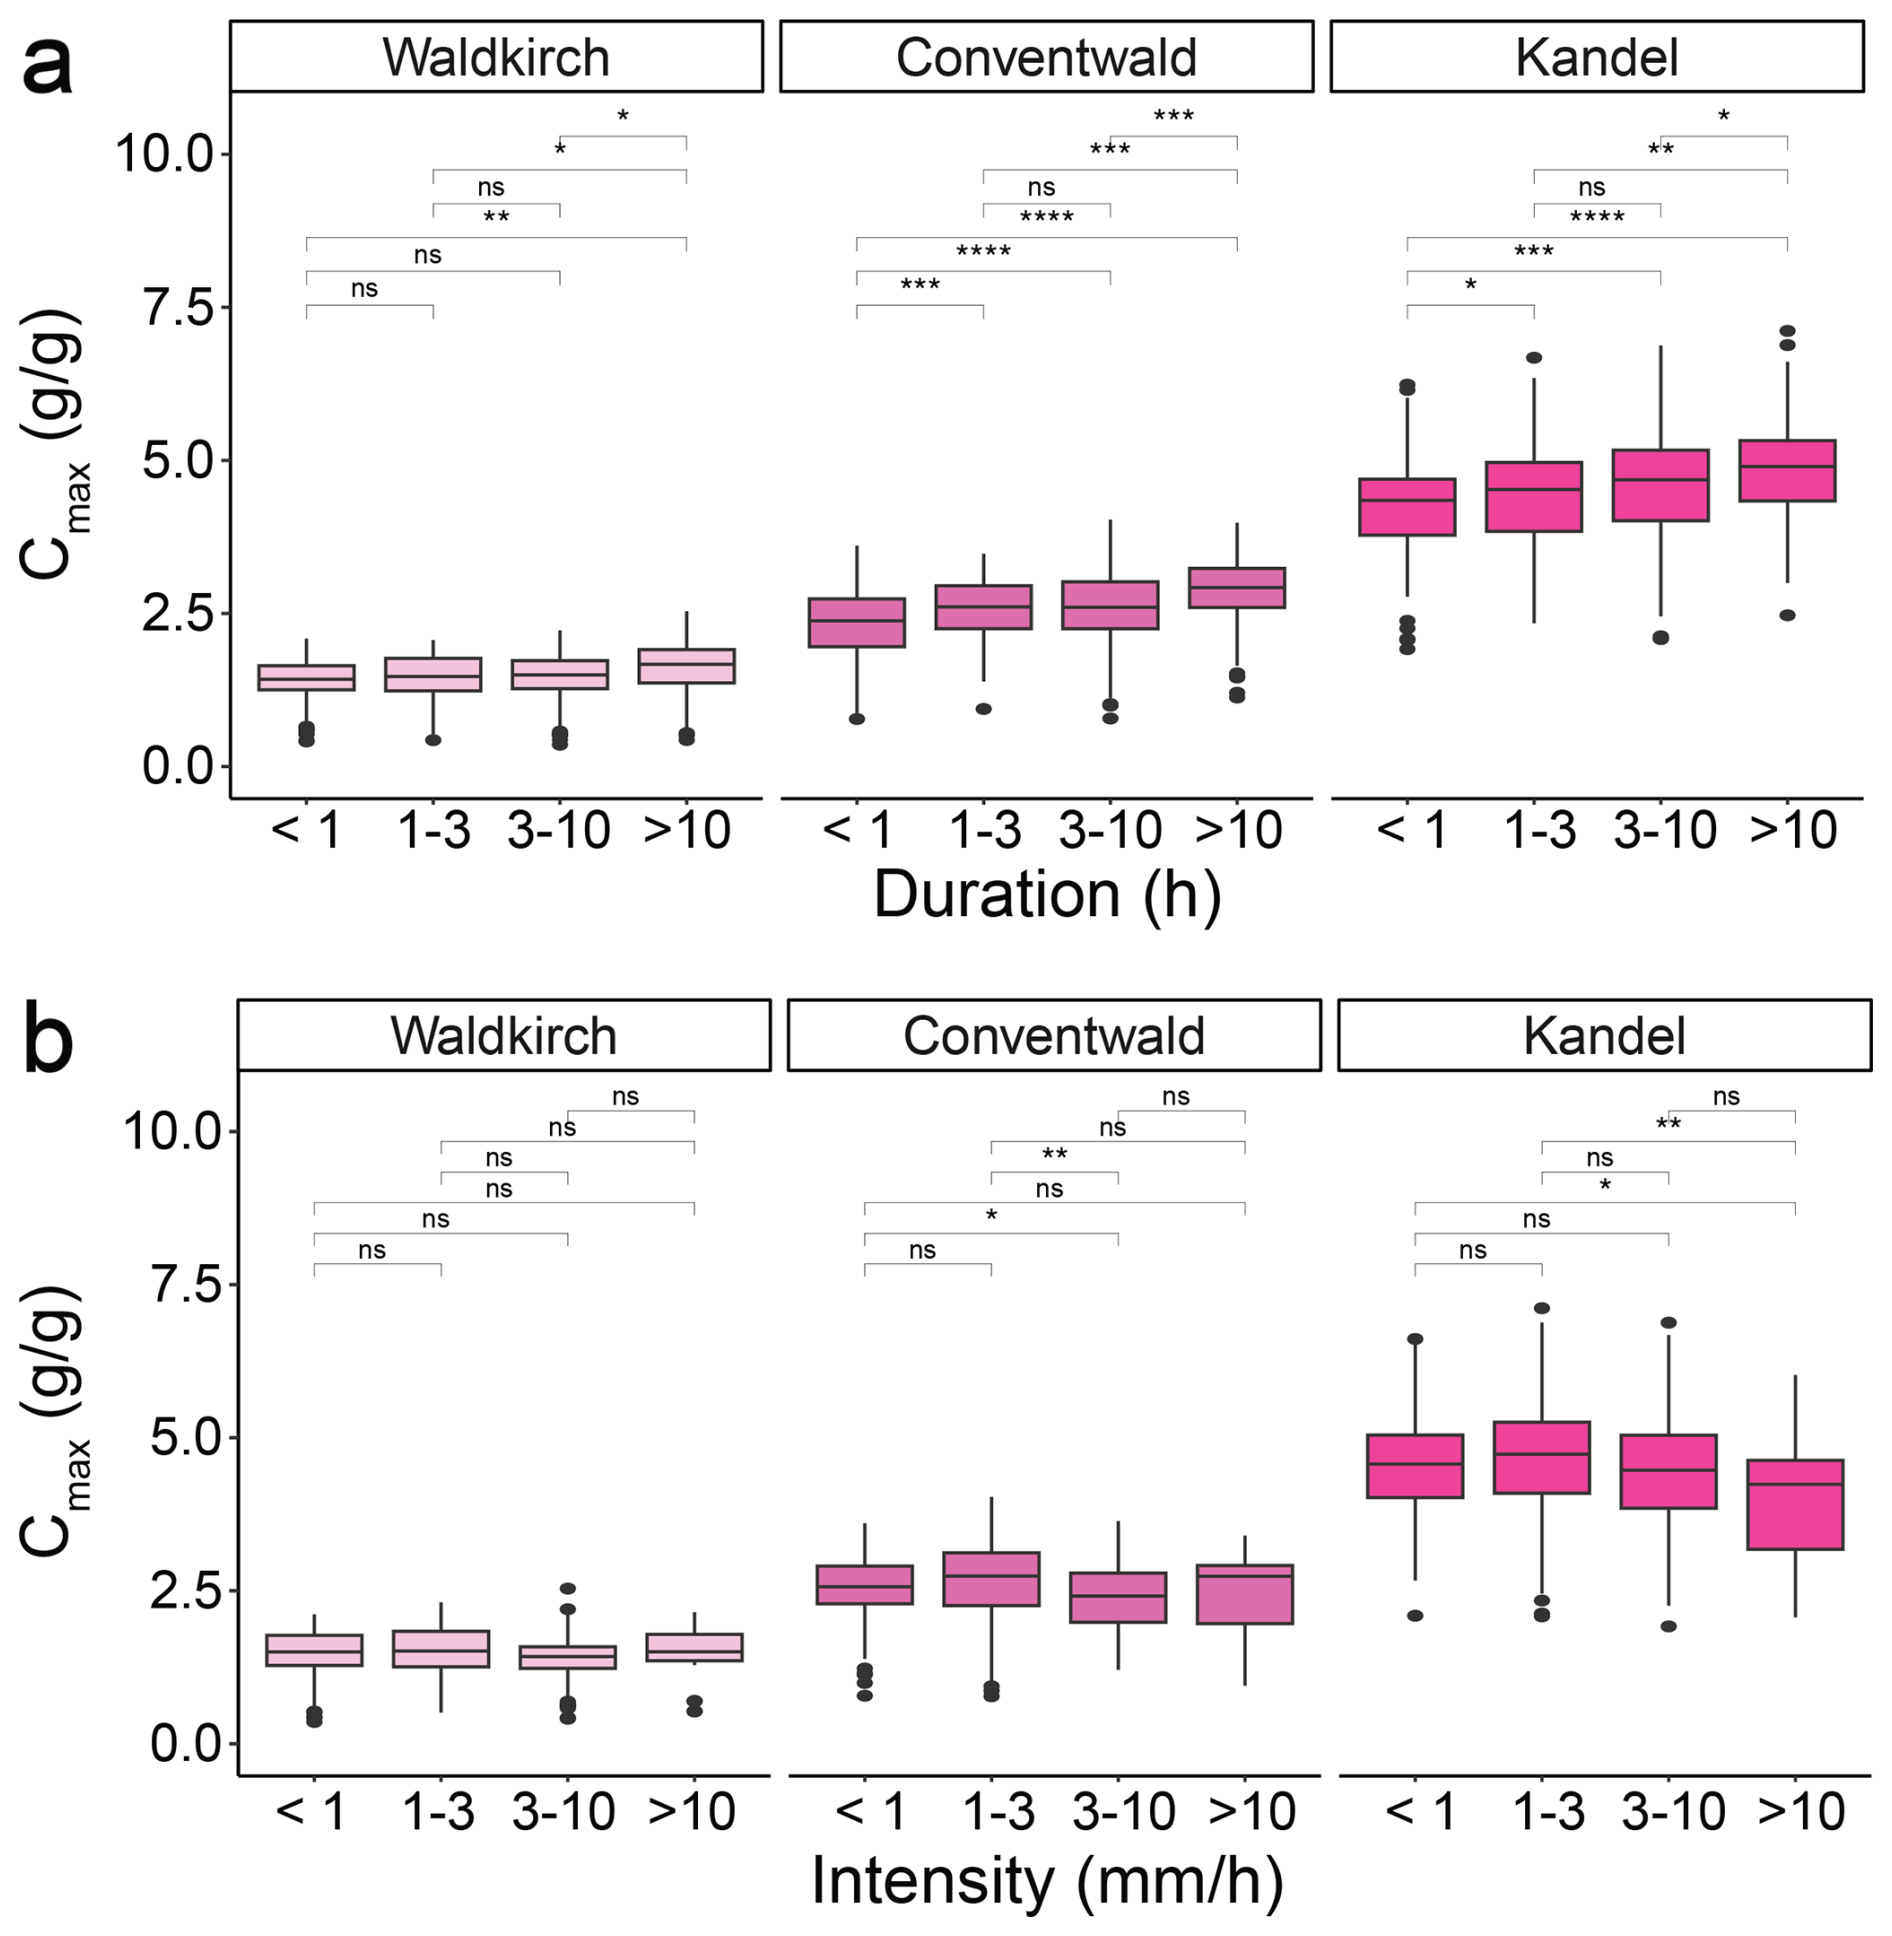
Figure 8Mean interception capacity (Cmax) on the three different research sites and for different precipitation durations (a) and consequently different precipitation intensities (b) overlaid significance symbols indicate the results of statistical t-tests between the groups. The significance levels are represented as follows: 0.05), 0.01), 0.001), 0.0001), and ns (p> 0.05).
Table 4Mean values and standard deviation (brackets) for minimum storage capacity (Cmin) and maximum storage capacity (Cmax) in total amounts (mm) and as mass fraction (g g−1) at the three different sites and for distinct precipitation durations and intensities.
3.5 Evaporation
Evaporation on rain-free days, as shown in Fig. 9 for a subset spring and a summer period exhibits a pronounced diurnal pattern with a peak around midday. The highest evaporation rates (mm h−1) occur at noon, coinciding with maximum temperatures and peak solar radiation. In Fig. 9a we present the evaporation rates in Spring 2025 reaching up to 0.4 mm h−1 when the canopy is not yet fully developed, while during the depicted period in Summer 2024 with a fully closed canopy (Fig. 9b), the maximum observed evaporation rate is only 0.16 mm h−1. For both periods the soil moisture varied between 13 vol % and 15 vol %, while the mean air temperature in spring was 15 °C and in the depicted summer period was 20 °C
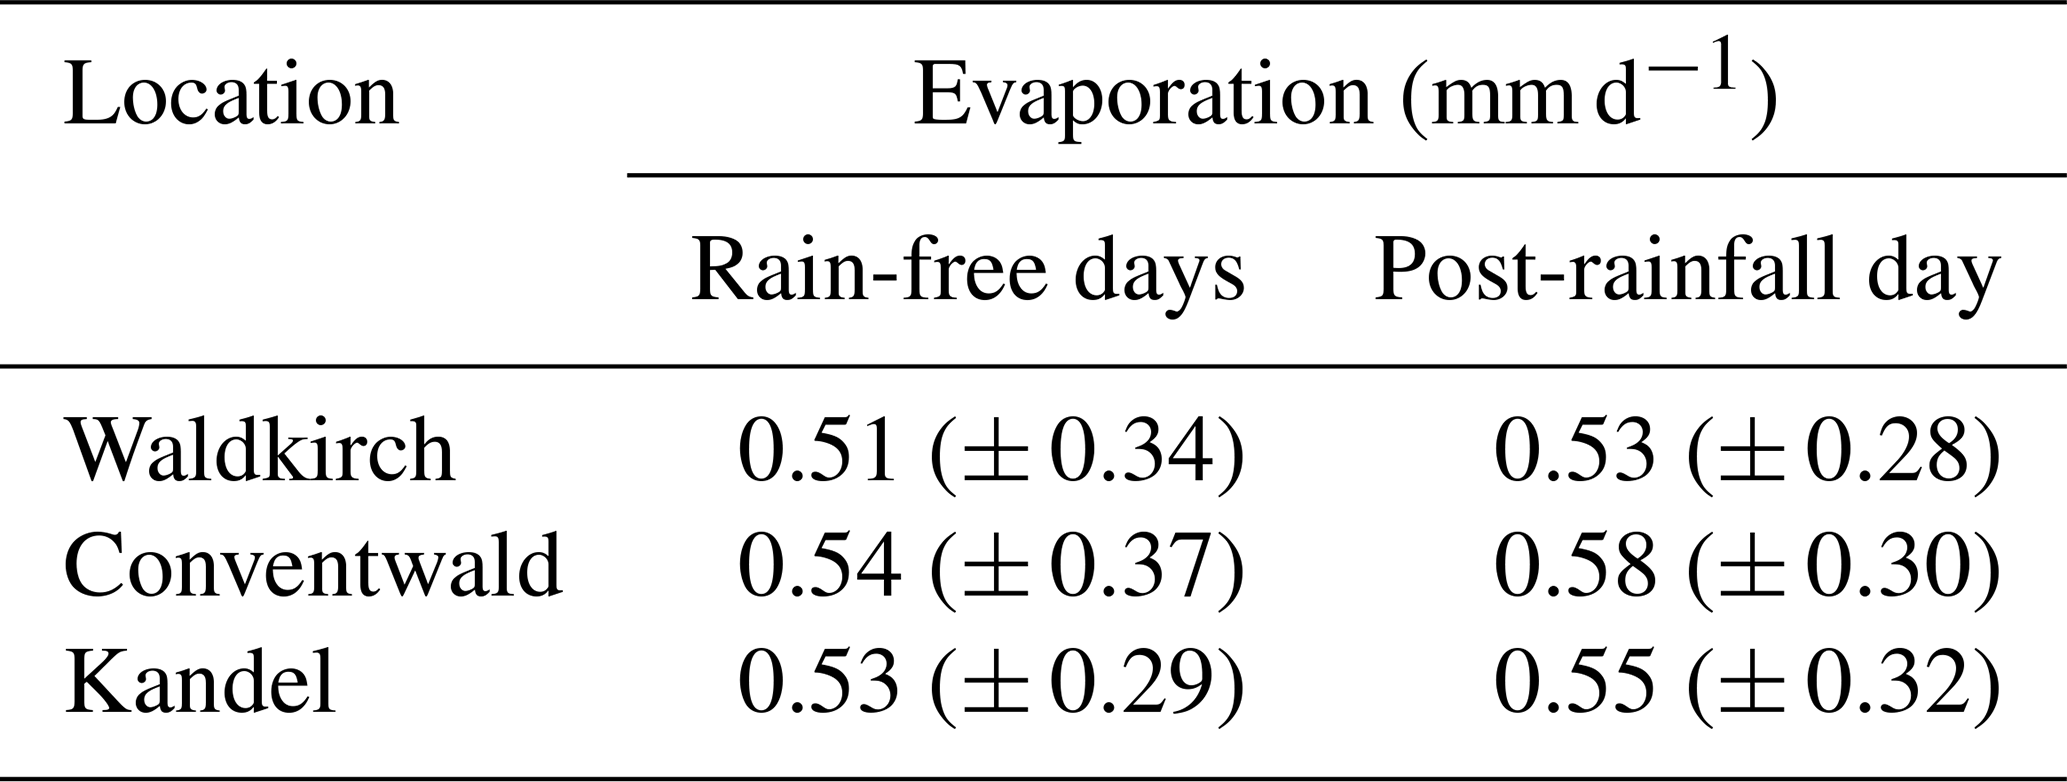
Average daily evaporation rates for days without rainfall range around 0.5 mm d−1 for the observed period. When examining daily evaporation rates on rain-free days, it becomes apparent that daily evaporation rates do not differ significantly between the three research sites, but are highest at the Conventwald site, followed by Kandel, and Waldkirch. Due to the limited duration of rain-free periods (generally only a few days), overall daily evaporation rates do not differ substantially from first-day following precipitation evaporation, with mean values only slightly lower (Table 5).
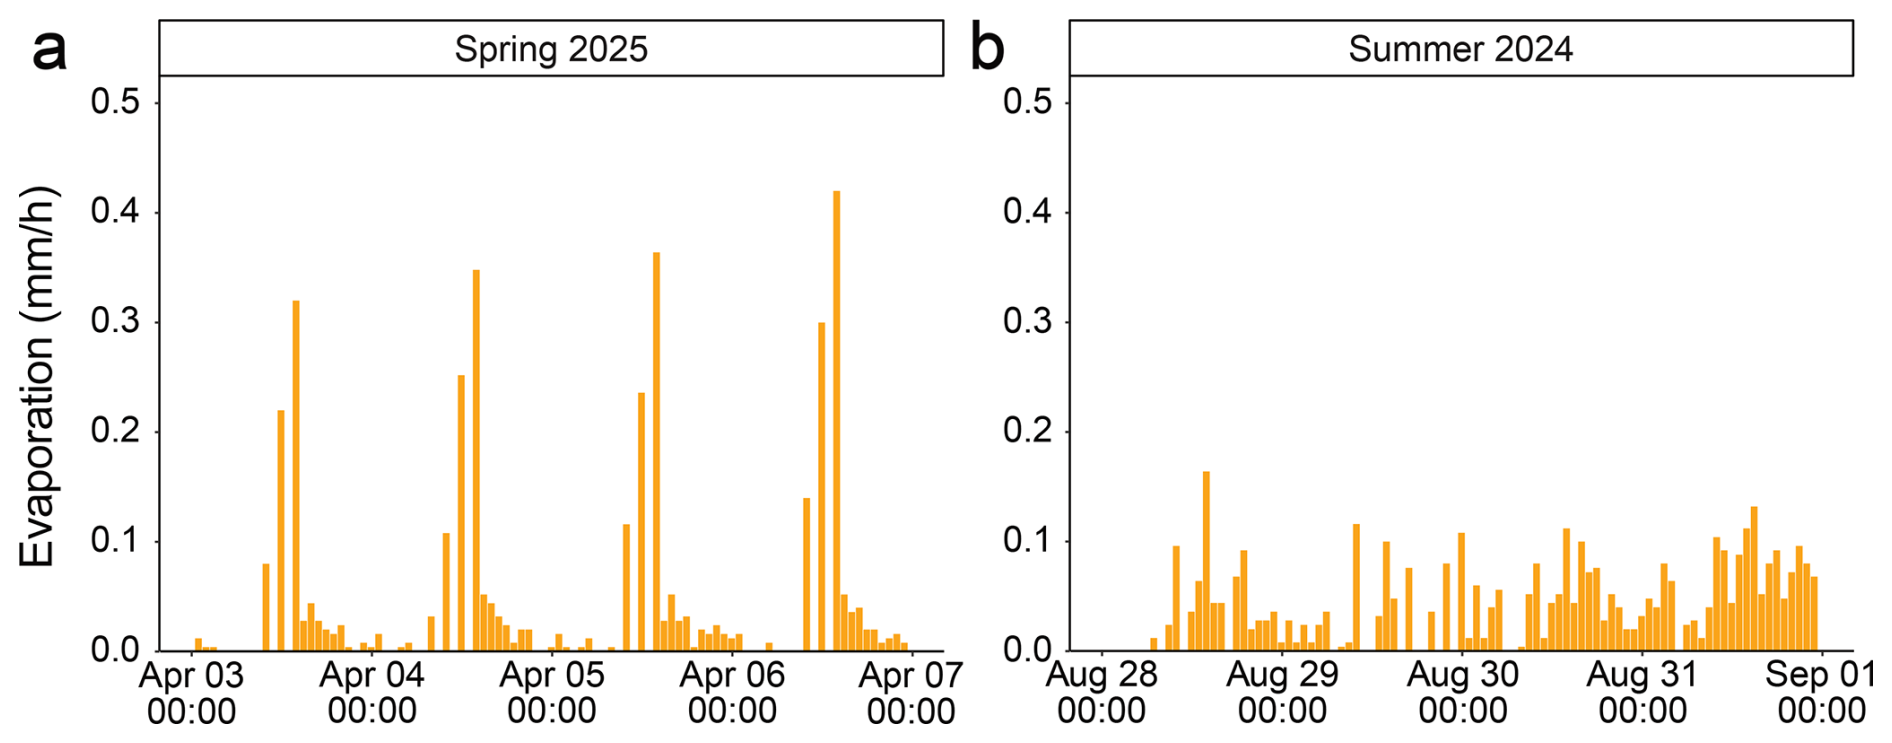
Figure 9Diurnal pattern of evaporation fluxes from the forest floor for one exemplary timespan (28 August 2024–31 August 2024) and lysimeter (Spruce crown edge, Conventwald).
Table 5Mean values and standard deviation (brackets) of evaporation rates for the three sites.
3.6 Infiltration distribution
The blue boxes in Fig. 10 depict the average proportion of throughfall between the left and right sides in relation to the lysimeter site setup for each of the twelve lysimeters. In some cases, such as Kandel Beech crown middle, precipitation is equal proportioned (50 % 50 %), whereas the most uneven proportion was observed in Waldkirch Spruce crown edge (45 % 55 %). Statistical analysis revealed that in three quarters of the lysimeters (nine out of twelve), one side receives a significantly larger proportion of precipitation (bold numbers).
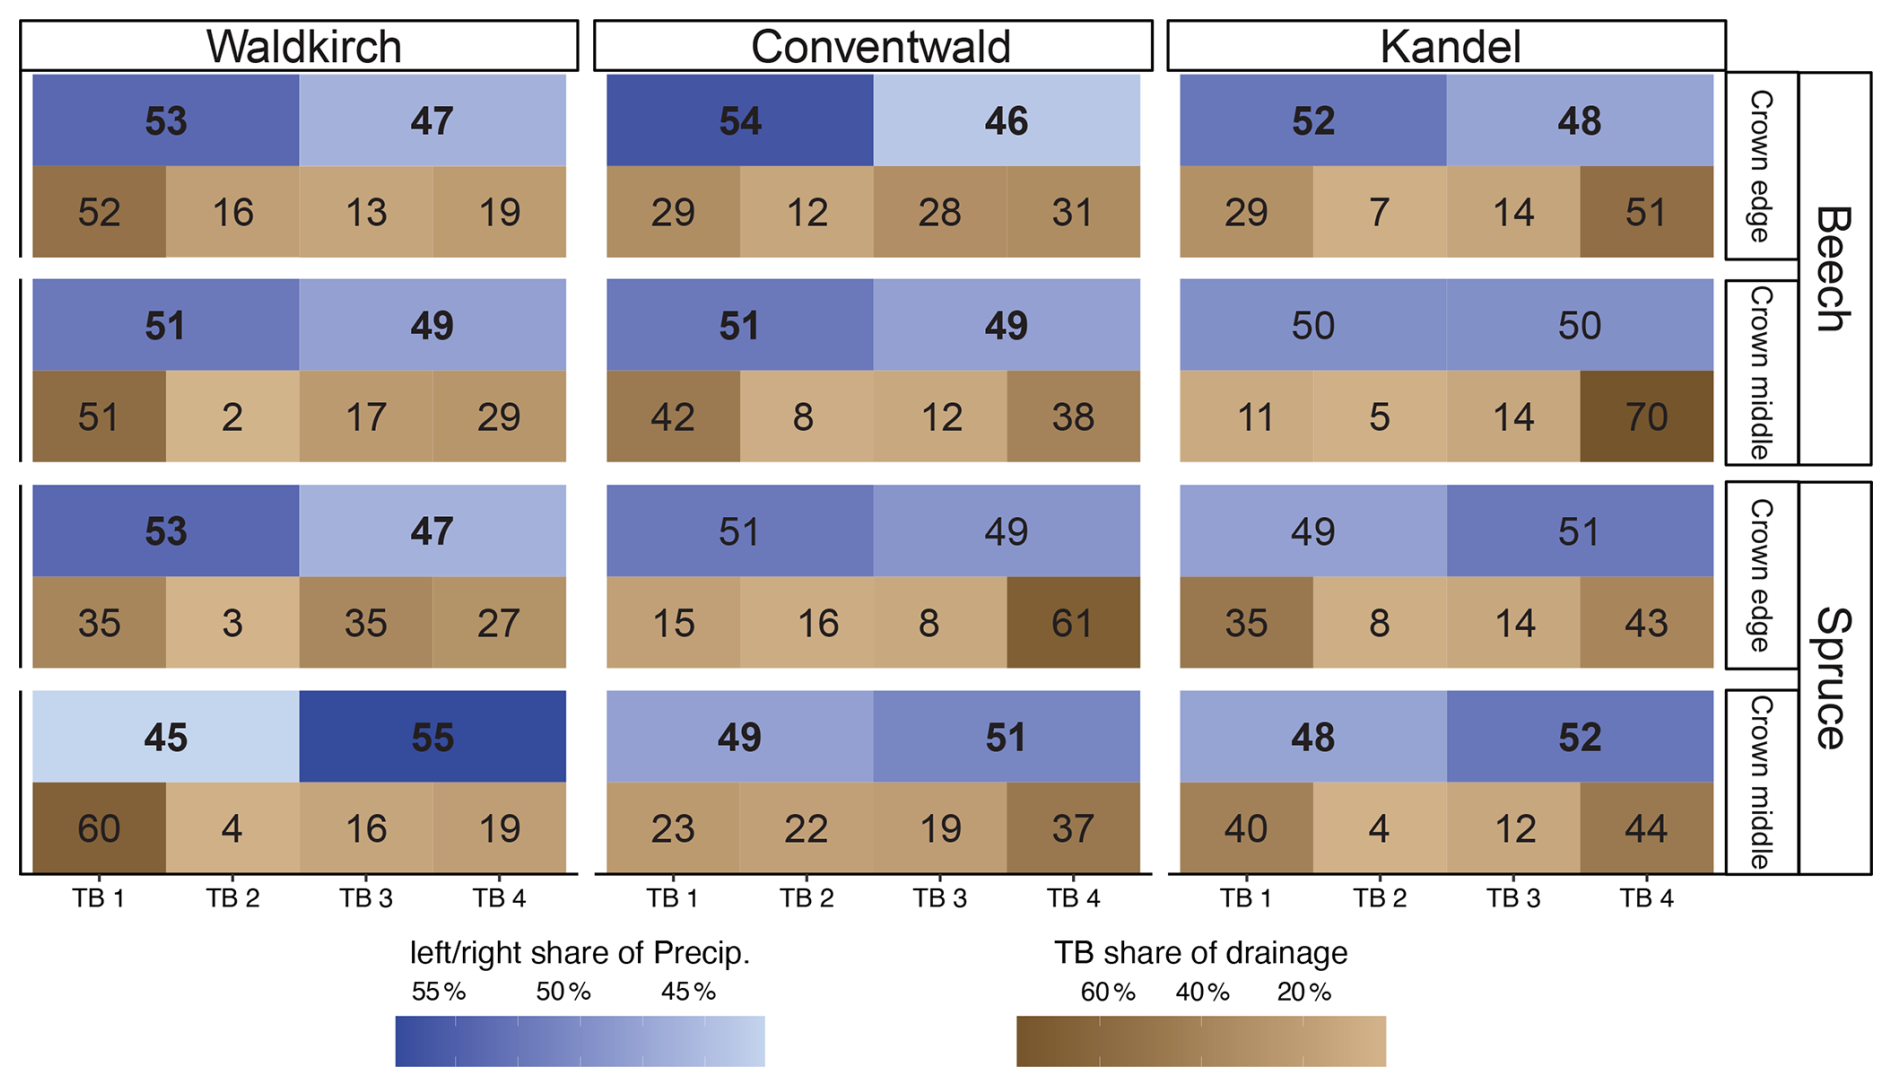
Figure 10Percentage share of precipitation (blue) on the left/right site of the lysimeter in relation to the field setup, bold numbers show a significant difference (t-test), and infiltration distribution (brown), showing the ability of the FF to redistribute water fluxes.
The brown boxes below illustrate the distribution patterns of percolating/draining water, divided among the four drainage grids of each lysimeter. The numbers represent the percentage share of total drainage at each grid location. Here, too, the degree of distribution varies: some lysimeters, such as Conventwald Beech crown edge, exhibit relatively even distribution, while others, such as Kandel beech crown middle, show pronounced heterogeneity.
If the spatial patterns of precipitation and drainage are similar, we assume that there is minimal redistribution of precipitation water by the FF e.g. Waldkirch Beech crown edge, where both precipitation and drainage are concentrated on the left side (primarily in Tables 1 and 2). Conversely, if the patterns differ, we attribute this to redistribution processes by the FF and/or the organic soil layer (e.g. Waldkirch Spruce crown middle). For the majority of the twelve lysimeters, we observe diverging patterns in drainage distribution compared to precipitation input. This supports our hypothesis that the FF plays a critical role in redistributing incoming water, which may contribute to the development of preferential flow paths.
4.1 Initial throughfall retention
Our findings support the hypothesis that a moist FF lacks the capacity to retain additional water, whereas throughfall retention capability increases in drier conditions. The outliers observed in the “no retention” boxplots may be attributed to hydrophobicity, which can occur under very dry conditions (Vogelmann et al., 2013). We hypothesize that severe dryness induces hydrophobicity within the litter layer, which in turn reduces water retention and promotes rapid percolation. But this hypothesis needs further testing. The unusually wet year 2024 precluded the development of these hydrophobic conditions necessary for observation. As a result, the specific processes associated with extreme dry-state behaviour remained dormant and could not be analyzed during the study period.
4.2 Storage capacity
Our findings show that sites with Moder FFs in contrast to Mull FF have higher water storage capacities by mass fraction, leading us to conclude that the ability to hold water is influenced by the FF form and therefore the proportion of organic fine material (OFM) rather than just a function of FF thickness. This suggests that the storage capacity is determined not only by the volume of available pores but also by the specific mechanisms that allow water to enter them. This is evident when contrasting the wetting mechanisms of the canopy and the forest floor: whereas canopy interception is heavily influenced by the momentum and velocity of raindrops (Keim et al., 2006; Nanko et al., 2022), the wetting of the forest floor is governed by low-velocity flow and capillary forces within detrital pores. Consequently, storage in the FF is less a result of drop impact and more a function of the hydraulic conductivity and pore structure of the organic-mineral interface.
The range of observed water-holding capacity (Cmin) and interception capacity (Cmax) across our lysimeter network (Fig. 7) can be attributed in part to our analytical approach. All precipitation events were analyzed without preconditioning the FF to a dry state, meaning storage was not empty at the onset of an event. This methodological choice differs to most laboratory studies, which typically being experiments on (oven-) dried material. In the natural environment, the litter layer is rarely, if ever, completely dry, and precipitation events frequently occur in rapid succession, preventing the full depletion of storage between them. This distinction complicates direct, quantitative comparisons with laboratory-derived values. For instance, (Sato et al., 2004) reported storage values of 0.44–1.74 g g−1, while Putuhena and Cordery (1996) measured values around 1 g g−1. The higher mean storage capacities observed in our study likely stem from the composition of our lysimeters, which were filled not only with freshly fallen litter but also with fragmented FF material and the upper centimetres of the mineral soil (A horizon), resulting in a more complex, layered porous medium with greater overall water retention potential. As anticipated, the mean Cmax values were consistently higher than Cmin, as this metric includes gravitational water that drains rapidly following the cessation of rainfall (Putuhena and Cordery, 1996; Sato et al., 2004).
Aside from the intrinsic properties of the FF, our event-based field data show that storage capacity is also dynamically modulated by the specific characteristics of the precipitation event itself. We found that Cmin and Cmax are more effectively filled during prolonged, low-intensity rainfall events. This finding partly differs from previous research. Sato et al. (2004), for example, found that higher intensities were associated with greater storage, which could be attributed to the larger overall water volumes used in the controlled experiments. Similarly, our results contrast with those of Keim et al. (2006), who performed canopy irrigation experiments and found an increase in storage for canopy interception with rainfall intensity. These discrepancies may be attributed to differences between field observations and laboratory simulations. In field studies, water storage is influenced by naturally varying pre-moisture conditions and precipitation characteristics, including intensity, duration, and magnitude. In contrast, these parameters are strictly controlled in laboratory settings, allowing for precise manipulation. Natural rainfall events with high intensity and long duration are uncommon in our study region. As a result, our field data, which reflects the actual distribution of storm events, is likely to underestimate these more extreme, high-volume events that can be easily created in the laboratory. Consequently, our results do not necessarily contradict previous work but rather provide a crucial real-world perspective, underscoring that the frequency and character of natural rainfall are critical determinants of FF storage.
4.3 Evaporation
Examining daily evaporation rates on days without rain reveals that they are highest at the Conventwald site, followed by Kandel and Waldkirch, but do not differ significantly and are around 0.5 mm d−1. Other studies, such as Magliano et al. (2017) align well with evaporation to be 1.1 ± 0.3 mm d−1 for forest litter at the first day after rainfall and Deguchi et al. (2008) with seasonal variations in evaporation rates from the FF to be 0.2 ± 0.13 mm d−1. The high spatial variability of their observation was attributed to the local photo-environment of each sampling point, rather than to litter conditions, if the spatial variation in air temperature or vapour pressure deficit at the FF is small relative to variation in radiation (Deguchi et al., 2008). The differences of evaporation between our research sites could also be attributed to the larger water availability in the FF storage at Conventwald, as discussed in the previous section. Additionally, differences in site exposure to wind and solar radiation are likely to contribute to the observed patterns. Notably, despite Waldkirch being the warmest site, it has the lowest evaporation rates, implying that temperature is not the primary controlling factor for evaporation of the FF, but more the other factors used in typical evaporation models (Penman-Monteith; Beven, 1979), like solar radiation, humidity or wind speed (Levia et al., 2011). This is also evident when we look at the difference in diurnal pattern in spring and summer. Even though average temperatures are higher in summer, we see higher hourly evaporation rates in spring due to higher solar radiation under the less dense canopy. In general this diurnal pattern is consistent across all lysimeters and has also been described by Deguchi et al. (2008), who reported midday peaks of approximately 0.04 mm per 30 min (equivalent to 0.08 mm h−1), which aligns well with our observations. Our high-resolution data further reveal hourly oscillations between peak evaporation and near-zero values. These fluctuations are attributed to the influence of sunflecks, small gaps in the canopy that allow direct sunlight to reach the forest floor, which trigger rapid, transient increases in evaporation. It should be noted, however, that while these oscillations are prominent at the lysimeter scale, they may be smoothed out when scaling these results to a hectare or catchment level, as the local photo-environment varies significantly across the landscape.
The differences in the pore size distribution between the FF and the underlying mineral soil can create a capillary barrier. This capillary barrier effect has the potential to reduce the transport of water vapour from the mineral soil via FFs into the atmosphere. As a result, the FF protects the mineral soil from evaporation. Our comparatively low evaporation rates suggest that this protective function of the FF is present, just like Magliano et al. (2017) compared evaporation rates from FF (1.1 mm d−1), bare forest soil (4.4 mm d−1) and pasture (7.0 mm d−1). The effect of a protective function aligns also with the findings of Floriancic et al. (2023), who showed that the removing of the organic litter layer in a temperate mixed forest increased evaporation from the underlying mineral soil.
4.4 Infiltration
The FF also influences water fluxes from the atmosphere into the mineral soil, as demonstrated by the water repellency of litter surfaces (Greiffenhagen et al., 2006; Neris et al., 2013) or the low pore connectivity between the FF and the mineral soil. Water repellency or low wettability is frequently observed in FFs at much higher residual water contents than in mineral soils (Greiffenhagen et al., 2006; Wessolek et al., 2008). During dry periods, this water repellency potential increases significantly, especially for thicker FF layers (Gimbel et al., 2016). The water repellency of FFs has been shown to increase overland flow and runoff on inclined terrain (Neris et al., 2013) and alter infiltration dynamics and pathways (Gimbel et al., 2016; Orfánus et al., 2021). Additionally, it may cause preferential flow along wettable microsites, directing rainwater predominantly towards root surfaces (Wessolek et al., 2008). Our findings in Fig. 10 provide a first insight to the redirection of water fluxes by the FF at a small spatial scale. The high variation in spatially resolved infiltration suggests that the structural heterogeneity of the FF, specifically the presence of preferential flow paths, acts as a primary driver of this variability. This internal redistribution within the FF appears to exert a strong influence on infiltration patterns just like the spatial redistribution caused by incoming canopy throughfall and stemflow processes. However, further investigation is needed to fully quantify these effects and compare them to the throughfall variability, particularly under dry and potentially hydrophobic conditions, which were not sufficiently represented in the period of study.
The results of this one-year lysimeter study, based on the analysis of 1570 distinct precipitation events, demonstrate that the forest floor (FF) functions as a dynamic regulator of water flux in temperate beech-dominated forests. Our findings reveal that initial throughfall retention is not significantly driven by differences in FF thickness or mass but is instead primarily influenced by the pre-event water content. While the predominantly moist conditions of the study period limited the detection of significant hydrophobic effects, the clear correlation between higher storage capacities (Cmin and Cmax) and a higher proportion of organic fine material, typical Moder at the Kandel and Conventwald sites, underscores the critical role of FF composition in water regulation.
Furthermore, this study highlights that throughfall characteristics are as influential as FF properties in governing storage dynamics. Specifically, low-intensity, long-duration events facilitated a more effective filling of the FFs storage compared to high-intensity, short-duration events. The observed low evaporation rates further indicate that the FF serves as a vital protective barrier against evaporation from the mineral soil.
Finally, the use of the gridded lysimeter setup provided crucial evidence of spatial water redistribution, supporting the hypothesis that the FF plays a fundamental role in modifying sub-surface hydrological pathways and infiltration processes. Overall, these findings emphasize that FF properties, particularly mass and the presence of organic fine material, are primary determinants of water storage, retention, and redistribution within temperate forest ecosystems.
The code used during the current study is available from the corresponding author on reasonable request.
The dataset used and analysed during the current study is available on https://doi.org/10.60493/0apjq-0aa41 (Paulsen, 2026).
The supplement related to this article is available online at https://doi.org/10.5194/hess-30-4305-2026-supplement.
MW and HP designed the setup. HP developed the lysimeter setup. HP wrote the first draft of the manuscript and performed data analysis. The manuscript was revised by MW and edited by HP.
The contact author has declared that neither of the authors has any competing interests.
Publisher's note: Copernicus Publications remains neutral with regard to jurisdictional claims made in the text, published maps, institutional affiliations, or any other geographical representation in this paper. The authors bear the ultimate responsibility for providing appropriate place names. Views expressed in the text are those of the authors and do not necessarily reflect the views of the publisher.
This project was carried out in the framework of Research Unit 5315 “Forest Floor: Functioning, Dynamics, and Vulnerability in a Changing World” funded by the Deutsche Forschungsgemeinschaft (DFG). We would like to thank Florenz König for his technical support, Delon Wagner for his help in developing the electronical setup of the lysimeters, and our student workers for their assistance in the field.
This research has been supported by the Deutsche Forschungsgemeinschaft (grant no. 457330647).
This open-access publication was funded by the University of Freiburg.
This paper was edited by Miriam Coenders-Gerrits and reviewed by Seyed Mohammad Moein Sadeghi and one anonymous referee.
AG Boden: Bodenkundliche Kartieranleitung – Band 1: Grundlagen, Kennwerte und Methoden, 6. edn., Hannover, ISBN 978-3-510-96869-5, 2024.
Beven, K.: A sensitivity analysis of the Penman-Monteith actual evapotranspiration estimates, J. Hydrol., 44, 169–190, https://doi.org/10.1016/0022-1694(79)90130-6, 1979.
Deguchi, A., Hattori, S., and Park, H.-T.: The influence of seasonal changes in canopy structure on interception loss: Application of the revised Gash model, J. Hydrol., 318, 80–102, https://doi.org/10.1016/j.jhydrol.2005.06.005, 2006.
Deguchi, A., Hattori, S., Daikoku, K., and Park, H.: Measurement of evaporation from the forest floor in a deciduous forest throughout the year using microlysimeter and closed-chamber systems, Hydrol. Process., 22, 3712–3723, https://doi.org/10.1002/hyp.6974, 2008.
Dunkerley, D.: Identifying individual rain events from pluviograph records: a review with analysis of data from an Australian dryland site, Hydrol. Process., 22, 5024–5036, https://doi.org/10.1002/hyp.7122, 2008.
Floriancic, M. G., Allen, S. T., Meier, R., Truniger, L., Kirchner, J. W., and Molnar, P.: Potential for significant precipitation cycling by forest-floor litter and deadwood, Ecohydrology, 16, https://doi.org/10.1002/eco.2493, 2023.
Gerrits, A. M. J., Savenije, H. H. G., Hoffmann, L., and Pfister, L.: New technique to measure forest floor interception – an application in a beech forest in Luxembourg, Hydrol. Earth Syst. Sci., 11, 695–701, https://doi.org/10.5194/hess-11-695-2007, 2007.
Gimbel, K. F., Puhlmann, H., and Weiler, M.: Does drought alter hydrological functions in forest soils?, Hydrol. Earth Syst. Sci., 20, 1301–1317, https://doi.org/10.5194/hess-20-1301-2016, 2016.
Greiffenhagen, A., Wessolek, G., Facklam, M., Renger, M., and Stoffregen, H.: Hydraulic functions and water repellency of forest floor horizons on sandy soils, Geoderma, 132, 182–195, https://doi.org/10.1016/j.geoderma.2005.05.006, 2006.
Guevara-Escobar, A., Gonzalez-Sosa, E., Ramos-Salinas, M., and Hernandez-Delgado, G. D.: Experimental analysis of drainage and water storage of litter layers, Hydrol. Earth Syst. Sci., 11, 1703–1716, https://doi.org/10.5194/hess-11-1703-2007, 2007.
Ilek, A., Szostek, M., Mikołajczyk, A., and Rajtar, M.: Does Mixing Tree Species Affect Water Storage Capacity of the Forest Floor? Laboratory Test of Pine-Oak and Fir-Beech Litter Layers, Forests, 12, 1674, https://doi.org/10.3390/f12121674, 2021.
International Union of Soil Sciences (IUSS): World reference base for soil resources 2022: International soil classification system for naming soils and creating legends for soil maps, 4. edn., International Union of Soil Sciences, Vienna, Austria, ISBN 979-8-9862451-1-9, 2022.
Keim, R. F., Skaugset, A. E., and Weiler, M.: Storage of water on vegetation under simulated rainfall of varying intensity, Adv. Water Resour., 29, 974–986, https://doi.org/10.1016/j.advwatres.2005.07.017, 2006.
Levia, D. F., Carlyle-Moses, D., and Tanaka, T. (Eds.): Forest Hydrology and Biogeochemistry: Synthesis of Past Research and Future Directions, Springer Netherlands, Dordrecht, https://doi.org/10.1007/978-94-007-1363-5, 2011.
Li, Q., Lee, Y. E., and Im, S.: Characterizing the Interception Capacity of Floor Litter with Rainfall Simulation Experiments, Water, 12, 3145, https://doi.org/10.3390/w12113145, 2020.
Magliano, P. N., Giménez, R., Houspanossian, J., Páez, R. A., Nosetto, M. D., Fernández, R. J., and Jobbágy, E. G.: Litter is more effective than forest canopy reducing soil evaporation in Dry Chaco rangelands, Ecohydrology, 10, https://doi.org/10.1002/eco.1879, 2017.
Nanko, K., Keim, R. F., Hudson, S. A., and Levia, D. F.: Throughfall drop sizes suggest canopy flowpaths vary by phenophase, J. Hydrol., 612, 128144, https://doi.org/10.1016/j.jhydrol.2022.128144, 2022.
Neris, J., Tejedor, M., Rodríguez, M., Fuentes, J., and Jiménez, C.: Effect of forest floor characteristics on water repellency, infiltration, runoff and soil loss in Andisols of Tenerife (Canary Islands, Spain), CATENA, 108, 50–57, https://doi.org/10.1016/j.catena.2012.04.011, 2013.
Orfánus, T., Zvala, A., Čierniková, M., Stojkovová, D., Nagy, V., and Dlapa, P.: Peculiarities of Infiltration Measurements in Water-Repellent Forest Soil, Forests, 12, 472, https://doi.org/10.3390/f12040472, 2021.
Paulsen, H.: Dataset to go with “Forest floor water storage and redistribution affect evaporation, retention, and infiltration in mixed temperate forests”, FreiData [data set], https://doi.org/10.60493/0apjq-0aa41, 2026.
Paulsen, H. and Weiler, M.: Technical note: A weighing forest floor grid lysimeter, Hydrol. Earth Syst. Sci., 29, 2309–2319, https://doi.org/10.5194/hess-29-2309-2025, 2025.
Pohl, S., Garvelmann, J., Wawerla, J., and Weiler, M.: Potential of a low‐cost sensor network to understand the spatial and temporal dynamics of a mountain snow cover, Water Resour. Res., https://doi.org/10.1002/2013WR014594, 2014.
Putuhena, W. M. and Cordery, I.: Estimation of interception capacity of the forest floor, J. Hydrol., 180, 283–299, https://doi.org/10.1016/0022-1694(95)02883-8, 1996.
Sato, Y., Kumagai, T., Kume, A., Otsuki, K., and Ogawa, S.: Experimental analysis of moisture dynamics of litter layers – the effects of rainfall conditions and leaf shapes, Hydrol. Process., 18, 3007–3018, https://doi.org/10.1002/hyp.5746, 2004.
Van Stan, J. T., Coenders-Gerrits, M., Dibble, M., Bogeholz, P., and Norman, Z.: Effects of phenology and meteorological disturbance on litter rainfall interception for a Pinus elliottii stand in the Southeastern United States, Hydrol. Process., 31, 3719–3728, https://doi.org/10.1002/hyp.11292, 2017.
Vogelmann, E. S., Reichert, J. M., Prevedello, J., Consensa, C. O. B., Oliveira, A. É., Awe, G. O., and Mataix-Solera, J.: Threshold water content beyond which hydrophobic soils become hydrophilic: The role of soil texture and organic matter content, Geoderma, 209–210, 177–187, https://doi.org/10.1016/j.geoderma.2013.06.019, 2013.
Walsh, R. P. D. and Voigt, P. J.: Vegetation Litter: An Underestimated Variable in Hydrology and Geomorphology, J. Biogeogr., 4, 253, https://doi.org/10.2307/3038060, 1977.
Wessolek, G., Schwärzel, K., Greiffenhagen, A., and Stoffregen, H.: Percolation characteristics of a water-repellent sandy forest soil, Eur. J. Soil Sci., 59, 14–23, https://doi.org/10.1111/j.1365-2389.2007.00980.x, 2008.
Zagyvai-Kiss, K. A., Kalicz, P., Szilágyi, J., and Gribovszki, Z.: On the specific water holding capacity of litter for three forest ecosystems in the eastern foothills of the Alps, Agric. For. Meteorol., 278, 107656, https://doi.org/10.1016/j.agrformet.2019.107656, 2019.
Zhao, L., Meng, P., Zhang, J., Zhang, J., Sun, S., and He, C.: Effect of slopes on rainfall interception by leaf litter under simulated rainfall conditions, Hydrol. Process., 36, https://doi.org/10.1002/hyp.14659, 2022.